special report 34 - balanced scorecard october 2011balanced scorecard using five key criteria for...
TRANSCRIPT

BUSINESS WITH CONFIDENCE icaew.com/fmfac
BALANCED SCORECARDA FINANCE & MANAGEMENT SPECIAL REPORTSR34 | OCTOBER 2011

Business performance measurement has come top of the Finance andManagement Faculty’s technical needs survey for the past two years. It is anarea which is not only a core part of the finance professional’s role – but alsoone which, when done well, can inform and shape business performance. It isoften said that ‘what gets measured gets managed’ and ‘what gets measuredgets valued’ and on the whole this is true.
But poorly thought-out measures can cause dysfunctional behaviours. Andan insufficient range of measures can provide management with a seriouslylimited view of business performance. This is where the balanced scorecard(BSc) can prove to be a valuable management tool.
We first published a good practice guideline on this subject back in 1999.*This report mainly focused on designing your measurement tool. Following apopular event in July 2011 on the topic of successful implementation, weinvited our speaker, Kevin Bounds, one of the original report’s co-authors, toupdate this guidance. The new report discusses how to ensure success, thetechnology available to support the tool and how to incorporate yourbusiness’ strategic objectives into your BSc. In addition it provides an in-depthcase study on implementation. It is a wide-ranging overview in which thetheoretical aspects are fully supported with practical experience.
Bounds has also interviewed Lawrence Churchill CBE, chairman of NESTand previously CEO of a number of large insurance companies. Churchill’scomments are both insightful and challenging for accountants.
In this report Bounds points out that communication skills are key whensetting up and rolling out BSc implementation. If this is an area that youwould like more guidance on then look out for a future special report on thistopic in early 2012.
Following the launch of this report we would like to invite you to join in adiscussion on all aspects of the balanced scorecard via our LinkedIn group:ICAEW Finance & Management Faculty. Our author will be happy to answerany questions you have. More information on how to join in the debate willfollow in October’s electronic newsletter.
EMMA RIDDELL
*’The balanced scorecard’, Good Practice Guideline 25, June 1999. Authors:Kevin Bounds, Lois Bentley and Judith Shackleton.
icaew.com/fmfac
BALANCED SCORECARDA special report published by:Finance and Management FacultyChartered Accountants’ HallMoorgate Place London EC2R 6EAT +44 (0)20 7920 8508 F +44 (0)20 7920 8784E [email protected]/fmfac
Chris JacksonHead of facultyT +44 (0)20 7920 8525E [email protected]
Emma RiddellTechnical managerT +44 (0)20 7920 8749E [email protected]
Rick PayneFinance direction programmeT +44 (0)20 7920 8451E [email protected]
Aude BezlerServices managerT +44 (0)20 7920 8508E [email protected]
The aim of this series of special reports isto provide faculty members with a reviewof a topical theme within the subject areasof finance and management, offeringboth analysis of the relevant theory andreview of the practical application ofappropriate management techniques.
Comments and suggestions should beaddressed to Emma Riddell.
The information contained in this andprevious issues of this publication isavailable (to faculty members only) on thefaculty website at icaew.com/fmfac
F&M SPECIAL REPORTS... are produced on behalf of the faculty bySilverdart Publishing, 211 Linton House, 164–180 Union Street,London SE1 0LH.T +44 (0)20 7928 7770www.silverdart.co.ukContact: Alex Murray or Hannah [email protected]
© ICAEW 2011. All rights reserved. Theviews expressed herein are not necessarilyshared by the ICAEW’s council or thefaculty. No part of this publication may bereproduced or transmitted in any form orby any means, or stored in any retrievalsystem of any nature without prior writtenpermission, except for permitted fairdealing under the Copyright, Designs andPatents Act 1988, or in accordance withthe terms of a licence issued by theCopyright Licensing Agency in respect ofphotocopying and/or reprographicreproduction. Application for permissionfor other use of copyright materialincluding permission to reproduce extractsin other published works shall be made tothe publishers. Full acknowledgement ofauthor, publisher and source must begiven. No responsibility for loss occasionedto any person acting or refraining fromaction as a result of any material in thispublication can be accepted by ICAEW orthe author(s).
ISBN 978-0-85760-283-1
Chris Jackson is headof faculty, Finance &ManagementFaculty, ICAEW.
Emma Riddell istechnical manager,Finance &ManagementFaculty, ICAEW.
FOREWORD
SUCCESSFUL IMPLEMENTATION

BALANCED SCORECARD
CONTENTS
FINANCE & MANAGEMENT SPECIAL REPORT October 2011 01
02 INTRODUCTIONWHY THIS REPORT?A summary of the background to this report and anexplanation of the need for updated guidance on the topic.
03 BACKGROUNDPERFORMANCE MEASUREMENTAn introduction to the balanced scorecard how it haschanged over time.
04 METHODWHAT IS THE BALANCED SCORECARD?An explanation of the balanced scorecard method, includingthe various perspectives that its measurement covers.
07 PREPARATIONCRITERIA FOR SUCCESSThis section looks at how to achieve the best from yourbalanced scorecard using five key criteria for success.
10 IMPLEMENTATIONPRACTICAL STEPSThis section provides a six-step guide to help you pin downyour objectives and their associated actions.
14 PLANNINGTIMESCALESHere we look at how to devise a feasible schedule in whichto carry out the balanced scorecard process.
15 BSC SOFTWARETHE ROLE OF TECHNOLOGYThis provides an overview of balanced scorecard softwareand the pros and cons of its role in implementation.
18 CONCLUSIONSUMMARYA reflection on the overall advantages of the balancedscorecard technique.
19 EXAMPLESCASE STUDIESThis section looks at two case studies that cover the designand implementation of the balanced scorecard.
23 APPENDIX 1: HISTORYTHE WORK OF KAPLAN AND NORTON
24 APPENDIX 2: ICAEW RESOURCESBOOKS, JOURNAL ARTICLES AND MORE
25 SPECIAL REPORTSPREVIOUS SPECIAL REPORTS

icaew.com/fmfac02
INTRODUCTION
WHY THIS REPORT?This section summarises the background to this report and explains the need forupdated guidance on the topic.
Business has indeed changed enormously over thelast 12 years with Enron, Sarbanes Oxley, the creditcrunch and the emergence of technology as a drivingforce for change all resulting in additional pressureson business and requiring both strategic change andbetter micro profit management to survive.
Successful companies have embraced the balancedscorecard as the key tool in aligning around strategyand in aligning all parts of the organisation aroundcommon goals. However, there are many cases wheresuccess has been elusive and these are generallydown to failure to address the five success criteriaoutlined later in this report.
Success requires good design, effectiveimplementation, trained analysts and a pragmaticapproach – plus good luck! Later in this report I setout the practical steps that will help you maximizeyour chances of success.
The Good Practice Guideline on which this report isbased was published 12 years ago. Bill Gates famouslywrote around that time that businesses would changemore in the next 10 years than in the previous 50years so we can expect significant change to haveoccurred since the original publication. Even in 1999the balanced scorecard (BSc) was becoming a wellknown and accepted management tool and its rate ofadoption has increased so that in leading companiesits use is almost de rigueur.
However not all companies have reaped thepotential benefits it can bring and so in November2010 I wrote an article for the faculty, published inFinance & Management, entitled ‘The balancedscorecard – why do so many implementations fail?’This was followed by a breakfast seminar at ICAEWwhere the audience took part in a live poll, the resultsof which are included later in this report (see page 8).
ABOUT THE AUTHOR
Kevin Bounds works as an independent consultant specialising in performancemanagement and finance transformation. He has worked both as a finance directorand as a senior consultant, predominantly in financial services, and is passionateabout the impact finance can have on corporate performance by leading theimplementation of effective performance management systems. [email protected]
We would like to thank Lois Bentley of Bridges Freelance Ltd and Yorkshire and theHumber PCT Collaborative for her work co-authoring the original Good PracticeGuideline on the balanced scorecard, upon which this report is based.
FINANCE & MANAGEMENT SPECIAL REPORT October 2011 03
In the past, most companies relied on key financialmeasures such as ‘profit’ or ‘return on capital employed’to show how well they were performing. However thesemeasures have a number of drawbacks, particularly in thefast moving business world of today.
The Harvard Business School professor Robert Kaplanand international consultant David Norton, who arewidely acknowledged as the creators of the ‘balancedscorecard’ (see ‘The work of Kaplan and Norton’ on page23), used the analogy of a pilot to explain the situation.Rather than focusing on just one measure, a pilot uses anumber of key indicators to help fly the plane. The pilotuses skill and judgement to interpret the readings andinterrelationships of the individual measures.
In the same way, managing a company successfullyrequires knowledge of a number of different factors; but,more than this, it requires a clear understanding of thelinks and interrelationships between these factors. Thebalanced scorecard aims not only to provide a convenientframework to create a good measurement system butalso to create a good management system.
At this point many readers will be saying ‘but wealready have a balanced system’. However, implementingthe balanced scorecard is more than just creating an ad-hoc collection of financial and non-financial measures. Asexplained here, it is the product of a fundamental changein the management system for most companies.
Traditional performance measurement systemsCurrently most companies rely mainly on financialmeasures such as profitability, cash flow and measures ofvalue added, such as economic value added (EVA), tomonitor their performance. While these are extremelyimportant – as the aim of all companies is to succeedfinancially – their main drawback is that they are historicalmeasures. Their principal role is to measure how well thecompany has performed in the past and as such they willnot necessarily give an indication of future performance.Even where non-financial measures are used, they areusually confined to a lower operational level, withfinancial measures used by more senior management.
The idea behind the balanced scorecard is that thecompany should focus on a mixture of key measures –financial and non-financial. In addition, these measuresshould be ‘cascaded’ down the organisation toappropriate levels, so that they can be used as dailyperformance measures by operational managers. Eachlevel in the organisation should understand the measures,how they relate to the overall strategy and, mostimportantly, should use them to change the way theywork. If necessary, the measures should be altered toreflect the changing business or new information aboutthe interrelationships between them discovered as a resultof working with the balanced scorecard.
The power of effective presentation should not beunderestimated – the balanced scorecard lends itself to a
number of graphical presentations which can paint acolourful and easily digestible view of the company’sperformance.
In short, the balanced scorecard is more than a newmeasurement system, it is also a new managementsystem. Its use will be severely limited unless the wholeorganisation embraces this new way of managing.
Why do we need to change?
Business is changingThe world of business is changing rapidly. Everythingmoves faster and our culture is based increasingly onboth high quality service and 24/7 availability. Customers’expectations are higher. In the past it was sufficient tomake a good quality product efficiently, but nowcustomers are driving the production process.
Measures such as return on capital employed werehistorically important – in a slow-moving industrialcompany they were ideal for measuring the effectivenessof the organisation. However today such measures have anumber of drawbacks, as follows:• organisations are consisting more and more of
intangible assets, such as people and knowledge;• traditional measures focus on only one aspect of the
effectiveness of the company;• the item being measured may not actually drive the
long-term success of the company;• they don’t energise or align the entire organisation; and• there is no link between actions and their results.
Measuring the internal efficiency of processes has its uses;however it does not answer the question ‘Is this the bestprocess?’ The balanced scorecard answers these questionsby:• looking at the business from four distinct perspectives
(see the following section for more detail on these fourperspectives);
• linking the measures together;• establishing the links between the outcomes (ie,
measures of the company’s historic success) and thedrivers (which will create value for the company in thefuture);
• creating an open culture where employees areempowered to try new practices and understand therelationship between their actions and the success orfailure of the company; and
• not being set in stone, creating a climate where it isconstantly reviewed and improved.
BACKGROUND
PERFORMANCE MEASUREMENTHow was the balanced scorecard first introduced, and how has it changed?This section outlines the history of performance measurement.
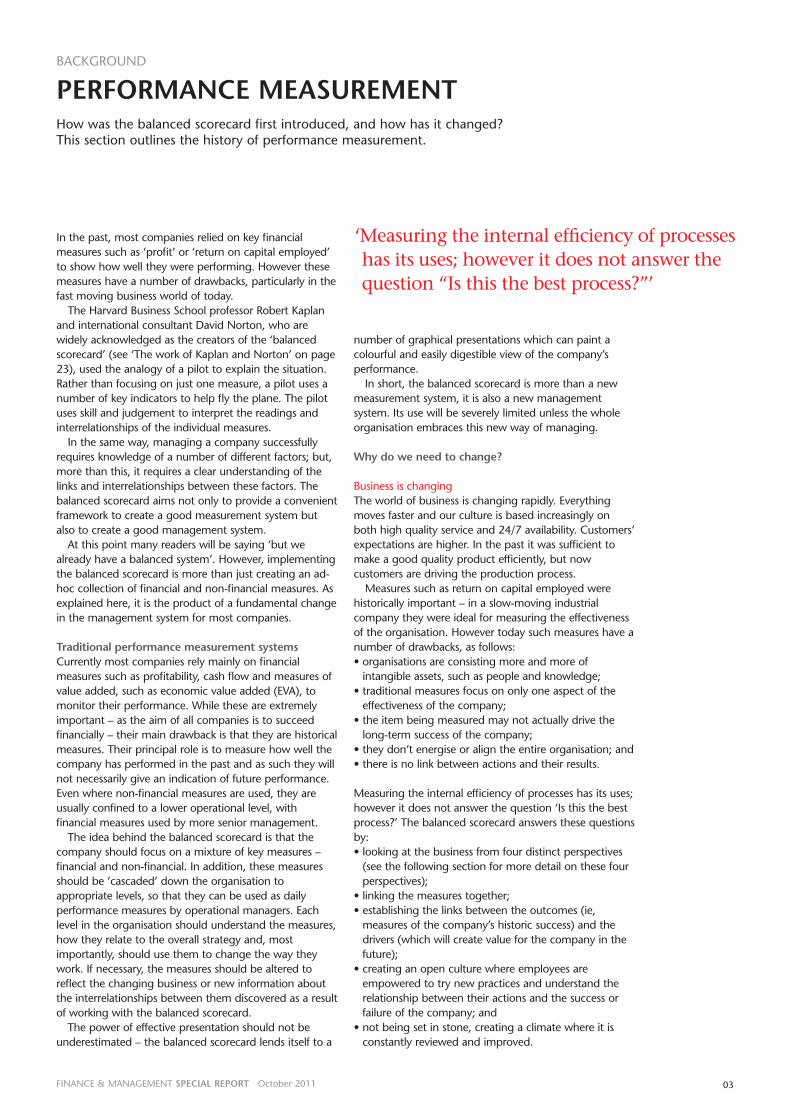
‘Measuring the internal efficiency of processeshas its uses; however it does not answer thequestion “Is this the best process?”’

icaew.com/fmfac04
METHOD
WHAT IS THE BALANCED SCORECARD?This part explains the balanced scorecard method of measurement in full, including thevarious perspectives that its measurement covers.
The balanced scorecard is an innovative type ofmeasurement system. It is perhaps best known as asystem that covers all the areas of a business’sperformance as opposed to more traditionalmeasures which focus on just one or two key (usuallyfinancial) measures.
It is also an innovative type of management system.Its success lies in the implementation. Manyorganisations have used it as a powerful change agent.
Four perspectivesThe balanced business scorecard was developed toprovide a convenient framework for measuring allaspects of the organisation’s performance.
The scorecard is designed to assess performancefrom a number of perspectives. Usually the scorecardis divided into four parts; Kaplan and Norton’soriginal article stated that it should provide theanswers to four basic questions:1. customer perspective: how do our customers see us?2. internal business perspective: what must we excel
at?
3. innovation and learning perspective: how can wecontinue to improve and create value? and
4. financial perspective: how do we look to ourshareholders?
Although each measure generally sits in only one ofthese categories, the measures are designed to belinked and to illustrate cause and effect (see belowleft). For most businesses these four perspectives aresufficient. But some businesses may have some otherfactor that is so fundamental to the business that it isimportant to set up another heading for this. Forexample a heavily regulated company such as a utilitycompany may include an extra heading for‘regulatory perspective’. Some of the insurancecompanies I have worked with rely on third partydistributions so have added a sales perspective andended with five sections of the scorecard.
Additionally, as described later, it is often moreeffective to use existing strategic themes orperspectives so that the implementation of thescorecard is seen as the natural next step in strategydeployment rather than a separate exercise. Thesecond case study included in this report (page 20)gives an example of a scorecard that was themedaround existing strategic imperatives.
Box 1 LEAD AND LAG INDICATORS
Outcomes:• Reflect actions• Historic• Lag indicators• Measure success in
fulfilling performancedrivers
Performance drivers:• Actions which lead to
fulfilling objectives• Future• Lead indicators
Figure 1 THE BSC LINKS PERFORMANCE MEASURES
In the examples of measures for each of the fourcategories on pages 5 and 6 (customer, internalbusiness, innovation and learning and financial) thefollowing key is used to illustrate where they arechiefly lagging or leading indicators:L = leadingLa = lagging
How do customers see us?
Can we continue toimprove and create value?
What must we excel at?
How do we look to shareholders?
MEASURES
GOALS MEASURES
CUSTOMER PERSPECTIVE
INNOVATION ANDLEARNING PERSPECTIVE
GOALS
GOALS MEASURES
GOALS MEASURES
INTERNAL BUSINESSPERSPECTIVE
FINANCIAL PERSPECTIVE
Source: Robert S Kaplan and David P Norton, ‘The balanced scorecard’, HarvardBusiness Review (January-February 1992)
FINANCE & MANAGEMENT SPECIAL REPORT October 2011 05
The actual measures
Outcomes and performance driversWithin each of the four categories, performancemeasures that sum up the strategy need to bedefined.
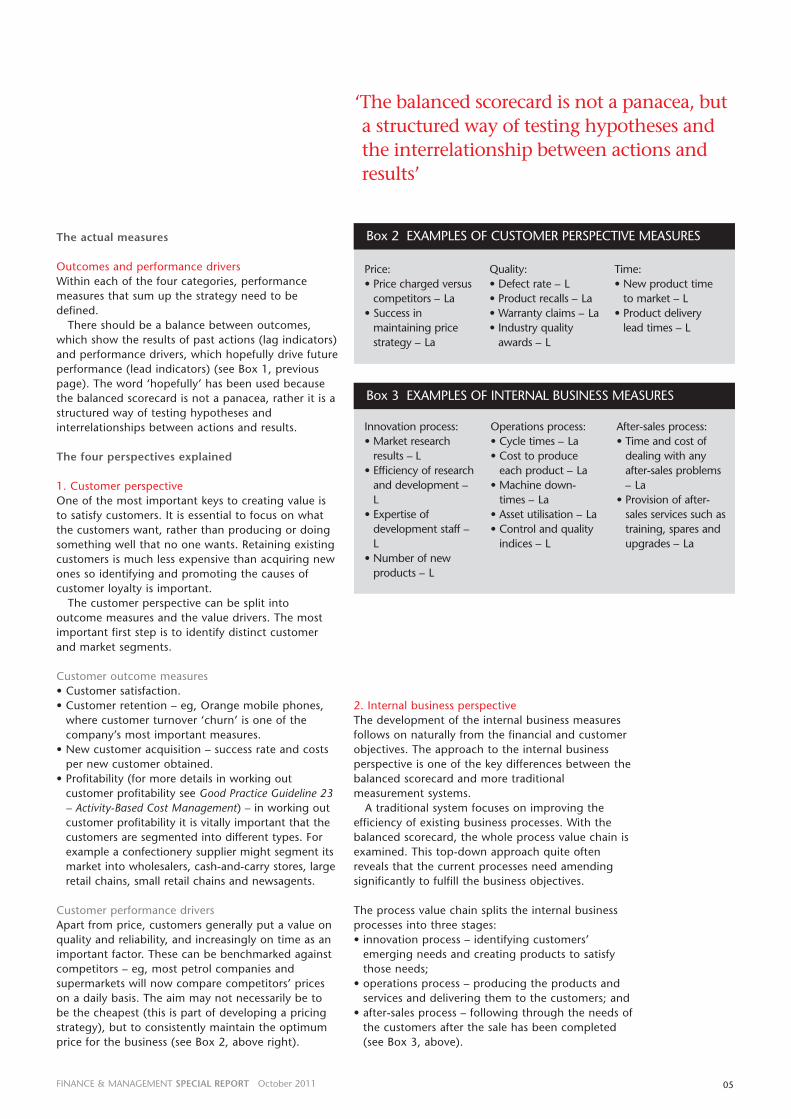
There should be a balance between outcomes,which show the results of past actions (lag indicators)and performance drivers, which hopefully drive futureperformance (lead indicators) (see Box 1, previouspage). The word ‘hopefully’ has been used becausethe balanced scorecard is not a panacea, rather it is astructured way of testing hypotheses andinterrelationships between actions and results.
The four perspectives explained
1. Customer perspectiveOne of the most important keys to creating value isto satisfy customers. It is essential to focus on whatthe customers want, rather than producing or doingsomething well that no one wants. Retaining existingcustomers is much less expensive than acquiring newones so identifying and promoting the causes ofcustomer loyalty is important.
The customer perspective can be split intooutcome measures and the value drivers. The mostimportant first step is to identify distinct customerand market segments.
Customer outcome measures• Customer satisfaction.• Customer retention – eg, Orange mobile phones,
where customer turnover ‘churn’ is one of thecompany’s most important measures.
• New customer acquisition – success rate and costsper new customer obtained.
• Profitability (for more details in working outcustomer profitability see Good Practice Guideline 23– Activity-Based Cost Management) – in working outcustomer profitability it is vitally important that thecustomers are segmented into different types. Forexample a confectionery supplier might segment itsmarket into wholesalers, cash-and-carry stores, largeretail chains, small retail chains and newsagents.
Customer performance driversApart from price, customers generally put a value onquality and reliability, and increasingly on time as animportant factor. These can be benchmarked againstcompetitors – eg, most petrol companies andsupermarkets will now compare competitors’ priceson a daily basis. The aim may not necessarily be tobe the cheapest (this is part of developing a pricingstrategy), but to consistently maintain the optimumprice for the business (see Box 2, above right).
2. Internal business perspectiveThe development of the internal business measuresfollows on naturally from the financial and customerobjectives. The approach to the internal businessperspective is one of the key differences between thebalanced scorecard and more traditionalmeasurement systems.
A traditional system focuses on improving theefficiency of existing business processes. With thebalanced scorecard, the whole process value chain isexamined. This top-down approach quite oftenreveals that the current processes need amendingsignificantly to fulfill the business objectives.
The process value chain splits the internal businessprocesses into three stages:• innovation process – identifying customers’
emerging needs and creating products to satisfythose needs;
• operations process – producing the products andservices and delivering them to the customers; and
• after-sales process – following through the needs ofthe customers after the sale has been completed(see Box 3, above).
Box 2 EXAMPLES OF CUSTOMER PERSPECTIVE MEASURES
Price:• Price charged versus
competitors – La• Success in
maintaining pricestrategy – La
Quality: • Defect rate – L• Product recalls – La• Warranty claims – La• Industry quality
awards – L
Time:• New product time
to market – L• Product delivery
lead times – L
Box 3 EXAMPLES OF INTERNAL BUSINESS MEASURES
Innovation process:• Market research
results – L• Efficiency of research
and development –L
• Expertise ofdevelopment staff –L
• Number of newproducts – L
Operations process:• Cycle times – La• Cost to produce
each product – La• Machine down-
times – La• Asset utilisation – La• Control and quality
indices – L
After-sales process:• Time and cost of
dealing with anyafter-sales problems– La
• Provision of after-sales services such astraining, spares andupgrades – La
‘The balanced scorecard is not a panacea, buta structured way of testing hypotheses andthe interrelationship between actions andresults’

icaew.com/fmfac06
3. Innovation and learningThis perspective focuses on the measures that drivefuture value and develop the business. Success in thisarea sets up the infrastructure for the objectives in theother three perspectives to be achieved.
Investment in people, systems and internalorganisational processes is often overlooked, or cutback when times are hard. There is often no obvious
link between this investment and the traditionalperformance measures. The balanced scorecardrecognises the long-term nature of these investmentsand their importance as value drivers for success inthe other areas.
The innovation and learning perspective is oftensplit into three areas:• employees – this can be divided into employee
satisfaction, recognition/reward and staff turnoverand employee productivity;
• information and knowledge systems – the systemsthat enable all people in the company to do theirjobs better; and
• internal learning systems – an infrastructure andprocesses that enable everyone to learn fromfailures and successes, and best practice thatsupports employees and responds to needs (seeBox 4, left).
4. Financial perspectiveSome exponents of non-financial measurementsystems believe that financial measures can beabandoned completely – on the grounds that, byfocusing on the non-financial measures, thetraditional ones will come right automatically.
I do not believe that this is the case. Abandoningfinancial measures destroys one of the mostimportant features of the balanced scorecard – thelink between actions and the ultimate financialoutcome.
The long-term financial objectives are the focus ofall the other perspectives. They should be developedfrom the strategy of the company. Detailed financialmeasures usually fall into one of four main categories:• cost reduction• asset utilisation• growth• risk management (see Box 5, left).
Box 5 EXAMPLES OF FINANCIAL MEASURES
Cost reduction:• Benchmark
costs againstcompetitors –La
• Unit costs ofproducts – La
• Fixed costs %of sales – La
Assetutilisation:• ROCE for each
category ofasset – La
• Workingcapital ratios –La
• Investment %of sales – L
• R&D % ofsales – L
Growth:• Sales growth
rate – La• Revenue from
newcustomers – L
• Share ofcustomer’sbusiness – La
Riskmanagement:• % high risk
customers – L• Sales order
book – L• Adequacy of
reserves – La• Variation
betweenforecast andactual results– La
Box 4 EXAMPLES OF INNOVATION AND LEARNING
Employees:• Staff turnover – La• Results of employee
satisfaction surveys –L
• Revenue peremployee – La
• Cultural values index– L
Information andknowledge:• Availability of online
customerinformation toemployees – L
• Quality ofinformation systems– L
• Quality ofcommunicationand knowledgesystems – L
Internal learning:• Investment in staff
training – L• Implementation of
staff suggestionscheme ideas – L
‘Abandoning financial measures destroys anessential feature of the balanced scorecard –the link between actions and the ultimatefinancial outcome’

FINANCE & MANAGEMENT SPECIAL REPORT October 2011 07
What makes a successful scorecard?I have identified five success criteria for creating aneffective scorecard – based on observation and discussionbut not on rigorous academic analysis. It would bewonderful if independent research could validate thecorrectness of these criteria and I would be delighted tocontribute to any such research project – but in themeantime I am totally convinced that applying them willdramatically increase your chance of success and if youdon’t, your competitors will so waiting for academicverification is not my recommended approach.
The five success criteria of BSc implementation
1. Sponsorship/acceptanceA high-level sponsor of the BSc project is crucial –otherwise, when it is first discussed ‘in anger’ at the boardor executive meeting, the usual tactic of ignoring themessage but attacking the messenger and casting doubton accuracy or validity of the measures will prevail. Thesponsor – ideally someone at CEO or CFO level – needsto prevent this and sometimes needs coaching in how todo so.
2. Clarity and linkage to strategyMost organisations already have an existing strategy andset of strategic initiatives and the scorecard may be seenas a competing and conflicting tool if it does notrecognise this. While there is merit in the traditionalscorecard quadrants (customer, process, organisationaldevelopment, financial results) there is no need to followthem slavishly.
Better acceptance is often achieved by organising thescorecard according to existing strategic imperatives: forexample one company decided to use the first page ofthe scorecard report to show key performance indicators(KPIs) alongside the strategy map and this proved apowerful way of communicating and then measuringstrategy. The strategy map conveyed on the left-handside the key strategic objectives already set by thecompany and alongside were placed the KPIs used formonitoring the success of the strategy. This demonstratedthe alignment of measures to strategy while reinforcingthe strategy itself.
PREPARATION
CRITERIA FOR SUCCESSThis section looks at how to achieve the best from your balanced scorecard usingfive key criteria for success.
3. BSc as ‘the’ management toolIf the scorecard is to be a powerful tool, it must be thetool for assessing and monitoring performance, not oneof a basket of tools. In practical terms, that means it hasto be the first substantive agenda item on the regularexecutive committee agenda, other reports must bereferenced back to it and actions arising from discussionof performance must be followed through and logged.
4. Insightful analysis and skilled ‘issues management’When the scorecard is presented, it needs to tell a story ofperformance and to link KPIs together. It needs insightfulanalysis and confident communication.
Most presenters expect to be called on time and to begiven their full time allocation – yet how often are theycalled upon late and asked to give the five-minuteversion? Getting points across in a shorter session is muchmore challenging – yet most presenters are not trained in‘elevator pitches’ and are not experienced in deliveringtheir message succinctly and powerfully.
Those involved in preparing and presenting the BSccan benefit from training in specific communication skills,and from the opportunity to practise and hone their skillsin a safe environment. Equally it is important not to catchexecutives offside – so if there are issues arising in theirpatch they need to be briefed beforehand and helped torespond rather than being put in an adversarial ordefensive position.
5. The right balance of measuresScorecards are often prepared by accountants andaccountants like proven, robust and well-definedmeasures. Unfortunately non-financial measures are oftenpoorly defined, inconsistently applied and sometimessubjective. As a result scorecards are often dominated byfinancial measures – which are lagging, not leading,indicators. An effective scorecard has a balance ofmeasures and recognises variability in data robustness.
I often implement scorecards where I show a dataquality key for each KPI – green shows robust quality,amber reasonable and red poor. By doing this andassigning a data owner at executive level, the data qualityimproves a lot quicker than if measures were excluded inthe first place!
The assessment of data quality is often subjective initself but interestingly I have never had my assessmentschallenged – most executives know intuitively howreliable the data is and if presented with caveats areprepared to engage in meaningful dialogue.
Performance management system successFigure 2 (overleaf) shows the results of an ICAEW poll ofperformance management system success.
The clear message from the data gathered is that mostperformance measurement systems are not working tofull potential and that the balance of measures and
‘If the scorecard is to be powerful,it must be the tool for assessingand monitoring performance,not one of a basket of tools’

icaew.com/fmfac08
• do individual performance objectives tie into thescorecard measures?
• does executive-level reporting stimulate debate aboutpriorities and balance?
• does the scorecard foster a less functional orientationand facilitate working across silos?
• does the scorecard drive the planning and prioritisationdebates? and
• does it convey a picture of performance that feels right?
If you have answered ‘no’ to any of these questions thenmaybe you need another attempt at designing andimplementing your scorecard. Ensure you address thesuccess criteria this time.
Success is relative – do the mathsIt is a well researched fact that most major programmesfail to deliver intended benefits. So in scorecard projects,you should aim not for perfection but to be significantlybetter than your competitors. In my projects I outline thefive success criteria and then ask the project team to scoretheir current position. Assume all five are equallyweighted and all score seven out of 10. What is theoverall score?
The obvious – but wrong – answer is seven out of 10.In my world, the answer is 0.17 which is 0.75. While 0.17
linkage to strategy are key areas to address. My ownobservation is that quality of analysis and communicationis also an area that is neglected, often with seriousdetriment to the project.
As accountants, who can lay claim to responsibility forperformance management, correcting these issues shouldbe in our gift but doing so involves getting out of thecomfort zone and improving commercial, influencing andpresentation skills. Yet these are the same areas whichrepeatedly come up as the core skills needed to climb thecorporate ladder and to move from financial controller tofinance director or CFO level.
The overall success rate of 24% is not particularlyunusual – and of course many of those who fail to get thebenefits of introducing a balanced scorecard approachfirst time around, have another attempt later on, possiblywith a different CEO and or a different sponsor. Secondtime around the project may not be described as abalanced scorecard project – I have helped organisationsto implement strategic business performance reportingon several occasions!
To see if you are in the 24% of successes, try asking thefollowing questions:• are staff communications and cascades framed in
balanced scorecard terminology and measures?• is the balanced scorecard used for board reporting?
Figure 2 ICAEW POLL OF PERFORMANCE MANAGEMENT SYSTEM SUCCESS
PERCENTAGE SCORING 7OR HIGHER
PERCENTAGE SCORING 3OR LOWER
SUCCESS CRITERION AVERAGESCORE
The measurement tool
Linkage to strategy
Senior sponsorship
Balance of measures
Quality of analysis
32%
18%
44%
15%
24%
22%
40%
24%
53%
37%
5.4
4.3
5.7
3.8
4.5
At a recent Finance and Management Faculty breakfast seminar, attendees were asked to score the successcriteria for the performance management system used in their organisation and to rate the system as asuccess or not. Each success criteria was scored on a scale of zero to 10 with 10 being high. The results weretypically revealing, as can be seen in the table below.
With the above scores it is perhaps not surprising that only 24% of attendees rated their performancemeasurement system a success. The scores are fairly typical – senior sponsorship and quality of analysis scores area little better than normal but the attendees were accountants who are interested in further development soprobably a more enlightened group than you sometimes find (and could be potential sponsors or presenters).With more than 60 scoring each criterion, the population is large enough for the differences across the criteria tobe meaningful.
‘In scorecard projects, you should aim not forperfection but to be significantly better thanyour competitors’

FINANCE & MANAGEMENT SPECIAL REPORT October 2011 09
Figure 3 CALCULATING RELATIVE SUCCESS
10
7
7
3
10
7
10
7
3
3
0
0
100%
17%
7%
3%
0%
0%
10
7
7
7
10
7
10
7
7
7
10
7
10
7
7
7
10
7
Analysis ‘The Tool’ Overallscore
SponsorshipBalanceStrategy
might not be a great score, it is probably better than yourcompetitor’s. Now consider what happens if you score 10out of 10 on four criteria and 0 on the other. Instead ofbeing a score of 0.80 the score is 0. This shows thatfailure to address any one of the five criteria to areasonable level will kill your project. This fits with realworld experience. Figure 3 (right) illustrates this scoring.
This exercise in maths may seem trivial, but it bringshome to project teams the importance of addressing allsuccess criteria and often the light then dawns on whyprevious attempts have failed.
Box 5 THE SPONSORING CEO’S VIEWPOINT
Lawrence Churchill CBE is chairman ofNEST, having previously chaired thePensions Protection Fund. In hiscorporate life, he has been chiefexecutive of NatWest Life andInvestments, chief executive of ZurichFinancial Services and chief executiveand Chairman of Unum plc, and usedthe balanced scorecard in all three companies to driveperformance and create alignment. Lawrence gives hisperspective on the balanced scorecard to Kevin below.
Kevin Bounds: How do you see the scorecard fitting in to youroverall management system?
Lawrence Churchill: It’s an information and diagnostic tool ofthe overall management system. It tells you what is workingand what isn’t.
KB: What does it bring that financial reports don’t?LC: It’s balanced!
KB: How would you rank the five success criteria from yourviewpoint and experience?
LC: I’d say that the linkage to strategy is the first acid test andonce that’s established, the key is the quality of the analysis. Ifthe analysis tells a story and brings new insights, then it’s easyfor me as sponsor to create the right dynamics to use theinformation effectively.
KB: Where you’ve witnessed success, what have been the keyfactors?
LC: Obviously the quality of sponsorship! Beyond that, therecognition by all that a balance of measures is necessary andthen the selection of the right measures. Creation of insighton issues which are off track helps cement the usefulness ofthe scorecard and also creates a sense of common ownershipof the issues.
KB: And causes of failure? LC: Not capturing the strategic drivers of performance,
management ‘puffing’ up the numbers (which is a symptomof weak management) and not recognising that differentmeasures have different time cycles.
KB: What difference did a successful scorecard make? LC: Firstly, it was a great confidence booster – everyone
understood strategy and their role in it. Secondly it was agood communication tool – we could frame all corporatemessages in it and communicate in a way that all staff couldrelate to. And finally it built management teamwork andholistic ownership of performance.
KB: And what is the role of the CFO in this? Should he be thenatural leader of the project?
LC: Not necessarily – it depends on the culture of theorganisation and the capabilities of the individuals involved. Itcould equally be the strategy director, the chief of staff or thechief information officer.
KB: What can the sponsor do to ensure success?LC: The sponsor can use his experience and knowledge to make
sure the right things are measured. He can position thescorecard as independent and authoritative and thenencourage open debate on the issues discussed.
KB: What other comments would help ensure success? LC: Be aware of the dangers of creating a plethora of measures
– 30 KPIs should be enough. Think clearly about the timingof measures – some are needed daily, some monthly andsome annually and your reporting system shouldaccommodate this. Also, not all measures will havecertainty so think about how you deal with uncertainty –stochastic modelling may be appropriate but it is difficultto present the results clearly.
KB: Thank you for sharing your insights with us – they show therewards of success and give clear pointers on what needs tobe done to get there. They also show that the CFO has noinnate ownership of this area and needs to be credible andconfident to grab it.

icaew.com/fmfac10
Much of this information exists. It is the way in whichit is used in the decision making that is different.With the balanced scorecard in place, you can thenmeasure progress towards it:• what are the four or five things we must do well to
succeed – critical success factors?• what are our performance indicators? and• what are our targets for this year?
Let detractors air their concerns at this stage. Findsomeone with experience and the confidence thatanything can be measured and who can show how.
OutputAn enhanced strategic plan that includes statementsin response to the questions above. To address thecriteria for success as discussed on page 7(sponsorship/acceptance; clarity and linkage tostrategy; BSc as ‘the’ management tool; insightfulanalysis and skilled issues management; and the rightbalance of measures), there are certain actions thatneed to be included in your plan. Figure 4 (belowleft) is an example of linkage to strategy that assumeslimited executive involvement.
STEP 2: Determine the measurement area and whois accountable
Actions• Confirm the areas that will be measured based on
the enhanced strategic plan.• Run workshops at executive level.• Accountability matters – determine which executive
will be personally accountable for what.• Establish which measures need to be monitored at
executive level.• Link it to your HR processes for individual appraisal.
The balanced scorecard needs to operate at all levelsin the business. There is a cascade through each levelof the organisation.
Generally restricting this to four levels works best,as follows:• Level 1 accountability – joint and several
accountability of the executive team. One executiveis responsible for bringing results to the table foreach measure. The whole team is responsible for
It’s easy to point out the reasons for failure – but farmore useful to give tips on how to ensure success.Successful design is only part of the solution –successful implementation and then maintenance isalso important. Below are some suggested practicalsteps which need to be turned into a detailed projectplan.
STEP 1: Understand the company’s strategy
Objectives• To produce an enhanced strategic plan.• To really understand where the business is going.
ActionsTake the organisation’s vision and strategic plan andask some questions so that you build a clear andagreed picture of the future state of the business.Include:• what would we be doing if the vision were real
today? • what will it look like when it is finished?• what would be happening in the marketplace? and• what would we be capable of internally?
Take some of the marketing material and ask:• what are the key processes that need to work well
to deliver this proposition to our customers?
IMPLEMENTATION
PRACTICAL STEPSBalanced scorecards can often fail as a result of poor planning and an impracticalapproach to the measurement process. This section provides a six-step guide toensuring you pin down your objectives and associated actions.
Figure 4 STEP 1: COMPANY STRATEGY EXAMPLE ACTIONS
ACTIONS RESOURCES
SUCCESS CRITERION ADDRESSED: Strategic linkage
Desktop decomposition ofstrategy into critical successfactors
Derivation of key performanceindictors from critical successfactors
Validation of KPIs and theirlinkage to strategy
Confirm comprehensive bychecking against individualperformance targets, bonus andLong Term Incentive Planschemes etc
Access to strategy documents,strategy department and boardpapers
As above plus access tofunctional/business unit heads andtheir support staff
Executive workshop with sponsorbriefed and with expert facilitation
Access to key information andconfidence from exec thatinformation is being used for validpurposes
‘The balanced scorecard needs tooperate at all levels in thebusiness’

FINANCE & MANAGEMENT SPECIAL REPORT October 2011 11
‘Momentum can be lost particularly if anoverly prescriptive project managementapproach is being used’
Figure 5 STEP 2: MEASUREMENT AREAS EXAMPLE ACTIONS
ACTIONS RESOURCES
Define measurement areas fromsteps above
Run workshops for each area toidentify detailed reporting analysis
Validate findings above
Experienced information analyst
Subject matter experts for each area,workshop facilitator, informationproviders
One-to-one meetings with executivesponsors
SUCCESS CRITERION ADDRESSED: Balance of measures
confirming or proposing alternative actions to moveactual to target. They determine the processwhereby targets are set.
• Level 2 accountability – individual executiveresponsibility. They determine how individual andteam targets will be set.
• Level 3 accountability – individualmanagers/supervisors agree on team measures andtargets and allocate accountability to members oftheir team. Day-to-day operational targets arecovered here.
• Level 4 accountability – individual objectives andtargets are linked to, and derived from, thebalanced scorecard.
Outputs• Ideas successfully communicated throughout the
organisation.• Measures allocated to individual executives.• An approach to individual performance appraisal
that is agreed with your HR professionals.
Your detailed project plan will need to include stepssuch as those given in Figure 5 (above right).
STEP 3: Establish how you will capture the dataand record the measures
Actions• From the KPI list, identify source data requirements. • Define data attributes and match vs requirements.• Initial view on data quality.• Develop the IT system to enable you to get the job
done.• Develop the existing system as little as possible in
the early stages; our experience is that starting withthe systems you have is usually adequate.
• Use risk and opportunity analysis to decide whereto invest in IT for improved measurement.
Outputs• Business requirements definition – what is to be
produced from the systems that will gather thedata for each measure, whether manual or enabledby technology?
• Implementation plan and team.
This is an area of the project where the numbersinvolved increase and issues of data availability andquality emerge. It is easy to get bogged down anddisheartened and, if no external resource is beingused, momentum can be lost, particularly if an overlyprescriptive project management approach is beingused.
The steps in the project plan given in Figure 6(above right) can help.
Figure 6 STEP 3: CAPTURE/RECORD DATA EXAMPLE ACTIONS
ACTIONS RESOURCES
Identify all data providers
Workshop to brief data providerson project, timescales andrequirements
Provide data templates
Proof of production run: testsreport production processes inlive environment
Experienced information analysts
Project leader and facilitator
Someone with one – don’t wastetime reinventing them
All data providers
SUCCESS CRITERION ADDRESSED: The management tool
STEP 4: Decide how you will report
Actions• Collect together the output of existing transactions
and new simple data collection systems.• This report should be short and summarise the key
points on one page.• Design overall pack – will need supporting pages.• Design commentary and issue identification process.• There are specialist software packages available for
balanced scorecard reporting, but for more simplesystems an Excel spreadsheet will probably suffice.
• Train presenters in communication skills.
Outputs• Reporting cycle agreed.• Time, place and agenda for meetings at each level.• Confident, skilled presenters.
icaew.com/fmfac12
message is: use the insights, improve performance,challenge but don’t kill the messenger.
The steps given in Figure 8 (opposite) need to beincluded in the project plan.
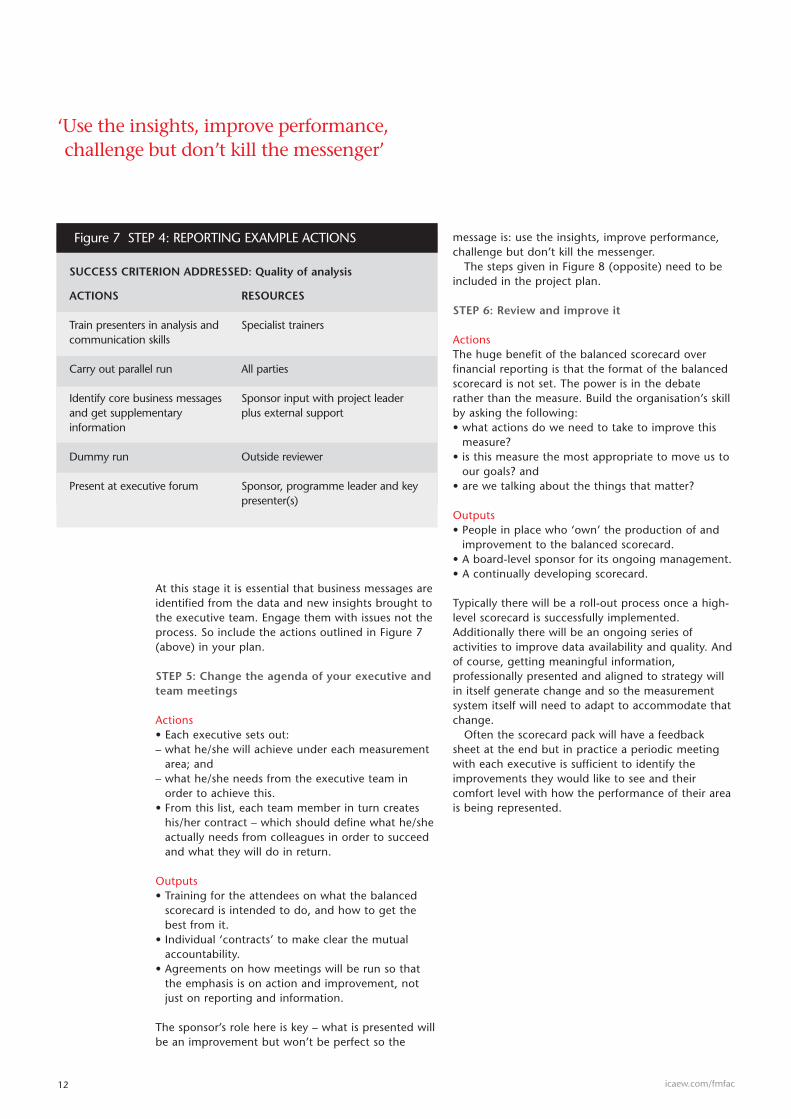
STEP 6: Review and improve it
ActionsThe huge benefit of the balanced scorecard overfinancial reporting is that the format of the balancedscorecard is not set. The power is in the debaterather than the measure. Build the organisation’s skillby asking the following:• what actions do we need to take to improve this
measure?• is this measure the most appropriate to move us to
our goals? and• are we talking about the things that matter?
Outputs• People in place who ‘own’ the production of and
improvement to the balanced scorecard.• A board-level sponsor for its ongoing management.• A continually developing scorecard.
Typically there will be a roll-out process once a high-level scorecard is successfully implemented.Additionally there will be an ongoing series ofactivities to improve data availability and quality. Andof course, getting meaningful information,professionally presented and aligned to strategy willin itself generate change and so the measurementsystem itself will need to adapt to accommodate thatchange.
Often the scorecard pack will have a feedbacksheet at the end but in practice a periodic meetingwith each executive is sufficient to identify theimprovements they would like to see and theircomfort level with how the performance of their areais being represented.
At this stage it is essential that business messages areidentified from the data and new insights brought tothe executive team. Engage them with issues not theprocess. So include the actions outlined in Figure 7(above) in your plan.
STEP 5: Change the agenda of your executive andteam meetings
Actions• Each executive sets out:– what he/she will achieve under each measurement
area; and– what he/she needs from the executive team in
order to achieve this.• From this list, each team member in turn creates
his/her contract – which should define what he/sheactually needs from colleagues in order to succeedand what they will do in return.
Outputs• Training for the attendees on what the balanced
scorecard is intended to do, and how to get thebest from it.
• Individual ‘contracts’ to make clear the mutualaccountability.
• Agreements on how meetings will be run so thatthe emphasis is on action and improvement, notjust on reporting and information.
The sponsor’s role here is key – what is presented willbe an improvement but won’t be perfect so the
Figure 7 STEP 4: REPORTING EXAMPLE ACTIONS
ACTIONS RESOURCES
Train presenters in analysis andcommunication skills
Carry out parallel run
Identify core business messagesand get supplementaryinformation
Dummy run
Present at executive forum
Specialist trainers
All parties
Sponsor input with project leaderplus external support
Outside reviewer
Sponsor, programme leader and keypresenter(s)
SUCCESS CRITERION ADDRESSED: Quality of analysis
‘Use the insights, improve performance,challenge but don’t kill the messenger’

FINANCE & MANAGEMENT SPECIAL REPORT October 2011 13
Figure 8 STEP 5: CHANGING AGENDAS EXAMPLE ACTIONS
ACTIONS RESOURCES
SUCCESS CRITERION ADDRESSED: Sponsorship
Agree sponsor role and behaviours
Ensure executives comfortable with commentaryand issue identification process
Change sequence of executive agenda to havescorecard as the first major item
Present dummy run analysis to CEO
Prepare ‘crib’ sheet for major meeting
Sponsor and programme leader
Programme leader plus executives
Sponsor
Sponsor, programme leader and presenter(s)
Presenter
‘The format of the balanced scorecard is notset: the power is in the debate rather thanthe measure’

icaew.com/fmfac14
PLANNING
TIMESCALESOnce you have become aware of the practicalities of implementation, it is essentialto devise a feasible schedule in which to carry them out. This section advises onthe length of time for each part of the balanced scorecard process.
out data gaps, carry out a software selection review andplan for further roll outs. These activities are all part of theprogramme to ensure that the implementation is acontinuing success.
During this period, it is also important to train thebusiness analysts in analysis and communication skills.The ability to present the scorecard succinctly, to drawout key business messages and to foster a collaborativeapproach to addressing performance issues are all keyskills which are often lacking in technical staff. Similarlythe sponsor needs to protect the messenger, to generateconstructive discussion and to be prepared to holdexecutives accountable for delivery on key remedialactions. Coaching and external support are often helpful.
Some people will regard this timetable as too long –my response is that it is the quickest I can manage andanything quicker is not likely to have addressed thesuccess criteria. Others will describe it as ridiculouslyambitious – my response is that, yes it is ambitious butnot ridiculously so and that a programme that fails to getmeaningful benefit within say six months is unlikely tomaintain momentum and sponsorship. Once an initialsuccess has been achieved roll out can be more measuredbut in the initial phase you want a project team that isenergised and full of enthusiasm. Outside help is useful,particularly early on.
Scorecards don’t get implemented as a result of goodintentions but as a result of detailed planning and focus –which might sound trite but emphasises that a projectplan and a project focus is required.
The project plan, discussed in the implementationsection above, along with a risk log and milestonereporting should be used as a key report at what willprobably be a weekly steering committee meeting. Formore details on successful project management, pleaserefer to Special Report 33 on project management issuedin June 2011 by the Finance and Management Faculty.
However in formulating this plan, you need to havehigh level targets in mind and there is a balance to bestruck between a professional project plan with detailedquality checking vs a pragmatic, speedy delivery.
My personal bias is to aim at a speedy implementationthat delivers real benefits in four months with a roll outplan that builds in proper IT support so that the system ismaintainable. Once the benefits are obvious, investmentin securing a sounder footing is more easily obtained.Also, prototyping requirements before committing tocomplex IT developments is always a sound strategy. Myrecommended timetable therefore is along the lines ofthat given in Figure 9 (below).
During the initial development period there will be aparallel set of activities to identify key data elements, work
Figure 9 TIMETABLE FOR IMPLEMENTING THE BALANCED SCORECARD
ACTIVITIES OUTPUTS
• Planning, resource gathering, sponsorcommitment, analyst training
• Strategy analysis, KPI derivation,scorecard strawman development
• Production of draft report as proof ofconcept
• Production in live environment toplanned timescales, analysts trained incommunication skills
• Initial production run and presentation
• Continuous refinement of scorecard• Technology platform implemented• Divisional/business unit cascade begins• Initial staff cascades• Further data clean up
• Agreed project plan, committedsponsor, executive update
• Strawman scorecard withdemonstrated strategy linkages
• Validated strawman
• Proof of production, analysts trained,report available to project team only
• First live scorecard • Agreement to discontinue other
reporting
• A successful but evolvingimplementation with evangelistshelping with roll out
PERIOD
Month 0
Month 1
Month 2
Month 3
Month 4
Thereafter

FINANCE & MANAGEMENT SPECIAL REPORT October 2011 15
information assimilation preferences.The one general concern I have is that most BI tools
struggle to embrace commentary and it is thecommentary and how it is presented that brings theinformation to life.
Display of informationCompanies such as SAP, Oracle and Cognos haveinvested significantly in developing software applicationsthat support balanced scorecard concepts. While a staticreport can inform and align the executive team, theability to drill down into the detail and carry out yourown analysis is very powerful. In one organisation Iworked in we deployed an executive information system(EIS) that was so successful that the marketing directorsaid ‘I think by using EIS!’. The screen shots below (for afictional business) illustrate the level of analysis you canperform with such systems. They have been provided bySAP but equivalent ones are available from most vendors.
Software vendors have invested heavily in scorecardapplications and other aspects of business intelligence(BI). However, most scorecard implementations start atthe top and are aimed at the group executivecommittee or its equivalent at divisional level. In thesecases, rapid progress can be made using prototypingtechniques and initial delivery can be made usingexisting BI software or Excel.
Once the scorecard is well established and is acceptedas a key management tool, it can be put on a morerobust technology platform. If, however, the projectbecomes technology driven from day one, there is a riskthat it will result in extended delivery timescales andlose momentum and sponsorship support.
There are some innovative solutions out there – onevendor I worked with had invested heavily in developingsoftware that embraced neuro-linguistic programming(NLP) concepts to make the information easily assimilatedand it could even be tailored to an individual’s personal
BSC SOFTWARE
THE ROLE OF TECHNOLOGYThis part provides an overview of balanced scorecard software and the pros andcons of its role in implementation.
Figure 10 SCREENSHOT 1
This screenshot demonstrates how strategy can be summarised. It shows how the overall objective of increasing shareholder value isachieved by actions across all quadrants of the scorecard. There are many ways to show these linkages and software helps but simplebreakdowns of strategy can be just as effective and then shown using the graphical capabilities of standard office software.

icaew.com/fmfac16
Figure 11 SCREENSHOT 2
Figure 12 SCREENSHOT 3
Key strategic initiatives are then derived from strategy. For example, in the chart in Figure 10, we have IP82 – Optimise purchasing and pricing to ensurebest possible margins. To deliver this, a variety of strategic initiatives are agreed and performance against them shown, as can be seen in this screenshot.
The ability to track all strategic initiatives is very powerful and contributes to strategy implementation. The success of these initiatives can then bemeasured by using drill down screens like the one above which looks at purchase order error rates. These screens will help assess the impact of thestrategic initiatives as well as monitoring business-as-usual performance.

FINANCE & MANAGEMENT SPECIAL REPORT October 2011 17
The same information can be portrayed in static,hard copy reports but the ability to do your ownanalysis is very powerful and when implemented well,gives a second boost to the effectiveness of thebalanced scorecard. The screens shown on theprevious two pages have multiple dropdown menuswhich give the user the ability to explore andinterrogate the data to seek answers to the questionshe has at that time – and often enables the user toidentify relationships that cannot be gleaned fromstatic reports. Additionally, the ability to specify yourown reports and analysis can help in data cleansing
and in understanding whether exceptions are a resultof accounting anomalies (eg, budget phasing) orgenuine performance features.
Most of the BI vendors supply equivalent tools andmany organisations have already invested in thembut are only using a fraction of their full functionality. Users throughout the business are increasingly ITliterate and are used to instant gratification – puttingin an information request and waiting a week or twountil some overworked accountant has time toaddress it is not a recipe for satisfaction for eitherparty – so self-service becomes an attractive option.
‘This software gives the user the ability toexplore and interrogate the data to seekanswers to the questions he has at that time’

icaew.com/fmfac18
CONCLUSION
SUMMARYA reflection on the overall advantages of the balanced scorecard technique.
Successful balanced scorecard implementation bringsthe following advantages:• it mobilises the entire workforce in pursuit of
strategic objectives;• financial measures alone do not motivate and do
not provide guidance for different choices;• the accounting profession can be seen to welcome
change and to act as a catalyst for innovation inbusiness;
• historic reporting has value, but does not provide ameans to impact on future direction and strategy;
• business management needs an integrated approach;• most accountants would prefer to be part of the
process of change rather than bystanders watchingtheir traditional practice wither on the vine; and
• personal experience has demonstrated that it worksand can be fun.
Good ideas badly implemented remain good ideas andI am firmly convinced that the balanced scorecard is agood idea! There are plenty of examples where it iscredited with producing superior performance and itsability to generate alignment is a powerful tool in itself.
Success is therefore dependent on successfulimplementation and I hope this report has given plentyof pragmatic advice on how to be successful. However,there is no monopoly on good advice so please shareyour experiences with me or members of the faculty’sLinkedIn group (see the foreword to this report formore information on how to join the LinkedIn debate).
Time for the popcorn! A recording of a five minuteinterview with Kevin Bounds on the topic of‘Performance measurement – the route to success’ isavailable on the ICAEW website aticaew.com/fmfjulyevent
In this session, Kevin Bounds explored the features ofsuccessful performance measurement systems andoffered practical tips and guidance on how to move toeffective performance management – and shared thecriteria that help ensure success.
Slides and a copy of the presentation are alsoavailable to view using the link given above.
WEBCAST – BALANCED SCORECARD

FINANCE & MANAGEMENT SPECIAL REPORT October 2011 19
EXAMPLES
CASE STUDIESThis section looks at two case studies that cover the key areas of the balanced scorecard – designand implementation.
CASE STUDY 1: DesignThis first case study on design is extracted from theoriginal Good Practice Guideline on the balancedscorecard (GPG25). Although the business featured,Leeds Life, no longer operates since its parent haschanged its business model, the guidance is still relevant.
In 1993, The Leeds Permanent Building Societydecided to ‘manufacture’ and offer its own life andpensions products rather than remain an intermediary forother providers. To some, this was a major diversificationwhose risks and opportunities needed to be controlled bya new approach to board reporting. The Leeds Life teamdeveloped a balanced scorecard as the main vehicle forboard reporting as well as for management control.
The implementation was split into three main stages:1. the goals – extracted from agreed strategy statements;2. measurement areas – the things you will measure to
test progress towards the goal; and3. the actual measures and targets.
The first step was to agree a set of goals. These were splitacross the four balanced scorecard perspectives. Figure 13(right) gives a selection of the goals that were set.
Each of the individual goals was then broken down intoa number of measurement areas. Figure 14 (below right)gives examples of some of the specific measurementareas. The best method for measuring and setting targetswas defined for each measurement area. The targets werethen established and agreed with the building societyboard as part of the annual planning cycle.
Leeds Life chose to colour code each of the fourmeasurement areas, so that readers could easily keeptrack. For the Leeds Life team, the scorecard became anintegral part of their monthly reporting cycle and wasthe basis for individual executive accountability. Insteadof looking at only historic financial information, theexecutive meetings now considered items such as:• service standards• feedback from branches• product price benchmarks.
For Leeds Life, the main benefits from implementingthe balanced scorecard were:• improved executive discussion and decision
making;• transparency as to what was being managed and
why; and explaining to the board any variances toplan, what action will be taken and why; and
• better understanding by all of how one area of thebusiness impacts another.
For example, the measures of new business forbranches was changed from ‘completed applications’to applications accepted as ‘fit for purpose’ accordingto criteria agreed with the third party administrationpartner. Everyone was much more aware of how their
performance impacted on other areas of the business.The balanced scorecard was used throughout thebusiness at all levels.
Figure 14 LEEDS LIFE MEASUREMENT AREAS
FINANCIAL
Figure 13 LEEDS LIFE GOALS
1. Growth in profit2. Growth in financial
strength3. Financial target4. Top 20 player5. Bottom quartile costs6. Manage funding
requirements7. Product performance
CUSTOMER
1. Preferred supplier2. Understand, manage
and deliver products3. Single entity4. Custom design at
mass prices5. Continuous
improvement incustomer relationship
INNOVATION
1. Leading edgepeople/process fit
2. Staged approach tointegration
3. Leading edgetechnology
4. Complementarychannels
5. Effective productrealisation
6. Competencyframework
QUALITY
1. Pool of talent2. Process quality
focused on customers3. Responsive product
design4. Integration with LPBS5. Well designed
managementprocesses
Source: Leeds Lifeteam 1994
FINANCIAL1.1 Profit and loss
account1.2 Embedded value2.1 Solvency margin2.2 Asset/liability match3.1 Return on investment3.2 Product profitability3.3 New business analysis3.4 New product post-
launch appraisal3.5 Expense overrun/
underrun analysis3.6 Expense analysis4.1 Market position4.2 Competitor position4.3 Cross-sell ratio4.4 Investment
performance4.6 Sales productivity6.1 Cashflow forecast6.5 Project financial
appraisal
CUSTOMER
1.1 Preferred supplier2.1 Customer feedback
analysis2.2 Process – ‘moments
of truth’5.2 Persistence5.2 Customer retention5.3 Customer complaints
and compliments5.4 Suggestions box
QUALITY
1.1 Competency trendanalysis
1.2 Advisor productivity1.3 Advisor growth2.1 Adherence to service
standards2.2 Process performance
by product2.3 Appropriateness of
service standards3.1 Time to launch3.2 External perception
(expert)4.2 Cannibalisation5.1 Management process
health check
INNOVATION1.1 Process innovation
effectiveness2.1 Integration process3.1 Realisation of IT
potential4.1 Match to customer
needs (QFD)4.2 Distribution staff’s
assessment6.2 Recognition/reward Source: Leeds Life
team 1994

icaew.com/fmfac20
CASE STUDY 2: ImplementationImplementation rather than design presents morechallenges so the following case study documents anexample where a mature company needed toimprove its performance reporting and realised verysignificant benefits within a few months.
Background Company A is a large UK company, part of aworldwide group but with a complex structure andhistory itself and in an industry that was goingthrough significant change and highly regulated. Company A had a headcount of c. 4,500, a cost baseof £250m and complex legacy IT platforms. The CEOwas the ex-CFO and had a voracious appetite fordetail and an ability to absorb a lot of complexfinancial data. Consequently the monthly executivecommittee meetings went through a huge amount ofdetail from every area but didn’t end up with a clearidea of priorities nor a holistic view of issues.
A new finance business partner (FBP) was brought inon an interim basis to manage the finance team andsoon identified that while there was a huge amount ofboth financial and non-financial managementinformation (MI) presented at the monthly executivemeetings, there was no linkage to strategy, no clearidentification of the key few issues to address and, as aresult, sub-optimal decision making.
This could clearly be an opportunity for theintroduction of a BSc, however this organisation hadpreviously tried to introduce one and had failed.
After two months in position, the FBP presented acase to the executive committee for rationalising theMI and presented a four month project plan todeliver it, together with a list of requirements fromhis executive colleagues to make it work. Thisincluded a small budget for training and software butalso a commitment to make time available for alimited number of executive workshops and one-to-one sessions as well as a commitment to ensure theirteams, as data providers, supported the exercise. Asmall project team was assembled and trained, and adetailed work plan developed.
While at this point the MI was not linked tostrategy, the company had a well developed strategyand hence the first decision was to order thescorecard by existing strategic imperatives as follows:• high level corporate KPIs – financial – used to
reflect corporate goal set for country CEO; and• overall strategy – deliver growth targets – overall
objective for CEO.
This was supported by strategic imperatives:• build effective distribution;• build market leading propositions;• deliver cost efficient service;
• improve cost competitiveness; and• create climate for success (see Figure 15, opposite).
An executive workshop was held to derive KPIs for eachstrategic imperative but by working with the strategydirector, this was built into an already planned strategysession and hence enhanced the strategy discussionrather than being seen as a competing action.
The project team then identified the keyinformation providers and commentators for the KPIsand formed a core team of around 15. These wereinvited to a two-day offsite session where:1. the company strategy was reviewed and explained;2. breakout groups considered each strategic
imperative and looked at the information neededto see if it was being delivered; and
3. a training session in effective communication skillswas delivered, covering written communications aswell as influencing skills and role playing seniorlevel meetings.
The core team then took these outputs and designedthe overall pack – called the ‘Strategic businessperformance report’ (SBPR) to distinguish it from aprevious failed scorecard exercise.
The wider team supported a proof of productionrun which ironed out production processes and thena parallel run was held to test out the commentaryand analysis phases.
Finally, four months after starting the first pack wasused as the main management tool and the packbecame widely established as the way of managingthe business. What this meant was:• it was the first substantive item on the monthly
executive agenda;• subsequent papers/discussions referred back to it
for consistency;• it was used as a briefing pack to explain the
business to outsiders eg, consultants, head officevisitors, regulators;
• executives didn’t travel without it; and• it provided the starting point for other
presentations such as staff cascades.
The SBPR consisted of 30 pages, included a one-pagesummary, a performance commentary, a key issuespage, a market analysis page and a self assessmentpage. This was followed by sections on each of thestrategic imperatives. Whilst 30 pages is probablyexcessive, it eliminated much more than that!
A section of the front page can be seen in Figure15, opposite. Here the original data have beenomitted to maintain confidentiality, but the enlargedsection at the bottom of the box, entitled ‘Createclimate for success’, provides an example of how itshould be populated.
‘Implementation rather than design of thebalanced scorecard presents the greaterchallenge’

FINANCE & MANAGEMENT SPECIAL REPORT October 2011 21
‘Not all management information has to bequantitative – self assessment brings outfascinating insights’
Description
KPI 1 (£m)
Figure 15 COMPANY A: STRATEGIC BUSINESS PERFORMANCE REPORT
Key PerformanceIndicator
Channel/product
MONTH YEAR TO DATE (YTD) FULL YEAR
Actual FC1 Budget Varianceto FC1
3 mthtrend
Varianceto
budgetActual FC1 Budget Variance
to FC1Vs.
2005
Varianceto
budget
FY FC1
FY budget
FY FC1vs.
2005
CorporateKPIs
KPI 3 (£m)
KPI 2 (£m)
KPI 1 (£m)Delivergrowthtargets
KPI 3 (%)
KPI 2 (£m)
KPI 4 (£m)
Delivered through the strategic imperatives
KPI 1 (%)Buildeffectivedistribution
KPI 3 (£k)
KPI 2 (%)
KPI 1 (out of 20)Build marketleadingpropositions
KPI 3 (%)
KPI 2 (£m)
KPI 1 (%)Deliver costefficientservice
KPI 3 (%)
KPI 2 (hours)
KPI 1 (FTE)Improve costcompetitive-ness
KPI 3 (%)
KPI 2 (£m)
KPI 1: Annualised staffturnover (%)
KPI 3: Cost of systemsdowntime (£0,000)
KPI 2: Regretted staffturnover (%)
–
–
–
20 18 15
50 48 46
12 15 15
11% 33%
(20%) –
(4%) (8%)
CREATE CLIMATE FOR SUCCESS
KPI 1 (£m)Createclimate forsuccess
KPI 3 (%)
KPI 2 (£m)
KEY: Variance to budget
= > 100% of target
= > 90% of target
= < 90% of target
Trend
Improvement
Static
Worsening
Data integrity (see p7, point 5 for explanation)
1
3
2
4
Trusted
Robust
Acceptable
Questionable
NOTES:
FC = Forecast
The trend shows the totalof the last three monthsversus the preceding threemonths
19 18 15 27 106 18 15 0
13 15 15 13 –13 15 15 –
180 192 184 2 –7 600 552 –
The original data have been omitted forconfidentiality – see the enlarged sectionbelow, ‘Create climate for success’, whichincludes illustrative data showing how topopulate each section.

icaew.com/fmfac22
As mentioned above, we included a self assessmentpage in the pack. We asked each executive to answerthree questions about each strategic imperative with ared, amber, green (RAG) answer. The questions were:• is the strategic initiative doing the right thing?• is delivery being managed effectively? and• will it deliver benefits in line with plan?
As a result, we produced the chart in Figure 16(above) for the first live run of the SBPR.
This chart generated two hours of discussion,which the strategy director described afterwards asthe best strategic discussion the team had ever had.While purely subjective, it brought out lots ofdifferent perceptions, contributed a more aligned andholistic view of performance and led to somesignificant changes in both strategy and tactics.
In subsequent months, data quality improved,additional KPIs were developed and additionalsupplementary reporting was put in place while somekey business issues were resolved.
The SBPR became an established tool and asimplified version of it was used for staff cascades. Inresponse to staff demand, an article explaining theSBPR went into the quarterly staff magazine. Thearticle was on page three – so prominent – and thefront cover illustrated the rear view out of a car withthe caption: ‘In perfect balance – how the financeteam is helping us to understand the business’.
The article itself linked back to a staff survey findingthat staff wanted to know how their everyday worklinked to the strategic initiatives. The article explainedscorecard concepts in simple terms (including
explaining the rear view mirror analogy!), detailed thedevelopment and evolution of the SBPR and outlinedits use in the business. It generated a lot of discussionand interest across the business and also helped raisethe profile of the finance team considerably.
It made the point that everyone working togetherto common objectives is what strategy is all about andby going to all 4,500 staff in the company it helpeddeliver this. We found that information providers weremuch more inclined to go the extra mile by beingassociated with a project that was seen to be highprofile and to have strong executive buy-in.
So what did the case study demonstrate?1. It is possible to implement a scorecard in four
months.2. Communication and training are vital.3. Using existing strategies makes it easier and more
acceptable.4. Effective sponsorship is essential. 5. Not all MI has to be quantitative – self
assessment brings out fascinating insights.6. It works if someone has the energy and drive to
carry people with them.7. It makes a substantial difference to business
performance.8. It’s an effective way to raise the profile of finance. 9. Just because introducing a balanced scorecard
has failed once, that doesn’t mean it can’t bedone in your organisation. Call it something elseand concentrate on effective implementation.
10. Success breeds success – most executive directorswanted their own divisional SPBRs.
Create a climatefor success
Qn 2 Qn 3
Figure 16 COMPANY A: STRATEGIC BUSINESS PERFORMANCE REPORT – STRATEGIC INITIATIVES
Qn 1
Improve costcompetitiveness
Qn 2 Qn 3Qn 1
Build marketleading propositions
Qn 2 Qn 3Qn 1
Build effectivedistribution
Qn 2 Qn 3Qn 1
Deliver growthtargets
Qn 2 Qn 3Qn 1
Deliver costefficient service
Qn 2 Qn 3Qn 1
Executive
Chief financialofficer
Marketingdirector
IT director
Head ofstrategy
Etc
Assessment key
No, have significantconcerns
Not clear
Yes, fully confident
ASSESSMENT QUESTIONS
Qn 1: Are you confident that the strategic initiative is doing the right thing? Qn 2: Are you confident that the strategic initiative is managing its delivery effectively?Qn 3: Are you confident that the strategic initiative will deliver benefits in line with the plan?
FINANCE & MANAGEMENT SPECIAL REPORT October 2011 23
APPENDIX 1: HISTORY
THE WORK OF KAPLAN AND NORTONThe balanced scorecard was the brainchild of Robert Kaplan and David Norton whose influentialwork in this field has led to its adoption by many businesses all over the world.
‘What you measure is what you get. Senior executives understand thattheir organisation’s measurement system strongly affects the behaviour ofmanagers and employees. Executives also understand that traditionalfinancial accounting measures like return-on-investment and earnings-per-share can give misleading signals for continuous improvement andinnovation – activities today’s competitive environment demands. Thetraditional financial performance measures worked well for the industrialera, but they are out of step with the skills and competencies companiesare trying to master today. As managers and academic researchers havetried to remedy the inadequacies of current performance measurementsystems, some have focused on making operational measures like cycletime and defect rates; the financial results will follow. But managersshould not have to choose between financial and operational measures.In observing and working with many companies, we have found thatsenior executives do not rely on one set of measures to the exclusion ofthe other. They realise that no single measure can provide a clearperformance target or focus attention on the critical areas of the business.Managers want a balanced presentation of both financial and operationalmeasures.’
Robert S Kaplan and David Norton Harvard Business Review, Jan-Feb 1992
Many successful accountants recognised that you couldnot manage an organisation simply by using ‘lag’indicators and therefore created measures thataddressed the ‘lead’ indicators. In the process, theydiscovered that it was far easier to communicate andstimulate action with a focus on non-financialmeasures. In 1991 Bob Eccles wrote an article in theHarvard Business Review (HBR) entitled ‘Theperformance measurement manifesto’, which providedencouragement for those already following this pathand stimulated many others to extend the reach andthe range of non-financial performance measures.
The balanced scorecardThe birth of the balanced scorecard is widely attributed tothe article ‘The balanced scorecard’ by Robert Kaplanand David Norton, published in the January-February1992 edition of HBR. The article argued thatmanagers do not want to have to choose betweenfinancial and operational measures; instead they wanta balanced presentation of measures that allows themto view the company from several perspectivessimultaneously. The article summarised their studiesof 12 companies, and explained the development ofa ‘balanced scorecard’ which would give managers afast but comprehensive view of the business. Thescorecard was split into four sections. To create thebalanced scorecard, managers needed to translatetheir company’s strategy and mission statements intospecific goals and measures.
This article was followed in 1993 by ‘Putting thebalanced scorecard to work’, which gave examples ofhow companies are using the balanced scorecard inpractice. The authors pointed out that effectivemeasurement must be an integral part of themanagement process and argued that the balancedscorecard was a management system that couldmotivate breakthroughs in critical areas. The use ofreal company examples gave a flavour of how thebalanced scorecard could be applied in differentsituations. The article also included a step-by-stepguide to implementation.
The final article in the trio was published in 1996,entitled ‘Using the balanced scorecard as a strategicmanagement system’. This article examined howsome companies had gone one step further andstarted to use the balanced scorecard to help connectlong-term objectives with short-term actions. Thefour stages of the process were defined as:• translating the vision;• communication and linking;• business planning; and• feedback and learning.
Kaplan and Norton followed up with their book TheStrategy Focused Organization in 2001. In it they
articulated five principles for building strategy-focusedorganisations:• translate the strategy to operational terms;• align the organisation to the strategy;• make strategy everyone’s everyday job;• make strategy a continual process; and• mobilise change through strong effective leadership.
They used case studies to illustrate success stories. Ineffect the book lagged behind what was happening inpractice since companies that had burning platforms usedscorecard principles to galvanise their organisation arounda survival strategy. Since 2001 there have been otherbooks by Kaplan and Norton developing themes aroundthe scorecard but these have not been as influential inshaping opinion as their earlier works.
See the following page of this report for a list of furtherreading material on the topic of the balanced scorecard,both from Kaplan and Norton and more generally.
Robert S Kaplan is Baker Foundation Professor atHarvard Business School. In 2006, Kaplan received theLifetime Contribution Award from the ManagementAccounting Section of the American AccountingAssociation and was admitted to the Accounting Hallof Fame.
David Norton is an international consultant and co-founder and director of several professional servicesfirms, including Palladium Group, Balanced ScorecardCollaborative, and Renaissance Worldwide. In 2008 heand Kaplan were voted as two of the world’s 12 mostinfluential thinkers by Sun Top Media’s ‘Thinkers 50’.

icaew.com/fmfac24
APPENDIX 2: ICAEW RESOURCES
BOOKS, JOURNAL ARTICLES AND MORE
ELECTRONIC RESOURCES
Available online 24/7 for ICAEWmembers at icaew.com/library. Use the Subject gateways tab, selectBusiness Management, thenPerformance Management, andfinally Balanced Scorecard.Alternatively go toicaew.com/en/library/subject-gateways/business-management/performance-management/balanced-scorecard
eBooksBalanced scorecard diagnostics:Maintaining maximum performance by P R Niven, Wiley, 2005, xvii,206ppISBN: 0471681237
eJournal articles‘Managing alliances with thebalanced scorecard’by R S Kaplan, Harvard BusinessReview, Vol.98, No.1, January-February 2010, pp.114-120
‘Lead and manage’by R S Kaplan, Leadership Excellence,Vol.26, Issue 10, October 2009,pp.7-8
‘Linking strategy to operations: Sixstages to execution’by A Pateman, Business PerformanceManagement, Vol.6 Issue 4,December 2008, pp.10-13
‘Moving strategy forward: mergingthe balanced scorecard and businessintelligence’by B Paladino and N Williams,Business Performance Management,Vol.6, Issue 2, June 2008, pp.12-17
‘Using the balanced scorecard as astrategic management system’by R S Kaplan and D P Norton,Harvard Business Review, Vol. 85, Issue7/8, July/August 2007, pp.150-161
OTHER RESOURCES
BooksKey performance indicators: developing,implementing and using winning KPIs by D Parmenter, Wiley, 2010, xix,299ppISBN: 9780470545157
Business process management and thebalanced scorecard: using processes asstrategic drivers by R F Smith, Wiley, 2007, x, 227ppISBN: 9780470047460 and0470047461
Scorecard best practices: design,implementation and evaluation by R A Lawson, Wiley, 2007, xvi,176ppISBN: 9780470129463
Balanced scorecard by M Bourne, Hodder Education,2007, xvi, 208ppISBN: 9780340946497
Alignment: using the balancedscorecard to create corporate synergiesby R S Kaplan, Harvard BusinessSchool Press, 2006, x, 302ppISBN: 1591396905
Balanced scorecard step-by-step:maximizing performance andmaintaining resultsby P R Niven, Wiley, 2006, xvii,318ppISBN: 9780471780496 and0471780499
How to develop and make effective useof a balanced scorecardby British Quality Foundation, 2005,25ppISBN: 1899358609
Implementing the IT balancedscorecard: aligning IT with corporatestrategyby J Keyes, Auerbach Publications,2005, xxii, 500ppISBN: 0849326214
A practitioner’s guide to the balancedscorecard: a practitioner’s report basedon ‘Shareholder and stakeholderapproaches to strategic performancemeasurement using the balancedscorecard’by A MacKay, CIMA, 2005, 63ppISBN: 1859715702Available in full at www.cimaglobal.com/Documents/ImportedDocuments/tech_resrep_a_practitioners_guide_to_the_balanced_scorecard_2005.pdf
Seminal works: The balanced scorecard– translating strategy into actionby R S Kaplan and D P Norton,Harvard Business School Press, 1996,xi, 322ppISBN: 9780875846514
Articles‘Strategic management’by A Macnab, Financial Management,July/August 2010, pp.31-33
‘Why do so many implementationsfail?’ by K Bounds, Finance & Management,No.182, November 2010, pp.6-9
‘Can a balanced scorecard help in arecession?’ by J Scopes, Finance & Management,No.171, November 2009, pp.14-15
‘The balanced scorecard – measuresthat drive performance’ by R S Kaplan, Harvard BusinessReview, Vol.70, No.1,January/February 1992, pp.71-79
Further information and resources onperformance management areavailable via the Library &Information Service’s websiteicaew.com/library
ICAEW members can obtain all ofthese publications from the Library &Information Service. Books can beposted out free of charge. Journalarticles can be supplied for a smallfee. Contact the Library on +44 (0)207920 8620 or [email protected]
The following resources are available to ICAEW members from the Library and InformationService at icaew.com/library

FINANCE & MANAGEMENT SPECIAL REPORT October 2011 25
SPECIAL REPORTS
PREVIOUS SPECIAL REPORTSThe faculty special reports summarised here were published over the past 15 months and, alongwith many others, are available to members at icaew.com/specialreports. They comprise a rangeof in-depth reports on a single topic, sometimes by a single author, sometimes by a range ofexperts. They are a vital source of expertise on a variety of subjects.
DEVELOPING A VISION FOR YOURBUSINESSThis report, by a range of authors, includingacademics and consultants, aims to offerpractical advice on developing a vision foryour business, dealing with how to define avision, the role of the FD and how to tell avision story. You will also find suggestions on
how to run workshops with employees todevelop a vision that successfullyencapsulates the ethos of your business. Akey message is that vision statements arecritical, and need time spent on them if theyare to be really effective.
Strategic planning September 2010 (SR30)
IFRSs – A BRIEFING FOR CEOsAs a chartered accountant in business youneed to keep up to date with the standardsthat apply to financial reporting. You alsoneed to have a thorough understanding oftheir business implications. This special reportprovides exactly that, in a practical andaccessible format. These concise and easy to
use briefing notes, produced by theInternational Accounting StandardsCommittee Foundation, provide summaries ofall the consolidated versions of InternationalFinancial Reporting Standards (IFRSs) issued at1 January 2009, in non-technical language.
Financial management June 2010 (SR29)
FINANCE TRANSFORMATION – THE OUTSOURCING PERSPECTIVEThis report offers a full overview of financeand accounting outsourcing solutions in linewith the most recent trends in pricing,location and the level of outsourcing thatbusinesses currently benefit from. A comprehensive guide to all matters
surrounding outsourcing, this special reportprovides clear guidance on the subtleties andthe practicalities faced by a business planningto engage in any level of finance andaccounting outsourcing.
Outsourcing December 2010 (SR31)
PERSONAL DEVELOPMENT FORACCOUNTANTS IN BUSINESSTechnical excellence and practicalexperience can only take you so far as achartered accountant in business. Oncethese are established, we becomemanagers, then directors and leaders. Thisspecial report pulls together a selection of
our best articles showing how to developthe ‘softer’ skills necessary in such roles. Itcovers the areas of leadership, networking,planning, saying ‘no’, delegating andnegotiating to provide a practical guide toimproving yourself and, as a result, yourcareer.
Personal development March 2011 (SR32)
PROJECT MANAGEMENTThere are myriad roles that you mayperform in a project, such as sponsor,champion, steering group member, projectlead, project member or project accountant.This report is an overview of the key aspectsof project management and should providea great starting point for any professional
accountant about to perform any of thesefunctions. Although it specifically addressesformal projects, much of the informationmay also be useful in informing other, lessformal, assignments. The report alsocontains details of recent developments,current issues and suggestions for furtherreading.
Project management June 2011 (SR33)

TECPLM10517