special report - from inflation to deflation and back - august 14-2013
TRANSCRIPT
7/27/2019 Special Report - From Inflation to Deflation and Back - August 14-2013
http://slidepdf.com/reader/full/special-report-from-inflation-to-deflation-and-back-august-14-2013 1/38
David A. Rosenberg August 14, 2013 Chief Economist & Strategist Special [email protected]
Page 1 of 38
SPECIAL REPORT
From Inflation To Deflation … And Back!I have been laying out the groundwork for the next phase of this cycle,which is good news for Main Street even if not that great for Wall Streetor my long-held belief in the longevity of this secular disinflationary cycle… which I think is now in its mature stage.
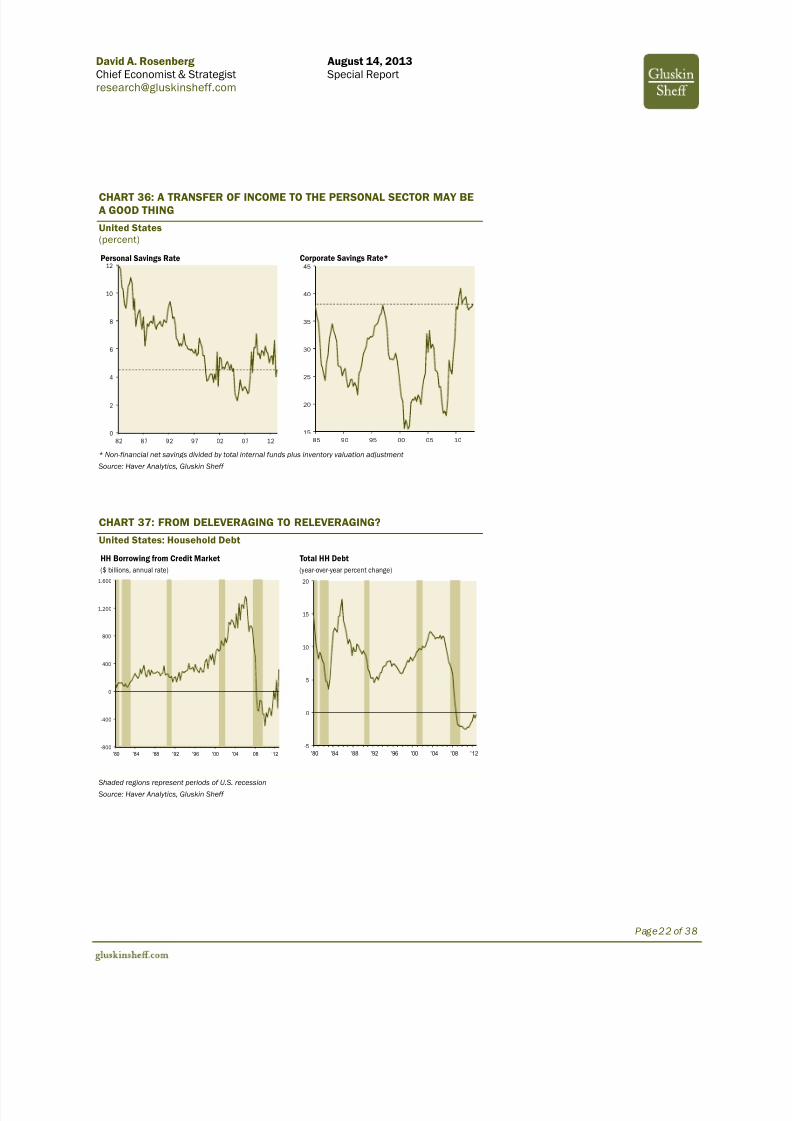
I think the people that write off the prospect of cost-push inflation aretaking on a very myopic view. Inflation is a process, and it takes a long while to build. There is evidence that the consumer deleveraging cycle islargely over. Subprime auto credit is up 30% from a year ago. We are up
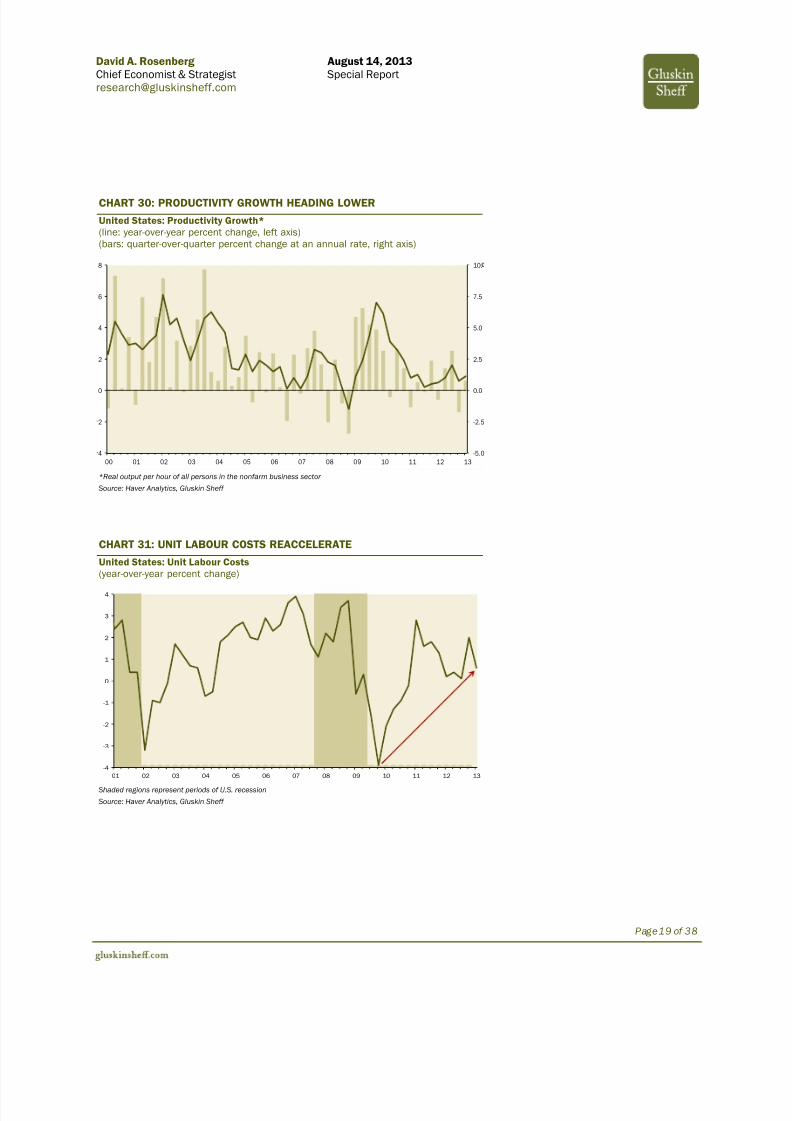
to a 20% share of mortgages being originated with downpayments of less than 10%. CLO (collateralized loan obligation) issuance is back to2007 levels. In the corporate space, fully one-third of high-yield debtissues this year have been centred in firms with the weakest balancesheets. At some point, money velocity and the money multiplier will stopfalling. No doubt fiscal drag will take a chunk out of GDP growth in thenear-term, but this too shall pass and the reality is that the aggregatesupply curve (and this is true globally) has become increasingly inelastic.The pool of available skilled labour is shrinking rapidly and after fiveyears of the weakest growth in the private sector capital stock, we arestarting to see the lagged ill-effects on productivity growth. Potentialnon-inflationary growth had already been pared, in my estimates, to1.7%. And the only way we could have experienced a drop in the
unemployment rate in the past year from 8.2% to 7.4% in the face of sub-2% economic growth strongly suggests that we are now on our wayto a potential non-inflationary speed limit of just 1%. Very Europeanindeed.
I am not very bullish on the outlook for aggregate demand growth. Butthe shape of the aggregate supply curve is now so inelastic that itdoesn’t take much in the way of growth in spending to generate higherinflation over time. I realize that is not evident just yet to the naked eyeand this is a process that will be akin to watching grass grow. That isalways the case. This is the big risk — margin compression affects the‘E’, while inflation, insofar as the tight historical relationship with finalprices holds, even if to a smaller degree this time around, affects theP/E. Once again, this becomes a strategy of adding some inflationhedges to the S.I.R.P. portfolio — exposure to tangibles or hard assets,and in some cases like resources and TIPS/RRBS (real return bonds),they have cheapened up very nicely of late. Within the equity universe,dividend coverage/payouts are augmented by screening of sectors andcompanies that have high-fixed costs and low variable costs, that havehigh capital/labour ratios and also high demand inelasticities (a.k.a.
SUMMARY
Inflation is a process,and it takes a long while to build. Thereis evidence that theconsumerdeleveraging cycle islargely over
The shape of theaggregate supplycurve is now soinelastic that itdoesn’t take much inthe way of growth inspending to generatehigher inflation overtime
The prospect that weare sitting at over 3%on the 10-year T-noteyield a year from nowand north of 4% by2017 is hardly trivial
If you are an investor,don’t spend too long
debating whether youshould be starting tohedge your portfolioagainst the prospectof a rising long-terminterest rateenvironment
Get a FREE 7 DAY TRIAL
By going to www.gluskinsheff.com/research
And subscribing with promo code:BWDGSATRIAL

7/27/2019 Special Report - From Inflation to Deflation and Back - August 14-2013
http://slidepdf.com/reader/full/special-report-from-inflation-to-deflation-and-back-august-14-2013 2/38
David A. Rosenberg August 14, 2013 Chief Economist & Strategist Special [email protected]
Page 2 of 38
‘pricing power’). Stay tuned as this theme becomes more fully fleshedout in the near future. Better to be prepared for shifts in the landscapethan to be surprised.
I keep emphasizing that it took Paul Volcker a good three years to killinflation for good and it is taking longer for Bernanke to dispel deflationconcerns even if the U.S. economy in terms of consumer prices hasnever deflated once in the past six decades, but he will ultimately besuccessful and my call for higher long-term rates is a secular view thatdoes not dismiss out of hand the prospect that near-term cyclicalpressures and the aggressive buying by the Fed does not lead to a testof the yield lows in coming months. It’s just a rally I would be glad to faceas it probably is the last gasp in this three-decade old bond bull phase.Unless you do believe in deflation, it is going to be difficult to hold everymaturity to the 10-year T-note negative in real terms (adjusted for thecore CPI trend) and negative relative to nominal GDP across the entirecurve indefinitely — that last part is only sustainable in a period of negative real growth rates which is hardly the case today and remainsan elusive forecast for many a pundit. Have a look at Ben Bernanke’sanalytical piece called Long-Term Interest Rates back on March 1 st andassess the balance of risks — visibly one-sided even if the timing is upfor debate.
The prospect that we are sitting at over 3% on the 10-year T-note yield ayear from now and north of 4% by 2017 is hardly trivial. I’ve been in thedeflation camp for two decades … but strongly feel it is time to move on.It is a crowded trade. I used to say in the 1990s and 2000s that we had
a generation of market pundits and players who only know higherinterest rates and inflation. Today, we have a group of twenty, thirty andeven forty-somethings who know little about bond selloffs, inflation oreven what a normal Fed tightening cycle looks like. The new paradigmhas shifted in the opposite direction and today’s ever-more consensusforecast of 1% yields on 10-year T-notes and 2% on the long bond basedon deflation reminds me of the bold calls for 30% bond yields back inthe early 1980s based on runaway inflation. Rosie’s Rule #4: “Fall inlove with your partner, not your forecast” .
A recent McKinsey study found that only 43% of employers surveyed innine countries believed they had a sufficient pool of skilled entry-levelworkers to choose from. Not only that, but mid-sized firms (between 50
and 500 employees) had an average of 13 entry-level positions sitting vacant. In other words, this is far more a skills mis-match story than onerelated to aging (though not aged) baby boomers. The reality is thatemployment has risen some three million since mid-2009 but for somereason, nine million adult Americans dropped out of the labour marketaltogether over this time frame. The demand is there with job openingsrising 81% from the cycle lows and layoffs down 41%. The problem isthat new hires are stagnating at best, and this is why the workweek is
I keep emphasizing that ittook Paul Volcker a goodthree years to kill inflationfor good and it is takinglonger for Bernanke todispel deflation concernseven if the U.S. economy interms of consumer priceshas never deflated once inthe past six decades
The reality is thatemployment has risen somethree million since mid-2009 but for some reason,nine million adultAmericans dropped out ofthe labour marketaltogether over this timeframe

7/27/2019 Special Report - From Inflation to Deflation and Back - August 14-2013
http://slidepdf.com/reader/full/special-report-from-inflation-to-deflation-and-back-august-14-2013 3/38
David A. Rosenberg August 14, 2013 Chief Economist & Strategist Special [email protected]
Page 3 of 38
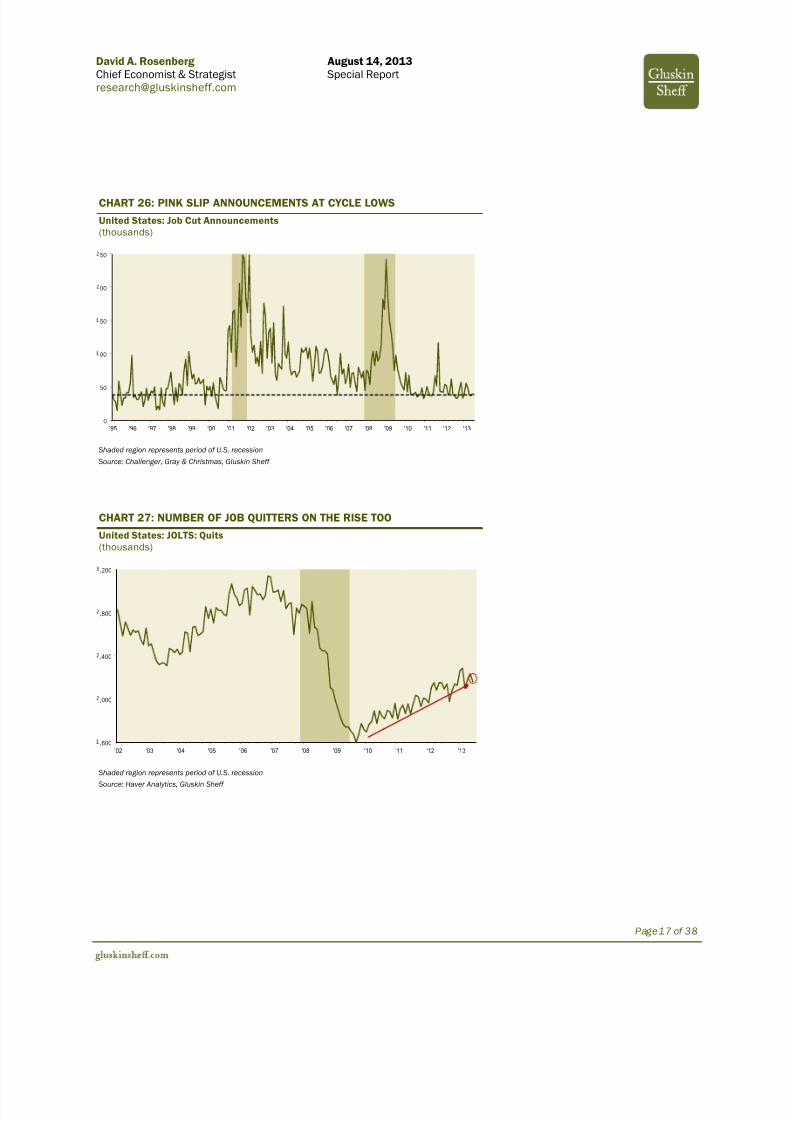
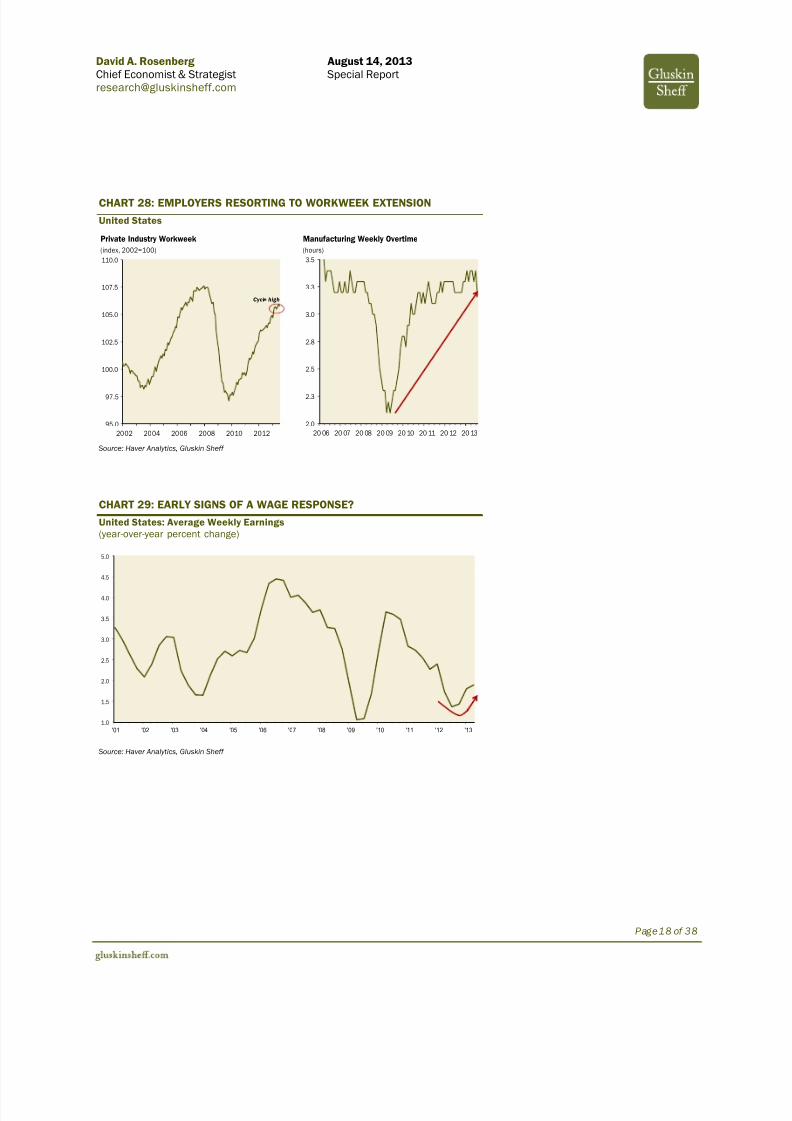
being lengthened and overtime hours being expanded. And the working class is beginning to notice that it is starting to have some bargaining power as the number of voluntary quits has risen 35% so far this cycleand are flirting near 4½-year highs.
While gross hirings are anemic, to be sure, companies are trying to hang onto their staff and as such, layoff rates have come down a long way.There may well be 90 million American adults outside of the labourmarket and another 12 million in the jobless ranks looking for a job butcan’t find one because they don’t have the right skills, but rest assuredthat the 144 million who are gainfully employed are becoming ever moreconfident in their own prospects, and that is, again, underscored by a“voluntary quit’ rate that has also risen to a cycle high.
No matter the reason, the reality is that capacity is being taken out of the jobs market (much like it has in the airline sector which is one areathat now has pricing power as a result), and as such, less competitionfor available jobs will likely result in rising wage rates unless the laws of supply and demand have managed to bypass the labour market. Muchof this “capacity reduction” may reflect the fact that an ever-rising number of the “99%” are actually getting paid not to work. So I wouldsay this may be more about the incentive system than demographics.
For example, a record 23 million households are now on food stamps —up over 735,000 from a year ago and now this is representing close to30% of the total number of adults who now reside outside the confinesof the labour force. There are also nearly nine million Americans on
disability and I do not want to at all disparage those who are trulyphysically hurt, but my only point is that the SSDI program (SocialSecurity Disability Insurance) is bursting at the seams, having jumped byone million workers in just the past three years and 300,000 of these in
just the past three months — an annual expense (to the taxpayer and itis non-wage income to the recipient) of $165 billion.
It will not be a straight line up, and in fact, I see the prospect of a still-oversold bond market seeing lower yield activity over the near-term, butdon’t confuse the small and big picture here. The big picture is that thelows in Treasury yields were turned in a year ago when a three-decadesecular bull market came to an end, and a secular bear market was inits infancy. You want more evidence? Go to the Bernanke piece he
penned on March 1st
titled “Long-Term Interest Rates” and you will seefirsthand that the architect of today’s super-low interest rates himself sees 10-year T-note yields moving from today’s 2.5%-ish level tosomething closer to 4% or even higher in coming years.
So if you are an issuer, the time for refinancing is now, not later. And if you are an investor, don’t spend too long debating whether you shouldbe starting to hedge your portfolio against the prospect of a rising long-
While gross hirings areanemic, to be sure,companies are trying tohang onto their staff and assuch, layoff rates havecome down a long way
The big picture is that thelows in Treasury yields wereturned in a year ago when athree-decade secular bullmarket came to an end,and a secular bear market
was in its infancy

7/27/2019 Special Report - From Inflation to Deflation and Back - August 14-2013
http://slidepdf.com/reader/full/special-report-from-inflation-to-deflation-and-back-august-14-2013 4/38
David A. Rosenberg August 14, 2013 Chief Economist & Strategist Special [email protected]
Page 4 of 38
term interest rate environment, even as central banks continue to keepshort-term policy yields at the floor. From the perspective of aneconomist at a wealth management firm, this means embarking onstrategies that over time will effectively hedge out interest rate risk, forexample with exposure to hard assets, credit arbitrage, and screening inthe equity market for companies with high fixed costs and low variablecosts, high ratios of capital to labour, and firms with a proven history of being able to pass on cost increases to protect profit margins.
CHART 1: ROSIE’S BAKER’S DOZEN OF (ECONOMISTS’) RULES
1 In order for an economic forecast to be relevant, it must be combined with a market call
2 Never be a slave to the data — they are no substitute for astute observation of the big picture
3 The consensus rarely gets it right and almost always errs on the side of optimism — except at the bottom
4 Fall in love with your partner, not your forecast
5 No two cycles are ever the same
6 Never hide behind your model
7 Always seek out corroborating evidence
8 Have respect for what the markets are telling you
9 Be constantly aware with your forecast horizon — many clients live in the short run
10 Of all the market forecasters, Mr. Bond gets it right most often
11 Highlight the risks to your forecasts
12 Get the U.S. consumer right and everything else will take care of itself
13 Expansions are more fun than recessions (straight from Bob Farrell’s quiver!)Source: Gluskin Sheff

7/27/2019 Special Report - From Inflation to Deflation and Back - August 14-2013
http://slidepdf.com/reader/full/special-report-from-inflation-to-deflation-and-back-august-14-2013 5/38

7/27/2019 Special Report - From Inflation to Deflation and Back - August 14-2013
http://slidepdf.com/reader/full/special-report-from-inflation-to-deflation-and-back-august-14-2013 6/38
David A. Rosenberg August 14, 2013 Chief Economist & Strategist Special [email protected]
Page 6 of 38
CHART 4: THE WIZARD IS A HERO!
CHART 5: UNPRECEDENTED MONETARY EXPANSION
United States
0.5
1.0
1.5
2.0
2.5
3.0
05 06 07 08 09 10 11 120.0
0.5
1.0
1.5
2.0
2.5
3.0
3.5
4.0
4.5
5.0
5.5
05 06 07 08 09 10 11 12
Fed Funds Rate(percent)
Fed Balance Sheet – Total Assets($ trillion)
Source: Haver Analytics, Gluskin Sheff

7/27/2019 Special Report - From Inflation to Deflation and Back - August 14-2013
http://slidepdf.com/reader/full/special-report-from-inflation-to-deflation-and-back-august-14-2013 7/38
David A. Rosenberg August 14, 2013 Chief Economist & Strategist Special [email protected]
Page 7 of 38
CHART 6: NINE TRILLION IN CASH … EARNING 0%
United States(quarter-over-quarter percent change, annual rate)
4.0
4.5
5.0
5.5
6.0
6.5
7.0
7.5
8.0
8.5
9.0
9.5
2001 2003 2005 2007 2009 2011 20
Household Cash Assets($ trillions)
3-Month Treasury Bill Yield(percent)
0
1
2
3
4
5
6
2001 2003 2005 2007 2009 2011 2013
Source: Haver Analytics, Gluskin Sheff
CHART 7: HE SAID WHAT??
“We do think that these policies can bring interest rates down, not just treasury rates but awhole range of rates including mortgage ratesand rates for corporate bonds and other types of important interest rates. It also affects stock
prices. It affects other prices, home prices, for example.
So looking at all the different channels of effect,we think it does have an impact on the economy.It will have impact on the labor market but again, the way I would describe it is a meaningful effect, a significant effect, but not a panacea,not a solution for the whole issue.”
Ben Bernankethe Post-FOMC Meeting Press Conference
September 13, 2012 .
7/27/2019 Special Report - From Inflation to Deflation and Back - August 14-2013
http://slidepdf.com/reader/full/special-report-from-inflation-to-deflation-and-back-august-14-2013 8/38
David A. Rosenberg August 14, 2013 Chief Economist & Strategist Special [email protected]
Page 8 of 38
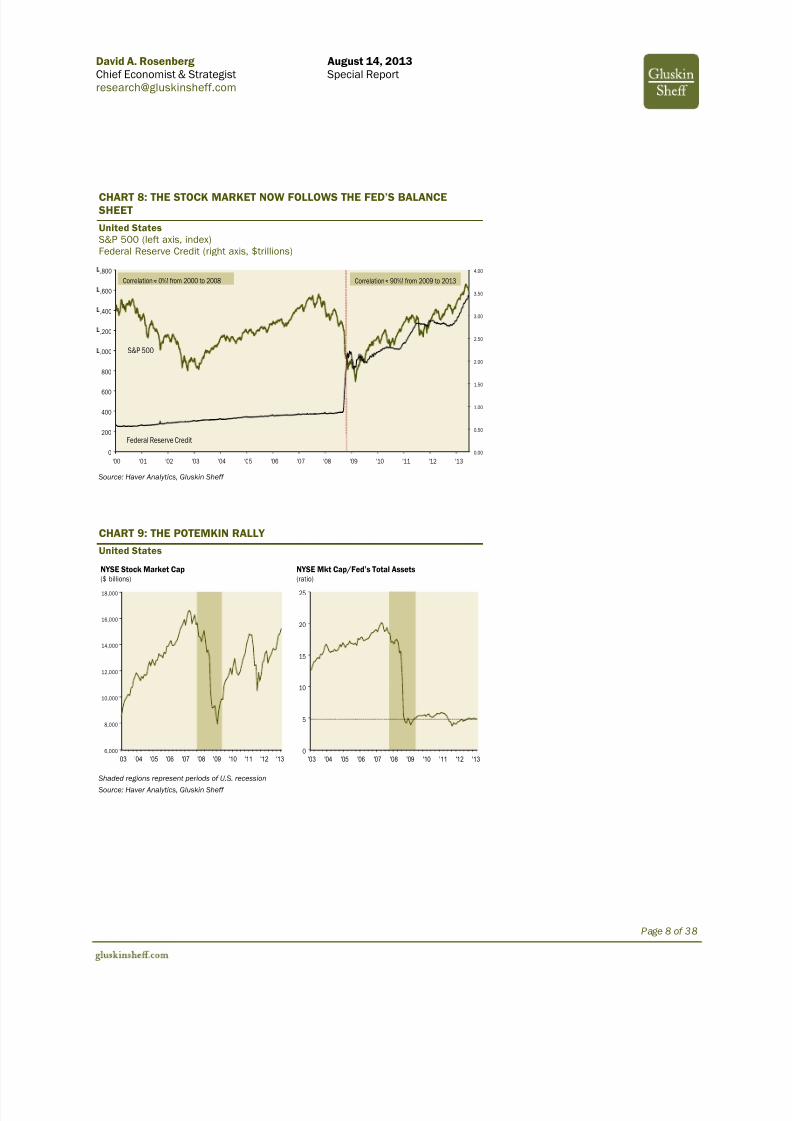
CHART 8: THE STOCK MARKET NOW FOLLOWS THE FED’S BALANCESHEET
United StatesS&P 500 (left axis, index)Federal Reserve Credit (right axis, $trillions)
0.00
0.50
1.00
1.50
2.00
2.50
3.00
3.50
4.00
0
200
400
600
800
,000
,200
,400
,600
,800
'00 '01 '02 '03 '04 '05 '06 '07 '08 '09 '10 '11 '12 '13
Correlation≈ 0%! from 2000 to 2008 Correlation≈ 90%! from 2009 to 2013
S&P 500
Federal Reserve Credit
Source: Haver Analytics, Gluskin Sheff
CHART 9: THE POTEMKIN RALLY
United States
0
5
10
15
20
25
'03 '04 '05 '06 '07 '08 '09 '10 '11 '12 '136,000
8,000
10,000
12,000
14,000
16,000
18,000
'03 '04 '05 '06 '07 '08 '09 '10 '11 '12 '13
NYSE Stock Market Cap($ billions)
NYSE Mkt Cap/Fed’s Total Assets(ratio)
Shaded regions represent periods of U.S. recession
Source: Haver Analytics, Gluskin Sheff

7/27/2019 Special Report - From Inflation to Deflation and Back - August 14-2013
http://slidepdf.com/reader/full/special-report-from-inflation-to-deflation-and-back-august-14-2013 9/38
David A. Rosenberg August 14, 2013 Chief Economist & Strategist Special [email protected]
Page 9 of 38
CHART 10: THE POTEMKIN ECONOMIC RECOVERY
United States: 16 Quarters After A Recession E nds
4.2%
3.9%
4.2%
2.0%2.2%
3.3%
1.4%
0%
1%
1%
2%
2%
3%
3%
4%
4%
5%
61 Q1 75 Q1 82 Q4 91 Q1 01 Q4 Avg. Current
Last Quarter of Recession
5.6%
10.7%
7.2%
4.3%4.8%
6.5%
3.0%
0%
2%
4%
6%
8%
10%
12%
61 Q1 75 Q1 82 Q4 91 Q1 01 Q4 Avg. Current
Last Quarter of Recession
Real GDP per capita(annualized percent change)
Nominal GDP per capita(annualized percent change)
Source: Haver Analytics, Gluskin Sheff
CHART 11: SUPPLY CURVE SCLEROSIS
United States
Total Factor Productivity(percent change from business-cycle peak)
-6
-4
-2
0
2
4
6
8
-16 -14 -12 -10 -8 -6 -4 -2 0 2 4 6 8 10 1 2 14 1 6 18 2 0 2 2 24
Quarters before/after business-cycle peak
1990 & 2001 average
1973 & 1981average
Greatrecession
“The report cites three estimates of theextent to which a lower trend rate explainsthe weak recovery. One, published in 2012by James Stock of Harvard University (now a council member) and Mark Watson of Princeton University, derives America’spotential growth rate from the long-termaverage of variables such as employmentand productivity. This approach concludesthat 80% of the two-percentage-point
shortfall in growth relative to other recoveries is caused by slower potential.”
The Economist, March 23, 2013
Source: Federal Reserve Bank of San Francisco, The Economist, Gluskin Sheff

7/27/2019 Special Report - From Inflation to Deflation and Back - August 14-2013
http://slidepdf.com/reader/full/special-report-from-inflation-to-deflation-and-back-august-14-2013 10/38
David A. Rosenberg August 14, 2013 Chief Economist & Strategist Special [email protected]
Page10 of 38
CHART 12: SECULAR DECLINE IN “POTENTIAL” GDP GROWTH
United States: Productivity Growth + Labour Force Growth(five-year percent change at an annual rate)
1.0
1.5
2.0
2.5
3.0
3.5
4.0
4.5
5.0
5.5
85 86 86 87 88 89 90 91 91 92 93 94 95 96 96 97 98 99 00 01 01 02 03 04 05 06 06 07 08 09 10 11 11 12
1.8%
Source: Haver Analytics, Gluskin Sheff
CHART 13: SUPPLY CURVE BECOMING INELASTIC
1980-90’s Elastic Supply Curve Today’s Inelastic Supply Curve
Source: Gluskin Sheff
7/27/2019 Special Report - From Inflation to Deflation and Back - August 14-2013
http://slidepdf.com/reader/full/special-report-from-inflation-to-deflation-and-back-august-14-2013 11/38
David A. Rosenberg August 14, 2013 Chief Economist & Strategist Special [email protected]
Page11 of 38
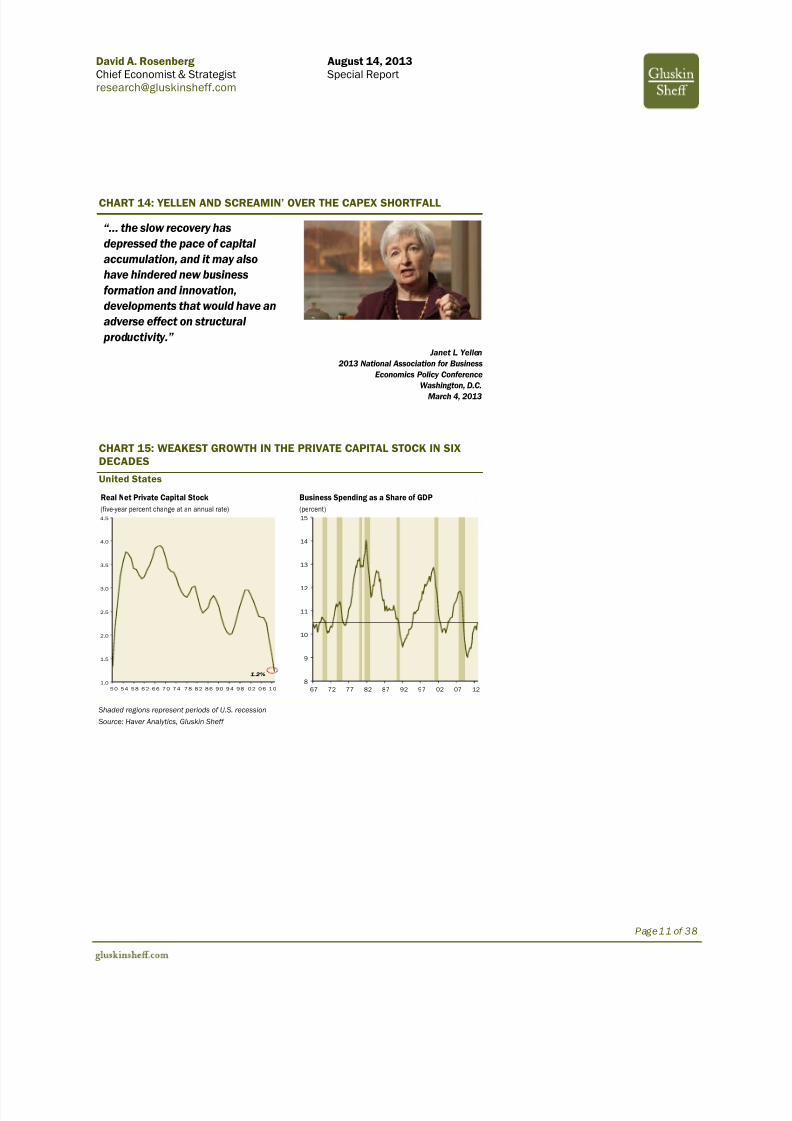
CHART 14: YELLEN AND SCREAMIN’ OVER THE CAPEX SHORTFALL
“… the slow recovery hasdepressed the pace of capital accumulation, and it may alsohave hindered new businessformation and innovation,developments that would have anadverse effect on structural
productivity.” Janet L. Yellen
2013 National Association for BusinessEconomics Policy Conference
Washington, D.C.March 4, 2013
CHART 15: WEAKEST GROWTH IN THE PRIVATE CAPITAL STOCK IN SIXDECADES
United States
8
9
10
11
12
13
14
15
67 72 77 82 87 92 97 02 07 121.0
1.5
2.0
2.5
3.0
3.5
4.0
4.5
5 0 5 4 5 8 6 2 6 6 7 0 7 4 7 8 8 2 8 6 9 0 9 4 9 8 0 2 0 6 1 0
1.2%
Real Net Private Capital Stock Business Spending as a Share of GDP(five-year percent change at an annual rate) (percent)
Shaded regions represent periods of U.S. recession
Source: Haver Analytics, Gluskin Sheff
7/27/2019 Special Report - From Inflation to Deflation and Back - August 14-2013
http://slidepdf.com/reader/full/special-report-from-inflation-to-deflation-and-back-august-14-2013 12/38
David A. Rosenberg August 14, 2013 Chief Economist & Strategist Special [email protected]
Page12 of 38
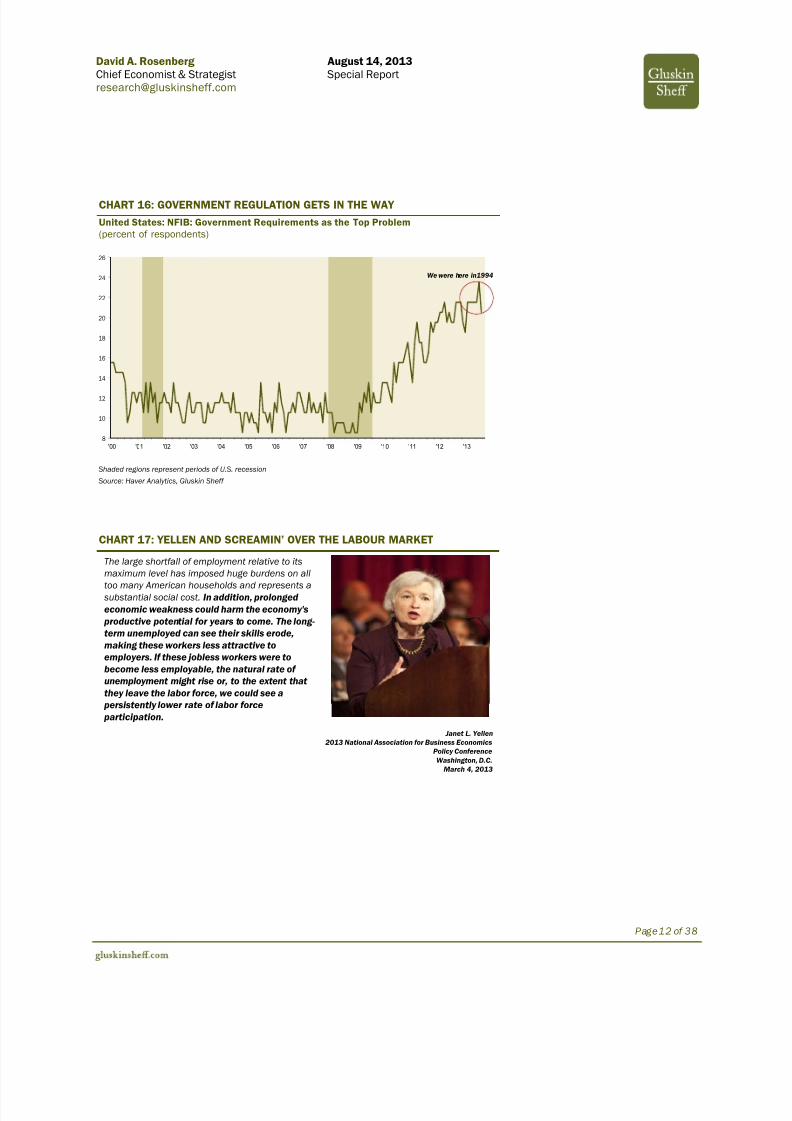
CHART 16: GOVERNMENT REGULATION GETS IN THE WAY
United States: NFIB: Government Requirements as the Top Problem(percent of respondents)
8
10
12
14
16
18
20
22
24
26
'00 '01 '02 '03 '04 '05 '06 '07 '08 '09 '10 '11 '12 '13
We were here in1994
Shaded regions represent periods of U.S. recession
Source: Haver Analytics, Gluskin Sheff
CHART 17: YELLEN AND SCREAMIN’ OVER THE LABOUR MARKET
The large shortfall of employment relative to itsmaximum level has imposed huge burdens on all
too many American households and represents a substantial social cost. In addition, prolonged economic weakness could harm the economy's
productive potential for years to come. The long-term unemployed can see their skills erode,making these workers less attractive toemployers. If these jobless workers were tobecome less employable, the natural rate of unemployment might rise or, to the extent that they leave the labor force, we could see a
persistently lower rate of labor force participation.
Janet L. Yellen2013 National Association for Business Economics
Policy ConferenceWashington, D.C.
March 4, 2013

7/27/2019 Special Report - From Inflation to Deflation and Back - August 14-2013
http://slidepdf.com/reader/full/special-report-from-inflation-to-deflation-and-back-august-14-2013 13/38
David A. Rosenberg August 14, 2013 Chief Economist & Strategist Special [email protected]
Page13 of 38
CHART 18: AVERAGE LENGTH OF UNEMPLOYMENT
United States(weeks)
10.0
15.0
20.0
25.0
30.0
35.0
40.0
45.0
'01 '02 '03 '04 '05 '06 '07 '08 '09 '10 '11 '12 '13
Shaded regions represent periods of U.S. recession
Source: Haver Analytics, Gluskin Sheff
CHART 19: A RECORD NUMBER OF AMERICANS HAVE LEFT THELABOUR FORCE
United States
32.5
33.5
34.5
35.5
36.5
2001 2004 2007 2010 201378
80
82
84
86
88
90
Jan/08 Jan/09 Jan/10 Jan/11 Jan/12 Jan/13
Over 90million!
People Not in Labor Force Share of population not in Labour Force
Source: Haver Analytics, Gluskin Sheff

7/27/2019 Special Report - From Inflation to Deflation and Back - August 14-2013
http://slidepdf.com/reader/full/special-report-from-inflation-to-deflation-and-back-august-14-2013 14/38
David A. Rosenberg August 14, 2013 Chief Economist & Strategist Special [email protected]
Page14 of 38
CHART 20: JOB OPENINGS ON THE RISE
United States: JOLTS: Job Openings(thousands)
,000
,500
,000
,500
,000
,500
,000
'02 '03 '04 '05 '06 '07 '08 '09 '10 '11 '12 '13
Shaded region represents period of U.S. recession
Source: Haver Analytics, Gluskin Sheff
CHART 21: HIRING INTENTIONS: CHOPPY BUT ON AN UPWARDTRAJECTORY
United States: NFIB: Firms Planning to Increase Employment(percent of respondents)
-10
-5
0
5
10
15
20
'00 '01 '02 '03 '04 '05 '06 '07 '08 '09 '10 '11 '12 '13
Shaded regions represent periods of U.S. recessionSource: Haver Analytics, Gluskin Sheff

7/27/2019 Special Report - From Inflation to Deflation and Back - August 14-2013
http://slidepdf.com/reader/full/special-report-from-inflation-to-deflation-and-back-august-14-2013 15/38
David A. Rosenberg August 14, 2013 Chief Economist & Strategist Special [email protected]
Page15 of 38
CHART 22: FIRMS WITH POSITIONS NOT ABLE TO FILL
United States: NFIB Survey(percent of respondents)
5
10
15
20
25
30
35
40
'00 '01 '02 '03 '04 '05 '06 '07 '08 '09 '10 '11 '12 '13
Shaded regions represent periods of U.S. recession
Source: Haver Analytics, Gluskin Sheff
CHART 23: SKILL SHORTAGE IS MORE ACUTE
United States: NFIB: Businesses with Few or No Qualified Applicants for JobOpenings(percent of respondents)
20
25
30
35
40
45
50
'04 '05 '06 '07 '08 '09 '10 '11 '12 '13
Shaded region represents period of U.S. recession
Source: Haver Analytics, Gluskin Sheff

7/27/2019 Special Report - From Inflation to Deflation and Back - August 14-2013
http://slidepdf.com/reader/full/special-report-from-inflation-to-deflation-and-back-august-14-2013 16/38
David A. Rosenberg August 14, 2013 Chief Economist & Strategist Special [email protected]
Page16 of 38
CHART 24: HIRING IS LAGGING BEHIND
United States: JOLTS: Hires(thousands)
,600
,800
,000
,200
,400
,600
,800
,000
,200
,400
,600
'02 '03 '04 '05 '06 '07 '08 '09 '10 '11 '12 '13
Shaded region represents period of U.S. recession
Source: Haver Analytics, Gluskin Sheff
CHART 25: FIRINGS PLUNGE (LABOUR HOARDING?)
United States: JOLTS: Layoffs and Discharges(thousands)
,500
,750
,000
,250
,500
,750
'02 '03 '04 '05 '06 '07 '08 '09 '10 '11 '12 '13
Shaded region represents period of U.S. recession
Source: Haver Analytics, Gluskin Sheff
7/27/2019 Special Report - From Inflation to Deflation and Back - August 14-2013
http://slidepdf.com/reader/full/special-report-from-inflation-to-deflation-and-back-august-14-2013 17/38
David A. Rosenberg August 14, 2013 Chief Economist & Strategist Special [email protected]
Page17 of 38
CHART 26: PINK SLIP ANNOUNCEMENTS AT CYCLE LOWS
United States: Job Cut Announcements(thousands)
0
50
00
50
00
50
'95 '96 '97 '98 '99 '00 '01 '02 '03 '04 '05 '06 '07 '08 '09 '10 '11 '12 '13
Shaded region represents period of U.S. recession
Source: Challenger, Gray & Christmas, Gluskin Sheff
CHART 27: NUMBER OF JOB QUITTERS ON THE RISE TOO
United States: JOLTS: Quits(thousands)
,600
,000
,400
,800
,200
'02 '03 '04 '05 '06 '07 '08 '09 '10 '11 '12 '13
Shaded region represents period of U.S. recession
Source: Haver Analytics, Gluskin Sheff
7/27/2019 Special Report - From Inflation to Deflation and Back - August 14-2013
http://slidepdf.com/reader/full/special-report-from-inflation-to-deflation-and-back-august-14-2013 18/38
David A. Rosenberg August 14, 2013 Chief Economist & Strategist Special [email protected]
Page18 of 38
CHART 28: EMPLOYERS RESORTING TO WORKWEEK EXTENSION
United States
95.0
97.5
100.0
102.5
105.0
107.5
110.0
2002 2004 2006 2008 2010 2012
Cycle high
Private Industry Workweek(index, 2002=100)
2.0
2.3
2.5
2.8
3.0
3.3
3.5
20 06 20 07 20 08 20 09 20 10 20 11 20 12 20 13
Manufacturing Weekly Overtime(hours)
Source: Haver Analytics, Gluskin Sheff
CHART 29: EARLY SIGNS OF A WAGE RESPONSE?
United States: Average Weekly Earnings(year-over-year percent change)
1.0
1.5
2.0
2.5
3.0
3.5
4.0
4.5
5.0
'01 '02 '03 '04 '05 '06 '07 '08 '09 '10 '11 '12 '13
Source: Haver Analytics, Gluskin Sheff
7/27/2019 Special Report - From Inflation to Deflation and Back - August 14-2013
http://slidepdf.com/reader/full/special-report-from-inflation-to-deflation-and-back-august-14-2013 19/38
David A. Rosenberg August 14, 2013 Chief Economist & Strategist Special [email protected]
Page19 of 38
CHART 30: PRODUCTIVITY GROWTH HEADING LOWER
United States: Productivity Growth*(line: year-over-year percent change, left axis)(bars: quarter-over-quarter percent change at an annual rate, right axis)
-5.0
-2.5
0.0
2.5
5.0
7.5
10.
4
2
0
2
4
6
8
00 01 02 03 04 05 06 07 08 09 10 11 12 13
*Real output per hour of all persons in the nonfarm business sector
Source: Haver Analytics, Gluskin Sheff
CHART 31: UNIT LABOUR COSTS REACCELERATE
United States: Unit Labour Costs(year-over-year percent change)
-4
-3
-2
-1
0
1
2
3
4
01 02 03 04 05 06 07 08 09 10 11 12 13
Shaded regions represent periods of U.S. recession
Source: Haver Analytics, Gluskin Sheff

7/27/2019 Special Report - From Inflation to Deflation and Back - August 14-2013
http://slidepdf.com/reader/full/special-report-from-inflation-to-deflation-and-back-august-14-2013 20/38
David A. Rosenberg August 14, 2013 Chief Economist & Strategist Special [email protected]
Page20 of 38
CHART 32: TIGHT HISTORICAL LINK BETWEEN UNIT LABOUR COSTS ANDINFLATION
United StatesOverall CPI (dark green line, left axis, year-over-year percent change)Unit Labour Costs (light green line, right axis, year-over-year percent change)
-4
0
4
8
12
16
-4
0
4
8
2
6
60 64 68 72 76 80 84 88 92 96 00 04 08 12
correlation = 0.87
Source: Haver Analytics, Gluskin Sheff
CHART 33: DEFLATION — YESTERDAY’S STORY
United States: NFIB: Firms Planning to Raise Average Selling Prices(percent of respondents)
0
10
20
30
40
'00 '01 '02 '03 '04 '05 '06 '07 '08 '09 '10 '11 '12 '13
Shaded regions represent periods of U.S. recessionSource: Haver Analytics, Gluskin Sheff

7/27/2019 Special Report - From Inflation to Deflation and Back - August 14-2013
http://slidepdf.com/reader/full/special-report-from-inflation-to-deflation-and-back-august-14-2013 21/38
David A. Rosenberg August 14, 2013 Chief Economist & Strategist Special [email protected]
Page21 of 38
CHART 34: BOB FARRELL’S 10 MARKET RULES TO REMEMBER
1 Markets tend to return to the mean over time
2 Excesses in one direction will lead to an opposite excess in the other direction
3 There are no new eras – excesses are never permanent
4 Exponential rapidly rising or falling markets usually go further than you think, butthey do not correct by going sideways
5 The public buys the most at the top and the least at the bottom
6 Fear and greed are stronger than long-term resolve
7Markets are strongest when they are broad and weakest when they narrow to ahandful of blue chip names
8 Bear markets have three stages – i) sharp down, ii) reflexive rebound, andiii) a drawn-out fundamental downtrend
9 When all the experts and forecasts agree, something else is going to happen
10 Bull markets are more fun than bear markets
CHART 35: LABOUR PAINS COME TO AN END?
United States: Labour Share of National Income(percent)
60.0
62.0
64.0
66.0
68.0
70.0
'50 '55 '60 '65 '70 '75 '80 '85 '90 '95 '00 '05 '10
Long run average
Trough?
Shaded regions represent periods of U.S. recession
Source: Haver Analytics, Gluskin Sheff
7/27/2019 Special Report - From Inflation to Deflation and Back - August 14-2013
http://slidepdf.com/reader/full/special-report-from-inflation-to-deflation-and-back-august-14-2013 22/38
David A. Rosenberg August 14, 2013 Chief Economist & Strategist Special [email protected]
Page22 of 38
CHART 36: A TRANSFER OF INCOME TO THE PERSONAL SECTOR MAY BEA GOOD THING
United States(percent)
0
2
4
6
8
10
12
82 87 92 97 02 07 1215
20
25
30
35
40
45
85 90 95 00 05 10
Personal Savings Rate Corporate Savings Rate*
* Non-financial net savings divided by total internal funds plus inventory valuation adjustment
Source: Haver Analytics, Gluskin Sheff
CHART 37: FROM DELEVERAGING TO RELEVERAGING?
United States: Household Debt
-5
0
5
10
15
20
'80 '84 '88 '92 '96 '00 '04 '08 '12-800
-400
0
400
800
1,200
1,600
'80 '84 '88 '92 '96 '00 '04 '08 '12
HH Borrowing from Credit Market Total HH Debt($ billions, annual rate) (year-over-year percent change)
Shaded regions represent periods of U.S. recessionSource: Haver Analytics, Gluskin Sheff

7/27/2019 Special Report - From Inflation to Deflation and Back - August 14-2013
http://slidepdf.com/reader/full/special-report-from-inflation-to-deflation-and-back-august-14-2013 23/38
David A. Rosenberg August 14, 2013 Chief Economist & Strategist Special [email protected]
Page23 of 38
CHART 38
“One purpose of this support is to prompt a return to the productive risk-taking that is essential to robust growth and to getting the unemployed back to work.” -- Long-Term Interest Rates, 2013, Ben Bernanke
CHART 39: BERNANKE DUSTS OFF THE “PHILLIPS CURVE”
FOMCmeeting – June 22, 2011
The Committee continues to anticipate that economic conditions--including low rates of resource utilization and a subdued outlook for inflation over the medium run -- are likely to warrant exceptionally low levels for the federal funds rate for an extended period.
FOMCmeeting – August 9, 2011
The Committee currently anticipates that economic conditions--including low rates of resource utilization and a subdued outlook for inflationover the medium run -- are likely to warrant exceptionally low levels for the federal funds rate at least through mid-2013.
FOMCmeeting – January 25, 2012
In particular, the Committee decided today to keep the target range for the federal funds rate at 0 to 1/4 percent and currently anticipatesthat economic conditions -- including low rates of resource utilization and a subdued outlook for inflation over the medium run--are likely towarrant exceptionally low levels for the federal funds rate at l east through late 2014.
FOMC meeting – September 13, 2012
In particular, the Committee also decided today to keep the target range for the federal funds rate at 0 to 1/4 percent and currently anticipates that exceptionally low levels for the federal funds rate are likely to be warranted at least through mid-2015.
FOMC meeting – December 12, 2012In particular, the Committee decided to keep the target range for the federal funds rate at 0 to 1/4 percent and currently anticipates that this exceptionally low range for the federal funds rate will be appropriate at least as long as the unemployment rate remains above 6-1/2 percent, inflation between one and two years ahead is projected to be no more than a half percentage point above the Committee’s2 percent longer-run goal , and longer-term inflation expectations continue to be well anchored.
7/27/2019 Special Report - From Inflation to Deflation and Back - August 14-2013
http://slidepdf.com/reader/full/special-report-from-inflation-to-deflation-and-back-august-14-2013 24/38
David A. Rosenberg August 14, 2013 Chief Economist & Strategist Special [email protected]
Page24 of 38
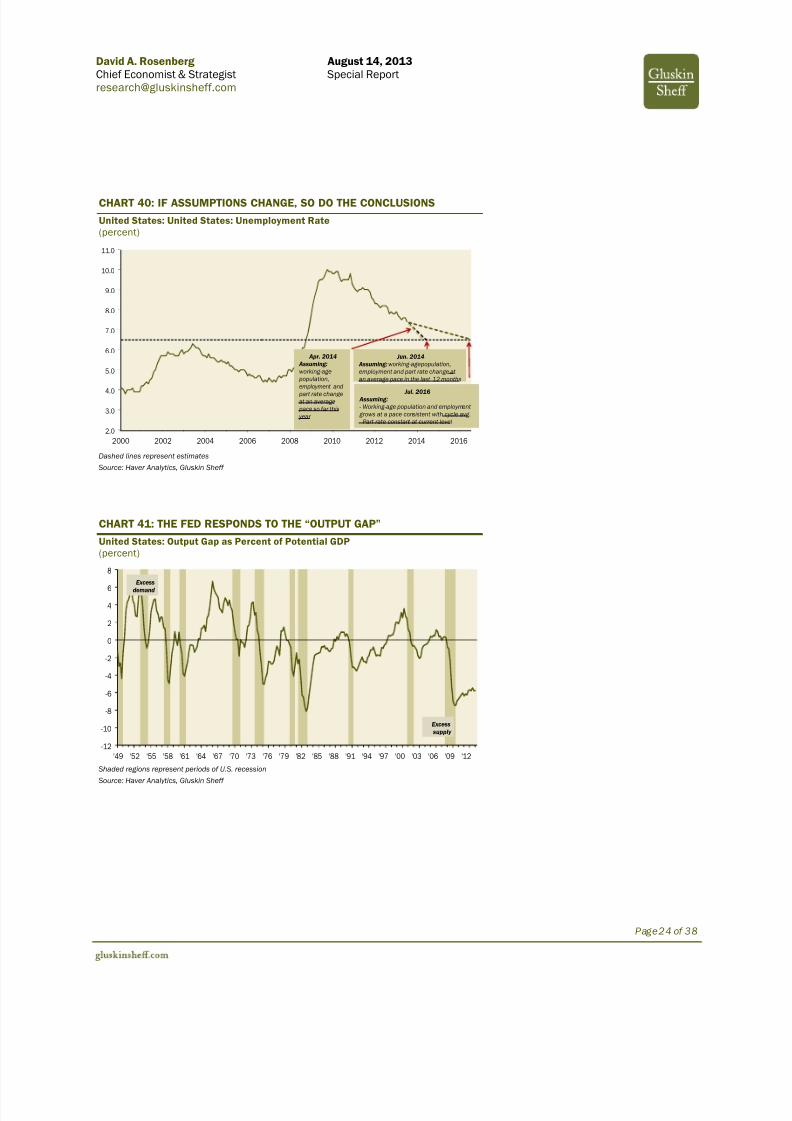
CHART 40: IF ASSUMPTIONS CHANGE, SO DO THE CONCLUSIONS
United States: United States: Unemployment Rate(percent)
2.0
3.0
4.0
5.0
6.0
7.0
8.0
9.0
10.0
11.0
2000 2002 2004 2006 2008 2010 2012 2014 2016
Jul. 2016 Assuming:- Working-age population and employment
grows at a pace consistent with cycle avg.- Part rate constant at current level
Jun. 2014 Assuming: working-age population,employment and part rate change atan average pace in the last 12 months
Apr. 2014 Assuming:working-agepopulation,employment andpart rate changeat an averagepace so far this
year
Dashed lines represent estimates
Source: Haver Analytics, Gluskin Sheff
CHART 41: THE FED RESPONDS TO THE “OUTPUT GAP”
United States: Output Gap as Percent of Potential GDP(percent)
-12
-10
-8
-6
-4
-2
0
2
4
6
8
'49 '52 '55 '58 '61 '64 '67 '70 '73 '76 '79 '82 '85 '88 '91 '94 '97 '00 '03 '06 '09 '12
Excessdemand
Excess supply
Shaded regions represent periods of U.S. recession
Source: Haver Analytics, Gluskin Sheff

7/27/2019 Special Report - From Inflation to Deflation and Back - August 14-2013
http://slidepdf.com/reader/full/special-report-from-inflation-to-deflation-and-back-august-14-2013 25/38
David A. Rosenberg August 14, 2013 Chief Economist & Strategist Special [email protected]
Page25 of 38
CHART 42: IS THE OUTPUT GAP REALLY 6%?
United States(percent)
-8
-6
-4
-2
0
2
4
Jan/80 Jan/85 Jan/90 Jan/95 Jan/00 Jan/05 Jan/10
-6%
0.0
0.5
1.0
1.5
2.0
2.5
3.0
3.5
'00 '01 ' 02 '03 '04 '05 '06 '07 '08 '09 '10 '11 '12 '13
1.7%
Output Gap Core CPI*
*CPI ex food and energy, YoY
Source: Haver Analytics, Gluskin Sheff
CHART 43: JAPAN HAS A 1% OUTPUT AND -0.3% CORE INFLATION
Japan(percent)
-2.0
-1.5
-1.0
-0.5
0.0
0.5
'00 '01 '02 '03 '04 '05 '06 '07 '08 '09 '10 '11 ' 12 '13
-0.3%
-6
-4
-2
0
2
4
6
Jan/90 Jan/95 Jan/00 Jan/05 Jan/10
-1%
Output Gap Core CPI*
*CPI ex food and energy, YoY
Source: Haver Analytics, Gluskin Sheff
7/27/2019 Special Report - From Inflation to Deflation and Back - August 14-2013
http://slidepdf.com/reader/full/special-report-from-inflation-to-deflation-and-back-august-14-2013 26/38
David A. Rosenberg August 14, 2013 Chief Economist & Strategist Special [email protected]
Page26 of 38
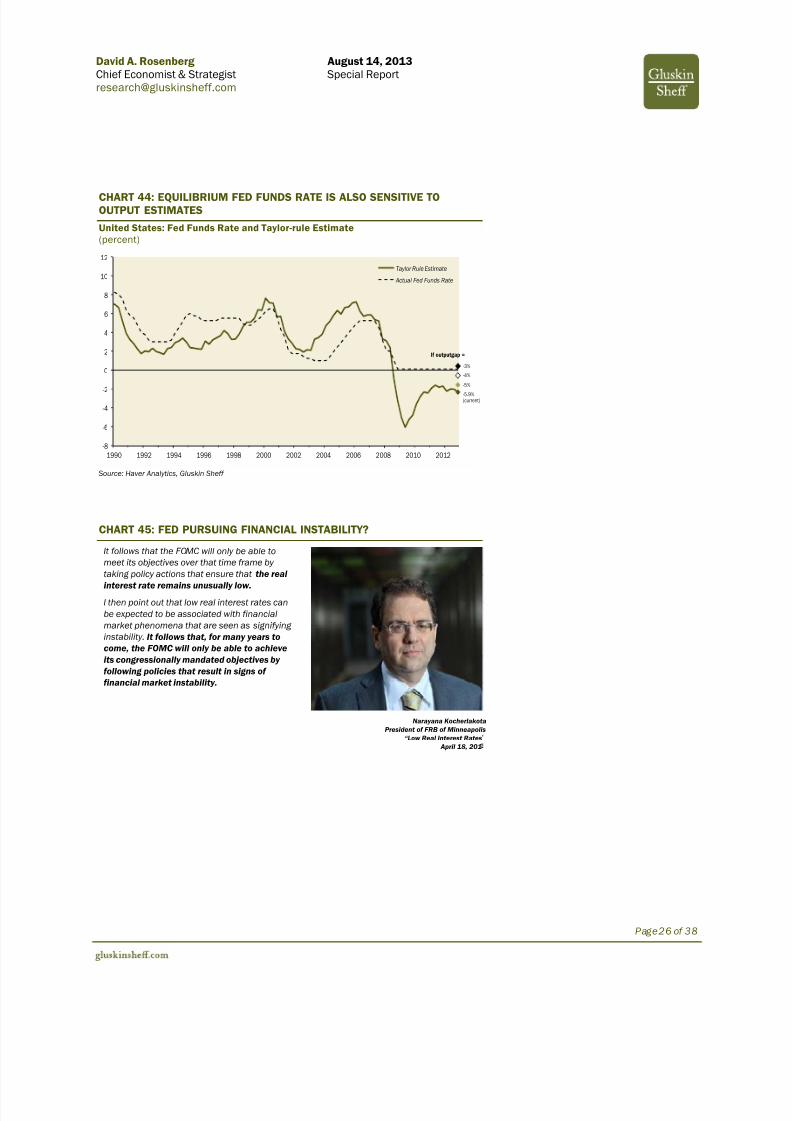
CHART 44: EQUILIBRIUM FED FUNDS RATE IS ALSO SENSITIVE TOOUTPUT ESTIMATES
United States: Fed Funds Rate and Taylor-rule Estimate(percent)
-8
-6
-4
-2
0
2
4
6
8
10
12
1990 1992 1994 1996 1998 2000 2002 2004 2006 2008 2010 2012
Taylor Rule Estimate
Actual Fed Funds Rate
-5.9%(current)
-5%
-4%
-3%
If outputgap =
Source: Haver Analytics, Gluskin Sheff
CHART 45: FED PURSUING FINANCIAL INSTABILITY?
It follows that the FOMC will only be able tomeet its objectives over that time frame by taking policy actions that ensure that the real
interest rate remains unusually low.I then point out that low real interest rates canbe expected to be associated with financialmarket phenomena that are seen as signifying instability. It follows that, for many years tocome, the FOMC will only be able to achieveits congressionally mandated objectives by following policies that result in signs of financial market instability.
Narayana KocherlakotaPresident of FRB of Minneapolis
“Low Real Interest Rates April 18, 201

7/27/2019 Special Report - From Inflation to Deflation and Back - August 14-2013
http://slidepdf.com/reader/full/special-report-from-inflation-to-deflation-and-back-august-14-2013 27/38
David A. Rosenberg August 14, 2013 Chief Economist & Strategist Special [email protected]
Page27 of 38
CHART 46: BURNS RETURNS!
United States: Real Fed Funds Rate*(percent)
-6
-4
-2
0
2
4
6
8
10
12
1971 1976 1981 1986 1991 1996 2001 2006 2011
Arthur Burns Paul Volcker Alan Greenspan Ben Bernanke
Source: Haver Analytics, Gluskin Sheff
CHART 47: THE FED’S EXPERIMENTS IN PROVIDING NEGATIVE REALRATES …
United States: Three-month Treasury Yield minus CPI YoY (percent)
-5.0
-4.0
-3.0
-2.0
-1.0
0.0
1.0
2.0
3.0
Feb/09 Jan/10 Dec/10 Nov/11 Oct/12-2.5
-2.0
-1.5
-1.0
-0.5
0.0
0.5
1.0
Jan/02 Jul/02 Jan/03 Jul/03 Jan/041.0
0.5
0.0
0.5
1.0
1.5
2.0
2.5
3.0
3.5
Apr/90 Dec/90 Aug/91 Apr/92 Dec/92-1.0
-0.5
0.0
0.5
1.0
1.5
2.0
2.5
3.0
3.5
4.0
Feb/98 Oct/98 Jun/99 Feb/00 Oct/00
1990-92 1998-2000 2002-04 2009-now
Source: Haver Analytics, Gluskin Sheff
7/27/2019 Special Report - From Inflation to Deflation and Back - August 14-2013
http://slidepdf.com/reader/full/special-report-from-inflation-to-deflation-and-back-august-14-2013 28/38
David A. Rosenberg August 14, 2013 Chief Economist & Strategist Special [email protected]
Page28 of 38
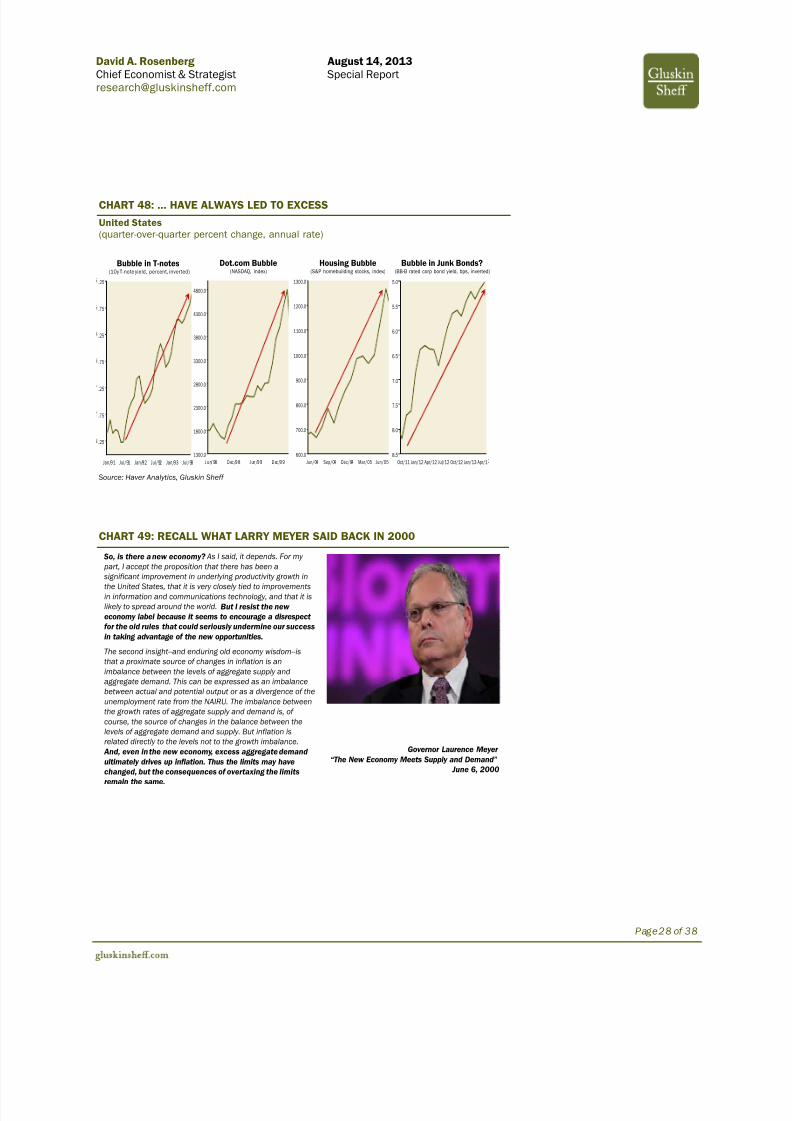
CHART 48: … HAVE ALWAYS LED TO EXCESS
United States(quarter-over-quarter percent change, annual rate)
5.0
5.5
6.0
6.5
7.0
7.5
8.0
8.5Oct/11 Jan/12 Apr/12 Jul/12 Oct/12 Jan/13 Apr/1
1300.0
1800.0
2300.0
2800.0
3300.0
3800.0
4300.0
4800.0
Jun/98 Dec/98 Jun /99 Dec/99600.0
700.0
800.0
900.0
1000.0
1100.0
1200.0
1300.0
Jun/04 Sep/04 Dec/04 Mar/05 Jun/05
.25
.75
.25
.75
.25
.75
.25
Jan/91 Jul/91 Jan/92 Jul/92 Jan/93 Jul/93
Bubble in T-notes(10y T-note yield, percent, inverted)
Dot.com Bubble(NASDAQ, index)
Housing Bubble(S&P homebuilding stocks, index)
Bubble in Junk Bonds?(BB-B rated corp bond yield, bps, inverted)
Source: Haver Analytics, Gluskin Sheff
CHART 49: RECALL WHAT LARRY MEYER SAID BACK IN 2000
So, is there a new economy? As I said, it depends. For my part, I accept the proposition that there has been a
significant improvement in underlying productivity growth in
the United States, that it is very closely tied to improvementsin information and communications technology, and that it islikely to spread around the world. But I resist the new economy label because it seems to encourage a disrespect for the old rules that could seriously undermine our successin taking advantage of the new opportunities.
The second insight--and enduring old economy wisdom--isthat a proximate source of changes in inflation is animbalance between the levels of aggregate supply andaggregate demand. This can be expressed as an imbalancebetween actual and potential output or as a divergence of theunemployment rate from the NAIRU. The imbalance betweenthe growth rates of aggregate supply and demand is, of course, the source of changes in the balance between thelevels of aggregate demand and supply. But inflation isrelated directly to the levels not to the growth imbalance.
And, even in the new economy, excess aggregate demand ultimately drives up inflation. Thus the limits may havechanged, but the consequences of overtaxing the limits
remain the same.
Governor Laurence Meyer “The New Economy Meets Supply and Demand”
June 6, 2000

7/27/2019 Special Report - From Inflation to Deflation and Back - August 14-2013
http://slidepdf.com/reader/full/special-report-from-inflation-to-deflation-and-back-august-14-2013 29/38
David A. Rosenberg August 14, 2013 Chief Economist & Strategist Special [email protected]
Page29 of 38
CHART 50: REMEMBER MISHKIN IN AUGUST 2007!
So far, I have discussed monetary transmission mechanisms working through the housing sector whenthe financial system is operating normally. However, exceptionally unfavorable conditions in thehousing sector have the potential to create instability in the financial system—instability that could magnify problems for the overall economy. Two questions thus arise: Through what channels might thehousing sector at times be a source of financial instability? And could such instability affect theoperation of the transmission mechanism, affecting the ability of a central bank to stabilize the overallmacroeconomy?
A breakdown in financial stability occurs when shocks to the financial system cause disruptions to thecredit intermediaries that are so severe that the system can no longer channel funds fluidly tocreditworthy households and businesses with productive investment opportunities. Without access tofinancing, individuals and firms must cut their spending, which will have consequences for overalleconomic activity.
The typical channel has been that sharp asset-price declines have seriously deteriorated the balance sheets of key financial institutions, inhibiting them from using their advantage of information capital tomake loans to firms and individuals. … it bears asking whether the sharp slowing in U.S. home priceappreciation, and in some areas of the country a turn to outright declines, has created a substantial risk of financial instability with adverse implications for macroeconomic performance.
Because prices of homes, like other asset prices, are inherently forward looking, it is quite difficult toconclude firmly whether they are above their fundamental values, and researchers have come toconflicting conclusions. Nevertheless, an explosive rise in asset prices always generates concern that a bubble may be developing and that its bursting might lead to broad and deep economic distress.
Fed Governor Frederic S. Mishkin August 3, 2007
CHART 51: CREDIT BUBBLE? IF IT QUACKS LIKE A DUCK …
“The third factor that can lead to overheating is a change inthe economic environment that alters t he risk-taking incentives of agents making credit decisions. For example, a
prolonged period of low interest rates, of the sort we areexperiencing today, can create incentives for agents to takeon greater duration or credit risks, or to employ additional financial leverage, in an effort to “reach for yield” …
Putting it all together, my reading of the evidence is that weare seeing a fairly significant pattern of reaching-for-yield behavior emerging in corporate credit.
The question of how policymakers should respond to differentmanifestations of credit market overheating is a big anddifficult one, and I won’t attempt to deliver a set of specificprescriptions here.
To lend a little concreteness and urgency to this issue,imagine that it is 18 months from now, and that with interestrates still very low, each of the trends that I identified earlier has continued to build — to the point where we believe thatthere could be meaningful systemic implications. What, if any,policy measures should be contemplated?”
.
Fed Governor Jeremy Stein“Overheating in Credit Markets: Origins,
Measurement, and Policy Responses” February 7, 2013
7/27/2019 Special Report - From Inflation to Deflation and Back - August 14-2013
http://slidepdf.com/reader/full/special-report-from-inflation-to-deflation-and-back-august-14-2013 30/38
David A. Rosenberg August 14, 2013 Chief Economist & Strategist Special [email protected]
Page30 of 38
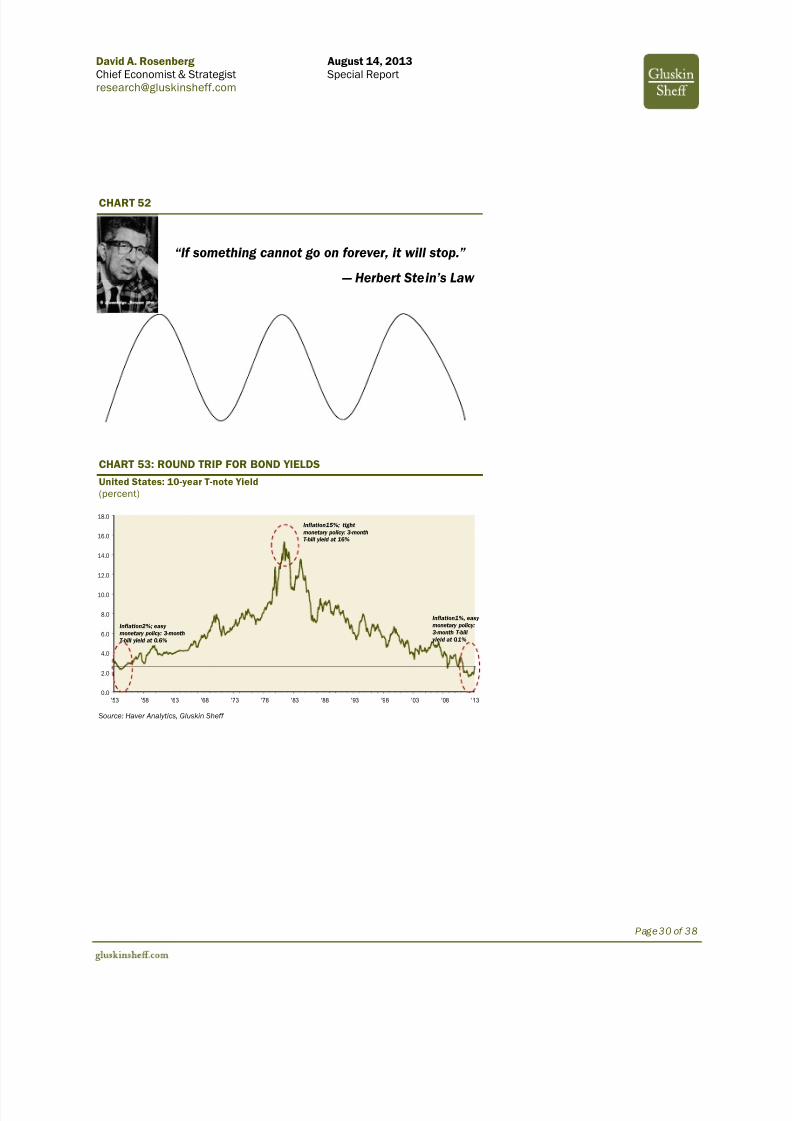
CHART 52
“If something cannot go on forever, it will stop.”
— Herbert Stein’s Law
CHART 53: ROUND TRIP FOR BOND YIELDS
United States: 10-year T-note Yield(percent)
0.0
2.0
4.0
6.0
8.0
10.0
12.0
14.0
16.0
18.0
'53 '58 '63 '68 '73 '78 '83 '88 '93 '98 '03 '08 '13
Inflation2%; easy monetary policy: 3-monthT-bill yield at 0.6%
Inflation15%; tight monetary policy: 3-monthT-bill yield at 16%
Inflation1%, easy monetary policy:3-month T-bill
yield at 0.1%
Source: Haver Analytics, Gluskin Sheff

7/27/2019 Special Report - From Inflation to Deflation and Back - August 14-2013
http://slidepdf.com/reader/full/special-report-from-inflation-to-deflation-and-back-august-14-2013 31/38

7/27/2019 Special Report - From Inflation to Deflation and Back - August 14-2013
http://slidepdf.com/reader/full/special-report-from-inflation-to-deflation-and-back-august-14-2013 32/38
David A. Rosenberg August 14, 2013 Chief Economist & Strategist Special [email protected]
Page32 of 38
CHART 56: DIVIDENDS — GROWTH TRUMPS YIELD
United States
-30.0
-20.0
-10.0
0.0
10.0
20.0
30.0
1995 2000 2005 201020%
30%
40%
50%
60%
70%
1950 1960 1970 1980 1990 2000 2010
Historicalaverage
Recordlows!
S&P 500 Dividend per Share(year-over-year percent change)
Dividend Payout Ratio(percent)
Source: Bank of America Merrill Lynch, Haver Analytics, Gluskin Sheff
CHART 57: JUNK BONDS AT 5% YIELD?
United States: Corporate Bond Spread
4.5
7.0
9.5
12.0
14.5
17.0
19.5
'96'97'98'99'00'01'02'03'04'05'06'07'08'09'10'11'120
200
400
600
800
1,000
1,200
1,400
1,600
1,800
2,000
'96'97'98'99'00'01'02'03'04'05'06'07'08'09'10'11'12
BB-B Rated Corporate Bond Yield(percent)
BB-B Rated Spread off Treasury Master(basis points)
Shaded regions represent periods of U.S. recession
Source: Haver Analytics, Gluskin Sheff
7/27/2019 Special Report - From Inflation to Deflation and Back - August 14-2013
http://slidepdf.com/reader/full/special-report-from-inflation-to-deflation-and-back-august-14-2013 33/38
David A. Rosenberg August 14, 2013 Chief Economist & Strategist Special [email protected]
Page33 of 38
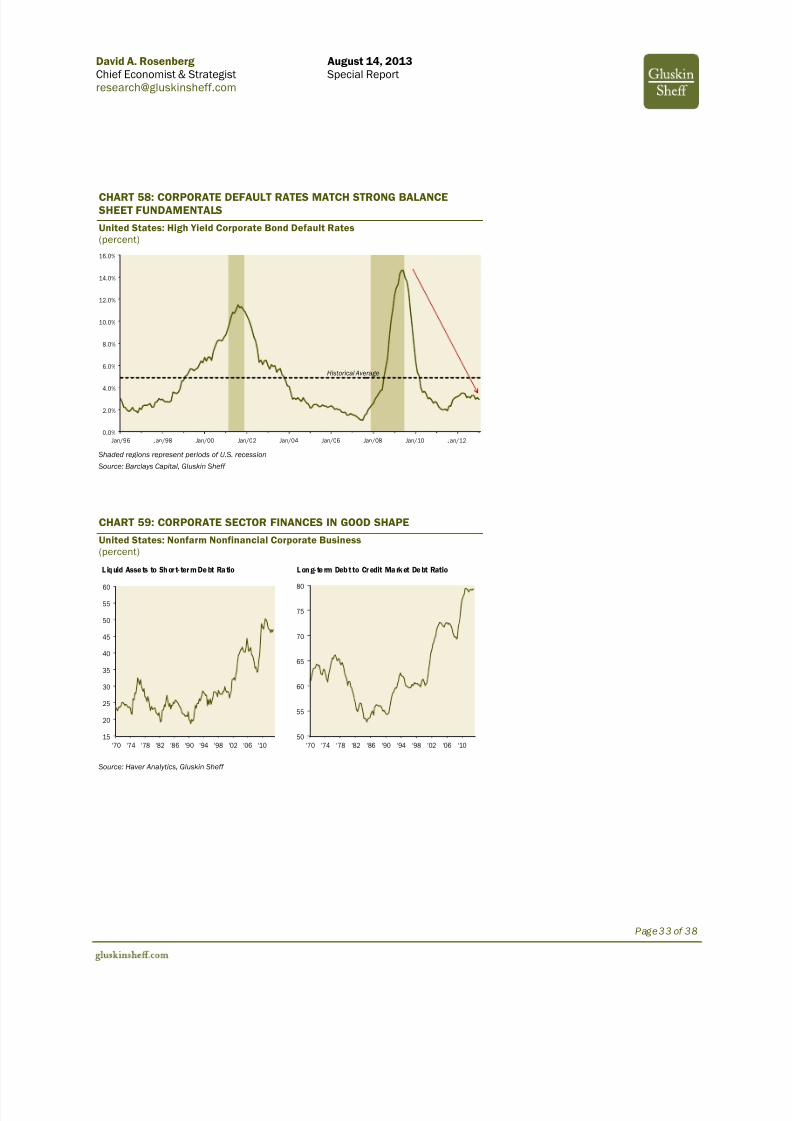
CHART 58: CORPORATE DEFAULT RATES MATCH STRONG BALANCESHEET FUNDAMENTALS
United States: High Yield Corporate Bond Default Rates(percent)
0.0%
2.0%
4.0%
6.0%
8.0%
10.0%
12.0%
14.0%
16.0%
Jan/96 Jan/98 Jan/00 Jan/02 Jan/04 Jan/06 Jan/08 Jan/10 Jan/12
Historical Average
Shaded regions represent periods of U.S. recession
Source: Barclays Capital, Gluskin Sheff
CHART 59: CORPORATE SECTOR FINANCES IN GOOD SHAPE
United States: Nonfarm Nonfinancial Corporate Business(percent)
50
55
60
65
70
75
80
'70 '74 '78 '82 '86 '90 '94 '98 '02 '06 '1015
20
25
30
35
40
45
50
55
60
'70 '74 '78 '82 '86 '90 '94 '98 '02 '06 '10
L iq uid Asse ts to Sh or t- ter m De bt Ra tio L on g- te rm Deb t to Cr edit Ma rk et De bt Ratio
Source: Haver Analytics, Gluskin Sheff

7/27/2019 Special Report - From Inflation to Deflation and Back - August 14-2013
http://slidepdf.com/reader/full/special-report-from-inflation-to-deflation-and-back-august-14-2013 34/38
David A. Rosenberg August 14, 2013 Chief Economist & Strategist Special [email protected]
Page34 of 38
CHART 60: NEXT STRATEGY SHIFT: FROM S.I.R.P. TO H.I.R.P. — HEDGEDINFLATION RISK PROTECTION
• Real estate
• TIPS
• Art/collectibles
• Gold/silver
• Bank s
• Consumer staples
• Energy
• Metals
• Agriculture
• Credit arbitrage
• Long-short strategies
• Volatility
• Loonie, Aussie, Kiwi
Source: Gluskin Sheff
CHART 61: EQUITY SECTOR SELECTION IN A COST-PUSH STAGFLATIONENVIRONMENT
• Consumer staples
• Consumer Discretionary
• Utilities
• Telecom• Commercial banks
• Cable/Media
• Oil & Gas — Exploration & Production /Refining/Energy Equipment & Services
• Industrial Conglomerates / Electrical Power
• Road & Railroads
• Machinery
• Airlines
• Basic materials
• Precious metals
• Specialty chemicals
• Paper packaging
Source: Gluskin Sheff

7/27/2019 Special Report - From Inflation to Deflation and Back - August 14-2013
http://slidepdf.com/reader/full/special-report-from-inflation-to-deflation-and-back-august-14-2013 35/38
David A. Rosenberg August 14, 2013 Chief Economist & Strategist Special [email protected]
Page35 of 38
OVERVIEW OF THEMES AND STRATEGIES
THEME STRATEGY/IDEA SECTOR/ASSET CLASS
Redeployment ofCapital
Companies which have deployed or have capacity (and a trackrecord) to deploy excess capital to generate risk-adjusted returnswhich exceeds their cost of capital.
Special situations
Income Orientation Focus on reliable dividend growth and dividend yield;Being and staying ahead of the robust demographic (baby-boomers aging) shift towards income oriented investments.Safety and Income at a Reasonable Price (S.I.R.P.).
Income-oriented stocks with the ability tosustain and grow dividends
Financials A focus on companies whose business model would benefit from
a rising interest rate environment over the longer term;A steeper yield curve would also benefit banks as well;Focus on those that are at or near Basel III compliance, tradebelow book and will see NIM expansion from rising rates.
Insurance companies
Banks
Canadian credit Although Verizon is certainly a threat to the incumbent firms inCanada, we think this is a bigger equity/earnings risk and still feelcomfortable with these companies from a credit perspective;Even when the credit markets were strong and spreads weremoving materially tighter, deposit notes have been the majorlaggard in Canadian credit so far in 2013.
Credit of Canadian telecom companies
Canadian bank deposit notes
Energy Infrastructure There are mega-billions of dollars worth of projects awaiting approval in North America for the distribution of natural gas bothfor domestic consumption and export. The multi-year trendtoward increasing gas consumption will benefit companies that
have expertise in building natural gas infrastructure andliquefaction/gas-to-liquid technology.
Engineering & Construction companiesspecialized in natural gas infrastructure
Auto Recovery The profitability leverage for the likes of Ford and GM isconsiderable when the global automotive industry begins toimprove.
U.S. auto manufacturers
Auto parts suppliers
European DomesticDemand Plays
The region is swinging back to positive growth for the first time intwo years; We favour western European Telecom names on the back of “lessbad” results. Expectations remain extremely low for this group.
European Financials, Industrials,Healthcare, Consumer Discretionary
Western European Telecom Companies
Mobility/Connectivity andIT Infrastructure
Focus on those firms that benefit from the secular trendsurrounding the portability of data and increased consumerusage of smartphones/tablets;
Identify and invest in firms that benefit from cloud-basedstrategies that allow customers to be more efficient and realizecost savings.
Technology firms
Cellular carriers/Tower companies
Non-Cyclical Focus on special situations that are not correlated with theeconomic cycle.
Defense-aerospace
Healthcare
Dollar/Discount stores

7/27/2019 Special Report - From Inflation to Deflation and Back - August 14-2013
http://slidepdf.com/reader/full/special-report-from-inflation-to-deflation-and-back-august-14-2013 36/38

7/27/2019 Special Report - From Inflation to Deflation and Back - August 14-2013
http://slidepdf.com/reader/full/special-report-from-inflation-to-deflation-and-back-august-14-2013 37/38
Page37 of 38
Gluskin Sheff at a Glance0Gluskin Sheff + Associates Inc. is one of Canada’s pre-eminent wealth management firms.Founded in 1984and focused on high net worth private clients and institutional investors, we arededicated to meeting the needs of our clients by delivering strong, risk-adjusted returns together with the highest level of personalized client service. OVERVIEW As of June 30, 2013, the Firm managedassets of $6.2billion. The minimuminvestment required to establish a clientrelationship with the Firm is $3million.
Gluskin Sheff is a publicly tradedcorporation on the Toronto Stock Exchange (symbol: GS) and remains46% owned by its senior managementand employees. We have public company accountability and governance with aprivate company commitment toinnovation and service.
LEADINGOur team is an exemplary group of investment professionals deep in talent,ideas and experience with the industry’stop leaders in risk management and clientservice – all with the objective of providing strong risk-adjusted returnsand the highest level of personalizedclient service.
INNOVATIVE Throughout our history we have beenStubbornly unconventional TM,consistently pursuing innovativeapproaches to wealth management forour clients. Today, we offer a diverseplatform of investment strategies,including Canadian, U.S. andinternational equity strategies, alternativestrategies and fixed income strategies.
PERSONALFor Gluskin Sheff, delivering outstandingclient service is as fundamental asdelivering strong investment results. Ourclients are unique, and so are their needs.
This is why we offer customizedinvestment plans to suit each client’s
specific objectives and risk profile.Our success in developing lasting clientrelationships is founded on shared values,a thorough understanding of our clients’goals and a keen desire to earn their trustand confidence.
ALIGNEDOur investment interests are directly aligned with those of our clients, asGluskin Sheff’s management andemployees are collectively the largestclient of the Firm’s investment portfolios.Our clients are our partners, throughperformance-based fees that are earnedonly when pre-specified performancebenchmarks for clients’ investments areexceeded.
PROVEN 1 $1million invested in our flagship GS+APremium Income Portfolio in 2001 (itsinception date) would have grown toapproximately $4.5million2 on June 30,2013versus$2.1million for the S&P/TSX
Total Return Index 3 over the same period.
Similarly, many of our other long-
standing investment strategies haveoutperformed their relevant benchmarks.
Our investment interests are directly aligned with those of our clients, as GluskinShe ff ’s management and
employees are collectively the largest client of the Firm’s investment portfolios.
$1 million invested in our
flagship GS+A PremiumIncome Portfolio in 2001
(its inception date) wouldhave grown toapproximately $4.5
million 2 on June 30, 2013
versus $2.1 million for theS&P/TSX Total ReturnIndex 3 over the same
period.
For further information, please contact research@gluskinshe ff .com
Notes:
1. Past returns are not necessarily in dicative of future performance. Rates of return are those of the composite of segregated Premium Income portfolios and are presented net of
fees and expenses and assume reinvestment of all income. Portfolios with significant client restrictions which would potentially achieve returns that are not reflective of the
manager’s portfolio returns are excluded from the composite. Returns of the pooled fund versions of the GS+A Premium Income portfolio are not included in the composite.
2. Investment amounts are presented to reflect the actual return of the composite of segregated Premium Income portfolios and are presented net of fees and expenses.
3. The S&P/TSX Total Return Index calculation is based on the securities included in the S&P/TSX Composite and includes dividends and rights distributions. This index includes
only Canadian securities.

7/27/2019 Special Report - From Inflation to Deflation and Back - August 14-2013
http://slidepdf.com/reader/full/special-report-from-inflation-to-deflation-and-back-august-14-2013 38/38
IMPORTANT DISCLOSURES
Copyright 2013 Gluskin Sheff + Associates Inc. (“Gluskin Sheff”). All rights
reserved .This report may provide information, commentary and discussion of issuesrelating to the state of the economy and the capital markets. All opinions,projections and estimates constitute the judgment of the author as of thedate of the report and are subject to change without notice. Gluskin Sheff isunder no obligation to update this report and readers should thereforeassume that Gluskin Sheff will not update any fact, circumstance or opinioncontained in this report.
The content of this report is provided for discussion purposes only. Anyforward looking statements or forecasts included in the content are basedon assumptions derived from historical results and trends. Actual resultsmay vary from any such statements or forecasts. No reliance should beplaced on any such statements or forecasts when making any investmentdecision, and no investment decisions should be made based on thecontent of this report.
This report is not intended to provide personal investment advice and itdoes not take into account the specific investment objectives, financial
situation and particular needs of any specific person. Under nocircumstances does any information represent a recommendation to buy orsell securities or any other asset, or otherwise constitute investment advice.Investors should seek financial advice regarding the appropriateness of investing in specific securities or financial instruments and implementing investment strategies discussed or recommended in this report.
Gluskin Sheff may own, buy, or sell, on behalf of its clients, securities of issuers that may be discussed in or impacted by this report. As a result,readers should be aware that Gluskin Sheff may have a conflict of interestthat could affect the objectivity of this report. Gluskin Sheff portfoliomanagers may hold different views from those expressed in this report andthey are not obligated to follow the investments or strategies recommendedby this report.
This report should not be regarded by recipients as a substitute for theexercise of their own judgment and readers are encouraged to seekindependent, third-party research on any companies discussed or impactedby this report.
Securities and other financial instruments discussed in this report are notinsured and are not deposits or other obligations of any insured depositoryinstitution. Investments in general and, derivatives, in particular, involvenumerous risks, including, among others, market risk, counterparty defaultrisk and liquidity risk. No security, financial instrument or derivative issuitable for all investors. In some cases, securities and other financialinstruments may be difficult to value or sell and reliable information aboutthe value or risks related to the security or financial instrument may bedifficult to obtain. Investors should note that income from such securitiesand other financial instruments, if any, may fluctuate and that the price orvalue of such securities and instruments may rise or fall and, in some cases,investors may lose their entire principal investment. Past performance is notnecessarily a guide to future performance.
Foreign currency rates of exchange may adversely affect the value, price orincome of any security or financial instrument mentioned in this report.Investors in such securities and instruments effectively assume currencyrisk.
Any information relating to the tax status of financial instruments discussedherein is not intended to provide tax advice or to be used by anyone toprovide tax advice. Investors are urged to seek tax advice based on theirparticular circumstances from an independent tax professional.
Individuals identified as economists in this report do not function asresearch analysts. Under U.S. law, reports prepared by them are notresearch reports under applicable U.S. rules and regulations.
In accordance with rules established by the U.K. Financial Services Authority,
macroeconomic analysis is considered investment research.Materials prepared by Gluskin Sheff research personnel are based on publicinformation. Facts and views presented in this material have not beenreviewed by, and may not reflect information known to, professionals inother business areas of Gluskin Sheff.
To the extent this report discusses any legal proceeding or issues, it has notbeen prepared as nor is it intended to express any legal conclusion, opinionor advice. Investors should consult their own legal advisers as to issues of law relating to the subject matter of this report. Gluskin Sheff researchpersonnel’s knowledge of legal proceedings in which any Gluskin Sheff entity and/or its directors, officers and employees may be plaintiffs,defendants, co—defendants or co—plaintiffs with or involving companiesmentioned in this report is based on public information. Facts and viewspresented in this material that relate to any such proceedings have notbeen reviewed by, discussed with, and may not reflect information known to,professionals in other business areas of Gluskin Sheff in connection withthe legal proceedings or matters relevant to such proceedings.
The information herein (other than disclosure information relating to GluskinSheff and its affiliates) was obtained from various sources and GluskinSheff does not guarantee its accuracy. This report may contain links tothird—party websites. Gluskin Sheff is not responsible for the content of anythird—party website or any linked content contained in a third—party website.Content contained on such third—party websites is not part of this reportand is not incorporated by reference into this report. The inclusion of a linkin this report does not imply any endorsement by or any affiliation withGluskin Sheff.
Gluskin Sheff reports are distributed simultaneously to internal and clientwebsites and other portals by Gluskin Sheff and are not publicly availablematerials. Any unauthorized use or disclosure is prohibited.
TERMS AND CONDITIONS OF USE
Your receipt and use of this report is governed by the Terms and Conditionsof Use which may be viewed at www.gluskinsheff.com/terms.aspx
This report is prepared for the exclusive use of Gluskin Sheff clients,
subscribers to this report and other individuals who Gluskin Sheff hasdetermined should receive this report. This report may not be redistributed,retransmitted or disclosed, in whole or in part, or in any form or manner,without the express written consent of Gluskin Sheff.
YOU AGREE YOU ARE USING THIS REPORT AND THE GLUSKIN SHEFFSUBSCRIPTION SERVICES AT YOUR OWN RISK AND LIABILITY. NEITHERGLUSKIN SHEFF, NOR ANY DIRECTOR, OFFICER, EMPLOYEE OR AGENT OFGLUSKIN SHEFF, ACCEPTS ANY LIABILITY WHATSOEVER FOR ANY DIRECT,INDIRECT, CONSEQUENTIAL, MORAL, INCIDENTAL, COLLATERAL OR SPECIALDAMAGES OR LOSSES OF ANY KIND, INCLUDING, WITHOUT LIMITATION,THOSE DAMAGES ARISING FROM ANY DECISION MADE OR ACTION TAKENBY YOU IN RELIANCE ON THE CONTENT OF THIS REPORT, OR THOSEDAMAGES RESULTING FROM LOSS OF USE, DATA OR PROFITS, WHETHERFROM THE USE OF OR INABILITY TO USE ANY CONTENT OR SOFTWAREOBTAINED FROM THIRD PARTIES REQUIRED TO OBTAIN ACCESS TO THECONTENT, OR ANY OTHER CAUSE, EVEN IF GLUSKIN SHEFF IS ADVISED OFTHE POSSIBILITY OF SUCH DAMAGES OR LOSSES AND EVEN IF CAUSED BY ANY ACT, OMISSION OR NEGLIGENCE OF GLUSKIN SHEFF OR ITSDIRECTORS, OFFICERS, EMPLOYEES OR AGENTS AND EVEN IF ANY OFTHEM HAS BEEN APPRISED OF THE LIKELIHOOD OF SUCH DAMAGESOCCURRING.
If you have received this report in error, or no longer wish to receive thisreport, you may ask to have your contact information removed from ourdistribution list by emailing [email protected].