(special session of imid 01) - 임기조 교수님 홈페이지 입니다. consumed in screen update...
TRANSCRIPT

FPD Roadmap & Market
(Special Session of IMID’01)
Contributors
J.K.Kim (Samsung Electronic)
P. Semenza (SRI)
M.R. Pinnel, J.N. Norman(USDC)
B.H. Lee, K.M. Kim(Samsung SDI)
Y.O. Kim(LG. Philips)
W.K. Lee(Samsung Advanced Institute of Technology)
Coordinator & Summary
Jae Soo Yoo, Professor
ChungAng University (http://display.cau.ac.kr)
전자부품연구원 디스플레이 기술 세미나자료 : www.eic.re.kr

Electronic Information DisplaysElectronic Information DisplaysElectronic Information Displays
CRTCRT FPDFPD ProjectionProjection
Emissive DisplayEmissive Display Non Emissive DisplayNon Emissive Display CRTCRT Light ValveLight Valve
PDPPDP VFDVFD FEDFED ELDELD LEDLED
LCDLCD ECDECD
TNTN STNSTN TFTTFT MIMMIM FLCDFLCD

The Big Picture
$65
$107
$375
$407
$402
$1,258
$8,486
$5,757
$41,841
$41,275$29,857
$16,801
$111
$128
$514
$626
$29
$781
$5,456
$2
$0 $5,000 $10,000 $15,000 $20,000 $25,000 $30,000 $35,000 $40,000 $45,000
FED
EL
MEMS
LED
VFD
OLED
PDP
LCD (Passive)
LCD (Active)
CRT
2000 2006

Why do a Roadmap?• Generate competitor dialogue to validate perceptions
• Define common issues, gaps, limits
• Evaluate market expectations and demand schedule
• Set technology advancement schedule
• Set performance targets
• Identify and prioritize tradeoffs
• Establish critical mass to enlist supply chain companies
• Distinguish evolutionary development needs from revolutionary advancements
• Compare/contrast with competing technology options
• Identify beneficial standardization topics

Expectations of a Roadmap:What it is and what it is not!
• Roadmap predictions usually are not precise, but they can be reasonably accurate
• A common understanding of trends and targets generates confidence in assessment of competitive position and strategic plan
• Roadmaps don’t have answers, but they make certain the right questions are being asked and the right challenges are being posed
• Roadmaps address WHAT needs to be done and WHEN it needs to be done, not HOW it is accomplished
• Roadmap activities help, not harm, competitive positioning

Roadmap Goal: Predict the evolution of the dominant FPDtechnologies and identify the opportunitiesfor alternative technologies to provide improved performance
Dominant FPD LCD on glass substratesTechnologies: PDP
Projectors with LCD and DMD light valves
Time Scale: 2001 -> 2005 ->2010
Qualification: Data included is for best commercial products,not for laboratory prototypes

Two Routes to Profitability
Reduce Costs
Reduce Costs
Reduce Costs
Reduce Costs
Reduce Costs
Reduce Costs
Improve Performance
Information Content
Response Time
Picture Quality
Power Efficiency… … … . .… … … . .

Information Content
Main metric: Number of pixels
Important factors:Pixel density - pixels per inch or- pixel size (mm)Screen size- diagonal length in inches
Benefits to customer:
•more efficient office work•word processing•spreadsheets•multiple windows
•clearer pictures•digital photography•medical images•geographic information systems•design•electronic commerce
•less eyestrain

Information Content - Status
Current Best: 200 ppi
22” a-Si LCD panel for work-stations9.2M pixels (3840x2400)
6.4” LCD panels for handheld PC0.8M pixels (1028x768)
4” LCD panels for PDA and e-phone0.3M pixels (640x480)
PDP and Projection technologies are well behind in information content,despite the larger screen size.
Projection systems can be tiled seamlessly to overcome this shortcoming.

Information Content – Conflicts
•Efficiency•small pixels lead to smaller aperture ratios
•Video display••large pixel numbers require high data rates (16 large pixel numbers require high data rates (16 GbGb/s for 9Mpixels)/s for 9Mpixels)
•Limits of human vision•200-250 ppi for laptops and desktops•300 ppi for handheld displays •150 ppi for conference/classroom/public use
•Software – OS and applications•must compensate for smaller icons, fonts etc

Information Content – Future Goals
Work-stations 20M pixels 40M pixels30” screen at 200 ppi 40” screen at 200 ppi
Handhelds 3M pixels 3M pixels8” screen at 300 ppi 8” screen at 300 ppi
Wall Displays 50M pixels 250M pixels8’ x 4’ screen at 100 ppi 20’ x 6’ screen at 150 ppi
2005 2010

Information Content – Paths to Progress
LCD
Projection
Alternatives
2005 2010
poly-Si TFTsbetter conductors – Ag,Cu?seamless tilingselective refreshnew drive schemes
LCOS light valves
Continuous grain TFTs
Scanned laser projectors
Flexible substratesRoll-to-roll processingAM-OLED

Response Time - Status
LCD 15-20 ms Liquid Crystal responsevarying with level of adjustment required
PDP Phosphor response – 15 msDischarge response – few msTime-modulated gray scale – 8-12 sub-frames
Projection ferroelectric LCDs are fast DMD is even faster

Response Time – Future Goals
2005 2010
LCD 8 - 10 ms 4 – 5 ms
PDP 10 bit gray scale 12 bit
Projection 4 - 5 ms 2 - 3 ms

Response Time – Paths to Progress
LCD
PDP
Projection
Alternatives
2005 2010
Smaller cell gapsReduced viscosityFerroelectric, OCB, ECB modes?New drive schemes
Continuous grain TFTs
?
FEDOLED
?
? ?
OCB = Optically Compensated BendECB = Electrically controlled birefringent

Power Efficiency
Metrics:Lumens created per WattWatts consumed in screen update
Factors:Efficiency of light creationEfficiency of light transmission
(e. g. aperture ratio)Efficiency of electronics
Ambiguities:Measure peak or average luminance?Standard measure of switching power
Benefits to Customer:
•Battery life•portable PCs•phones/PDAs
•Power cost•office displays•home entertainment•air conditioning
•Environmental impact•fewer power stations•less CO2 emission

Power Efficiency - Status
Transmissive LCD 1-2 lm/W
Reflective LCD < < 1 mW/cm2 for static images< 1 mW/cm2 for video
PDP 1.5 lm/W
Projection 14 lm/W

Power Efficiency – Future Goals
Trans. LCD 5 lm/W 10 lm/W
Refl. LCD - static 1 µW/cm2 0.5 µW/cm2
- video 10 µW/cm2 5 µW/cm2
PDP 3 lm/W 5 lm/W
Projection 20 lm/W 25 lm/W
2005 2010

Power Efficiency – Paths to Progress
LCD
PDP
Projection
Alternative
2005 2010
Integrate CF with arrayPoly-Si TFTsEmbedded memory or bistable modesMulti-format drivers
Improved geometriesNew addressing schemes
Better sources Improved light collection
OLED
Frame sequential color(O)LED backlight
Better materials
Electrophoresis

Application Cell Phone Video phone Internet access
HDTV/ Publicity
Color Mono Color Color Color Drive mode Passive Passive Active Active
Diagonal size 1.5" 3" 6" 60" Pixel number 128x64 320x240 640x480 1280x720
Pixel size (µm) 300 63x190 63x190 350x1050 Number of Colors 1-16 262K 262K 16.8M
Brightness (candela/m2) 100 300 300 500 Lifetime (hours) 10,000 10,000 20,000 30,000
Dark room Contrast 100 200 200 400 Contrast ratio at 100,000 lux 5 10 10 5
Viewing Angles (degrees) 160 160 160 160 Response Time (µsec) 10 10 10 10
Voltage 6 9 6 9 Power (mW) 200 500 600 30,000
Thickness (mm) 2 2 5 10 Weight (gms) 10 20 50 5,000
Year (on glass) 2001 2002 2003 - Year (on plastic) 2003 2004 2005 2006
Reference Display Parameters

OverviewLiquid Crystal Displays (J.K.Kim, Y.O.Kim)Plasma Display Panels (B.H.Lee)Organic Light-Emitting Diode Displays (K.M.Kim)Microdisplays, FED, … (W.K.Lee)Conclusion
Outline

Historical and projected growth in the FPD market
Source: DisplaySearch

InformationNetwork
Service
* CD-ROM
* DVD
* Game
* E-Paper
* Web
* On-Line DB
* Internet
* Cable
* Wireless
* Satellite
* E-Banking* On-Line Shopping
* E-Trade
User PlatformHomeM/M
NPC
PDA
Mobile Phone
E-Book
MobileM/M
D-TVPCSTBWeb PADDVC/DSC
Electronic commercial transactions over the network

Ⅰ. Market Outlook Answer for “?”
•Low Cost
•Monitor Market in earnest
•New Application Market- LCD TV- Web Pad- Car Navigation- …
4 / 9

Ⅱ. TFT-LCD Trends Application trends
Analog Analog / Digital Digital
1990 2000
• CRT leads the Market• TFT-LCD
• CRT vs. TFT-LCD• TFT-LCD leads the Market• PDP, OLED
•Calculator
•STN-LCD Display
•TFT-LCD NBPCSize / Performance Performance / Cost
•TFT-LCD MonitorSize Performance
Cost is a basic issue
•LCD TV Cost / Performance
•Small Mobile Performance
5 / 9

Word processorsWatches
CalculatorsPachinkoNegative growth
Portable LCTVs
Notebook PCsHome appliance
Camcorders/monitorsData projectors
FA, MEPortable game equipment
Car clocks/metersPortable phones100-199%
Automotive monitors
Electronics notebooksCamcorder/finders
Portable DVD playersDesktop monitors
Stand-alone TVsDigital Still Cameras200-299%
PDAsPublic display monitors300-499%
Industrial MonitorsProjection TVs500% or higher
Product NameGrowth Rate
Projected growth rate over the period of 1999-2005
Source: Fuji Chimera

Ⅱ. TFT-LCD Trends Product Performance trends
NTPCNTPC
MonitorMonitor
(13.3(13.3””XGA)XGA)
20052005
Weight
Thickness
Power Con.
20012001
390(g)
5.5mm
4.6W/150nit
320(g)
3.5mm
2.xW/200nit
160。
UXGA
200nit(IPS)
170 。
QUXGA
300nit
• IMT-2000• PDA• Web Pad
MobileMobileApplicationApplication(3.8(3.8””QVGA)QVGA)
W.V.A
Resolution
Brightness
Power Con.
Response Time
Weight
Core Technology
40mW
30ms
60g
Touch, Reflective
<30mW
<10ms
<40g
Circuit Integration
19981998
535(g)
6.5mm
4.0W/100nit
90。
/ 120。
XGA
200nit(film)
-
-
-
-
TVTV
Response Time
Brightness
Panel size(max)
<20ms
400nit
29”
<10ms
>500nit
40”class
-
-
-
8 / 9

TechnologySize
inchesMaximumResolution
Brightnesscd/㎡
Colorbits
ContrastRatio
PowerW
TFT LCD 24-42" 1080 lines >300 8 300-500:1 40-150
Plasma <40" 720 lines >300 8 150-200:1 300
Plasma >40" 1080 lines >400 8 250-350:1 400
HTPS .9-1.3" 1080 lines >1000 8 100:1 50-100
* HTPS: High Temp. P-Si for ProjectorSource: Display Search ‘99. 5, LCD added
The Winner Display;
•Which can render natural color ?•Which can provide reasonable price ?
HDTV Display Competitors

•400 - 500 cd/m2 for day light viewing
•300:1 Minimum Contrast
•Color reproduction > 70% of NTSC
•Color temperature > 9000 ̊ K
For Bright and High Contrast D-TV
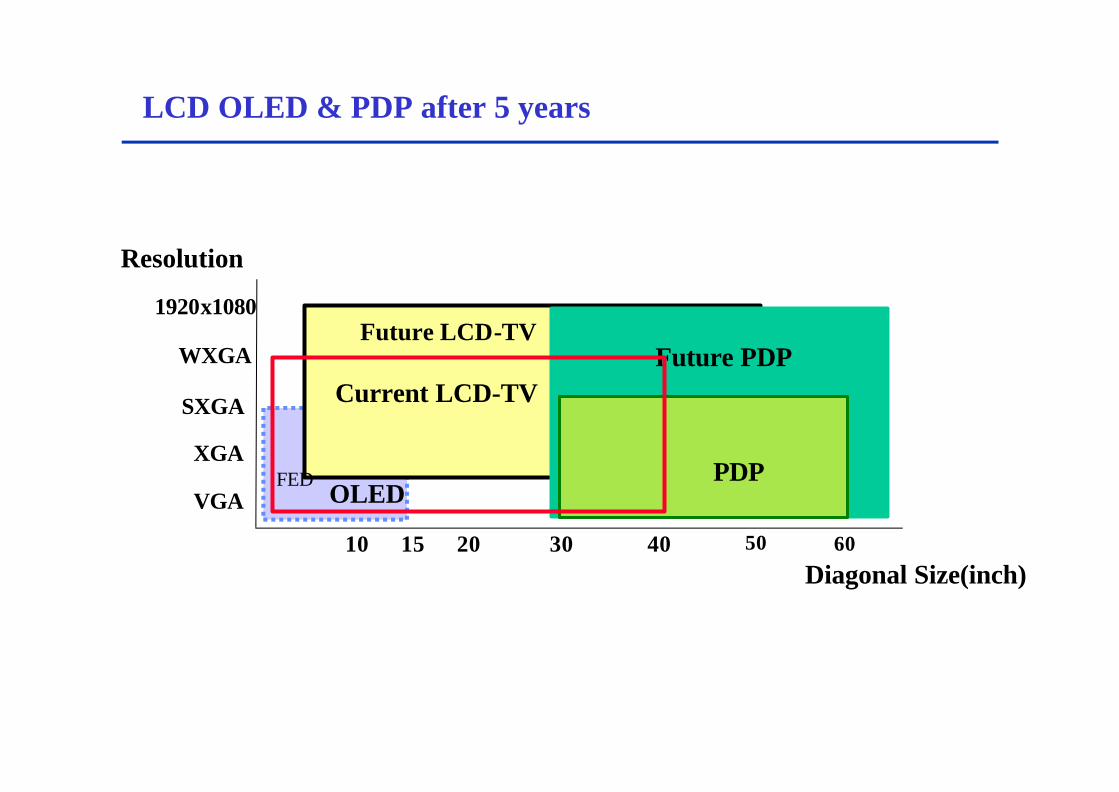
1920x1080
10 2015
Resolution
Diagonal Size(inch)
VGA
XGA
SXGA
WXGA
Current LCD-TV
FEDOLED
Future LCD-TV
LCD OLED & PDP after 5 years
Future PDP
30 40 50
PDP
60

-1% -1%
5%8% 8% 10% 11%
9%
8% 4%2%
-3%
-
5,000
10,000
15,000
20,000
25,000
Q1 '00 Q2 Q3 Q4 Q1 '01 Q2 Q3 Q4 Q1 '02 Q2 Q3 Q4
-30%
-25%
-20%
-15%
-10%-5%
0%
5%
10%
15%
Demand Supply Ratio
ü Continuous Glut till 2002 (over 10%) if every LCD maker invests as planed
ü Samsung’ forecast : Balance coming in Q3 ’02 by Capacity ramp-up delayMore investment will delay Balance over Q4 ’02
ü Uncertainty - Monitor demands increase (‘01 : 12M → 14~15M) - Demand of Small & Medium size (PDA,HHP,Game,AV etc)- TFT LCD line conversion to Small Size- Low Yield for High Resolution / Slim & Light Model
Demand & Supply

Lamp Reflector
LampPCB(Source)
Top Chassis
LCD Panel
Plastic Mold Frame
PCB(Gate)
Gate TCP(Flat Type)
Source TCP(Bent Type)
BEFDiffuserLGPReflector Sheet
Assembly structure of a TFT-LCD Module

- Larger Glass Size- Glass area utilization- Improve Cost of Ownership
Shorten TAT (Turn Around Time)Shorten Transportation distance
- Process SimplificationTFT Process reduction (7 5 4 mask step)Automation : LC & Module line
- Reduce number of parts
- Material reductionSpin coating slit coatingRecycling
Productivity
Cost saving
Panel Cost down approach

Mother Glass Size v. productivity
131.45
3.6
11.4510
Gen1
Gen 3Gen 3.5
Gen 4
Gen 2
Gen 5
5.65.0
Gen 1 Gen 2 Gen 3 Gen 3.5 Gen 4 (Gen 5)
300x400 370x470 550x650 600x720 730x920 1000X1200680x880 1100x1250
main product 10.4 12.1 14.1 14.1 /17 15 /17(x4) (x6) (x6) (x9)/(x6) (x15)/(x12)

Display Size & Pixel density for large screen
Screen Size
40”
24”
15”17”
Pixel Contents1M 2M
1280x768
1920x1200
1280x1024
1024x768
1280x76830”
4M
XGA .8 M pixelsSXGA 1.5 MUXGA 1.9 MD-TV 1M/2MWUXGA 2.3M

(1) High Volume Production- Cost burden divide by number of panels per glass
(2) High Yield mfg. Skills for large size
(3) Reduced process for cost down
(4) Materials cost saving
(5) New Process & Materials development
Challenge to $10/inch !(1)+(2)+(3)+(4)+(5)
Cost Effective Manufacturing

Roadmap ; an optimum set of products that Match the market requirements at the time market desire them
Suppliers ; develop the equipment and materials
Manufactures ; install and optimize the process
Correct Capacity to address the desired markets
Performance/Cost
The ideal goal of roadmap
Win / WinWin / Win
Thank You!

OverviewLiquid Crystal Displays (J.K.Kim, Y.O.Kim)Plasma Display Panels (B.H.Lee)Organic Light-Emitting Diode Displays (K.M.Kim)Microdisplays, FED, … (W.K.Lee)Conclusion
Outline

Plasma Display Panel Market Overview
•The worldwide color PDP system market will
exceed $2.7 billion in 2001 and $16.4 billion in
2006
•Nearly 314,000 PDPs will be shipped in 2001,
growing to 6.2 million in 2007
•PDP sales will switch from a business-dominated
market in 2001 to a television-dominated market
in 2007
•The majority of PDP production will be in Japan
throughout much of the forecast period; however,
companies in Korea, Taiwan, and elsewhere are
expected to have an impact by 2007

Applications for PDP (1)Applications for PDP (1)
Public InformationPublic InformationⅡⅡ(Trades Show & Shopping (Trades Show & Shopping Mall)Mall)
A Clear image & pleasing DesignA Clear image & pleasing Design
Clear text,ideal suitable for Clear text,ideal suitable for large quantity of Datalarge quantity of Data
Stationary InformationStationary Information(Airport,Station & Bus (Airport,Station & Bus terminal)terminal)
A High class & noble A High class & noble ambianceambiance
Public Public InformationInformationⅠⅠ(Lobby & Hotel (Lobby & Hotel Lounge)Lounge)

Applications for PDP (2)Applications for PDP (2)
Space saving & Wide viewing angle for Biz. Space saving & Wide viewing angle for Biz. presentationpresentation
Conference Conference RoomRoom
A clearer & softer text imageA clearer & softer text image
Financial MarketFinancial Market
Wide screen with high Wide screen with high quality picture quality picture
Home TheaterHome Theater

Worldwide PDP System Shipment Value
Source: Stanford Resources/iSuppli, Plasma Display Panels 2001
$0
$2,000
$4,000
$6,000
$8,000
$10,000
$12,000
$14,000
$16,000
1999 2000 2001 2002 2003 2004 2005 2006 2007
Mill
ions
Consumer Conference Room Desktop MonitorsFinancial Exchange Industrial/Medical Public InformationRetail/Signage

PDP System Price Comparison by Screen Size
Source: Stanford Resources/iSuppli, Plasma Display Panels 2001
$0
$5,000
$10,000
$15,000
$20,000
$25,000
$30,000
$35,000
1999 2000 2001 2002 2003 2004 2005 2006 2007
Ave
rag
e S
ellin
g P
rice
<=29.x 30.x-34.x 35.x-39.x 40.x-44.x 45.x-54.x >=55.x

Technology Road MapTechnology Road Map
Property 1998 2001 2004
Screen Size
(inch)
PDP TVs
Presentation PDPs
Pixel resolutionPDP TVs
Presentation PDPs
Brightness
(cd /m 2)
PDP TVs
Presentation PDPs
Contrast
(in dark room)
PDP TVs
Presentation PDPs
Power (W )PDP TVs
Presentation PDPs
Lifetime (hour)PDP TVs
Presentation PDPs
Panel thickness
(m m )
PDP TVs
Presentation PDPs
Panel weight
(kg)
PDP TVs
Presentation PDPs
200
600 500
100 60
40 30
50" 60"
852×480 1366×768
1366×768 1920×1 0 8 0
350 400
250 300
500:1 700:1 1,000:1
500:1 700:1
350 300 350
20,000 30,000
50 40
50"42"
Light weight
Large Size
High Brightness
Thin thickness
High Contrast
High Definition
Low Power
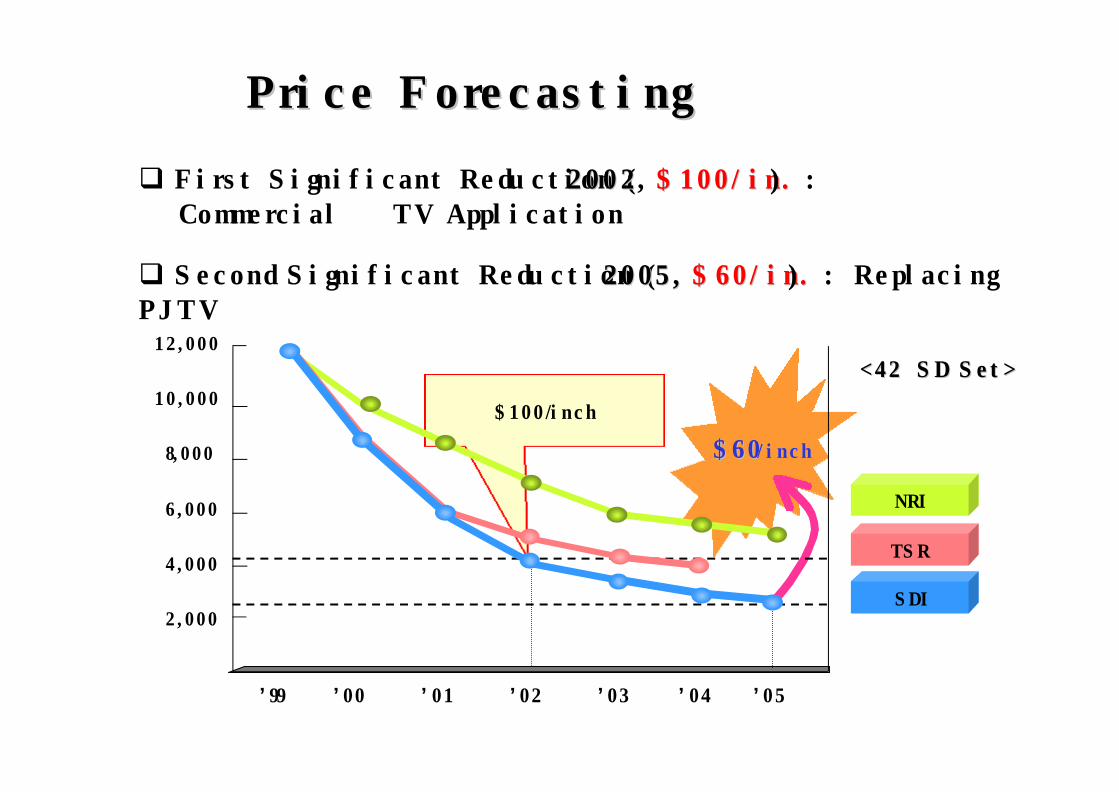
$100/inch
$60$60//inchinch
12,000
10,000
8,000
6,000
4,000
2,000
q First Significant Reduction (20022002, $100/in.$100/in.) :Commercial → TV Application
Price ForecastingPrice Forecasting
q Second Significant Reduction (2005, 2005, $60/in.$60/in.) : Replacing PJTV
<<4242″″SD Set>SD Set>
’99 ’00 ’01 ’02 ’03 ’04 ’05
NRI
TSR
SDI

Summary of Plasma Display Panels
• Plasma display panels making an impact in the business market; entry to lucrative consumer TV market delayed by high end-user prices
• Costs of PDPs will drop surely and steadily
• For HDTV applications, the most important criteria for PDPs are resolution (pixels per inch), size, luminance, power consumption, and cost.
• Manufacturers will need to highlight the flexibility and uniqueness of the PDP to generate acceptance of HDTV

OverviewLiquid Crystal Displays (J.K.Kim, Y.O.Kim)Plasma Display Panels (B.H.Lee)Organic Light-Emitting Diode Displays (K.M.Kim)Microdisplays, FED, … (W.K.Lee)Conclusion
Outline

Duty Number of Driving : Scan Line <120
2 4 6 8 10 Panel Size(Inch)
104
105
106
Mobile Phone
NavigationCar Multi.
Game, PDA
Duty drive:Scan Line number<120
120×160
QVGA
HVGA
QVGA
256×64
Passive Matrix(Small Molecule)
PDA(IMT2K)DSC, DVDCar Audio
Active Matrix(Small Molecule &
Polymer)
SVGA
HVGA
MonitorNote - PC
OLED Market Entry

OLED Advantages
• Excellent “Look” (Emissive Technology)
- Superior viewing angle and contrast ratio
• Low Power(Low operating voltage)
- Generate and modulate light when and where it is needed
• Manufacturing- Many options(evaporation, inkjet, roll-to-roll and so on..)
- Low panel cost(Simple panel construction, no gas, less vacuum)
■ Over 80 company projects
■ Over 50 government and university lab efforts
■ Over 20 OLED fabs under construction or in planning

PMAM PLED
‘97
NEC
5.7” QVGA
LG
8” VGA
Mono (Multi)
Color
Samsung SDI
5.7” QVGA
Pioneer
256*64
‘98 ‘99 ‘00 ‘01
Pioneer
5.2” QVGA
Sanyo
2.1” QVGA
LG
3.8” QVGA
Philips
2”Polymer
Seiko-Epson
2.5” Polymer
TDK
256*64
TDK Mono, QVGA
Idemitsu
5”
Sanyo-Kodak
5.5” QVGA
Samsung
128*64
Ritek
2.5”
Sony
13.1” SVGA
Samsung SDI
8.4” SVGA
Toshiba
1.8” Polymer

Application for OLED■ Car stereo (aftermarket) is ideal first product(Pioneer,TDK)
- Limited operating time
- Adds value to competitive product
- Low volume
■ Cell phone is a key OLED market (Pioneer and others)
- Huge market opportunity
- Reliability issue
- Slow growth predicted until price is aligned with LCD,
- power budget is established and reliability is proven
- Less competition at the outdoor sunlight, compared to
R-LCD
■ OLED pursues all applications !

0
10
20
30
40
50
60
70
80
90
100
AMLCD AMOLED
(%)
Labor & Other
Module Material (Driver IC,Controller, Backlight)
Cell Material (Color filter,Poliarizer)
Array Material
Equipment Depreciation
Building Depreciation
• Driving Curcuit Integrated( No need Drive IC … )▶ Self Luminescence : No need Color Filter, Polarizer, Backlight
Cost Competitiveness
< 2.x” TFTLCD : AMOLED >

Street Price Forecast (2.x”size)
üü AMOLED Should maintain cost merit compared to TFT LCDAMOLED Should maintain cost merit compared to TFT LCD
0
10
20
30
40
50
60
2001 2002 2003 2004 2005
Year
US$
STN LCD
TFT LCD
AMEL
AMEL (SDI Forcast)

Continued ChallengesContinued Challenges
• Lifetime- Differential aging of colors
- Temperature/Moisture sensitivity
• Driving schemes- TFTs/pixel (Pixel uniformity, additional cost, large area)
• Manufacturing- Yield- Manufacturing processes- Improved equipment
3,000h,
>10,000h
Green
>10,000h<2.000hPolymer
>10,000h6,000~10,000hS/M
RedBlue

Technology Road Map
Cellular/PDA PC TV
Ultra Lo-power Hi-Picture Quality
Product
Small~ Mid Mid~ Large LargeSizeDisplay
Glass/Metal Coating →Encap.
Normal Top Emission →Structure
2~3K 10K 20~30KLife(Hr)
1 2 4EfficiencyOLED
3RD Gen.2nd Gen.(Display Circuit Integ)
CurrentP-Si Generation
’01 ‘03 ’05Year

Competing Technologies
• OLED does not (yet) enable new applications
• VFD, LED
– OLED can take market share in segmented displays when price is lower
• PMLCD
– All current OLEDs compete with PMLCD
– Command premium price for better visual quality
– This cannot last; OLED price must drop
• AMLCD
– AMOLED cannot seriously compete until beyond 2007
– LCD manufacturers will phase in AMOLED slowly
– Current investment in LTPS; must get this value first
• Remember: Competition is a moving target!

Patent Issues
• Small molecule
– Kodak original patent-holder
– First patent expires 2003, but Kodak has many later patents
– Formidable patent strength in Japan (more than 8,800 OLED patents filed by Japanese companies since 1997)
• E.g., Sharp, Matsushita, NEC, Fujitsu, Toshiba, SEL
– Inevitable lawsuits
• Polymer
– CDT original patent-holder
– Most polymer companies American or European
– Expect ramp-up from Japan in near future

Thoughts for the Future
• Next key step: Establishment of manufacturing infrastructure
• Creating big expectations too early can backfire– “OLEDs will take over the cell phone market”– “OLEDs will replace LCDs as the desktop
monitor”– OLED e-paper– No need for this “hype”: OLED is easy to sell
because it looks good!
• Low price will create large market early• No fundamental barriers to OLED’s success!

OverviewLiquid Crystal Displays (J.K.Kim, Y.O.Kim)Plasma Display Panels (B.H.Lee)Organic Light-Emitting Diode Displays (K.M.Kim)Microdisplays, FED, … (W.K.Lee)Conclusion
Outline

FED
CRT
Operating Mechanism
u cathodoluminescence same as CRT
(electrons hit phosphors make light)
1µm Cathode electrode
(Cr)
Gate electrode
(Cr)
Insulator (SiO2)
Microtip(Mo)
PackagingSpacerPhosphor

Advantages of FED
• Flat, Thin, and low power CRT
• Provides CRT-like images
– Natural-color images from all viewing angles
– True video speed
– High Brightness
– High Contrast Ratio
• Instant-on over a wide temperature range

Accomplishment
Product
R&D4” Mono
(LETI,’91)
2.4” Color(FED,
Candescnet, ’96)
10.4”VGA(Pixtech, ’96)
4~5”QVGA(Canon, Fujitsu,
Futaba, ’96)
5.3” QVGA(Candescnet, ’00)
13.2” SVGA(Candescnet, ’00)
12.1” VGA(M)(Pixtech, ’99)
5.1”, 5.6”QVGA(Motorola, ’98)
5”Mono(Futaba, ’95)
15”VGA(Pixtech, ’99)
5.2” QVGA(Candescnet, ’01)
13.2” SVGA(Candescnet, ’01)
15” VGACNT-Diode
(Samsung, ’00)
~ ‘95 ‘96 ‘97 ‘98 ‘99 ‘00 ‘01
7” Wide 480x234(C)to Audi for Evaluation
(Pixtech, ’01)
4.5”QVGA(Samsung, ’97)
5.2”QVGA(Samsung, ’98)
4.5”CNT-FED(Samsung, ’99)
10.4” VGA(Samsung, ’00) 7” QVGA
CNT-triode (Samsung, ’01)

- Coexistence of various technologies
- From Microtip type to New Emission type (‘00.05)
- Monitor to TV (‘00.11)
Players
MatsushitaCandescent Motorola Canon Samsung
BSD*Type Mircrotip CNT SED CNT2.6”
MulticolorStatus13.2 SVGA
Color 15” VGA Color30” SED
Color15” VGAMono7” VGA Color
-Manufacturing
Line
2G PP Lineplan 3.5G MP
Line
2G PP LineNo announce
for MP
Announced MPin 2003 R&D Line
42” TV LargeTarget
ApplicationTV
Mid & LargeMonitor & TVMid & Large
42” TVLarge
TVMid & Large
Low Power StructureStrength
Ultra SmallHole
Invisible SpacerJoint with
SONY
Carbon SurfaceEmission
Technology
SED Technology
CarbonEmission
Manufacturing
* BSD:Ballistic Electron Surface Emitting Display

◆◆ CNTCNT--FEDFED
CNT, Graphiteⓔ ⓔⓔ
◆◆ BSD (Ballistic electron SurfaceBSD (Ballistic electron Surface--emitting Display)emitting Display)
Surface Electrode
Lower ElectrodePorous Poly Silicon
Porous Poly Silicon Layer
Oxidation Layer Metal electrode
Poly Si Poly-Si
Solid
Vacuum
Competing Technologies
• Samsung Developed 7” Full Color Test Vehicle
- CNT : good electron emitters
- Screen printing Method
Well established, Low cost & Good scalability
• Matsushita Demonstrate
3” Multicolor @ SID 2000
- Target : 20~40” TV
- Operating Vacuum : 1~10Pa
- Power Consumption : 100W @ 42”

Summary
ü FED has advantages - Thin and low power Consumption- CRT-like images(Natural Color, True Video speed, High Brightness)- Reliability
ü Problems to Solve- not so easy to make Large Screen- doesn’t have exact application
ü New approaches- SED, CNT, BSD type for Large Screen and Cheap Process- Target market changes from Middle size to Large size
ü Who can replace the Conventional CRT?

Microdisplay Market
$0
$200,000
$400,000
$600,000
$800,000
$1,000,000
$1,200,000
$1,400,000
$1,600,000
1999 2000 2001 2002 2003 2004 2005 2006
Th
ou
san
ds
of
Do
llars
LCD LCOS MEMS Emis/ScanSource: Stanford Resources/iSuppli, Microdisplays 2002 (preliminary)

Application Categories
• Projection
– Front
• business
• auditorium
• home theater
– Rear
• television
• video cubes
• monitors
•Near-Eye
– Viewfinders
– Handheld
• cell phone
• PDA
– Head-Worn
• headset
• head-mounted

Projection and Near-Eye Percentages
0%
20%
40%
60%
80%
100%
2000units
2000value
2006units
2006value
Projection Near-Eye
75%
72%
74%
71%
Source: Stanford Resources, Inc. Microdisplays 2001

Near Eye Applications
• Camcorders
– Microdisplay viewfinder often in conjunction with backside or flip-out direct-view display.
– Cost, usage, and performance tradeoffs
• Digital cameras
– Potential advantages of microdisplay viewfinder: sunlight readability, high pixel count, large image size, zoom ability
– But, smaller budget for display
• Consumer market
– Short product cycles
– Lower price, higher performance each generation
• LCD and LCOS high volume proven

02-03-29
Microdisplays Summary
•In 2006, near-eye applications will account for 74% of the units, while projection applications will account for 70% of themarket value.
•LCD microdisplays will continue to lead in both shipments and value compared to other technology types
•Manufacturing Issues
– Supply and demand
– Ramp-up to full volume
•Cooperation vs. Competition
– Industry structure