spectroscopic techniques for corrosion detection using drones · in conclusion, we find a poor...
TRANSCRIPT

Spectroscopic techniques for
corrosion detection using drones Technology review as part of work within the
performance contract “Dronemetrologi”
Hugo Kerdoncuff, Wan-Ing Lin, Lars Johann Wacker
December 2017, Ver. 1.01

Spectroscopic techniques for corrosion detection using drone
Technology review as part of work within the performance contract “Dronemetrologi
Report DFM-2017-R005, Ver. 1.01
2017
By
Hugo Kerdoncuff, Wan-Ing Lin, Lars Johann Wacker
Copyright: Reproduction of this publication in whole or in part must include the customary
bibliographic citation, including author attribution, report title, etc.
Published by: DFM A/S, Kogle Allé 5, 2970 Hørsholm
Denmark
Request report
from:
www.dfm.dk
Content
1. Introduction.............................................................................................................................................. 5
1.1 Legal and technological framework ........................................................................................ 5
1.2 Sensor requirements for drone deployment ........................................................................... 6
1.3 Requirements for efficient corrosion detection ....................................................................... 7
1.4 Requirements for detection accuracy ..................................................................................... 7
2. Spectroscopic methods for corrosion detection ........................................................................ 8
2.1 Microwave and millimetre-wave imaging ................................................................................ 8
2.2 Terahertz spectroscopy ........................................................................................................ 10
2.3 Infrared thermography .......................................................................................................... 12
2.4 Fourier-transform infrared spectroscopy (FTIR) / Mid-Infrared spectroscopy (MIR) ............. 13
2.5 Colour, multispectral, and hyperspectral imaging and VIS-NIR spectroscopy ..................... 15
2.6 Raman spectroscopy ........................................................................................................... 18
2.7 Laser-induced breakdown spectroscopy (LIBS) ................................................................... 18
2.8 X-ray spectroscopy .............................................................................................................. 20
3. Evaluation and conclusion ................................................................................................................ 21
4. Bibliography ........................................................................................................................................... 25
5. Acknowledgements ............................................................................................................................ 29

4 Spectroscopic techniques for corrosion detection using drones
Summary
Corrosion is one of the major cost factors in the inspection and maintenance of offshore structures
and in particular for wind turbines. Inspections require rope access teams, which is time
consuming, costly and imposes safety issues. Replacing these inspections by drone-based
operations will thus be beneficial on many levels.
Current state-of-the-art inspections using drones rely on footage from colour cameras. This
method requires the subsequent rating of the images by specially trained inspectors, which is
inherently prone to uncertainty and large variations of the rating due to subjectivity.
This review aims to identify the technical requirements and possibilities for operating a corrosion
sensor from a drone platform, which would deliver objective ratings of the state of an asset without
the help of a human inspector.
Specifications of current state-of-the-art drone platforms set requirements for the sensor, which
corresponds to a maximum weight of 1.5kg, a maximum size of 240 mm x 160 mm x 130 mm,
and a maximum average power consumption of 100W. Moreover, the sensor needs to be working
in a non-contact, non-destructive way with a detection range of minimum 3 m. Inherent limitations
of the drone platforms like mechanical vibrations are only discussed qualitatively. According to
current regulations and industry needs, the measurement uncertainty of the corrosion sensor
should be no higher than 5%.
This review focusses on spectroscopic solutions, since they demonstrate a high specificity to
chemical compounds and elements, which is necessary for detecting corrosion products. Different
options are discussed in terms of sensing capabilities, and operational and technical requirements
for implementation on a drone. These methods include microwave spectroscopy, terahertz
spectroscopy, infrared thermography, Fourier-transform infrared spectroscopy, infrared
spectroscopy, visible to near-infrared spectroscopy, colour imaging, multi- and hyperspectral
imaging, Raman spectroscopy, laser-induced breakdown spectroscopy and X-ray spectroscopy.
In conclusion, we find a poor technological fitness for this application for microwave-, terahertz,
Fourier-transform, Raman and X-ray spectroscopy. Infrared, visible to near-infrared
spectroscopy, colour imaging, hyperspectral imaging and laser-induced breakdown spectroscopy
are identified to have fair technological suitability. Infrared thermography and multispectral
imaging are found to be the most feasible technologies considered in this review.
Spectroscopic techniques for corrosion detection using drones 5
Review of spectroscopic methods for the detection of corrosion using drones
1. Introduction
Corrosion represents a major cost factor for modern societies. Estimates attribute about 3.4 % of
the world wide gross domestic product to costs related to corrosion1. The degradation of steel
structures has multiple effects ranging from a purely cosmetic issue of red rust stains on painted
surfaces to severe structural collapses. A constant monitoring of critical structures such as
buildings, bridges and towers is thus of outmost importance for the safety of the structures.
However, many of these structures are found in remote locations, like offshore wind turbines and
oil and gas drilling platforms, or raise safety issues in case of inspection, e.g. due to their heights.
Other issues include necessary transportation pathway closedown in case of inspection of public
transport infrastructures such as bridges, which leads to high associated cost and inconvenience
for the public. The use of drones is an efficient way to inspect hardly accessible structures. It
provides both increased safety during operation and inspection, and reduced associated
maintenance costs. Currently, the use of drones for maintenance inspection is limited to the
acquisition of camera footage, which is subsequently rated by specialists. This evaluation method
is cost intensive and depends highly on the experience and subjectivity of the inspector.
This report will focus on corrosion detection and evaluation beyond the state-of-the-art and tries
to identify corrosion detection methods that could be deployed on a drone. Ideally, the identified
method shall be able to quantify the amount of corrosion without the external help of a human
inspector, or at least guide the inspector with suggestions for a more efficient and objective
inspection. Due to the airborne nature of the drone platform, the review will focus on non-
destructive, non-contact and remote methods. Most spectroscopic methods answer these criteria
and can furthermore provide chemically specific information, which makes them good candidates
for corrosion detection and evaluation. Since monitoring corrosion is essentially an industrial
need, the use of professional drones with their associated higher load capabilities will be assumed
in this report.
The report is structured as followed. First a technological review of payload mass, dimension and
other restrictions is given. In the second part, the requirements for a corrosion sensor are laid out
in terms of current norms. The following part describes the different spectroscopic solutions
available and evaluates them in terms of their applicability for drone-based corrosion detection.
The last part compares the different methods and rates their feasibility.
1.1 Legal and technological framework Danish legislation defines five categories for unmanned aerial vehicles (UAV). These categories
are differentiated by weight as shown in Table 1. Drones of category 3 are not exempted from
some of the regulations for manned aircraft as drones of the other four categories are. This makes
operation in general more difficult and less attractive for inspection enterprises. For professional
use, only drones of category 1B, 2 and 3 are of importance. UAVs with a maximum take-off weight
(MTOW) lower than 1.5 kg only allow for very small payloads and will thus not be considered
within this framework. Therefore only drones of category 1B and 2 are reasonable choices for
professional corrosion inspection applications with associated payloads ranging from 1.5 kg to 10
kg. Further legal constraints like minimum distances to built-up areas are not considered here due
to the technical nature of this review.

6 Spectroscopic techniques for corrosion detection using drones
Category Typical usage MTOW Typical
payload
Comments
Microdrone Recreational use 250 g NA Not considered in this review
because of limited payload
1A Recreational use,
aerial
photography
1.5 kg Normally only
RGB camera
Not considered in this review
because of limited payload
1B Simple
commercial use,
aerial
photography
1.5 to 7 kg 1.5 kg Typical drone for professional
use
2 Advanced
commercial use
7 to 25 kg Typical 5.5 to
10 kg
Large professional drone
3 Commercial use > 25 kg Above 10 kg Not considered in this review
because of regulatory
constraints
Table 1 Drone categories within Danish aviation law2–4.
1.2 Sensor requirements for drone deployment On a global scale, the Chinese company DJI represents the company with the largest market
share5. Their largest multipurpose drone with gimbal mount is the Matrice 600 Pro, which can
carry up to 6 kg of payload4. Stabilization mounts like gimbals reduce the allowed payload weight
and dimensions to about 1.5 kg and 240 mm x 160 mm x 130 mm. Within this report, these
specifications are considered as representative for most drones.
Due to expected miniaturization at a later stage of technological development, the requirements
for the payload dimensions and weight are relaxed to a footprint of 25cm x 25 cm with a mass of
about 1.5 kg in accordance with the requirements laid out in the underlying result contract of this
report6.
The airborne nature of the sensor imposes additional constraints related to positioning and
pointing stability, vibrations, distance to the target area and available time for a measurement.
Current state-of-the-art flight control systems7 specify a hovering performance of 0.02 m vertically
and 0.01 m horizontally when using the Global Navigation Satellite System (GNSS). With the
Global Positioning System (GPS) for navigation alone the accuracy reduces to about 0.5 m
vertically and 1.5 m horizontally. For safe operation in case of navigation system failure the drone
should hold a minimum horizontal distance of 3 m, which sets a lower limit to the measurement
distance. Data on vibrations from the drone relevant for the measurement is not available.
Subsequently the issue is considered only relevant for high precision and high-resolution
measurements. By employing market available gimbal mounts8 to reduce vibrations and pointing
variations, the pointing instability can be reduced to ±0.02°. Combining the pointing and
positioning stability results in an uncertainty of the measurement position on the object of about
9 cm.
Typical multirotor drones carry batteries with a capacity of about 100 Wh for flight times of about
16 minutes4. Assuming an acceptable reduction of the flight time by 25%, the average power
consumption of the sensor should not exceed about 100 W when using the on-board battery.
Spectroscopic techniques for corrosion detection using drones 7
1.3 Requirements for efficient corrosion detection Corrosion is defined as a process of changing the properties of a building material from its design
specifications. While corrosion is mostly considered as the loss of bearing material caused by
oxidation, this review will also consider the detection of the corrosion products. In terms of
structural construction, the most prominent products are metal oxides originating from steel or
aluminium. Since corrosion in aluminium is normally prohibited by a protective aluminium oxide
layer, which forms naturally at the surface, we will rather focus on steel corrosion products and
their detection, if not stated otherwise.
Different corrosion detection and quantification methods are currently used. Most steel surfaces
are covered with protective coatings and paints, which prevent corrosion, but tend to mask the
apparition and spreading of corrosion in case the protective layers are breached. Most non-
destructive evaluation methods focus on measuring the loss of material. However, the detection
of a breakdown or end-of-life of the protective coating, or the detection of corrosion products are
already good indicators for maintenance decisions.
The identification of oxidation products is often complicated as the earliest corrosion products are
usually not in their most stable state and may undergo conversion. Detectable products include,
amongst others, Fe(OH)x, FeOOH, γ-FeOOH, α-FeOOH and Fe3O4 9.
The most common methods for the detection and evaluation of corrosion are manual inspection
and manual rating of images of the sample by a specialist. Most standards require comparing the
state of the asset with reference images and rating the surface condition in respect to parameters
such as blistering and amount of rust. This procedure is prone to a high variability in the ratings
due to the subjectivity of the specialists. Different approaches have aimed at removing subjectivity
by using computer algorithms and are discussed in the section on colour imaging methods.
1.4 Requirements for detection accuracy The main standards for the assessment of degradation of coatings and corrosion on surfaces
are ISO-468210, ASTM D61011 and the “European scale of degree of rusting for anticorrosive
paints”12. These standards list surface conditions into six to eleven categories. For example, ISO-
4682 ranks surface conditions into six categories from 0 to 5, with a rating of 0 corresponding to
an undamaged sample and a rating of 5 to a severely corroded sample. While the nomenclature
of the categories might be different between standards, the due time for maintenance is usually
considered at around 1% surface deterioration, and the maximum amount of surface deterioration
for a localized repair is about 3 to 5%13. Considering the higher costs of non-localized repairs, a
valuable corrosion sensor should be able to measure surface deterioration below 5%.
Additionally, the standards not only take into account the total corroded area (ISO 4628-3) but
also the size of the single defects (ISO 4628-2). The end-of-life of protective coatings is attributed
to category 2 to 3, while localized repairs are possible up to category 4. Damages corresponding
to category 3 involve a total percentage of rusted area up to 1% and defect sizes of 0.5 to 5 mm.
Category 4 allows for maximum 8% of rusted area and defect sizes larger than 5mm, which is
considerably easier to detect. In this report, we will assess the corrosion detection and evaluation
methods in regards to their ability to detect surface damages of category 3.
8 Spectroscopic techniques for corrosion detection using drones
2. Spectroscopic methods for corrosion detection
This section describes different spectroscopic methods to detect corrosion or corrosion products.
The focus lies mainly on corroded steel, where not mentioned differently. While many common
detection methods like ultrasound or eddy current detection have been widely adopted by industry
and might be superior by performance compared with the techniques discussed in this review,
they disqualify in the context of remote corrosion sensing from a drone, since the probe needs to
be in contact with the sample. As such, less obvious choices for inspection are also discussed as
they might be able to fill this gap.
Most spectroscopic methods do not require contact with the sample. However, some may have
long recording times or need high collection efficiencies, among other drawbacks. These
requirements and the efficiency in identifying and quantifying corrosion are discussed in this
section together with more basic technical requirements for the use on a drone.
While spectroscopic methods are often associated with the analysis of visible light that has been
interacting with a sample, this report considers the definition of spectroscopic methods in a very
broad sense. This includes techniques like time-domain spectroscopy or x-ray fluorescence
spectroscopy. Most of the techniques are discussed from a measurement point of view. However,
in the case of inspections using cameras the analysis with advanced analytical methods is also
considered, since the combination would fulfil most requirements stated above.
This section includes reviews on microwave and millimetre-wave imaging, terahertz-
spectroscopy, infrared imaging and thermography, Fourier-transform infrared spectroscopy,
spectroscopy in the visible region, overlapping with colour as well as multi- and hyperspectral
cameras, Raman spectroscopy, laser-induced breakdown spectroscopy and finishes with x-ray
spectroscopy techniques. While this section only focusses on the methods on their own, the
following section will compare the different methods with each other and conclude the report.
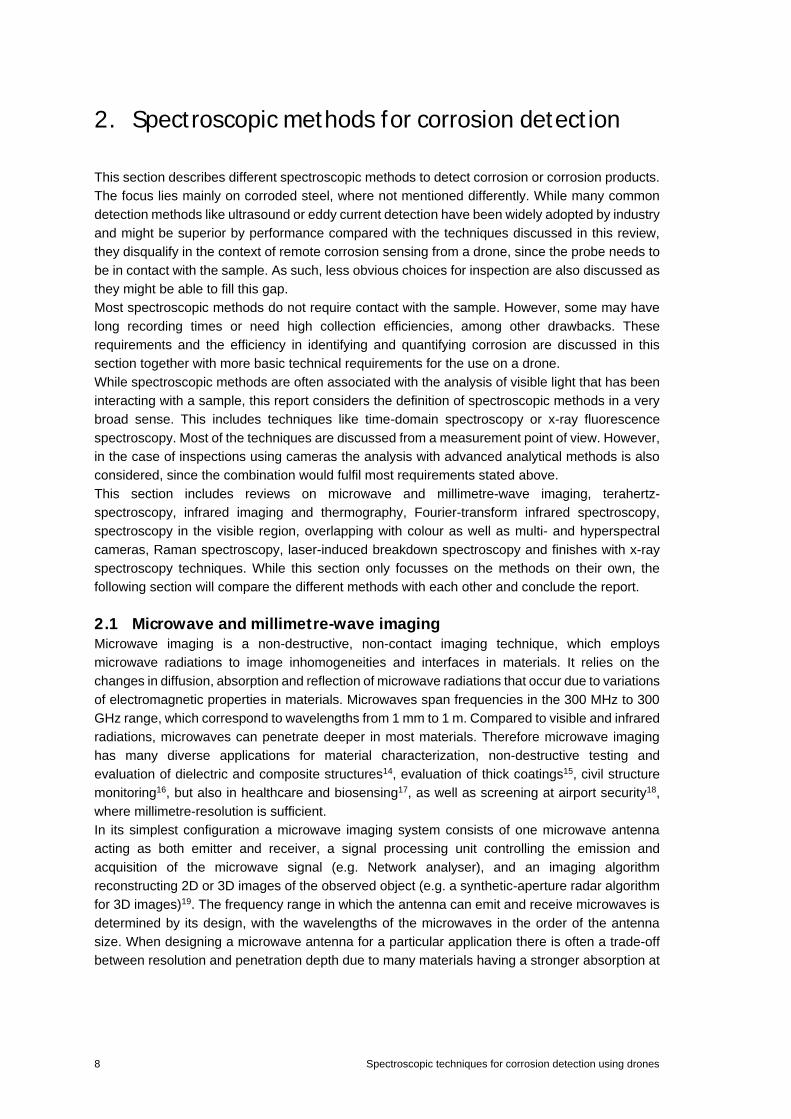
2.1 Microwave and millimetre-wave imaging Microwave imaging is a non-destructive, non-contact imaging technique, which employs
microwave radiations to image inhomogeneities and interfaces in materials. It relies on the
changes in diffusion, absorption and reflection of microwave radiations that occur due to variations
of electromagnetic properties in materials. Microwaves span frequencies in the 300 MHz to 300
GHz range, which correspond to wavelengths from 1 mm to 1 m. Compared to visible and infrared
radiations, microwaves can penetrate deeper in most materials. Therefore microwave imaging
has many diverse applications for material characterization, non-destructive testing and
evaluation of dielectric and composite structures14, evaluation of thick coatings15, civil structure
monitoring16, but also in healthcare and biosensing17, as well as screening at airport security18,
where millimetre-resolution is sufficient.
In its simplest configuration a microwave imaging system consists of one microwave antenna
acting as both emitter and receiver, a signal processing unit controlling the emission and
acquisition of the microwave signal (e.g. Network analyser), and an imaging algorithm
reconstructing 2D or 3D images of the observed object (e.g. a synthetic-aperture radar algorithm
for 3D images)19. The frequency range in which the antenna can emit and receive microwaves is
determined by its design, with the wavelengths of the microwaves in the order of the antenna
size. When designing a microwave antenna for a particular application there is often a trade-off
between resolution and penetration depth due to many materials having a stronger absorption at
Spectroscopic techniques for corrosion detection using drones 9
shorter wavelengths. The varying response of materials to different wavelengths also allows
spectroscopic measurements to distinguish between materials in a sample. However, the
microwave spectrum of a sample is principally affected by the geometric characteristics of the
sample (coating thickness, defect dimensions, etc.) and chemometric methods such as PCA
(principal component analysis) must be applied in order to recover information about the
materials15.
Microwave imaging relies on the measurement of coherent properties of the reflected microwave
radiations such as magnitude, phase, polarization and frequency, at different positions on the
sample. Often, coherent properties of the emitted microwaves must be optimized for a particular
application. For example the reflection of microwaves from steel rebars is strongest when the
polarization of the microwaves is parallel to a rebar19.
Compared to common testing and evaluation techniques such as visual inspection, ultrasound,
eddy current, and shearography, microwave imaging has the combined advantages of remote
detection, detection through materials such as paint and cement, and detection in both dielectric
and conductive materials. For these reasons microwave imaging has been extensively
investigated for the evaluation of corrosion in composite materials14, civil structures16, under
paints and coatings15,20, etc. Zhang et al. employed a sweep frequency microwave imaging
technique for the evaluation of corrosion on steel under a coating20. Steel samples were exposed
to atmospheric corrosion from one to ten months and subsequently coated with 150 µm paint.
Corroded areas were imaged by raster scanning the microwave antenna (a centimetre-size open-
ended rectangular waveguide) over the sample and recording the averaged magnitude and phase
of reflected microwave radiations in an 8.5 GHz range (18 - 26.5 GHz). Another study19 from
Kharkovsky et al. describes a three-dimensional microwave imaging technique for the evaluation
of corrosion of steel rebars in cement-based structures. The imaging system is similar to the one
from Zhang et al., with the addition of a wideband synthetic aperture radar technique to render
three-dimensional images. Rebars were imaged at a depth of 25 mm and 50 mm inside mortar
with a spatial-resolution of approximately 5 mm when using microwave radiations in the K-band
(18 - 27 GHz). The thinning of rebars and the presence of rust could be observed through the
mortar.
Although the evaluation of rust and defects under coatings and inside cement-based structures
has been demonstrated experimentally it remains challenging to perform in the field. One of the
major obstacle is the control of the standoff distance (distance between the probe and the sample,
also called lift-off) which is crucial in reaching optimum sensitivity. With a short standoff distance
the system operates in the near field region and becomes more sensitive to variations due to
irregular surfaces of the sample or movement of the probe, which are often considered as noise.
On the other hand, at large distances the penetration depth decreases. Thus an optimum standoff
distance must often be determined theoretically and experimentally for a particular application. In
most corrosion evaluations using microwave imaging the standoff distance is set within 1 mm to
10 mm and any variation during measurement may affect significantly the result16. In order to
relax the constraint on standoff distance stability, compensation techniques have been
developed: by monitoring the standoff distance then correcting the microwave measurement14 or
by employing differential probes to detect material boundaries21. Nevertheless, the required
stability remains within a few millimetres.
Imaging systems embarked on drones that employ microwave radiations have already been
developed for long-range radar imaging of landscapes and buildings with resolutions on the order
of metres. Therefore, it is reasonable to consider that the specifications of a microwave imaging
system for corrosion evaluation can be fitted to the size, weight and power requirements of a
10 Spectroscopic techniques for corrosion detection using drones
drone application. However a major limitation to the application of microwave imaging on drones
are the constraints on standoff distance and stability since specifications for drone position
stability are usually two orders of magnitude higher than the millimetre positioning required for
microwave imaging. As a conclusion, although microwave imaging enables evaluation of rust and
defects for civil structures, its practical implementation on drones requires major technological
improvement to overcome these constraints.
2.2 Terahertz spectroscopy The International Telecommunication Union defines terahertz radiation (THz) as electromagnetic
radiation with a wavelength of about 0.1 mm to 1 mm22. The photon energy is smaller than the
ionization energy of most materials and smaller than the bandgap energy of non-metallic
materials. Generally, these materials transmit THz waves, while metals reflect them23. These
properties make THz waves an obvious choice for use within non-destructive testing and
evaluation.
There are two types of THz non-destructive evaluation and spectroscopy techniques. Frequency-
domain spectroscopy measures the response of the sample for different frequencies of the
incoming radiation employing a continuous wave source. Time-domain spectroscopy uses short
pulses of radiation, recording the time dependent response. While frequency-domain
spectroscopy can determine the material composition of the sample, time-domain spectroscopy
detects boundaries and interfaces of different materials and is employed to measure the thickness
of material layers, such as coatings.
The two main techniques for the generation of coherent THz radiation are frequency multiplication
of radio frequency signals using semiconductor diodes (mostly GaAs-Schottky diodes)24 or
frequency division by using two lasers (photo mixing)25. Other methods of THz generation include
the use of synchrotron radiation26, free electron lasers (FEL)27, gyrotrons28, backward wave
oscillators29, varactor rectifiers30, rectifiers using resonant tunnelling diodes31, photo-Dember
rectifiers32, far-infrared lasers (quantum cascade lasers33–36 or organic gas far-infrared laser37)
and optical rectification emmiters38.
Photomixing is the most common technique for time-domain spectroscopy. Two lasers are
detuned with respect to each other by the required terahertz frequency and overlapped on a non-
linear component to generate the radiation. Time-domain spectroscopy requires ultrashort pulses
in the picosecond range and generation is achieved by replacing one of the two lasers in the beat
frequency generation scheme by an ultrashort pulse laser.
Equipment for the generation of continuous wave THz radiation is generally available in the size
and weight range required for drone deployment. Picosecond pulsed laser sources required for
time-domain spectroscopy are not available for in field deployment. Their size and weight exceed
the load requirements and their delicate design make them prone to failure due to vibrations on a
drone platform.
Detection of THz waves depends on the frequency range. Detection strategies range from phase
locked detection of reflected or transmitted signals using a biased photodiode and time gating
with ultrashort pulses. Fixed wavelength and broadband detector arrays and cameras are
available for certain wavelengths. However, high-sensitivity detection systems might require
cryogenic cooling making their use on drones virtually not efficient.
THz radiation testing suffers from two major technological drawbacks. First, the spatial resolution
is limited to the radiation wavelength, which is on the order of millimetres. This might prevent the
detection of small corrosion defects significantly smaller than the detection wavelengths. Second,
Spectroscopic techniques for corrosion detection using drones 11
THz technology is not available with high power and efficiency for transmitters and receivers,
which limits its sensitivity and makes an integration into a noisy drone environment challenging.
Moreover, the available equipment is relatively expensive and heavy and for high sensitivity, the
detector needs cryogenic cooling.
However, a number of different approaches to use THz radiation for testing purposes have been
evaluated in recent years. For example, to surpass the limited spatial resolution of THz radiation
imaging, the use of near field imaging has been demonstrated39 though this technique suffers
from a reduced distance between the probe and the sample.
In the aftermath of the 2003 accident of the Space shuttle Columbia, the National Aeronautics
and Space Administration in the USA started developing “advanced non-destructive evaluation,
totally non-contact, non-liquid coupled techniques to accesses density variations in the thermal
protection foam”. Anatasi and Madaras have studied the possibility to detect corrosion with THz
radiation on this background and have shown that it is possible to detect corrosion under paint
when the paint starts swelling and blistering40 and under the isolation tiles of the space shuttle41.
Building on their work Kurabayashi et al.42 investigated possible imaging through multi-layered
paint using different THz frequencies. They found, that the absorption is highly dependent on the
type of paint used and thus different frequencies have to be used for different types of coating.
Moreover, the technique might not be applicable when the absorption of the applied coating is too
high. Another approach by Anatasi and Madaras addresses the problem by measuring the surface
roughness under layers of paint43. Their results show potential, but require recording a signal from
different angles, making a measurement from a drone too time-consuming.
Another approach is the use of THz spectroscopy to directly detect and determine corrosion
products. A proposal for the detection of rust under concrete from the National Institute of
Standards and Technology (NIST) suggests detection of an antiferromagnetic resonance in the
iron oxides. Studies on rusted steel plates showed great promise44. Two recent publications show
the identification of goethite via a one and two magnon resonance at about 0.5 and 0.9 THz,
respectively45 and hematite at low temperatures46. Unfortunately, the resonance in hematite is not
present at room temperature, since the Morin temperature is about 260 K, making its application
in the field impossible.
THz technology has a high potential for corrosion detection. However many issues remain that
have prevented the wide spread use for ground inspections making a drone deployment even
less likely. Current equipment is costly and heavy. Taking full spectra is slow and thus not feasible
for drone integration. The use of coherent THz radiation allows the suppression of the influence
from non-coherent radiation like thermal sources. However, the coherence of the radiation can
give rise to interference and will require phase control of the source and detector to suppress the
detection of interference fringes. The influence of vibrations caused by the nature of the drone
platform on the generation and detection would require more elaborate testing and precautions.
However, deployment of a simple THz system on a drone has been demonstrated for
transmission measurements47. Proposed procedures for resonance detection would rely on a
system employing the detected resonances by the team at NIST between 0.5 and 1 THz.
However, data on detection distances and sensitivities for a drone based THz system are not
published and reflection measurements have not been demonstrated to date. Looking at other
similar systems on the market, this approach is considered not feasible. Time-domain
spectroscopy has been proven to be useful for the determination of coating thickness, which can
be a first sign of the protection break down making it a good choice for maintenance inspection.
However, current time-domain systems do not comply with the size and weight restrictions
inflicted by the drone platform.
12 Spectroscopic techniques for corrosion detection using drones
2.3 Infrared thermography Infrared thermography images the temperature of objects via detection of their infrared
“blackbody” radiation48. All objects emit radiation according to the blackbody radiation law and, at
temperatures in the range of -270 °C to 3590 °C, the emission spectrum peaks in the infrared
region (0.75 µm - 1000 µm). Near ambient temperatures, a narrower range of detection between
7 µm to 14 µm, referred to as long-wave infrared (LWIR) band, is usually used. In addition to
covering the emission peaks of bodies near ambient temperatures (-66 °C to 141 °C), the LWIR
band has the advantage of being separated from the main emission band of the sun, which is
highly relevant for outdoor measurements. Infrared detectors have seen major improvements in
the past two decades49 with the development of uncooled micro-bolometers and focal plane
arrays (FPA) which enable megapixel two-dimensional infrared imaging. The typical parameters
to consider when selecting a thermography system for a particular application are spectral range,
temperature range, spatial resolution, temperature resolution and frame rate50. The spectral and
temperature range are directly related because the peak wavelength of the thermal radiation is
inversely proportional to the temperature (Wien’s displacement law). The operating conditions
may also influence the choice of spectral range, which can be chosen to avoid radiations from the
sun or fit a particular transparency window. As with common digital cameras, the spatial resolution
of an infrared camera primarily depends on detector size, lens system and object to camera
distance. A typical spatial resolution value for a megapixel infrared camera with a standard 30
mm lens at 3 m distance is 0.8 mm. Temperature resolution is defined as the smallest difference
in temperature which can be measured, hence it is dependent on the noise level of the infrared
camera over the spectral range. Due to the nonlinear relation between the temperature of an
object and the infrared radiation intensity measured by the infrared camera, the temperature
resolution is not uniform over the temperature range. Typical values for modern uncooled micro-
bolometer focal plane arrays are around 0.02 K at room temperature. It is worth noting that there
exists a trade-off between temperature resolution and spatial resolution via the size of the
detecting element. On one hand, the sensitivity of the detecting element increases with its size
as it collects more flux, but on the other hand, its spatial resolution reduces as its field of view
widens. Typical frame rate values of megapixel infrared cameras lie in the range 30 -100 Hz, and
the frame rate increases with lower number of pixels.
Thermography is efficiently used as a qualitative tool by showing temperature differences which
may indicate leaks or defaults in an object. It can also be used as a quantitative tool but then
requires careful calibration to a specific application in order to provide accurate temperature
measurements. The main limitation of the temperature accuracy of thermal imaging is that no real
object behaves as an ideal blackbody and hence the emission of thermal radiation from different
objects at the same temperature may differ significantly. For example, glass and metal at the
same temperature will actually look very different with an infrared camera, which translates into
large differences in their emissivity values. Another source of error comes from reflected or
transmitted infrared radiation, which may compete with emitted thermal radiation, especially for
objects with low emissivity.
Thermography techniques are generally classified into two main categories, passive and active.
Passive thermography images the temperature of objects without any external heat stimulation
as the objects themselves act as heat sources. In active thermography, heat is provided to the
objects in order to generate temperature contrasts. Various heat stimulation methods can be
employed to image the response of the object, such as pulsed thermography51, lock-in
thermography52 or pulsed phase thermography53. The heating mechanism itself can be as diverse
Spectroscopic techniques for corrosion detection using drones 13
as eddy current induction, ultrasonic vibrations, microwave dielectric heating54 or flash lamp
heating52. Passive thermography is used in medical sciences55, surveillance and condition
monitoring56, while active thermography is used for defect detection51,52, material characterization
and measurement of coating thickness.
Bison et al. employed lock-in thermography to detect a localized loss of material through a metallic
plate52. They applied a uniform modulated heat flux to the undamaged surface of the plate with
two lamps and recorded temperature maps of the surface at regular intervals. From a sequence
of temperature maps, they recovered the amplitude and phase of the oscillating temperatures for
each pixel. The phase image then clearly revealed the damage on the metallic plate. In another
study51, Jönsson et al. applied pulsed thermography with flash lamps for the evaluation of
corrosion on carbon steel and magnesium. They used a cooled infrared camera with a spectral
range of 3.0 – 5.0 µm, a resolution of 640 px x 512 px, a frame rate of 126 Hz, and a flash lamp
consuming 6 kJ for 1 ms to generate short pulses. They demonstrated the superior performance
of the method at detecting blisters and filiform corrosion under coatings thicker than 60 µm,
compared to three-dimensional profilometri with a photometric stereo technique. Pulsed phase
thermography has been applied by Schönberger et al. to investigate the corrosion of steel and
galvanized steel coated with organic paints propagating from stone chipping defects53. They
identified corrosion spots on 100 x 200 square centimetres surfaces using a cooled infrared
camera with a spectral range of 3.0 – 5.0 µm, a resolution of 640 px x 512 px and a frame rate of
100 Hz, combined with xenon lamps delivering approximatively 6 kJ of energy in form of a short
square pulse. By using high-resolution infrared imaging with a microscope objective, pulsed
phase tomography could even differentiate corrosion attack, delamination, uncoated areas and
intact areas on surfaces smaller than 10 x 10 square millimetres.
Infrared thermography systems are already commonly mounted on drones for applications such
as building inspection, security and rescue, power line monitoring, etc. However, these systems
employ passive thermography techniques which are suitable for defect detection under specific
conditions only. For example, passive thermography methods have been applied to the detection
of delamination on reinforced concrete structures, using the evolution of the outdoor ambient heat
due to day-night cycle as a 24 hours sinusoidal heating mechanism. Air gaps have lower thermal
conductivity than concrete and are revealed by the thermal amplitude variation over the course
of a day. Active thermography is a more versatile technique for defect detection as it can be
applied to a wider range of materials and ambient conditions. However, it requires additional
equipment, which drains the drone resources (payload, battery capacity) and raises technical
challenges such as drone position stability during the measurement. Pulsed thermography and
pulsed phase thermography require a high energy pulse of a few kilojoules for each thermal image
therefore the surface that can be imaged by a drone-mounted thermography system gets rapidly
limited by the battery capacity of the drone. Nevertheless, both pulsed thermography techniques
remain viable by allowing quick measurements (< 1 s) under a large variety of ambient conditions,
which match the requirements of drone-based sensors. On the other hand, lock-in thermography
requires longer measurement times and may suffer high noise due to instability of the drone
position, which does not make it a suitable method for drone applications.
2.4 Fourier-transform infrared spectroscopy (FTIR) / Mid-Infrared spectroscopy (MIR)
Infrared (IR) spectroscopy measures the absorption of a sample over a wide spectral range as
the absorption of IR light directly reflects molecular bonds in the sample and can provide

14 Spectroscopic techniques for corrosion detection using drones
complementary information about these to elemental analysis methods such as e.g. inductively
coupled plasma mass spectrometry or X-ray fluorescence spectroscopy. The IR electromagnetic
spectrum is usually divided into three regions; the near-infrared (NIR) covers approximately
14000 – 4000 cm−1, the mid-infrared (MIR) 4000 – 400 cm−1 and the far-infrared (FIR) 400 – 10
cm−1.
In the simplest implementation of IR spectroscopy, the spectrum is recorded by using a dispersive
optical element to split the light transmitted or reflected from the sample into different
wavelengths. However, depending on the wavelength region, IR spectroscopy possesses a
number of challenges. The ambient air or the used optical components might not be transparent
for the light used. Thus, the optical components and the wavelength region needs to be chosen
carefully. The main advantage of IR spectroscopy and especially MIR spectroscopy are the
possibility to acquire abundant information in organic molecules about functional groups and
possible quantitative measurements.
Classical approaches of IR spectroscopy have been used to study atmospheric corrosion and
corrosion products in the lab57,58. Raman et al. were able to distinguish and identify rust phases
in different samples and their transformation under heat. Misawa et al. studied a similar problem
on low alloy steel59. Both groups confirm their findings with alternative methods. Moreover, the
use of dispersive IR spectroscopy in corrosion science has been sparse in favour of FTIR and
Raman spectroscopy, due to their easier use in the laboratory. Zeylikovich and coworkers
investigated the wavelength-dependent transmission of paint and found transmission windows for
military paint between 1 µm and 2.8 µm, and between 3.8 µm and 5.5 µm60. Their method showed
promising results and was patented61,62. It formed the basis for the CUPID system for imaging
through paint61. The system demonstrated promising results in imaging corrosion damages under
paint layers, but since the system is highly dependent on the paint used, it has not been brought
to wide usage and the relevance of the approach for a flexible system is limited.
Fourier-transform infrared spectroscopy (FTIR) utilizes light with typical photon wavenumber
within the MIR region, between 600 cm−1 and 4000 cm−1. While most other spectroscopic methods
use a dispersive spectrometer to directly measure the spectral density of the transmitted or
reflected light, FTIR relies on an indirect acquisition technique. A broadband infrared light source
is filtered by a Michelson-Morley interferometer and the spectral response of the sample to the
light from the output port of the spectrometer is recorded depending on the path difference of the
two interferometer arms. By applying a Fourier-transformation to the raw data the actual spectrum
is obtained. FTIR analysis enables fast (typically 10 - 100 spectra/sec)63,64 identification of
polymers, non-metallic materials, mineral compounds and organic molecules and covers the
fundamental vibrational modes of anion functional groups such as SiO4, CO3, PO4, and SO4 65.
This technique was used to examine the corrosion process of steel components in a printing
machine, where the spectra revealed corrosion products of steel and enabled identification of iron
oxides including goethite (α-FeO(OH)), lepidocrocite (γ-FeO(OH)) and magnetite (Fe3O4) 66.
Quantitative studies of iron oxides were also approached systematically by using FTIR in
magnetite (Fe3O4), maghemite (γ-Fe2O3), and hematite (α-Fe2O3) 67. When studying heritage
materials, some inorganic pigments containing iron oxides are inactive in the MIR region but
display resonances in the FIR region which have been successfully probed by FTIR on mural
paintings and corrosion products in printers68,69.
FTIR and Raman spectroscopy are complementary analytical methods that both probe the
intrinsic vibrational modes of molecular bonds but obey different selection rules. However, FTIR
generally provides better sensitivity than Raman spectroscopy and a comparable capability to
identify minerals. In addition, the IR bands can exhibit measurable band shifts with cation
Spectroscopic techniques for corrosion detection using drones 15
substitution that provide information required for mineral identification. Besides, carbon dioxide
(CO2), which is found in oil and gas fields in varying concentrations, can cause severe corrosion
of infrastructures in the presence of water. FTIR is sensitive to the detection of CO2 and may
therefore be employed as a corrosion prevention tool.
The deployment of an IR spectrometer on a drone has been demonstrated by T&A Survey Drone
Services in the Netherlands for mining-related environmental monitoring and crop monitoring,
where it has provided detailed spectral information of soil, rocks and vegetation70. The specificity
and the availability of alternative methods can explain why dispersive IR spectroscopy is not used
widely for corrosion analysis. However, the relatively simple setup and the possibility to integrate
it on a drone make it promising and incite further investigation.
Integration of the components needed for the system of Alfano et al.61 onto a drone has already
been shown. IR cameras in the relevant wavelength range are available for deployment on a
drone and the additional power consumption and weight of an IR light source is in a compatible
range.
However, there are multiple concerns in integrating specifically an FTIR spectrometer on a UAV
platform. Since this technique relies on the precise control of the position of a mirror and on the
stability of two interferometric arms, the vibrations on a drone may cause excessively noisy
measurements. Besides, most FTIR instruments are laboratory instruments. Typical weights for
in field remote imaging instruments are around 33 kg, which is too heavy for drone deployment
and makes this technique not very favourable71.
2.5 Colour, multispectral, and hyperspectral imaging and VIS-NIR spectroscopy
Colour imaging, multispectral imaging and hyperspectral imaging are all detection methods of the
visible part of the electromagnetic spectrum. Multi- and hyperspectral imaging and VIS-NIR
spectroscopy are normally also sensitive in the NIR region. They differ mainly in the spectral
resolution, number of bands, acquisition time and cost.
The corrosion detection techniques relying on imaging presented in this section are inherently not
quantitative and still require human comparison and rating. However, recent efforts have aimed
at overcoming these drawbacks by applying machine learning algorithms and artificial
intelligence. Current results are discussed in the last part of this section.
2.5.1 Colour imaging Colour imaging relies on the acquisition of images that mimic the spectral perception of the human
eye. The images are formed by recording the intensity of radiations in three overlapping bands:
the red band from 575 nm to 650 nm, the green band from 475 nm to 600 nm and the blue band
from 400 nm to 525 nm. The most common practice to image in these three bands simultaneously
is by covering the imaging sensor with a Bayer filter. This regular filter pattern lets the green part
of the spectrum to half of the pixels, while the green and blue part of the spectrum is imaged on
one quarter of the pixels each. An interpolation algorithm reconstructs the full colour information
after acquisition for all pixels. NIR light is blocked by a filter, since the human eye is not sensitive
to these wavelengths and would cause an overexposed perception of the image.
An advantage of this technique is the natural resemblance of the sample, allowing the inspector
to easily evaluate the sample from the acquired image or validate results from a different method.
Moreover, cameras of different price categories are available and carrying a high performance
camera on a drone represents the main analytic technique. Since they are inherently not
chemically sensitive, the detection of corrosion relies on the perception of colour with its

16 Spectroscopic techniques for corrosion detection using drones
restrictions and the requirement of an inspector. Advanced analysis techniques and their
performance are discussed below.
2.5.2 Multispectral imaging Multispectral imaging is often combined with colour imaging to record images in the NIR region
or in specific narrower wavelength bands. In comparison with colour imaging, a wider variety of
imaging sensors can be used for multispectral imaging depending on requirements for size, cost,
covered spectral bands and frame rate, while the covered wavelength range can span from about
300 nm to 1100 nm and the choice of spectral bands is only limited by the availability of optical
bandpass filters. Modern manufacturing techniques allow the production of filters over the whole
spectrum. Bandwidths can be customized from a few nanometres up to tens of nanometres.
Multispectral imaging is commonly used with drones for the recording of the vegetation index in
farming. Therefore, sensors for drone deployment are already available and would only have to
be adapted for the required wavelengths to detect corrosion. Unfortunately, corrosion products
do not exhibit clear absorption lines as such. This makes the detection method relatively cheap
and deployable but the advantage over colour imaging is limited. More details about this issue
are discussed in the subsection on VIS-NIR spectroscopy.
2.5.3 Hyperspectral imaging Hyperspectral imaging is implemented by mounting a narrow tuneable bandpass filter in front of
a monochrome camera and taking multiple pictures of the same sample in rapid repetition, while
adjusting the pass wavelength of the filter in between the images. The amount of recorded data
is usually significantly greater than with colour or multispectral imaging as the number of spectral
bands covered by a hyperspectral image is higher. In order to reduce the amount of collected
data and increase the amount of light per pixel, many hyperspectral cameras operate with
relatively low resolution sensors.
Both multi- and hyperspectral-imaging are generally not used for the detection of corrosion. The
main reason is the limited advantage of the technique over colour imaging, due to the lack of
significant absorption and emission lines in iron oxides that could be used as fingerprints.
However, the spectral response of iron oxides have been used in mineralogical characterization
of gleys72 and determination of the mixture ratio of iron oxides73. Both studies concluded, that the
technique is able to identify the different iron oxides in most cases73. However, the studies limited
the analysis to predefined samples of iron oxide containing powders, gleys and the oxides
themselves. These samples are considerably less complex than the samples considered in
corrosion inspection, where a mixture of different iron oxides, coating and other organic materials
present in the environment will complicate the measurement. This makes a transition to corrosion
detection challenging.
2.5.4 VIS-NIR spectroscopy Near-infrared (NIR) spectroscopy is a spectroscopic technique using the electromagnetic
spectrum from about 700 nm to 2500 nm to probe the molecular and atomic bands of a material.
This section will focus only on wavelengths below 1100 nm, which address electronic transitions,
while the section about FTIR and MIR spectroscopy covered longer wavelengths, which address
molecular transitions. VIS-NIR spectroscopy also covers the visible range from 300 nm to 700
nm. This section will focus on active spectroscopic techniques, which require an artificial light
source, while colour, multi- and hyperspectral imaging rely on the presence of ambient light.

Spectroscopic techniques for corrosion detection using drones 17
The reflectance spectra and their associated electronic spectra of iron oxides have been studied
extensively, e.g. by Scheinost et al.74, Sherman and Waite75 or Torrent and Barron73. They report
four distinct bands in all iron oxides at about 410 nm, 480 nm, 700 nm and 950 nm with the
exception of hematite. The absorption bands in hematite are at around 420 nm, 532 nm, 700 nm
and 875 nm.
On a technical side, the absorption bands are wide without sharp features, thus do not require
high-resolution spectroscopy and can be probed with a wideband light source. Implementing this
technique by coupling a light source with hyperspectral imaging on a drone seems feasible and
sufficient in terms of resolution.
Scheinost et al.74 studied the reflectance of iron oxide minerals and found significant differences
in the position and intensity of the bands, for the same type of material in different samples. They
account these onto differences of crystal structure. The magnitude of the position shifts can lead
to band overlaps, complicating a distinct identification of materials. Despite these problems, VIS-
NIR spectroscopy has found some very specific applications in identification and quantification of
iron oxides in soil samples76,77 and in the paper industry78. Due to the unspecific identification
scheme, this technique does not offer any advantages over normal colour imaging or visual
inspection. Industry has not implemented it for corrosion detection and is relying on photographs
and contact inspection.
2.5.5 Advanced analytical data evaluation Multiple advanced analytics approaches have been developed to overcome the need for a human
corrosion specialist to evaluate the state of corrosion. Colour images have been analysed using
a colour-based digital imaging processing approach9. This approach analysed the pixel values in
terms of the HSV colour model (hue, saturation, value). By determining a certain colour range as
corrosion, the algorithm was able to classify up to 27 rust grades, while the accuracy when used
on the sample pictures in ASTM D61011 was determined to 0.01 to 0.02. Although the procedure
would fulfil most of the requirements, the detection is not specific to corrosion products. Moreover,
it would require assistance for image adjustment, detection of unusual shapes and distinction of
materials with similar colours.
Momma et al.79 used colour images of rust on steel structures to train and test a support vector
machine for corrosion recognition and they achieved a correct classification of 66% of their
images. Petricca and coworkers80 used pixel wise colour pre-categorization and deep learning
algorithms for detection of corrosion in colour images. Notably, their aim is to use their technology
for drone-based inspection. Their pre-categorization of images with OpenCV achieved an
accuracy of 69% and their deep learning approach of 78%, while both methods combined allowed
for accuracies of up to 88%.
Huynh et al.81 employed hyperspectral cameras to evaluate the condition of the Sydney Harbour
Bridge. They acquired spectral images in the range 450 nm to 650 nm, which provides an increase
in spectral resolution while preserving the same sensing bandwidth compared to RGB cameras.
Their approach of supervised learning of a multi-class support vector machine allowed them to
automatically detect corroded subareas within their pictures and classify them in four degradation
and one background categories according to the different ASTM standard classes. They achieve
correct classification rates of between 75% and 85% depending on the level of degradation
present.
Overall most of the advanced analytical methods are currently not able to deliver our required
uncertainty level below 5%. Classifying the images based on the position of the pixels in colour
18 Spectroscopic techniques for corrosion detection using drones
space seems promising but the method needs to prove its performance in more challenging
conditions.
2.5.6 Overall conclusion Colour and hyperspectral imaging systems are a typical load on drones. By themselves, the
recorded images do not provide sufficient information for the specific identification and automatic
evaluation of the corrosion state of an asset. While manual rating from colour images is a widely
accepted approach, it heavily relies on the inspector and its objectivity. Advanced computational
approaches to analyse recorded images lack currently the necessary accuracy for their wide
spread use in corrosion evaluation applications.
2.6 Raman spectroscopy Raman spectroscopy relies on the inelastic scattering of a monochromatic laser beam from a
sample. Excitation or deexcitation of molecular vibrations lead to a shift in frequency of the
reemitted photons. Since the energy shift is caused by the characteristic molecular levels of the
molecules under investigation, the spectrum of the scattered photons acts as a fingerprint82.
Raman scattering is an inherently weak process with typical scattering rates on the order of 1 in
10 million83. Moreover it is an omnidirectional process, which complicates the efficient collection
of the scattered photons. The strong absorption of iron oxides84 also contributes to the lowering
of the signal obtained from corrosion products, which renders the evaluation of corrosion with
Raman scattering particularly challenging.
Nonetheless, Raman spectroscopy is one of the standard tools to identify corrosion products on
different types of steel due to their distinctive spectra. It proved to be especially useful, when
combined with microscopic imaging85. However, most studies have been performed in a
controlled laboratory environment, allowing for near-contact probe-sample distances, high
numerical aperture collection optics and long exposure times, which are not feasible conditions
when measuring from a flying drone platform85–87.
By choosing the wavelength of the excitation laser close to an electronic transition in the examined
material, the amount of scattered photons can be increased by a factor of 102 to 106 88. This
scattering enhancement process called resonance Raman scattering has been demonstrated to
work in iron oxides for excitation wavelengths of about 532 nm89 and 636 nm 87. These results
have been reproduced in laboratory conditions at DFM. However, the achieved enhancement
was not large enough to allow for remote detection of iron oxides within acceptable timeframes.
Moreover, we anticipate the presence of titanium dioxide (TiO2) in real life samples, since it is
widely used as a white pigment in protective paints90. The strong Raman spectrum of titanium
dioxide overlaps with the weak spectra of iron oxides, potentially masking the presence of
corrosion91. In conclusion, the use of Raman spectroscopy for detection of corrosion from drones
is not favourable without dramatic improvements of Raman spectroscopy methods for iron oxides.
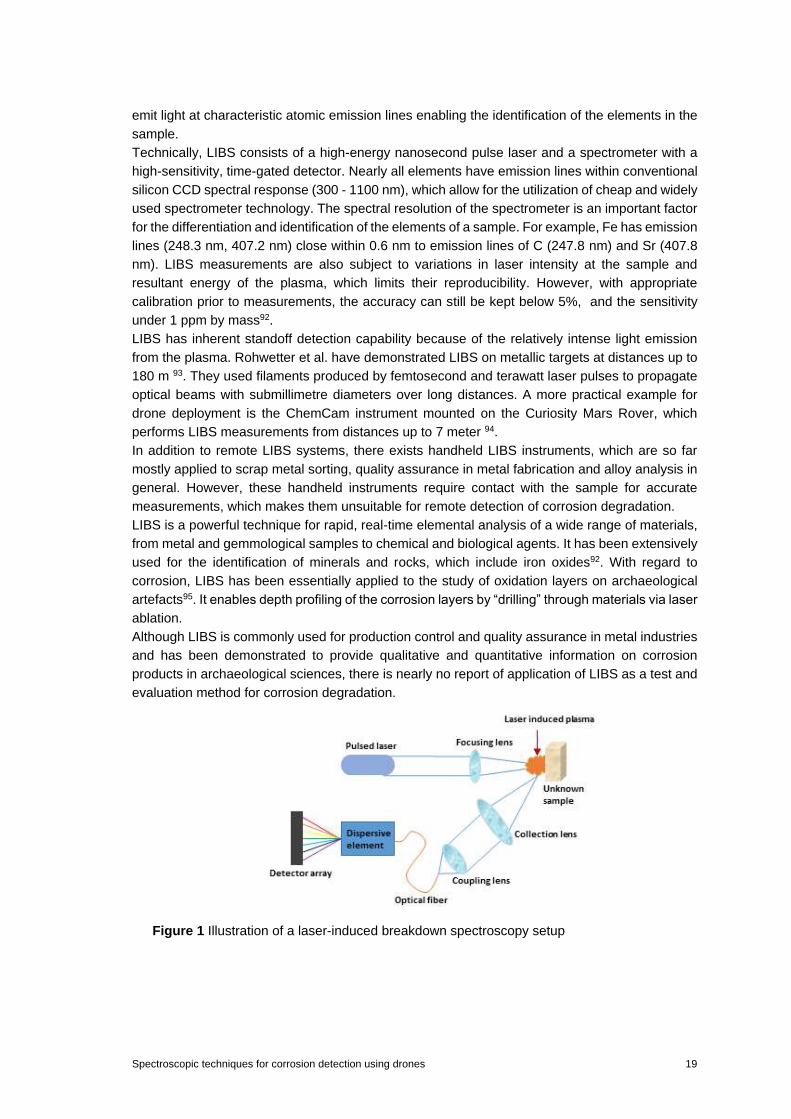
2.7 Laser-induced breakdown spectroscopy (LIBS) Laser-induced breakdown spectroscopy (LIBS) is an elemental analysis technique considered
non-destructive (or minimally destructive) and requiring short high-intensity pulse lasers, as well
as virtually no sample preparation. LIBS is an atomic emission spectroscopy technique, which
involves the creation of a high-temperature plasma at the surface of the sample by ablation of a
small amount of material with a high intensity focused laser pulse. During the process of plasma
cooling, which happens about 10 µs after the laser pulse excitation, the electrons of the atoms
and ions in excited electronic states fall down into their ground states. This causes the plasma to
Spectroscopic techniques for corrosion detection using drones 19
emit light at characteristic atomic emission lines enabling the identification of the elements in the
sample.
Technically, LIBS consists of a high-energy nanosecond pulse laser and a spectrometer with a
high-sensitivity, time-gated detector. Nearly all elements have emission lines within conventional
silicon CCD spectral response (300 - 1100 nm), which allow for the utilization of cheap and widely
used spectrometer technology. The spectral resolution of the spectrometer is an important factor
for the differentiation and identification of the elements of a sample. For example, Fe has emission
lines (248.3 nm, 407.2 nm) close within 0.6 nm to emission lines of C (247.8 nm) and Sr (407.8
nm). LIBS measurements are also subject to variations in laser intensity at the sample and
resultant energy of the plasma, which limits their reproducibility. However, with appropriate
calibration prior to measurements, the accuracy can still be kept below 5%, and the sensitivity
under 1 ppm by mass92.
LIBS has inherent standoff detection capability because of the relatively intense light emission
from the plasma. Rohwetter et al. have demonstrated LIBS on metallic targets at distances up to
180 m 93. They used filaments produced by femtosecond and terawatt laser pulses to propagate
optical beams with submillimetre diameters over long distances. A more practical example for
drone deployment is the ChemCam instrument mounted on the Curiosity Mars Rover, which
performs LIBS measurements from distances up to 7 meter 94.
In addition to remote LIBS systems, there exists handheld LIBS instruments, which are so far
mostly applied to scrap metal sorting, quality assurance in metal fabrication and alloy analysis in
general. However, these handheld instruments require contact with the sample for accurate
measurements, which makes them unsuitable for remote detection of corrosion degradation.
LIBS is a powerful technique for rapid, real-time elemental analysis of a wide range of materials,
from metal and gemmological samples to chemical and biological agents. It has been extensively
used for the identification of minerals and rocks, which include iron oxides92. With regard to
corrosion, LIBS has been essentially applied to the study of oxidation layers on archaeological
artefacts95. It enables depth profiling of the corrosion layers by “drilling” through materials via laser
ablation.
Although LIBS is commonly used for production control and quality assurance in metal industries
and has been demonstrated to provide qualitative and quantitative information on corrosion
products in archaeological sciences, there is nearly no report of application of LIBS as a test and
evaluation method for corrosion degradation.
Figure 1 Illustration of a laser-induced breakdown spectroscopy setup
20 Spectroscopic techniques for corrosion detection using drones
2.8 X-ray spectroscopy X-ray spectroscopy is an elemental analysis technique, which includes several distinct methods
employing X-radiation, such as X-ray absorption spectroscopy (XAS), X-ray emission
spectroscopy (XES) and X-ray diffraction (XRD).
X-ray spectroscopy methods rely on the excitation or ejection of core electrons in a material by
high-energy X-ray photons. This process involves the absorption of all (X-ray absorption) or part
(X-ray Raman scattering) of the X-ray photon energy. The resulting unstable excited state relaxes
by releasing energy in the form of an X-ray photon (X-ray fluorescence) or an Auger electron. The
excitation and relaxation energies depend on the electronic structure of the material and thus
constitute a fingerprint of the material.
XRD provides information on the atomic and molecular structure of crystalline materials by
observing the interference patterns resulting from the elastic scattering of X-rays on crystal
planes.
Technically, XAS is more demanding than XES and XRD as it requires a tuneable X-ray source,
which is usually a synchrotron radiation source. There are currently no available portable
synchrotron radiation sources, which prevents the application of XAS in the field. In comparison,
XES and XRD typically uses high-energy X-ray beams generated by X-ray tubes, which can be
implemented into compact instruments.
From the detection side, XRD employs gas or semiconductor X-ray detectors but also mechanical
adjustment of the angle of the incident X-ray beam onto the sample and of the angle of detection
of diffracted X-ray radiations having a direct influence onto the mechanical feasibility for
integrating the measurement technology onto a drone. Furthermore XRD usually requires sample
preparation by grinding a small amount of material into a powder, thus do not apply for non-
destructive remote sensing. These technical limitations have prevented the development of
handheld XRD instrument but portable XRD instruments of the size of a small briefcase and
weighting less than 15 kg have been developed for field measurements96.
Concerning XES, handheld instruments based on X-ray fluorescence (XRF) are commercially
available and enable qualitative and semi-quantitative measurements of the elemental
composition of a wide range of materials for applications in mining, metal and alloy industries, art
conservation, jewellery, etc. XRF detection requires the use of an energy-dispersive X-ray (EDX)
spectrometer or a wavelength-dispersive X-ray (WDX) spectrometer. The former counts the X-
ray photons according to their energy and the later to their wavelength. WDX spectrometers
provide a finer spectral resolution than EDX spectrometers but require longer acquisition times
as they employ a scanning monochromator for separating photons at different wavelengths and
acquiring a spectrum. Therefore, most handheld XRF instruments are built with EDX
spectrometers.
Sarrazin et al. have demonstrated a portable XRD-XRF instrument requiring no sample
preparation for non-invasive and non-contact study of art objects97. Originally designed for the
analysis of the chemistry and mineralogy of Martian soil98, Sarrazin and co-workers developed
the technology further for the in-field use for geology and for the non-contact analysis of artwork.
Due to the powder diffraction method the instrument still requires near-contact operation and is
limited to the study of finely grained materials such as dyes in paints. The non-contact XRD-XRF
instrument was commercialized by inXitu but is no more available since Olympus bought the
company99. The portable XRD-XRF instrument for in-field measurements is still available from
Olympus under the name TERRA Portable XRD. According to the manufacturer, the instrument
is capable of identifying and quantifying the different corrosion products by characterizing their
crystallographic structure100.

Spectroscopic techniques for corrosion detection using drones 21
Handheld XRF instruments are used in the inspection of piping systems for preventing sulfidic
corrosion101. In this application, XRF analyses the content of silicon in carbon steel, which
indicates the risk of sulfidation corrosion. In general, XRF can detect corrosion indicative elements
in metal alloys, such as Si, Cr, Ni, and Cu, but cannot identify the corrosion products themselves.
Corrosion detection can also be performed by X-ray inspection (XRI), which is based on
projectional X-ray radiography where a beam of high-energy photons is sent through the object
under inspection and collected on the other side of the object. The loss of photons through the
object depends on the density of its constituent materials, thus the obtained radiography image
indicates density variations which may be attributed to corrosion, welds, wet insulation, etc. XRI
enables imaging through insulation and paint layers but requires access to two opposite sides of
the inspected object, thus it is essentially used for inspection of metal pipes with an insulating
layer.
Finally yet importantly, care must be taken when using X-ray radiations, as they can be harmful
and legal restrictions apply. X-ray instruments may require heavy shielding which limits their
applicability on a drone platform. All these aspects make X-ray spectroscopy either impossible or
at least unfavourable to realize on a drone depending on the specific method used.
3. Evaluation and conclusion
Many different methods have been investigated for detecting and evaluating corrosion
degradation but few have so far reached or have the potential to reach a stage of development
sufficient for being deployed efficiently on drones.
Methods such as THz spectroscopy and microwave imaging are promising for the detection of
corrosion damages under paints and coatings but measurement constraints, like short probe-
target distance and position stability, prevent their practical deployment on a drone. On the other
hand, simple and fast imaging methods with a RGB, hyperspectral or multispectral camera, are
easily applicable with drones but are limited to the analysis of the surface of the samples, and
thus cannot be applied to the early detection of corrosion under paints and coatings, or inside
concrete structures. Nevertheless, they are promising tools when combined with advanced data
analysis methods involving machine learning algorithms. In theory, a computer trained with
sufficient data and provided with enough information should provide a more objective rating of
surface deterioration from camera images than a human inspector could.
Figure 2 (Left) Illustration of the XRF principle102. (Right) Example of an XRF spectrum103.

22 Spectroscopic techniques for corrosion detection using drones
Measurement methods like Raman spectroscopy, FTIR spectroscopy, dispersive IR spectroscopy
and LIBS reveal chemically specific information about the sample, which enables the identification
of corrosion products and their differentiation from coatings and paints. Furthermore, the
technology itself allows for detection across distances of several meters. As promising as it
sounds, these methods however face important practical limitations due to their poor imaging
capabilities over large surface areas. Moreover, Raman spectroscopy applied to the identification
of corrosion products requires single-point acquisition times of several minutes, which are too
long for drone deployment.
Among the most promising techniques for corrosion degradation detection on drones figure
multispectral imaging and infrared thermography. One of their major advantages is that both
methods are already commonly used for drone applications. However, the two techniques have
different imaging capabilities. Multispectral imaging enables coarse material identification by
measuring the reflectance spectra of surfaces, whereas infrared thermography can image through
a few centimetres inside the sample and detect hidden defects but cannot identify corrosion
products. In order to enlarge the range of applications for infrared thermography with drones, it
would be advantageous to develop active thermography system for drone deployment, which has
not been done before to our knowledge.
Method Corrosion degradation
sensing capability
Drone
compatibility
(payload)
Drone
compatibility
(technical)
Overall
rating
Microwave
spectroscopy
Good
Sensitive to swelling and
blistering.
Coarse material
differentiation
capabilities by spectral
imaging.
Can image through a
few centimetres of
paints, coatings and
concrete.
Good
Microwave radar
systems have
been deployed on
drones for
geomatic surveys.
Poor
Short sensing
distance.
Probe positioning
requirements do
not match noisy
drone
environment.
Poor
THz
spectroscopy
Good
Sensitive to swelling and
blistering, roughness
and probably to oxide
products. Can image
through a few
centimetres of paints,
coatings and concrete.
Good
Demonstrated with
a gas
measurement
system deployed
on a drone.
Poor
Short sensing
distance.
Probe positioning
requirements do
not match noisy
drone
environment.
Poor
Infrared
thermography
Good
Sensitive to swelling and
blistering.
Coarse material
differentiation
capabilities.
Fair
Passive
thermography
instruments have
already been
deployed on
drones.
Fair
Large field of view
imaging but lower
resolution than
conventional
cameras.
Good
Spectroscopic techniques for corrosion detection using drones 23
Can image through a
few centimetres of
paints, coatings and
concrete.
Active
thermography
uses heating
sources that may
drain the drone
battery.
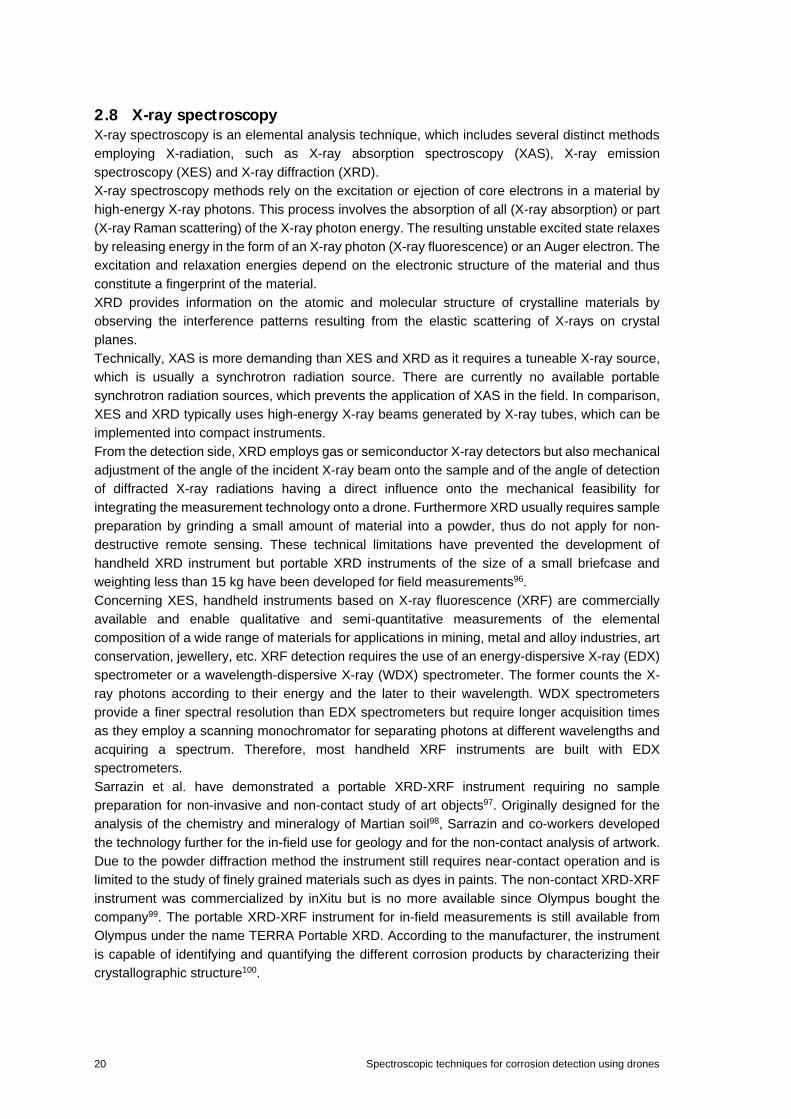
FTIR Fair
Measure molecular
composition, can identify
corrosion products.
Slightly higher sensitivity
to corrosion products
than Raman
spectroscopy.
Limited to surface
detection, cannot image
through materials.
Poor
No handheld
commercial
systems available.
Sturdy mount to
hold
interferometer
stable is needed.
Fair
Point sensing
operation limits
imaging of large
surface areas.
Poor
IR
spectroscopy
Fair
Measure molecular
composition, can identify
corrosion products.
Slightly higher sensitivity
to corrosion products
than Raman
spectroscopy.
Can image through
specific coatings.
Good
Commercially
available compact
handheld
spectrometers.
Fair
Point sensing
operation limits
imaging of large
surface areas.
Fair
VIS-NIR
spectroscopy
Fair
Similar to camera
techniques. Specificity to
corrosion products is
limited by the lack of
characteristic absorption
and emission lines in
iron oxides.
Good
Commercially
available compact
handheld
spectrometers.
Fair
Point sensing
operation limits
imaging of large
surface areas.
Fair
RGB camera Fair
Low specificity to
corrosion products.
Require human
inspector or machine
learning methods for
differentiating corrosion
damages.
Limited to surface
detection, cannot image
through materials.
Excellent
Standard sensor
on almost all
drones.
Excellent
Large field of view
imaging and
cheap.
Fair

24 Spectroscopic techniques for corrosion detection using drones
Multispectral
camera
Fair
Similar to RGB camera
with slightly higher
specificity to corrosion
products.
Excellent
Commercially
available
multispectral
imaging system
for drone
deployment
Excellent
Similar to RGB
camera but more
expensive.
Good
Hyperspectral
camera
Fair
Similar to multispectral
camera. Specificity to
corrosion products is
limited by the lack of
characteristic absorption
and emission lines in
iron oxides.
Excellent
Commercially
available
multispectral
imaging system
for drone
deployment
Good
Large amount of
data necessitates
high-capacity
storage onboard
or fast
communication to
ground.
Fair
Raman
spectroscopy
Poor
Measure molecular
composition, can identify
corrosion products.
Low sensitivity to
corrosion products.
Limited to surface
detection, cannot image
through materials.
Good
Commercially
available compact
handheld Raman
spectrometers
Poor
Long acquisition
times (several
minutes).
Restrictive safety
regulations over
unshielded high
power laser light.
Poor
Laser-induced
breakdown
spectroscopy
(LIBS)
Fair
Measure elemental
composition, can identify
corrosion products.
Enable depth profiling of
corrosion layers by laser
ablation through
materials.
Good
A compact LIBS
system has been
deployed on the
Mars rover
Curiosity
Fair
Point sensing
operation limits
imaging of large
surface areas.
Restrictive safety
regulations over
unshielded laser
light.
Fair
X-ray
spectroscopy
Good
XRF can measure
elemental composition,
and XRD can identify
corrosion products.
Both are limited to
surface detection and
cannot image through
materials.
XRI can image through
materials and detect
hidden defects.
Fair
Handheld XRF
and portable XRD
and XRI systems
commercially
available.
Poor
(Near-) contact
and point sensing
operation of XRF
and XRD.
Restrictive safety
regulations over
unshielded X-ray
radiations.
Poor
Table 2 Overview of the discussed techniques and their performance and viability.

Spectroscopic techniques for corrosion detection using drones 25
4. Bibliography
1. Koch G, Varney J, Thompson N, Moghissi O, Gould M, P. J. International Measures of
Prevention, Application, and Economics of Corrosion Technologies Study. (NACE
International, 2016).
2. Bygnings- og Boligministeriet Transport. Bekendtgørelse om flyvning med droner i
bymæssigt område. BEK nr 1256 (2017).
3. Bygnings- og Boligministeriet Transport. Bekendtgørelse om flyvning med droner uden
for bymæssigt område. BEK nr 788 (2017).
4. DJI. Datasheet DJI Matice 600. (2017).
5. Eva-Carina Nørskov, Jesper Villadsen, Niels Berg Conradsen, S. Y. S. Kortlægning af
droner i Danmark. Teknol. Inst. (2016).
6. Hald, J. RK Dronemetrologi. Bedreinnovation.dk (2017).
7. DJI. Datasheet A3 flight control system. (2017).
8. DJI. Datasheet Ronin-M. (2017).
9. A.W.Momber. Quantitative performance assessment of corrosion protection systems for
offshore wind power transmission platforms. Renew. Energy 94, (2016).
10. EN ISO 4628-3:2016. Paint. Varn. Degrad. coatings—Designation Quant. size defects,
intensity Unif. Chang. Appear. Part 3 Assess. degree rusting 1, (2016).
11. ASTM. ASTM D 610. ASTM D 610- SSPC Vis 2 (2001).
12. D’imprimerie, C. E. des associations de fabricants de peintures et d’éncres. ‘European
scale of degree of rusting for anticorrosive paints’. (1964).
13. GL, D. Corrosion protection of ship. DNVGL-CG-0288 (2017).
14. Kharkovsky, S., Ryley, A. C., Stephen, V. & Zoughi, R. Dual-Polarized Near-Field
Microwave Reflectometer for Noninvasive Inspection of Carbon Fiber Reinforced
Polymer-Strengthened Structures. IEEE Trans. Instrum. Meas. 57, 168–175 (2008).
15. Miszczyk, A. & Darowicki, K. Inspection of protective linings using microwave
spectroscopy combined with chemometric methods. Corros. Sci. 64, 234–242 (2012).
16. Kharkovsky, S. & Zoughi, R. Microwave and millimeter wave nondestructive testing and
evaluation - Overview and recent advances. IEEE Instrum. Meas. Mag. 10, 26–38
(2007).
17. Li, C., Tofighi, M.-R., Schreurs, D. & Horng, J. T.-S. Principles and Applications of
RF/Microwave in Healthcare and Biosensing. (2016).
18. Sheen, D. M., McMakin, D. L. & Hall, T. E. Three-dimensional millimeter-wave imaging
for concealed weapon detection. IEEE Trans. Microw. Theory Tech. 49, 1581–1592
(2001).
19. Kharkovsky, S. et al. Application of microwave 3D SAR imaging technique for evaluation
of corrosion in steel rebars embedded in cement-based structures. in AIP Conference
Proceedings 1516–1523 (2012). doi:10.1063/1.4716395
20. Hong Zhang, Y. H. et al. Evaluation of Atmospheric Corrosion on Coated Steel Using K -
Band Sweep Frequency Microwave Imaging. IEEE Sens. J. 16, (2016).
21. Ghasr, M. T., Carroll, B., Kharkovsky, S., Austin, R. & Zoughi, R. Millimeter-Wave
Differential Probe for Nondestructive Detection of Corrosion Precursor Pitting. IEEE
Trans. Instrum. Meas. 55, 1620–1627 (2006).
22. ITU-R. Objective quality coverage assessment of digital terrestrial television
broadcasting signals of Systems A and B. BT Ser. Broadcast. Serv. (2012).
23. Ahi, K. & Anwar, M. Advanced terahertz techniques for quality control and counterfeit
detection. in Proc. SPIE 9856 Terahertz Physics, Devices, and Systems X: Advanced
Applications in Industry and Defense (eds. Anwar, M. F., Crowe, T. W. & Manzur, T.)
98560G (2016). doi:10.1117/12.2228684
24. Broadband Frequency Tripler Operational Manual. Virginia Diodes, Man. (2016).
25. Terahertz Technologies Lasers, Accessories and Solutions. Toptica Photonics,
Datasheet (2017).
26 Spectroscopic techniques for corrosion detection using drones
26. Williams, G. P. High-power terahertz synchrotron sources. Philos. Trans. R. Soc. A
Math. Phys. Eng. Sci. 362, 403–414 (2004).
27. Tan, P., Huang, J., Liu, K., Xiong, Y. & Fan, M. Terahertz radiation sources based on
free electron lasers and their applications. Sci. China Inf. Sci. 55, 1–15 (2012).
28. Idehara, T. & Sabchevski, S. P. Gyrotrons for High-Power Terahertz Science and
Technology at FIR UF. J. Infrared, Millimeter, Terahertz Waves 38, 62–86 (2017).
29. He, W. et al. Generation of broadband terahertz radiation using a backward wave
oscillator and pseudospark-sourced electron beam. Appl. Phys. Lett. 107, 133501
(2015).
30. Rizzi, B. J., Hesler, J. L., Dossal, H. & Crowe, T. W. Varactor diodes for millimeter and
submillimeter wavelengths. in Michigan Univ., The Third International Symposium on
Space Terahertz Technology: Symposium Proceedings (1992).
31. Kitagawa, S., Suzuki, S. & Asada, M. Wide-Range Varactor-Tuned Terahertz Oscillator
Using Resonant Tunneling Diode. J. Infrared, Millimeter, Terahertz Waves 35, 445–450
(2014).
32. Klatt, G. et al. Terahertz emission from lateral photo-Dember currents. Opt. Express 18,
4939 (2010).
33. Köhler, R. et al. Terahertz semiconductor-heterostructure laser. Nature 417, 156–159
(2002).
34. Scalari, G. et al. THz and sub-THz quantum cascade lasers. Laser Photonics Rev. 3,
45–66 (2009).
35. Lee, A. W. M. et al. Real-time terahertz imaging over a standoff distance (> 25 meters).
Appl. Phys. Lett. 89, 141125 (2006).
36. Fathololoumi, S. et al. Terahertz quantum cascade lasers operating up to ∼ 200 K with
optimized oscillator strength and improved injection tunneling. Opt. Express 20, 3866
(2012).
37. Pagies, A., Ducournau, G. & Lampin, J.-F. Low-threshold terahertz molecular laser
optically pumped by a quantum cascade laser. APL Photonics 1, 31302 (2016).
38. Ramakrishnan, G. Enhanced terahertz emission from thin film semiconductor/metal
interfaces. (TU Delft, 2012).
39. Kawano, Y. & Ishibashi, K. An on-chip near-field terahertz probe and detector. Nat.
Photonics 2, 618–621 (2008).
40. Anastasi, R. F. Terahertz NDE for Under Paint Corrosion Detection and Evaluation. in
AIP Conference Proceedings 820, 515–522 (AIP, 2006).
41. Madaras, E. I. et al. Application of terahertz radiation to the detection of corrosion under
the shuttle’s thermal protection system. in AIP Conference Proceedings 975, 421–428
(AIP, 2008).
42. Kurabayashi, T., Yodokawa, S. & Kosaka, S. Terahertz imaging through paint layers. in
37th International Conference on Infrared, Millimeter, and Terahertz Waves 1–2 (IEEE,
2012). doi:10.1109/IRMMW-THz.2012.6380425
43. Anastasi, R. F. & Madaras, E. I. Terahertz NDE for metallic surface roughness
evaluation. in Proc. SPIE 6176, Nondestructive Evaluation and Health Monitoring of
Aerospace Materials, Composites, and Civil Infrastructure V, 61760O (2006).
doi:10.1117/12.659463
44. Plusquellic, D. F., Provenzano, V. & Chou, S. G. THz Spectroscopic Study of Iron Oxide
Layers within Steel-Reinforced Structural Components. MRS Proc. 1296, mrsf10-1319-
o03-10 (2011).
45. Chou, S. G. et al. Using Terahertz Waves to Identify the Presence of Goethite via
Antiferromagnetic Resonance. Appl Magn Reson (2017).
46. Shin G. Chou, Paul E. Stutzman, Shuangzhen Wang, Edward J. Garboczi, William F.
Egelhoff, and D. F. P. High-Resolution Terahertz Optical Absorption Study of the
Antiferromagnetic Resonance Transition in Hematite (α-Fe2O3). J. Phys. Chem. C
(2012). doi:10.1021/jp3036567
47. The Thz Drone Project. Bakman Technologies (2017). Available at:
http://www.bakmantechnologies.com/THz-drone-project.php.

Spectroscopic techniques for corrosion detection using drones 27
48. Vollmer, M. & Möllmann, K.-P. Infrared Thermal Imaging: Fundamentals, Research and
Applications. (Wiley-VCH Verlag GmbH & Co. KGaA, 2010).
doi:10.1002/9783527630868
49. Rogalski, A., Martyniuk, P. & Kopytko, M. Challenges of small-pixel infrared detectors: a
review. Reports Prog. Phys. 79, 46501 (2016).
50. Venkataraman, B. & Raj, B. Performance parameters for thermal imaging systems.
Insight - Non-Destructive Test. Cond. Monit. 45, 531–535 (2003).
51. Jönsson, M., Rendahl, B. & Annergren, I. The use of infrared thermography in the
corrosion science area. Mater. Corros. 61, 961–965 (2010).
52. Bison, P., Ceseri, M. & Inglese, G. Mapping corrosion of metallic slab by thermography.
J. Phys. Conf. Ser. 214, 12073 (2010).
53. Schönberger, A., Virtanen, S., Giese, V., Schröttner, H. & Spießberger, C. Non-
destructive detection of corrosion applied to steel and galvanized steel coated with
organic paints by the pulsed phase thermography. Mater. Corros. 63, 195–199 (2012).
54. Foudazi, A., Ghasr, M. T. & Donnell, K. M. Characterization of Corroded Reinforced
Steel Bars by Active Microwave Thermography. IEEE Trans. Instrum. Meas. 64, 2583–
2585 (2015).
55. Lahiri, B. B., Bagavathiappan, S., Jayakumar, T. & Philip, J. Medical applications of
infrared thermography: A review. Infrared Phys. Technol. 55, 221–235 (2012).
56. Bagavathiappan, S., Lahiri, B. B., Saravanan, T., Philip, J. & Jayakumar, T. Infrared
thermography for condition monitoring – A review. Infrared Phys. Technol. 60, 35–55
(2013).
57. Nasrazadani, S. & Raman, A. The application of infrared spectroscopy to the study of
rust systems—II. Study of cation deficiency in magnetite (Fe3O4) produced during its
transformation to maghemite (γ-Fe2O3) and hematite (α-Fe2O3). Corros. Sci. 34, 1355–
1365 (1993).
58. Raman, A., Kuban, B. & Razvan, A. The application of infrared spectroscopy to the study
of atmospheric rust systems—I. Standard spectra and illustrative applications to identify
rust phases in natural atmospheric corrosion products. Corros. Sci. 32, 1295–1306
(1991).
59. Misawa, T., Asami, K., Hashimoto, K. & Shimodaira, S. The mechanism of atmospheric
rusting and the protective amorphous rust on low alloy steel. Corros. Sci. 14, 279–289
(1974).
60. Zeylikovich, I. et al. Mid-IR transmission window for corrosion detection beneath paint.
Electron. Lett. 39, 39 (2003).
61. Robert R. Alfano, Iosif Zeylikovich, Wubao Wang, Jamal Ali, Vincent Benischek, Y. B.
Systems and methods for non-destructively detecting material abnormalities beneath a
coated surface US 6853926 B2. (2005).
62. Final Report Summary - CUPID (Innovative Non-Destructive Corrosion Under Paint
Integrated Detection System). LTD, Insp. Technol. United Kingdom
63. Magana, D., Parul, D., Brian Dyer, R., And Shreve, A. P. Implementation of Time-
Resolved Step-Scan Fourier Transform Infrared (FT-IR) Spectroscopy Using a kHz
Repetition Rate Pump Laser. Appl Spectrosc. 65, 535 (2011).
64. VERTEX Series FT-IR Spectrometer. Bruker Optics (2017). Available at:
https://www.bruker.com/fileadmin/user_upload/8-PDF-Docs/OpticalSpectrospcopy/FT-
IR/VERTEX/Flyers/VERTEXSerie_Flyer_EN.pdf.
65. Anderson, M. S. et al. Fourier transform infrared spectroscopy for Mars science. Rev.
Sci. Instrum. 76, (2005).
66. Drag, K. & Lovre, M. Corrosion Investigation of Printing Machines By FT-IR
Spectroscopy. Anal. korozije Tisk. strojeva FT-IR Spektrosk. Metod. 19, 899–906 (2012).
67. Namduri H., N. S. Quantitative analysis of iron oxides using Fourier transform infrared
spectrophotometry. Corros. Sci. 50, 2493 (2008).
68. Prati, S., Joseph, E., Sciutto, G. & Mazzeo, R. New advances in the application of FTIR
microscopy and spectroscopy for the characterization of artistic materials. Acc. Chem.
Res. 43, 792–801 (2010).

28 Spectroscopic techniques for corrosion detection using drones
69. Kendix, E and Prati, Silvia and Mazzeo, Rocco and Joseph, Edith and Sciutto, Giorgia
and Fagnano, C. Far infrared spectroscopy in the field of cultural heritage. Preserv. Sci.
7, 8--13 (2010).
70. Vegetation monitoring in Groningen. T&A Survey Group B.V. Available at: http://www.ta-
survey.nl/page.php?id=314&lang=EN.
71. Bruker. Application Note AN #91 HI 90 - Hyperspectral Imaging System. Bruker Opt.
(2011).
72. Natalia Leone, Mariano Mercurio, Eleonora Grilli, Antonio P. Leone, Alessio Langella, A.
B. Potential of vis-NIR reflectance spectroscopy for the mineralogical characterization of
synthetic gleys: a preliminary investigation. Period. di Mineral. 80, 433–453 (2011).
73. Torrent, J. & Barrón, V. in Encyclopedia of surface and Colloid Science 1 1438–1446
(2002).
74. Scheinost, A. C., Chavernas, A., Barrón, V., & Torrent, J. Use and limitations of second-
derivative diffuse reflectance spectroscopy in the visible to near-infrared range to identify
and quantify Fe oxides in soils. Clays Clay Miner. 46, 528–536 (1998).
75. Waite, D. M. S. and T. D. Electronic spectra of Fe3+ oxides and oxide hydroxides in the
near IR to near UV. Am. Mineral. (1985).
76. Fernandez, R. N. & Schulze, D. G. Munsell Colors of Soils Simulated by Mixtures of
Goethite and Hematite with Kaolinite. Zeitschrift für Pflanzenernährung und Bodenkd.
155, 473–478 (1992).
77. Barron, V. & Torrent, J. Use of the Kubelka-Munk theory to study the influence of iron
oxides on soil colour. J. Soil Sci. 37, 499–510 (1986).
78. Jepson, W. B. Structural iron in kaolinites and in associated ancillary minerals. Iron soils
clay Miner. 467–583 (1988).
79. Momma, E. et al. Rust classification using image analysis of steel structures. in 2008 3rd
International Conference on Sensing Technology 409–413 (IEEE, 2008).
doi:10.1109/ICSENST.2008.4757137
80. Petricca, L., Moss, T., Figueroa, G. & Broen, S. Corrosion Detection Using A.I : A
Comparison of Standard Computer Vision Techniques and Deep Learning Model. in
Computer Science & Information Technology ( CS & IT ) 91–99 (Academy & Industry
Research Collaboration Center (AIRCC), 2016). doi:10.5121/csit.2016.60608
81. Huynh, C. P., Mustapha, S., Runcie, P. & Porikli, F. Multi-class support vector machines
for paint condition assessment on the Sydney Harbour Bridge using hyperspectral
imaging. Struct. Monit. Maint. 2, 181–197 (2015).
82. Practical Raman Spectroscopy. (Springer Berlin Heidelberg, 1989). doi:10.1007/978-3-
642-74040-4
83. Bertolucci, H. and. Symmetry and spectroscopy: an introduction to vibrational and
electronic spectroscopy. (Courier Corporation, 1989).
84. Shebanova, O. N. & Lazor, P. Raman study of magnetite (Fe3O4): laser-induced thermal
effects and oxidation. J. Raman Spectrosc. 34, 845–852 (2003).
85. Morcillo, M. et al. SEM/Micro-Raman Characterization of the Morphologies of Marine
Atmospheric Corrosion Products Formed on Mild Steel. J. Electrochem. Soc. 163,
C426–C439 (2016).
86. Hanesch, M. Raman spectroscopy of iron oxides and (oxy)hydroxides at low laser power
and possible applications in environmental magnetic studies. Geophys. J. Int. 177, 941–
948 (2009).
87. Nieuwoudt, M. K., Comins, J. D. & Cukrowski, I. The growth of the passive film on iron in
0.05 M NaOH studied in situ by Raman micro-spectroscopy and electrochemical
polarisation. Part I: near-resonance enhancement of the Raman spectra of iron oxide
and oxyhydroxide compounds. J. Raman Spectrosc. 42, 1335–1339 (2011).
88. Strommen, D. P. & Nakamoto, K. Resonance raman spectroscopy. J. Chem. Educ. 54,
474 (1977).
89. Martin, T. P., Merlin, R., Huffman, D. R. & Cardona, M. Resonant two magnon Raman
scattering in α-Fe2O3. Solid State Commun. 22, 565–567 (1977).
90. Winkler, J. Titanium dioxide. (Vincentz Network, 2003).
Spectroscopic techniques for corrosion detection using drones 29
91. Hardcastle, F. D., Ishihara, H., Sharma, R. & Biris, A. S. Photoelectroactivity and Raman
spectroscopy of anodized titania (TiO2) photoactive water-splitting catalysts as a
function of oxygen-annealing temperature. J. Mater. Chem. 21, 6337 (2011).
92. Senesi, G. S. Laser-Induced Breakdown Spectroscopy (LIBS) applied to terrestrial and
extraterrestrial analogue geomaterials with emphasis to minerals and rocks. Earth-
Science Rev. 139, 231–267 (2014).
93. Rohwetter, P. et al. Filament-induced remote surface ablation for long range laser-
induced breakdown spectroscopy operation. Spectrochim. Acta Part B At. Spectrosc. 60,
1025–1033 (2005).
94. Wiens, R. C. et al. The ChemCam Instrument Suite on the Mars Science Laboratory
(MSL) Rover: Body Unit and Combined System Tests. Space Sci. Rev. 170, 167–227
(2012).
95. Elhassan, A. Short Review Of Laser-Induced Breakdown Spectroscopy For Corrosion
Diagnostic. in AIP Conference Proceedings 1380, 65–69 (2011).
96. Olympus scientific solutions Americas. Terra X-ray diffraction and x-ray fluorescence
analyzer (User’s manual). (2014).
97. Chiari, G., Sarrazin, P. & Gailhanou, M. A portable non-invasive XRD-XRF instrument for
the study of art objects. in Denver X-Ray Conference. JCPDS-International Centre for
Diffraction Data USA 23, 175–186 (2008).
98. Sarrazin, P. et al. Field deployment of a portable X-ray diffraction/X-ray flourescence
instrument on Mars analog terrain. Powder Diffr. 20, 128–133 (2005).
99. NASA Technology. Mineral Analyzer Shakes Answers Out of Soil and Rocks. Available
at: https://spinoff.nasa.gov/Spinoff2017/ee_6.html.
100. Scaling and Corrosion Residue Identification with X-ray Diffraction. Olympus Corporation
(2017). Available at: https://www.olympus-ims.com/en/applications/scaling-and-
corrosion-residue-identification-with-x-ray-diffraction/.
101. Nummi, E. Analysis of silicon in steel using the Thermo Scientific Niton XL5 analyzer to
prevent sulfidic corrosion failures. Thermo Sci. Appl. Note (2016).
102. Calvero. Schematic representation of X-ray fluorescence. (2006). Available at:
https://en.wikipedia.org/wiki/File:X-ray_fluorescence_simple_figure.svg.
103. Wikipedia, L. at E. File:XRFScan.jpg. (2009). Available at:
https://en.wikipedia.org/wiki/File:XRFScan.jpg.
5. Acknowledgements
DFM A/S acknowledges funding from the Danish Agency for Institutions and Educational Grants
as part of the result contract “Dronemetrologi”, from the EU regional fund for regional
development and the region of southern Denmark (Syddansk Vækstforum).