speech quality assessment - university of texas at...
TRANSCRIPT

W. Lin et al. (Eds.): Multimedia Analysis, Processing & Communications, SCI 346, pp. 623–654. springerlink.com © Springer-Verlag Berlin Heidelberg 2011
Speech Quality Assessment
Philipos C. Loizou
University of Texas-Dallas, Department of Electrical Engineering, Richardson, TX, USA
Abstract. This chapter provides an overview of the various methods and tech-niques used for assessment of speech quality. A summary is given of some of the most commonly used listening tests designed to obtain reliable ratings of the qual-ity of processed speech from human listeners. Considerations for conducting suc-cessful subjective listening tests are given along with cautions that need to be exercised. While the listening tests are considered the gold standard in terms of as-sessment of speech quality, they can be costly and time consuming. For that reason, much research effort has been placed on devising objective measures that correlate highly with subjective rating scores. An overview of some of the most commonly used objective measures is provided along with a discussion on how well they correlate with subjective listening tests.
The rapid increase in usage of speech processing algorithms in multi-media and telecommunications applications raises the need for speech quality evaluation. Accurate and reliable assessment of speech quality is thus becoming vital for the satisfaction of the end-user or customer of the deployed speech processing sys-tems (e.g., cell phone, speech synthesis system, etc.).
Assessment of speech quality can be done using subjective listening tests or us-ing objective quality measures. Subjective evaluation involves comparisons of original and processed speech signals by a group of listeners who are asked to rate the quality of speech along a pre-determined scale. Objective evaluation involves a mathematical comparison of the original and processed speech signals. Objec-tive measures quantify quality by measuring the numerical “distance” between the original and processed signals. Clearly, for the objective measure to be valid, it needs to correlate well with subjective listening tests, and for that reason, much research has been focused on developing objective measures that modeled various aspects of the auditory system. This Chapter provides an overview of the various subjective and objective measures proposed in the literature [1] [2, Ch. 10] for as-sessing the quality of processed speech.
Quality is only one of many attributes of the speech signal. Intelligibility is a different attribute and the two are not equivalent. For that reason, different as-sessment methods are used to evaluate quality and intelligibility of processed speech. Quality is highly subjective in nature and it is difficult to evaluate reliably. This is partly because individual listeners have different internal standards of what constitutes “good” or “poor” quality, resulting in large variability in rating scores

624 P.C. Loizou
among listeners. Quality measures assess “how” a speaker produces an utterance, and includes attributes such as “natural”, “raspy”, “hoarse”, “scratchy”, and so on. Quality is known to possess many dimensions, encompassing many attributes of the processed signal such as “naturalness”, “clarity”, “pleasantness”, “brightness”, etc. For practical purposes we typically restrict ourselves to only a few dimensions of speech quality depending on the application. Intelligibility measures assess “what” the speaker said, i.e., the meaning or the content of the spoken words. In brief, speech quality and speech intelligibility are not synonymous terms, hence different methods need to be used to assess the quality and intelligibility of proc-essed speech.
The present Chapter focuses on assessment of speech quality, as affected by distortions introduced by speech codecs, background noise, noise-suppression al-gorithms and packet loss in telecommunication systems.
1 Factors Influencing Speech Quality
There is a host of factors that can influence speech quality. These factors depend largely on the application at hand and can affect to some degree listening and talk-ing difficulty. In telecommunication applications, for instance, degradation factors that can cause a decrease in speech quality and subsequently increase listening dif-ficulty include distortions due to speech codecs, packet loss, speech clipping and listener echo [3]. The distortions alone introduced by speech codecs vary widely depending on the coding rate [1, Ch. 4]. The distortions introduced, for instance, by waveform coders (e.g., ADPCM) operating at high bit rates (e.g., 16 kbps) dif-fer from those introduced by linear-predictive based coders (e.g., CELP) operating at relatively lower bit rates (4-8 kbps).
The distortions introduced by hearing aids include peak and center clipping, Automatic Gain Control (AGC), and output limiting. The AGC circuit itself intro-duces non-linear distortions dictated primarily by the values of attack and release time constants. Finally, the distortions introduced by the majority of speech-enhancement algorithms depend on the background noise and the suppression function used (note that some enhancement algorithms can not be expressed in terms of a suppression function). The choice of the suppression function can affect both the background noise and speech signal itself, leading to background and speech distortions. The suppression function of spectral-subtractive type of algo-rithms, for instance, is known to introduce “musical noise” distortion [4].
In summary, there are many factors influencing speech quality and the source of those factors depends on the application. Hence, caution needs to be exercised when choosing subjective or objective measures to evaluate speech quality.
2 Subjective Listening Tests
Several methods for evaluating speech quality have been proposed in the literature [1]. These methods can be broadly classified into two categories: those that are based on relative preference tasks and those that are based on assigning a

Speech Quality Assessment 625
numerical value on the quality of the speech stimuli, i.e., based on quality ratings. In the relative preference tests, listeners are presented with a pair of speech stimuli consisting of the test stimuli and the reference stimuli. The reference stimuli are typically constructed by degrading the original speech signal in a systematic fash-ion, either by filtering or by adding noise. Listeners are asked to select the stimuli they prefer the most. In the rating tests, listeners are presented with the test speech stimuli and asked to rate the quality of the stimuli on a numerical scale, typically a 5-point scale with one indicating poor quality and a five indicating excellent qual-ity. No reference stimuli are needed in the rating tests. As we will see next, these tests have their strengths and weaknesses, and in practice, the best test might de-pend on the application at hand. In the following sections, we describe in more de-tail the relative preference and quality rating tests which can be used to assess the quality of degraded speech.
2.1 Relative Preference Methods
Perhaps the simplest form of paired comparison test is the forced-choice paired comparison test. In this test, listeners are presented with pairs of signals produced by systems A and B, and asked to indicate which of the two signals they prefer. The same signal is processed by both systems A and B. Results are reported in terms of percent of time system A is preferred over system B. Such a method is typically used when interested in evaluating the preference of system A over other systems. The main drawback of this simple method is that it is not easy to com-pare the performance of system A with the performance of other systems obtained in other labs.
While the above AB preference test tells us whether system A is preferred over system B, it does not tell us by how much. That is, the magnitude of the difference in preference is not quantified. The comparison category rating (CCR) test is de-signed to quantify the magnitude of the preference difference on a 4-point scale with the rating of 0 indicating no difference, 1 indicating small difference, 2 indi-cating a large difference and 3 indicating a very large difference. Table 1 shows the category ratings [5,6]. This scale is also referred to as the comparison mean opinion score (CMOS). Positive and negative numbers are used to account for both directions of preference.
2.2 Absolute Category Rating Methods
Preference tests typically answer the question: “How well does an average listener like a particular test signal over another signal or over a reference signal which can be easily reproduced?” Listeners must choose between two sequentially pre-sented signals, but do not need to indicate the magnitude of their preference (except in the CCR test, Table 1) or the reason(s) for their decision. In some appli-cations, however, knowing the reason why a particular signal is preferred over an-other is more important that the preference score itself. Another shortcoming of
626 P.C. Loizou
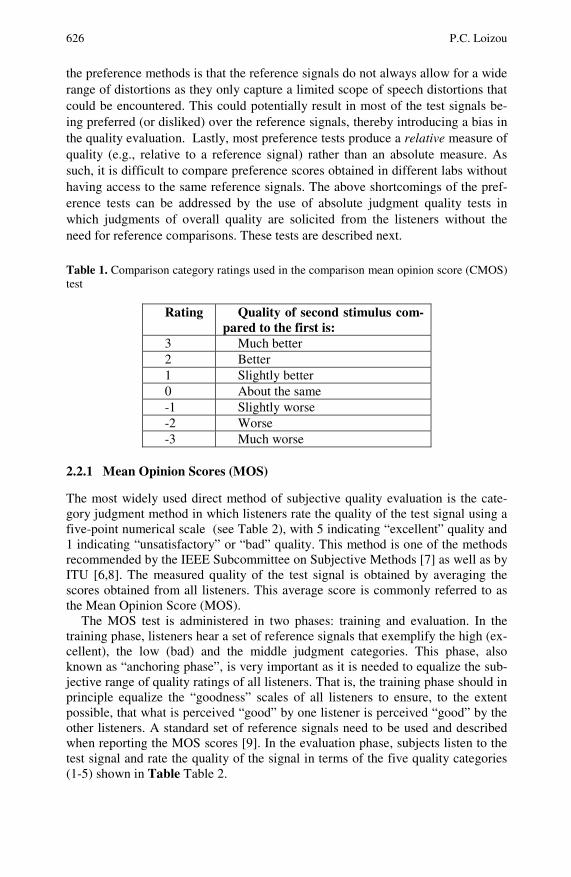
the preference methods is that the reference signals do not always allow for a wide range of distortions as they only capture a limited scope of speech distortions that could be encountered. This could potentially result in most of the test signals be-ing preferred (or disliked) over the reference signals, thereby introducing a bias in the quality evaluation. Lastly, most preference tests produce a relative measure of quality (e.g., relative to a reference signal) rather than an absolute measure. As such, it is difficult to compare preference scores obtained in different labs without having access to the same reference signals. The above shortcomings of the pref-erence tests can be addressed by the use of absolute judgment quality tests in which judgments of overall quality are solicited from the listeners without the need for reference comparisons. These tests are described next.
Table 1. Comparison category ratings used in the comparison mean opinion score (CMOS) test
Rating Quality of second stimulus com-pared to the first is:
3 Much better 2 Better 1 Slightly better 0 About the same -1 Slightly worse -2 Worse -3 Much worse
2.2.1 Mean Opinion Scores (MOS)
The most widely used direct method of subjective quality evaluation is the cate-gory judgment method in which listeners rate the quality of the test signal using a five-point numerical scale (see Table 2), with 5 indicating “excellent” quality and 1 indicating “unsatisfactory” or “bad” quality. This method is one of the methods recommended by the IEEE Subcommittee on Subjective Methods [7] as well as by ITU [6,8]. The measured quality of the test signal is obtained by averaging the scores obtained from all listeners. This average score is commonly referred to as the Mean Opinion Score (MOS).
The MOS test is administered in two phases: training and evaluation. In the training phase, listeners hear a set of reference signals that exemplify the high (ex-cellent), the low (bad) and the middle judgment categories. This phase, also known as “anchoring phase”, is very important as it is needed to equalize the sub-jective range of quality ratings of all listeners. That is, the training phase should in principle equalize the “goodness” scales of all listeners to ensure, to the extent possible, that what is perceived “good” by one listener is perceived “good” by the other listeners. A standard set of reference signals need to be used and described when reporting the MOS scores [9]. In the evaluation phase, subjects listen to the test signal and rate the quality of the signal in terms of the five quality categories (1-5) shown in Table Table 2.

Speech Quality Assessment 627
Table 2. MOS rating scale
Rating Speech quality Level of distortion 5 Excellent Imperceptible 4 Good Just perceptible, but not annoying 3 Fair Perceptible and slightly annoying 2 Poor Annoying, but not objectionable 1 Bad Very annoying and objectionable
Detailed guidelines and recommendations for administering the MOS test can
be found in the ITU-R BS.562-3 standard [6] and include:
1. Selection of listening crew: Different number of listeners is recom-mended depending on whether the listeners had extensive experience in assessing sound quality. Minimum number of non-expert listeners should be 20 and minimum number of expert listeners should be 10. The listeners need to be native speakers of the language of the speech materials tested, and should not have any hearing impairments.
2. Test procedure and duration: Speech material (original and de-graded) should be presented in random order to subjects, and the test session should not last more than 20 minutes without interruption. This step is necessary to reduce listening fatigue.
3. Choice of reproduction device: Headphones are recommended over loudspeakers, since headphone reproduction is independent of the geometric and acoustic properties of the test room. If loudspeakers are used, the dimensions and reverberation time of the room need to be re-ported.
Further guidelines pertaining the choice of speech input levels, noise and reference conditions, etc. for proper evaluation of the quality of narrow- and wide-band speech codecs can be found in the ITU standard [5] as well as in [10].
Reference signals can be used to better facilitate comparisons between MOS tests conducted at different times, different laboratories and different languages [11]. MOS scores can be obtained, for instance, using different Modulated Noise Reference Unit (MNRU) reference signals1 for various values of Q (S/N) ranging from 5 to 35 [5,11]. A plot of MOS scores as a function of Q can be constructed to transform the raw MOS scores to an equivalent Q value. The Q equivalent values can then be used to compare performance among systems in different labs.
The MOS test is based on a five-category rating of the speech quality (Table 2). The quality scale is in a way quantized into five discrete steps, one for each cate-gory. Listeners are therefore forced to describe the complex impressions of speech
1 The MNRU reference signals are generated by adding to the input signal random noise
with amplitude proportional to the instantaneous signal amplitude as follows: /20( ) ( ) 1 10 ( )Qr n x n d n−= +⎡ ⎤
⎢ ⎥⎣ ⎦ where x(n) is the input speech signal, d(n) is the random
noise and Q is the desired SNR.

628 P.C. Loizou
quality in terms of the five categories. It is implicitly assumed that these five steps (categories) are uniformly spaced, i.e., that they equidistant from each other. This assumption, however, might not be true, in general. For these reasons, some have suggested modifying the above test to ask the listeners to evaluate the test signals in terms of real numbers from 0 to 10, where zero indicates “bad” quality and 10 indicates “excellent” quality [12]. In this test, no quantization of the quality scale is done since the listeners are allowed to use fractions between integers, if they so desire.
A variant of the MOS test that addresses to some degree the low resolution is-sue stated above, is the degradation mean opinion score (DMOS) test [13]. In this test, the listeners are presented with both the unprocessed signal (which is used as a reference) and the processed signal. Listeners are asked to rate the perceived degradation of the processed signal relative to the unprocessed signal on a 5-point scale (Table 3). This test is suitable for situations in which the signal degradations or impairments are small.
Table 3. Degradation rating scales
Rating Degradation 1 Very annoying 2 Annoying 3 Slightly annoying 4 Audible but not annoying 5 Inaudible
2.2.2 Diagnostic Acceptability Measure
The absolute category judgment method (e.g., MOS test) is based on ratings of the overall quality of the test speech signal. These ratings, however, do not convey any information about the listeners’ bases for judgment of quality. Two different listeners, for instance, may base their ratings on different attributes of the signal, and still give identical overall quality rating. Similarly, a listener might give the same rating for two signals produced by two different algorithms, but base his judgments on different attributes of each signal. In brief, the MOS score alone does not tell us which attribute of the signal affected the rating. The MOS test is therefore considered to be a single-dimensional approach to quality evaluation, and as such it can not be used as a diagnostic tool to improve the quality of speech enhancement or speech coding algorithms.
A multi-dimensional approach to quality evaluation was proposed by Voiers [14] based on the Diagnostic Acceptability Measure (DAM). The DAM test evaluates the speech quality on three different scales classified as parametric, metametric and isometric [1,15]. These three scales yield a total of 16 measure-ments on speech quality covering several attributes of the signal and background. The metametric and isometric scales represent the conventional category judgment approach where speech is rated relative to “intelligibility”, “pleasantness” and “acceptability”. The parametric scale provides fine-grained measurements of the signal and background distortions. Listeners are asked to rate the signal distortion

Speech Quality Assessment 629
on six different dimensions and the background distortion on four dimensions. Listeners are asked for instance to rate on a scale of 0 to 100 how muffled or how nasal the signal sounds ignoring any other signal or background distortions pre-sent. Listeners are also asked to rate separately on a scale of 0 to 100 the amount of hissing, buzzing, chirping or rumbling present in the background. The compos-ite acceptability measure summarizes all the information gathered from all the scales into a single number, and is computed as a weighted average of the individ-ual scales.
The parametric portion of the DAM test relies on the listeners’ ability to detect, perhaps more reliably, specific distortions present in the signal or in the back-ground rather than providing preference judgments of these distortions. It there-fore relies on the assumption that people tend to agree better on what they hear rather than on how well they like it [15]. To borrow an example from daily life, it is easier to get people to agree on the color of a car than how much they like it. As argued in [15], the parametric approach tends to give more accurate – more reli-able – scores of speech quality as it avoids the individual listener’s “taste” or pref-erence for specific attributes of the signal from entering the subjective quality evaluation.
Compared to the MOS test, the DAM test is time consuming and requires care-fully trained listeners. Prior to each listening session, listeners are asked to rate two “anchor” and four “probe” signals. The “anchors” consist of examples of high and low quality speech and give the listeners a frame of reference. The “probes” are used to detect any coincidental errors which may affect the results in a particular session. In addition to the presentation of “anchors” and “probes”, lis-teners are selected on the basis that they give consistent ratings over time and have a moderately high correlation to the listening crew’s historical average rating [1]. The selected listeners are calibrated prior to the testing session so as to determine their own subjective origin or reference relative to the historical average listener’s ratings.
2.2.3 The ITU-T P.835 Standard for Evaluating Noise-Suppression Algorithms
The above subjective listening tests (DAM and MOS) were designed primarily for the evaluation of speech coders. The speech coders, however, are evaluated mainly in quiet and generally introduce different types of distortion than those en-countered in noise suppression algorithms. Speech enhancement algorithms typi-cally degrade the speech signal component while suppressing the background noise, particularly in low SNR conditions. That is, while the background noise may be suppressed, and in some cases rendered inaudible, the speech signal may get degraded in the process. This situation complicates the subjective evaluation of speech enhancement algorithms since it is not clear as to whether listeners base their overall quality judgments on the signal distortion component, noise distortion component or both. This uncertainty regarding the different weight individual lis-teners place on the signal and noise distortion components introduces additional error variance in the subjects’ ratings of overall quality resulting and consequently decreases the reliability of the ratings. These concerns were addressed by the
630 P.C. Loizou
ITU-T standard (P. 835) [16] that was designed to lead the listeners to integrate the effects of both signal and background distortion in making their ratings of overall quality.
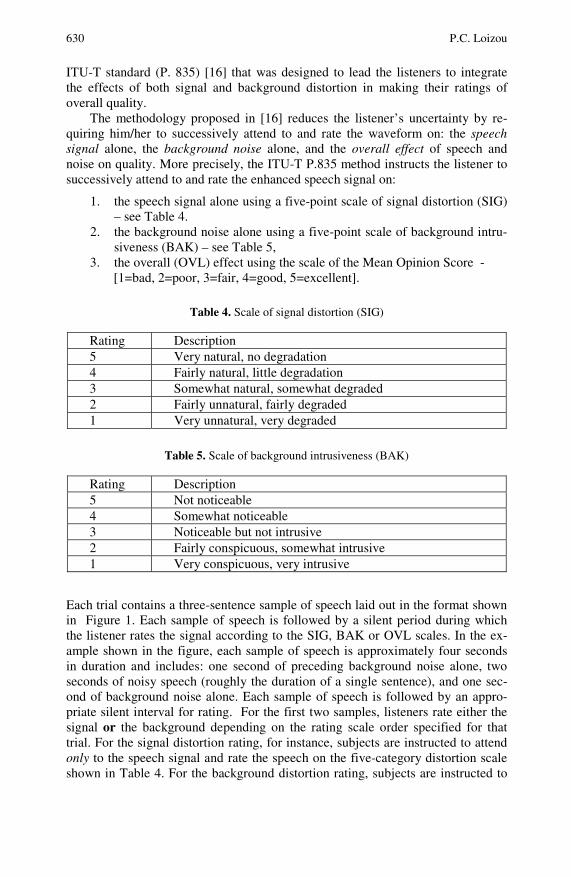
The methodology proposed in [16] reduces the listener’s uncertainty by re-quiring him/her to successively attend to and rate the waveform on: the speech signal alone, the background noise alone, and the overall effect of speech and noise on quality. More precisely, the ITU-T P.835 method instructs the listener to successively attend to and rate the enhanced speech signal on:
1. the speech signal alone using a five-point scale of signal distortion (SIG) – see Table 4.
2. the background noise alone using a five-point scale of background intru-siveness (BAK) – see Table 5,
3. the overall (OVL) effect using the scale of the Mean Opinion Score - [1=bad, 2=poor, 3=fair, 4=good, 5=excellent].
Table 4. Scale of signal distortion (SIG)
Rating Description 5 Very natural, no degradation 4 Fairly natural, little degradation 3 Somewhat natural, somewhat degraded 2 Fairly unnatural, fairly degraded 1 Very unnatural, very degraded
Table 5. Scale of background intrusiveness (BAK)
Rating Description 5 Not noticeable 4 Somewhat noticeable 3 Noticeable but not intrusive 2 Fairly conspicuous, somewhat intrusive 1 Very conspicuous, very intrusive
Each trial contains a three-sentence sample of speech laid out in the format shown in Figure 1. Each sample of speech is followed by a silent period during which the listener rates the signal according to the SIG, BAK or OVL scales. In the ex-ample shown in the figure, each sample of speech is approximately four seconds in duration and includes: one second of preceding background noise alone, two seconds of noisy speech (roughly the duration of a single sentence), and one sec-ond of background noise alone. Each sample of speech is followed by an appro-priate silent interval for rating. For the first two samples, listeners rate either the signal or the background depending on the rating scale order specified for that trial. For the signal distortion rating, for instance, subjects are instructed to attend only to the speech signal and rate the speech on the five-category distortion scale shown in Table 4. For the background distortion rating, subjects are instructed to

Speech Quality Assessment 631
attend only to the background and rate the background on the five-category intru-siveness scale shown in Table 5. Finally, for the third sample in each trial, subjects are instructed to listen to the noisy speech signal and rate it on the five-category overall quality scale used in MOS tests (Table 2). To control for the effects of rat-ing scale order, the order of the rating scales needs to be balanced. That is, the scale order should be “Signal, Background, Overall Effect” for half of the trials, and “Background, Signal, Overall Effect” for the other half. The ITU-T P.835 standard was used in [17] to evaluate and compare the performance of 13 different speech enhancement algorithms.
Fig. 1. Stimulus presentation format for the listening tests conducted according to the ITU-T P.835 standard
2.3 Considerations in Subjective Listening Tests
2.3.1 Evaluating the Reliability of Quality Judgments: Recommended Practice
In the above subjective tests, listeners rate the quality of the processed speech on a 5-point discrete scale (MOS test) or on a 0-100 continuous scale (DAM test). For the ratings to be meaningful, however, listeners must use the scales consistently. A given listener must rate a specific speech sample the same way every time he or she hears it. That is, we would like the intra-rater reliability of quality judgments to be high. Listeners need, in other words, to be self-consistent in their assessment of quality. Various statistics have been used to evaluate intra-rater reliability [18,19]. The two most common statistics are the Pearson’s correlation coefficient between the first and second ratings, and the test-retest percent agreement.
Additionally, all listeners must rate a given speech sample in a similar way. We would thus like the inter-rater reliability of quality judgments to be high. A num-ber of inter-rater reliability measures have been used [18] and include among oth-ers the Cronbach’s alpha [20], Kendall’s coefficient of Concordance [21] and the intraclass correlation coefficient [22,23].
The measurements of intra- and inter-rater reliability are critically important as they indirectly indicate the confidence we place on the listeners’ (i.e., the raters) quality judgments. High values of inter-rater reliability, for instance, would sug-gest that another sample of listeners would produce the same mean rating score for the same speech material. In other words, high inter-rater reliability implies high reproducibility of results. In contrast, a low value of inter-rater reliability would suggest that the listeners were not consistent in their quality judgments.

632 P.C. Loizou
The efficacy of reliability measures has been studied extensively in behavioral sciences (see reviews in [19,24]) as well as in voice research where pathological voices are rated by clinicians in terms of breathiness or roughness [18,25,26]. More detailed description about the intra- and inter-rater reliability measures can be found in [2, Chap. 10].
2.3.2 Using Statistical Tests to Assess Significant Differences: Required Practice
After conducting subjective quality tests and collecting the ratings from all sub-jects, we often want to compare the performance of various algorithms. At the very least, we are interested in knowing whether a specific algorithm improves the speech quality over the baseline condition (i.e., un-processed speech). Consider for instance the MOS ratings scores obtained by 10 listeners in Table 6 when pre-sented with speech processed by different algorithms. The mean MOS score for speech processed by algorithm A was 3.24, and the mean rating score for speech processed by algorithm B was 3.76. For this example, can we safely say with con-fidence that algorithm B improved the subjective speech quality relative to algo-rithm A? The answer is no, as it depends largely on the inter-rater reliability of quality judgments or grossly on the variance of the rating scores. Consider the Ex-ample 2 in Table 6 contrasting the rating scores of speech processed by say two different algorithms, C and D. The mean rating scores are identical to those ob-tained by algorithms A and B, however, the variance of the rating scores is high, suggesting that the inter-rater reliability in Example 2 was low (i.e., subjects were not consistent with each other when making quality judgments). In brief, we can not reach a conclusion, based solely on the mean rating scores, as to which algo-rithm performs better without first performing the appropriate statistical test.
Table 6. Example MOS ratings of 10 listeners for speech processed by algorithms A-D
Example 1 Example 2 Subjects Alg. A Alg. B Alg. C Alg. D
1 3.10 3.60 1.80 1.80 2 3.20 3.70 2.60 1.50 3 3.50 4.00 3.50 4.00 4 3.30 3.80 4.50 4.90 5 3.40 3.90 2.50 3.70 6 3.20 3.70 3.50 3.90 7 3.50 4.00 4.10 4.50 8 3.10 3.60 4.60 5.00 9 3.00 3.50 2.10 4.60
10 3.10 3.80 3.20 3.70
Mean 3.24 3.76 3.24 3.76 Variance 0.03 0.03 0.96 1.46

Speech Quality Assessment 633
Statistical techniques [27, ch. 4] can be used to draw inferences about the means of two populations, which in our case correspond to the ratings of proc-essed and un-processed speech or more generally to ratings obtained using two different algorithms. The t-statistic can often be used to test two hypothesis, the null hypothesis that the means are equal, and the alternate hypothesis that the means are different. The computed value of t will determine if we will accept or reject the null hypotheses. If the value of t is found to be greater than a critical value (found in statistics tables), then we reject the null hypothesis and therefore conclude that the means of the two populations are different. For the example in Table 6, if t is found to be larger than the critical value, we conclude that there is a statistically significant difference in quality and that algorithm B produced better speech quality than algorithm A. If the value of t is found to be smaller than the critical value, then we accept the null hypothesis and conclude that the means of the two populations do not differ, i.e., performance (quality) of algorithm A is as good as performance of algorithm B. For the Example 1 in Table 6, t-tests re-vealed that the rating scores of algorithm B are significantly higher than the rat-ings of algorithm A, i.e., algorithm B performed better than algorithm A. For the Example 2 in Table 6, however, t-tests revealed non-significant differences be-tween the ratings of algorithms C and D. In other words, algorithm D did not im-prove speech quality relative to algorithm C. As the examples in Table 6 illustrate, we can not draw conclusions as to which algorithm improves quality based solely on the mean rating scores (the mean scores were identical in examples 1 and 2).
The above t-test applies only when we want to compare the means of two popu-lations. It is tempting to run pair-wise comparisons of the population means using multiple t-tests to answer the above questions. However, the probability of falsely rejecting at least one of the hypotheses increases as the number of t tests in-creases. That is, although we may set the probability of Type I error at the
0.05α = level for each individual test, the probability of falsely rejecting at least one of those tests might be much larger than 0.05. For the above reason, multiple pairwise comparisons are recommended with Bonferroni correction. The Bon-ferroni test is based on Student’s t statistic and adjusts the observed significance level based on the fact that multiple comparisons are made. This is simply done by multiplying the observed significance level by the number of comparisons made. Alternate statistical tests, including the analysis of variance, are described in [2, Ch. 10].
For the relative preference listening tests, one-sided t-tests need to be run to as-sess whether algorithm A is preferred over algorithm B beyond the chance level, which is 50%.
In summary, no reliable conclusions can be drawn based solely on the mean rating scores collected from subjective listening tests. The appropriate statistical test needs to be run to truly assess whether a particular algorithm improved (or not) speech quality.

634 P.C. Loizou
3 Objective Quality Measures
Subjective listening tests provide perhaps the most reliable method for assessment of speech quality. These tests, however, can be time consuming requiring in most cases access to trained listeners. For these reasons, several researchers have inves-tigated the possibility of devising objective, rather than subjective, measures of speech quality [1, ch. 2]. Ideally, the objective measure should be able to assess the quality of the processed speech without needing access to the original speech signal. The objective measure should incorporate knowledge from different levels of processing including low-level processing (e.g., psychoacoustics) and higher level processing such as prosodics, semantics, linguistics and pragmatics. The ideal measure should predict with high accuracy the results obtained from subjec-tive listening tests with normal-hearing listeners. In addition, it should take into account inherent differences between languages (e.g., Western languages vs. tonal languages) [28].
Much progress has been done in developing such an objective measure [1]. In fact, one such measure has been standardized [29]. Current objective measures are limited in that most require access to the original speech signal, and some can only model the low-level processing (e.g., masking effects) of the auditory system. Yet, despite these limitations some of these objective measures have been found to corre-late well with subjective listening tests (e.g., MOS scores). A different class of measures, known as non-intrusive measures, does not require access to the original signal. Figure 2 shows how the conventional (also referred to as intrusive) measures and the non-intrusive measures are computed. This Chapter will focus primarily on the intrusive measures, as those measures have been studied the most. A brief intro-duction and literature review on non-intrusive measures will also be given.
System tobe tested
Non-intrusiveEvaluation
IntrusiveEvaluation
Predicted quality
Inputsignal
Degradedsignal
Fig. 2. Computation of intrusive and non-intrusive objective measures
Most objective measures of speech quality are implemented by first segmenting the speech signal into 10-30 ms frames, and then computing a distortion measure between the original and processed signals. A single, global measure of speech distortion is computed by averaging the distortion measures of each speech frame. More sophisticated objective measures [30,31] deviate from the above short-time frame-processing framework and also involve a time-delay estimation block for aligning the two signals prior to the distortion measure computation. As we will see shortly, the distortion measure computation can be done either in the time

Speech Quality Assessment 635
domain (e.g., signal-to-noise ratio measures) or in the frequency domain (e.g., LPC spectral distance measures). For the frequency-domain measures, it is as-sumed that any distortions or differences detected in the magnitude spectra are correlated with speech quality. Note that the distortion measures are not distance measures in the strict sense, as they do not obey all properties of a distance metric. For one, these measures are not necessarily symmetric and some (e.g., log spectral distance measure) yield negative values. Psychoacoustic experiments [32] suggest that the distance measures should not be symmetric [33].
A large number of objective measures has been evaluated, particularly for speech coding [1] and speech enhancement [34] applications. Reviews of ob-jective measures can be found in [35-38]. Next, we focus on a subset of those measures.
3.1 Time and Frequency Signal-to-Noise Ratio Measures
The segmental signal-to-noise ratio can be evaluated either in the time or fre-quency domain. The time-domain measure is perhaps one of the simplest objective measures used to evaluate speech enhancement or speech coding algorithms. For this measure to be meaningful it is important that the original and processed sig-nals be aligned in time and that any phase errors present be corrected. The seg-mental signal-to-noise (SNRseg) is defined as:
12
1
10 120
( )10
SNRseg= logˆ( ( ) ( ))
Nm N
Mn Nm
Nm Nm
n Nm
x n
Mx n x n
+ −
−=
+ −=
=
−
∑∑
∑
(1)
where ( )x n is the original (clean) signal, ˆ( )x n is the enhanced signal, N is the
frame length (typically chosen to be 15-20 msecs), and M is the number of frames in the signal.
One potential problem with the estimation of SNRseg is that the signal energy during intervals of silence in the speech signal (which are abundant in conversa-tional speech) will be very small resulting in large negative SNRseg values, which will bias the overall measure. One way to remedy this is to exclude the silent frames from the sum in Eq. (1) by comparing short-time energy measurements against a threshold or by flooring the SNRseg values to a small value. In [39], the SNRseg values were limited in the range of [-10 dB, 35 dB] thereby avoiding the need for a speech/silence detector.
The segmental SNR can be extended in the frequency domain to produce the frequency-weighted segmental SNR (fwSNRseg) [40]:
2
10 211
0
1
( , )log
ˆ( ( , ) ( , ))10fwSNRseg
K
jMj
Km
jj
F m jB
F m j F m j
MB
−=
=
=
⎡ ⎤⎢ ⎥−⎣ ⎦=
∑∑
∑
(2)

636 P.C. Loizou
where jB is the weight placed on the j th frequency band, K is the number of
bands, M is the total number of frames in the signal, ( , )F m j is the filter-bank am-
plitude (excitation spectrum) of the clean signal in the j th frequency band at the
mth frame, and ˆ ( , )F m j is the filter-bank amplitude of the enhanced signal in the
same band. The main advantage in using the frequency-based segmental SNR over the time-domain SNRseg (Eq. (1)) is the added flexibility to place different weights for different frequency bands of the spectrum. There is also the flexibility in choos-ing perceptually-motivated frequency spacing such as critical-band spacing.
Various forms of weighting functions jB were suggested in [1,40]. One possi-
bility is to choose the weights jB based on articulation index studies [41]. Such
an approach was suggested in [1] with the summation in Eq. (2) taken over 16 ar-ticulation bands spanning the telephone bandwidth (300-3400 Hz).
3.2 Spectral Distance Measures Based on LPC
Several objective measures were proposed based on the dissimilarity between all-pole models of the clean and enhanced speech signals [1]. These measures assume that over short-time intervals speech can be represented by a pth order all-pole model of the form:
1
( ) ( ) ( ) ( )p
x xi
x n a i x n i G u n=
= − +∑
(3)
where ( )xa i are the coefficients of the all-pole filter (determined using linear pre-
diction techniques), xG is the filter gain and ( )u n is a unit variance white noise
excitation. Perhaps two of the most common all-pole based measures used to evaluate speech-enhancement algorithms are the log likelihood ratio and Itakura-Saito measures. Cepstral distance measures derived from the LPC coefficients were also used.
The log-likelihood ratio (LLR) measure is defined as:
ˆ ˆˆ( , ) log
Tx x x
LLR x x Tx x x
d =a R a
a aa R a
(4)
where Txa are the LPC coefficients of the clean signal, ˆ
Txa are the coefficients of
the enhanced signal, and xR is the ( 1) ( 1)p p+ × + autocorrelation matrix (Toe-
plitz) of the clean signal. This measure penalizes differences in formant peak lo-cations.
The Itakura-Saito (IS) measure is defined as follows:
ˆ ˆ ˆˆ
ˆ
( , ) log 1T
x x x x xIS x x T
x xx x x
G Gd
G G
⎛ ⎞= + −⎜ ⎟
⎝ ⎠
a R aa a
a R a (5)

Speech Quality Assessment 637
where xG and x̂G are the all-pole gains of the clean and enhanced signals respec-
tively. Note that unlike the LLR measure, the IS measure penalizes differences in all-pole gains, i.e., differences in overall spectral levels of the clean and enhanced signals. This can be considered as a drawback of the IS measure, since psycho-acoustic studies [42] have shown that differences in spectral level have minimal effect on quality.
A gain-normalized spectral distortion (SD) measure is often used to assess the quality of coded speech spectra. The SD measure evaluates the similarity of the LPC spectra of the clean and processed signals [3,33]. The LPC coefficients can also be used to derive a distance measure based on cepstrum coefficients. This distance provides an estimate of the log spectral dis-tance between two spectra. The cepstrum coefficients can be obtained recursively from the LPC coefficients { }ja using the following expression [43, p. 442]:
1
1
( ) ( ) 1m
m m kk
kc m a c k a m p
m
−
−=
= + ≤ ≤∑
(6)
where p is the order of the LPC analysis (Eq. (3)). A measure based on cepstrum coefficients can be computed as follows [44]:
[ ]2
ˆ ˆ1
10( , ) 2 ( ) ( )
log 10
p
cep x x x xke
d c k c k=
= −∑c c
(7)
where ( )xc k and ˆ ( )xc k are the cepstrum coefficients of the clean and enhanced
signals respectively.
3.3 Perceptually-Motivated Measures
The above objective measures are attractive in that they are simple to implement and easy to evaluate. However, their ability to predict subjective quality is limited as they do not closely emulate the signal processing involved at the auditory pe-riphery. For one, the normal-hearing frequency selectivity as well as the perceived loudness were not explicitly modeled or incorporated in the measures. Much re-search [42,45-50] has been done to develop objective measures based on models of human auditory speech perception, and in this section we describe some of these perceptually-motivated measures.
3.3.1 Bark Distortion Measures
Much progress has been made on modeling several stages of the auditory process-ing, based on existing knowledge from psychoacoustics about how human listen-ers process tones and bands of noise [51, ch. 3]. Specifically, these new objective measures take into account the fact that:

638 P.C. Loizou
1. The ear’s frequency resolution is not uniform, i.e., the frequency analysis of acoustic signals is not based on a linear frequency scale. This can be modeled by pre-processing the signal through a bank of bandpass filters with center frequencies and bandwidths increasing with frequency. These filters have come be known in the psychoacoustics literature as critical-band filters and the corresponding frequency spac-ing as critical-band spacing.
2. Loudness is related to signal intensity in a nonlinear fashion. This takes into account the fact that the perceived loudness varies with frequency [52,53].
One such measure that takes the above into account is the Bark distortion measure (BSD). The BSD measure for frame k is based on the difference between the loudness spectra and is computed as follows:
2
1
( ) ( ) ( )bN
k kb
BSD k S b S b=
⎡ ⎤= −⎣ ⎦∑
(8)
where ( ) and ( )k kS b S b are the loudness spectra of the clean and enhanced signals
respectively and bN is the number of critical bands. The mean BSD measure is
finally computed by averaging the frame BSD measures across the sentence. Ex-periments in [46] indicated that the BSD measure yields large values for the low-energy (unvoiced) segments of speech. This problem can be avoided by excluding the low-energy segments of speech from the BSD computation using a voiced/unvoiced detector. Improvements to the BSD measure were reported in [47,54,55] leading to the modified BSD measure (MBSD). Experiments in [46,47] indicated that both BSD and MBSD measures yielded a high correlation ( 0.9ρ > )
with MOS scores. Further improvements to the MBSD measure were proposed in [54,56].
3.3.2 Perceptual Evaluation of Speech Quality (PESQ) Measure
Most of the above objective measures have been found to be suitable for assessing only a limited range of distortions which do not include distortions commonly en-countered when speech goes through telecommunication networks. Packet loss, for instance, signal delays and codec distortions would cause most objective measures to produce inaccurate predictions of speech quality. A number of objec-tive measures were proposed in the 1990s focusing on this type of distortions as well as filtering effects and variable signal delays [31,57,58].
A competition was held in 2000 by the ITU-T study group 12 to select a new objective measure capable of performing reliably across a wide range of codec and network conditions. The perceptual evaluation of speech quality (PESQ) measure,

Speech Quality Assessment 639
described in [30], was selected as the ITU-T recommendation P.862 [29] replacing the old P.861 recommendation [59]. The latter recommendation proposed a quality assessment algorithm called perceptual speech quality measure (PSQM). The scope of PSQM is limited to assessing distortions introduced by higher-bit speech codecs operating over error-free channels.
The structure of the PESQ measure is shown in Figure 3. The original (clean) and degraded signals are first level equalized to a standard listening level, and fil-tered by a filter with response similar to a standard telephone handset. The signals are aligned in time to correct for time delays, and then processed through an audi-tory transform, similar to that of BSD, to obtain the loudness spectra. The absolute difference between the degraded and original loudness spectra is used as a meas-ure of audible error in the next stage of PESQ computation. Note that unlike most objective measures (e.g., the BSD measure) which treat positive and negative loudness differences the same (by squaring the difference), the PESQ measure treats these differences differently. This is because positive and negative loudness differences affect the perceived quality differently. A positive difference would indicate that a component, such as noise, has been added to the spectrum, while a negative difference would indicate that a spectral component has been omitted or heavily attenuated. Compared to additive components, the omitted components are not as easily perceived due to masking effects, leading to a less objectionable form of distortion. Consequently, different weights are applied to positive and negative differences. The differences, termed the disturbances, between the loudness spec-tra is computed and averaged over time and frequency to produce the prediction of subjective MOS score. The final PESQ score is computed as a linear combination of the average disturbance value symd and the average asymmetrical disturbance value asymd as follows:
0 1 2sym asymPESQ a a d a d= + ⋅ + ⋅ (9)
where 0 1 2
4.5, 0.1 and 0.0309a a a= = − = − . The range of the PESQ score is –0.5 to 4.5, although for most cases the output range will be a MOS-like score, i.e., a score be-tween 1.0 and 4.5. High correlations (ρ > 0.92) with subjective listening tests were reported in [30] using the above PESQ measure for a large number of testing con-ditions taken from mobile, fixed and voice over IP (VoIP) applications. The PESQ can be used reliably to predict the subjective speech quality of codecs (waveform and CELP-type coders) in situations where there are transmission channel errors, packet loss or varying delays in the signal. It should be noted that the PESQ meas-ure does not provide a comprehensive evaluation of telephone transmission qual-ity, as it only reflects the effects of one-way speech or noise distortion perceived by the end-user. Effects such as loudness loss, sidetone and talker echo are not re-flected in the PESQ scores. More details regarding the PESQ computation can be found in [2, Ch. 10].

640 P.C. Loizou
Reference signal
Pre-processing
Time Alignment
Auditorytransform
Disturbanceprocessing
Time averaging
Auditorytransform
Identifybad
intervals
PESQ
Pre-processing
Systemunder test
Degradedsignal
Fig. 3. Block diagram of the PESQ measure computation
3.4 Composite Measures
In addition to the above measures, one can form the so called composite measures [1, Ch. 9] by combining multiple objective measures. The rational behind the use of composite measures is that different objective measures capture different char-acteristics of the distorted signal, and therefore combining them in a linear or non-linear fashion can potentially yield significant gains in correlations. Regression analysis can be used to compute the optimum combination of objective measures for maximum correlation. One possibility is to use the following linear regression model:
01
( )i i
P
j ij ij
y f
x
ε
α α ε=
= +
= + +∑
x
(10)
where ( )f x is the mapping function presumed to be linear, P is the number of
objective measures involved, 1{ }Ni iy = are the dependent variables corresponding to
the subjective ratings of N samples of degraded speech, ijx is the independent
(predictor) variable corresponding to the jth objective measure computed for the ith observation (degraded sample or condition), and iε is a random error associ-
ated with each observation. The regression coefficients iα can be estimated to
provide the best fit with the data using a least-squares approach [1, p. 184]. The P objective measures considered in (10) may include, among other measures, the LPC-based measures (e.g., IS, LLR), segmental SNR measures (e.g., SNRseg) or the PESQ measure. The selection of objective measures to include in the compos-ite measure is not straightforward and in some cases it is based solely on experi-mental evidence (trial and error) and intuition. Ideally, we would like to include

Speech Quality Assessment 641
objective measures that capture complementary information about the underlying distortions present in the degraded signal.
A linear function ( )f x was assumed in (10) for mapping P objective measures
to the observed subjective ratings, 1{ }Ni iy = . Such a model is accurate only when the
true form of the underlying function is linear. If it is not, then the modeling error will likely be large and the fit will be poor. Non-parametric models which make no assumptions about the form of the mapping function can alternatively be used. More specifically, models based on multivariate adaptive regression splines (MARS) have been found to yield better performance for arbitrary data sets [60]. Unlike linear and polynomial regression analysis, the MARS modeling technique is data driven and derives the functional form from the data. The basic idea of the MARS modeling technique is to recursively partition the domain into smaller sub-regions and use spline functions to locally fit the data in each region. The number of splines used in each sub-region is automatically determined from the data. The MARS model has the following form:
01
( )M
i j j ij
y Bα α ε=
= + +∑ x
(11)
where ( )jB x are the basis functions and M is the number of basis functions
which are automatically determined from the data (note that M could be larger than the number of objective measures). The MARS technique has been success-fully applied to speech quality evaluation in [34,61]. Radial basis functions were used in [49,50] for ( )jB x . Good correlations were obtained in [50] in terms of
predicting the quality of noise-suppressed speech. While the composite measures always improve the correlation, caution needs to
be exercised in as far using these measures with test speech materials and distor-tions other than the ones that have been validated. The reason for this is that the composite measures need to be cross-validated with conditions not included in the training stage, hence they will perform the best when tested with the same speech materials containing processed speech with similar distortions.
3.5 Non-intrusive Objective Quality Measures
The above objective measures for evaluating speech quality are “intrusive” in na-ture as they require access to the input (clean) signal. These measures predict speech quality by estimating the “distortion” between the input (clean) and output (processed) signals and then mapping the estimated “distortion” value to a quality metric. In some applications, however, the input (clean) signal is not readily available and therefore the above objective measures are not practical or useful. In VoIP applications, for instance, where we are interested in monitoring continu-ously the performance of telecommunication networks (in terms of speech

642 P.C. Loizou
quality), we only have access to the output signal. In such cases, a non-intrusive objective measure of speech quality would be highly desirable for continuous monitoring of quality of speech delivered to a customer or to a particular point in the network. Based on such quality assessment, network traffic can be routed, for instance, through less congested parts of the network and therefore improve the quality of service.
A fundamentally different approach is required to analyze a processed signal when the clean (reference) input signal is not available, and several non-intrusive measures have been proposed in the literature [61-67]. Some methods are based on comparing the output signal to an artificial reference signal derived from an appropriate codebook [65,66]. Other methods use vocal-tract models to identify distortions [63]. This latter method [63] first extracts a set of vocal-tract shape pa-rameters (e.g., area functions, cavity size) from the signal, and then evaluates these parameters for physical production violations, i.e., whether the parameters could have been generated by the human speech-production system. Distortions are identified when the vocal-tract parameters yield implausible shape and cavity sizes. A variant of the vocal-tract method was adopted as the ITU-T P.563 [68] standard for non-intrusive evaluation of speech quality. More information on non-intrusive methods can be found in [62].
3.6 Evaluation of Objective Quality Measures
So far we have not yet discussed what makes a certain objective measure better than other. Some objective measures are “optimized” for a particular type of dis-tortion and may not be meaningful for another type of distortion. The task of evaluating the validity of objective measures over a wide range of distortions is immense [1]. A suggested process to follow is to create a large database of speech distorted in various ways and evaluate the objective measure for each file in the database and for each type of distortion [1, ch 1]. At the same time, the distorted database needs to be evaluated by human listeners using one of the subjective lis-tening tests (e.g., MOS test) described above. Statistical analysis needs to be used to assess the correlation between subjective scores and the values of the objective measures. For the objective measure to be valid and useful, it needs to correlate well with subjective listening tests. A discussion is given next on how to assess the predictive power of objective measures followed by a presentation of some of the measures that have been found to correlate well with listening tests.
3.6.1 Figures of Merit
The correlation between subjective listening scores and objective measures can be obtained using the Pearson’s correlation coefficient which is computed as follows:
2 1/2 2 1/2
( )( )
[ ( ) ] [ ( ) ]d d d dd
d d d dd d
S S O O
S S O Oρ
− −=
− −∑
∑ ∑ (12)

Speech Quality Assessment 643
where dS are the subjective quality ratings, dO are the values of the objective
measure, and dS and dO are the mean values of dS and dO respectively. This
correlation coefficient ρ can be used to predict the subjective results based on the
values of the objectives measures as follows:
( )Pk k
O
P P O Oσρσ
= + −
(13)
where kO denotes the value of the objective measure obtained for the kth speech
file in the database, kP denotes the predicted subjective listening score, Pσ and
Oσ denote the standard deviations of the subjective and objective scores respec-
tively, P and O denote the mean values of the subjective and objective scores respectively. Note that Eq. (13) is based on first-order linear regression analysis assuming a single objective measurement. Higher order polynomial regression analysis could also be used if the objective measure is composed of multiple measurements [1, ch. 4.5].
A second figure-of-merit is an estimate of the standard deviation of the predic-tion error obtained by using the objective measures to predict the subjective listen-ing scores. This figure-of-merit is computed as:
21e Pσ σ ρ= − (14)
where eσ is the standard error of the estimate. The standard error of the estimate
of the subjective scores provides a measure of variability of the subjective scores about the regression line, averaged over all objective scores. For good predictabil-ity of the subjective scores, we would like the objective measure to yield a small value of eσ . Both figures of merit, i.e., correlation coefficient and standard error
of the estimate eσ , need to be reported when evaluating objective measures. In
some cases, histograms of the absolute residual errors, computed as the difference between the predicted and actual scores, can provide valuable information similar to that provided by eσ . Such histograms can provide a good view of how fre-
quently errors of different magnitudes occur. An alternative figure-of-merit to eσ is the root-mean-square error (RMSE) be-
tween the per condition averaged objective measure and subjective ratings com-puted over all conditions:
( )M
OSRMSE
M
iii∑
=
−= 1
2

644 P.C. Loizou
where iS indicates the averaged subjective score in ith condition, iO indicates the
averaged objective score in ith condition and M is the total number of conditions. The above analysis assumes that the objective and subjective scores are linearly
related (see Eq. (13)). This is not always the case, however, and in practice, it is not easy to uncover the best-fitting function or the true relationship between the objective and subjective measurements. Scatter plots of the rating scores vs. objective scores can provide valuable insights in terms of unveiling the relation-ship between the objective and subjective measurements. Some found a better fit with a quadratic relationship [44,46] while others found a good fit with a logistic function [69]. Kitawaki et al .[44], for instance, derived a quadratic expression for predicting MOS scores from cepstral distance measures for Japanese speech. Non-parametric regression techniques, such as the MARS technique [60] can alterna-tively be used to uncover the mapping function between (multiple) objective measures and subjective ratings (see Section 3.4).
3.6.2 Correlations of Objective Measures with Subjective Listening Tests
Objective measures need to be validated with ratings obtained in subjective listen-ing tests with human listeners. The choice of objective measures needs to be made carefully depending on the application, language and type of distortions present in the processed speech.
For distortions introduced by speech coders, for instance, the objective meas-ures investigated in [1] are appropriate. High correlations (ρ >0.9) were obtained primarily with composite and frequency-variant measures. The LPC-based meas-ures performed modestly well ( 0.62ρ < ). The SNRseg measure performed well, but only for distortions introduced by waveform speech coders (e.g., ADPCM). This suggests that the SNRseg measure is only appropriate for evaluating speech processed via waveform coders. For distortions, such as clipping, introduced by hearing aids the coherence-based measures reported in [70,71] are appropriate.
For distortions introduced by speech-enhancement algorithms, the objective measures discussed and evaluated in [34] are appropriate. These measures were evaluated using the publicly available noisy speech corpus (NOIZEUS2), which was used in a comprehensive subjective quality evaluation [72] of 13 different speech enhancement algorithms encompassing four different classes of algo-rithms: spectral subtractive, subspace, statistical-model based and Wiener-filtering type algorithms. The enhanced speech files were sent to Dynastat, Inc (Austin, TX) for subjective evaluation using the standardized methodology for evaluating noise suppression algorithms based on ITU-T P.835 [16]. The use of ITU-T P.835 methodology yielded three rating scores for each algorithm: an overall quality rat-ing, a signal distortion rating and a background distortion rating. A summary of the resulting correlations is given in Table 7 for a subset of the objective measures tested.
2 Available at: http://www.utdallas.edu/~loizou/speech/noizeus/

Speech Quality Assessment 645
Table 7. Estimated correlation coefficients ( | |ρ ) of objective measures with overall qual-
ity, signal distortion and background noise distortion [34]
Objective measure Overall quality
Signal distortion
Background distortion
SegSNR 0.36 0.22 0.56
Weighted spectral slope (WSS) [87]
0.64 0.59 0.62
PESQ 0.89 0.81 0.76
Log-likelihood ratio (LLR) 0.85 0.88 0.51
Itakura-Saito distance (IS) 0.60 0.73 0.09
Cepstrum distance (CEP) 0.79 0.84 0.41
fwSNRseg 0.85 0.87 0.59
Modified PESQ 0.92 0.89 0.76
In addition to several conventional objective measures (most of which were de-scribed in this Section), modifications to the PESQ measure were also considered in [34]. As it was not expected that the PESQ measure would correlate highly with all three rating scores (speech distortion, noise distortion and overall quality), the PESQ measure was optimized for each of the three rating scales by choosing a different set of parameters ( 0 1 2, ,a a a ) in Eq. (9) for each rating scale. Multiple lin-
ear regression analysis was used to determine the values of the parameters
0 1 2, ,a a a . Of the seven basic objective measures tested, the PESQ measure yielded
the highest correlation ( 0.89ρ = ) on overall quality, followed by the fwSNRseg
and LLR measures ( 0.85ρ = ). Even higher correlation with overall quality was
obtained with the modified PESQ measure ( 0.92ρ = ). The majority of the basic
objective measures predicted equally well signal distortion and overall quality, but not background distortion. This was not surprising given that most measures take into account both speech-active and speech-absent segments in their computation. Measures that would place more emphasis on the speech-absent segments would be more appropriate and likely more successful in predicting noise distortion. The SNRseg measure, which is widely used for evaluating the performance of speech enhancement algorithms, yielded a very poor correlation coefficient ( 0.31ρ = )
with overall quality. This outcome suggests that the SNRseg measure is unsuitable for evaluating the performance of enhancement algorithms.
In summary, the PESQ measure has proved to be the most reliable measure for assessing speech quality. Consistently high correlations were noted for speech processed by speech codecs and telephone networks [30] as well as for noisy

646 P.C. Loizou
speech processed by speech-enhancement algorithms [34]. High correlations were also obtained with the PESQ measure in Mandarin Chinese speech processed through various speech codecs [73]. Although not designed to predict speech intel-ligibility, the PESQ measure has also yielded a modestly high correlation ( 0.79ρ = ) with intelligibility scores [74], at least when tested with English
speech. Modifications of the PESQ measure for Mandarin Chinese were reported in [28]. High correlation with speech intelligibility was also obtained with the fwSNRseg measure (Eq. (2)).
4 Challenges and Future Directions in Objective Quality Evaluation
Presently, there is no single objective measure that correlates well with subjective listening evaluations for a wide range of speech distortions. Most measures have been validated for a specific type of distortion and for a specific language. Some measures correlate well with distortions introduced by speech coders while others (e.g., PESQ measure) correlate well with distortions introduced by telecommuni-cation networks and speech-enhancement algorithms. While the PESQ measure has been shown to be a robust objective measure, it is computationally demanding and requires access to the whole utterance. In some applications, this might not be acceptable. Ideally, the objective measure should predict the quality of speech in-dependent of the type of distortions introduced by the system whether be a net-work, a speech coder or a speech enhancement algorithm. This is extremely chal-lenging and would require a deeper understanding of the human perceptual processes involved in quality assessment.
For one, little is known as to how we should best integrate or somehow com-bine the frame computed distance measures to a single global distortion value. The simplest approach used in most objective measures is to compute the arithmetic mean of the distortions computed in each frame, i.e.,
1
0
1( , )
M
k kk
D dM
−
=
= ∑ x x
(15)
where M is the total number of frames, D denotes the global (aggregate) distor-tion, and ( , )k kd x x denotes the distance between the clean and processed signals
in the kth frame. This distance measure could take, for instance, the form of either (4), (5), or (8). The averaging in Eq. (15) implicitly assumes that all frames (voiced, unvoiced and silence) should be weighted equally, but this is not neces-sarily consistent with quality judgments. For one, the above averaging does not take into account temporal (forward or backward) masking effects.
Alternatively, we can consider using a time-weighted averaging approach to estimate the global distortion, i.e.,

Speech Quality Assessment 647
1
01
0
( ) ( , )
( )
M
k kk
W M
k
w k dD
w k
−
=−
=
=∑
∑
x x
(16)
where ( )w k represents the weighting applied to the kth frame. Computing the
frame weights, ( )w k , however, is not straightforward and no optimal methods (at
least in the perceptual sense) exist to do that. Accurate computation of ( )w k would require a deeper understanding of the fac-
tors influencing quality judgments at least at two conceptual levels: the supraseg-mental (spanning syllables or sentences) and the segmental (spanning a single phoneme) levels. At the suprasegmental level we need to know how humans inte-grate information across time, considering at the very least temporal (non-simultaneous) masking effects such as forward and backward masking. Forward masking is an auditory phenomenon which occurs when large energy stimuli (maskers) precede in time, and suppress (i.e., mask) later arriving and lower energy stimuli from detection. In the context of speech enhancement, this means that the distortion introduced by the noise-reduction algorithm may be detectable beyond the time window in which the signal and distortion are simultaneously pre-sent. Masking may also occur before the masker onset and the corresponding ef-fect is called backward masking [75,ch. 4]. Back-ward masking effects are rela-tively short (less than 20ms), but forward-masking effects can last longer than 100 msecs [75, ch. 4.4] and its effects are more dominant. Attempts to model forward masking effects were reported in [1, p. 265,45,55].
At the segmental (phoneme) level, we need to know which spectral characteris-tics (e.g., formants, spectral tilt, etc) of the signal affect quality judgments the most. These characteristics might also be language dependent [76], and the objec-tive measure needs to take that into account (e.g., [28]). We know much about the effect of spectral manipulations on perceived vowel quality but comparatively lit-tle on consonant quality [42,77]. Klatt [42] demonstrated that of all spectral manipulations (e.g., low-pass filtering, notch filtering, spectral tilt) applied to vowels, the formant frequency changes had the largest effect on quality judg-ments. His findings, however, were only applicable to vowels and not necessarily to stop consonants or any other sound class. For one, Klatt concluded that spectral tilt is unimportant in vowel perception [42], but that is not the case however in stop-consonant perception. We know from the speech perception literature that spectral tilt is a major cue to stop place of articulation [78, ch. 6,79]. Some [79] explored the idea of constructing a spectral template that could be associated with each place of stop articulation, and used those templates to classify stops. In brief, the stop consonants, and possibly the other consonants, need to be treated differ-ently than vowels, since different cues are used to perceive consonants.
There has been a limited number of proposals in the literature on how to esti-mate the weights ( )w k in (16) or how to best combine the local distortions to a
single global distortion value [1,1, ch. 7,45,69,80,81]. In [80,82], the weights
648 P.C. Loizou
( )w k were set proportional to the frame energy (raised to a power) thereby plac-
ing more emphasis on voiced segments. This approach, however, did not yield any significant benefits as far as obtaining a better correlation with subjective listening tests [1, p. 221,82]. A more successful approach was taken in [83] for assessing distortions introduced by hearing aids. Individual frames were classified into three regions relative to the overall RMS level of the utterance, and the objective meas-ure was computed separately for each region. The high-level region consisted of segments at or above the overall RMS level of the whole utterance. The mid-level region consisted of segments ranging from the overall RMS level to 10 dB below, and the low-level region consisted of segments ranging from RMS-10 dB to RMS-30 dB. A similar approach was also proposed in [84].
Rather than focusing on finding suitable weights for Eq. (16), some have pro-posed alternative methods to combine the local distortions into a single global dis-tortion value. In [80], a classifier was used to divide the speech frames into four distinct phonemic categories: vocalic, nasal, fricative and silence. A separate dis-tortion measure was used for each phonemic class and the global distortion was constructed by linearly combining the distortions of the four classes. A similar ap-proach was also proposed in [81] based on statistical pattern-recognition princi-ples. The underlying assumption in these segmentation-based methods is that the distortion in various classes of sounds is perceived differently, and therefore a dif-ferent weight ought to be placed to each class. It is not yet clear what those weights should be, and further research based on psychoacoustic experiments is needed to determine that.
A different approach for combining local distortions was proposed in [69] based on the assumption that the overall perceived distortion consists of two com-ponents. The first component takes the average distortion into account by treating all segments (frames) and all frequencies equally. The second component takes into account the distribution of the distortion over time and frequency. That is, it takes into consideration the possibility that the distortion might not be uniformly distributed across time/frequency but concentrated into a local time or frequency region. The latter distortion is computed using an information-theoretic measure borrowed from the video coding literature [85]. This measure, which is based on entropy, quantifies roughly the amount of information contained in each time-frequency cell and assigns the appropriate weight accordingly. The measuring normalizing blocks (MNB) algorithm [31] utilizes a simple perceptual transform, and a hierarchical structure of integration of distance measurements over a range of time and frequency intervals.
In most objective quality measures, the distortion is computed as the difference between the auditory spectra of the clean and processed signals or as the differ-ence of their all-pole spectra (e.g., LPC) representations. This difference is com-monly squared to ensure positivity of the distance measure. Squaring this differ-ence, however, assumes that the positive and negative differences contribute equally to the perceived quality. But as mentioned earlier, that is not the case. A positive difference might sometimes be perceived more harshly and therefore be more objectionable than a negative difference. This is because the omitted components (produced by a negative difference) might sometimes be masked and

Speech Quality Assessment 649
therefore become inaudible. Objective measures should therefore treat positive and negative distortions differently. Yet, only a few objective measures take into account this asymmetrical effect of auditory spectra differences on quality judg-ments [30,31,86].
To summarize, further research is needed to address the following issues and questions for better objective quality evaluation:
1. At the suprasegmental level, we need a perceptually meaningful way to compute the weights ( )w k in (16), modeling at the very least
temporal (forward) masking effects. 2. At the segmental (phoneme) level, we need to treat consonants dif-
ferently than vowels since perceptually we use different cues to iden-tify consonants and vowels. Certain spectral characteristics of the consonants and vowels need to be emphasized or deemphasized in the distortion calculation, and these characteristics will likely be dif-ferent.
3. A different weight needs to be placed on positive and negative dif-ferences of the auditory spectral representation of the clean and processed signals.
To address the above issues, it will require a better understanding of the factors in-fluencing human listeners in making quality judgments. For that, perception ex-periments similar to those reported in [42,45,77] need to be conducted.
5 Summary
This Chapter presented an overview of the various techniques and procedures that have been used to evaluate the quality of processed speech. A number of subjective listening tests were described for evaluating speech quality. These tests included relative preference methods and absolute category rating methods (e.g., MOS, DAM). The ITU-T P.835 standard established for evaluating quality of speech processed by noise-reduction algorithms was also described. Lastly, a description of common objective quality measures was provided. This included segmental SNR measures, spectral distance measures based on LPC (e.g., Itakura-Saito measure) and perceptually motivated measures (e.g., bark dis-tortion measure, PESQ measure). The segmental SNR measure, which is often used to assess speech quality, was not found to correlate well with subjective rating scores obtained by human listeners, and should not be used. The PESQ measure has been proven to be the most reliable objective measure for as-sessment of speech quality [30,34], and to some degree, speech intelligibility [74].
References
[1] Quackenbush, S., Barnwell, T., Clements, M.: Objective measures of speech quality. Prentice Hall, Englewood Cliffs (1988)
[2] Loizou, P.: Speech Enhancement: Theory and Practice. CRC Press LLC, Boca Raton (2007)

650 P.C. Loizou
[3] Grancharov, V., Kleijn, W.: Speech Quality Assessment. In: Benesty, J., Sondhi, M., Huang, Y. (eds.) Handbook of Speech Processing, pp. 83–99. Springer, Heidelberg (2008)
[4] Berouti, M., Schwartz, M., Makhoul, J.: Enhancement of speech corrupted by acoustic noise. In: Proc. IEEE Int. Conf. Acoust. Speech, Signal Processing, pp. 208–211 (1979)
[5] ITU-T, Subjective performance assessment of telephone band and wide-band digital codecs, ITU-T Recommendation p. 830 (1996)
[6] International Telecommunication Union - Radiocommunication Sector, Recommen-dation BS. 562-3, Subjective assessment of sound quality (1990)
[7] IEEE Subcommittee, IEEE Recommended Practice for Speech Quality Measure-ments. IEEE Trans. Audio and Electroacoustics AU-17(3), 225–246 (1969)
[8] International Telecommunication Union - Telecommunication Sector, Recommenda-tion, Subjective performance assessment of telephone band and wideband digital co-decs p. 830 (1998)
[9] IEEE Recommended Practice for Speech Quality Measurements. IEEE Trans. Audio and Electroacoustics AU-17(3),225–246 (1969)
[10] Coleman, A., Gleiss, N., Usai, P.: A subjective testing methodology for evaluating medium rate codecs for digital mobile radio applications. Speech Communica-tion 7(2), 151–166 (1988)
[11] Goodman, D., Nash, R.: Subjective quality of the same speech transmission condi-tions in seven different countries. IEEE Trans. Communications COm-30(4), 642–654 (1982)
[12] Rothauser, E., Urbanek, G., Pachl, W.: A comparison of preference measurement methods. J. Acoust. Soc. Am. 49(4), 1297–1308 (1970)
[13] ITU-T, Methods for subjective determination of transmission quality, ITU-T Recom-mendation p. 800 (1996)
[14] Voiers, W.D.: Diagnostic Acceptability Measure for speech communication systems. In: Proc. IEEE Int. Conf. Acoust. Speech, Signal Processing, pp. 204–207 (1977)
[15] Voiers, W.D., Sharpley, A., Panzer, I.: Evaluating the effects of noise on voice com-munication systems. In: Davis, G. (ed.) Noise Reduction in Speech Applications, pp. 125–152. CRC Press, Boca Raton (2002)
[16] ITU-T, Subjective test methodology for evaluating speech communication systems that include noise suppression algorithm, ITU-T Recommendation p. 835 (2003)
[17] Hu, Y., Loizou, P.: Subjective comparison of speech enhancement al-gorithms. In: Proc. IEEE Int. Conf. Acoust. Speech, Signal Processing, vol. I, pp. 153–156 (2006)
[18] Kreiman, J., Kempster, G., Erman, A., Berke, G.: Perceptual evaluation of voice qual-ity: Review, tutorial and a framework for future research. J. Speech Hear. Res. 36(2), 21–40 (1993)
[19] Suen, H.: Agreement, reliability, accuracy and vailidity: Toward a clarification. Be-havioral Assessment 10, 343–366 (1988)
[20] Cronbach, L.: Coefficient alpha and the internal structure of tests. Psychometrika 16, 297–334 (1951)
[21] Kendall, M.: Rank correlation methods. Hafner Publishing Co., New York (1955) [22] Shrout, P., Fleiss, J.: Intraclass correlations: Uses in assessing rater re-liability. Psy-
chological Bulletin 86(2), 420–428 (1979) [23] McGraw, K., Wong, S.: Forming inferences about some intraclass correlation coeffi-
cients. Psychological Methods 1(1),30–46 (1996)

Speech Quality Assessment 651
[24] Tinsley, H., Weiss, D.: Interrater reliability and agreement of subjective judgments. J. Counseling Psychology 22(4), 358–376 (1975)
[25] Gerratt, B., Kreiman, J., Antonanzas-Barroso, N., Berke, G.: Compar-ing internal and external standards in voice quality judgments. J. Speech Hear. Res. 36, 14–20 (1993)
[26] Kreiman, J., Gerratt, B.: Validity of raing scale measures of voice quality. J. Acoust. Soc. Am. 104(3), 1598–1608 (1998)
[27] Ott, L.: An introduction to statistical methods and data analysis, 3rd edn. PWS-Kent Publishing Company, Boston (1988)
[28] Chong, F., McLoughlin, I., Pawlikoski, K.: A Methodology for Improving PESQ ac-curacy for Chinese Speech. In: TENCON Conference, pp. 1–6 (2005)
[29] ITU, Perceptual evaluation of speech quality (PESQ), and objective method for end-to-end speech quality assessment of narrowband telephone networks and speech co-decs. ITU-T Recommendation p. 862 (2000)
[30] Rix, A., Beerends, J., Hollier, M., Hekstra, A.: Perceptual evaluation of speech quality (PESQ) - A new method for speech quality assessment of telephone networks and co-decs. In: Proc. IEEE Int. Conf. Acoust, Speech, Signal Processing, vol. 2, pp. 749–752 (2001)
[31] Voran, S.: Objective estimation of perceived speech quality - Part I: Development of the measuring normalizing block technique. IEEE Transactions on Speech and Audio Processing 7(4), 371–382 (1999)
[32] Flanagan, J.: A difference limen for vowel formant frequency. J. Acoust. Soc. Am. 27, 613–617 (1955)
[33] Viswanathan, R., Makhoul, J., Russell, W.: Towards perceptually consistent measures of spectral distance. In: Proc. IEEE Int. Conf. Acoust, Speech, Signal Processing, vol. 1, pp. 485–488 (1976)
[34] Hu, Y., Loizou, P.: Evaluation of objective quality measures for speech enhancement. IEEE Trans. Audio Speech Lang Processing 16(1), 229–238 (2008)
[35] Dimolitsas, S.: Objective speech distortion measures and their relevance to speech quality assessments. In: IEE Proc. - Vision, Image and Signal Processing, vol. 136(5), pp. 317–324 (1989)
[36] Kubichek, R., Atkinson, D., Webster, A.: Advances in objective voice quality assess-ment. In: Proc. Global Telecommunications Conference, vol. 3, pp. 1765–1770 (1991)
[37] Kitawaki, N.: Quality assessment of coded speech. In: Furui, S., Sondhi, M. (eds.) Advances in Speech Signal Processing, pp. 357–385. Marcel Dekker, New York (1991)
[38] Barnwell, T.: Objective measures for speech quality testing. J. Acoust. Soc. Am. 66(6), 1658–1663 (1979)
[39] Hansen, J., Pellom, B.: An effective quality evaluation protocol for speech enhance-ment algorithms. In: Proc. Inter. Conf. on Spoken Language Processing, vol. 7, pp. 2819–2822 (1998)
[40] Tribolet, J., Noll, P., McDermott, B., Crochiere, R.E.: A study of complexity and quality of speech waveform coders. In: Proc. IEEE Int. Conf. Acoust. Speech, Signal Processing, pp. 586–590 (1978)
[41] Kryter, K.: Methods for calculation and use of the articulation index. J. Acoust. Soc. Am. 34(11), 1689–1697 (1962)
[42] Klatt, D.: Prediction of perceived phonetic distance from critical band spectra. In: Proc. IEEE Int. Conf. Acoust. Speech, Signal Processing, vol. 7, pp. 1278–1281 (1982)
652 P.C. Loizou
[43] Rabiner, L., Schafer, R.: Digital processing of speech signals. Prentice Hall, Engle-wood Cliffs (1978)
[44] Kitawaki, N., Nagabuchi, H., Itoh, K.: Objective quality evaluation for low bit-rate speech coding systems. IEEE J. Select. Areas in Comm. 6(2), 262–273 (1988)
[45] Karjalainen, M.: A new auditory model for the evaluation of sound quality of audio system. In: Proc. IEEE Int. Conf. Acoust. Speech, Signal Processing, vol. 10, pp. 608–611 (1985)
[46] Wang, S., Sekey, A., Gersho, A.: An objective measure for predicting subjective qual-ity of speech coders. IEEE J. on Select. Areas in Comm. 10(5), 819–829 (1992)
[47] Yang, W., Benbouchta, M., Yantorno, R.: Performance of the modified Bark spectral distortion as an objective speech quality measure. In: Proc. IEEE Int. Conf. Acoust. Speech, Signal Processing, pp. 541–544 (1998)
[48] Karjalainen, M.: Sound quality measurements of audio systems based on models of auditory perception. In: Proc. IEEE Int. Conf. Acoust., Speech, Signal Processing, vol. 9, pp. 132–135 (1984)
[49] Chen, G., Parsa, V.: Loudness pattern-based speech quality evaluation using Bayesian modelling and Markov chain Monte Carlo methods. J. Acoust., Soc. Am. 121(2), 77–83 (2007)
[50] Pourmand, N., Suelzle, D., Parsa, V., Hu, Y., Loizou, P.: On the use of Bayesian modeling for predicting noise reduction performance. In: Proc. IEEE Int. Conf. Acoust., Speech, Signal Processing, pp. 3873–3876 (2009)
[51] Moore, B.: An introduction to the psychology of hearing, 5th edn. Academic Press, London (2003)
[52] Fletcher, H., Munson, W.: Loudness, its definition, measurement and calculation. J. Acoust. Soc. Am. 5, 82–108 (1933)
[53] Robinson, D., Dadson, R.: A re-determination of the equal-loudness relations for pure tones. Brit. J. Appl. Phys. 7, 166–181 (1956)
[54] Yang, W.: Enhanced modified Bark spectral distortion (EMBSD): An objective speech quality measure based on audible distortion and cognition model. Ph.D., Tem-ple University (1999)
[55] Novorita, B.: Incorporation of temporal masking effects into bark spectral distortion measure. In: Proc. IEEE Int. Conf. Acoust. Speech, Signal Processing, vol. 2, pp. 665–668 (1999)
[56] Yang, W., Yantorno, R.: Improvement of MBSD by scaling noise masking threshold and correlation analysis with MOS difference instead of MOS. In: Proc. IEEE Int. Conf. Acoust., Speech, Signal Processing, vol. 2, pp. 673–676 (1999)
[57] Rix, A., Hollier, M.: The perceptual analysis measurement for robust end-to-end speech quality assessment. In: Proc. IEEE Int. Conf. Acoust., Speech, Signal Process-ing, vol. 3, pp. 1515–1518 (2000)
[58] Bartels, R., Stewart, G.: Solution of the matrix equation AX+XB=C. Comm. of ACM 15(9), 820–826 (1972)
[59] Beerends, J., Stemerdink, J.: A perceptual speech-quality measure based on a psycho-acoustic sound representation. J. Audio Eng. Soc. 42(3), 115–123 (1994)
[60] Friedman, J.: Multivariate adaptive regression splines. Annals Statistics 19(1), 1–67 (1991)
[61] Falk, T.H., Chan, W.: Single-Ended Speech Quality Measurement Using Machine Learning Methods. IEEE Trans. Audio Speech Lang. Processing 14(6), 1935–1947 (2006)

Speech Quality Assessment 653
[62] Rix, A.: Perceptual speech quality assessment - A review. In: Proc. IEEE Int. Conf. Acoust., Speech, Signal Processing, vol. 3, pp. 1056–1059 (2004)
[63] Gray, P., Hollier, M., Massara, R.: Non-intrusive speech quality as-sessment using vocal-tract models. In: IEE Proc. - Vision, Image and Signal Processing, vol. 147(6), pp. 493–501 (2000)
[64] Chen, G., Parsa, V.: Nonintrusive speech quality evaluation using an adaptive neuro-fuzzy inference system. IEEE Signal Processing Letters 12(5), 403–406 (2005)
[65] Jin, C., Kubichek, R.: Vector quantization techniques for output-based objective speech quality. In: Proc. IEEE Int. Conf. Acoust., Speech, Signal Processing, pp. 491–494 (1996)
[66] Picovici, D., Madhi, A.: Output-based objective speech quality measure using self-organizing map. In: Proc. IEEE Int. Conf. Acoust., Speech, Signal Processing, pp. 476–479 (2003)
[67] Kim, D., Tarraf, A.: Perceptual model for nonintrusive speech quality assessment. In: Proc. IEEE Int. Conf. Acoust., Speech, Signal Processing, vol. 3, pp. 1060–1063 (2004)
[68] ITU, Single ended method for objective speech quality assessment in narrow-band te-lephony applications. ITU-T Recommendation p. 563 (2004)
[69] Hollier, M., Hawksford, M., Guard, D.: Error activity and error en-tropy as a measure of psychoacoustic significance in the perceptual domain. In: IEE Proc. - Vision, Im-age and Signal Processing, vol. 141(3), pp. 203–208 (1994)
[70] Arehart, K., Kates, J., Anderson, M., Harvey, L.: Effects of noise and distortion on speech quality judgments in normal-hearing and hearing-impaired listeners. J. Acoust. Soc. Am. 122, 1150–1164 (2007)
[71] Kates, J.: On using coherence to measure distortion in hearing aids. J. Acoust. Soc. Am. 91, 2236–2244 (1992)
[72] Hu, Y., Loizou, P.: Subjective comparison and evaluation of speech enhancement al-gorithms. Speech Communication 49, 588–601 (2007)
[73] Holub, J., Jianjun, L.: Intrusive Speech Transmission Quality Measurement in Chi-nese Environment. In: Intern. Conf. on Information, Communications and Signal Processing, pp. 1–3 (2007)
[74] Ma, J., Hu, Y., Loizou, P.: Objective measures for predicting speech intelligibility in noisy conditions based on new band-importance functions. J. Acoust. Soc. Am. 125(5), 3387–3405 (2009)
[75] Zwicker, E., Fastl, H.: Pschoacoustics: Facts and Models, 2nd edn. Springer, Heidel-berg (1999)
[76] Kang, J.: Comparison of speech intelligibility between English and Chinese. J. Acoust. Soc. Am. 103(2), 1213–1216 (1998)
[77] Bladon, R., Lindblom, B.: Modeling the judgment of vowel quality differences. J. Acoust. Soc. Am. 69(5), 1414–1422 (1981)
[78] Kent, R., Read, C.: The Acoustic Analysis of Speech. Singular Publishing Group, San Diego (1992)
[79] Stevens, K., Blumstein, S.: Invariant cues for the place of articulation in stop conso-nants. J. Acoust. Soc. Am. 64, 1358–1368 (1978)
[80] Breitkopf, P., Barnwell, T.: Segmental preclassification for improved objective speech quality measures. In: Proc. IEEE Int. Conf. Acoust., Speech, Signal Processing, pp. 1101–1104 (1981)

654 P.C. Loizou
[81] Kubichek, R., Quincy, E., Kiser, K.: Speech quality asessment using expert pattern recognition techniques. In: IEEE Pacific Rim Conf. on Comm. Computers, Sign. Proc., pp. 208–211 (1989)
[82] Barnwell, T.: A comparison of parametrically different objective speech quality measures using correlation analysis with subjective listening tests. In: Proc. IEEE Int. Conf. Acoust., Speech, Signal Processing, pp. 710–713 (1980)
[83] Kates, J., Arehart, K.: Coherence and the speech intelligibility index. J. Acoust. Soc. Am. 117, 2224–2237 (2005)
[84] Mattila, V.: Objective measures for the characterization of the basic functioning of noise suppression algorithms. In: Proc. of online workshop on Measurement Speech and Audio Quality in Networks (2003)
[85] Mester, R., Franke, U.: Spectral entropy-activity classification in adaptive transform coding. IEEE J. Sel. Areas Comm. 10(5), 913–917 (1992)
[86] Voran, S.: Objective estimation of perceived speech quality - Parti I: Development of the measuring normalizing block technique. IEEE Transactions on Speech and Audio Processing 7(4), 371–382 (1999)
[87] Klatt, D.H.: Prediction of perceived phonetic distance from critical-band spectra:A first step. In: Proceedings of the IEEE International Conference on Acoustics, Speech, and Signal Processing, vol. 2, pp. 1278–1281 (1982)