springs monitoring protocol implementation plan for park
TRANSCRIPT

Springs Monitoring Protocol – SOP#6 - Version 20180930
Page 1 of 80
Springs Monitoring Protocol Implementation Plan for Park Units in the
Southern Colorado Plateau Network
Standard Operating Procedure (SOP) #8
Surveying
Version SCPN_Springs_SOP8_20180930
Revision History Log: Previous
Version #
Revision
Date
Author Changes Made Reason for Change New
Version #
This SOP is adopted from the Northern Colorado Plateau Network’s SOP #6 Measuring
Vegetation, Version 1.14 (March 2018) in Weissinger, R., D. Witwicki, H. Thomas, A. Wight,
K. Lund, and M. Van Grinsven. 2018. Riparian monitoring of wadeable streams protocol for
park units in the Northern Colorado Plateau Network: Version 1.05. Natural Resource Report
NPS/NCPN/NRR—2018/1636. National Park Service, Fort Collins, Colorado, and the Northern
Colorado Plateau Network’s SOP #16 Trimble RTK Basic Operating Instructions in the Field,
Version 1.00 (April 2017) in Perkins, D. W., M. Scott, G. Auble, M. Wondzell, C. Holmquist-
Johnson, E. Wahlig, H. Thomas, and A. Wight. 2018. Big rivers monitoring protocol for park
units in the Northern Colorado Plateau Network: Version 1.01. Natural Resource Report
NPS/NCPN/NRR—2018/1707. National Park Service, Fort Collins, Colorado.
This SOP gives detailed instructions for surveying the stream channel using a total station or
RTK and post-processing survey data after returning from the field. A list of necessary
equipment for these procedures can be found in SOP #1.
A three-person team comprised of a survey lead and two rod persons can efficiently complete the
tasks described below. The survey lead should be skilled in total station and RTK operation at
remote field sites and have experience with rod duties (i.e., running rod) and post-processing
survey data. The rod persons should have excellent attention to detail, basic knowledge of
surveying, and be skilled in running rod. If surveying with RTK, there must be one person with
in-depth knowledge of base station set-up and operation of rovers.
This SOP starts with total station information on page 1, followed by RTK operation (Section 3)
on page 17. Once the total station and RTK is set up then the actual surveying procedures are
outlined in Section 12 on page 71.
1. Total Station Surveying Basics & Equipment Operation

Springs Monitoring Protocol – SOP#6 - Version 20180930
Page 2 of 80
1.1 Survey Equipment The survey lead is responsible for instructing the rod persons on how to handle and take care of
sensitive and expensive survey equipment (see SOP #1 for complete list of survey equipment).
The SCPN currently uses a Topcon GTS239total station instrument, Trimble Recon data
collector with SurveyProsoftware, and Microsoft Excel software for data post-processing in the
office. Terramodel software is sometimes used for initial data checking and rectification. Refer
to the Topcon Total Station and SurveyPromanuals for more details on surveying and using this
equipment.
Two different types of rods are used for surveying: prism poles and leveling rods (Fig. 1). Both
types of rods hold prisms and have attached levels to ensure the rod is plumb. The level on a
leveling rod is removable, and may need to be attached before you begin using it. The general
term “rod” is used to refer to both types of rods.
The prism pole is an adjustable pole with two different rod ends that can be used (Fig. 2).
The pointed end will only be used on backsights, control points, and occasionally on
headpin shots. Do not use the pointed end for generic topographic shots because it will
sink into the ground causing the incorrect elevation of the shot to be recorded. The flat
foot end is best for topographic shots and all other shots. The prism rod can be swapped
out as a rover rod when using RTK.
The leveling rod has extensions that snap into place and is not adjustable beyond these
settings. It has flat foot end that should only be used for topographic shots (i.e., not
control points and backsight shots).

Springs Monitoring Protocol – SOP#6 - Version 20180930
Page 3 of 80
Figure 1. Prism pole (left) and leveling rod (right).

Springs Monitoring Protocol – SOP#6 - Version 20180930
Page 4 of 80
Figure 2. Options for the bottom of prism poles. The point on the left is used for control
points, top of headpins, and well shots while the flat foot is on the right is used for all
other shots. Leveling rods only have a flat foot.
1.2 Safety concerns while surveying The following is a list of safety concerns that you need to be aware of while surveying. Refer to
the Nikon Total Station, Trimble Access software, or other specific survey manuals for more
complete lists of safety precautions.
Do not look directly into the laser beam produced by the total station. When the survey
lead is taking shots, the rod person focuses their eyes on keeping the rod level. The
survey lead will let the rod person know when the shot has been completed by
communicating “got it”, “okay”, etc.
Be mindful of potential hazards during thunderstorms. Know what materials each rod is
constructed of and whether they are conductive. Serious or fatal injuries may result from
conductive materials being struck by lightning.
Never look at the sun through the total station telescope. If you do, you may damage or
lose your eyesight.
Avoid recharging batteries in direct sunlight. Do not recharge the battery pack when it is
wet. If you do, you may receive electric shocks or burns, or the battery pack may
overheat or catch fire.
Do not cover the battery charger when battery pack is being recharged. The charger must
be able to dissipate heat adequately. Coverings such as blankets or clothing can cause the
charger to overheat.
Avoid getting the total station batteries wet. The batteries are not waterproof. Do not get
the battery wet when it is removed from the instrument. If water seeps into the battery, it
may cause a fire or burns.
Do not sit, stand, or stack objects on the total station cases. It is unstable and its surface is
slippery. Stacking or sitting on the plastic carrying case may cause personal injury or
instrument damage.

Springs Monitoring Protocol – SOP#6 - Version 20180930
Page 5 of 80
1.3 Rod technique This section explains techniques and tips for using surveying rods (i.e., running rod). It is
important that the rod persons know how to be accurate and efficient during a survey. See
section 3 for additional rod techniques specific to certain parts of the survey.
Communication - Clear communication between team members is a key component of a
successful survey. If people are beyond a comfortable talking range, use radios to
communicate. The survey lead may use an ear piece and microphone attached to the radio
to free their hands for operating the total station and data collector.
Raising the rod – Shots are generally taken at the lowest rod height unless there is an
obstruction. Always raise the rod from the bottom section (the largest rod), followed by
the next-to-top section and so forth, unless otherwise directed at the beginning of the
survey. If the total station does not have a clear line of sight to the prism, try raising the
rod until the total station operator can see it. When using the leveling rod, be sure that
each rod extension has snapped fully into place before the shot is taken.
Leveling the rod - Center the leveling bubble attached to the rod to make sure the rod is
precisely vertical. Hold the rod steady in this position while the shot is taken. If the rod
was not level, notify the survey lead immediately so that the shot is re-taken. A bipod (a
piece of equipment that turns a rod into a tripod) can be very useful to minimize survey
error and should be used for control shots and other important shots. All other shots
typically do not need a bipod.
Squaring the prism - The rod person needs to make sure that the prism on their rod is
square to (i.e., facing) the total station during each shot. When the rod person does not
have a clear view of the total station, the survey lead can communicate to the rod person
to rotate their prism until is it square by instructing them to rotate clockwise or
counterclockwise.
Rod location and height - Know the height of your rod at all times. Rod persons should
always have a measuring tape on them while surveying. The rod person always needs
to let the total station operator know the location of the rod and how many rods are
up before each shot is taken (e.g., “T3R, top of headpin, one rod”). The total station
operator will let the rod person know when the shot has been successfully completed.
Any shot errors (e.g., rod not raised to full height, incorrect rod height relayed to
survey lead) need to be communicated to the survey lead immediately, documented,
and corrected by re-taking the shot, if necessary.
Rod positioning – When a tagline is being used, each shot should be taken with the rod
flush against the downstream side of the tagline. When two crew members are running
rod, they should "leapfrog" across the tagline or down the profile for the greatest
efficiency. During a stake-to-line transect line survey, use flagged points on the line and
the position of the person at the previous shot to roughly position yourself on the transect
line. Square the prism to the total station and allow the total station operator to take a
shot; the operator will communicate to you the direction (upstream or downstream) and
distance to the line. Reposition for the next shot attempt. It is better to move efficiently to
the next approximate shot position and let the total station “do the work” than to spend a
lot of time gauging the precise transect line location.

Springs Monitoring Protocol – SOP#6 - Version 20180930
Page 6 of 80
Timing of prism direction – It is crucial that only the prism of the current shot should be
facing the total station operator. Crew members running rod need to make sure their
prisms are facing away from the total station while setting up for their next shot.
Know what rod foot to use - For control shots, the rod persons will use the point (not the
foot) of the prism pole (see Figure 2) on the exact location of the control point (i.e., the
center of the X on rock or in the pre-stamped dot on a rebar cap), the top of headpins, and
wells. For all other shots on topographic features, use the flat foot on the bottom of the
prism pole or a leveling rod.
1.4 Establishing survey control The following instructions are used when establishing the first survey at a reach. Revisit
instructions begin in Section 2.2.
A. Before leaving the office, calibrate the Weatherport hand-held weather unit along with
other pre-trip duties. See the Weatherport manual in the Total Station manual binder for
details. Alternatively, take a copy of the Topcon atmospheric correction chart (p. 12-4 of
Topcon manual) into the field.
B. In the field, locate headpins for all transects at the reach, and mark with pin flags and
flagging. Positioning and driving headpins may be completed during the initial site survey.
C. Identify potential survey control points, which will be used for instrument setups (i.e.,
occupied points), backsight locations, and maintaining control throughout the survey. The
survey lead should determine these locations with the help of other crew members to check
lines-of-sight. Ideally, each reach should have at least 4 control points that are all
intervisible to each other and have good geometry. Among all control points, there should
be good visibility of the entire reach.
D. Monument the control points. All permanent survey control must be cleared ahead of time
with the park unit. Check to see what is permitted before you leave for the field.
Permanent survey control are established using the following methods:
Permanent metal cemented in bedrock (if permit allows). Use ½”-diameter
threaded rod; a 5” piece works best on horizontal bedrock, while a 7” piece works
best on vertical walls. On the 7” pieces, have maintenance grind down the threads
on one side, but just on the part that will be sticking out of the rock. Use a
hammer drill with a ½” concrete bit to drill a hole with a wider entrance. For
vertical walls, make sure to align the rod so that the flat spot is facing up and
enough is protruding from the rock to place the pointed foot of a leveled prism
pole on it. Add water to 2-3 spoonfuls of concrete mix to make a mixture the
consistency of pancake batter. Place the threaded rod in the drilled hole, making
sure that the appropriate length is sticking out (½ - 1 in.), then add cement down
and around the rod. After filling the hole, make a cement collar around the rod to
ensure that water does not get in the hole.
X’s etched in rocks (if permit allows)

Springs Monitoring Protocol – SOP#6 - Version 20180930
Page 7 of 80
0.5-m lengths of 3/8” rebar. Place an aluminum cap on top of the rebar stamped
with SCPN, the ReachID, the appropriate code for the control point, and an exact
mark on the cap to place the point of the prism pole (i.e., a dot pre-stamped in the
center of the cap either by the manufacturer or by the SCPN; Fig. 3). It is easiest
to stamp the cap first, place the cap on the rebar, and then use a piece of wood or
something else to protect the cap while hammering the rebar into the ground.
Figure 3. Example of a rebar cap with a pre-stamped dot in the center.
It is important not to move any monuments once they have been surveyed in. Flag the
areas around control points for easy visibility while surveying.
E. Document control points using photos, descriptions, and a sketch of the reach.
a. Reference photos should include 1) a few shots with enough background topography
for anyone returning to the reach to find the approximate location, and 2) at least one
close-up of the precise position of the point. Try to include either the total station or a
rod person in each photo.
b. Write detailed notes describing the location of each control point in the field notebook
(Fig. 4). Use permanent features rather than vegetation that will change over time. The
lead surveyor is responsible for recording these in the field notes.
c. Sketch a well-drawn location map of the reach including transects, headpins, control
points, and any distinguishing features of the reach (Fig. 4).
F. Record the location of each control point using the highest grade GPS unit available. Use
the highest precision possible. If satellites are hard to acquire, precision can be dropped
down to the middle range, but try to avoid low precision. These coordinates will be used to
translate and rotate the survey data into real-world coordinates.
Springs Monitoring Protocol – SOP#6 - Version 20180930
Page 8 of 80
G. Determine a surveying strategy including occupied points, backsights, and order of
transects and longitudinal profile shots. Have as few instrument locations as possible to
reduce error.
1.5 Setting up the survey equipment This section describes steps to set up the total station (also referred to as the instrument or gun),
data collector, and backsight. Most of these steps are performed by the survey lead while the rod
persons attach prisms to the prism poles/leveling rods and measure the length of each. Rod
persons will also typically set up the backsight.
A. Set up the total station. The survey lead will set up the total station at the initial occupied
point, using standard leveling procedures:
a. Use the red laser plummet to center the total station over the occupied point location
(e.g., pre-stamped dot in rebar cap of control point, middle of top of uncapped rebar,
center of X on rock, etc.). Start with coarse leveling using the tripod legs followed by
using the three adjustment screws on the total station for electronic leveling using the
bubble screen (refer to Topcon Total Station manual for more details). Ideally, be
within +/- 10”. If you are establishing the point, it is easiest to level the instrument
first, then place the capped rebar or chisel an X in the rock at the precise location.
To turn the laser on and off, hit the ANG button in the bubble screen.
To access the bubble screen, hit the 0 button on the total station.
b. Measure the height of the instrument (HI), to the nearest millimeter, from the top of the
permanent rebar or center of etched X in rock to the horizontal axis indicator mark on
the side of the instrument. Document occupied point location and height of instrument
(see Fig. 5).
B. Set up the rods. Attach a prism to each rod. Measure the height of each prism pole and
leveling rod, to the nearest millimeter, from bottom of rod to center of prism. Make sure
that prisms are set so that the heights for each type of rod are identical. Note that the
heights of the prism poles will be different from the heights of the leveling rods, and there
will need to be clear communication during the survey as to which type of rod is being
used. Always raise the rod from the top section (the smallest rod), followed by the next-to-
top section, etc. Document rod heights in the field notes (Fig. 5; e.g., 1HR = 1.768 m, 2HR
= 2.987 m, 3HR = 4.151 m…6HR = 7.680 m). If rod heights are changed during survey,
the rod person must immediately notify the survey lead. Rod height errors are the
most common source of error during a survey.
C. Set up the backsight in the initial position. The backsight may be established using a
tripod/tribrach/prism, rod/bipod/prism, or a roving rod/prism held by a rod person. If the
backsight will be established using a rod and prism, make sure it can be shot at a single rod
since higher rods are less precise. Set up the backsight using standard leveling methods.
Measure the height, to the nearest millimeter, from top of the permanent rebar or etched X
in rock to the center of the prism. Use a bipod on the rod to improve steadiness. Document
the backsight location and height in field notes (Fig. 5).

Springs Monitoring Protocol – SOP#6 - Version 20180930
Page 9 of 80

Springs Monitoring Protocol – SOP#6 - Version 20180930
Page 10 of 80
Figure 4. Example of survey field notes that describe the location of each control point and include a sketched map of
transects, headpins, control points, and other distinguishing features of the reach. Codes are defined in Table 1.
Springs Monitoring Protocol – SOP#6 - Version 20180930
Page 11 of 80
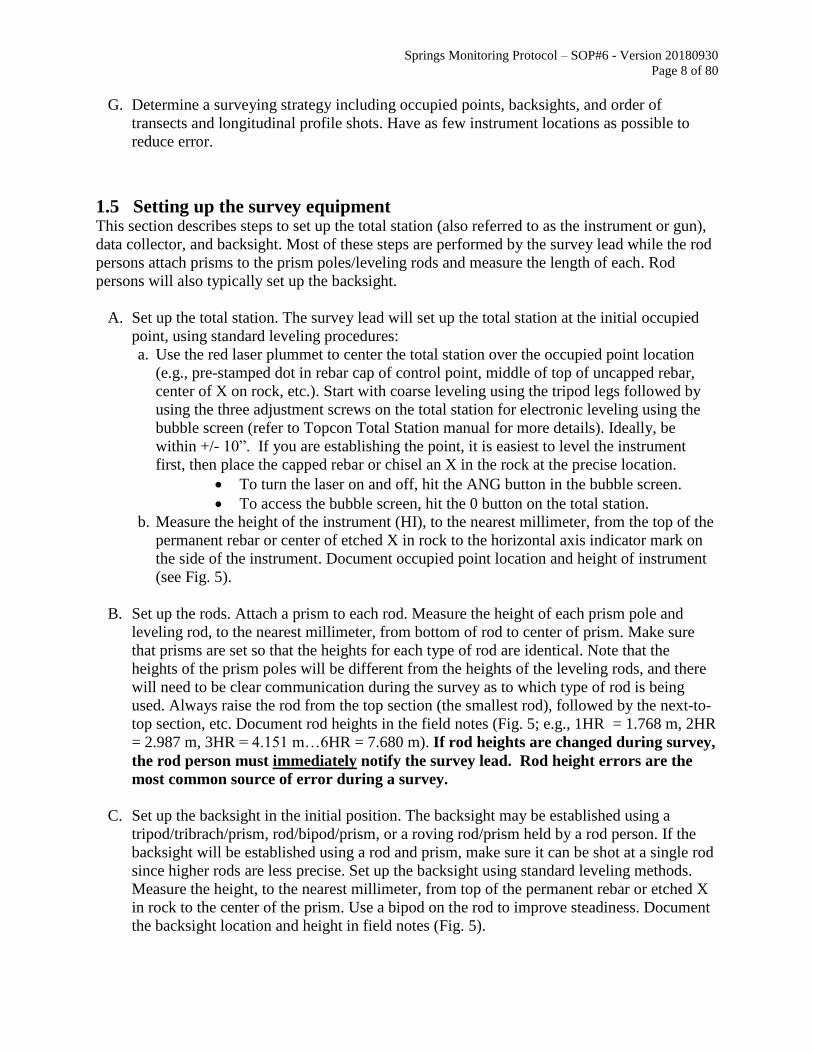
Figure 5. Example of survey field notes for establishing a reach. Codes are defined in Table 1. Use an equal sign to indicate
when you are set up on a known location (e.g., BS1 = CP3 or OP2 = CP1).

Springs Monitoring Protocol – SOP#16 - Version 1.00 – April 2017
Page 12 of 80
Table 1. Definitions and abbreviations for survey terminology. In codes, # is replaced with the number
of the transect that is being surveyed; * indicates L for river left and R for river right.
Survey terminology Code Definition
Occupied point OP$ or
OP$TEMPYY
Monumented or unmonumented points occupied by the total station during a survey. The dollar sign corresponds with the order of the occupied points used. YY is the last two digits of the year.
Backsight BS
A measurement taken back towards a point of known elevation (or arbitrary elevation entered in the total station), or a point previously occupied by the total station used to maintain survey control
Control point CP Monumented point used to maintain control in survey
Note: Use an equal’s sign to indicate if you’re set up on a known location (e.g., BS1=CP3 or OS2=CP1)
Instrument height HI
Height of the total station from the top of the rebar or the center of the X etched in rock to the horizontal axis indicator mark on instrument (to the nearest millimeter)
Rod height HR Height of prism pole or leveling rod from the bottom of the rod to the center of the prism (to the nearest millimeter), also includes backsight height
Edge of water T#LEW or T#REW
* Shot taken with the rod at the edge of flowing water
Top of well casing, instream
T#WELL Shot taken at the notch filed on the top of the well casing of a well
Ground surface at well T#WELL-GS Shot taken on the ground surface next to notch filed into the well casing
Water surface at T#WELL-W Shot taken at water surface next to notch filed in well casing
Confirmation shot code.#
Check shot taken to document errors during a survey. Usually taken at the backsight or a known monumented location such as a control point or a headpin (e.g., CP1)
Traverse shot TR= Used when moving or traversing the instrument to the next location (e.g., TR=CP3 means that you are moving the total station to control point 3)
1.6 Recording survey notes in the field
While the survey lead is operating the data collector and total station, he/she is simultaneously recording
information in a field notebook (Fig. 5), which will be important for post-processing data and
documenting survey details. The information in the field notebook needs to match what is in the data
collector, although some information is not recorded in the data collector. Field notebook information
includes the following:
Record the date, park unit, ReachID, field crew members and their duties (i.e., total station
operator or rod crew), scale factor, and general notes (foliage present, weather conditions, etc.).
Record the file name used in the data collector.
Record all rod heights before the survey begins. The term “rod height” is used for both prism poles
and leveling rods.
Document each instrument and backsight height and location.

Springs Monitoring Protocol – SOP#16 - Version 1.00 – April 2017
Page 13 of 80
Record all transect and stream profile points. The data collector requires a point name (which
should include year, surveyor’s initials, and a unique number), code (called “description” in the
data collector), and rod height for each point surveyed. Table 1 contains a list of standard codes
used for surveying wadeable streams in the SCPN. Similar points may be grouped in your notes
using a dash after the number to indicate that all following numbers have the same code and rod
height (see Fig. 5). This information is very helpful in post-processing and should be recorded in
your notes for all points. Details of every point are also stored in the data collector.
When checking station setup and/or backsight, document errors (Northing, Easting, Elevation,
Horizontal Angle, Horizontal Distance, Vertical Distance). Record what point was used as
reference. Before moving the total station, shoot a check shot to document errors.
List all mistakes or blunders made during the survey so they can be corrected later (e.g., mis-
naming of points and any rod heights that were entered incorrectly in the data collector). It is not
recommended to make these changes in the field but to keep a running list of changes to be made
during post-processing. It is very important to keep track of the rod height at all times and
record any mistakes.
Record photos taken for documentation.
Description of each control point (see Section 1.4, E and Fig. 4).
Sketch the reach including relative locations of transects, reference marks, instrument setups, and
the spring site (Fig. 4).
Define any codes that you use that are not defined in Table 1.
Note anything unusual or that will potentially be helpful with data post-processing (e.g.,
overhanging cliff wall, secondary channels, woody debris piles, etc.).
2. Operating the data collector and total station
This portion of the SOP assumes that the survey lead is competent at surveying.
2.1 Establishing a survey Create a local, arbitrary coordinate system to establish the survey. Survey in as many control points as
you can from the first instrument location before starting to survey. Be diligent and precise since this
will be the baseline for all future revisits.
Acceptable Errors for Establishing a Survey:
Horizontal (includes the northing and easting): 0.000 - 0.050 m (5 cm).
Ideally, it is best to have < 0.030 m (2 cm) error.
Vertical (includes elevation): 0.000-0.030 m (3 cm).
Ideally, it is best to have <0.01 m (1.0 cm) error.
A. Dealing With Errors
There are plenty of ways for errors to occur within a survey. Errors are minimized by
thoroughly training the survey lead and rod persons and by constant attention to detail
throughout the survey. Survey errors can accumulate, and in the worst case scenario, the data
will be unusable for scientific purposes. Some sources of error include wrong rod height,
wrong instrument height, tripod or rods not level, wrong location, poor aiming, wrong
Electronic Distance Measurement (EDM; also known as Measurement Mode), parallax,
instrument in need of calibration, etc. If errors are encountered, double-check every element

Springs Monitoring Protocol – SOP#16 - Version 1.00 – April 2017
Page 14 of 80
of the setup and see if the error can be addressed and minimized. If the source of the errors
cannot be determined, then the survey will need to be started over from the beginning.
Surveying errors are managed by checking the backsight every hour, after about 100 shots, or
after a good stopping point (e.g., after finishing T2). Take a check shot of the backsight every
time you check the backsight.
Do not continue if errors are outside the acceptable range. Stop and remedy the problem.
2.2 Revisiting a survey Before leaving for the field, be sure to gather any previous trip reports, survey notes and details of the
original survey, revisit maps, headpin and control reference photos, vegetation transect lengths and
calibrate the Weatherport hand-held unit before you leave the office (see Table 2 for all necessary revisit
documents). Also make sure to upload all necessary baseline files of previous survey control and
headpin coordinates to the data collector before leaving the office.
In addition, have the GIS technician load all control points, headpins, and other relevant locations onto
GPS units before leaving for the field.
In the field, locate headpins for all transects and all survey control at the reach, and mark with pin flags
and flagging. Set up the taglines and transect tapes, making sure the lengths are within 0.1 m of the
original vegetation transect lengths. The lead surveyor then needs to figure out a surveying strategy for
the reach.
When revisiting a site, the initial parameters of the survey will be set up differently than when
establishing a survey. We recommend setting up the total station over one known control point and the
backsight over another known control point to re-establish the coordinate system.
Acceptable Errors for Revisiting a Survey:
Horizontal (includes the northing and easting): 0.000 - 0.050 (5 cm).
Ideally, it is best to have < 0.020 (2 cm) error.
Vertical (includes elevation): 0.000-0.030 (3 cm).
Ideally, it is best to have <0.010 (1.0 cm) error.
Do not continue the survey if errors are outside of the acceptable range. Stop and remedy
the problem. See Section 2.1 for tips on minimizing errors. An additional factor that can create
errors during a revisit is that the location of a control point may shift. The survey team can
determine this through check shots on multiple control points. If there is only one control point
with high errors, most likely its location has shifted. Do not attempt to move the control point.
Instead, record this in the field notebook and shoot in its new position.

Springs Monitoring Protocol – SOP#16 - Version 1.00 – April 2017
Page 15 of 80
Table 2. Summary of all data derived from the survey or used for revisits.
Data File type Location* Comments
Needed for
revisit
Survey Visit Notes Word Corrected
folder Typed up from field notes
X
Original raw data .JOB, .raw, .csv, and .txt Original folder Only one master copy!
Metadata Worksheet in FINAL Excel Corrected
folder
Corrections to raw data
Worksheet in FINAL Excel spreadsheet
Corrected folder
Final corrected data Worksheet in FINAL Excel spreadsheet & .csv file
Corrected folder
Cross-sections for each transect
Each transect has a worksheet in FINAL Excel spreadsheet
Corrected folder
Longitudinal profile for thalweg
Worksheet in FINAL Excel spreadsheet
Corrected folder
Post-processing notes
Word Corrected
folder Tied in closely with FINAL spreadsheet
Revisit file: Control coordinates (local & real-world)
Separate .csv and .xlsx files
Corrected folder
Uploaded to data collector for revisits
X
Revisit file: Headpin & ground surface coordinates (local & real-world)
Separate .csv and .xlsx files
Corrected folder
Uploaded to data collector for revisits
X
Plan map for revisit (or Revisit map)
PDF or JPEG file Corrected
folder
Created from real-world coordinates imported into ArcGIS
X
Survey reference photos
Powerpoint or Word Field Crews
folder
Photos of survey control points and descriptions of locations
X
Reference headpin photos
Powerpoint Field Crews
folder
Photos of headpins and descriptions of locations
X
Previous trip reports Word Field Crews
folder X
Spatial data for headpins, unmonumented transect ends, control points, monitoring wells, etc.
Shape files
Springs monitoring spatial data
folder
X
*Corrected folder =X:\Active_Monitoring_Projects\Springs\Data\Geomorphology\PARK\PARK
_Reach_YEAR\corrPARK _Reach_YEAR
Original folder = X:\Active_Monitoring_Projects\Springs\Data\Geomorphology\PARK\PARK
_Reach_YEAR\origPARK _Reach_YEAR
Field Crews folder = X:\Active_Monitoring_Projects\Springs\Field_Crews\PARK
Springs monitoring spatial data folder = G:\GIS\Data\Parks\PARK\Monitoring\SCPN_Springs
2.3 Establishing a new instrument setup Make as many shots as possible from each instrument setup, including transects, stream profile, control
points, and hydrologic instrumentation. Shoot in additional instrument setup locations as necessary to

Springs Monitoring Protocol – SOP#16 - Version 1.00 – April 2017
Page 16 of 80
complete the survey. Make sure to document any additional instrument locations and backsights used in
the field notes.
3. Overview of Trimble GNSS survey system
This document describes setup and operation of the Trimble R6 GNSS survey system used by
Northern Colorado Plateau Network (NCPN). The equipment is configured for single-base radio-
broadcast RTK method.
This system depends on using a coordinated point for setting up the base receiver.
If you are starting a new survey at a new site and have no known coordinated points then you
need to first select a base station location. See Base Station Selection (section 1.2).
If you are re-surveying a known site then you may need to find the base point using the
controller as a hand-held personal GPS device. See Using the controller as a “stand-alone” GPS
device (section 2.5).
3.1 The Gear: Trimble R6 Model-4 system using one rover.
The equipment shown is configured primarily for a single base radio broadcast RTK survey
method with one rover, however, additional rovers may be used as equipment and personnel allow.
Figure 6 provides a general idea of what a minimal setup might look like when packed for transport. We
often have an additional Pelican case and base battery as well as an additional solar charger setup to
charge spare batteries, computers, I-pad, etc. at camp. This is the minimal setup we use for an RTK
system using one rover. Typically, we are in remote areas in difficult terrain making a return trip to the
base for any reason during a survey, other than to turn it on or off, very time consuming and inefficient.
We minimize two common problems (power failure and wind tip-over of the radio antenna) by using a
solar battery charger and mounting the base receiver and radio antenna on high quality solidly built
tripods.

Springs Monitoring Protocol – SOP#16 - Version 1.00 – April 2017
Page 17 of 80
a)
b)

Springs Monitoring Protocol – SOP#16 - Version 1.00 – April 2017
Page 18 of 80
Figure 6 – Trimble R6 Model 4 GPS surveying equipment. a) equipment packed up in Pelican
cases and bags b) GPS equipment completely unpacked.

Springs Monitoring Protocol – SOP#16 - Version 1.00 – April 2017
Page 19 of 80
3.2 Base Station Selection:
This topic is often overlooked in the rush to get the base set up and get surveying so others who
need the survey data can also get to work. However, base station selection can have a very strong impact
on how efficiently, or inefficiently, this survey system functions. Because we are using single base radio
broadcast RTK survey method, any wireless communication problems involving satellite signal and/or
radio broadcast issues can cause extensive time consuming delays. Following are some helpful
guidelines when deciding on where to set the base point (in order of importance):
1. Pick a site that will allow for the best radio coverage to the sites it serves. Generally this
will be an elevated prominent spot if available.
2. Stay away from potential multi-pathing obstructions like chain link fence, canyon walls,
large monoliths, etc.
3. The site needs to have adequate sky visibility. Look for a spot that has the least amount of
tall obstructions like tall trees or canyon walls nearby. Better visibility to the South is
preferred if you have to make a choice.
4. What kind of permanent monument can you use (or are allowed to use) to mark the
point?
5. Reasonable accessibility to haul the gear in and out?
Example Base station setup:
Figure 7 shows a typical base station setup showing the base receiver over a survey mark (X
engraved into rock, Figure 9), the broadcast radio mounted on one of the legs of the base receiver tripod,
broadcast/transmit antenna (relatively short -- about 3m tall mounted on the other tripod), and the power
system (base battery and solar charger).

Springs Monitoring Protocol – SOP#16 - Version 1.00 – April 2017
Page 20 of 80
Figure 7 – Example of base station setup with base receiver, radio antenna, battery and solar
panel
Notice the rocks bungeed onto the tripod legs to help prevent wind topple and the solar panel is
weighted down also. The tripod legs are spread out relatively wide and the height is kept relatively short.
This base point was chosen to provide the best radio broadcast to the three sites it serves (Millard
Canyon, Queen Anne, and Bonita Bend in Canyonlands NP) while maintaining good sky visibility for
the base receiver and acceptable accessibility to haul the equipment in and out. This setup has slightly
different looking components but function identically to what is pictured in the equipment layout photo.
For instance, the radio coax cable here is yellow, not black and the stubby rod is black, not yellow.

Springs Monitoring Protocol – SOP#16 - Version 1.00 – April 2017
Page 21 of 80
Figure shows an example of
where there was no higher ground within
reasonable proximity to the survey site to
locate the Base radio and antenna. As a
result, the surveyor chose the base point
based on the other criteria listed above but
had to rely on a tall radio broadcast
antenna (approximately 20 feet tall) and
high transmit power (35 Watts) to make
the RTK survey system work effectively
throughout the entire area of interest.
Rover receivers still experienced radio
reception drop-out in some places where
dense vegetation was present. In this
situation, a repeater radio could be utilized
if one is available to re-broadcast the base
radio signal further. Currently the NPS
NCPN group does not have a repeater
radio setup.
Figure 8 – Example of base radio
setup with a tall antenna mast
Figure shows an example of a typical
base point where permanent rebar/markers are
not able to be placed. In these circumstances a 1-
2 inch cross/plus is engraved into a rock surface
using either a grout saw, rock chisel, or a battery
operated Dremel tool. These markings are very
unobtrusive and, unless you have been to the
location repetitively, you will need to use the
TSC3 survey controller (or similar) in the stand-
alone GPS mode to navigate to the point. These
crosses can fill in with a little sand/silt and
become nearly invisible. Often we put a
somewhat ‘suspicious looking’ rock or group of
rocks over it to mark the spot.
Figure 9 – Example of base station cross/plus etched into rock surface
4. Trimble TSC3 Hand Controller
This section describes controller operation and functionality for the Trimble Survey Controller
Model-3 (TSC3) device (Figure ). This is a Windows OS device with touch-screen capability. Although
it has many features and functionality, only certain functionality is enabled on this device, namely:

Springs Monitoring Protocol – SOP#16 - Version 1.00 – April 2017
Page 22 of 80
Global Navigation Satellite System (GNSS) functionality using external receivers and radios for
precise survey methods. (For us that means single base, radio broadcast, RTK method and other
static/semi-static methods.)
Stand-alone GPS navigation and positioning as a hand-held unit. (Internal GPS)
USB and Bluetooth communication standards.
Compass, Camera and Flashlight
4.1 Controller notification and keys:
Figure 10 – Trimble TSC3 hand
controller
1. LED status lights
2. Windows key
3. Trimble Access key
4. Curser direction (arrow) buttons
5. Camera key (Fn > 1)
6. Function (Fn) key
7. Power key (green). Quick press for
On/Off. Hold for reset (warm boot).
8. Upper case (Caps) key. One press for one-
time use, Fn > Caps for continued Upper
case.
9. Control (CTRL) for shortcut functions.
10. Touch screen with screen protector. Keep
a spare one or two in the field with you.
11. These four black keys can control the soft
key displays above them if there are any.
12. Escape (ESC) key
13. Enter key
14. Enter button
15. Backspace/Delete key (position curser
past item to be deleted)
16. Enter key
4.2 Opening a Job from the Device Home screen:

Springs Monitoring Protocol – SOP#16 - Version 1.00 – April 2017
Page 23 of 80
a.) The Device Home
screen. Notice the Device Status
Indicator bar at the top.
b.) Tapping on the device
status bar opens an icon menu
for the active device functions.
c.) Tapping on the
Speaker icon opens the sound
options, pick the one on the left
to adjust the volume and options
for ON/Off.
e.) Tapping the Clock
icon brings up the time and date
options. For accurate records,
please check/set the time
correctly. This is very important
for total station work as it is used
for the time stamp on all
measurements taken.
f.) Pressing the Windows
key (lower left) brings up the
Windows Applications screen.
The Trimble Access application
is currently highlighted.
g.) To create or open a
survey job you need to start the
Trimble Access application. Tap
The icon or press the Enter key
on the keypad (Figure item #3)
and you should briefly see this
message.
h.) This is the Trimble
Access Home screen. General
Survey is what you need to get
into the survey functions.
Settings will be discussed later
and the Files option is the same
as Windows Explorer.
i.) The upper bar names
the root folder, in this case nps.
Tap the General Survey
icon or highlight it using the
arrow key button and press the
Enter key.
j.) This is the General
Survey screen. The job’s Status
Bar is on the right side and the
job’s Status Line is along the
bottom of the display. These two
information boxes (and perhaps
the Map) is where you will spend
most all of your time looking at
the controller screen during a

Springs Monitoring Protocol – SOP#16 - Version 1.00 – April 2017
Page 24 of 80
survey.
k.) To open or create a
job, tap on the Jobs icon or
highlight the Jobs icon and press
the Enter key.
l.) The Jobs options
screen is displayed and you can
pick an option. In this case, we
have already created a job so it
just needs to be opened.
m.) Pick the job you want
opened. Here you can see some
obscure job names. Follow the
NCPN protocol for naming jobs
when you create one.
n.) This is the main
screen of the selected job. The
Status Bar and the Status Line
are vacant because there is no
survey running in this job at this
time. A main job screen is what
you need to have open to start
any survey session.
Note: if your job has not
already been created for you as
part of the field preparation
proceedures then you will need
to create a new job in the
controller. See section 3 on
Creating a Job to get to this
point of having a defined job
already created/loaded in the
controller as part of the pre-trip
procedures.
4.3 Camera function:
a.) Go to the Windows
applications screen and open
b.) Tap on the Camera
icon to open the camera
c.) The camera function
is opened and is ready to take a

Springs Monitoring Protocol – SOP#16 - Version 1.00 – April 2017
Page 25 of 80
Pictures & Videos or use the
shortcut key (Fn > 1) on the
controller (Figure , item #5) and
skip to c.)
function if not using the shortcut
keys.
picture. Here the controller case
laying on a desk is in view.
d.) Tap Menu to open
and check/set the resolution.
Sometimes when the controller
is reset the camera resolution
will be reset to the lowest value.
e.) Set the resolution to
2048x1536 to get nice sharp
pictures. We have had issues
with the highest setting.
f.) After taking the
picture this Media file screen
appears. Use the drop-down list
to indicate how you want the
image associated with the
collected survey data. Then tap
Accept or press the Enter key to
store it.
4.4 File Explorer and USB flash drive access
To access File Explorer navigate to the Windows home screen (Windows key > File Explorer >
Trimble Data). This directory will typically contain at least these two folders: 1) The named Root
Directory (i.e. NPS or Rover #), and 2) The System Files.
The System Files directory contains all the files needed to operate the controller within the
general survey program (i.e. geoid models, survey styles, feature code libraries, etc.).
The named Root Directory contains all the files associated with a given job (i.e. Job files, media
files/photos, and any linked files like previous survey data in a csv format). The root folder is
where you will copy/paste files that are needed in referencing previous data sets, previous job
files, and/or job templates.
The easiest way to transfer files between controllers is to use a USB flash drive. To find the USB
flash drive, insert the flash drive into the USB port. Go to: Windows home screen (Windows key) > File
Explorer > My Device > Hard Disk (the USB flash drive is recognized as a hard disk).
To copy files to the flash drive:
Highlight the file(s) in either the System Files directory or the named root directory. Tap and
hold on the highlighted file. Pick Copy when the popup menu appears.
Tap Up, and navigate to the same directory the job is in (Trimble Data > {Root Directory}).
Tap Menu, scroll to Edit, and choose Paste. The file(s) will now be copied into the root
directory. All data files associated with the job must be in the same directory as the job. Once
your reference csv files have been copied into the Root Directory you will then be able to link to
those files in the Job Properties screen described in section 3.1.2.
4.5 Bluetooth connectivity
There are three parts to the Bluetooth wireless system:

Springs Monitoring Protocol – SOP#16 - Version 1.00 – April 2017
Page 26 of 80
Turning the Bluetooth function ON or OFF.
Paring devices in the Windows environment.
Assigning survey functions of paired devices in the Trimble Access survey application.
First, make sure the Bluetooth functionality is turned on and then make sure the receivers are
known by paring them and finally assign the appropriate devices as either a GNSS base or GNSS rover.
Press the Windows key again to put you back in the survey job.
Turning the Bluetooth device On or Off:
a.) From a job screen,
press the Windows key. Scroll
to Settings and tap to open.
b.) From the Settings
screen, tap Bluetooth to open.
c.) Scroll right/left to get
to the Mode screen. Tap in the
Turn on Bluetooth box to place
an X there then tap OK or press
Enter to turn it on.
d.) In the Power screen,
make sure these are turned off
(unchecked) to prevent the
Bluetooth device from starting
unnecessarily and causing
power drain.
Pairing a Bluetooth device:
a.) See Turning Bluetooth On or Off to get b.) Tap Add new device… if you need to

Springs Monitoring Protocol – SOP#16 - Version 1.00 – April 2017
Page 27 of 80
to the Bluetooth management screen. Scroll
right/left to get to the Devices screen shown here.
First check to see if your device is already paired
by scrolling down to see the list of paired devices.
pair a device. Make sure the device you want to
pair is turned on. The controller should recognize
the device and you can rename it there. You don’t
need to create a password and it is best to just
leave this blank.
Assigning Bluetooth survey devices:
a.) Push the Trimble key
and select Trimble Access to get
to Access main page. Open the
Settings menu by tapping on it.
b.) Open the Connect
menu by tapping on it.
c.) Pick the Bluetooth
option.
d.) The Bluetooth
assignment settings screen.
This tells the Access survey
application which paired
devices it should be
communicating with for a
specific function in the survey
system. Paired devices will
appear in the drop-down list
next to the device function.
Here, the base receiver is
selected from the list of paired
devices in the Connect to GNSS
base drop-down list.
e.) This shows the rover
receiver is selected from the
paired devices in the Connect to
GNSS Rover drop-down list. If
there is more than one rover
listed, make sure you pick the
right one from the list. This is
why its good practice to list the
receiver’s serial number in the
device name (when pairing), so
you can physically check the
number on the bottom of your
receiver unit. It can be rather
confusing when your controller
is paired with someone else’s
rover receiver. Tap Accept to set
the device assignments.
f.) The last screen of the
Bluetooth assignment settings
in Trimble Access is this
Automatically enable Bluetooth switch. If this is check-marked
then the Windows Bluetooth
device > Mode > Turn on
Bluetooth option will always be
on. Even if you go in and turn it
off (uncheck the box in Mode) it
will turn on again as soon as
you exit. This switch means if
Trimble Access is running the
Bluetooth device will be turned
on. I prefer to keep this option
off (unchecked) to save power
when I’m not actually
surveying.

Springs Monitoring Protocol – SOP#16 - Version 1.00 – April 2017
Page 28 of 80
4.6 Using the controller as a “stand-alone” GPS device
The TSC3 controller can be used as a traditional hand-held personal GPS unit. It is often used to
navigate to a base point monument.
a.) From the main Job
screen, open Instrument.
b.) Pick Navigate to
point. The right LED light on
the controller should start to
blink green every 5 seconds,
letting you know the internal
GPS is functioning.
c.) You need to have a
point keyed in or be linked to a
file of points.
d.) A point has been
selected. Press Start or the Enter
key. You may see a message
asking you to calibrate the
compass.
e.) It may take a few
minutes to get its current
position and calculate the
direction you need to go.
f.) It figured it out. The
N compass needle points North.
You need to go the in the
direction of the large arrow
relative to North. When you get
near the point it will change to a
+ and circle diagram as shown
in the Stakeout a point routine.
Pressing Esc twice will close the
stand-alone GPS function.
When you start an RTK survey
this will also close it.

Springs Monitoring Protocol – SOP#16 - Version 1.00 – April 2017
Page 29 of 80
You can also get the coordinates of your current position:
a.) From the main Job
screen, open Instrument.
b.) Pick the Position
option. The right LED light on
the controller will start to blink
every 5 seconds, letting you
know the internal GPS is
functioning.
c.) It may take a few
minutes to generate your
position. The undefined values
(question marks) will populate
with grid coordinate values.
d.) Tapping the Options
soft key allows other display
options for the position, These
are the local geographic
coordinates. Pressing Esc will
close the stand-alone GPS
function. When you start an
RTK survey this will also close
it.
5. Creating a Job in the TSC3 Hand Controller
Trimble Access is the field surveying application software found on the TSC3 survey controller
device. You need to have an Access Job file defined and opened to start any kind of survey. This
section describes how to create an Access Job file. For sites that have been previously surveyed, the Job
file is probably easiest and safest to create in the office before the field trip to avoid last minute surprises
about missing data/missing files or incorrect project settings (i.e. datum and projections). However, for
new surveys having no stakeout data, you can create the new job in the office if you know about it ahead
of time or the Job can be defined at the site in the field during base startup.

Springs Monitoring Protocol – SOP#16 - Version 1.00 – April 2017
Page 30 of 80
a.) The main job screen.
Notice there is No Current job in
the title bar. Tap Jobs or
highlight Jobs and press the
Enter key.
b.) On the jobs options
screen tap New job.
c.) The New job screen
will then appear. Name the job
according to the NCPN format
"Project+Site+year+rover#
+person" (i.e.
CanyQA2014r2HoJo).
d.) To set the job
properties, Tap on the Coord.
Sys.: entry box.
e.) The Select coordinate
system options screen will apear.
Select from library opens up the
pre-defined coordinate system
library.
f.) This screen is where
you define the coordinate
system. Use the drop-down lists
to fill in the various boxes.
The values shown are the
coordinate system settings that
are used for all five of the NCPN
Big Rivers Monitoring Sites
(YAMPA, GREEN, CANY,
BLCA, and CURE).
g.) This is page-2 of the
Select coordinate system screen.
The Coordinates (type) option is
either Grid or Ground. Choose
Grid for this setting to generate
h.) A Project height must
be defined. This is the message
you get when you try to store the
defined coordinate system
without defining the project
i.) After Storing the job’s
coordinate system definition you
will be back at this main job
screen. This example job is
called junk.

Springs Monitoring Protocol – SOP#16 - Version 1.00 – April 2017
Page 31 of 80
true UTM grid coordinates.
Ground elevations will be
computed using the Geoid model
set on the previous page.
The Ground setting
means the grid coordinates will
be computed at a scaled up
ground elevation. These, then,
are not UTM grid coordinates as
UTM is defined at the ellipsoid
height.
height. For RTK-GNSS jobs this
can be any value. Zero is a good
option if you don’t know the
average elevation in the area that
you are working.
Note: Project height is
used to compute an elevation
(and thereby a grid coordinate)
of 2D points, which you won’t
have any running a RTK-GNSS
system since this allows you to
measure 3D points (x,y,z) within
a tolerance of a couple
centimeters.
5.1 Adding stake-out information to the Job:
If this is a return trip to a known site then you will have coordinated points and possibly transect
lines that you are looking to repeat survey measurements at. This is called “stake-out” data. This section
describes various ways to add stakeout data to the job. There are basically three methods, one of which
is hand entering all the data called “keying in”. As you can imagine, this is OK for a few points but is
not an acceptable method for many points. The other two methods involve getting data from files. The
two methods for this are data file import and data file link.
5.1.1 Importing data to a Job:
When using the data file import method, all data points that are imported into the current job are
essentially copied into and made a part of the existing job’s data set. Survey jobs that accumulate lots of
data can be unwieldy to manage if all the stakeout data is imported/copied into the job and gets added
together with the current survey topo measurements. Therefore, this method is not recommended for
including previous stake-out data as a reference for the current field survey job. The other method,
described below as linking, is the preferred method for accessing previous survey data from the current
job.
5.1.2 Linking a data file to a Job:
During a repeat survey there exists previous data such as control points, photo points, veg plots,
transect lines, etc. These items usually need to be found by staking out because the purpose of the repeat
survey is to gather data in the exact same horizontal location as previously done.
Terminology Note: Stakeout is a term used by surveyors (and the survey application software)
to precisely locate a known point when performing a survey while Navigate is a term, generally used by
everyone, when roughly locating a known point with a stand-alone GPS unit not involved in a precise
surveying system.
There are two ways of accessing known (coordinated) data points in either Stakeout or Navigate
mode. One is by importing the data into the job and the other is by linking data files. Linking files is
easy to do but requires that the files be created correctly and available in the controller. This takes a bit
more time and effort to set up than importing the data directly into the job but it makes the field work
much more manageable by logically isolating data into subsets by type and location.
Linking only those files having data of a certain type on your current transect or site will serve to
keep the map less cluttered and the stakeout list much shorter and manageable. Linked files are
usually CSV grid coordinate files and are generally created in the office and uploaded to the

Springs Monitoring Protocol – SOP#16 - Version 1.00 – April 2017
Page 32 of 80
controller into the same root folder as the job. Files may be linked/unlinked from a job at any time
during a survey. (Menu > Jobs > Properties of job > Linked files).
a.) From the main job
screen, open Jobs.
b.) Pick the Properties of
job option.
c.) Tap on the Linked
files option. Currently, there are
no linked files.
d.) Tap in the check-mark
area for each .csv file you want
linked to the job. You can link to
jobs also but this can cause some
unexpected problems if you are
loading previous versions of an
Access Job file. Tap Accept.
Note: CSV files must be
in PNEZD format with no
header, just 5 columns of data.
PNEZD means Point
name, Northing (Y
coordinate), Easting (X
coordinate), Z
(elevation), and
Description.
e.) You now see there are
4 linked files to this job. Tap
Accept. Now when you list
points you will see all the points
in the job as well as those in the
linked files. The points in the
linked files are not imported into
the job until a function needs the
coordinates. This has the
advantage of keeping the job free
of unnecessary clutter and copies
of points that you don’t need.
Points within linked files are not imported into the current job until they are used for a job function
such as Stakeout, or Compute Inverse. When a point is imported into the job from a linked file you
will hear the controller make a “Chunk” sound. Review of the job will show the point with a small
“C” icon next to it indicating it was copied into the job.
Data in linked files can be viewed in the Point Manager and displayed in the Map view as shown in
Figure 11 below. The blue colored data is from the linked file(s). The black colored data is currently
in the job.

Springs Monitoring Protocol – SOP#16 - Version 1.00 – April 2017
Page 33 of 80
Figure 11 – General survey map view showing current surveyed data along with data from a
linked file for reference.
5.1.3 Keying in data
As mentioned at the beginning of this section, points and certain types of data objects created by
points can be hand entered by typing in the point name, coordinates, and description. It is recommended
to have a paper copy of control point coordinates in case access to electronic files is lost. To key in
points, go to: The main menu of the existing job > Key in > Points. Enter the Point name, Northing,
Easting, Elevation, and Code as they appear on the printed copy. Leave the Control Point option
unchecked even for control points. This makes it easier to manipulate in the office software later.
6. Step 1 - GNSS Base Station Setup and Assembly
Figure shows all of the base station equipment unpacked and each item identified below:

Springs Monitoring Protocol – SOP#16 - Version 1.00 – April 2017
Page 34 of 80
Figure 12 – RTK base station equipment unpacked
Items in figure 12:
1. 42-watt solar panel with connecting cable
2. Extension rods for radio antenna
3. Tribrach base
4. Tribrach adaptor (removable mount)
5. Flat disc for mounting radio antenna rod on
tripod
6. Long whip antenna
7. Short whip antenna
8. Antenna base (connects to antenna coax
cable #13 and whip antenna #6 or #7)
9. Solar panel voltage regulator/battery saver
10. R6-4 base receiver dome
11. Short extension pole for base receiver
(0.2m)
12. TDL-450 broadcast radio
13. Radio antenna coax cable with fixed
antenna mount
14. Power/data cable for base receiver and
broadcast radio
15. Marine battery with quick connect cables
for base receiver power and solar panel
16. Heavy duty wooden tripods for base and
radio antenna

Springs Monitoring Protocol – SOP#16 - Version 1.00 – April 2017
Page 35 of 80
The Basic RTK system setup connects the battery (power), broadcast radio, antenna, and
GPS receiver using two cables: one is the combination power/data cable and the other is the
radio antenna coax cable (alternate coax cable may be yellow in color). Figure 13 shows the base
receiver and radio setup and all cable connections without being mounted on the tripods. The
following sections describe how to assemble each of the components in more detail and mount
on the tripods.
Figure 13 – Example of basic RTK base station system components and connections
Figure 14 – Base tripod with
tribrach base mounted
Base station tripod setup and receiver assembly
a) Set up the base tripod over the control point
(i.e. “x” in a rock or rebar) and roughly level
the tripod head by eye by adjusting the legs and
tighten the thumb screws firmly. Screw the
tribrach base (adaptor removed) onto the base
of the tripod and level over the control point:
Roughly center the tribrach on the tripod head
as shown in Figure .
Adjust the three tribrach thumb screws to be
near the mid-point of their travel range. This is
represented by a groove mark in the post
holding the thumb screw. The top edge of the
thumb screw should be near the groove mark.
Adjust the eyepiece reticle (cross-hair) to your
eyesight to eliminate parallax error (sharp, crisp
Springs Monitoring Protocol – SOP#16 - Version 1.00 – April 2017
Page 36 of 80
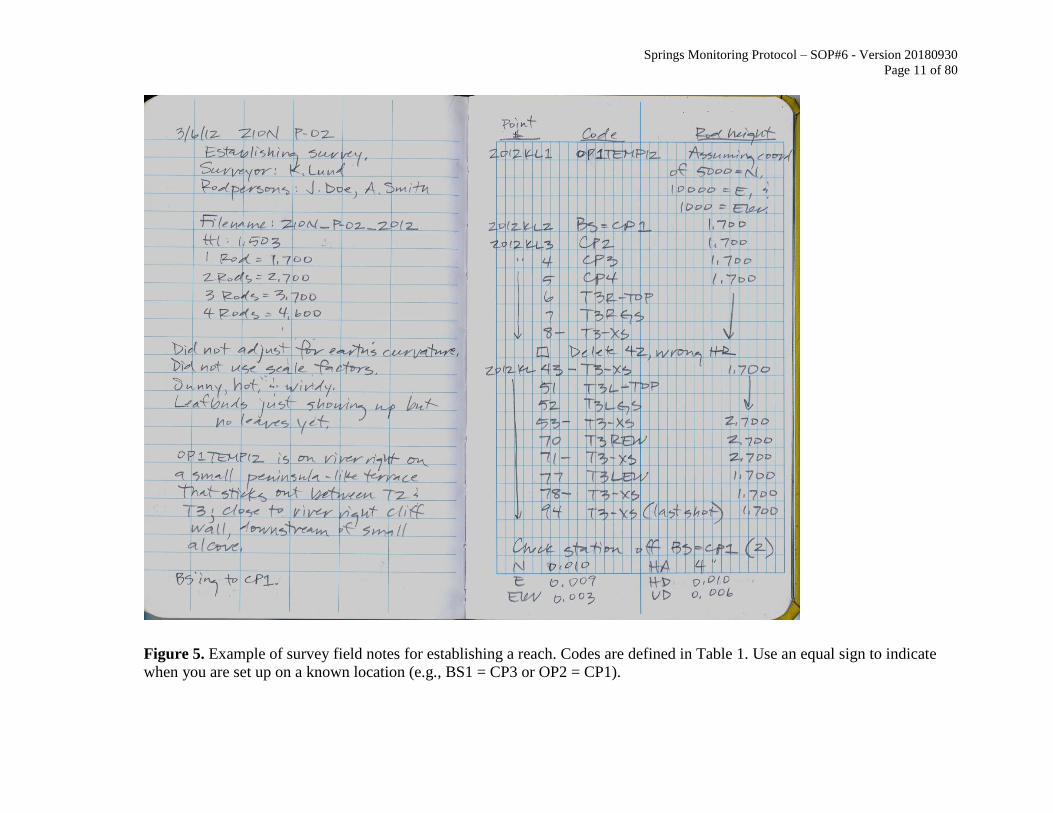
Figure 15 – Base tripod
anchored with tie-down straps
lines).
Roughly adjust the focus if necessary and
center the tripod over the base point.
Using full body weight, press the tripod shoes
into soft ground or verify solid setup on rock
surface and finish leveling/setting up the tripod.
Anchor the tripod using either large rocks on
the tripod shoes (shown in Figure ) or using tie-
down straps connected to a strap around the
tripod head and anchoring them into the ground
with stakes (Figure ).
o Note: this anchoring process should be
done for both the base station tripod and
radio antenna setup to insure that neither
of the tripods get blown over in high
winds or disturbed by wildlife.
Figure 16 – Base station
receiver setup
b) Screw the stubby pole (0.2 meter) onto the
tribrach adapter and screw the base receiver
onto the stubby pole. Plug the combination
power/data cable to the round port on the
receiver (port#1). The connector is keyed, line
up the red marks first then carefully but firmly
push it in (pull the small wire loop to release the
small prongs and remove it). Now attach this
assembly to the tribrach base (as shown) and
close the tribrach latch to lock it in place. The
base receiver is now set up.

Springs Monitoring Protocol – SOP#16 - Version 1.00 – April 2017
Page 37 of 80
Figure 17 – Base station radio
setup
Base radio and antenna assembly:
Set up another tripod within a couple meters of
the base receiver. Lengthen the legs to nearly the max
and spread them out pretty far to reduce the chances of
the wind blowing it over. Strap it down with a tie-down
kit if there is a chance of this. Roughly level the tripod
head by eye by adjusting the legs and tighten the thumb
screws firmly. Its only job is to support the radio mast
so it doesn’t need to be perfectly level and you can
adjust it after you have the mast up. Note that the radio
antenna can be mounted on anything (such as a pole
lashed to a tree or fence post) as long as it is positioned
relatively vertical and as high as is reasonable for the
situation at hand. A tripod is necessary where there is
no other way to mount the radio mast and always
works. Other methods should be considered “make
shift” or “less than optimal but it will work”
approaches in case of a loss of a tripod.
In the large photo of Figure the radio setup is
shown with no additional antenna mast (so it fits into
the photo). It is recommended to use at least one
telescope pole (shown mounted in the inset photo) to
raise the antenna. Antenna height is a big factor in
effective broadcast reception at the rover. The choice of
base point location will determine how effective the
radio coverage will be. Low elevation base points may
mean using a very tall (unwieldy) antenna mast which
will require additional strapping/tethering for support
(see Figure 8). There are two whip attachments, the
short whip is shown. The long whip (5dB gain) sends
the same transmit power but shapes the signal pattern
flatter (ie – less vertical coverage) so the transmit
power is concentrated in the horizontal direction
perpendicular to the antenna axis. This works best for
long distances. If you are working relatively near the
base station and it is up higher in elevation, use the
short whip.

Springs Monitoring Protocol – SOP#16 - Version 1.00 – April 2017
Page 38 of 80
Figure shows an additional 42W solar panel charging system (PowerFilm product)
which helps prolong the life of the base battery (12V AGM, deep cycle) when operating at
higher wattage radio broadcast for a long time. At lower broadcast wattages it can keep the
battery fully charged if it receives full sun (YMMV).The small square object is a voltage
regulator to prevent overcharging. This setup typically provides enough charge during the day to
maintain the battery well above 50% and eliminates the need for a generator or alternate power
source to re-charge the base battery at night. This is especially important when having to operate
in remote areas and when floating the river when transporting generators and fuel can be
problematic and noisy.
Caring for the solar panel: Although these are really pretty tough they can be damaged by
rolling them up improperly. The directions say to roll them up with the solar side facing out and
not to be less than 4” diameter. Be careful of the wire pig-tail. When setting it up, connect the
voltage regulator to the battery first. Then make the final connection between the voltage
regulator and the solar panel.
Figure 18 – Base station battery and 42 watt solar panel charging system
7. Step 2 - Starting the GNSS base station
7.1 Start the base from a known point:
This section describes how to start the base survey session utilizing a control point with
known coordinates.
Key points:
The base and rover receivers for this system are identical units but we have assigned one
to be the base and the other to be the rover to simplify the setup process (Trimble Access
Springs Monitoring Protocol – SOP#16 - Version 1.00 – April 2017
Page 39 of 80
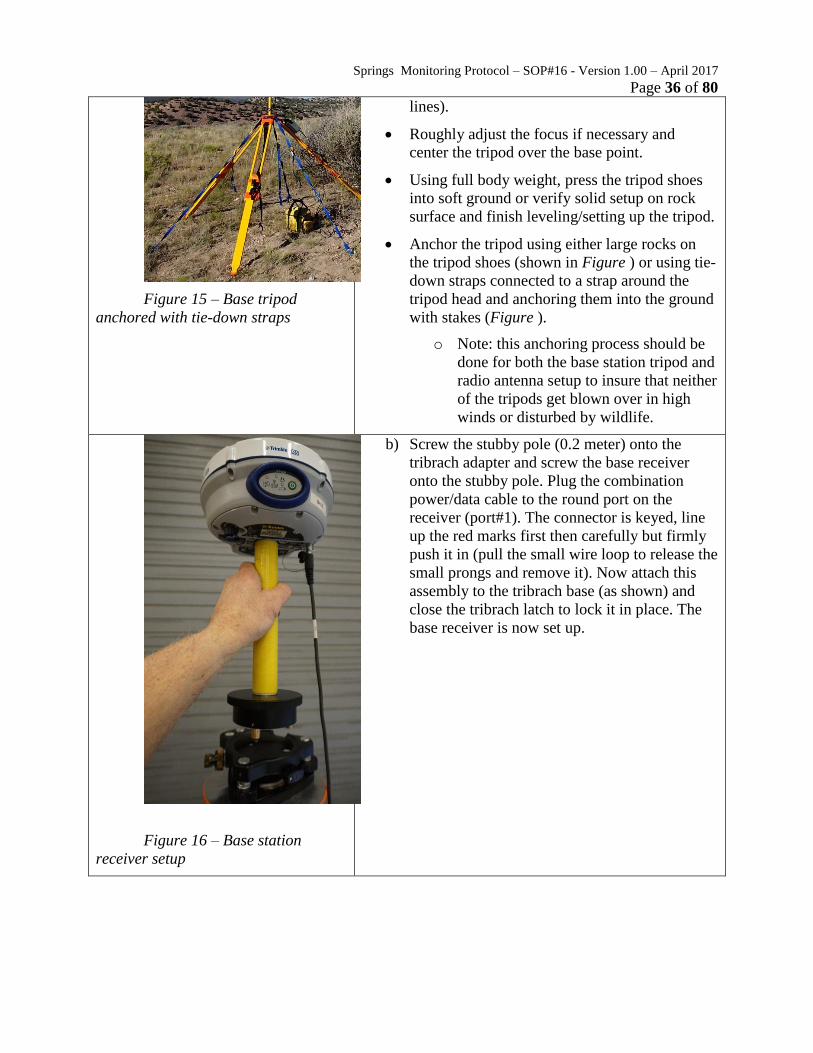
> Settings > Connect > Bluetooth). Each of the receivers also have printed labels on them
for easy identification.
The base height (height of instrument) and rover height (rod height) are measured to
different places on the receivers respectively. The base is measured to the center of
bumper and the rover is measured to the bottom of antenna mount.
The base is normally set to log base data based on the parameters we have set in the
survey style (R6RTK-TDL). The base receiver needs to collect data for at least 2 hours to
be post-processed effectively using OPUS, preferably longer, but can’t exceed 24 hours
continuous.
Step-by-step process for starting base station using the Trimble TSC3 hand
controller:
At this point the base receiver and base radio have been powered on. There is no transmit
signal (Tx) light from the radio, only the green power light is on. Similarly, the base receiver has
a steady green power light and a steadily flashing orange light indicating it is receiving satellite
signals. The radio transmission light is not on. The following sequence describes how to start the
base survey session, after which a rover survey session may be started.
a.) The main job screen.
Notice there is nothing in the
status bar except the controller
battery status and the status line
is empty. Go to Measure.
b.) Pick the survey style
you’ll be using. R6RTK-TDL is
configured to work with the
NPS base receiver and
broadcast radio. More on survey
styles elsewhere.
c.) Pick Start base
receiver. To initiate
communication with the base.
You need to be within Bluetooth
range (generally 25ft.)
d.) You should briefly e.) If the receiver is not f.) When you have

Springs Monitoring Protocol – SOP#16 - Version 1.00 – April 2017
Page 40 of 80
see this screen.
If it hangs on this screen
then the Bluetooth device in
the controller needs to be
turned on or setup (see
section 2.5 Bluetooth
connectivity).
Quick check: Is the blue
light on the controller flashing
once every 5 seconds? If not go
to Windows > Settings >
Bluetooth > Devices > Mode.
If it says connecting via
cable then the receiver needs
RTK survey device
assignment (Trimble Access
> Settings > Connect >
Bluetooth).
listed in the Connect to GNSS
base: drop-down list then it
needs Bluetooth pairing
(Windows > Settings >
Bluetooth > Devices > Add new
device…).
You should also briefly
see this starting base message
and hear some connection
sounds.
established communication with
the base receiver you will be in
the Start base screen. The status
bar shows it’s tracking 17
satellites and the base battery is
fully charged (bottom battery
icon). The highlighted Point
name box is asking you to
define the base point position
(default is by Point name). You
can pick different ways to
define the point by tapping on
the drop-down list arrow.
g.) Note: At this point, it
is assumed you have a known
(coordinated) base point. If you
are starting from an unknown
base point, refer to the part
about starting from a “Here”
position.
If there is a defined base
point coordinate by name (from
you either hand-entering it into
the job via Key in, or from a
linked or imported file) then you
can pick it from the list of
points. Tapping the drop-down
arrow brings up a list of options
on how to get a base point. Use
the List option to bring up the
list of named coordinated
h.) After picking the
base point from a list (or keying
it in), the point name, code, and
observation class will be filled
in.
Next is to measure the
antenna height. Antenna height
(Uncorrected) means you are
providing a raw measurement.
You don’t apply any
modifications to this raw
measurement. Notice the default
Measured to point for the base
receiver is Center of bumper.
The software will correct this
raw slant measurement to a
vertical distance to the ARP
(Antenna Reference Plane).
i.) Be sure to measure
the base receiver height from
the survey point (monument
object) up to the center of
bumper and enter it. In this
case, it is 1.536m.

Springs Monitoring Protocol – SOP#16 - Version 1.00 – April 2017
Page 41 of 80
points.
j.) The antenna height
has been entered. Now the Start
soft key becomes enabled
because the required
information is present.
Other information on
this screen:
Station index is the ID
number assigned to this
base receiver.
Transmit delay has to do
with multiple bases
operating at the same
time on this radio
frequency. Leave it at
zero.
Verify that the
information on this
screen is correct and tap
Start or press Enter.
k.) You should briefly
see this message.
Notice the icons in the
status bar area of the screen.
These represent:
Battery conditions: 1st is
controller, 2nd
is the
device the controller is
connected to, in this case
the base receiver.
Satellite information
icon and number
tracked.
GNSS functions menu.
Active base icon with
base height.
l.) Then it should halt on
this message until you OK it.
m.) After you OK it you
will be returned to the main job
screen. The base has now started
and the status line at the bottom
indicates a base survey session
is in progress. You can now
start a rover survey session.

Springs Monitoring Protocol – SOP#16 - Version 1.00 – April 2017
Page 42 of 80
At this point it’s a good
idea to check the receiver and
radio.
The green power light on
the base receiver will
flash off briefly every
five seconds. This is
your confirmation that
it’s logging base data.
The green radio light on
the receiver will start
blinking every second as
it computes correction
information.
The red TX (transmit)
light on the radio will
blink once per second as
it transmits the
correction on the
broadcast frequency.
NOTE: It is good practice to keep a log sheet of the base set-up (Figure ). This includes
control point used, base height measurement, start times and dates, radio transmit power,
broadcast antenna height, and any other relevant issues to setting up the base station. When the
survey is ended, make a note of the base file name (number) and end time. Check to see that the
receiver is still centered over the base point and that the height is still the same. These notes will
come in very helpful in the office if you have multiple base setups and/or base sessions as well as
for future planning if you return to the same site repeatedly.

Springs Monitoring Protocol – SOP#16 - Version 1.00 – April 2017
Page 43 of 80
Figure 19 – Example of survey metadata sheet
Radio transmit power:
The TDL-450H radio has several transmit power settings. These range from 2W to 35W.
With good base station placement, the radio transmit power can be kept relatively low. 8W is
generally more than enough to handle most sites. The transmit power can be changed by using

Springs Monitoring Protocol – SOP#16 - Version 1.00 – April 2017
Page 44 of 80
the arrow buttons to scroll through the menu. Current settings are marked with an asterisk. Scroll
left/right to find the power setting. Scroll up/down to find the one you want. Press the power
button to accept the change. The radio will last approximately a day at 8W with no solar charger.
Springs Monitoring Protocol – SOP#16 - Version 1.00 – April 2017
Page 45 of 80
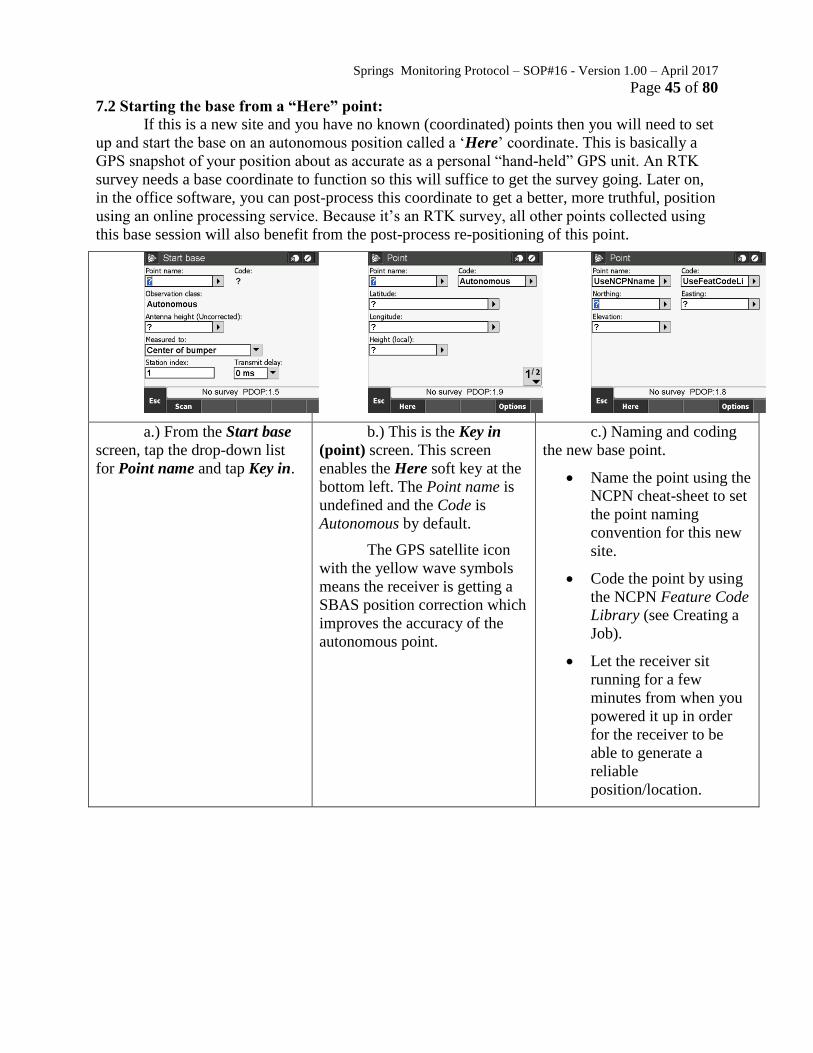
7.2 Starting the base from a “Here” point:
If this is a new site and you have no known (coordinated) points then you will need to set
up and start the base on an autonomous position called a ‘Here’ coordinate. This is basically a
GPS snapshot of your position about as accurate as a personal “hand-held” GPS unit. An RTK
survey needs a base coordinate to function so this will suffice to get the survey going. Later on,
in the office software, you can post-process this coordinate to get a better, more truthful, position
using an online processing service. Because it’s an RTK survey, all other points collected using
this base session will also benefit from the post-process re-positioning of this point.
a.) From the Start base
screen, tap the drop-down list
for Point name and tap Key in.
b.) This is the Key in
(point) screen. This screen
enables the Here soft key at the
bottom left. The Point name is
undefined and the Code is
Autonomous by default.
The GPS satellite icon
with the yellow wave symbols
means the receiver is getting a
SBAS position correction which
improves the accuracy of the
autonomous point.
c.) Naming and coding
the new base point.
Name the point using the
NCPN cheat-sheet to set
the point naming
convention for this new
site.
Code the point by using
the NCPN Feature Code
Library (see Creating a
Job).
Let the receiver sit
running for a few
minutes from when you
powered it up in order
for the receiver to be
able to generate a
reliable
position/location.
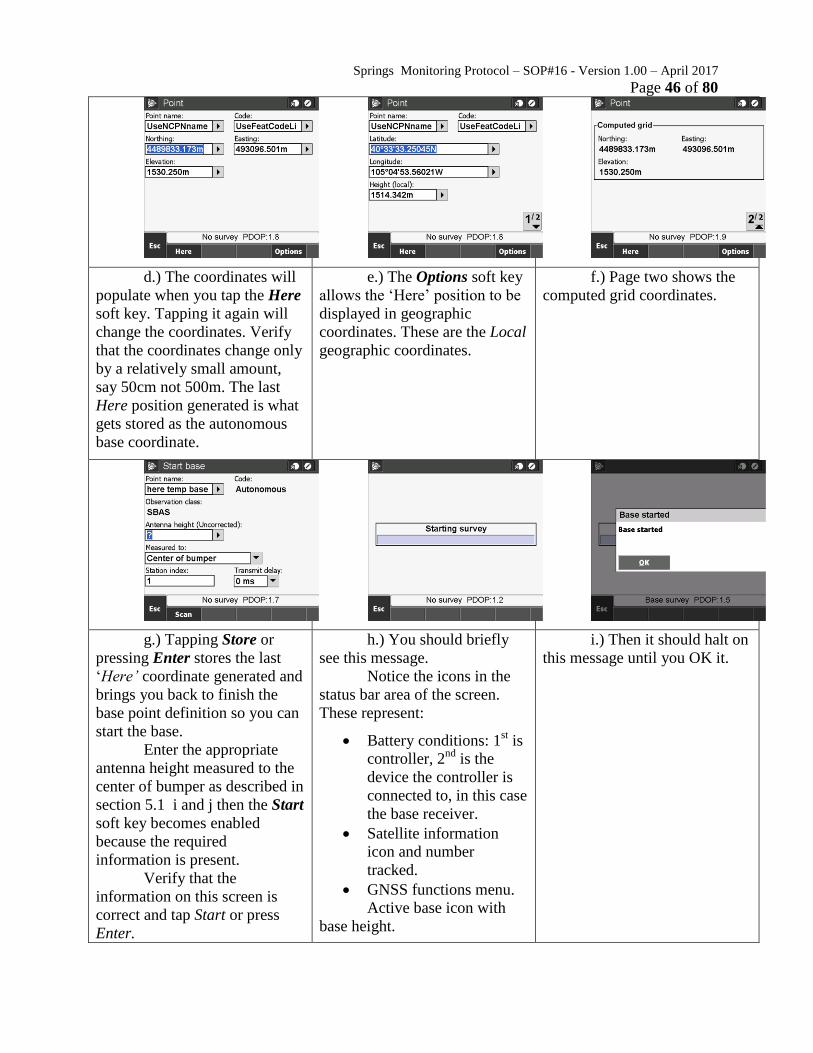
Springs Monitoring Protocol – SOP#16 - Version 1.00 – April 2017
Page 46 of 80
d.) The coordinates will
populate when you tap the Here
soft key. Tapping it again will
change the coordinates. Verify
that the coordinates change only
by a relatively small amount,
say 50cm not 500m. The last
Here position generated is what
gets stored as the autonomous
base coordinate.
e.) The Options soft key
allows the ‘Here’ position to be
displayed in geographic
coordinates. These are the Local
geographic coordinates.
f.) Page two shows the
computed grid coordinates.
g.) Tapping Store or
pressing Enter stores the last
‘Here’ coordinate generated and
brings you back to finish the
base point definition so you can
start the base.
Enter the appropriate
antenna height measured to the
center of bumper as described in
section 5.1 i and j then the Start
soft key becomes enabled
because the required
information is present.
Verify that the
information on this screen is
correct and tap Start or press
Enter.
h.) You should briefly
see this message.
Notice the icons in the
status bar area of the screen.
These represent:
Battery conditions: 1st is
controller, 2nd
is the
device the controller is
connected to, in this case
the base receiver.
Satellite information
icon and number
tracked.
GNSS functions menu.
Active base icon with
base height.
i.) Then it should halt on
this message until you OK it.

Springs Monitoring Protocol – SOP#16 - Version 1.00 – April 2017
Page 47 of 80
8. Step 3 - Assembling the rover and starting an RTK survey
8.1 Rover assembly
Figure -a shows the Trimble R6 rover survey equipment along with all the chargers and
accessories packed in the pelican case for storage/transport in the field. Figure shows the
minimum equipment that must be assembled to conduct a survey in the field and includes the
following: adjustable rover rod, rover receiver, radio whip antenna, 2 rover batteries, two-piece
controller mounting bracket, and TSC3 controller.
a)
Figure 20 – Trimbel R6 rover a) pelican case containing rover survey gear and
assessories b) rover survey gear unpacked
Figure shows the rover gear assembled and ready to setup an RTK survey. The
connection between receiver and controller is via Bluetooth wireless. The rover receiver accepts
incoming RTK correction information from the base via the whip antenna.
Figure 21 – Trimble R6 rover gear assembled
Be vigilant about rover rod heights. Make it a habit to continually compare the setting
shown on the controller to what the rod height is actually set at. See the part about measuring
points for more info on rod heights.
The scale printed on the rod is for rod heights measured to the bottom of the antenna
mount. In the case of the R6 receiver it’s also the bottom of the receiver.
It is recommended to pin the rod height at one of the convenient locations using the
attached pin (1.8m or 2m shown in Figure 22). Rod height mistakes are the most

Springs Monitoring Protocol – SOP#16 - Version 1.00 – April 2017
Page 48 of 80
common surveying mistake made and are very difficult if not impossible to fix after
the survey has ended and you’ve left the site.
Fixed-height rods (2m is common) are available and go a long way toward
preventing rod height mistakes, but the adjustable height rod allows us to work in
places where a fixed-height rod would either make it very difficult or even prevent
certain measurements.
Figure 22 – adjustable height rover rod with locking pin
Starting the Rover session:
Once the base station is set up and started then a rover survey session can be started. This
is the last step in getting the RTK survey system functioning. Collecting survey data can begin
once a rover session is started. Any number of rovers can be used in an RTK survey which is
what makes this method so powerful, as the work can be divided up between rover operators.
Key ideas:
Be sure to set the rover’s controller to the correct job.
The point name will be a hold-over from the last point name entered in any job. Be sure
to change it to the correct naming format.
Entering the correct point name does not set the naming pattern. Take a junk/temporary
shot to set the naming pattern for the job. The NCPN cheat-sheet shows how to set the
naming convention.
Be sure to stake out a known point (preferably a control point) if this is a resurvey (see
Staking-out points). This verifies the system is working correctly and that no blunders
have occurred during job creation, equipment setup, or survey startup. If it’s a new site
then set an additional control point and have every rover measure it and then compare
coordinates.

Springs Monitoring Protocol – SOP#16 - Version 1.00 – April 2017
Page 49 of 80
a.) Main job screen
showing the base station in
operation. Go to Measure.
b.) Pick the survey style
R6RTK-TDL (same as used for
the base setup).
c.) Pick Measure points.
d.) You should briefly
see this screen.
If it hangs on this screen
then the Bluetooth device in
the controller needs to be
turned on or setup (see
section 2.5 Bluetooth
connectivity).
Quick check: Is the blue
light on the controller flashing
once every 5 seconds? If not go
to Windows > Settings >
Bluetooth > Devices > Mode.
If it says connecting via
cable then the receiver
needs RTK survey device
assignment (Trimble Access
> Settings > Connect >
Bluetooth).
If the receiver is not listed in
the Connect to GNSS base:
drop-down list then it needs
Bluetooth pairing (Windows
> Settings > Bluetooth >
e.) You should briefly
see this message and hear some
connection sounds.
f.) You should briefly
see this message then be
presented with a list of available
base stations broadcasting on
this radio frequency (next
screen).

Springs Monitoring Protocol – SOP#16 - Version 1.00 – April 2017
Page 50 of 80
Devices > Add new
device…).
g.) This shows only one
base station is detected
(normally the case due to our
remote sites and government
radio frequency) and the radio
reception is 100%. The index is
the ID number assigned to the
base in the survey style. If you
see other base stations
broadcasting on this radio
frequency then you’ll see them
listed also. Make sure you pick
the correct base ID.
Tapping Accept or
pressing Enter starts the rover
survey session and returns you
to the Measure points screen.
You may briefly see another
Starting survey message and
hear a message saying ‘waiting
for information from the base’
as well as some more
connection sounds as base
information is imported into the
job.
h.) The Measure points
screen with an Initialization
message. You should see this
Initialization gained message
for about 3 seconds if the rover
receiver is upright and sky view
is not obstructed.
i.) This is the Measure
points screen. Refer to either the
next section “Measure points”
(section 7) or “Stake-out”
(section 8) to continue.
You can now see
additional information, mostly
indicated by icons, in the status
bar area of the screen. These
represent:
Battery conditions (1st is
controller, 2nd
is the
device the controller is
connected to, in this case
the rover receiver)
Satellite information
icon and number tracked
Base information icon
Active radio icon
Rover receiver icon and
rover rod height
(currently undefined).
The status bar at the
bottom shows that an RTK
survey is in progress and has a
fixed solution with the
estimated horizontal and vertical
accuracies and RMS. When
conducting an RTK survey
these values are usually less
than 0.02m.
9. Step 4 - Measuring Points

Springs Monitoring Protocol – SOP#16 - Version 1.00 – April 2017
Page 51 of 80
This section covers an overview of how to collect survey data using an RTK setup and
possible interuptions that can occur in the field. Once the base and rover receivers are set up and
running, there is radio communication from the base, the rover receiver has initialized, and a
fixed position solution at the rover is attained, then the actual task of measuring points can begin.
The following sections descirbe how to measure points using the TSC3 controller and the
guidelines for nameing conventions for point names as well as point code desciptions.
For a detailed desciption of field procedures associated with RTK surveying refere to the
Standard Operating Procedure (SOP) #8 - Field Preperation and Surveying Protocols.
9.1 Measuring points:
a.) From the main job
screen you can see the status
bar and status line show an
active RTK survey is running
with a fixed solution.
To start measuring
points select/open Measure.
Note: this screenshot
should have undefined rod
height for the rover (not
2.000) since we haven’t
measured our first point yet.
b.) This is the Measure
points screen.
The point name is a
hold-over from the last
job or point entered in
this job. Use the
NCPN point naming
convention to set the
point name correctly.
Use the Feature Code
Library (associated
with the job in Job
Properties) to get the
point coding correct.
c.) The Method
determines only how long the
shot takes before self-storing
or being allowed to store
manually. The default method
is Topo point, which is
commonly set at 5 seconds.
You can change the
amount of time required
before storing a measurement
by going into the Options soft
key and changing the
occupation time. I would not
go less than 3 seconds, and
this only if you have wide
open sky, lots of satellites,
excellent radio reception, very
low RMS, very small
residuals, etc. i.e. – perfect
GNSS survey conditions.

Springs Monitoring Protocol – SOP#16 - Version 1.00 – April 2017
Page 52 of 80
d.) This is the first
page of the Options screen
(Options soft key) showing
settings for a Topo point. This
is where you can enable or
disable the Auto store point
function. When this is check-
marked and Accepted,
measured points will
automatically store when the
countdown clock expires. This
is very useful for most topo
work but I find it better to
disable this function when
measuring points that require
higher precision and accuracy
such as control points.
e.) This shows the
Measure Points screen
correctly filled out. The
operator has:
1. Defined the Point
Name
2. Defined the Point
Code
3. Set the rod height
(antenna height)
4. Set the measure point
(default is Bottom of
antenna mount for the
rover)
5. Checked that the
positioning solution is
fixed and that the error
estimates are within
acceptable limits.
Now measuring points
can begin.
f.) The rover is placed
on a point and plumbed using
the target bubble attached to
the rod. The Measure soft key
is tapped or the Enter key is
pressed to start the measuring
process.
The Time to go clock
counts down from 5 seconds
(for a Topo point) while the
Time so far clock counts up as
the point continues to be
measured. The Store function
soft key is currently disabled
until the countdown clock
expires and the positioning
solution remains fixed and
within acceptable tolerances.
g.) As the point is
being measured the
countdown (Time to go) clock
expires and the Store soft key
becomes enabled unless the
“auto store point” option has
Note: if the “auto store
point” has been
selected/checked in the
options tab then the
measurement will be auto
stored after the required time

Springs Monitoring Protocol – SOP#16 - Version 1.00 – April 2017
Page 53 of 80
been checked.
The Time so far clock
shows the point is being
measured for 6 seconds and
continues until the Store soft
key is tapped or the Enter key
is pressed.
has expired and the user will
not need to enter/tap the
“Store” key. Instead you will
hear “Observation Stored”
once the point has been
measured/auto stored and you
are then ready to move to the
next point and take your next
measurement.

Springs Monitoring Protocol – SOP#16 - Version 1.00 – April 2017
Page 54 of 80
9.2 Point Coding (Feature Coding):
This section discusses how to use a Feature Coding Library which is associated with the
file (Job properties). The feature code library is used to standardize the coding used by each
surveyor in the field as well as simplify data processing back in the office. The feature code
library allows the surveyor to enter/select a standardized code for each measurement by the type
of data point that is being collected (topo points, control points, breaklines, etc.). A more detailed
description of how this is utilized in the field is provided in the Standard Operating Procedure
(SOP) #8 - Field Preperation and Surveying Protocols.
a.) This is the Stake out
point screen. The curser default
location is always in the Code
entry box and the code defaults
to the listed name.
b.) If there is a Feature
Code Library associated with
the file then pressing any letter
key associated with a code in
the file will bring up a list of
those feature codes. In this case
the letter C was pressed. The
feature code library (.fxl) file is
NPS point coding 09092015 as
shown in the title bar.
c.) The operator then
either taps or scrolls using the
up/down arrow keys to highlight
the code from the list. Then tap
Select or press the Enter key to
actually pick it. Codes with A
inscribed in a circle are codes
with attributes.
d.) The code has been
selected and is displayed on the
top line. Tapping Enter or
pressing the Enter key will
return you to the Stake out point
screen and the code you picked
will be inserted into the Code
entry box.
e.) The code appears in
the Code box and the point is
ready to be measured. Notice
the Attrib soft key is enabled
because this point code has an
attribute. You can enter it now
by tapping the soft key or enter
it after you measure when it
prompts you. Tapping Measure
f.) This shows the point
being measured. Auto store is
not enabled hence the 15
seconds noted for the current
observation time that has
elapsed. Tapping Store or
pressing the Enter key will store
the point.
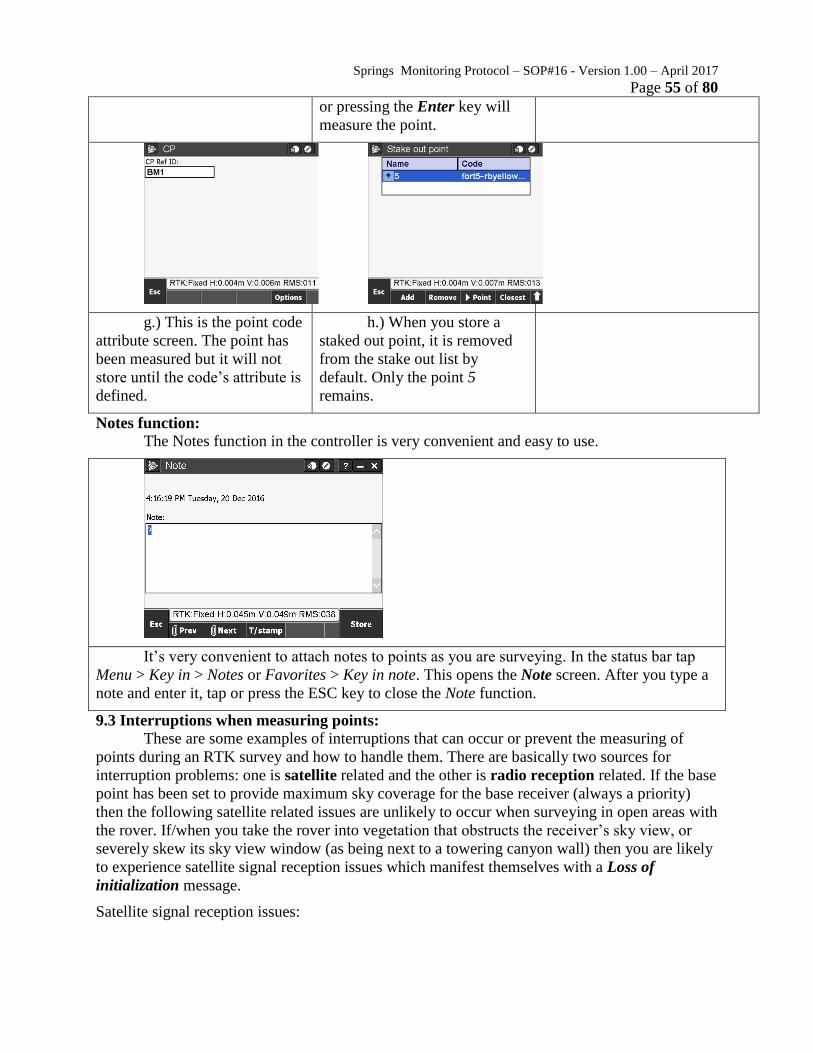
Springs Monitoring Protocol – SOP#16 - Version 1.00 – April 2017
Page 55 of 80
or pressing the Enter key will
measure the point.
g.) This is the point code
attribute screen. The point has
been measured but it will not
store until the code’s attribute is
defined.
h.) When you store a
staked out point, it is removed
from the stake out list by
default. Only the point 5
remains.
Notes function:
The Notes function in the controller is very convenient and easy to use.
It’s very convenient to attach notes to points as you are surveying. In the status bar tap
Menu > Key in > Notes or Favorites > Key in note. This opens the Note screen. After you type a
note and enter it, tap or press the ESC key to close the Note function.
9.3 Interruptions when measuring points:
These are some examples of interruptions that can occur or prevent the measuring of
points during an RTK survey and how to handle them. There are basically two sources for
interruption problems: one is satellite related and the other is radio reception related. If the base
point has been set to provide maximum sky coverage for the base receiver (always a priority)
then the following satellite related issues are unlikely to occur when surveying in open areas with
the rover. If/when you take the rover into vegetation that obstructs the receiver’s sky view, or
severely skew its sky view window (as being next to a towering canyon wall) then you are likely
to experience satellite signal reception issues which manifest themselves with a Loss of
initialization message.
Satellite signal reception issues:

Springs Monitoring Protocol – SOP#16 - Version 1.00 – April 2017
Page 56 of 80
a.) Status line message
showing a problem. The
operator is not presently
measuring a point but the
RTK: Fixed solution has been
replaced by this message.
b.) Loss of
initialization: You will see a
brief message indicating
Initialization lost. The Fixed
solution will revert to Float.
As can be seen the horizontal
and vertical precisions have
grown unacceptably large.
Any number of issues can
cause a loss of initialization.
c.) The Float solution
continues but the precisions
are getting better.
d.) The receiver
regains initialization and the
user is notified. Audible
messages also accompany the
visual messages. The RTK:
Check status will change to
RTK: Fixed and the operator is
good to measure a point
provided that the precisions
are acceptable.
e.) Here’s an example
of losing initialization after a
measurement has started. The
solution status has gone to
Float and the Store soft key is
not shown because of this
condition.
The countdown clock
is removed and replaced with
an Epochs remaining
statement. An epoch is a time
duration for a measurement;
for RTK this is one second.
The horizontal and
vertical tolerances shown in
the status line are far above
the acceptable limits.
f.) The solution has not
improved at 23 seconds of
measuring. 3 epochs still
remain. I can still tap the
blank soft key or press the
Enter key to force the point to
store.

Springs Monitoring Protocol – SOP#16 - Version 1.00 – April 2017
Page 57 of 80
g.) Here I’ve forced
the store function of a less
than quality point solution.
This Continue and store
point? confirmation message
appears describing the
problem and how bad the
precisions are. If these
conditions are acceptable for
this point then tap Yes or press
Enter. If not tap No or Re-
Meas.
h.) In this case the
measurement has been going
on for 23 seconds and it
appears that it’s a good
measurement by the precisions
shown. However, for some
reason I don’t want to store
this point. I’m going to
abandon this measurement.
i.) Tapping the Esc
soft key or pressing the ESC
key will generate this
Abandon point? message.
Radio reception issue:
If the base and rover receivers have adequate sky visibility then the only problem you are
likely to encounter is loss of radio reception.
This screen shows a loss of base radio reception. When this occurs you will see the radio
icon has a red circle with an X inscribed in it. The positioning solution will revert to Autonomous as
shown in the status line and the precisions will become very poor. Also, the green radio light on the
rover receiver will stop blinking. The only readily available solution is to raise the rod height to the
max to get the radio antenna higher up and wait for a minute or two. Sometimes the radio will drift in
and out and you may still be able to get a shot.
This problem is minimized by a combination of good base station placement to start with and
taking notes on how the base radio is set up to overcome this condition in repeat survey sessions. If
the base station is located out of line of site or a large distance from where the rover is being used the
connection issue could be related to the radio signal not being transmitted far enough. This could be
due to a low output wattage set on the base broadcast radio (5W instead of 35W) or the points being
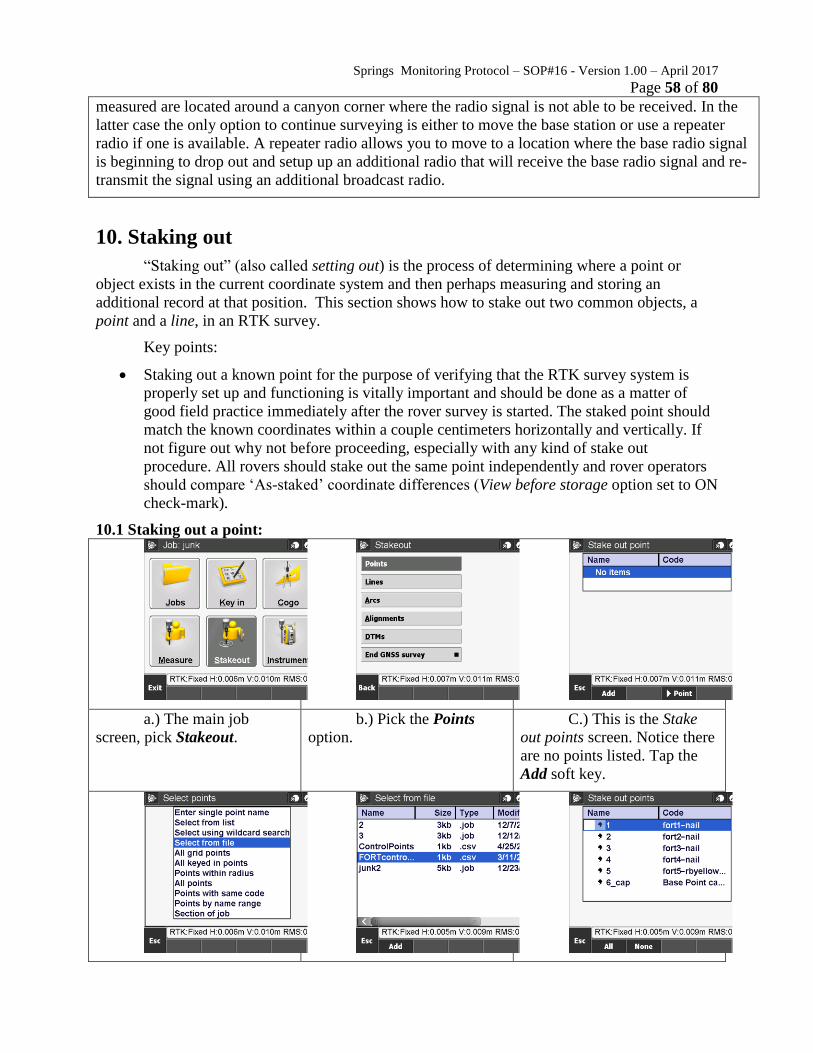
Springs Monitoring Protocol – SOP#16 - Version 1.00 – April 2017
Page 58 of 80
measured are located around a canyon corner where the radio signal is not able to be received. In the
latter case the only option to continue surveying is either to move the base station or use a repeater
radio if one is available. A repeater radio allows you to move to a location where the base radio signal
is beginning to drop out and setup up an additional radio that will receive the base radio signal and re-
transmit the signal using an additional broadcast radio.
10. Staking out
“Staking out” (also called setting out) is the process of determining where a point or
object exists in the current coordinate system and then perhaps measuring and storing an
additional record at that position. This section shows how to stake out two common objects, a
point and a line, in an RTK survey.
Key points:
Staking out a known point for the purpose of verifying that the RTK survey system is
properly set up and functioning is vitally important and should be done as a matter of
good field practice immediately after the rover survey is started. The staked point should
match the known coordinates within a couple centimeters horizontally and vertically. If
not figure out why not before proceeding, especially with any kind of stake out
procedure. All rovers should stake out the same point independently and rover operators
should compare ‘As-staked’ coordinate differences (View before storage option set to ON
check-mark).
10.1 Staking out a point:
a.) The main job
screen, pick Stakeout.
b.) Pick the Points
option.
C.) This is the Stake
out points screen. Notice there
are no points listed. Tap the
Add soft key.

Springs Monitoring Protocol – SOP#16 - Version 1.00 – April 2017
Page 59 of 80
d.) These are various
methods to add points to the
stake out list. Generally, we
link files to the job so go to
Select from file and tap Enter
or press Enter key. See the
part about linking files in
Create a job if you need to do
this.
e.) Now a list of
available files is shown.
Highlight the file you need
and Accept.
f.) Now the points in
the file you selected are
shown.

Springs Monitoring Protocol – SOP#16 - Version 1.00 – April 2017
Page 60 of 80
g.) Check-mark the
ones you need. Optionally, you
can tap the All soft key at the
bottom, tap Add.
h.) The points you check-
marked from file listing are now
added to the stake out list.
Highlighting a point and
tapping Stakeout or
pressing Enter will start
the stakeout process for
that point.
Tapping Closest will start
the stakeout process for whatever
point on the list is closest to your
current position.
i.) The internal compass
won’t remain in calibration
because we do survey work in
locations that are quite far apart
from each other. As a result, this
Compass calibration message
pops up as soon as you try to
navigate to a point. You can
either disable it or follow the
calibration procedure.
The calibration procedure
requires you to release it from the
rod, turn it 360 in the face up
position, roll it 360 end-over-end,
and roll it 360 through face down
to face up again.

Springs Monitoring Protocol – SOP#16 - Version 1.00 – April 2017
Page 61 of 80

Springs Monitoring Protocol – SOP#16 - Version 1.00 – April 2017
Page 62 of 80
j.) If the rover is more
than a few meters from the point
then you’ll see this big arrow
display telling you how far you
need to go and in what direction.
Note the relationship to the North
arrow.
k.) When you get close
enough to the point the display
will change to this.
Your location is the cross
in the middle. It doesn’t
appear to move. This is
called Surveyor centered
(changeable in Options to
Target centered).
The point location is the
round circle object. It
moves around as you do.
There is a compass
direction shown in the
upper left to help you
know which way to
move. Some operators
prefer a small compass
mounted on the rod.
Distances to the point are
also shown to help you
know how far to move in
a direction. Cut or Fill are
survey terms meaning
‘down’ or ‘up’
respectively.
When you have moved
the tip of the rod to the
stake out coordinate and
plumbed it using the rod’s
target bubble, the
distances to the point will
be a few millimeters or a
centimeter or so. This
depends on the quality of
the positioning solution
shown in the bottom
status bar.
l.) Here, the operator has
positioned the rover rod on a
survey cap monument. As can be
seen, the horizontal positioning is
acceptable at 3mm and 13mm.
However, vertical distance is
indicating a problem. It’s saying
I need to come up about 6cm to
get to the point (Fill 0.063m). As
it turns out this monument was
run over by a tractor and
squashed down into the ground
about this much.
Tapping Measure or
pressing Enter will put you
temporarily in the Measure
Points screen (previously
discussed) and will start
measuring a point.

Springs Monitoring Protocol – SOP#16 - Version 1.00 – April 2017
Page 63 of 80
m.) The Options screen
(Stake out point Options soft
key). The View before storage
option lets you see the
relationship between the position
you just measured and the known
coordinates of the point.
n.) If View before
storage is check-marked then this
Confirm staked deltas screen appears when you try to store a
staked out measurement. This
allows the operator to see how
close the measured point is and
rename, recode, or escape
(abandon measurement) if
necessary.
Just like Auto store
(unchecked) for measured
points, this option is nice
when you are wanting to
see the actual details and
have the option to cancel
(Esc) or store the shot but
for general topo work
uncheck it if you don’t
need to see the details.

Springs Monitoring Protocol – SOP#16 - Version 1.00 – April 2017
Page 64 of 80
10.2 Staking out a line:
There are a few different ways to stake out a line. The two most commonly used ones are
by Line name and by Two points. First we will discuss the Two points method.
Staking a line by two points is faster to initiate but you will only be able to see the line in
the stake out program. It will not be visible in the map.
a.) The main job
screen, pick Stakeout.
b.) Pick the Lines
option.
c.) This is the default
Stake out line screen (by Line
name). To stake out by two
points, use the drop-down list
and tap ahead of the Two
points method to place a
check-mark there. That will
open the Stake out line by two
points screen (following).
d.) This is the Stake
out line (by two points)
screen. You can pick the start
and end points by opening the
drop-down list for each.
Tapping Start or pressing the
Enter key will start the stake
out process.
e.) Here you can see
the line on the display. The
rover’s position is indicated by
the cross. H. Offset is negative
if the rover is left of the line.
The left or right side is
predicated on the direction the
line is defined from start point
to end point.
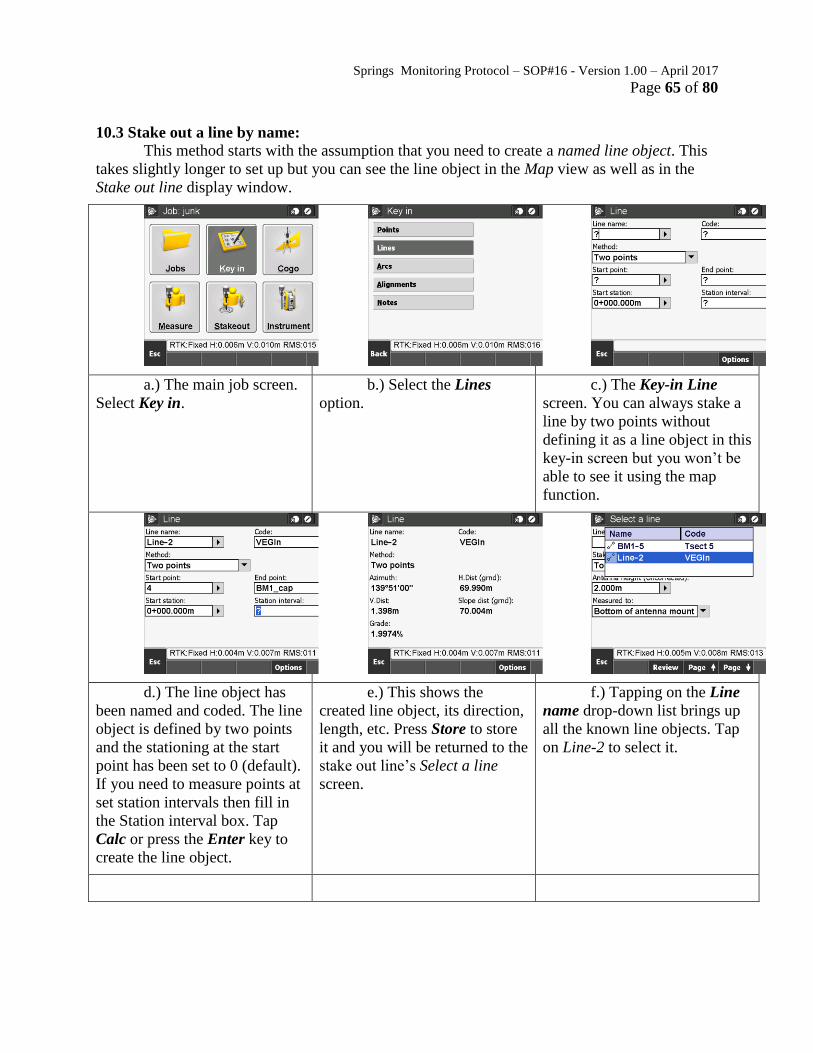
Springs Monitoring Protocol – SOP#16 - Version 1.00 – April 2017
Page 65 of 80
10.3 Stake out a line by name:
This method starts with the assumption that you need to create a named line object. This
takes slightly longer to set up but you can see the line object in the Map view as well as in the
Stake out line display window.
a.) The main job screen.
Select Key in.
b.) Select the Lines
option.
c.) The Key-in Line
screen. You can always stake a
line by two points without
defining it as a line object in this
key-in screen but you won’t be
able to see it using the map
function.
d.) The line object has
been named and coded. The line
object is defined by two points
and the stationing at the start
point has been set to 0 (default).
If you need to measure points at
set station intervals then fill in
the Station interval box. Tap
Calc or press the Enter key to
create the line object.
e.) This shows the
created line object, its direction,
length, etc. Press Store to store
it and you will be returned to the
stake out line’s Select a line
screen.
f.) Tapping on the Line
name drop-down list brings up
all the known line objects. Tap
on Line-2 to select it.

Springs Monitoring Protocol – SOP#16 - Version 1.00 – April 2017
Page 66 of 80
g.) The selected line is
entered into the Line name box.
Now the Stake method is
highlighted. In this case, for
topo measurement, I’m not
concerned with where on the
line I am as long as I’m on the
line so I’ll choose To the line
from the drop-down list. If I
needed to be at a certain spot on
the line I would have picked
Station on the line. Tapping
Start or pressing Enter will start
the actual stake out process.
h.) Here you see the
actual stake process. You can
see the line in the ‘window’ and
one of the endpoints, point 4.
The cross in the middle is where
you are in relation to the line.
Remember how the line was
defined: Start at point 4 end at
point BM1_cap. Your current
position is about 2 meters from
the start point along the line and
a little over 1 meter left of the
line. If H. Offset is negative, you
are left of the line. If Station is
negative you are behind the start
point. Since the line is a vector,
the V. Dist means your current
position is above or below the
line. For our intent and purpose
we don’t really care where the
line vector is vertically. If a
measurement on the line is
needed at this time then move
right about a meter until the H.
offset value drops to near zero.
i.) This is the map
function. Main job screen, Map
from the menu bar. Since the
line is a named object it will
appear on the map. The map
function does not give you any
numerical values about your
relationship position to an
object. For tight tolerances
along the line and stationing I
would suggest using the
previous method (Stake out
line). For faster positioning
many find the map function
easier to use. However, the
operator must pay attention to
the map scale as the depictions
of lines, points, position cross,
etc. appear the same size at any
scale. So you may be watching
the line move in relation to the
cross as you position yourself
on the line and think you are on
the line (as it appears here) only
to find out later in the office that
you were over a meter away
because the scale was at
something like 20m. I find the
scale at .5m to 1.5m adequate
for topo work. Here, the scale is
at 1 meter and a reference bar is
shown for comparison to other
objects in the map window. It
would appear that the rover’s
current position is within a
couple of centimeters of the line
based on comparison to the
scale bar, acceptable for topo

Springs Monitoring Protocol – SOP#16 - Version 1.00 – April 2017
Page 67 of 80
work.
The yellow ‘hand’ soft
key is the current enabled map
operation. The map view can be
dragged along the line using the
touch screen. The big ‘up-
arrow’ soft key opens up other
map options.
11. Step 5 - Ending the survey
This is a two-part process. First end the rover session, then end the base session.
11.1 Ending the Rover session:
a.) From the main job
screen, pick Measure to get to
the options.
b.) Pick the End GNSS
survey option.
c.) You will see a brief
message saying Ending survey
and then see this Survey ended
message. Picking Yes will turn
the receiver off. Picking No
will leave the receiver running
and receiving radio broadcast
but the survey session has
ended. The screen will return
to the main job screen.
Whether or not you
power down, if you forget to
measure something simply
start another survey session
and reconnect to the base
radio.
11.2 Ending the Base session and retrieving the base file:
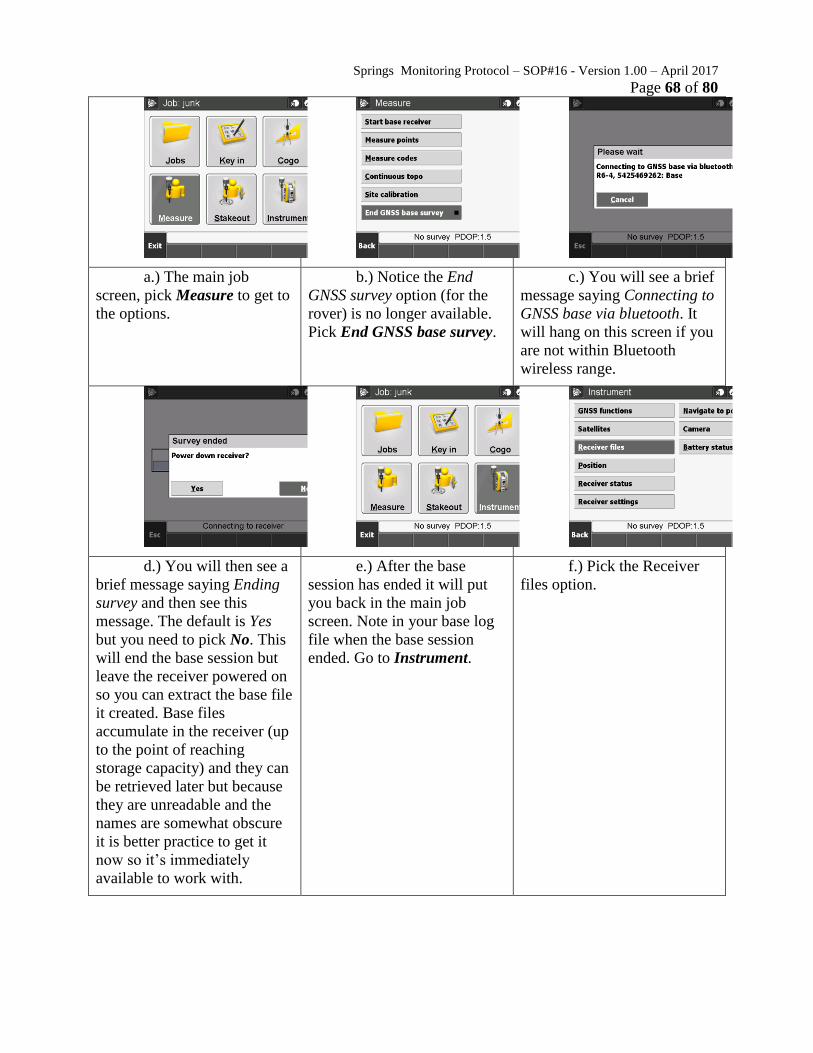
Springs Monitoring Protocol – SOP#16 - Version 1.00 – April 2017
Page 68 of 80
a.) The main job
screen, pick Measure to get to
the options.
b.) Notice the End
GNSS survey option (for the
rover) is no longer available.
Pick End GNSS base survey.
c.) You will see a brief
message saying Connecting to
GNSS base via bluetooth. It
will hang on this screen if you
are not within Bluetooth
wireless range.
d.) You will then see a
brief message saying Ending
survey and then see this
message. The default is Yes
but you need to pick No. This
will end the base session but
leave the receiver powered on
so you can extract the base file
it created. Base files
accumulate in the receiver (up
to the point of reaching
storage capacity) and they can
be retrieved later but because
they are unreadable and the
names are somewhat obscure
it is better practice to get it
now so it’s immediately
available to work with.
e.) After the base
session has ended it will put
you back in the main job
screen. Note in your base log
file when the base session
ended. Go to Instrument.
f.) Pick the Receiver
files option.

Springs Monitoring Protocol – SOP#16 - Version 1.00 – April 2017
Page 69 of 80
g.) This is a list of all
the receiver files logged base
data currently in the receiver.
Every time the base is started
it logs a file. Some of these
may not contain relevant
information. Look for files by
date and by size. The 8 digit
file name is composed of:
First 4 digits are the
last 4 digits of the
receiver serial nuber.
Next 3 digits are the
day of the year.
Last digit is sequence
number of files created
in a day, starts with
zero.
h.) Check-mark the
files you want to copy by
tapping in front of the file
name. Tap Import or press the
Enter key.
i.) A confirmation list
of the selected files you want
to copy appears. Tap Start or
press the Enter key to start the
Bluetooth transfer. The base
files will be copied to the root
folder. Note the names of the
base files and maybe the sizes
in your base log so you know
which files go with which
base point.
j.) The selected file(s)
will start to be copied to the
controller. Keep the controller
near the base receiver and
don’t unplug or turn off the
base receiver until the transfer
is finished. It can take several
minutes for a large file.
k.) This notice will
appear when the transfer is
complete. Tap OK and you’re
done. You can now power
down the base receiver by
pushing the power button for
about 4 seconds or from the
controller by answering Yes to

Springs Monitoring Protocol – SOP#16 - Version 1.00 – April 2017
Page 70 of 80
the power down question
again.
12. Surveying the Site
Keep a running list of points, descriptions, and rod heights in the field notebook as you survey.
The survey lead needs to be diligent about making sure that all three pieces of information are
correct for each shot. You can group shots that have the same description and rod height (see
Fig. 5 for an example).
Different shots may require a different Electronic Distance Measurement (EDM) or
Measurement Mode. This changes how precise the total station shoots the laser. Use a precise or
fine EDM or measurement mode for control points, headpins, and any hydrologic equipment.
Use a normal EDM or coarse measurement mode for all other shots.
Once the first occupied point and backsight have been established, you can begin surveying. All
of the following will need to be surveyed (see additional instructions in the proceeding sections):
Control points
Hydrologic equipment:
o Top of well casings (with cap off)
o Ground surfaces next to wells
Shoot as much as is visible from the current location before moving the instrument.
12.1 Surveying control points It is highly recommended to shoot as many control points as are visible from the occupied point
as foresights or confirmation/check shots. For control shots, the rod persons will use the point
(not the foot) of the prism pole (Fig. 2) on the exact location of the control point (i.e., the center
of the X on rock or in the pre-stamped dot on a rebar cap). Another way to minimize survey error
is to use a bipod to keep the rod steady and level for control shots.
A. Tips for Difficult Surveying Situations:
If dense vegetation is blocking the shot, move the rod slightly upstream or downstream
while keeping the bottom of the rod on the same geomorphic surface. The rod person
will need to estimate the distance upstream or downstream of the tagline and relay this
to the total station operator to document in the field notes.
Use an alternative rod height. The total station operator finds a section of the rod that is
visible and sets the crosshairs to the elevation shown on the rod face (e.g., 1.500 m).
The rod person then adjusts the rod so that the prism is at this height. The total station
operator instructs the rod person to raise or lower the prism until it is centered in the
pre-set crosshairs, takes the shot, and enters the appropriate rod height.
To take a shot where it’s difficult to get the rod level (e.g., a cliff wall), place the prism
on the wall and use a rod height of zero.

Springs Monitoring Protocol – SOP#16 - Version 1.00 – April 2017
Page 71 of 80
If the rod is too tall (e.g., at an overhanging cliff wall next to a stream), you can use a
small stick instead of the rod. Place the prism on top of the stick and measure from the
end of the stick to the center of the prism.
Ground shots: It is also possible to place the prism directly on the ground (i.e., by
laying the rod on its side) if that is the only way to get shot. Measure rod height from
the ground to center of prism.
Take a shot using the horizontal or vertical offset functions in the data collector (see
instructions for the software).
If dense vegetation is blocking part of the prism but some of the glass is still visible,
aim the total station at the crosshairs in the center of the prism and not at the portion of
visible glass. If you are unable to get a shot at any of the standard rod heights, attempt
one of the alternative shots described above.
Where large woody or other debris precludes placing the base of the rod on the ground
surface, the rod person should place it on the object for the shot, and relay to the total
station operator the height of the debris above the ground surface. The total station
operator should document this information in the field notes in order to make later
adjustments to the survey data. It is helpful if you can shoot a ground shot
perpendicular to the transect that is the same height of the ground below the debris.
12.2 Surveying wells and other hydrologic monitoring equipment SCPN has determined that the minimum requirements necessary for surveying hydrologic
equipment requires a total station with an angle precision of 9 seconds, roughly +/- 0.016 m over
500 m. The current Topcon GTS-239 total station fulfills this.
For the select reaches that have hydrologic equipment, survey all hydrologic monitoring
equipment in and around the reach. Each of these reaches will have permanent datum
coordinates, referencing permanent bedrock survey control or stable uplands rebar (see Section
1.4 D). The permanent datum will be the instrument location unless re-sectioning to establish an
occupied point from which all features and controls are visible. You will also need another
known point to backsight to use as a reference elevation. Surveying will be conducted using pre-
established coordinates for all controls, which are the basis for conversion of hydrologic data and
integrated analysis. Data may be comprised of those collected during reach establishment or
during revisits.
Groundwater wells – Bring pipe wrenches to open the well cap. Survey the following using
permanent datum coordinates and appropriate coding for each (see Table 1):
1. Top of the uncapped well at the measuring notch (Fig. 23)
2. Ground surface next to the measuring notch on the well casing
3. If instream, the water surface next to the hydrologic equipment
4. The entire length of the nearest cross-section transect to the wells. This can be done
between the transect end points and does not need to be extended to stable uplands.
Follow the methods outlined in Section 3.2.
For the hydrologic equipment, elevations are the most important numbers. The acceptable errors
for hydrologic surveying are as follows:
Acceptable Errors for Establishing a Hydrologic Survey:
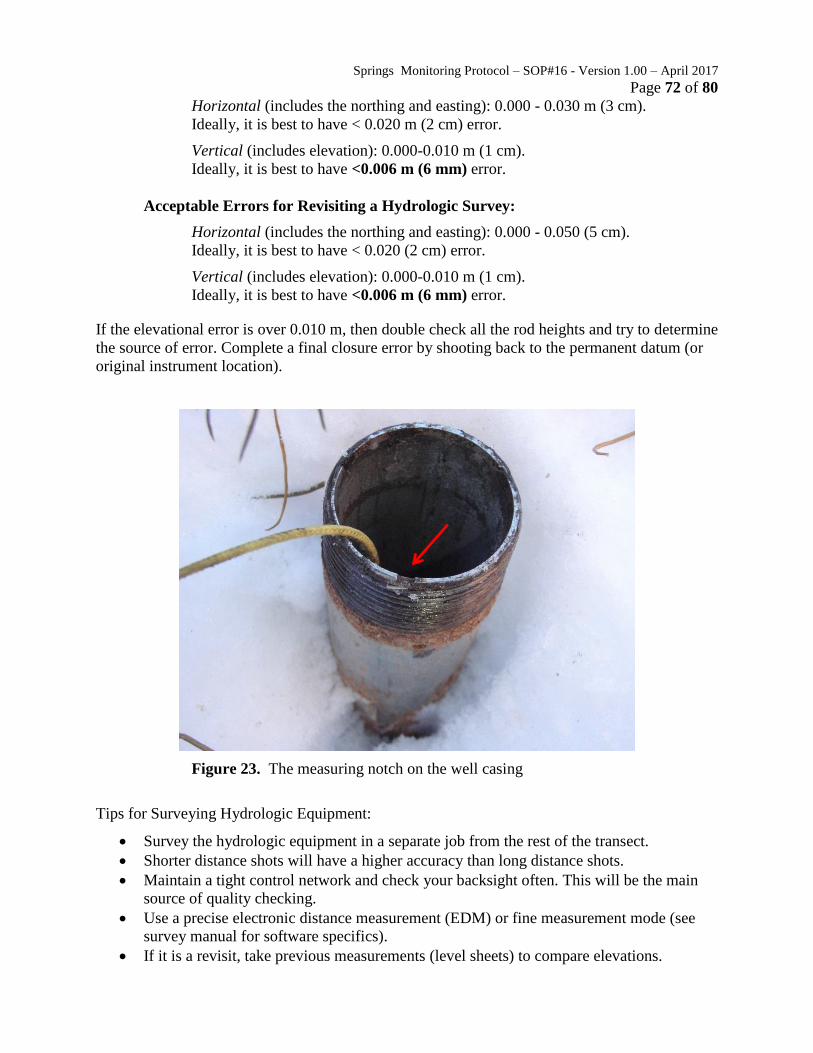
Springs Monitoring Protocol – SOP#16 - Version 1.00 – April 2017
Page 72 of 80
Horizontal (includes the northing and easting): 0.000 - 0.030 m (3 cm).
Ideally, it is best to have < 0.020 m (2 cm) error.
Vertical (includes elevation): 0.000-0.010 m (1 cm).
Ideally, it is best to have <0.006 m (6 mm) error.
Acceptable Errors for Revisiting a Hydrologic Survey:
Horizontal (includes the northing and easting): 0.000 - 0.050 (5 cm).
Ideally, it is best to have < 0.020 (2 cm) error.
Vertical (includes elevation): 0.000-0.010 m (1 cm).
Ideally, it is best to have <0.006 m (6 mm) error.
If the elevational error is over 0.010 m, then double check all the rod heights and try to determine
the source of error. Complete a final closure error by shooting back to the permanent datum (or
original instrument location).
Figure 23. The measuring notch on the well casing
Tips for Surveying Hydrologic Equipment:
Survey the hydrologic equipment in a separate job from the rest of the transect.
Shorter distance shots will have a higher accuracy than long distance shots.
Maintain a tight control network and check your backsight often. This will be the main
source of quality checking.
Use a precise electronic distance measurement (EDM) or fine measurement mode (see
survey manual for software specifics).
If it is a revisit, take previous measurements (level sheets) to compare elevations.

Springs Monitoring Protocol – SOP#16 - Version 1.00 – April 2017
Page 73 of 80
Refer to the Hydrologic Surveying Cheatsheet to see if there are any special instructions
for surveying (e.g., use the rod point in the measuring notch, etc.).
12.3 Tips for surveying To effectively manage surveying errors, check the backsight every hour, after about 100
shots, or after a good stopping point (e.g., after finishing transect 2). See Acceptable
Errors for Establishing a Survey in Section 2.1.
Make sure that the tripod is solid from the ground up (i.e., the feet are solidly placed so
there’s no chance of the tripod moving or settling). Take extra precaution on bedrock since
it is easy to bump the tripod. Use a permanent marker to draw circles on the rock around
the laser plummet dot and around the tripod feet.
If the tripod becomes out of level (e.g., from being accidentally bumped or the tripod
heating up), repeat the total station setup procedures, including leveling the tripod,
measuring the instrument and backsight heights, setting the temperature and atmospheric
pressure, and performing the backsight circle.
Know where to easily access the list of all the points in the job in the survey software.
There is a manual cord if the Bluetooth (wireless option) doesn’t work.
SCPN prisms have a prism constant of -30 mm. This is usually printed on the prism target
facing the gun. Do NOT set the prism constant in total station or it doubles the value of
the constant. Set the prism constant in the data collector ONLY.
Take check/confirmation shots of the backsight or a previously shot control point, which
can be helpful in post-processing (use code.#, e.g., CP1.1, CP1.2, CP1.3, etc.).
The battery life of the data collector should last for about 24 hours of surveying (usually 3
full days of surveying). Older total station batteries last 4-5 hours while new ones last
about 6 hours.
Make sure to charge total station batteries at the end of each day and data collector
batteries at the end of every 3rd
day.
Do not remove any pin flags until the very end of the survey.
13. After the Field Visit
13.1 Tasks performed immediately after returning from the field This section contains instructions for downloading raw data from the data collector, returning
GPS units, and creating a Survey Visit Notes document from the details recorded in your field
notebook. Table 2 provides a summary of all data derived from the survey or used for revisits.
Download raw data from the data collector. A. For each reach surveyed, create an Original and a Corrected folder (e.g., origPARKP-
03_2012, corrPARKP-03_2012, etc.) in
Z:\Active_Monitoring_Projects\Springs\Data\Geomorphology\PARK\PARK_Reach_YEAR.
It is essential to include the year in the file name.
B. Download or export the raw data from the data collector into the Original folder:
a. Create a comma delimited (.csv) file on the Recon. Open the correct job. In the File
menu, click on Export. Select the CSV radio button and click Next. On the next

Springs Monitoring Protocol – SOP#16 - Version 1.00 – April 2017
Page 74 of 80
screen, click the down arrow on the right side of the screen and click on Select All
Points; click Next. On the next screen, select the Plane radio button under
“Coordinates.” Units will default to meters; click Next. Select Name, Northing,
Easting, Elevation, Description as the export order and click Finish.
b. Connect the data collector to the computer with a USB cord. This automatically
opens Windows Mobile Device Center > Connect without setting up your device >
File Management > Browse the contents of your device > drive > Survey Data.
Navigate to the job.
c. Copy and paste the 3 files from this job (.CSV, .RAW, and .JOB) to the Original
folder. Leave the files on the data collector for the time being.
These are the only files that belong in the Original folder. This data will be archived.
C. Make copies of the original data (.JOB, .CSV, and .RAW files) and paste them into the
Corrected data folder. Once corrections have been made, rename these files by adding
“corr” to the beginning of the existing names.
Download data from the GPS units. GPS units should be given to the GIS technician as soon as you return from the field. All data
should be downloaded and differentially corrected as soon as possible. The coordinates are
then given to the lead surveyor for the post-processing. These data are used for relocating
points and making maps.
Use survey notes to write a Survey Visit Notes document In a Word document, create a report with the details of the survey from your field notebook,
including the dates, lead surveyor, the rod crew, the type of total station and software used in
survey, if scale factors were used, intrasurvey errors, prism constant, weather, etc. Add any
relevant details important to the survey or for future visits.
13.2 Documenting post-processing steps
Create a Word document to record the details of survey post-processing, including the number of
jobs surveyed for the reach (if more than one) and specifics of each post-processing step (i.e.,
what points were used for translating and rotating, what computer programs were used to
accomplish the tasks (e.g., “exported file from Traverse PC and imported into ArcGIS”), etc.
This document should be clear and specific enough to allow someone else to understand what
you did and to repeat it, if necessary. The list of individual corrections does not need to be listed
here but should be referenced in this document.
13.3 Correcting survey data and other initial processing
Create a spreadsheet for the corrected survey data.

Springs Monitoring Protocol – SOP#16 - Version 1.00 – April 2017
Page 75 of 80
In the Corrected folder, create an Excel spreadsheet that contains the 13 worksheets outlined in
Table 3. More detailed instructions of how to complete each worksheet are provided in the
remainder of this SOP.
Make corrections to the survey data.
Copy the coordinates from the .csv file into the Reach Corrections worksheet. Make corrections
from field notes here in a separate column. For example, where an incorrect rod height is
documented in the field notes, locate the appropriate point number in the Excel file, and make
the needed correction to the elevation recorded for the shot. Notes describing each correction can
be made to the coordinate and raw data files in the corrected data folder. When all corrections
have been completed, save the final data as a comma-delimited file (.csv) in the Corrected folder.
This is the file that is imported into the survey software used by the data collector for revisits.
Translate and rotate all jobs into the same coordinate system.
If the survey data contains more than one job, all jobs need to be converted to the same
coordinate system. Import the corrected data into your survey software. Determine which job is
the most accurate, and translate and rotate the remaining jobs around that. Document details of
each step in your post-processing notes document (see Section 4.2).
13.4 Creating stream cross-sections for each transect
To create stream cross-sections for each transect, data are processed in the survey software then
graphed in Excel. Each transect output from Excel should use either 10.00 m or 100.00 m as the
stationing value for the left endpin, depending on the extent of area beyond the left endpin that
may be included in future surveys over the long term. This enables relocation of the left endpin
farther left, if ever necessary, without introducing negative stationing values. Make sure that the
Excel file with figures of the transect cross-sections and the longitudinal profile includes
“FINAL” and a version number in the file name (e.g., PARK_P-03_2011_FINAL_1.0).
The advantage of using this method is that the survey software calculates the direct length
between the headpins rather than the accumulated lengths between each surveyed point. Any
variations from the line that may have occurred while surveying points along the transect are
disregarded, and points are “snapped” into a straight line between the headpins so that errors do
not accumulate over the length of the transect. In this section, the survey data are translated and
rotated to the locations of the vegetation transects in order to graph the stream cross-sections.
Note that this is different than translating and rotating the data to real-world coordinates. This
method also allows locations along the transect tape to be easily correlated with vegetation data
for integrated analyses.

Springs Monitoring Protocol – SOP#16 - Version 1.00 – April 2017
Page 76 of 80
Table 3. Worksheets in the excel file that contain the final corrected survey data.
Worksheet Contains
Metadata Explanations of survey codes and descriptions, and general project information
T1, T2, T3, etc. thru T7 (each transect has its own worksheet)
All cross-sectional data for that transect.
One graph showing the full cross-section.
Another graph showing the close-up cross-section between the vegetation transect end points.
Relevant data needed for graphing purposes.
Comparison of vegetation transect length vs. survey transect length.
Waterline elevation.
Profile, Sinuosity, Slope All longitudinal profile data for the reach.
One graph showing the longitudinal profile for the reach.
Relevant data needed for graphing purposes.
Slope, including calculations.
Sinuosity index, including calculations.
Reach (e.g., P-03) Corrections
The first 5 columns contain the original data for all shots that were taken (point name, northing, easting, elevation, and description)
The 6th column contains the corrections next to the relevant
shot. Describe in detail what correction happened (e.g., corrected rod height from 1.7 to 2.0, deleted, changed description from T3L-TOP to T3R-TOP, duplicate shot deleted, etc.).
The next columns will be the corrected data.
Corr data- FINAL The final version of the corrected data. Choose the most accurate shot for each control point and headpin, and make sure that only one point is included for each.
Comparing Pts Shows intrasurvey errors (i.e., compares control points from different instrument locations)
Real World Coord The corrected data after being translated and rotated to real-world coordinates.

Big River Monitoring Protocol – SOP#11 - Version 1.00 – January 2017
Page 77 of 80
13.5 Translating and rotating survey data into real-world coordinates Using your survey software, the data is translated and rotated to real-world coordinates and converted
into UTM coordinates. Unless RTK or extremely high-accuracy GPS is used to establish control point
coordinates, errors introduced from the GPS make real-world coordinates usable only for reporting
purposes (e.g., to show the points on background imagery in ArcGIS, make revisit maps, etc.) and not in
the data collector for survey revisits.
A. Import the corrected .csv file into your survey software.
B. Obtain differentially-corrected UTM coordinates for all control points, headpins, instrument
setups, and backsights from the GIS technician. Examine the GPS report to identify points with the
combination of the lowest Positional Dilution of Precision (PDOP) values and reported errors
(horizontal and vertical precision). Select the two most accurate points.
C. Using the COGO features in the software, translate the entire survey dataset to the most accurate
point recorded on the GPS unit. The coordinates of the selected point will match the coordinates of
that same point in the GPS data. Rotate the dataset to the second-most accurate GPS point.
D. Compare the northing and easting coordinates for the remaining control points to make sure that
they are within a few centimeters to those reported by GPS. If the error is greater than this, check
all transformations and rotations to identify any errors and correct them.
E. Export these coordinates into the Real-world worksheet in the Excel file. Be sure to report the
errors here as well.
13.6 Making a revisit map Import the real-world coordinates into ArcGIS, and make a map for the next visit which clearly shows
the control points, occupied points, transects, headpins, and stream profile.
13.7 Creating revisit files In the survey software or Excel, separate the corrected local coordinates for the control points, headpins,
ground surfaces at the headpins, and transect end points from the rest of the survey data and save as a
.csv file. This file is uploaded to the data collector before a revisit survey (see Section 2.2 for details).
REFERENCES
Demeurichy, Kenny. CHaMP Introduction to Topographic Survey Manual. Utah State University,
Ecogeomophology and Topographic Analysis Lab. Bonneville Power Administration.
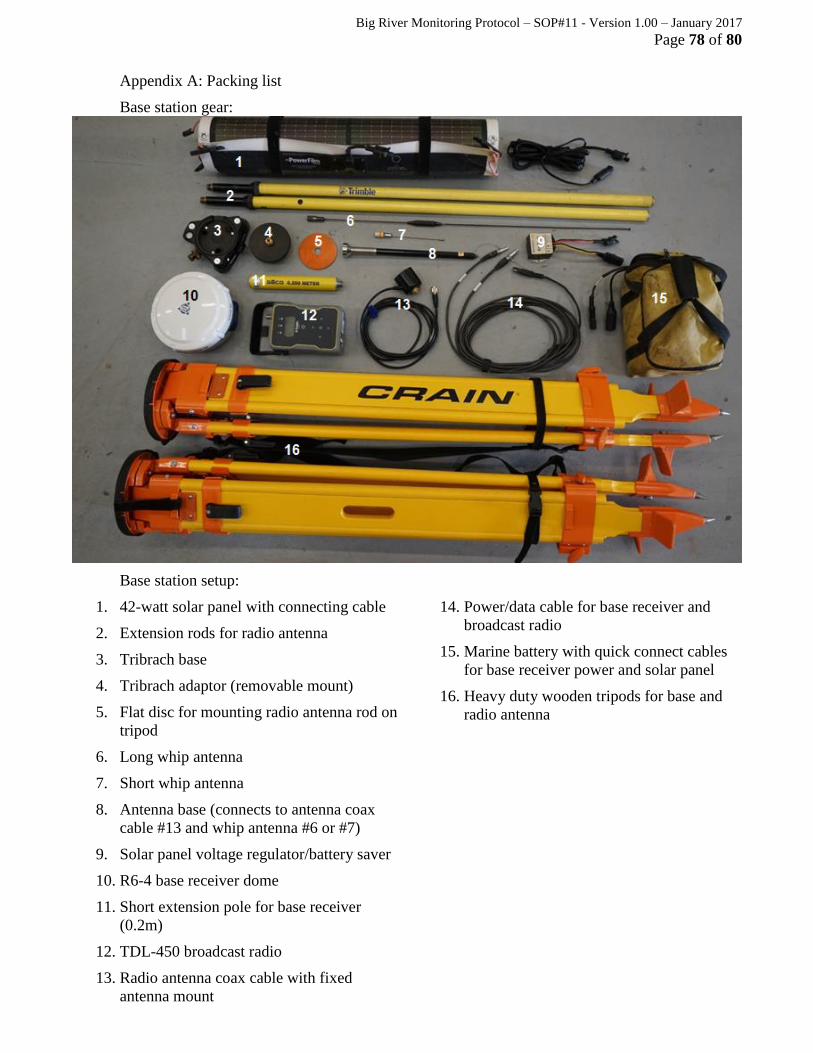
Big River Monitoring Protocol – SOP#11 - Version 1.00 – January 2017
Page 78 of 80
Appendix A: Packing list
Base station gear:
Base station setup:
1. 42-watt solar panel with connecting cable
2. Extension rods for radio antenna
3. Tribrach base
4. Tribrach adaptor (removable mount)
5. Flat disc for mounting radio antenna rod on
tripod
6. Long whip antenna
7. Short whip antenna
8. Antenna base (connects to antenna coax
cable #13 and whip antenna #6 or #7)
9. Solar panel voltage regulator/battery saver
10. R6-4 base receiver dome
11. Short extension pole for base receiver
(0.2m)
12. TDL-450 broadcast radio
13. Radio antenna coax cable with fixed
antenna mount
14. Power/data cable for base receiver and
broadcast radio
15. Marine battery with quick connect cables
for base receiver power and solar panel
16. Heavy duty wooden tripods for base and
radio antenna

Big River Monitoring Protocol – SOP#11 - Version 1.00 – January 2017
Page 79 of 80
Not shown but often necessary: A means of securing the base receiver, base radio
antenna, and solar charging panel from being toppled by strong winds. There are generally two
methods; weigh it down or tie it down.
In areas where there is only rock; A set of six 24” – 30” bungie cords to strap rocks to the
tripod legs as ballast to help prevent wind topple and hold down the solar charger. (Photo
example shown on page 3)
In areas of sufficient soil depth; A set of six tent pegs and a tie-down kit, 3 lb. hammer,
and a set of four smaller bungie cords for use in holding down the solar panel with 4 tent
pegs.

Big River Monitoring Protocol – SOP#11 - Version 1.00 – January 2017
Page 80 of 80
Appendix A: Packing list (cont’d)
Rover gear:
5
For each rover setup:
Rover rod (adjustable height model shown, with flat topo tip)
Rover receiver
Receiver radio antenna
Receiver batteries (you’ll need at least 2 per rover)
Rod mounting bracket (2-pieces)
Survey controller (TSC3 controller)
1
3 2
4
5
6