sprint corp 1q16 earnings presentation
TRANSCRIPT

©2016 Sprint. This information is subject to Sprint policies regarding use and is the property of Sprint and/or its relevant affiliates. Any review, use, distribution or disclosure is prohibited without authorization.
July 25, 2016
Fiscal 1Q16 Results Conference Call
#MoveForward

©2016 Sprint. This information is subject to Sprint policies regarding use and is the property of Sprint and/or its relevant affiliates. Any review, use, distribution or disclosure is prohibited without authorization.
Cautionary Statement
2#MoveForward
SAFE HARBOR
This release includes “forward-looking statements” within the meaning of the securities laws. The words “may,” “could,”
“should,” “estimate,” “project,” “forecast,” “intend,” “expect,” “anticipate,” “believe,” “target,” “plan”, “outlook,”
“providing guidance,” and similar expressions are intended to identify information that is not historical in nature. All
statements that address operating performance, events or developments that we expect or anticipate will occur in the
future — including statements relating to our network, connections growth, and liquidity; and statements expressing
general views about future operating results — are forward-looking statements. Forward-looking statements are
estimates and projections reflecting management’s judgment based on currently available information and involve a
number of risks and uncertainties that could cause actual results to differ materially from those suggested by the
forward-looking statements. With respect to these forward-looking statements, management has made assumptions
regarding, among other things, the development and deployment of new technologies and services; efficiencies and
cost savings of new technologies and services; customer and network usage; connection growth and retention; service,
speed, coverage and quality; availability of devices; availability of various financings, including any leasing transactions;
the timing of various events and the economic environment. Sprint believes these forward-looking statements are
reasonable; however, you should not place undue reliance on forward-looking statements, which are based on current
expectations and speak only as of the date when made. Sprint undertakes no obligation to publicly update or revise any
forward-looking statements, whether as a result of new information, future events or otherwise, except as required by
law. In addition, forward-looking statements are subject to certain risks and uncertainties that could cause actual
results to differ materially from our company's historical experience and our present expectations or projections.
Factors that might cause such differences include, but are not limited to, those discussed in Sprint Corporation’s Annual
Report on Form 10-K for the fiscal year ended March 31, 2016. You should understand that it is not possible to predict
or identify all such factors. Consequently, you should not consider any such list to be a complete set of all potential risks
or uncertainties.
©2016 Sprint. This information is subject to Sprint policies regarding use and is the property of Sprint and/or its relevant affiliates. Any review, use, distribution or disclosure is prohibited without authorization.
*Non-GAAP Financial Measures
3#MoveForward
*FINANCIAL MEASURES
Sprint provides financial measures determined in accordance with GAAP and adjusted GAAP (non-GAAP). The non-GAAP financial measures reflect industry conventions, or standard
measures of liquidity, profitability or performance commonly used by the investment community for comparability purposes. These measurements should be considered in addition to,
but not as a substitute for, financial information prepared in accordance with GAAP. We have defined below each of the non-GAAP measures we use, but these measures may not be
synonymous to similar measurement terms used by other companies.
Sprint provides reconciliations of these non-GAAP measures in its financial reporting. Because Sprint does not predict special items that might occur in the future, and our forecasts are
developed at a level of detail different than that used to prepare GAAP-based financial measures, Sprint does not provide reconciliations to GAAP of its forward-looking financial
measures.
The measures used in this release include the following:
EBITDA is operating income/(loss) before depreciation and amortization. Adjusted EBITDA is EBITDA excluding severance, exit costs, and other special items. Adjusted EBITDA Margin
represents Adjusted EBITDA divided by non-equipment net operating revenues for Wireless and Adjusted EBITDA divided by net operating revenues for Wireline. We believe that
Adjusted EBITDA and Adjusted EBITDA Margin provide useful information to investors because they are an indicator of the strength and performance of our ongoing business
operations. While depreciation and amortization are considered operating costs under GAAP, these expenses primarily represent non-cash current period costs associated with the use
of long-lived tangible and definite-lived intangible assets. Adjusted EBITDA and Adjusted EBITDA Margin are calculations commonly used as a basis for investors, analysts and credit
rating agencies to evaluate and compare the periodic and future operating performance and value of companies within the telecommunications industry.
Sprint Platform Postpaid ABPA is average billings per account and calculated by dividing postpaid service revenue earned from postpaid customers plus installment plan billings and
lease revenue by the sum of the monthly average number of postpaid accounts during the period. We believe that ABPA provides useful information to investors, analysts and our
management to evaluate average Sprint platform postpaid customer billings per account as it approximates the expected cash collections, including installment plan billings and lease
revenue, per postpaid account each month.
Sprint Platform Postpaid Phone ABPU is average billings per postpaid phone user and calculated by dividing service revenue earned from postpaid phone customers plus installment
plan billings and lease revenue by the sum of the monthly average number of postpaid phone connections during the period. We believe that ABPU provides useful information to
investors, analysts and our management to evaluate average Sprint platform postpaid phone customer billings as it approximates the expected cash collections, including installment
plan billings and lease revenue, per postpaid phone user each month.
Free Cash Flow is the cash provided by operating activities less the cash used in investing activities other than short-term investments, including changes in restricted cash, if any, and
excluding the sale-leaseback of devices. Adjusted Free Cash Flow is Free Cash Flow plus the proceeds from device financings and sales of future lease receivables, net of repayments.
We believe that Free Cash Flow and Adjusted Free Cash Flow provide useful information to investors, analysts and our management about the cash generated by our core operations
and net proceeds obtained to fund certain leased devices, respectively, after interest and dividends, if any, and our ability to fund scheduled debt maturities and other financing
activities, including discretionary refinancing and retirement of debt and purchase or sale of investments.
Net Debt is consolidated debt, including current maturities, less cash and cash equivalents, short-term investments and, if any, restricted cash. We believe that Net Debt provides useful
information to investors, analysts and credit rating agencies about the capacity of the company to reduce the debt load and improve its capital structure.

©2016 Sprint. This information is subject to Sprint policies regarding use and is the property of Sprint and/or its relevant affiliates. Any review, use, distribution or disclosure is prohibited without authorization.
Net Loss per Share
4#MoveForward
1QFY151QFY151QFY151QFY15 1QFY161QFY161QFY161QFY16
Reported net loss per share ($0.01) ($0.08)
Select items included in net loss per share:
Contract terminations ($0.03)

©2016 Sprint. This information is subject to Sprint policies regarding use and is the property of Sprint and/or its relevant affiliates. Any review, use, distribution or disclosure is prohibited without authorization.
Fiscal 1Q 2016 Highlights
5#MoveForward
Highest postpaid phone net additions^ for a fiscal first quarter in the last nine years1
Best-ever postpaid phone churn^ in the company’s 20 year history in wireless
Postpaid net port positive against all three national carriers for the first time in over 5 years
Grew wireless operating revenue y/y while aggressively reducing cash operating expenses
Nearly $11 billion of liquidity
LTE Plus service now available in 237 markets, and our 2.5GHz spectrum now carries more LTE traffic than any of our other spectrum bands
1 Excluding Nextel Migrations
^ Indicates results specific to Sprint Platform
©2016 Sprint. This information is subject to Sprint policies regarding use and is the property of Sprint and/or its relevant affiliates. Any review, use, distribution or disclosure is prohibited without authorization.
6
4
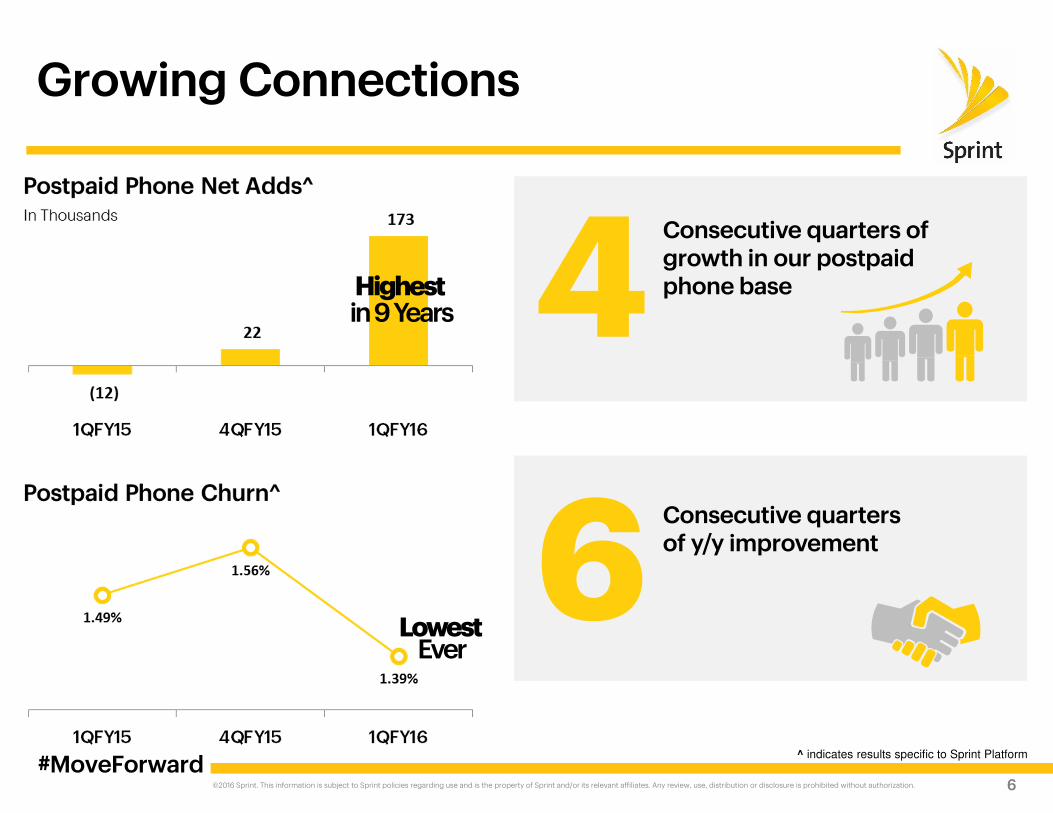
Growing Connections
6#MoveForward
^ indicates results specific to Sprint Platform
Lowest Ever
Highest in 9 Years
Consecutive quarters of y/y improvement
Consecutive quarters of growth in our postpaid phone base

©2016 Sprint. This information is subject to Sprint policies regarding use and is the property of Sprint and/or its relevant affiliates. Any review, use, distribution or disclosure is prohibited without authorization.
Network Getting Better Every Day
7#MoveForward
Sprint is Back!
LTE Download Delivered Speed Trend – All Downloads (150KB + )
Source: Sprint’s analysis of Nielson NMP data (Apr 2016 – Jun 2016) for average LTE download speeds in 44 NMP MSA’s
First Place Network Reliability
RootScore® Awards*
75%
*Rankings based on RootMetrics 125 Metro RootScore Reports (January-June 2016) for mobile performance as tested on best available plans and
devices on 4 mobile networks across all available network types. Your experience may vary. The RootMetrics awards are not an endorsement of Sprint.
Visit www.rootmetrics.com.
©2016 Sprint. This information is subject to Sprint policies regarding use and is the property of Sprint and/or its relevant affiliates. Any review, use, distribution or disclosure is prohibited without authorization.
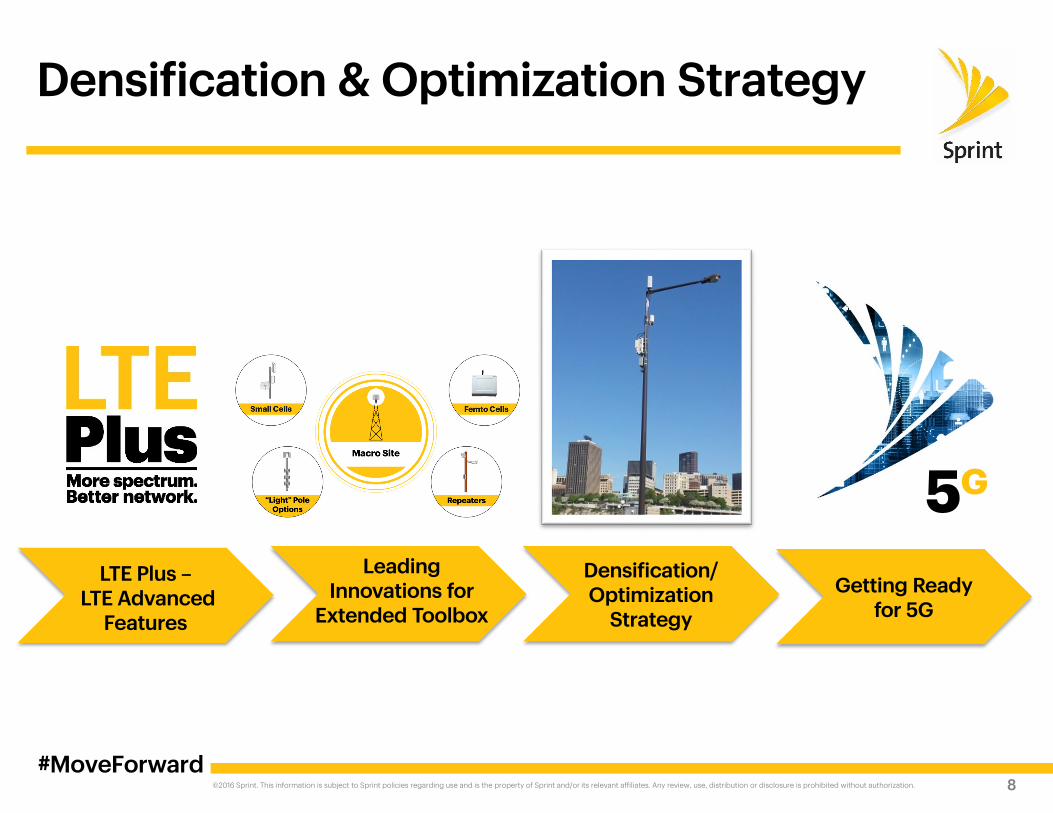
Densification & Optimization Strategy
8#MoveForward
LTE Plus –LTE Advanced
Features
Densification/ Optimization Strategy
Getting Ready for 5G
Leading Innovations for
Extended Toolbox
G5

©2016 Sprint. This information is subject to Sprint policies regarding use and is the property of Sprint and/or its relevant affiliates. Any review, use, distribution or disclosure is prohibited without authorization.
Enhancing Our Value Proposition
9
©2016 Sprint. This information is subject to Sprint policies regarding use and is the property of Sprint and/or its relevant affiliates. Any review, use, distribution or disclosure is prohibited without authorization.
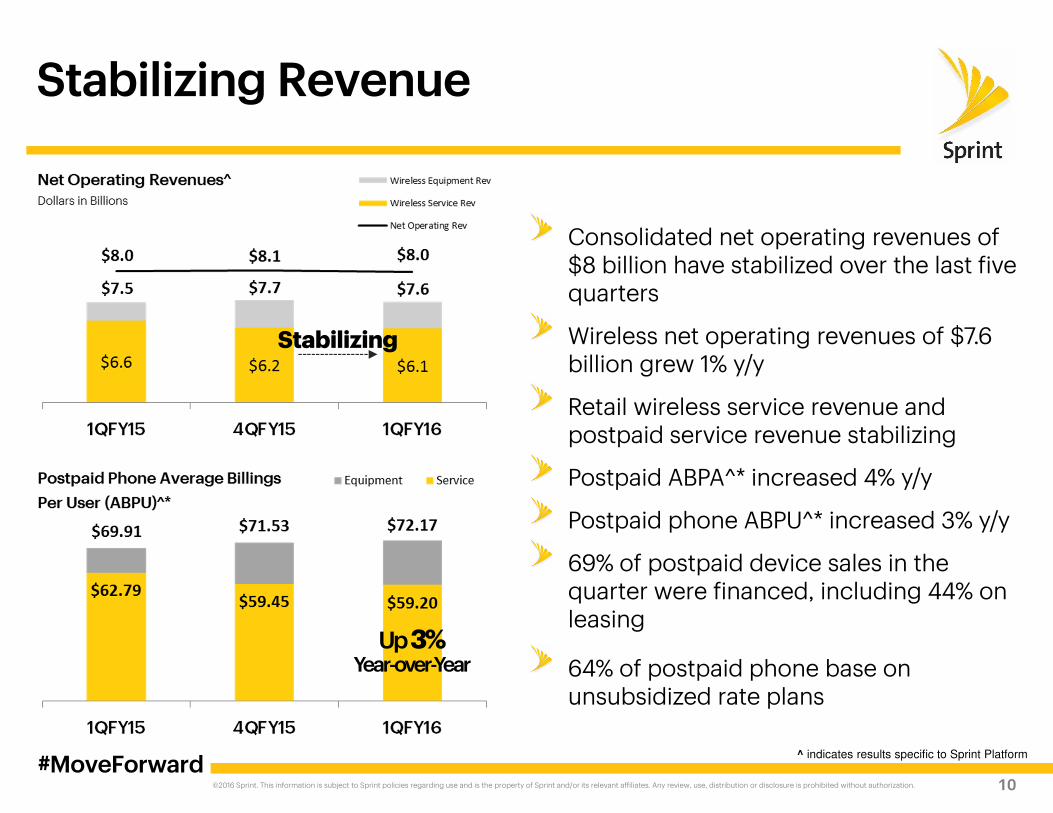
Stabilizing Revenue
10#MoveForward
Consolidated net operating revenues of $8 billion have stabilized over the last five quarters
Wireless net operating revenues of $7.6 billion grew 1% y/y
Retail wireless service revenue and postpaid service revenue stabilizing
Postpaid ABPA^* increased 4% y/y
Postpaid phone ABPU^* increased 3% y/y
69% of postpaid device sales in the quarter were financed, including 44% on leasing
64% of postpaid phone base on unsubsidized rate plans
^ indicates results specific to Sprint Platform
Stabilizing
Up3%Year-over-Year
©2016 Sprint. This information is subject to Sprint policies regarding use and is the property of Sprint and/or its relevant affiliates. Any review, use, distribution or disclosure is prohibited without authorization.
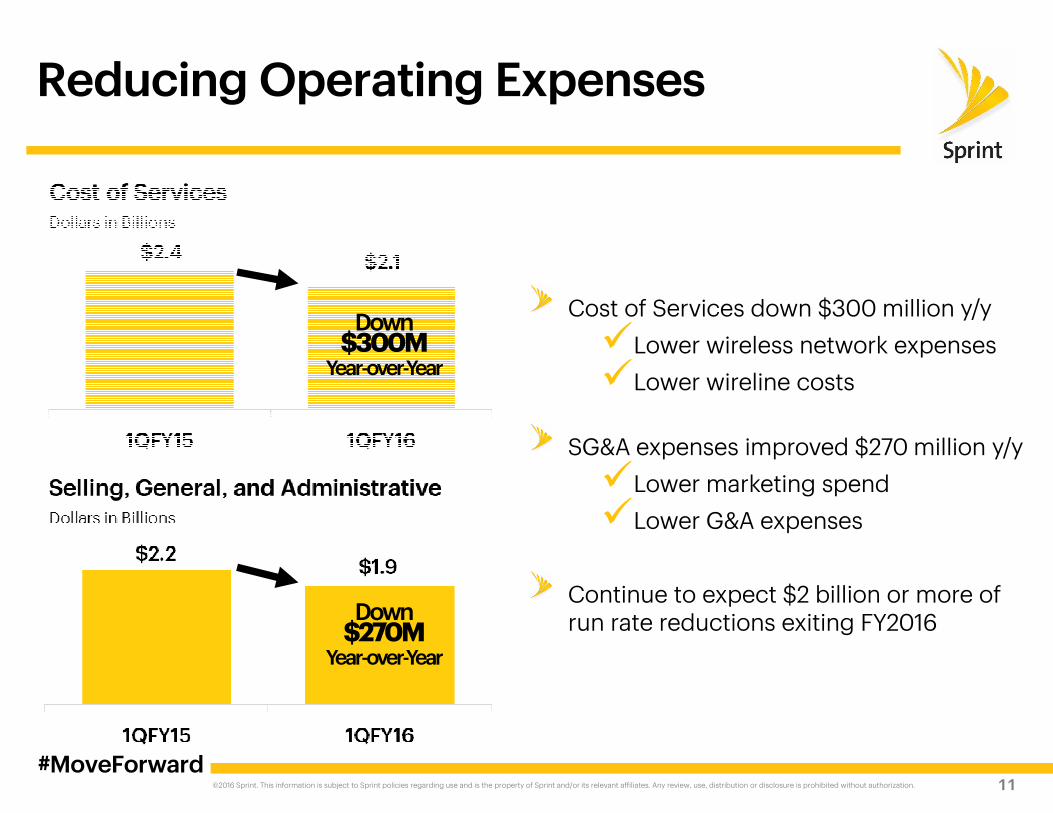
Reducing Operating Expenses
11#MoveForward
Cost of Services down $300 million y/y
�Lower wireless network expenses
�Lower wireline costs
SG&A expenses improved $270 million y/y
�Lower marketing spend
�Lower G&A expenses
Continue to expect $2 billion or more of run rate reductions exiting FY2016
Down$300M
Year-over-Year
Down$270M
Year-over-Year
©2016 Sprint. This information is subject to Sprint policies regarding use and is the property of Sprint and/or its relevant affiliates. Any review, use, distribution or disclosure is prohibited without authorization.
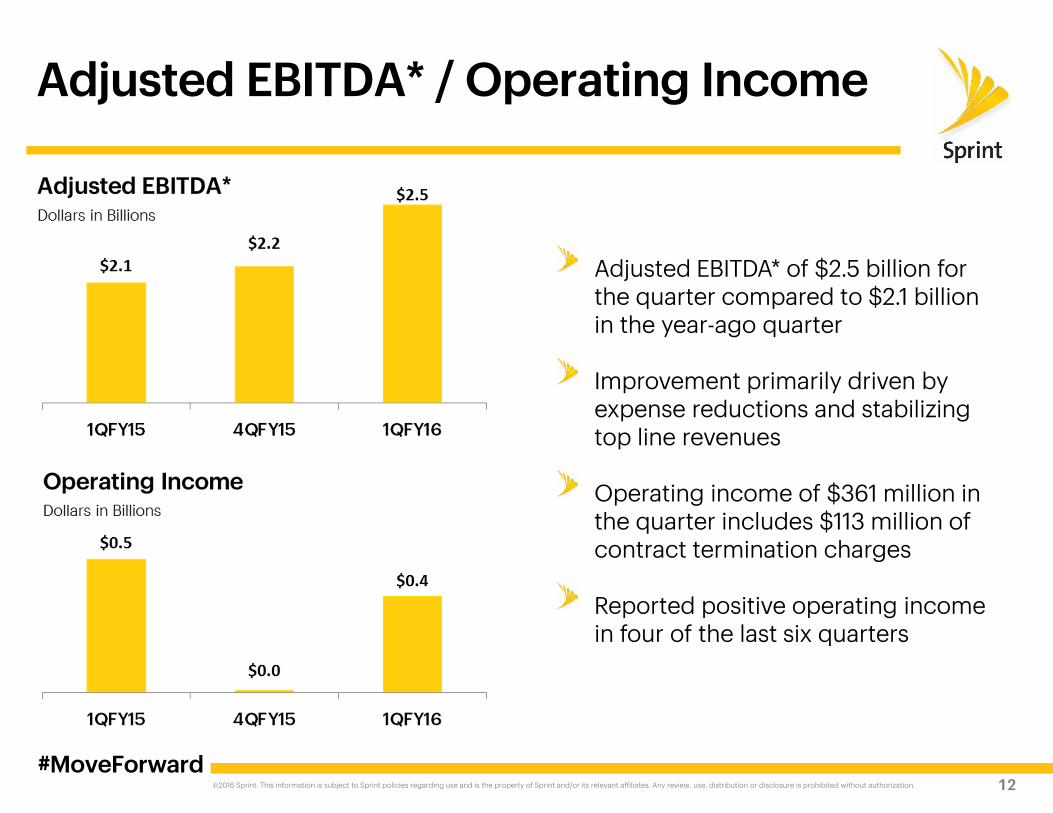
Adjusted EBITDA* / Operating Income
12#MoveForward
Adjusted EBITDA* of $2.5 billion for the quarter compared to $2.1 billion in the year-ago quarter
Improvement primarily driven by expense reductions and stabilizing top line revenues
Operating income of $361 million in the quarter includes $113 million of contract termination charges
Reported positive operating income in four of the last six quarters
©2016 Sprint. This information is subject to Sprint policies regarding use and is the property of Sprint and/or its relevant affiliates. Any review, use, distribution or disclosure is prohibited without authorization.
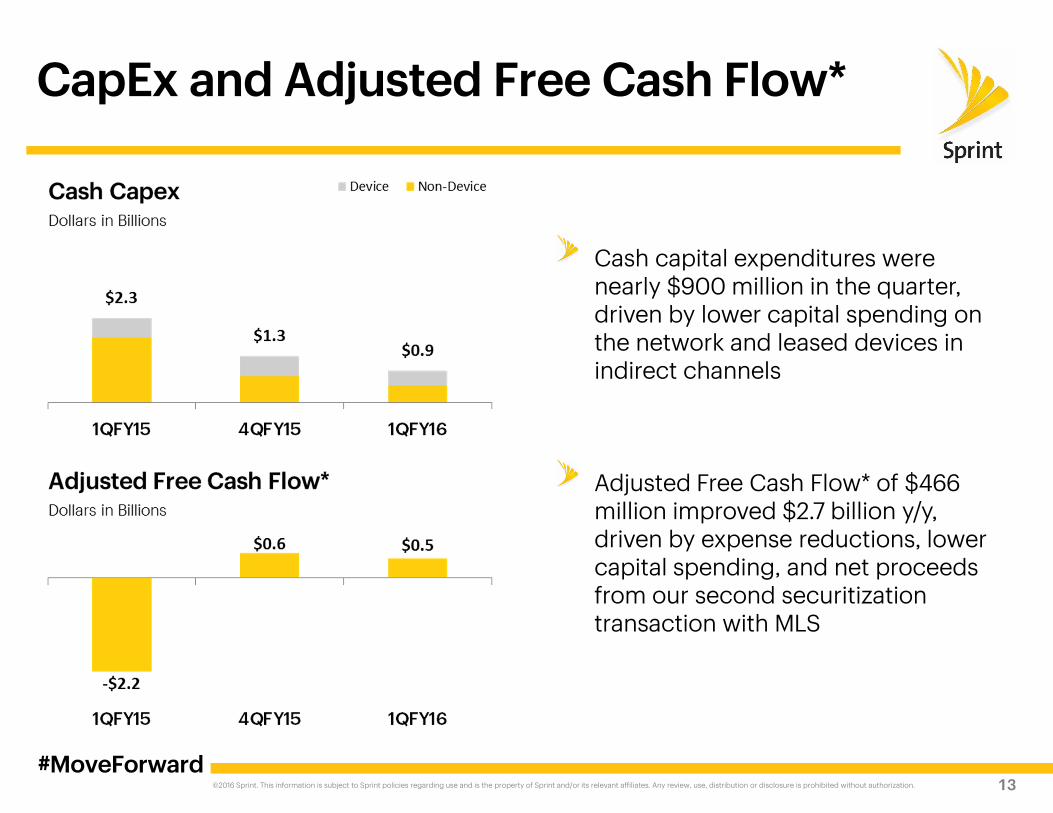
CapEx and Adjusted Free Cash Flow*
13#MoveForward
Cash capital expenditures were nearly $900 million in the quarter, driven by lower capital spending on the network and leased devices in indirect channels
Adjusted Free Cash Flow* of $466 million improved $2.7 billion y/y, driven by expense reductions, lower capital spending, and net proceeds from our second securitization transaction with MLS
©2016 Sprint. This information is subject to Sprint policies regarding use and is the property of Sprint and/or its relevant affiliates. Any review, use, distribution or disclosure is prohibited without authorization.
Cash, cash equiv, short-term investments
$2-$4 Potential FY ‘16 Funding
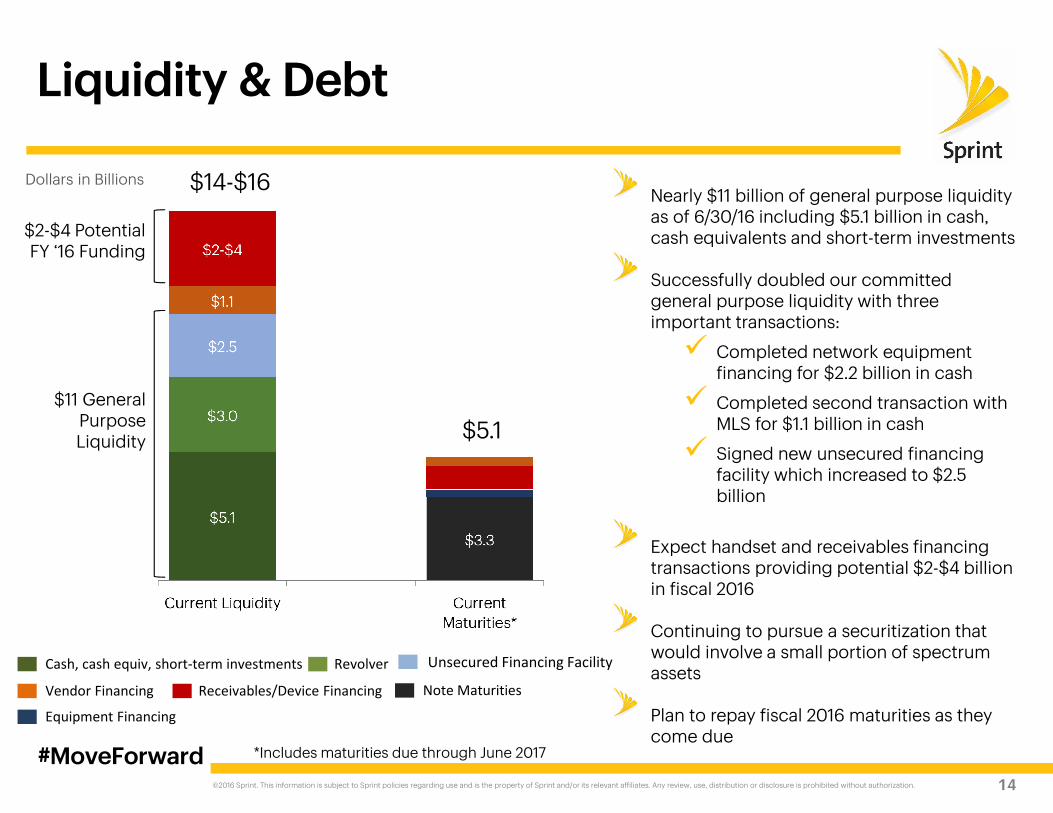
Liquidity & Debt
14
#MoveForward
Nearly $11 billion of general purpose liquidity as of 6/30/16 including $5.1 billion in cash, cash equivalents and short-term investments
Successfully doubled our committed general purpose liquidity with three important transactions:
� Completed network equipment financing for $2.2 billion in cash
� Completed second transaction with MLS for $1.1 billion in cash
� Signed new unsecured financing facility which increased to $2.5 billion
Expect handset and receivables financing transactions providing potential $2-$4 billion in fiscal 2016
Continuing to pursue a securitization that would involve a small portion of spectrum assets
Plan to repay fiscal 2016 maturities as they come due
$11 General Purpose Liquidity
$14-$16
$5.1
Revolver
Equipment Financing
Receivables/Device Financing
Unsecured Financing Facility
Vendor Financing Note Maturities
Dollars in Billions
*Includes maturities due through June 2017
©2016 Sprint. This information is subject to Sprint policies regarding use and is the property of Sprint and/or its relevant affiliates. Any review, use, distribution or disclosure is prohibited without authorization.
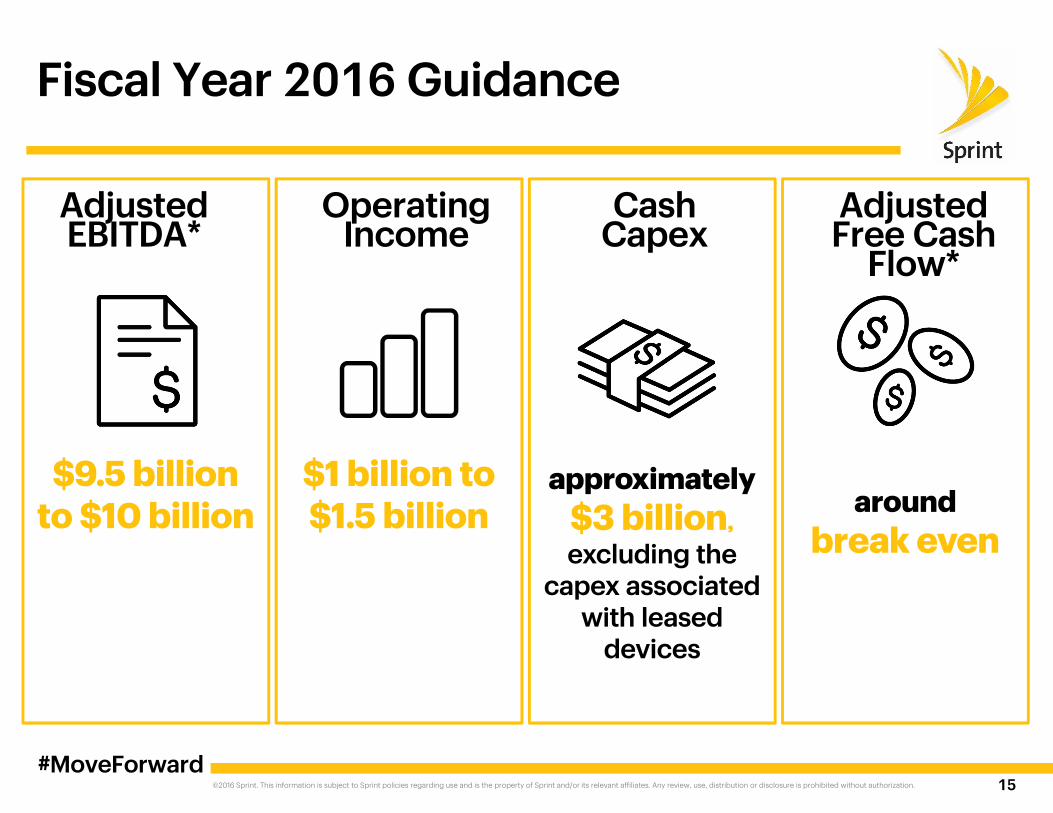
$9.5 billion to $10 billion around
break even
Fiscal Year 2016 Guidance
15#MoveForward
$1 billion to $1.5 billion
approximately
$3 billion,
excluding the capex associated
with leased devices
Operating Income
Cash Capex
AdjustedFree Cash Flow*
Adjusted EBITDA*

©2016 Sprint. This information is subject to Sprint policies regarding use and is the property of Sprint and/or its relevant affiliates. Any review, use, distribution or disclosure is prohibited without authorization.
Questions & Answers
#MoveForward