sprint interval training in hypoxia stimulates glycolytic...
TRANSCRIPT
Sprint Interval Training in Hypoxia StimulatesGlycolytic Enzyme Activity
JOKE PUYPE1, KAREN VAN PROEYEN1, JEAN-MARC RAYMACKERS2, LOUISE DELDICQUE1,and PETER HESPEL1
1Exercise Physiology Research Group, Department of Kinesiology, KU Leuven, Leuven, BELGIUM; and 2Institute ofNeuroscience, Universite catholique de Louvain, Brussels, BELGIUM
ABSTRACT
PUYPE, J., K. VAN PROEYEN, J.-M. RAYMACKERS, L. DELDICQUE, AND P. HESPEL. Sprint Interval Training in Hypoxia
Stimulates Glycolytic Enzyme Activity. Med. Sci. Sports Exerc., Vol. 45, No. 11, pp. 2166–2174, 2013. Purpose: In this study, we
compared the effect of sprint interval training (SIT) in normoxia versus hypoxia on muscle glycolytic and oxidative capacity,
monocarboxylate transporter content, and endurance exercise performance. Methods: Healthy male volunteers (18–30 yr) performed
6 wk of SIT on a cycling ergometer (30-s sprints vs 4.5-min rest intervals; 3 dIwkj1) in either normobaric hypoxia (HYP, FiO2 = 14.4%,
n = 10) or normoxia (NOR, FiO2 = 20.9%, n = 9). The control group did not train (CON, n = 10). Training load was increased from four
sprints per session in week 1 to nine sprints in week 6. Before and after SIT, subjects performed a maximal incremental exercise test
plus a 10-min simulated time trial on a cycle ergometer in both normoxia (MAXnor and TTnor) and hypoxia (MAXhyp and TThyp). A
needle biopsy was taken from musculus vastus lateralis at rest 5–6 d after the last exercise session. Results: SIT increased muscle
phosphofructokinase activity more in HYP (+59%, P G 0.05) than that in NOR (+17%), whereas citrate synthase activity was similar
between groups. Compared with the pretest, power outputs corresponding to 4 mmol blood lactate in HYP during MAXnor (+7%) and
MAXhyp (+9%) were slightly increased (P G 0.05), whereas values were constant in NOR. VO2max in MAXnor and TT performance in TTnorand TThyp were increased by È6%–8% (P G 0.05) in either group. The training elevated monocarboxylate transporter 1 protein content
by È70% (P G 0.05). In CON, all measurements were constant throughout the study. Conclusion: SIT in hypoxia up-regulated muscle
phosphofructokinase activity and the anaerobic threshold more than SIT in normoxia but did not enhance endurance exercise performance.
Key Words: HIGH-INTENSITY INTERVAL TRAINING, ANAEROBIC THRESHOLD, PHOSPHOFRUCTOKINASE, MUSCLE
LACTATE TRANSPORTER, ENDURANCE PERFORMANCE
Altitude training has been used for more than 50 yr asa popular strategy in athletic populations to improveendurance exercise performance at sea level. For the
last 15–20 yr, various new technologies have been devel-oped to simulate altitude environments by the production ofhypoxic air under normobaric conditions. This has stimulatedthe use of the so-called ‘‘live high–train low’’ procedures inthe preparation of endurance competitions because athletescan comfortably embed ‘‘altitude’’ in their normal trainingenvironment at sea level. In addition, some of the commer-cial hypoxicators can produce hypoxic air at sufficiently highrates to cope with the high pulmonary ventilations elicitedby high-intensity exercise. Hence, ‘‘living low–training high’’
also is becoming a popular ingredient of training in enduranceathletes. The validity of such an approach has been demon-strated in a series of studies showing high-intensity endurancetraining in hypoxia to bemore effective than similar training innormoxia, to induce skeletal muscle remodeling to facilitateoxidative energy turnover (22,40). Thus, training in hypoxiawas found to activate hypoxia-inducible factor 1 (HIF-1), whichwas associated with increased mitochondrial volume densityand capillarity, as well as the up-regulation of vascular endo-thelial growth factor and glycolytic enzyme mRNAs (35,40).Furthermore, some studies have indeed found increased VO2max
and maximal power outputs, but most prominently duringexercise testing at altitude (23).
Apart from hypoxia training, sprint interval training (SIT),characterized by repeated sprints at supramaximal work-loads interspersed by short recovery bouts, also is a popularstrategy to enhance endurance exercise performance. It hasbeen demonstrated that a few weeks of consistent SIT, in-volving 30-s ‘‘all-out’’ sprints interspersed by 4 min of activerecovery episodes, can increase indices of muscular oxida-tive capacity (3,6–8,13,17), glycolytic energy turnover (17),VO2max (3,7,17,21), and exercise performance (6,8,13,17,21),to the same degree or even more than much larger volumesof aerobic endurance training (7,13). Hence, small-volume
Address for correspondence: Peter Hespel, Ph.D., Exercise Physiology Re-search Group, Department of Kinesiology, FABER, KU Leuven, Tervuursevest101, B-3001Heverlee, Leuven, Belgium; E-mail: [email protected] for publication January 2013.Accepted for publication April 2013.
0195-9131/13/4511-2166/0MEDICINE & SCIENCE IN SPORTS & EXERCISE�Copyright � 2013 by the American College of Sports Medicine
DOI: 10.1249/MSS.0b013e31829734ae
2166
APP
LIED
SCIENCES
Copyright © 2013 by the American College of Sports Medicine. Unauthorized reproduction of this article is prohibited.

SIT may be a time efficient strategy to stimulate muscle andperformance adaptations equal to traditional high-volume en-durance training.
To date, experiments involving hypoxic training have justlooked at the potential of traditional constant-load ‘‘aerobic’’exercise. However, on the basis of the aforementioned evi-dence, it is reasonable to speculate that SIT in hypoxia mightbe another pertinent exercise stimulus to boost enduranceexercise performance either at sea level or at altitude. It iswell established that aerobic performance capacity consis-tently drops at altitude (36), which impairs training adapta-tion due to reduction of overall training workload. Conversely,performance in short maximal exercise is not impaired byacute exposure to low or moderate altitude/hypoxia (38) be-cause increased fraction of glycolytic ATP production com-pensates for the hypoxia-induced drop of oxidative energyinput. Arterial oxygen content in fact is significantly reducedduring SIT in hypoxia (30). Hence, a lower rate of oxygendelivery to muscles increases stress on glycolytic flux, whichconceivably may stimulate the up-regulation of this energypathway. Against this background, in this study, we com-pared the effects of a well-validated high-intensity intervaltraining protocol (7) in normoxia versus hypoxia (14.5%FiO2, corresponding to È3000 m altitude) on VO2max andendurance exercise performance in both normoxia and hyp-oxia as well as on indices of muscle oxidative and glycolyticcapacity.
METHODS
Subjects
Twenty-nine healthy male subjects, age 18–30 yr, volun-teered to take part in the study, which was approved by theethics committee of KU Leuven. Subjects gave their written,informed consent after they underwent a medical checkup andwere informed in detail of all experimental procedures andpossible risks associated with the experiments. Exclusioncriteria for participation were smoking, exposure to hypoxiaor intermittent sprint training during a period of 6 monthsbefore the study, and any health risk that could compromisethe subject’s safety during training and/or hypoxia exposure.All subjects were involved in regular sports and physicalactivity at a rate of three to five times per week. Subjectswere instructed not to participate in any strenuous exercisesessions other than prescribed by the study protocol. Theywere also repeatedly instructed to maintain constant dietaryand physical activity pattern throughout the study and torefrain from any exercise, except the activities of daily liv-ing, for 2 d before the experimental sessions (pretest andposttest). Furthermore, to minimize diet-induced variabilityin muscle metabolism during exercise, subjects were in-structed to register their food intake in a diary for 3 d pre-ceding the pretest and to replicate this diet for the posttest. Inaddition, during the pretest and posttest, subjects received acarbohydrate-rich meal (1050 kcal, 60% carbohydrates, 30%
fat, 10% protein) between 3 and 4 h before the start of theexercise tests. During the study, one subject from thenormoxia training group (see next section) was excludedbecause of nonadherence to the training protocol.
Experimental Protocol
Study design and experimental groups. The sub-jects first performed a familiarization session to experiencethe procedures of the exercise tests for the pretest and theposttest. One week later, they participated in the pretest,which involved two identical exercise testing sessions, in-terspersed by a 2-d rest interval, including an incrementalVO2max test plus a 10-min simulated time trial. However, thefirst session was performed in normoxia (FiO2 È20.9%),whereas the second was performed in hypoxia (FiO2
È14.5%). In addition, 5–6 d after the last session, the sub-jects returned to the laboratory after an overnight fast for aresting muscle biopsy. Needle biopsies were taken from theright musculus vastus lateralis through an incision in theskin and under local anesthetic (2–3 mL lidocaine, subcu-taneously). After the pretest, subjects were matched to ob-tain triplets with similar values for age, body weight, andpower output at VO2max (Table 1). The triplets were ran-domly assigned to three experimental groups. Two groupsparticipated in a 6-wk supervised cycling training programinvolving SIT (see next section) in either hypoxia (HYP,n = 10) or normoxia (NOR, n = 9). A control group (CON,n = 10) was not enrolled in the training program. After the6-wk intervention period, all subjects participated in theposttest, which was identical with the pretest. Exercise testsin the pretest and the posttest were performed on the sameday of the week and same time of the day. In the posttest, toallow for adequate recovery, the last SIT session was sched-uled 3 d before the start of the posttest. Furthermore, becausemuscle biopsies were taken 5–6 d after the last exercise testsession, biopsies in the posttest were taken 12–13 d after thelast SIT session.
Training intervention. NOR performed all SIT ses-sions in normoxia (FiO2 È20.9%), whereas HYP trained in anormobaric hypoxic facility (SportingEdge, Sherfield onLoddon, UK) maintained at 14.5% ambient O2 content,which corresponds to È3000 m of simulated altitude. Sub-jects were not blinded to the conditions because the per-ception of exaggerated hyperventilation during recoveryfrom sprints in hypoxia conceivably would rapidly undo theblinding. Subjects participated in three supervised trainingsessions per week (Monday–Wednesday–Friday) for 6 wk.Each SIT session started with a 10-min warm-up at 100 W.Thereafter, subjects performed a series of 30-s sprints, sep-arated by recovery cycling intervals of 4 min 30 s (50 W).Cadence during the sprints was fixed at 100–105 rpm byusing the isokinetic mode of operation of the cycle ergom-eters (Avantronic Cyclus 2). In each session, subjects wereasked to perform the first and the last sprint at maximalpower. The other sprints were performed at È80% of the
SPRINT TRAINING IN HYPOXIA Medicine & Science in Sports & Exercised 2167
APPLIED
SCIEN
CES
Copyright © 2013 by the American College of Sports Medicine. Unauthorized reproduction of this article is prohibited.
mean power output measured in the first sprint. The numberof sprints per session was progressively increased fromfour in week 1 to nine in week 6. Immediately after the lastsprint, the subjects started a 15-min cooling down at 100 W.Power output during the sprints was continuously measured(Avantronic Cyclus 2). Furthermore, 3 min after the first andthe last sprint, a capillary blood sample (5 KL) was collectedfrom an earlobe for determination of blood lactate concen-tration (Lactate Pro, Arkray, Japan). Pilot experiments in asimilar population in our laboratory before the start of thestudy indicated that arterial oxygen saturation during SIT in14.5% ambient O2 content is consistently reduced comparedwith similar training in normoxia (Fig. 1).
Exercise testing. In the pretest and the posttest, thesubjects reported to the laboratory in normoxia (FiO2
È20.9%) to perform a maximal incremental exercise test(MAXnor) followed by a 10-min simulated time trial (TTnor)on an electromagnetically braked bicycle ergometer (Avan-tronic Cyclus 2). Three days later, these tests were repeatedin hypoxia (FiO2 È14.5%, MAXhyp and TThyp). The initialworkload for the incremental VO2max tests was set at 60 Wand was increased by another 35 W every 3 min untilvoluntary exhaustion (drop of cadence G75 rpm). During thetest, heart rate was continuously measured (Polar, Kempele,Finland), and a capillary blood sample (5 KL) for lactateassay (Lactate Pro) was taken from an earlobe during thefinal 30 s of each stage as well as 0 and 3 min postexercise.The exercise intensity (W) corresponding with a blood lac-tate level of 4 mmolILj1 (LT4) was extrapolated from thelactate curve and was used as an index of the anaerobicthreshold. Furthermore, during the final 3–5 min of the test,expired gases were collected to determine VO2max (Cortex
�
Metalyzer II, Leipzig, Germany). The subjects then activelyrecovered for 20 min by easy cycling at 60 W, after whichthe 10-min TT was started. Initial load was set at 90% ofpeak power output obtained from the VO2max test, andsubjects could adjust the workload at any time, aiming todevelop as high as possible a mean power output during the10 min. However, power output was hidden to the subjectsfor workload adjustments would be driven by rate of per-ceived exertion only. Heart rate during the time trial wascontinuously measured (Polar), and a capillary blood samplefor determination of lactate concentration (Lactate Pro) wassampled after 3 min of passive recovery.
Analysis of Muscle Samples
A part of the muscle samples was immediately frozen inliquid nitrogen. All muscle samples were stored at j80-Ctill later analysis. Muscle glycogen content was measured asglucose residues after acid hydrolysis using a standard en-zymatic fluorometric assay (19). Maximal activities of cit-rate synthase (CS) and phosphofructokinase (PFK) wereperformed using enzymatic spectrophotometric assays aspreviously described (11). For Western blotting, approxi-mately 30 mg of muscle was first homogenized (Polytron
2100, Kinematica, Newark, NJ) in a sucrose buffer (250 mMsucrose, 30 mM HEPES, 2 mM EGTA, 40 mM NaCl, 2 mMPMSF, pH 7.4) and centrifuged at 1000g for 5 min. Thisprocedure removed heavy material, including a fraction ofthe mitochondria. The supernatant was spun at 190,000gfor 90 min at 4-C. The new supernatant (cytosolic fraction)was stored at –80-C, whereas the new pellet (total musclemembrane fraction, including sarcolemmal and mitochon-drial membrane fractions) was resuspended in Tris–sodiumdodecyl sulfate (SDS) (10 mM Tris, 4% SDS, 1 mM EDTA,2 mM PMSF, pH 7.4). Protein content was determined with abovine serum albumin standard (DC protein assay; Bio-Rad,Herlev, Denmark). Fifteen micrograms of protein from eachsample was combined with Laemmli sample buffer andsubjected to SDS–polyacrylamide gel electrophoresis. Af-ter electrophoretic separation at 40 mA for 1 h, the proteinswere transferred to a polyvinylidene fluoride membraneat 80 V for 2 h for Western blot analysis. Membraneswere then incubated in 5% milk powder in tris buffered salinewith Tween 20. Subsequently, membranes were incubatedwith the following antibodies overnight at 4-C: phospho-adenosine monophosphate–activated protein kinase alpha(P-AMPK>Thr172; Cell Signaling Technology, Danvers, MA),total adenosine monophosphate–activated protein kinase(total AMPK; Cell Signaling), eukaryotic elongation fac-tor 2 (eEF2; Cell Signaling), monocarboxylate transporter 1(MCT1; Millipore, Overijse, Belgium), and MCT4 (Millipore).Membranes were washed in TBS-T and incubated for 1 hat room temperature in a secondary antibody conjugated tohorseradish peroxidase. After an additional three washes,chemiluminescence detection was carried out using LuminateTM
Forte Substrate (Millipore). Membranes were scanned andquantified with Genetools and Genesnap softwares (Syngene,Cambridge, UK), respectively. Results were expressed rela-tive to a standard sample that was run together with thesamples and are reported relative to AMPK total for P-AMPKand eEF2 total for MCT1 and MCT4. Pretest values in CONwere assigned the arbitrary value of 1.0, and all other sampleswere expressed relative to this value.
Data Analysis and Statistical Analyses
The effects of the interventions were evaluated using arepeated-measures ANOVA. Two-way ANOVA was per-formed to examine the main effects of treatment and/or time.A planned contrast analysis was used for post hoc compar-isons when appropriate. Contrast analysis was also usedto evaluate specific preplanned comparisons. A probabilitylevel (P) e0.05 was considered statistically significant. Alldata are expressed as means T SEM.
RESULTS
Sprint training parameters. The number of sprintsper session was progressively increased from four to ninethroughout the 6-wk training period (see Table 2). Hence,
http://www.acsm-msse.org2168 Official Journal of the American College of Sports Medicine
APP
LIED
SCIENCES
Copyright © 2013 by the American College of Sports Medicine. Unauthorized reproduction of this article is prohibited.

from the start to the end of the training, the mean poweroutputs during the last sprint of each session did not signif-icantly increase. However, the mean power outputs in thefirst sprints increased by È5% (P G 0.05) in both traininggroups. Nonetheless, peak power outputs were stable fromthe pretest to the posttest in either group. Irrespective ofthe experimental condition, blood lactate concentration in-creased from È7 to 8 mmolILj1 in the first sprint to È13 to14 mmolILj1 in the final sprint in both week 1 and week6 (P G 0.05). Peak heart rates during the training weresimilar between the groups at all times.
Incremental exercise tests. All subjects performeda maximal incremental exercise test in both normoxia(MAXnor, FiO2, 20.9%) and in hypoxia (MAXhyp, FiO2,14.5%; see Table 3). In the pretest, power output at LT4 aswell as peak VO2, blood lactate, and time to exhaustion weresimilar between the groups. Power output at LT4 (È17%),peak VO2 (È15%), time to exhaustion (È15%), and peakheart rate (È3%) were significantly lower in MAXhyp thanthat in MAXnor. In CON, most measurements were con-stant between the pretest and the posttest, except peak VO2
in MAXhyp, which slightly dropped (P G 0.05). Both traininggroups augmented peak VO2 by È6.5% (P G 0.05) inMAXnor, but not in MAXhyp. In MAXnor, compared with thepretest, power output in the posttest at LT4 increasedby È7% in HYP (P G 0.05) but was unchanged in NOR(HYP vs NOR, P = 0.09). Similarly, the training interven-tion increased LT4 power output during MAXhyp byÈ9% inHYP (P G 0.05), but not in NOR. Furthermore, from thepretest to the posttest, time to exhaustion in both NOR andHYP was improved by È4% in MAXnor (P G 0.05) versusÈ7% in MAXhyp (P G 0.05). Irrespective of the treatment,peak heart rate, blood lactate, and RER were similar betweenthe pretest and the posttest in either MAXnor or MAXhyp.
Time trial performance. Similar to the incrementalexercise tests, the subjects performed the 10-min simulatedtime trial in both normoxia (TTnor, FiO2, 20.9%) and inhypoxia (TThyp, FiO2, 14.5%; see Table 4). In the pretest,mean power output was not significantly different betweenthe three groups, yet on average was È15% lower in TThyp
than that in TTnor. TT performance in CON was unchangedin the posttest. Irrespective of the experimental condition, thetraining period increased mean power output by È6%–8%in both TTs (P G 0.05). In NOR, compared with the pretest,blood lactate concentration in the posttest was higher inTTnor and TThyp (P G 0.05). Conversely, in HYP, bloodlactate was higher in the posttest than that in the pretest in
TThyp (P G 0.05), but not in TTnor. However, lactate valuesat the end of the TTs were not significantly different be-tween NOR and HYP at any time.
Muscle enzyme activity. PFK and CS activity inresting muscle were used as indices of muscle glycolyticand oxidative capacity, respectively (see Figure 2). Pretestvalues for either enzyme were similar between the groupsand in CON were constant between the pretest and the post-test. The training program markedly increased PFK activity inHYP (+59%, P G 0.05), but not in NOR. Thus, in the posttest,PFK activity was significantly higher in HYP than that inNOR (P G 0.05). Irrespective of the experimental condition,CS activity was constant from the pretest to the posttest.
Muscle lactate transporters, AMPK, and glyco-gen content. In the pretest, muscle MCT1 and MCT4protein content and glycogen content were similar betweenthe groups, and in CON values were constant between thepretest and the posttest (see Figure 2). The training increasedmuscle MCT1 protein content by È70% in both NOR andHYP (P G 0.05), whereas MCT4 contents were unchanged.AMPK total protein content and phosphorylation status wereconstant between the pretest and the posttest, and there wereno significant differences between NOR and HYP at anytime. Compared with the pretest, the training increasedmuscle glycogen content in NOR by È25% (P G 0.05), butthis effect was not significantly different from HYP.
DISCUSSION
It is well established that, within limits of course, training-induced muscle cell adaptation is enhanced as the degreeof metabolic stress imposed by the training program is in-creased. Depending on the specific training goals, metabolic
TABLE 1. Subject characteristics.
CON NOR HYP
Age (yr) 27.9 T 2.0 25.1 T 1.9 23.8 T 1.6Height (cm) 179.9 T 2.5 179.2 T 2.2 179.3 T 1.6Weight (kg) 79.7 T 3.0 74.4 T 2.5 75.3 T 2.5VO2max (mLIminj1Ikgj1) 55.1 T 2.5 53.3 T 3.5 55.1 T 1.7Peak power (W) 322 T 16 310 T 14 305 T 9
Values are presented as mean T SEM for the control group (CON, n = 10) and the groupstraining in either normoxia (NOR, n = 9; FiO2, 20.9% ) or hypoxia (HYP, n = 10; FiO2, 14.5%).
FIGURE 1—Arterial O2 saturation during SIT in normoxia versushypoxia. Data represent observations in a preliminary pilot experimentinvolving an SIT session in young healthy subjects (n = 10). Subjectsperformed four 30-s maximal sprints (S1 to S4) on a cycling ergometer(Avantronic Cyclus 2), interspersed by recovery intervals of 4 min 30 s(cycling at 50 W). During the session, arterial oxygen saturation(%SpO2) was continuously measured at a rate of 60 Hz bypulsoximetry (NellcorN-600-x, Oxismart, Mallinckrodt, St. Louis, MO).The curves represent mean values for an SIT session in normoxia (FiO2,20.9%) versus an identical session in hypoxia (FiO2, 14.5%).
SPRINT TRAINING IN HYPOXIA Medicine & Science in Sports & Exercised 2169
APPLIED
SCIEN
CES
Copyright © 2013 by the American College of Sports Medicine. Unauthorized reproduction of this article is prohibited.

stress in endurance training can be raised either by increas-ing the duration and/or intensity of the exercise sessions orby doing training sessions in a carbohydrate-depleted orfasted state (34). Another strategy is to exercise in a state ofreduced oxygen allowance in either hypobaric (Èaltitude) ornormobaric hypoxia (Èsimulated altitude) (29). We postu-lated that low-volume SIT in hypoxia is more potent thanSIT in normoxia to enhance endurance exercise performancedue to more explicit beneficial physiological adaptations tofacilitate aerobic and anaerobic energy turnover in skeletalmuscles. In addition, the capacity to perform short high-intensity anaerobic exercise is unaffected by acute exposureto hypoxia, which allows athletes to maintain normal train-ing intensities (38). Therefore, we compared the effects of a6-wk SIT program involving 30-s sprints interspersed byrecovery intervals of 4 min 30 s in normoxia (NOR) versussimilar training in hypoxia (NOR; 14.5% FiO2, corre-sponding to È3000 m altitude) on VO2max and time trialperformance in both normoxia and hypoxia, as well as onsome muscular metabolic characteristics. As expected, peakand mean workloads during training were similar betweenthe two training groups (Table 2). Nonetheless, SIT inhypoxia, but not SIT in normoxia, increased muscle PFKactivity as well as slightly elevated functional power outputat the 4-mmol lactate threshold (LT4). However, in theconditions of the current study, these beneficial physiologi-cal adaptations translated into performance enhancementneither in a 10-min simulated time trial nor in an incrementalVO2max test in either normoxia or in hypoxia.
As indicated earlier, part of the rationale driving the cur-rent study is that the capacity to perform short bouts of an-aerobic exercise is intact during acute exposure to moderatehypoxia (38). This is explained by the fact that increasedfraction of anaerobic ATP production via glycolysis ade-quately compensates for the hypoxia-induced drop of oxida-tive energy turnover. Hence, compared with normoxia, stresson glycolytic flux is significantly increased, which conceiv-ably may stimulate the up-regulation of this energy pathway.Indeed, it is well established that consistent high-intensityexercise training involving high fraction of anaerobic ATP
production via glycolysis stimulates muscle PFK activity(16,20). Consistent with such assumptions, we found 6 wk ofSIT in hypoxia to increase muscle PFK activity approxi-mately threefold more than an equivalent volume of SIT innormoxia (Fig. 2). This finding is in line with earlier re-ports showing high-intensity endurance training in hypoxia tocause greater up-regulation of muscle PFK mRNA expressionthan similar training in normoxia (35,40). This effect proba-bly is at least partly due to elevated HIF-1> activity duringtraining in hypoxia. HIF-1> is suggested to stimulate tran-scription of the PFK enzyme (37). In addition, elevated HIF-1> mRNA abundance induced by hypoxic endurance trainingalso has been found to be associated with higher PFK proteinexpression (35,40).
The bulk of ATP production during a 30-s all-out sprint isaccounted for by muscle phosphocreatine breakdown plusanaerobic glycogen degradation to lactate (31). However,during repeated sprints interspersed by short rest intervals,the reactivation of glycogenolysis via allosteric activationof the phosphorylase enzyme becomes gradually impaired asthe number of sprints is increased. This failure to reactivateglycogenolysis is particularly true in type 2 fibers exhibit-ing at the same time the largest inhibition of Ca2+ activationand the most explicit drop of intramyocellular pH due toH+ accumulation (31).
This important role of oxidative metabolism in maintainingpower output during SIT definitely partly explains the poten-tial of SIT to stimulate muscular oxidative capacity (3,6–8,13,17). Along this line, it is the prevailing opinion that 5¶adenosine monophosphate-activated protein kinase (AMPK)by SIT is implicated in the up-regulation of mitochondrialadaptation. In this regard, some earlier studies have shownthat AMPK activity is acutely increased after an SIT session(9,14,18). However, to the best of our knowledge, the effectsof consistent SIT on basal muscle AMPK expression areunknown. We did not evaluate the acute effects of exercise,but analyses on resting muscle biopsies showed that the 6-wkSIT period up-regulated neither muscle AMPK total proteincontent nor AMPK phosphorylation status (Èactivity). Stud-ies in our (33,34) and other laboratories (27) have previously
TABLE 2. Blood lactate and power output during the SIT sessions.
NOR HYP
Week 1 Week 6 Week 1 Week 6Mean power (W)
First sprint 702 T 33 736 T 31* 639 T 19 679 T 25*Last sprint 609 T 34** 653 T 35** 591 T 22** 610 T 21**
Peak power (W)First sprint 944 T 52 954 T 35 976 T 45 989 T 28Last sprint 873T 45** 911 T 48 932 T 61 934 T 22
Blood lactate (mmolILj1)First sprint 6.9 T 0.6 7.5 T 0.5 8.1 T 0.7 7.8 T 0.7Last sprint 13.1 T 0.7** 13.7 T 1.0** 13.6 T 0.3** 14.2 T 0.4**
Peak heart rate (beatsIminj1)First sprint 181 T 4 179 T 3 181 T 3 179 T 4Last sprint 183 T 3 181 T 3 187 T 4** 184 T 3
Values are presented as mean T SEM observations during the first (week 1) and the last week (week 6) of the training period involving 30-s intermittent sprints in either normoxia (NOR,n = 9; FiO2, 20.9%) or hypoxia (HYP, n = 10; FiO2, 14.5%). The number of sprints per session was increased from four in week 1 to nine in week 6. Peak heart rate, mean, and peak poweroutputs during the first and the last sprints in week 1 and week 6 are given. Blood lactate was measured 3 min after the first and the last sprint.*P G 0.05 versus week 1.**P G 0.05 versus first sprint.
http://www.acsm-msse.org2170 Official Journal of the American College of Sports Medicine
APP
LIED
SCIENCES
Copyright © 2013 by the American College of Sports Medicine. Unauthorized reproduction of this article is prohibited.

shown high-volume endurance training readily to increaseAMPK abundance in muscle. Conversely, studies that lookedat the effects of low-volume high-intensity endurance traininghave yielded equivocal results, with two studies showingunchanged AMPK activity posttraining (10,39) versus onestudy reporting slightly increased AMPK activity posttraining(1). In this study, we added the observation that even lowervolumes of SIT failed to affect basal muscle AMPK. Thus,literature data taken together with the current findings clearlyindicate that high-volume endurance training is probably
more effective than low-volume high-intensity training tostimulate AMPK abundance in muscle. Consistent withunchanged AMPK, SIT even in normoxia did not elevate CSactivity. This is in conflict with earlier reports showing sub-stantial increase in markers of oxidative capacity in musclespost-SIT, including increase of CS activity (3,6–8,13,17),3-hydroxyacyl CoA dehydrogenase (7,17), pyruvate dehy-drogenase (7), cytochrome c oxidase (13), and succinate de-hydrogenase (28). The reason for this discrepant finding isunclear but may be due to the late timing of the muscle
FIGURE 2—Effect of SIT on muscle PFK (A) and CS activity (B), and on MCT1 (C), MCT4 (D), and AMPK protein content (E). Values are presentedas mean T SEM before (pretest) and after (posttest) the intervention period. Subjects were enrolled in a 6-wk training period involving 30-s inter-mittent sprints in either normoxia (n = 9; FiO2, 20.9%) or hypoxia (n = 10; FiO2, 14.5%). The control group (n = 10) did not train. In both the pretestand the posttest, a needle biopsy was taken from resting musculus vastus lateralis. For the AMPK data (E), a smaller number of observations wasincluded (CON: n = 7; NOR: n = 6; HYP: n = 7). WW, wet weight. See Methods section for more details. *P G 0.05 versus pretest, *P G 0.05 versus NORposttest.
SPRINT TRAINING IN HYPOXIA Medicine & Science in Sports & Exercised 2171
APPLIED
SCIEN
CES
Copyright © 2013 by the American College of Sports Medicine. Unauthorized reproduction of this article is prohibited.
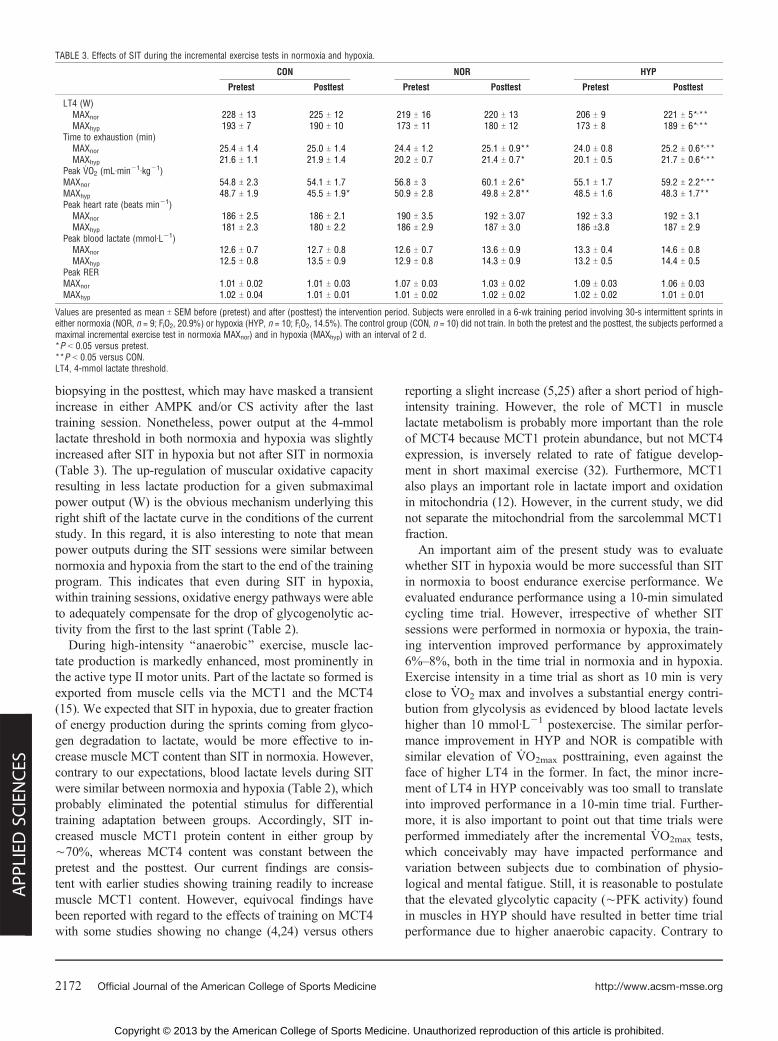
biopsying in the posttest, which may have masked a transientincrease in either AMPK and/or CS activity after the lasttraining session. Nonetheless, power output at the 4-mmollactate threshold in both normoxia and hypoxia was slightlyincreased after SIT in hypoxia but not after SIT in normoxia(Table 3). The up-regulation of muscular oxidative capacityresulting in less lactate production for a given submaximalpower output (W) is the obvious mechanism underlying thisright shift of the lactate curve in the conditions of the currentstudy. In this regard, it is also interesting to note that meanpower outputs during the SIT sessions were similar betweennormoxia and hypoxia from the start to the end of the trainingprogram. This indicates that even during SIT in hypoxia,within training sessions, oxidative energy pathways were ableto adequately compensate for the drop of glycogenolytic ac-tivity from the first to the last sprint (Table 2).
During high-intensity ‘‘anaerobic’’ exercise, muscle lac-tate production is markedly enhanced, most prominently inthe active type II motor units. Part of the lactate so formed isexported from muscle cells via the MCT1 and the MCT4(15). We expected that SIT in hypoxia, due to greater fractionof energy production during the sprints coming from glyco-gen degradation to lactate, would be more effective to in-crease muscle MCT content than SIT in normoxia. However,contrary to our expectations, blood lactate levels during SITwere similar between normoxia and hypoxia (Table 2), whichprobably eliminated the potential stimulus for differentialtraining adaptation between groups. Accordingly, SIT in-creased muscle MCT1 protein content in either group byÈ70%, whereas MCT4 content was constant between thepretest and the posttest. Our current findings are consis-tent with earlier studies showing training readily to increasemuscle MCT1 content. However, equivocal findings havebeen reported with regard to the effects of training on MCT4with some studies showing no change (4,24) versus others
reporting a slight increase (5,25) after a short period of high-intensity training. However, the role of MCT1 in musclelactate metabolism is probably more important than the roleof MCT4 because MCT1 protein abundance, but not MCT4expression, is inversely related to rate of fatigue develop-ment in short maximal exercise (32). Furthermore, MCT1also plays an important role in lactate import and oxidationin mitochondria (12). However, in the current study, we didnot separate the mitochondrial from the sarcolemmal MCT1fraction.
An important aim of the present study was to evaluatewhether SIT in hypoxia would be more successful than SITin normoxia to boost endurance exercise performance. Weevaluated endurance performance using a 10-min simulatedcycling time trial. However, irrespective of whether SITsessions were performed in normoxia or hypoxia, the train-ing intervention improved performance by approximately6%–8%, both in the time trial in normoxia and in hypoxia.Exercise intensity in a time trial as short as 10 min is veryclose to VO2 max and involves a substantial energy contri-bution from glycolysis as evidenced by blood lactate levelshigher than 10 mmolILj1 postexercise. The similar perfor-mance improvement in HYP and NOR is compatible withsimilar elevation of VO2max posttraining, even against theface of higher LT4 in the former. In fact, the minor incre-ment of LT4 in HYP conceivably was too small to translateinto improved performance in a 10-min time trial. Further-more, it is also important to point out that time trials wereperformed immediately after the incremental VO2max tests,which conceivably may have impacted performance andvariation between subjects due to combination of physio-logical and mental fatigue. Still, it is reasonable to postulatethat the elevated glycolytic capacity (ÈPFK activity) foundin muscles in HYP should have resulted in better time trialperformance due to higher anaerobic capacity. Contrary to
TABLE 3. Effects of SIT during the incremental exercise tests in normoxia and hypoxia.
CON NOR HYP
Pretest Posttest Pretest Posttest Pretest Posttest
LT4 (W)MAXnor 228 T 13 225 T 12 219 T 16 220 T 13 206 T 9 221 T 5*,**MAXhyp 193 T 7 190 T 10 173 T 11 180 T 12 173 T 8 189 T 6*,**
Time to exhaustion (min)MAXnor 25.4 T 1.4 25.0 T 1.4 24.4 T 1.2 25.1 T 0.9** 24.0 T 0.8 25.2 T 0.6*,**MAXhyp 21.6 T 1.1 21.9 T 1.4 20.2 T 0.7 21.4 T 0.7* 20.1 T 0.5 21.7 T 0.6*,**
Peak VO2 (mLIminj1Ikgj1)MAXnor 54.8 T 2.3 54.1 T 1.7 56.8 T 3 60.1 T 2.6* 55.1 T 1.7 59.2 T 2.2*,**MAXhyp 48.7 T 1.9 45.5 T 1.9* 50.9 T 2.8 49.8 T 2.8** 48.5 T 1.6 48.3 T 1.7**Peak heart rate (beats minj1)
MAXnor 186 T 2.5 186 T 2.1 190 T 3.5 192 T 3.07 192 T 3.3 192 T 3.1MAXhyp 181 T 2.3 180 T 2.2 186 T 2.9 187 T 3.0 186 T3.8 187 T 2.9
Peak blood lactate (mmolILj1)MAXnor 12.6 T 0.7 12.7 T 0.8 12.6 T 0.7 13.6 T 0.9 13.3 T 0.4 14.6 T 0.8MAXhyp 12.5 T 0.8 13.5 T 0.9 12.9 T 0.8 14.3 T 0.9 13.2 T 0.5 14.4 T 0.5
Peak RERMAXnor 1.01 T 0.02 1.01 T 0.03 1.07 T 0.03 1.03 T 0.02 1.09 T 0.03 1.06 T 0.03MAXhyp 1.02 T 0.04 1.01 T 0.01 1.01 T 0.02 1.02 T 0.02 1.02 T 0.02 1.01 T 0.01
Values are presented as mean T SEM before (pretest) and after (posttest) the intervention period. Subjects were enrolled in a 6-wk training period involving 30-s intermittent sprints ineither normoxia (NOR, n = 9; FiO2, 20.9%) or hypoxia (HYP, n = 10; FiO2, 14.5%). The control group (CON, n = 10) did not train. In both the pretest and the posttest, the subjects performed amaximal incremental exercise test in normoxia MAXnor) and in hypoxia (MAXhyp) with an interval of 2 d.*P G 0.05 versus pretest.**P G 0.05 versus CON.LT4, 4-mmol lactate threshold.
http://www.acsm-msse.org2172 Official Journal of the American College of Sports Medicine
APP
LIED
SCIENCES
Copyright © 2013 by the American College of Sports Medicine. Unauthorized reproduction of this article is prohibited.
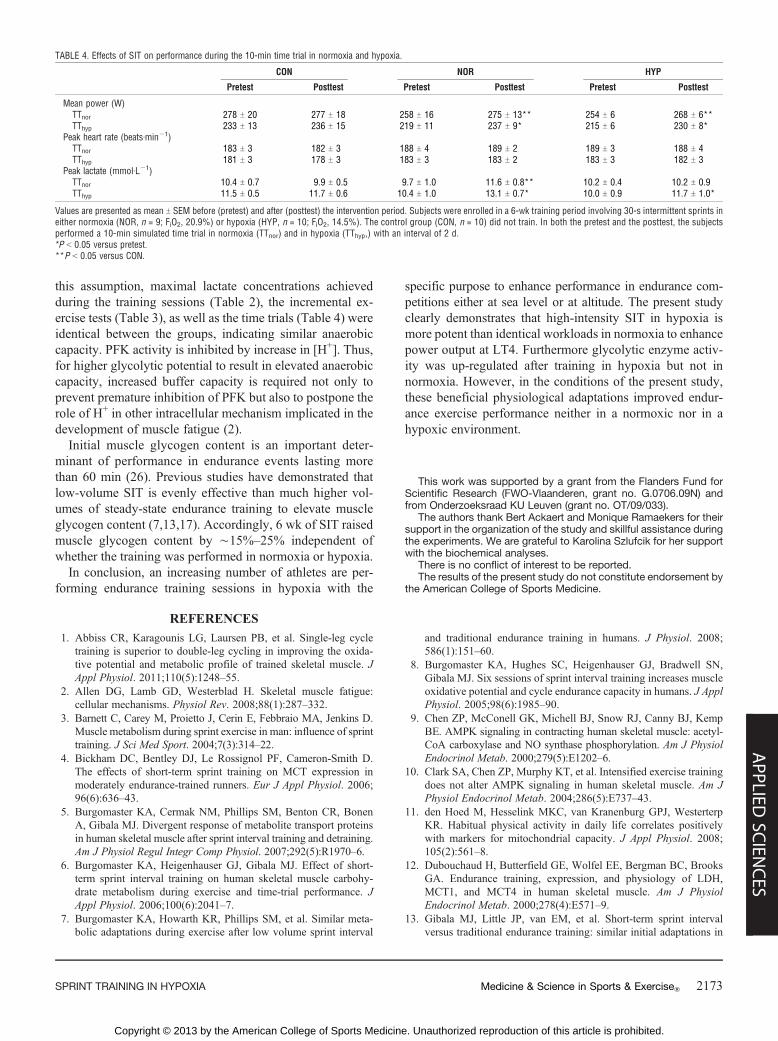
this assumption, maximal lactate concentrations achievedduring the training sessions (Table 2), the incremental ex-ercise tests (Table 3), as well as the time trials (Table 4) wereidentical between the groups, indicating similar anaerobiccapacity. PFK activity is inhibited by increase in [H+]. Thus,for higher glycolytic potential to result in elevated anaerobiccapacity, increased buffer capacity is required not only toprevent premature inhibition of PFK but also to postpone therole of H+ in other intracellular mechanism implicated in thedevelopment of muscle fatigue (2).
Initial muscle glycogen content is an important deter-minant of performance in endurance events lasting morethan 60 min (26). Previous studies have demonstrated thatlow-volume SIT is evenly effective than much higher vol-umes of steady-state endurance training to elevate muscleglycogen content (7,13,17). Accordingly, 6 wk of SIT raisedmuscle glycogen content by È15%–25% independent ofwhether the training was performed in normoxia or hypoxia.
In conclusion, an increasing number of athletes are per-forming endurance training sessions in hypoxia with the
specific purpose to enhance performance in endurance com-petitions either at sea level or at altitude. The present studyclearly demonstrates that high-intensity SIT in hypoxia ismore potent than identical workloads in normoxia to enhancepower output at LT4. Furthermore glycolytic enzyme activ-ity was up-regulated after training in hypoxia but not innormoxia. However, in the conditions of the present study,these beneficial physiological adaptations improved endur-ance exercise performance neither in a normoxic nor in ahypoxic environment.
This work was supported by a grant from the Flanders Fund forScientific Research (FWO-Vlaanderen, grant no. G.0706.09N) andfrom Onderzoeksraad KU Leuven (grant no. OT/09/033).
The authors thank Bert Ackaert and Monique Ramaekers for theirsupport in the organization of the study and skillful assistance duringthe experiments. We are grateful to Karolina Szlufcik for her supportwith the biochemical analyses.
There is no conflict of interest to be reported.The results of the present study do not constitute endorsement by
the American College of Sports Medicine.
REFERENCES
1. Abbiss CR, Karagounis LG, Laursen PB, et al. Single-leg cycletraining is superior to double-leg cycling in improving the oxida-tive potential and metabolic profile of trained skeletal muscle. JAppl Physiol. 2011;110(5):1248–55.
2. Allen DG, Lamb GD, Westerblad H. Skeletal muscle fatigue:cellular mechanisms. Physiol Rev. 2008;88(1):287–332.
3. Barnett C, Carey M, Proietto J, Cerin E, Febbraio MA, Jenkins D.Muscle metabolism during sprint exercise in man: influence of sprinttraining. J Sci Med Sport. 2004;7(3):314–22.
4. Bickham DC, Bentley DJ, Le Rossignol PF, Cameron-Smith D.The effects of short-term sprint training on MCT expression inmoderately endurance-trained runners. Eur J Appl Physiol. 2006;96(6):636–43.
5. Burgomaster KA, Cermak NM, Phillips SM, Benton CR, BonenA, Gibala MJ. Divergent response of metabolite transport proteinsin human skeletal muscle after sprint interval training and detraining.Am J Physiol Regul Integr Comp Physiol. 2007;292(5):R1970–6.
6. Burgomaster KA, Heigenhauser GJ, Gibala MJ. Effect of short-term sprint interval training on human skeletal muscle carbohy-drate metabolism during exercise and time-trial performance. JAppl Physiol. 2006;100(6):2041–7.
7. Burgomaster KA, Howarth KR, Phillips SM, et al. Similar meta-bolic adaptations during exercise after low volume sprint interval
and traditional endurance training in humans. J Physiol. 2008;586(1):151–60.
8. Burgomaster KA, Hughes SC, Heigenhauser GJ, Bradwell SN,Gibala MJ. Six sessions of sprint interval training increases muscleoxidative potential and cycle endurance capacity in humans. J ApplPhysiol. 2005;98(6):1985–90.
9. Chen ZP, McConell GK, Michell BJ, Snow RJ, Canny BJ, KempBE. AMPK signaling in contracting human skeletal muscle: acetyl-CoA carboxylase and NO synthase phosphorylation. Am J PhysiolEndocrinol Metab. 2000;279(5):E1202–6.
10. Clark SA, Chen ZP, Murphy KT, et al. Intensified exercise trainingdoes not alter AMPK signaling in human skeletal muscle. Am JPhysiol Endocrinol Metab. 2004;286(5):E737–43.
11. den Hoed M, Hesselink MKC, van Kranenburg GPJ, WesterterpKR. Habitual physical activity in daily life correlates positivelywith markers for mitochondrial capacity. J Appl Physiol. 2008;105(2):561–8.
12. Dubouchaud H, Butterfield GE, Wolfel EE, Bergman BC, BrooksGA. Endurance training, expression, and physiology of LDH,MCT1, and MCT4 in human skeletal muscle. Am J PhysiolEndocrinol Metab. 2000;278(4):E571–9.
13. Gibala MJ, Little JP, van EM, et al. Short-term sprint intervalversus traditional endurance training: similar initial adaptations in
TABLE 4. Effects of SIT on performance during the 10-min time trial in normoxia and hypoxia.
CON NOR HYP
Pretest Posttest Pretest Posttest Pretest Posttest
Mean power (W)TTnor 278 T 20 277 T 18 258 T 16 275 T 13** 254 T 6 268 T 6**TThyp 233 T 13 236 T 15 219 T 11 237 T 9* 215 T 6 230 T 8*
Peak heart rate (beatsIminj1)TTnor 183 T 3 182 T 3 188 T 4 189 T 2 189 T 3 188 T 4TThyp 181 T 3 178 T 3 183 T 3 183 T 2 183 T 3 182 T 3
Peak lactate (mmolILj1)TTnor 10.4 T 0.7 9.9 T 0.5 9.7 T 1.0 11.6 T 0.8** 10.2 T 0.4 10.2 T 0.9TThyp 11.5 T 0.5 11.7 T 0.6 10.4 T 1.0 13.1 T 0.7* 10.0 T 0.9 11.7 T 1.0*
Values are presented as mean T SEM before (pretest) and after (posttest) the intervention period. Subjects were enrolled in a 6-wk training period involving 30-s intermittent sprints ineither normoxia (NOR, n = 9; FiO2, 20.9%) or hypoxia (HYP, n = 10; FiO2, 14.5%). The control group (CON, n = 10) did not train. In both the pretest and the posttest, the subjectsperformed a 10-min simulated time trial in normoxia (TTnor) and in hypoxia (TThyp,) with an interval of 2 d.*P G 0.05 versus pretest.**P G 0.05 versus CON.
SPRINT TRAINING IN HYPOXIA Medicine & Science in Sports & Exercised 2173
APPLIED
SCIEN
CES
Copyright © 2013 by the American College of Sports Medicine. Unauthorized reproduction of this article is prohibited.

human skeletal muscle and exercise performance. J Physiol. 2006;575(Pt 3):901–11.
14. Gibala MJ, McGee SL, Garnham AP, Howlett KF, Snow RJ,Hargreaves M. Brief intense interval exercise activates AMPK andp38 MAPK signaling and increases the expression of PGC-1alphain human skeletal muscle. J Appl Physiol. 2009;106(3):929–34.
15. Gladden LB. Lactate metabolism: a new paradigm for the thirdmillennium. J Physiol. 2004;558(Pt 1):5–30.
16. Jacobs I, Esbjornsson M, Sylven C, Holm I, Jansson E. Sprinttraining effects on muscle myoglobin, enzymes, fiber types, andblood lactate. Med Sci Sports Exerc. 1987;19(4):368–74.
17. Laursen PB, Jenkins DG. The scientific basis for high-intensityinterval training: optimising training programmes and maximisingperformance in highly trained endurance athletes. Sports Med.2002;32(1):53–73.
18. Little JP, Safdar A, Bishop D, Tarnopolsky MA, Gibala MJ. Anacute bout of high-intensity interval training increases the nuclearabundance of PGC-1alpha and activates mitochondrial biogenesisin human skeletal muscle. Am J Physiol Regul Integr Comp Physiol.2011;300(6):R1303–10.
19. Lowry OH, Passoneau JV. A Flexible System of Enzymatic Analysis.New York: Academic Press, 1972.
20. MacDougall JD, Hicks AL, MacDonald JR, McKelvie RS, GreenHJ, Smith KM. Muscle performance and enzymatic adaptations tosprint interval training. J Appl Physiol. 1998;84(6):2138–42.
21. Macpherson RE, Hazell TJ, Olver TD, Paterson DH, Lemon PW.Run sprint interval training improves aerobic performance but notmaximal cardiac output. Med Sci Sports Exerc. 2011;43(1):115–22.
22. Melissa L, MacDougall JD, Tarnopolsky MA, Cipriano N, GreenHJ. Skeletal muscle adaptations to training under normobarichypoxic versus normoxic conditions. Med Sci Sports Exerc. 1997;29(2):238–43.
23. Millet GP, Roels B, Schmitt L, Woorons X, Richalet JP. Com-bining hypoxic methods for peak performance. Sports Med. 2010;40(1):1–25.
24. Mohr M, Krustrup P, Nielsen JJ, et al. Effect of two different intensetraining regimens on skeletal muscle ion transport proteins and fa-tigue development. Am J Physiol Regul Integr Comp Physiol. 2007;292(4):R1594–602.
25. Perry CG, Heigenhauser GJ, Bonen A, Spriet LL. High-intensityaerobic interval training increases fat and carbohydrate metaboliccapacities in human skeletal muscle. Appl Physiol Nutr Metab.2008;33(6):1112–23.
26. Philp A, Hargreaves M, Baar K. More than a store: regulatory rolesfor glycogen in skeletal muscle adaptation to exercise. Am J PhysiolEndocrinol Metab. 2012;302(11):E1343–51.
27. Richter EA, Ruderman NB. AMPK and the biochemistry of ex-ercise: implications for human health and disease. Biochem J.2009;418(2):261–75.
28. Saltin B, Nazar K, Costill DL, et al. The nature of the training re-sponse; peripheral and central adaptations of one-legged exercise.Acta Physiol Scand. 1976;96(3):289–305.
29. Schmutz S, Dapp C, Wittwer M, et al. A hypoxia complement dif-ferentiates the muscle response to endurance exercise. Exp Physiol.2010;95(6):723–35.
30. Smith KJ, Billaut F. Influence of cerebral and muscle oxygena-tion on repeated-sprint ability. Eur J Appl Physiol. 2010;109(5):989–99.
31. Spriet LL, Lindinger MI, McKelvie RS, Heigenhauser GJ, JonesNL. Muscle glycogenolysis and H+ concentration during maximalintermittent cycling. J Appl Physiol. 1989;66(1):8–13.
32. Thomas C, Perrey S, Lambert K, Hugon G, Mornet D, Mercier J.Monocarboxylate transporters, blood lactate removal after supra-maximal exercise, and fatigue indexes in humans. J Appl Physiol.2005;98(3):804–9.
33. Van Proeyen K, De Bock K, Hespel P. Training in the fasted statefacilitates re-activation of eEF2 activity during recovery from en-durance exercise. Eur J Appl Physiol. 2011;111(7):1297–305.
34. Van Proeyen K, Szlufcik K, Nielens H, Ramaekers M, Hespel P.Beneficial metabolic adaptations due to endurance exercise train-ing in the fasted state. J Appl Physiol. 2011;110(1):236–45.
35. Vogt M, Puntschart A, Geiser J, Zuleger C, Billeter R, Hoppeler H.Molecular adaptations in human skeletal muscle to endurance train-ing under simulated hypoxic conditions. J Appl Physiol. 2001;91(1):173–82.
36. Wehrlin JP, Hallen J. Linear decrease in VO2max and performancewith increasing altitude in endurance athletes. Eur J Appl Physiol.2006;96(4):404–12.
37. Wenger RH. Cellular adaptation to hypoxia: O2-sensing proteinhydroxylases, hypoxia-inducible transcription factors, and O2-regulated gene expression. FASEB J. 2002;16(10):1151–62.
38. Weyand PG, Lee CS, Martinez-Ruiz R, Bundle MW, Bellizzi MJ,Wright S. High-speed running performance is largely unaffectedby hypoxic reductions in aerobic power. J Appl Physiol. 1999;86(6):2059–64.
39. Yeo WK, Paton CD, Garnham AP, Burke LM, Carey AL, HawleyJA. Skeletal muscle adaptation and performance responses to oncea day versus twice every second day endurance training regimens.J Appl Physiol. 2008;105(5):1462–70.
40. Zoll J, Ponsot E, Dufour S, et al. Exercise training in normobarichypoxia in endurance runners. III. Muscular adjustments of selectedgene transcripts. J Appl Physiol. 2006;100(4):1258–66.
http://www.acsm-msse.org2174 Official Journal of the American College of Sports Medicine
APP
LIED
SCIENCES
Copyright © 2013 by the American College of Sports Medicine. Unauthorized reproduction of this article is prohibited.