srp690 the future of conservation reserve program land in ...€¦ · the future of conservation...
TRANSCRIPT
THE FUTURE OFCONSERVATION RESERVE
PROGRAM LANDIN KANSAS:
THE LANDOWNER’S VIEW
Report of Progress 690Agricultural Experiment Station
Kansas State University, ManhattanMarc A. Johnson, Director

THE FUTURE OF CONSERVATION RESERVE PROGRAMLAND IN KANSAS:
THE LANDOWNER’S VIEW1
Penelope L. Diebel, Ted T. Cable, and Philip S. Cook2
ABSTRACT
Nearly three million acres of Kansas cropland were idled in the first nine sign-ups ofthe Conservation Reserve Program’s (CRP). Kansas CRP land enrollment is the largest ofthe Central Great Plains states (Colorado, Kansas, Nebraska, Oklahoma, and Wyoming).These five states contain almost one-fourth of the total national acres enrolled in CRP.Therefore, a study of Kansas CRP landowners is paramount to determining the future use ofCRP lands when contracts expire. The fate of CRP lands could have tremendous impacts onthe agricultural sector, wildlife habitat, recreation, and rural communities. A statewiderandom sample of 3,000 CRP contracts, approximately 10% of total Kansas contracts, wasselected from the Agricultural Stabilization and Conservation Services CRP database. Byusing the contract as the unit of analysis, a drawing was made from a population of knownsize and could be aligned with additional data bases (soil types, exact acreage, previous uses,productivity, etc.) concerning the particular tract of land. Over 70 percent of the surveyrespondents were both owners and operators of land under CRP contract. Their average agewas 58.6 years. A majority (85.1 percent) was satisfied with the CRP program; 88.8 and84.5 percent would continue in the CRP program for 5 or 10 years, respectively. Thelargest percentage of respondents removed their CRP lands from wheat (81.2) and sorghum(57.3) production. Most of these lands were in western Kansas. A majority of producersranked soil erosion as an important influence on their initial enrollment. Wildlife habitat wasa consideration in choosing farming practices (67.7 percent). However, 57.6 percent saidincreases in wildlife populations on CRP lands were undesirable. Hunting was the mostfrequent form of recreation allowed on CRP land (76.4). Little other recreation wasallowed. More respondents planned to keep CRP land in forage production for livestockthan to return it to crop production; over a third were undecided. Market prices for crops,forage, and livestock were the key factors in the decision about future use of CRP land.
1Contribution no. 94-45-S from the Kansas Agricultural Experiment Station.
2Assistant Professor, Department of Agricultural Economics, Associate Professor andResearch Assistant, Department of Horticulture, Forestry, and Recreation Resources, KansasState University, Manhattan, KS 66506-4011.
i

CONTENTS
Introduction . . . . . . . . . . . . . . . . . . . ... . . . . . . . . . . . . . . . . . . . . . . . . . . . . . . . . . . . . . . . . . 1
Methods and Survey Design . . . . . . . . . . . . . . . . . . . . . . . . . . . . . . . . . . . . . . 3
Results . . . . . . . . . . . . . . . . . . . . . . . . . . . . . . . . . . . . . . . . . . . . . . . . . . . . . . 3
Summary and Conclusions . . . . . . . . . . . . . . . . . . . . . . . . . . . . . . . . . .. . . . . 10
Sources Cited . . . . . . . . . . . . . . . . . . . . . . . . . . . . . . . . . . . . . . . . . . . . . . . . . . . . . . . . . . . 11
Figures . . . . . . . . . . . . . . . . . . . . . . . . . . . . . . . . . . . . . . . . . . . . . . . . . . . . . . . . . . . . . . 12
Tables . . . . . . . . . . . . . . . . . . . . . . . . . . . . . . . . . . . . . . . . . . . . . . . . . . . . . . . . . . . . . . . . . .. . 20
Appendix (Questionnaire) . . . . . . . . . . . . . . . . . . . . . . . . . . . . . . . . . . . . . . . . . . . . . . 48
ACKNOWLEDGEMENTS
The authors would like to thank the following people andcontributions to this project: the Kansas Department of WildlifeUniversity of Missouri, Columbia, for financial support; Paul Ohlenbusch and Charles Lee
organizations for theirand Parks and the
for questionnaire review; Roger Lemmons and all county ASCS offices forparticipants’ addresses; Jong-I Perng for data retrieval; and Zerihun Alem,Edwards Grund, Celinda Chandler, and Greg Schumaker for data entry.
providing CRPChrysanne
ii
INTRODUCTION
Before a new farm program is delivered in 1995, many agricultural conservation andenvironmental issues will be debated. One of the most critical issues will be the expirationof Conservation Reserve Program (CRP) contacts. Farmers, cattleman, other agriculturalgroups, and conservation and environmental organizations are concerned about the impact ofthis released land on cattle and grain prices and on the environmental benefits accrued duringthe contract life. The issue of CRP land is of great importance to Kansas and other CentralGreat Plains states (Colorado, Nebraska, Oklahoma, and Wyoming), because nearly one-fourth of the total national CRP acres is in this area. Kansas’ total enrollment ranks amongthe top five in the nation.
Conservation Reserve Program
Congress established the CRP in Title XII of the Food Security Act of 1985 as avoluntary, long-term, cropland retirement program to be administered by the U.S.Department of Agriculture (USDA). The USDA provides CRP participants with an annualper acre rent and half the cost of establishing a permanent cover (grass or trees) in exchangefor retiring highly erodible or environmentally sensitive cropland for 10 years. Theenrollment target was 40-45 million acres by the end of the 1990 crop year. The primarygoal of the original CRP program was to reduce soil erosion on cropland. Secondaryobjectives included protecting the capability of long-run food and fiber production, curbingsurplus production, supporting income, and improving environmental quality (water andwildlife habitat).
During each of the nine sign-up periods, producers proposed which fields to take outof production and annual rental payments (bids) and estimated the commodity crop basereduction. Crop base was reduced by the proportion of the farm’s total cropland enrolled inCRP. After all bids were received, a maximum acceptable rental rate for multicountyregions (pools) was determined. In general, all bids not exceeding the maximum bid foreach pool were accepted. The eligibility criteria were changed several times during the1986-1990 period. Most of the changes affected the method of measuring the annual erosionand the minimum level of erosion necessary to enroll land.
The CRP program was extended under the Food, Agriculture, Conservation, andTrade Act (FACTA) of 1990 and revised again. The major revisions were to combine theCRP program with the Wetlands Reserve Program (WRP), a change in the bidding process,and additional incentives to promote tree planting on CRP lands in conservation priorityareas. FACTA mandated an enrollment of 40-45 million acres by 1995, including the 33.9million acres enrolled in the previous CRP program. Another three sign-ups have beenconducted. The tenth and eleventh were held in 1991, and the twelfth was in 1992. Nosign-ups were held in 1990.
1
The future of the CRP program under a new farm bill in 1995 is unknown.However, given the current government efforts to reduce the federal budget deficit, theextension of current CRP contracts and of the CRP program as it now exists seems unlikely.Options that are currently being discussed are extension of contracts on particularly sensitivesoils, federal government purchase of permanent easements on selected lands, and theextension of the entire program under a reduced set of benefits to producers. Another optionbeing considered by several states is the establishment of smaller CRP programs funded byvarious agencies at the state level.
Kansas and the CRP
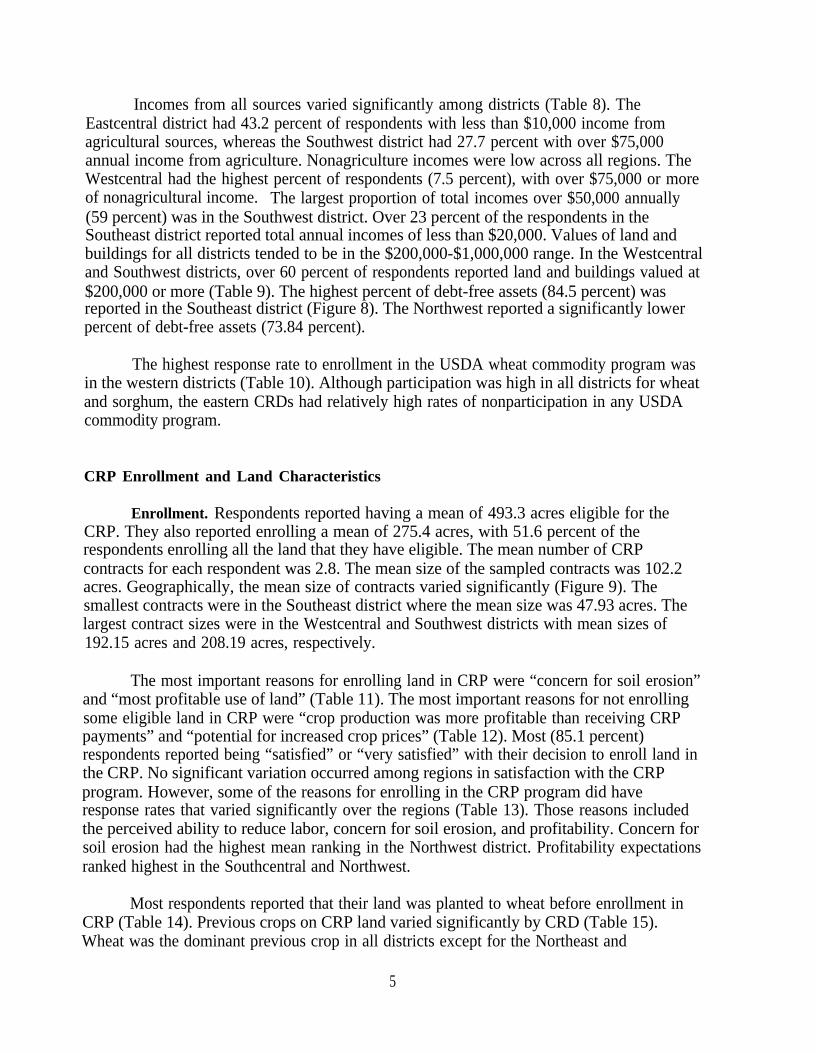
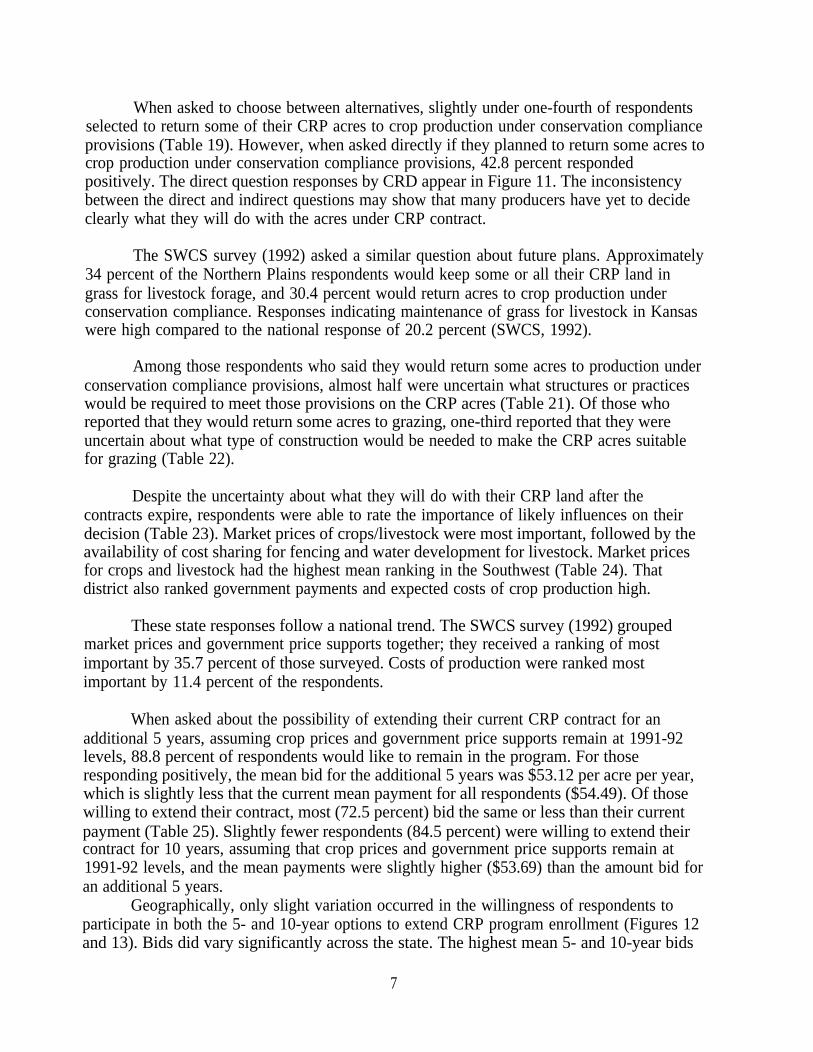
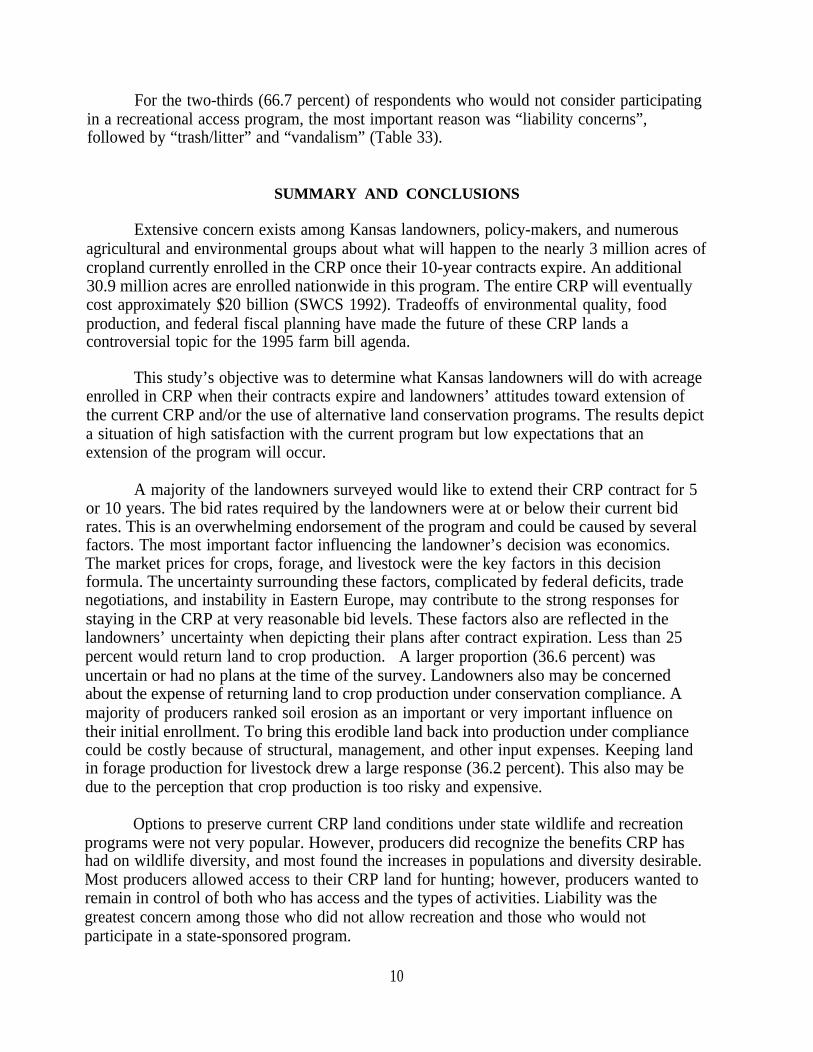
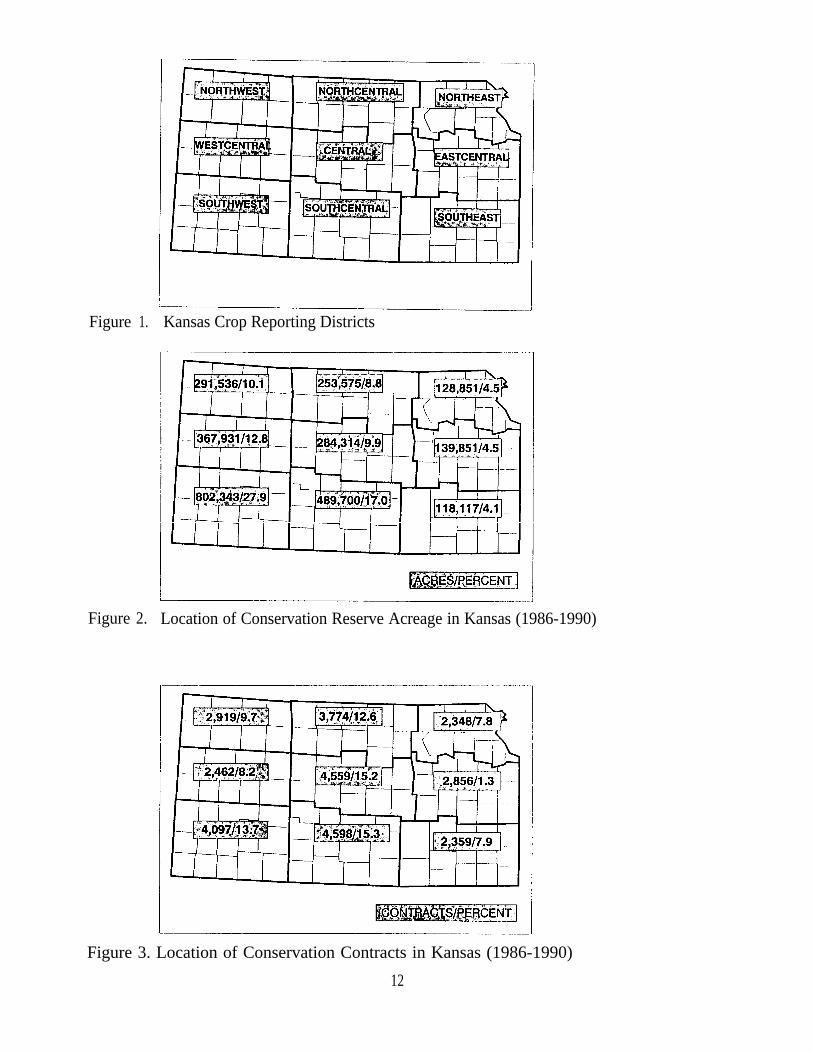
The future of the CRP program will be critical to agricultural producers andcommunities, as well as environmental groups, in Kansas. Over 2.8 million acres of Kansascropland were idled in the first nine CRP sign-ups (1986-1990). This represents 9.9 percentof Kansas’ tillable cropland. Over 60 percent of these acres are situated in western Kansas(west of a line north and south at Russell). Geographical dispersion of CRP variables in thisstudy was based on state Crop Reporting Districts (CRD), shown in Figure 1. Figures 2 and3 show the dispersion of CRP acreage and contracts within the state CRDs (1986-1990 sign-ups). The tenth, eleventh, and twelfth sign-ups added approximately another 83,000 acres.Kansas CRP enrollment is the largest of the Central Great Plains states.
The first of these 10-year contracts, a little over 100,000 acres, will expire inSeptember, 1995. The bulk of Kansas’ CRP acres will be released in 1996 and 1997.Approximately 1 million acres will become available for tillage in 1996; another 880,000acres will follow in 1997. Nationally, 13.67 million acres will be released in late 1996 andearly 1997. When these contracts expire, producers will face several options. If demand forU.S. wheat and feed grains is strong, most CRP land could return to crop production, withserious implications for soil erosion, water quality, and wildlife habitat. On the other hand,if the wheat and feed grain markets weaken, a smaller amount of CRP land would beexpected to return to crop production immediately. Many other unpredictable forces willenter into the contract holder’s decision: personal agendas, trade negotiations (such as GATTand NAFTA), former Soviet Union and Eastern Bloc purchase agreements, and changes inagricultural policy proposed by the current U.S. administration.
In order to address these issues, a survey of CRP contract holders in Kansas wasconducted. A statewide random sample of 3,000 CRP contracts, approximately 10 percent ofthe total state contracts, was selected from the Agricultural Stabilization and ConservationService (ASCS) database. The survey elicited potential producer action when CRP contractsexpire, willingness to participate in an extended CRP program, wildlife benefits accruingfrom CRP acres, and general socioeconomic characteristics of Kansas CRP contract holders.
2

METHODS AND SURVEY DESIGN
Dillman’s (1978) Total Design Method was used to implement a mail survey. Aquestionnaire and cover letter were mailed to each contract holder in November, 1992.Approximately 1 week later, a postcard reminder was sent. Two weeks after the postcardwas sent, another questionnaire was mailed to those who had not yet responded.
Of the 3,000 questionnaires sent out, 53 were undeliverable. Usable questionnaireswere returned by 2,146 respondents, giving a 72.8 percent response rate (adjusted forundeliverable). The survey sample of contracts was tested against the state contractpopulation for representativeness. The percent of surveyed contracts in each county was notsignificantly different than the actual population set using a Spearman Rank CorrelationCoefficient (0.9220, p< 0.001). The same statistical test indicated that the percent of surveycontracts in each type of CRP treatment activity in each population was not significantlydifferent than the true population (Spearman Rank Correlation Coefficient = 0.9503,p< 0.001). In addition, two-tail F- and t-tests showed insignificant differences between themean bids (F-test p< .961, t-test p<. 894) and the farm sizes (F-test p <.495, t-test p< .388)of the sample and state populations. The distributions of CRP contracts and acres within thesurvey sample are shown by CRDs in Figures 4 and 5, respectively.
The data contained in the questionnaires were coded into a computer data base usingdBASE III PLUS V1.1 (Ashton-Tate, 1986). Analyses of the data were done usingSPSS/PC + V3.1 (SPSS, 1989). The information collected was grouped into five areas.First, demographic information was solicited. General data on age, education, and assetswere gathered. Second, reasons for CRP enrollment or nonenrollment were surveyed.Third, potential future use of CRP land after contracts expire was examined. Fourth, viewsabout CRP’s influence on wildlife populations were sought. Finally, information about CRPand outdoor recreation was gathered. A copy of the complete questionnaire is the Appendix(pg. 48).
RESULTS
The following section presents a summary of the general results. For some questionsa breakdown of responses by location (CRD) is also provided. Note that responses may notappear in the same order as respective questions in the questionnaire. More detailedresponses are presented in Diebel and Cable (1993).
Who Are CRP Participants?
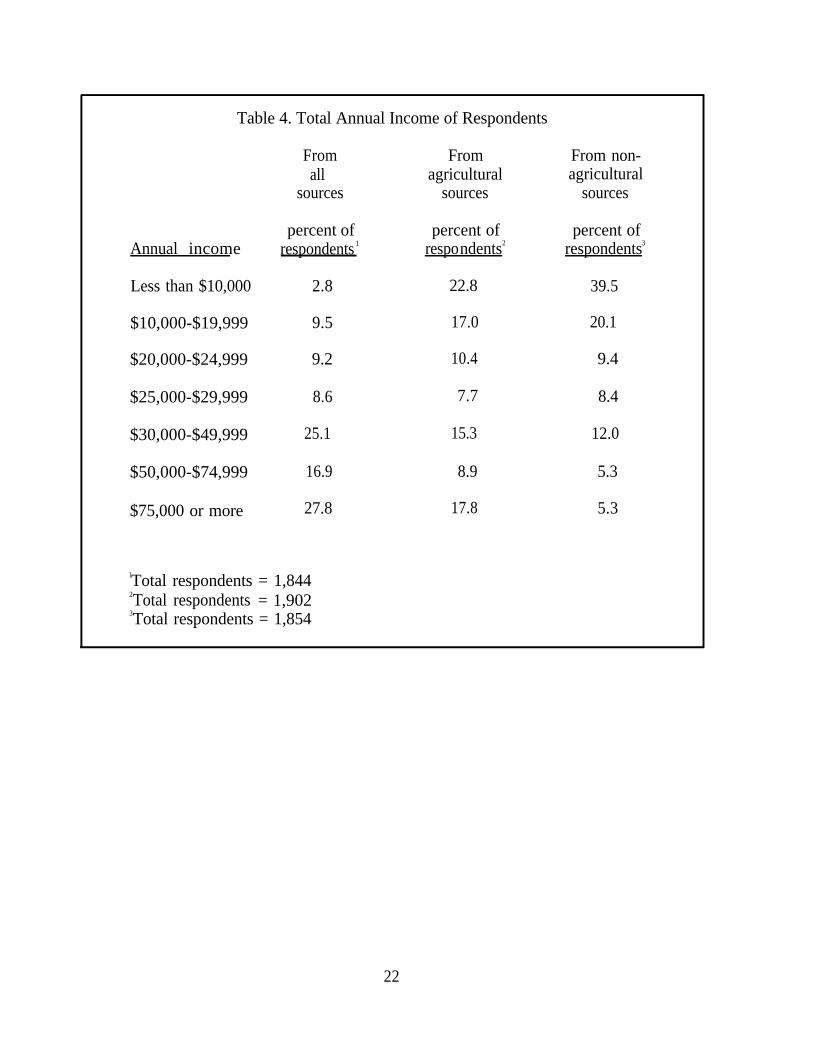
Kansas residents made up 94.4 percent of the respondents (the rest owned land inKansas but lived out of state), and the sample CRP contracts were spread throughout thestate (Table 1). Over 70 percent of the sample contract holders were both owner andoperator (Table 2). The 1987 Census of Agriculture found 43.7 percent of operators werefull owners in Kansas, and 59.3 percent at the national level (U.S. Department of
3
Commerce, 1989). A survey of CRP contract holders by the Soil and Water ConservationSociety (SWCS) also found that many (73 percent) contract holders were both owner andoperator (SWCS, 1992). The respondents managed a mean of 1,476.3 acres. Most (88.3percent) respondents were male, and their mean age was 58.6 years. Both of these statisticsare slightly higher than 1987 average state and national levels. Men accounted for 95.7percent of all farmers in Kansas and 93.7 percent nationally; the average age was 52 for thestate and nationwide (U.S. Dept. of Commerce, 1989). The average age of respondents inthe SWCS survey (1992) for the Northern Plains contract holders was approximately 55years.
One quarter of respondents had at least a bachelor’s degree or more education (Table3). The SWCS survey (1992) found that over half of the CRP contract holders nationwidehad “less than a high school degree” or “attained a high school diploma. ” Less than 20percent of the Northern Plains respondents had a college degree (SWCS, 1992).
Almost 70 percent of respondents had incomes over $30,000 annually (Table 4).Almost one-quarter (22. 8 percent) of the respondents made less than $10,000 annually fromagricultural sources, and 39.5 percent made less than $10,000 annually from nonagriculturalsources. According to the U.S. Department of Commerce (1989), 2.8 percent of all farms inKansas had net agricultural sales of less than $10,000. National off-farm income follows asimilar distribution, with 27 percent of farmers getting less than $10,000 annually from off-farm jobs (U.S. Dept. of Commerce, 1989).
Among the respondents 7.8 percent had farm land and buildings valued at more than$1,000,000 (Table 5), but only 0.8 percent had machinery and equipment valued at morethan $1,000,000 (Table 6). The mean percent of farm assets owned debt free was 79.4.These figures are fairly high compared to state and national statistics for all farms (U.S.Dept. of Commerce, 1989). The sampled contract holders had low debt and highly valuedland and buildings. Machinery values were low because of age and purchase of usedequipment. Only 4.4 percent of farms at the state level had land and buildings valued over$1,000,000, and 4.7 percent at the national level (U.S. Dept. of Commerce, 1989). Thedebt to asset ratio in 1987 was less than 10 percent for only 18.5 percent of farms in Kansasand 13.4 percent in the U.S. (U.S. Dept. of Commerce, 1990).
Most of the respondents (75.0 percent) were participating in the USDA commodityprogram for wheat (Table 7). Participation was also high (60.6 percent) in the sorghumprogram. Few respondents were growing other crops under federal commodity programprovisions.
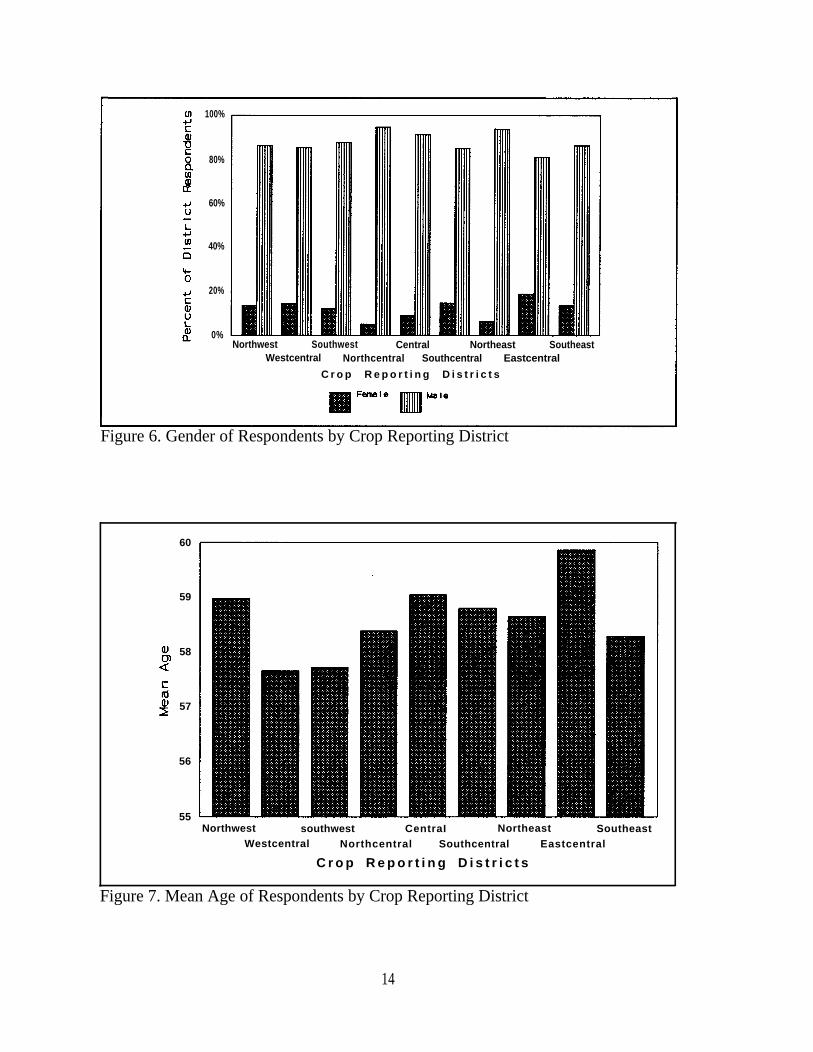
Significant differences occurred among CRDs for many characteristics of the CRPcontract holder. The characteristic with the least variation geographically was the gender ofrespondents (Figure 6). However, large differences occurred in mean age among locations(Figure 7). The Eastcentral district had the highest mean age of 59.9 years, and theWestcentral respondents were the youngest, with a mean age of 57.7 years.
4
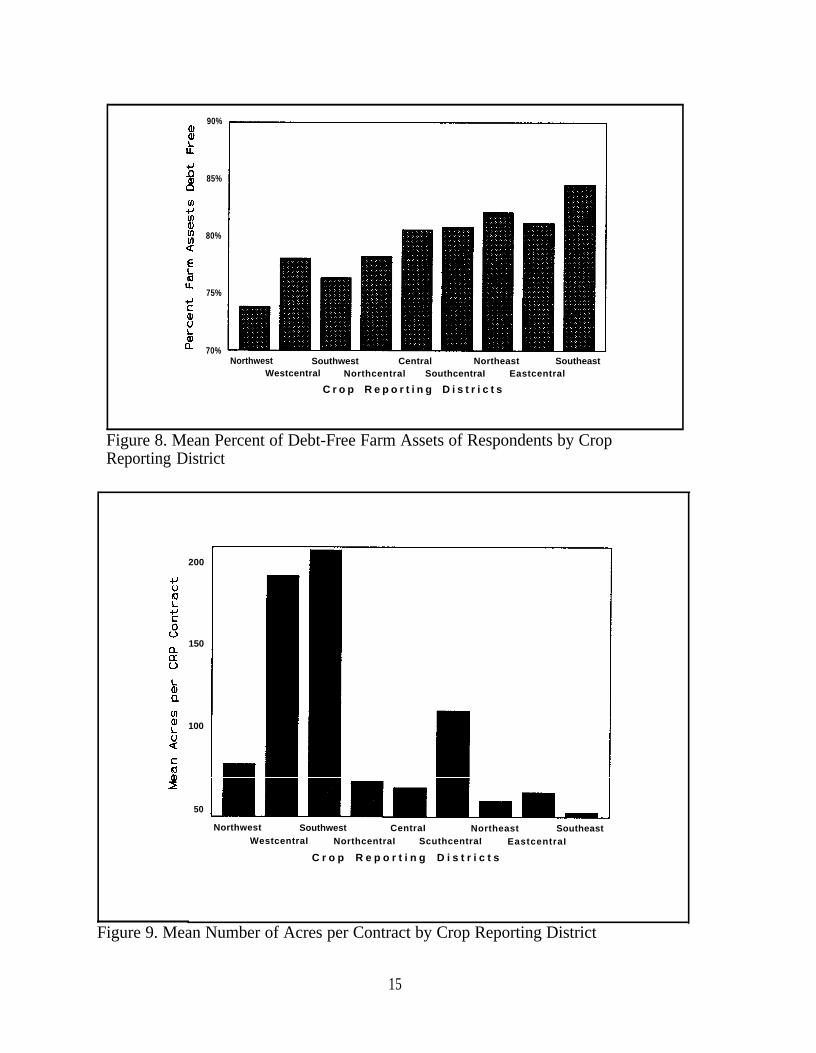
Incomes from all sources varied significantly among districts (Table 8). TheEastcentral district had 43.2 percent of respondents with less than $10,000 income fromagricultural sources, whereas the Southwest district had 27.7 percent with over $75,000annual income from agriculture. Nonagriculture incomes were low across all regions. TheWestcentral had the highest percent of respondents (7.5 percent), with over $75,000 or moreof nonagricultural income. The largest proportion of total incomes over $50,000 annually(59 percent) was in the Southwest district. Over 23 percent of the respondents in theSoutheast district reported total annual incomes of less than $20,000. Values of land andbuildings for all districts tended to be in the $200,000-$1,000,000 range. In the Westcentraland Southwest districts, over 60 percent of respondents reported land and buildings valued at$200,000 or more (Table 9). The highest percent of debt-free assets (84.5 percent) wasreported in the Southeast district (Figure 8). The Northwest reported a significantly lowerpercent of debt-free assets (73.84 percent).
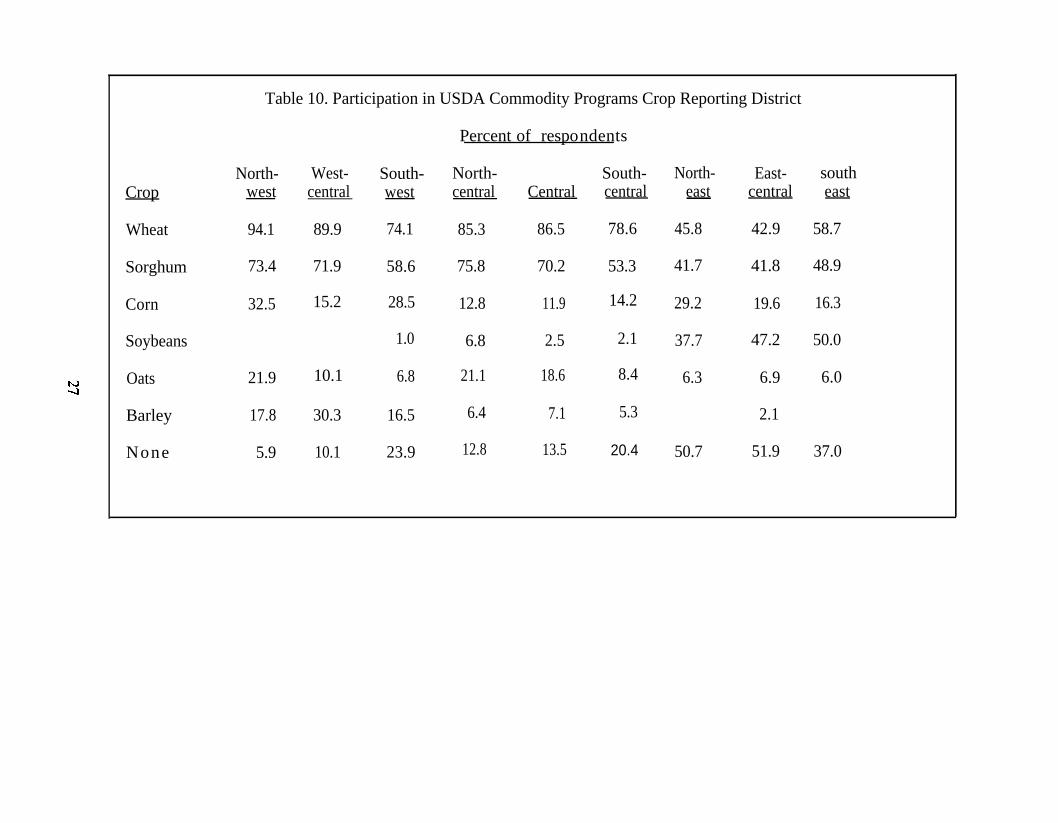
The highest response rate to enrollment in the USDA wheat commodity program wasin the western districts (Table 10). Although participation was high in all districts for wheatand sorghum, the eastern CRDs had relatively high rates of nonparticipation in any USDAcommodity program.
CRP Enrollment and Land Characteristics
Enrollment. Respondents reported having a mean of 493.3 acres eligible for theCRP. They also reported enrolling a mean of 275.4 acres, with 51.6 percent of therespondents enrolling all the land that they have eligible. The mean number of CRPcontracts for each respondent was 2.8. The mean size of the sampled contracts was 102.2acres. Geographically, the mean size of contracts varied significantly (Figure 9). Thesmallest contracts were in the Southeast district where the mean size was 47.93 acres. Thelargest contract sizes were in the Westcentral and Southwest districts with mean sizes of192.15 acres and 208.19 acres, respectively.
The most important reasons for enrolling land in CRP were “concern for soil erosion”and “most profitable use of land” (Table 11). The most important reasons for not enrollingsome eligible land in CRP were “crop production was more profitable than receiving CRPpayments” and “potential for increased crop prices” (Table 12). Most (85.1 percent)respondents reported being “satisfied” or “very satisfied” with their decision to enroll land inthe CRP. No significant variation occurred among regions in satisfaction with the CRPprogram. However, some of the reasons for enrolling in the CRP program did haveresponse rates that varied significantly over the regions (Table 13). Those reasons includedthe perceived ability to reduce labor, concern for soil erosion, and profitability. Concern forsoil erosion had the highest mean ranking in the Northwest district. Profitability expectationsranked highest in the Southcentral and Northwest.
Most respondents reported that their land was planted to wheat before enrollment inCRP (Table 14). Previous crops on CRP land varied significantly by CRD (Table 15).Wheat was the dominant previous crop in all districts except for the Northeast and
5

Eastcentral, where the dominant previous crop was sorghum. The percent of respondentsreporting wheat as the previous crop varied from 92.4 percent in the Southcentral district to54.4 percent in the Eastcentral district. Most of the land in the sampled contracts wasenrolled in CP-2, the native grass treatment (Table 16). The treatments, as classified byASCS, follow.
CP1:CP2:CP3:CP4:CP5:CP6:CP7:CP8:CP9:CP1O:CP1l:CP12:CP13:CP14:
Permanent introduced grasses and legumes.Permanent native grasses.Tree planting.Permanent wildlife habitat.Field windbreaks.Diversions, Type 1.Erosion control structuresGrass waterwaysShallow water areas for wildlife.Vegetative-cover, grass already established.Vegetative-cover, trees already established.Wildlife food plots.Filter strips.Wetland trees.
Management. Most respondents reported that some type of improvement existed ontheir CRP acres (Table 17). Approximately half of the respondents had existing terraces onthe CRP acres. Almost all CRP participants had done some type of active management ontheir CRP acres in the last 2-3 years, with mowing and weed control being the two mostcommon management activities (Table 18).
The Future of CRP Land
The picture of what will happen to CRP land after the contracts expire is somewhatcloudy. When asked to choose between various alternatives, slightly over one-third of therespondents revealed that they had made no plans or were uncertain about what they will dowith their CRP land after the contract expires (Table 19). The response rate to most of theseoptions varied significantly across the state (Table 20). Keeping CRP land in grass forlivestock was a highly selected option for all districts except Westcentral and Southwest. Inthe Westcentral district, responses “return to annual crop production” and “keep in grass forlivestock grazing” were selected equally (32 percent each). In the Southwest, respondentsfavored crop production (34. 1 percent), to livestock grazing (26.2 percent).
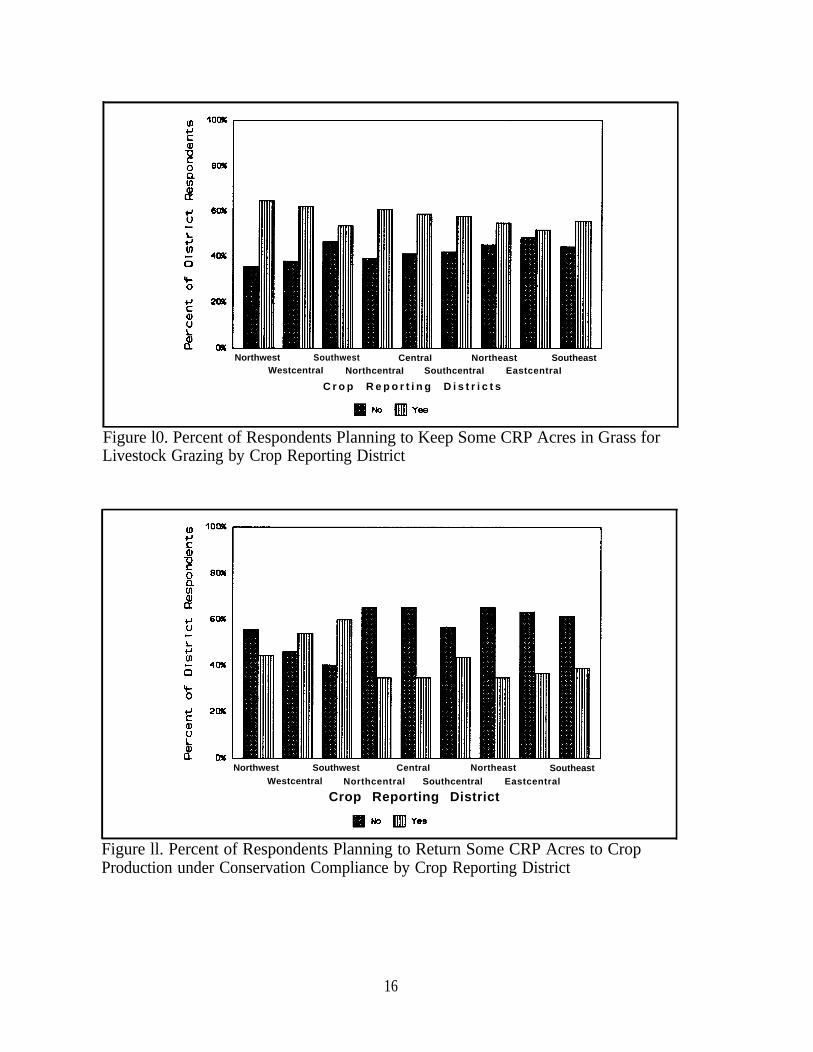
Approximately the same percentages of respondents chose to leave some land in grassfor livestock grazing and stated that they were uncertain of their plans. Yet, when askeddirectly if they planned to return some acres to livestock grazing, 57.7 percent respondedpositively. Little geographic variation occurred in the response to this question (Figure 10).Note that these questions refer to any or all acres on the contract number being surveyed.More than one possibility exists for each contract.
6
When asked to choose between alternatives, slightly under one-fourth of respondentsselected to return some of their CRP acres to crop production under conservation complianceprovisions (Table 19). However, when asked directly if they planned to return some acres tocrop production under conservation compliance provisions, 42.8 percent respondedpositively. The direct question responses by CRD appear in Figure 11. The inconsistencybetween the direct and indirect questions may show that many producers have yet to decideclearly what they will do with the acres under CRP contract.
The SWCS survey (1992) asked a similar question about future plans. Approximately34 percent of the Northern Plains respondents would keep some or all their CRP land ingrass for livestock forage, and 30.4 percent would return acres to crop production underconservation compliance. Responses indicating maintenance of grass for livestock in Kansaswere high compared to the national response of 20.2 percent (SWCS, 1992).
Among those respondents who said they would return some acres to production underconservation compliance provisions, almost half were uncertain what structures or practiceswould be required to meet those provisions on the CRP acres (Table 21). Of those whoreported that they would return some acres to grazing, one-third reported that they wereuncertain about what type of construction would be needed to make the CRP acres suitablefor grazing (Table 22).
Despite the uncertainty about what they will do with their CRP land after thecontracts expire, respondents were able to rate the importance of likely influences on theirdecision (Table 23). Market prices of crops/livestock were most important, followed by theavailability of cost sharing for fencing and water development for livestock. Market pricesfor crops and livestock had the highest mean ranking in the Southwest (Table 24). Thatdistrict also ranked government payments and expected costs of crop production high.
These state responses follow a national trend. The SWCS survey (1992) groupedmarket prices and government price supports together; they received a ranking of mostimportant by 35.7 percent of those surveyed. Costs of production were ranked mostimportant by 11.4 percent of the respondents.
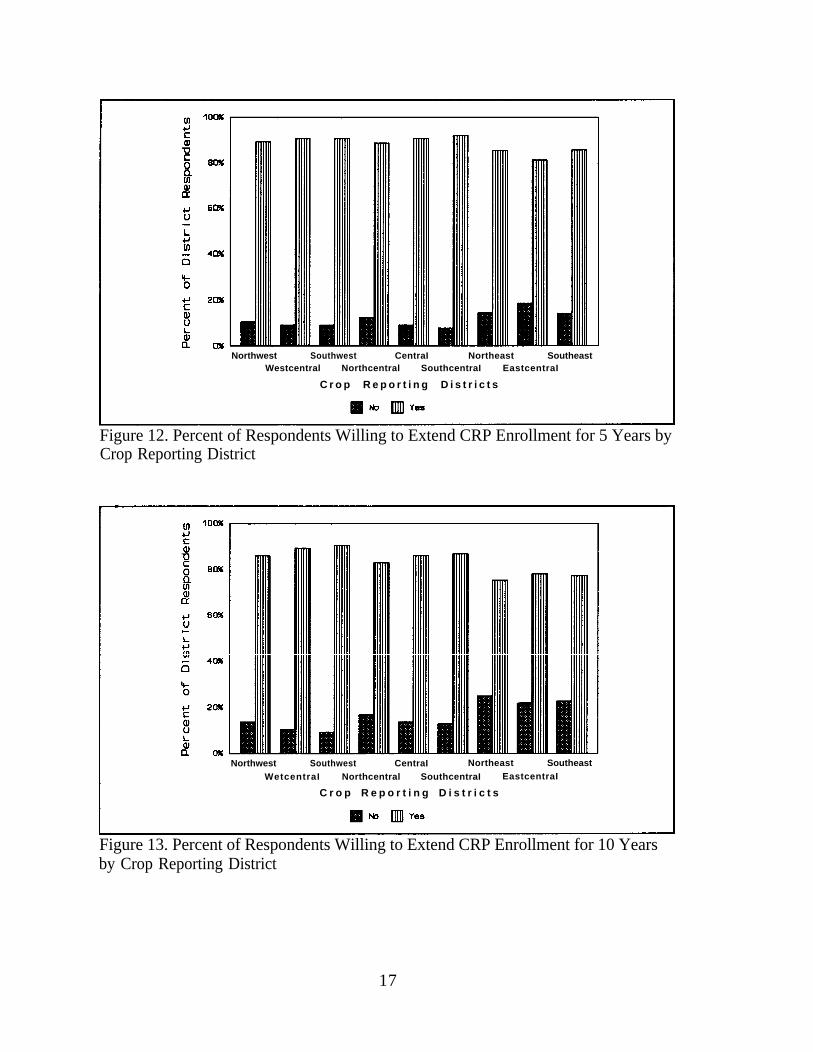
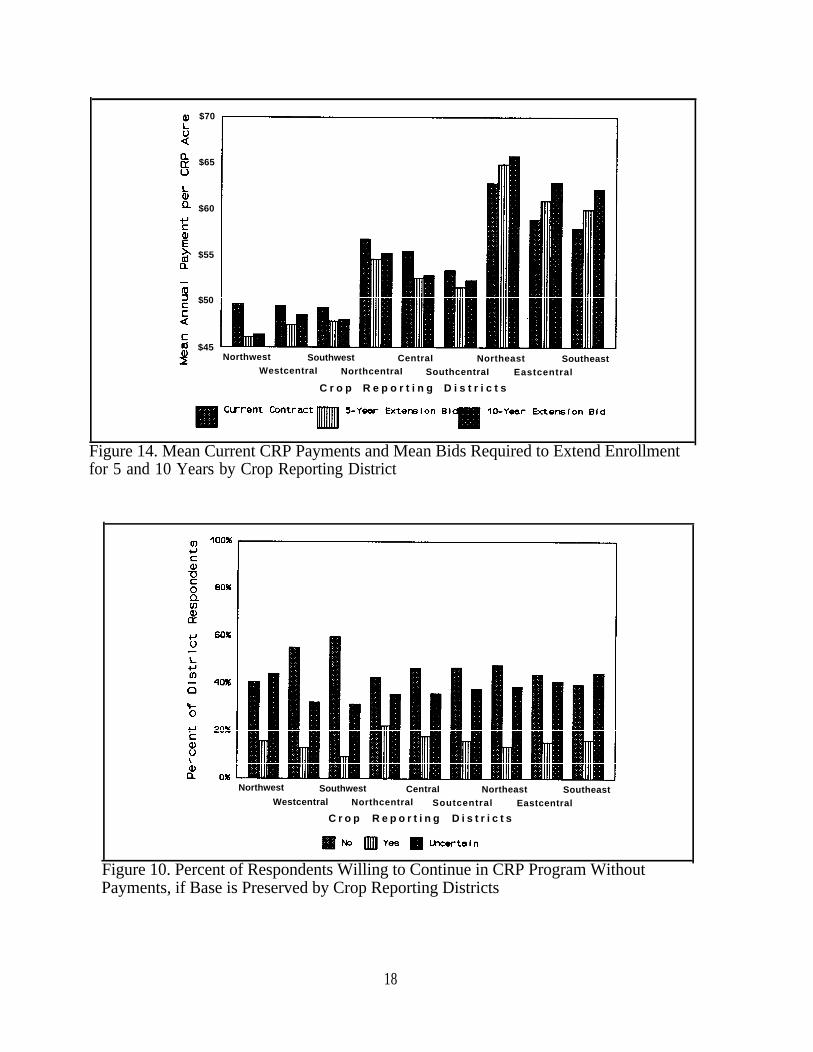
When asked about the possibility of extending their current CRP contract for anadditional 5 years, assuming crop prices and government price supports remain at 1991-92levels, 88.8 percent of respondents would like to remain in the program. For thoseresponding positively, the mean bid for the additional 5 years was $53.12 per acre per year,which is slightly less that the current mean payment for all respondents ($54.49). Of thosewilling to extend their contract, most (72.5 percent) bid the same or less than their currentpayment (Table 25). Slightly fewer respondents (84.5 percent) were willing to extend theircontract for 10 years, assuming that crop prices and government price supports remain at1991-92 levels, and the mean payments were slightly higher ($53.69) than the amount bid foran additional 5 years.
Geographically, only slight variation occurred in the willingness of respondents toparticipate in both the 5- and 10-year options to extend CRP program enrollment (Figures 12and 13). Bids did vary significantly across the state. The highest mean 5- and 10-year bids
7

were in the Northeast district ($64.90 and $65.79, respectively). These bids are above thecurrent mean payment of $62.87 in the Northeast. All three eastern districts had mean bidsfor both 5- and 10-year extensions that were higher than their current mean bids (Figure 14).
On a national level, the SWCS survey (1992) found that extending contracts foranother 5 years would cost an additional $9.79 per acre per year beyond the current rentalrate. This would result in a bid much higher than those reported in this survey. Accordingto SWCS (1992), a 10-year extension would cost an additional $15.17 per acre per year.Nationally, the lowest bid rates were found in the Southern Plains and the highest in theNortheast.
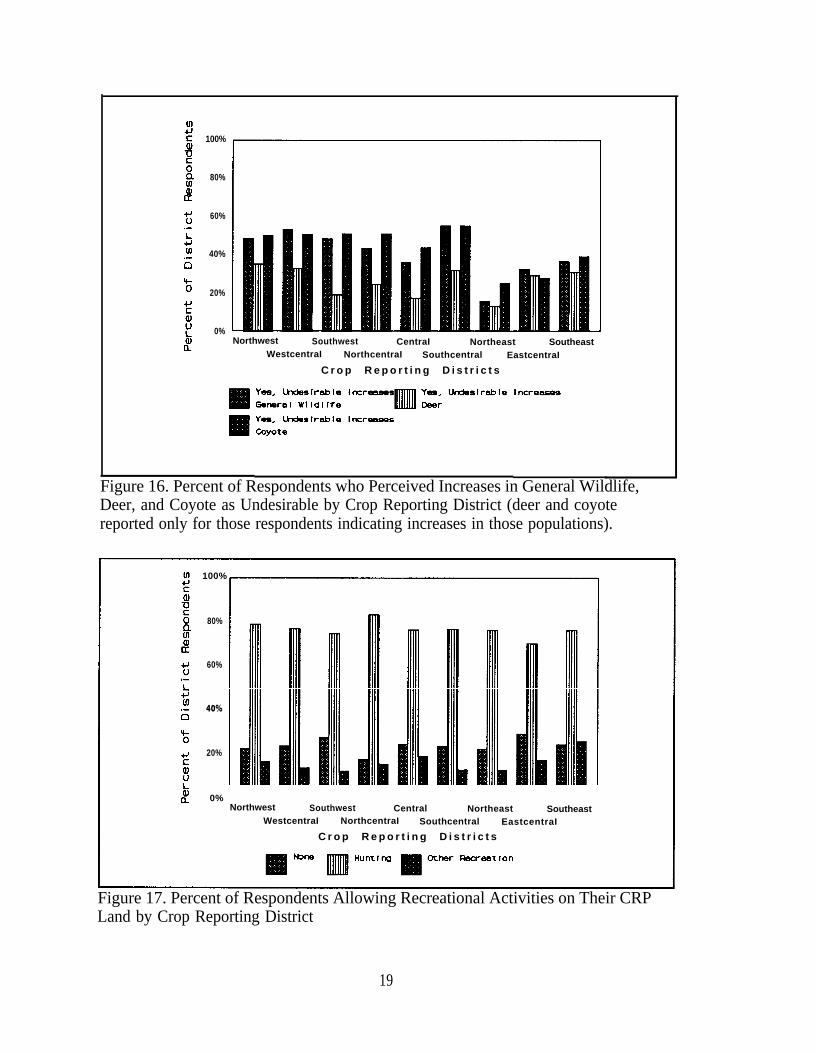
When asked if they were willing to leave their CRP acres in permanent cover afterthe contract expires, without an annual rental payment, provided that the acres continued tobe protected as commodity base acres and could be used for annual set-aside requirements,only 15.4 percent of respondents responded “yes”. Thirty-seven percent responded“uncertain”, and 47.6 percent responded “no”. Significant differences occurred in theresponse rates to this question among CRDs (Figure 15). The Southwest and Westcentralhad the strongest negative responses (59.7 and 55.1, respectively). The strongest positiveresponse (21.9 percent) was in the Northcentral district. Undecided responses were veryhigh, with the highest of 44.0 percent being in the Northwest.
When asked about extending their CRP contracts for 5 years subject to conditionsother than those currently allowed, the mean bids ranged from $37.31 per acre per year to$43.92 per acre per year depending on the condition (Table 26). However, the response rateto all conditions-was low.
CRP and Wildlife
Over two-thirds (67.7 percent) of respondents felt that wildlife is an importantconsideration in their choice of farming practices; however, only 24.0 percent were willingto change some of the current vegetative cover on their CRP acres to increase wildlife if 50percent cost-sharing funds were available. The remaining respondents were split evenlybetween “no” and “uncertain” (both 38.0 percent). No significant difference occurredamong districts of the state for either of these questions.
Almost two-thirds (64.7 percent) of the respondents “agreed” or “strongly agreed”that enrollment in CRP has increased the diversity of wildlife on their farm. Regardingindividual species, deer, pheasant, and quail were reported to have increased by over one-half of the respondents (Table 27). Increases in wildlife were considered undesirable by 42.4percent of respondents, with increases in coyote (58.2 percent of those respondents findingwildlife increases undesirable) and deer (44.0 percent) mentioned most often as undesirable.Of those respondents indicating an increase in deer specifically, only 25.8 percent found theincrease undesirable. However, of those that saw an increase in coyotes, 47.6 percent feltthat increase was undesirable.
8

The Northcentral, Central, and Northeast were the only CRDs that had less than a 70percent response rate for perceiving increases in deer population (Table 28). Pheasantincreases were reported by over 80 percent of respondents in all districts but the Eastcentraland Southeast. The population of quail was reported as increasing by over 70 percent ofrespondents in all but the three western districts. Coyote population increases were reportedmost often (70.3 percent) by respondents in the Southwest region of the state. The responsesto whether the general increases in wildlife were undesirable were significantly differentacross districts. Figure 16 shows the percentages of respondents finding the generalincreases undesirable and the percentages of respondents (who specifically listed increases indeer and coyotes) finding deer and coyote increases undesirable. Coyote increases wereoverwhelmingly undesirable in most regions.
The SWCS survey (1992) found half of the national respondents willing to plant adifferent vegetative cover on CRP acres to improve wildlife, if cost was shared. TheNortheast area of the U.S. was the most accepting of this proposal (66.7 percent); theNorthern plains was the least accepting (38.5 percent). However, this low positive responserate did not reflect outright rejection but the desire for more information (SWCS, 1992).
CRP and Recreation
Almost two-thirds of the respondents allowed friends and neighbors recreationalaccess to their CRP acres (Table 29). A mean of 13 friends and neighbors used the CRPacres each year. Over 40 percent of respondents allowed anyone who asks permissionrecreational access. Only 13.8 percent of respondents reported not allowing anyonerecreational access to their CRP acres.
Hunting was allowed on CRP land by over three-quarters of the respondents (Table30), and other types of recreation were allowed by 15.6 percent of respondents. The dataindicate that, although only 13.8 percent of respondents reported not allowing anyone accessto their CRP land for recreation, 23.5 percent reported not allowing any recreational activityon their land. Only the responses to “other recreation” varied significantly across districts.Figure 17 shows that the highest response to “other recreation” was in the Southeast (25.3percent).
Few respondents charged a fee for recreational access (Table 30). Of those whoallowed no one access and allowed no recreational activity, “liability concerns” was theirmost important reason (Table 31).
One-third (33.3 percent) of the respondents were interested in participating in a state-sponsored recreational access program. For those respondents who would considerparticipating, the most important feature of a program was the amount of the lease payment(Table 32). Respondents required a mean of $33.62 per acre per year to participate. Otherimportant attributes were the types of recreation allowed and “walk-in only/no vehicleaccess”.
9
For the two-thirds (66.7 percent) of respondents who would not consider participatingin a recreational access program, the most important reason was “liability concerns”,followed by “trash/litter” and “vandalism” (Table 33).
SUMMARY AND CONCLUSIONS
Extensive concern exists among Kansas landowners, policy-makers, and numerousagricultural and environmental groups about what will happen to the nearly 3 million acres ofcropland currently enrolled in the CRP once their 10-year contracts expire. An additional30.9 million acres are enrolled nationwide in this program. The entire CRP will eventuallycost approximately $20 billion (SWCS 1992). Tradeoffs of environmental quality, foodproduction, and federal fiscal planning have made the future of these CRP lands acontroversial topic for the 1995 farm bill agenda.
This study’s objective was to determine what Kansas landowners will do with acreageenrolled in CRP when their contracts expire and landowners’ attitudes toward extension ofthe current CRP and/or the use of alternative land conservation programs. The results depicta situation of high satisfaction with the current program but low expectations that anextension of the program will occur.
A majority of the landowners surveyed would like to extend their CRP contract for 5or 10 years. The bid rates required by the landowners were at or below their current bidrates. This is an overwhelming endorsement of the program and could be caused by severalfactors. The most important factor influencing the landowner’s decision was economics.The market prices for crops, forage, and livestock were the key factors in this decisionformula. The uncertainty surrounding these factors, complicated by federal deficits, tradenegotiations, and instability in Eastern Europe, may contribute to the strong responses forstaying in the CRP at very reasonable bid levels. These factors also are reflected in thelandowners’ uncertainty when depicting their plans after contract expiration. Less than 25percent would return land to crop production. A larger proportion (36.6 percent) wasuncertain or had no plans at the time of the survey. Landowners also may be concernedabout the expense of returning land to crop production under conservation compliance. Amajority of producers ranked soil erosion as an important or very important influence ontheir initial enrollment. To bring this erodible land back into production under compliancecould be costly because of structural, management, and other input expenses. Keeping landin forage production for livestock drew a large response (36.2 percent). This also may bedue to the perception that crop production is too risky and expensive.
Options to preserve current CRP land conditions under state wildlife and recreationprograms were not very popular. However, producers did recognize the benefits CRP hashad on wildlife diversity, and most found the increases in populations and diversity desirable.Most producers allowed access to their CRP land for hunting; however, producers wanted toremain in control of both who has access and the types of activities. Liability was thegreatest concern among those who did not allow recreation and those who would notparticipate in a state-sponsored program.
10

This survey did not address all the options to the current CRP program. However, itprovides the most extensive look at Kansas CRP contract-holders to date. Much informationhas been gathered and further analysis may reveal even more complicated relationshipsbetween Kansas landowners, economics, and the future of CRP lands.
SOURCES CITED
Ashton-Tate. 1986. dBASE III PLUS VI.1. Ashton-Tate. Torrance, CA.
Diebel, Penelope L. and Ted T. Cable. 1993. The Future of Kansas CRP Lands: TheLandowner’s View. A Report to Kansas Wildlife and Parks. Unpublished.Department of Agricultural Economics, Kansas State University, Manhattan, KS.
Dillman, D.A. 1978. Mail and Telephone Surveys: The Total Design Method. New York,N.Y.: John Wiley and Sons. 325pp.
Soil and Water Conservation Society. 1992. When Conservation Reserve Program ContractsExpire. Soil and Water Conservation Society, Ankeny, Iowa.
SPSS. 1989. SPSS/PC + V3.1. SPSS, Inc. Chicago, IL.
U.S. Department of Commerce. 1989.States Summary and State Data.Washington, D.C.
U.S. Department of Commerce. 1990.Surveys Part 2: Agricultural Economics and Land Ownership Survey. July 1990,U.S. Government Printing Office, Washington, D.C.
1987 Census of Agriculture, Vol. 1, Part 51: UnitedNovember 1989, U.S. Government Printing Office,
1987 Census of Agriculture, Vol. 3, Related.
11
Figure
Figure
1.
2.
Kansas Crop Reporting Districts
Location of Conservation Reserve Acreage in Kansas (1986-1990)
Figure 3. Location of Conservation Contracts in Kansas (1986-1990)
12

Figure 4. Location of Conservation Reserve Acres in Contracts Surveyed
Figure 5. Location of Conservation Reserve Contracts Surveyed
13
100%
80%
60%
40%
20%
0%Northwest Southwest Central Northeast Southeast
Westcentral Northcentral Southcentral Eastcentral
C r o p R e p o r t i n g D i s t r i c t s
Figure 6. Gender of Respondents by Crop Reporting District
60
59
58
57
56
55Northwest southwest CentraI Northeast Southeast
Westcentral Northcentral Southcentral Eastcentral
C r o p R e p o r t i n g D i s t r i c t s
Figure 7. Mean Age of Respondents by Crop Reporting District
14
90%
85%
80%
75%
70%Northwest Southwest Central Northeast Southeast
Westcentral Northcentral SouthcentraI Eastcentral
C r o p R e p o r t i n g D i s t r i c t s
Figure 8. Mean Percent of Debt-Free Farm Assets of Respondents by CropReporting District
200
150
100
50
Northwest Southwest CentraI Northeast SoutheastWestcentraI NorthcentraI ScuthcentraI EastcentraI
C r o p R e p o r t i n g D i s t r i c t s
Figure 9. Mean Number of Acres per Contract by Crop Reporting District
15
Northwest Southwest CentraI Northeast SoutheastWestcentraI NorthcentraI SouthcentraI EastcentraI
C r o p R e p o r t i n g D i s t r i c t s
Figure l0. Percent of Respondents Planning to Keep Some CRP Acres in Grass forLivestock Grazing by Crop Reporting District
Northwest Southwest CentraI Northeast SoutheastWestcentral Northcentral Southcentral Eastcentral
Crop Reporting District
Figure ll. Percent of Respondents Planning to Return Some CRP Acres to CropProduction under Conservation Compliance by Crop Reporting District
16
Northwest Southwest CentraI Northeast SoutheastWestcentral Northcentral SouthcentraI EastcentraI
C r o p R e p o r t i n g D i s t r i c t s
Figure 12. Percent of Respondents Willing to Extend CRP Enrollment for 5 Years byCrop Reporting District
Northwest Southwest CentraI Northeast SoutheastWetcentraI Northcentral SouthcentraI EastcentraI
C r o p R e p o r t i n g D i s t r i c t s
Figure 13. Percent of Respondents Willing to Extend CRP Enrollment for 10 Yearsby Crop Reporting District
17
$70
$65
$60
$55
$50
$45Northwest Southwest CentraI Northeast Southeast
WestcentraI NorthcentraI SouthcentraI Eastcentral
C r o p R e p o r t i n g D i s t r i c t s
Figure 14. Mean Current CRP Payments and Mean Bids Required to Extend Enrollmentfor 5 and 10 Years by Crop Reporting District
Northwest Southwest CentraI Northeast SoutheastWestcentral Northcentral Soutcentral Eastcentral
C r o p R e p o r t i n g D i s t r i c t s
Figure 10. Percent of Respondents Willing to Continue in CRP Program WithoutPayments, if Base is Preserved by Crop Reporting Districts
18
100%
80%
60%
40%
20%
0%Northwest Southwest CentraI Northeast Southeast
WestcentraI NorthcentraI Southcentral EastcentraI
C r o p R e p o r t i n g D i s t r i c t s
Figure 16. Percent of Respondents who Perceived Increases in General Wildlife,Deer, and Coyote as Undesirable by Crop Reporting District (deer and coyotereported only for those respondents indicating increases in those populations).
100%
80%
60%
40%
20%
0%Northwest Southwest Central Northeast Southeast
WestcentraI NorthcentraI Southcentral EastcentraI
C r o p R e p o r t i n g D i s t r i c t s
Figure 17. Percent of Respondents Allowing Recreational Activities on Their CRPLand by Crop Reporting District
19
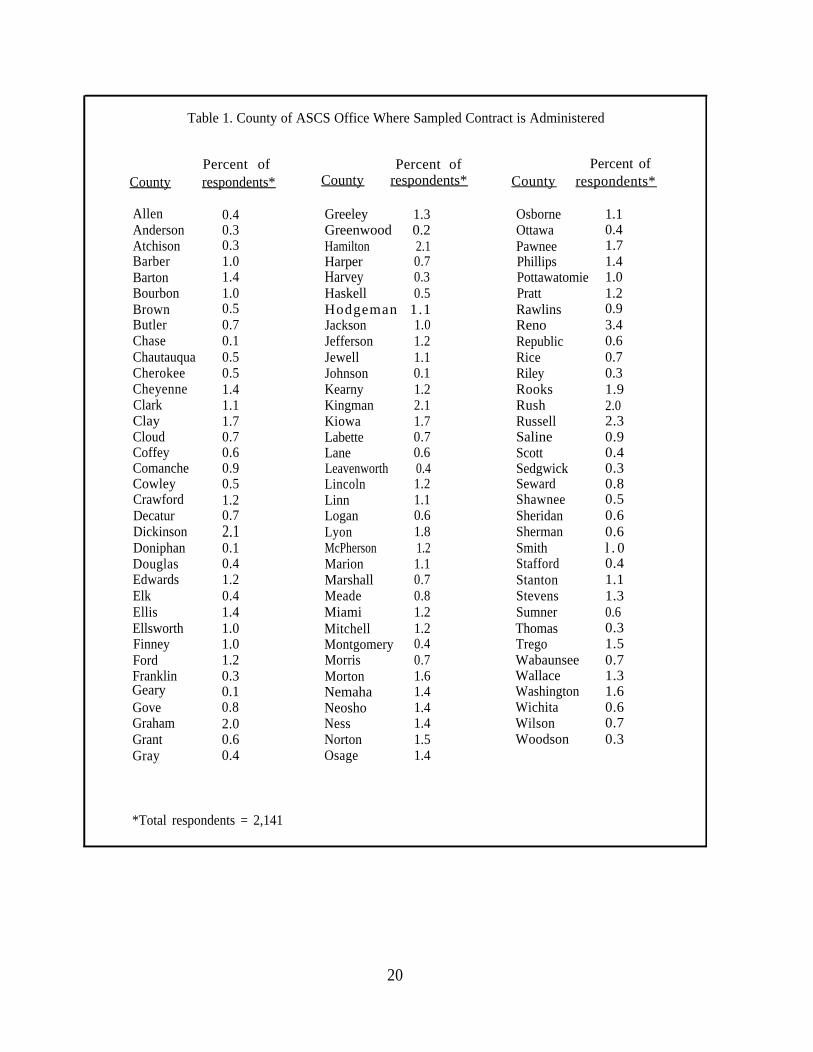
Table 1. County of ASCS Office Where Sampled Contract is Administered
Percent ofCounty respondents*
Percent ofCounty respondents*
Percent ofCounty respondents*
AllenAndersonAtchisonBarberBartonBourbonBrownButlerChaseChautauquaCherokeeCheyenneClarkClayCloudCoffeyComancheCowleyCrawfordDecaturDickinsonDoniphanDouglasEdwardsElk
Geary
EllisEllsworthFinneyFordFranklin
GoveGrahamGrantGray
0.40.30.31.01.41.00.50.70.10.50.51.41.11.70.70.60.90.51.20.72.10.10.41.20.41.41.01.01.20.30.10.82.00.60.4
Greeley 1.3Greenwood 0.2Hamilton 2.1Harper 0.7Harvey 0.3Haskell 0.5Hodgeman 1.1Jackson 1.0Jefferson 1.2Jewell 1.1Johnson 0.1Kearny 1.2Kingman 2.1Kiowa 1.7Labette 0.7Lane 0.6Leavenworth 0.4Lincoln 1.2Linn 1.1Logan 0.6Lyon 1.8McPherson 1.2Marion 1.1Marshall 0.7Meade 0.8MiamiMitchellMontgomeryMorrisMortonNemahaNeoshoNessNortonOsage
1.21.20.40.71.61.41.41.41.51.4
OsborneOttawaPawneePhillipsPottawatomiePrattRawlinsRenoRepublicRiceRileyRooksRushRussellSalineScottSedgwickSewardShawneeSheridanShermanSmithStaffordStantonStevensSumnerThomasTregoWabaunseeWallaceWashingtonWichitaWilsonWoodson
1.10.41.71.41.01.20.93.40.60.70.31.92.0 2.30.90.40.30.80.50.60.6l . 00.41.11.30.6 0.31.50.71.31.60.60.70.3
*Total respondents = 2,141
20

Table 2. Relationship of Respondents to Land under CRP Contract
Percentof
Relationship respondents*
Owner and operator 70.8
Renter and operator 18.1
Absentee landowner 11.1
*Total respondents = 2,109
Table 3. Highest Level of Education Obtained by Respondent
Percentof
Education level respondents*
Some elementary school 5.2
Some high school 6.1
High school diploma 31.9
Some college or post-high school 24.0
Vocational or technical school 7.8
Bachelor’s degree 17.4
Graduate degree 7.7
*Total respondents = 2,025
21
Annual income
Less than $10,000
$10,000-$19,999
$20,000-$24,999
$25,000-$29,999
$30,000-$49,999
$50,000-$74,999
$75,000 or more
Table 4. Total Annual Income of Respondents
Fromall
sources
percent ofrespondents 1
2.8
9.5
9.2
8.6
25.1
16.9
27.8
Fromagricultural
sources
percent ofrespondents2
22.8
17.0
10.4
7.7
15.3
8.9
17.8
From non-agricultural
sources
percent ofrespondents3
39.5
20.1
9.4
8.4
12.0
5.3
5.3
lTotal respondents = 1,8442Total respondents = 1,9023Total respondents = 1,854
22
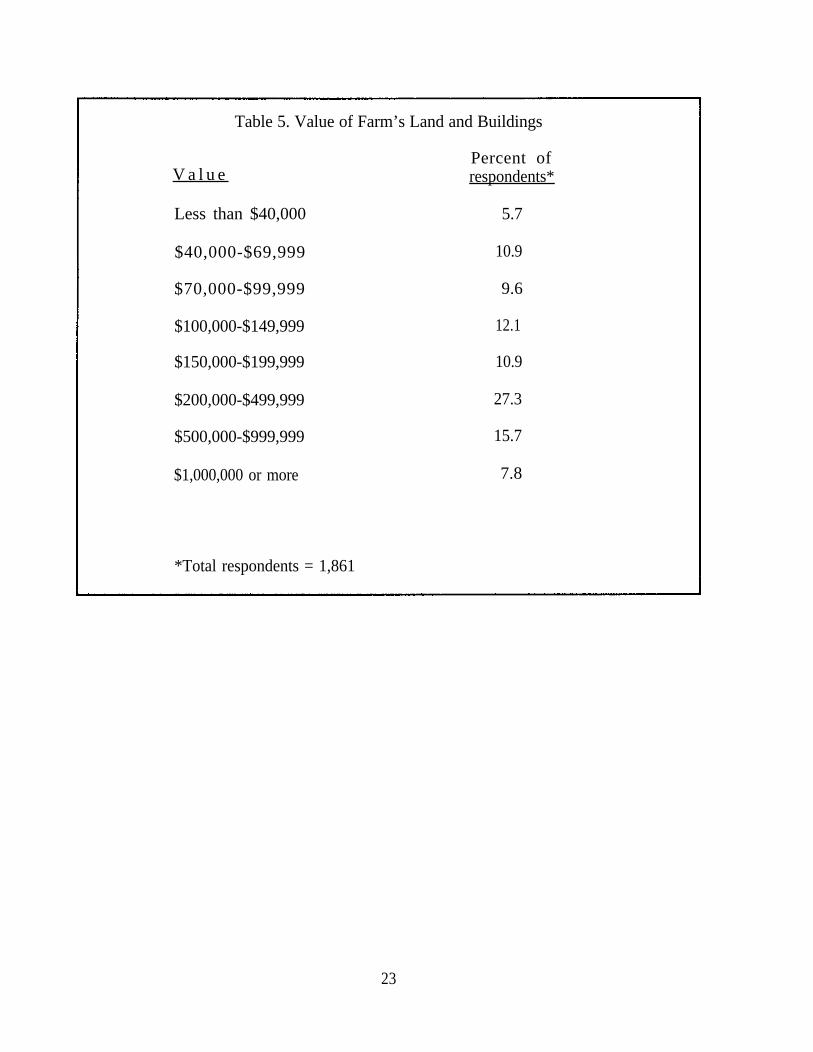
Table 5. Value of Farm’s Land and Buildings
V a l u ePercent ofrespondents*
Less than $40,000
$40,000-$69,999
$70,000-$99,999
$100,000-$149,999
$150,000-$199,999
$200,000-$499,999
$500,000-$999,999
$1,000,000 or more
*Total respondents = 1,861
5.7
10.9
9.6
12.1
10.9
27.3
15.7
7.8
23

Table 6. Value of Farm’s Machinery and Equipment
Percent ofValue respondents*
Less than $10,000 28.6
$10,000-$29,999 16.5
$30,000-$49,999 12.0
$50,000-$99,999 16.5
$100,000-$199,999 14.0
$200,000-$499,999 8.9
$500,000-$999,999 2.9
$1,000,000 or more 0.8
*Total respondents = 1,835
Table 7. Participation in USDA Commodity Programs
Crop Percent of Crop Percent ofprogram respondents* program respondents*
Wheat 75.0 Soybeans 12.2
Sorghum 60.6 Oats 12.1
Corn 19.1 Barley 9.5
None 23.2
*Total respondents = 2,078
24
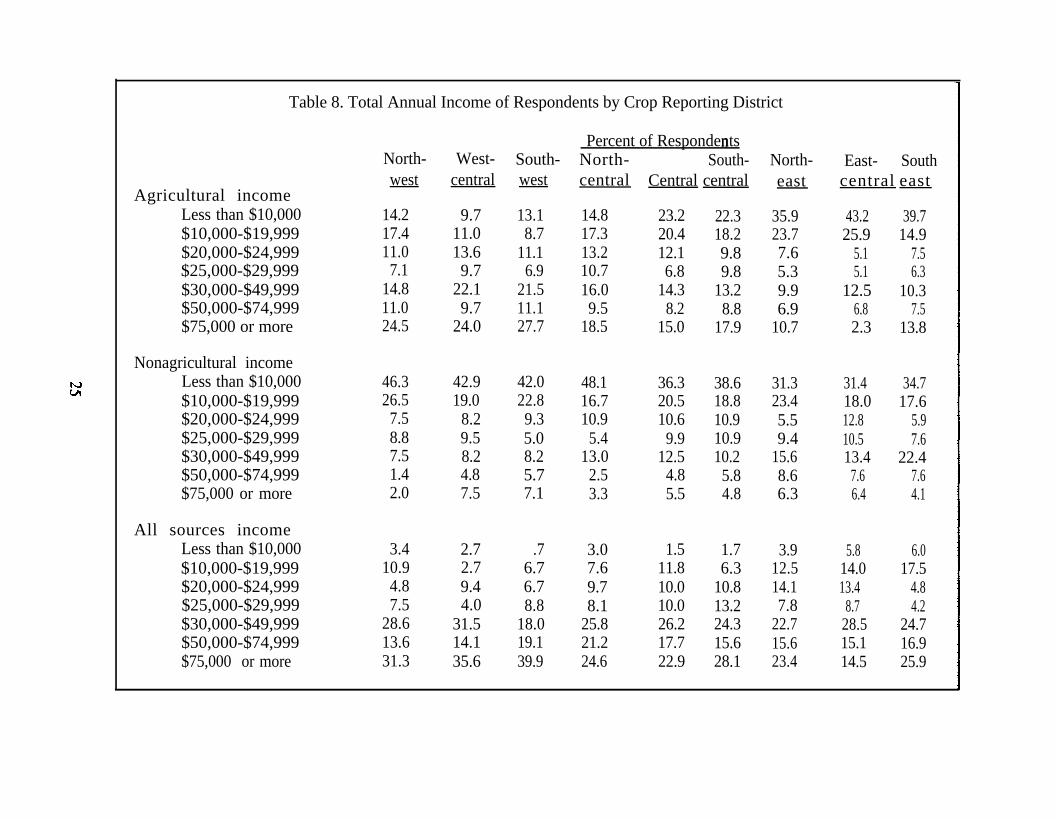
Table 8. Total Annual Income of Respondents by Crop Reporting District
eastAgricultural income
Less than $10,000$10,000-$19,999$20,000-$24,999$25,000-$29,999$30,000-$49,999$50,000-$74,999$75,000 or more
Nonagricultural incomeLess than $10,000$10,000-$19,999$20,000-$24,999$25,000-$29,999$30,000-$49,999$50,000-$74,999$75,000 or more
All sources incomeLess than $10,000$10,000-$19,999$20,000-$24,999$25,000-$29,999$30,000-$49,999$50,000-$74,999$75,000 or more
North-west
14.217.411.0
7.114.811.024.5
46.326.5
7.58.87.51.42.0
3.410.94.87.5
28.613.631.3
West-central
9.711.013.69.7
22.19.7
24.0
42.919.0
8.29.58.24.87.5
2.72.79.44.0
31.514.135.6
South-west
13.18.7
11.16.9
21.511.127.7
42.022.89.35.08.25.77.1
.76.76.78.8
18.019.139.9
Percent of RespondentsnNorth-central
14.817.313.210.716.09.5
18.5
48.116.710.9
5.413.0
2.53.3
3.07.69.78.1
25.821.224.6
South-Central central
23.220.412.16.8
14.38.2
15.0
36.320.510.6
9.912.5
4.85.5
1.511.810.010.026.217.722.9
22.318.29.89.8
13.28.8
17.9
38.618.810.910.910.25.84.8
1.76.3
10.813.224.315.628.1
North-
35.923.77.65.39.96.9
10.7
31.323.45.59.4
15.68.66.3
3.912.514.17.8
22.715.623.4
East- Southcentral east
43.2 39.725.9 14.9 5.1 7.5 5.1 6.312.5 10.3 6.8 7.5
2.3 13.8
31.4 34.718.0 17.612.8 5.910.5 7.613.4 22.4 7.6 7.6 6.4 4.1
5.8 6.014.0 17.513.4 4.8 8.7 4.228.5 24.715.1 16.914.5 25.9
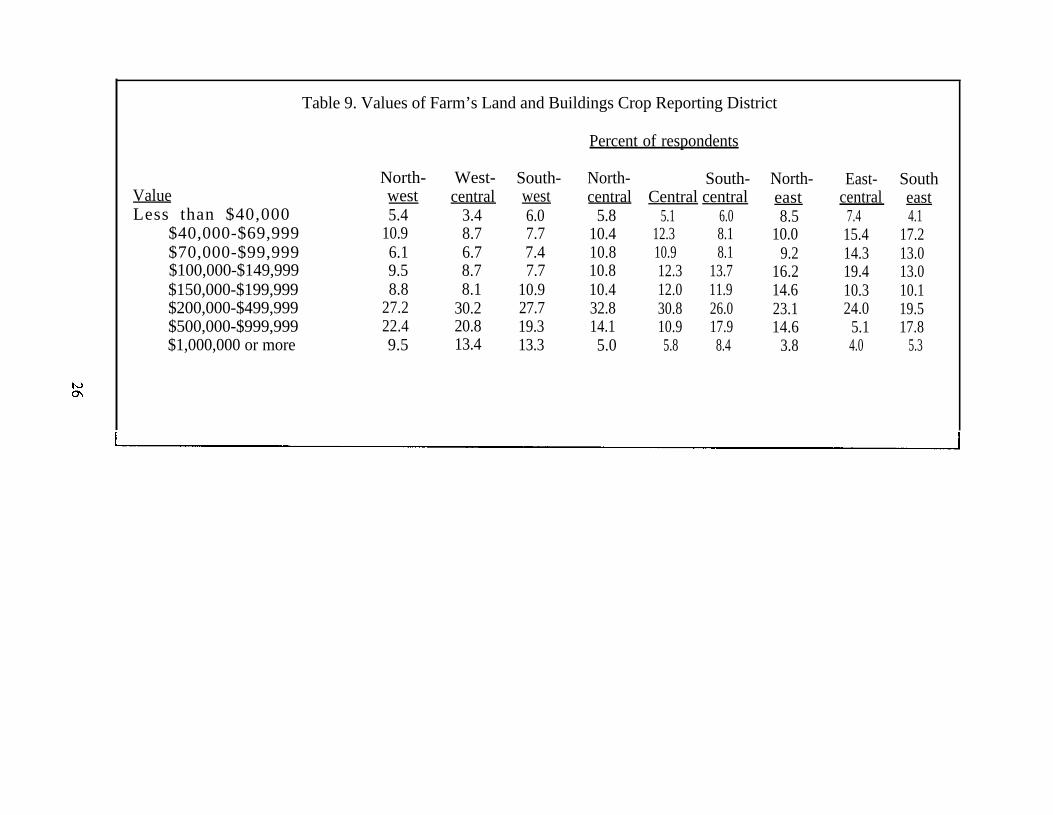
Table 9. Values of Farm’s Land and Buildings Crop Reporting District
Percent of respondents
ValueLess than $40,000
$40,000-$69,999$70,000-$99,999$100,000-$149,999$150,000-$199,999$200,000-$499,999$500,000-$999,999$1,000,000 or more
North-west5.4
10.96.19.58.8
27.222.49.5
West-central
3.48.76.78.78.1
30.220.813.4
South-west6.07.77.47.7
10.927.719.313.3
North-central
5.810.410.810.810.432.814.15.0
South-Central central
5.1 6.012.3 8.1 10.9 8.112.3 13.712.0 11.930.8 26.010.9 17.95.8 8.4
North-east8.5
10.09.2
16.214.623.114.6
3.8
East- Southcentral east
7.4 4.115.4 17.214.3 13.019.4 13.010.3 10.124.0 19.5
5.1 17.8 4.0 5.3
Crop
Wheat
Sorghum
Corn
Soybeans
Oats
Table 10. Participation in USDA Commodity Programs Crop Reporting District
North- West- South-west central west
94.1 89.9 74.1
73.4 71.9 58.6
32.5 15.2 28.5 14.2
1.0 2.1
21.9
Percent of respondents
North- South-central Central central
85.3 86.5
75.8 70.2
12.8
6.8
11.9
2.5
78.6
53.3
North-east
45.8
41.7
29.2
37.7
6.3
50.7
East-central
42.9
41.8
19.6
47.2
6.9
2.1
51.9
southeast
58.7
48.9
16.3
50.0
6.010.1 6.8 21.1 18.6 8.4
Barley 17.8 30.3 16.5
None 5.9 10.1 23.9
6.4 7.1 5.3
12.8 13.5 20.4 37.0
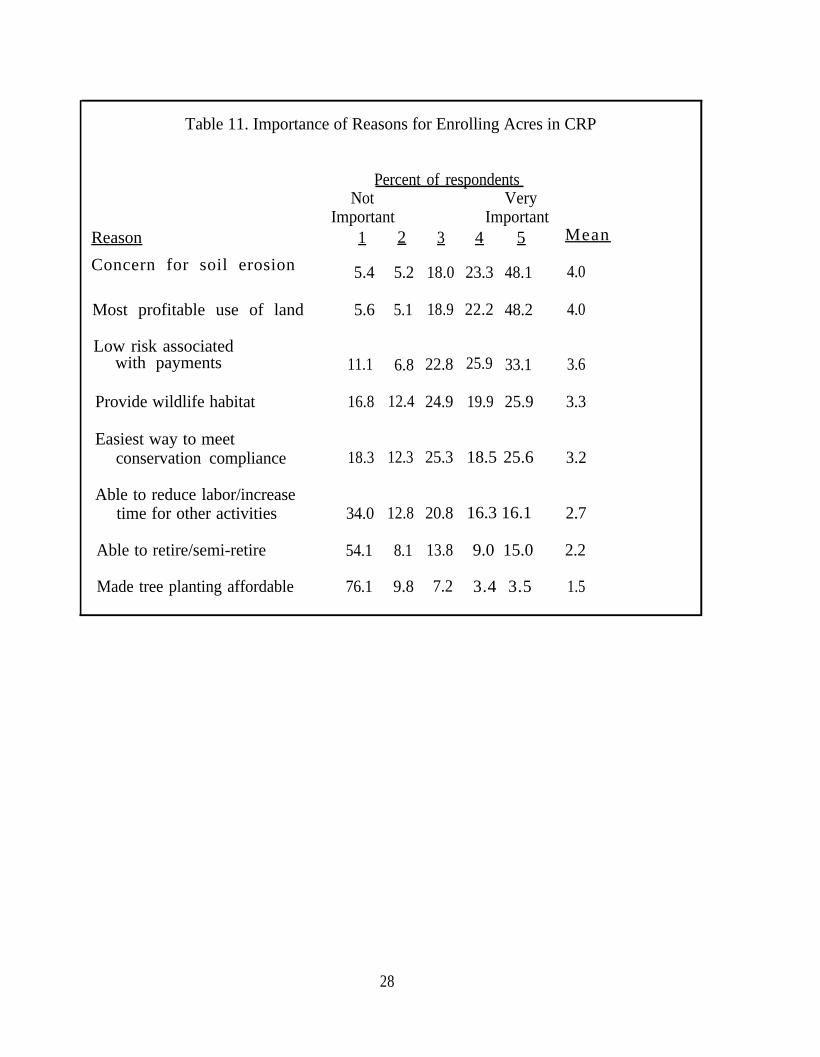
Table 11. Importance of Reasons for Enrolling Acres in CRP
Reason
Concern for soil erosion
Mean
Most profitable use of land
Low risk associatedwith payments 25.9
Provide wildlife habitat
Easiest way to meetconservation compliance
Able to reduce labor/increasetime for other activities
Able to retire/semi-retire
Made tree planting affordable
Percent of respondentsNot
Important1
5.4
5.6
11.1
16.8
18.3
34.0
54.1
76.1
2
5.2
5.1
6.8
12.4
12.3
12.8
8.1
9.8
3
18.0
18.9
22.8
24.9
25.3
20.8
13.8
7.2
VeryImportant
4
23.3
22.2
19.9
5
48.1
48.2
33.1
25.9
18.5 25.6
16.3 16.1
9.0 15.0
3.4 3.5
4.0
4.0
3.6
3.3
3.2
2.7
2.2
1.5
28

Table 12. Importance of Reasons for Not Enrolling Eligible Acres in CRP*
Percent of respondentsNot
ImportantVery
ImprotantReason 1 2
8.4
3 4 5 M e a n
Crop production was
3.4
more profitablethan receivingCRP payments 18.1 21.9 20.7 30.9
Potential for increasedcrop prices 21.9 10.7 25.1 22.6 19.6 3.1
Better able toutilize my laborand/or equipment 28.1 9.4 21.1 23.3 18.1 2.9
2.7Needed crops for
livestock feed 41.7 9.6 12.0 12.7 24.1
Needed to keepfamily member ortenant in farming 48.3 12.8
19.1
12.1
15.6
9.8
9.6
17.0
11.0
2.3
Profits fromhaying/grazinghigher thanCRP payments 44.7 2.2
*Includes only responses for those who did not enroll all eligible acres
29

Table 13. Importance of Reasons for Enrolling Acres in CRP by Crop Reporting Districts
Mean value*
ReasonConcern for soil erosion
Most profitable use of land
Low risk associatedwith payments
Provide wildlife habitat
Easiest way to meetconservation compliance
Able to reduce labor/increasetime for other activities
Able to retire/semi-retire
Made tree planting affordable
North- West-west central4.37 3.99
4.16 4.11
3.65 3.61
3.38 2.99
3.55 3.14
2.32 2.41
2.06 2.03
1.57 1.59
South- North-west central3.81 4.12
4.14 3.95
3.81 3.56
3.19 3.26
3.09 3.23
2.92 2.81
2.34 2.18
1.48 1.37
*Mean values based on scale: 1 = Not Important to 5 = Very Important
South-Central central
4.02 3.96
4.08 4.21
3.43 3.67
3.10 3.21
3.20 3.05
2.47 2.66
1.85 2.31
1.53 1.47
North-east4.11
3.73
3.48
3.47
3.21
2.69
2.19
1.40
East-central
4.04
3.72
3.61
3.31
3.11
2.76
2.31
1.43
South-east4.10
3.86
3.54
3.15
3.34
2.77
2.28
1.55
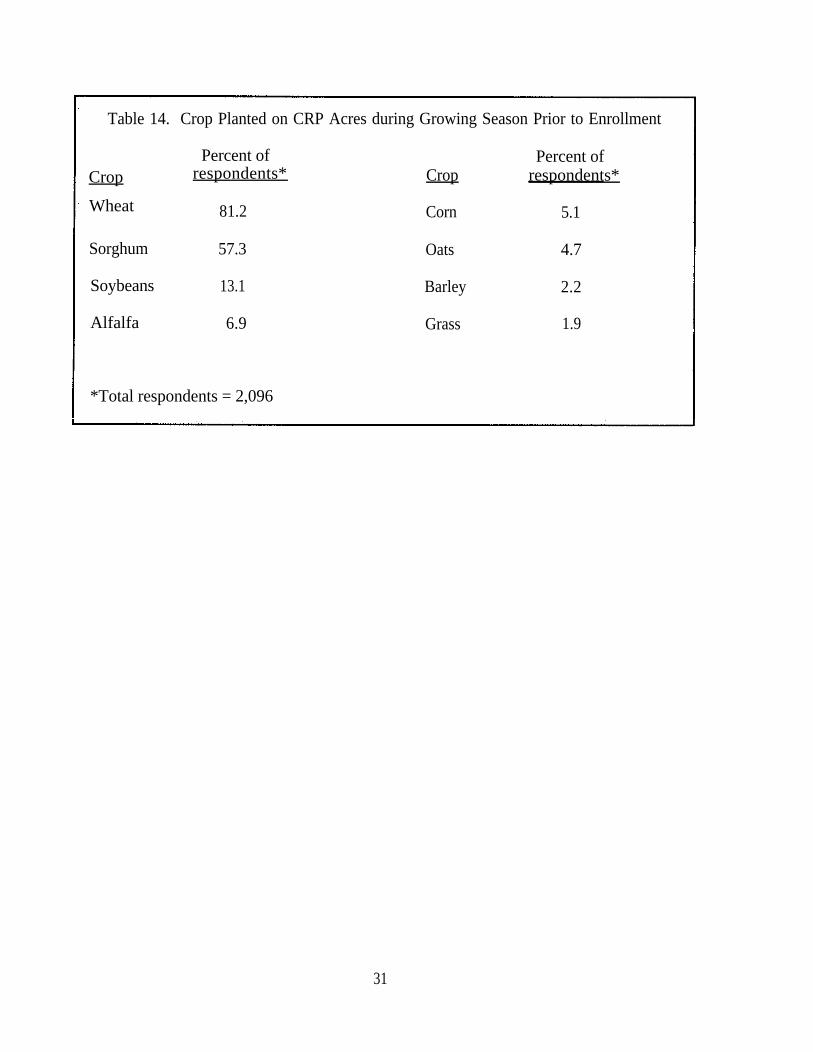
Table 14. Crop Planted on CRP Acres during Growing Season Prior to Enrollment
Crop respondents*
Wheat
Sorghum
Soybeans
Alfalfa
Percent of
81.2
57.3
13.1
6.9
Crop
Corn
Percent ofrespondents*
5.1
Oats 4.7
Barley
Grass
2.2
1.9
*Total respondents = 2,096
31
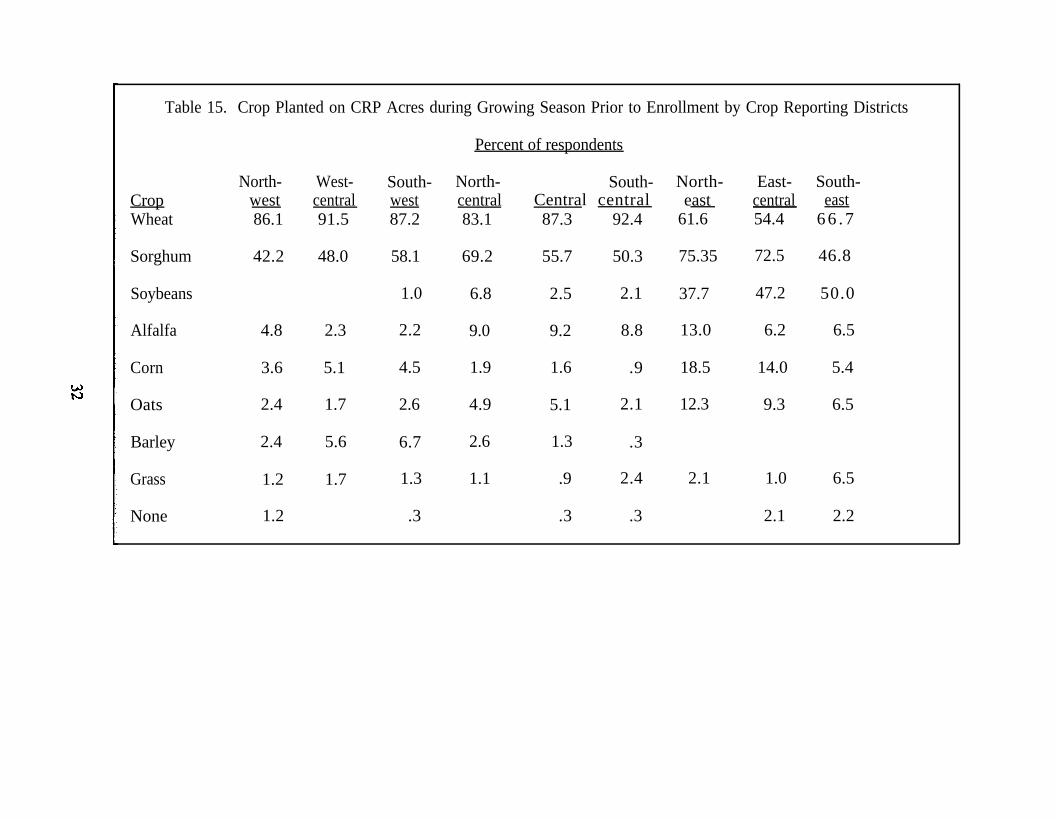
Table 15. Crop Planted on CRP Acres during Growing Season Prior to Enrollment by Crop Reporting Districts
Percent of respondents
North- West- South- North- South- North- East- South-Crop west central west central Central central east central eastWheat 86.1 91.5 87.2 83.1 87.3 92.4 61.6 54.4 6 6 . 7
Sorghum 42.2 48.0 58.1 69.2 55.7 50.3 75.35 72.5 46.8
Soybeans 1.0 6.8 2.5 2.1 37.7 47.2 50.0
Alfalfa 4.8 2.3 2.2 9.0 9.2 8.8 13.0 6.2 6.5
Corn 3.6 5.1 4.5 1.9 1.6 .9 18.5 14.0 5.4
Oats 2.4 1.7 2.6 4.9 5.1 2.1 12.3 9.3 6.5
Barley 2.4 5.6 6.7 2.6 1.3 .3
Grass 1.2 1.7 1.3 1.1 .9 2.4 2.1 1.0 6.5
None 1.2 .3 .3 .3 2.1 2.2
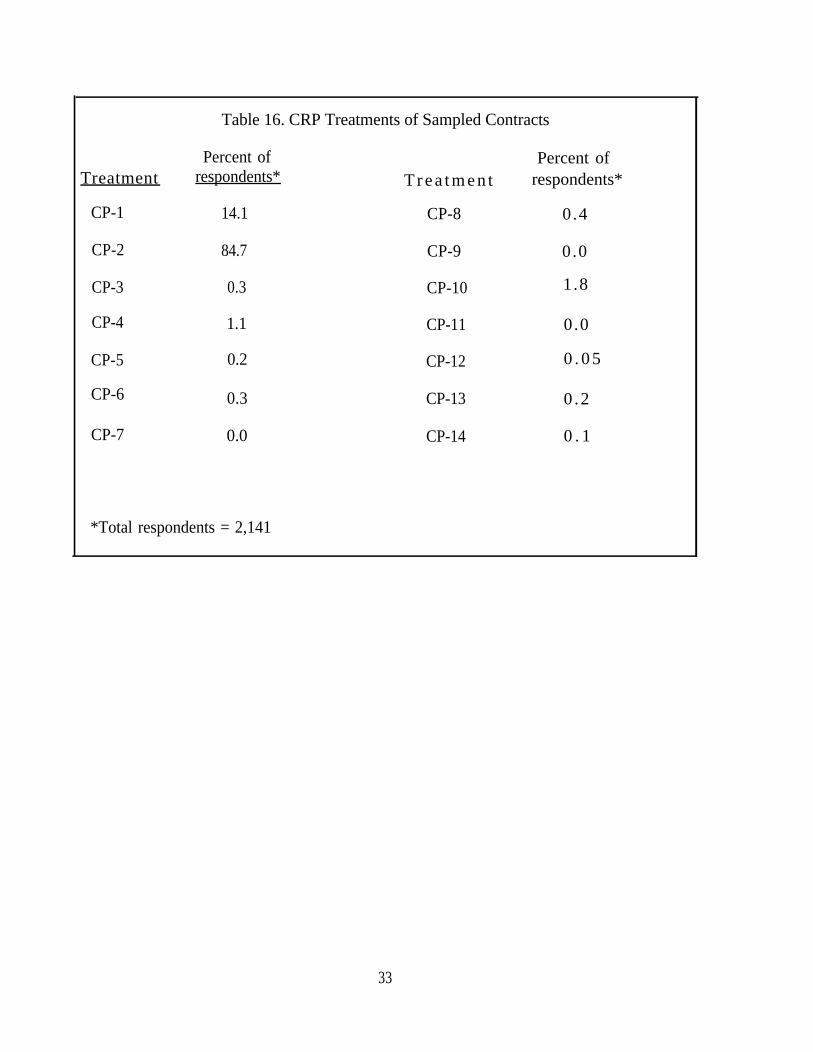
Table 16. CRP Treatments of Sampled Contracts
Percent of Percent ofTreatment respondents* T r e a t m e n t respondents*
CP-8CP-1
CP-2
CP-5
CP-6
CP-7
14.1 0.4
84.7 CP-9 0.0
CP-3 0.3 CP-10 1.8
CP-4 1.1 CP-11 0.0
0.2 CP-12 0 . 0 5
0.3 0 .2CP-13
CP-14 0 . 10.0
*Total respondents = 2,141
33

Table 17. Improvements Currently on CRP Acres
Improvement
Terraces
Waterways
Fences
Livestock watering sources
Livestock handling facilities
None
Percent ofrespondents*
50.7
32.7
31.7
15.5
5.0
27.7
*Total respondents = 2,125
Table 18. Management Practice Done on CRP Acres in the Past 2-3 Years
Management Practice
Mowing
Weed Control
Prescribed burning
No active management
*Total respondents = 2,128
Percent ofrespondents*
81.2
78.4
24.2
3.9
34

Table 19. Plans for CRP Acres after the Contract Expires
Percent of MeanPlans respondents* (acres)
No plans/uncertain 36.6 47.4
Keep in grass for livestock grazing 36.2 29.3
Return to annual crop productionunder conservation complianceprovisions
Keep in grass for
Keep in grass for
erosion control
hay production
Keep in grass and/or trees forwildlife habitat
Return to annual crop productionwithout conservation complianceprovisions
Sell the land
Keep in trees for
Keep in trees for
erosion control
timber production
23.6
22.9
17.6
10.2
4.9
2.6
1.8
0.5
44.0
16.0
8.3
7.4
6.4
4.1
0.5
0.1
*Total respondents = 2,034
35

Table 20. Plans for CRP Acres after Contract Expires by Crop Reporting District
Percent of respondents
ReasonNo plans/uncertain
Keep in grass for livestockgrazing
Return to annual cropproduction under cons.compliance provisions
Keep in grass for erosion control
Keep in grass for hay production
Keep in grass and/or treesfor wildlife habitat
Return to annual crop productionwithout conservation complianceprovisions
Sell the land
Keep in trees for erosion control
Keep in trees for timber production
North-west
33.5
41.6
24.2
32.3
10.6
9.9
3.1
.6
1.2
.6
West-central34.3
32.0
32.0
19.8
8.1
9.9
2.9
1.7
.6
South-west
41 .0
26.2
34.1
16.7
2.3
7.9
5.2
1.3
.7
North-central26.9
48.1
24.2
23.8
24.6
7.3
3.8
3.1
1.2
.8
South-Central central40.1 42.0
36.8 37.2
18.2 23.7
22.5 22.1
22.1 13.5
9.8 13.1
4.2 2.6
4.2 2.2
2.0 3.8
.3 1.0
North-east33.6
32.9
12.1
23.6
32.1
15.7
10.0
3.6
4.3
.7
East- South-central east41.6 30.8
32.6 39.6
17.4 20.3
25 .3 26 .4
24.7 29.7
11.1 9.3
5.8 9.9
4.7 2.2
1.1 1.1
1.1
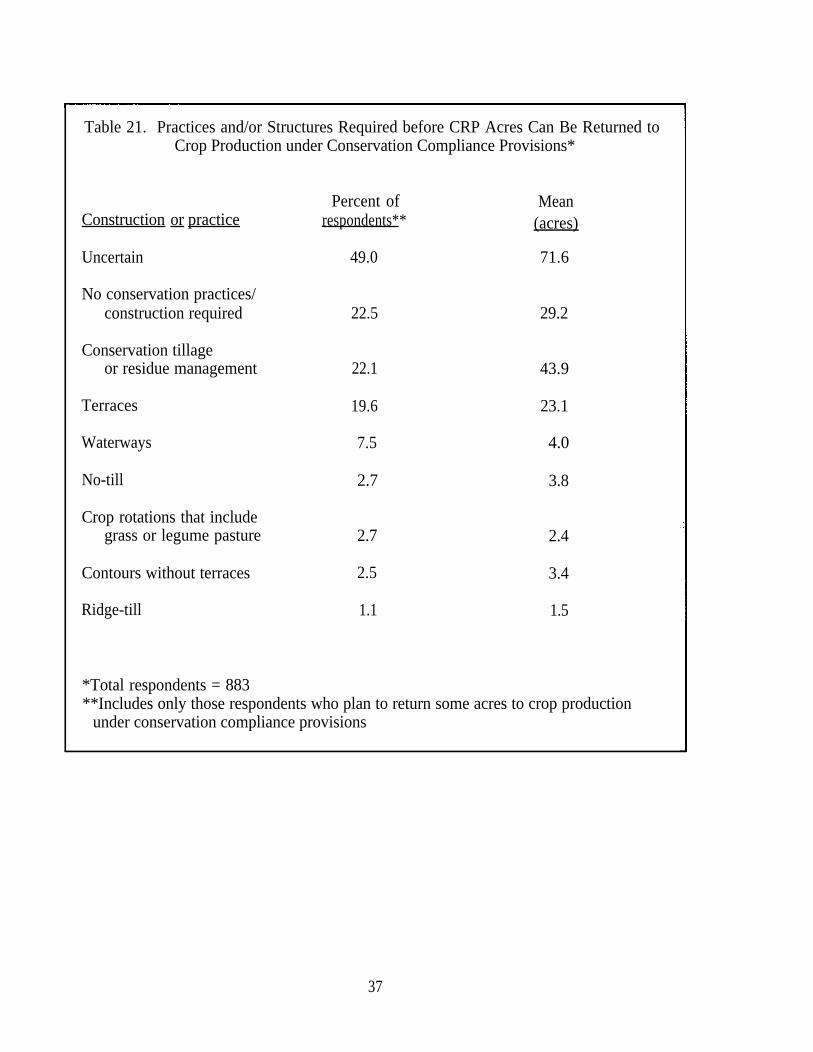
Table 21. Practices and/or Structures Required before CRP Acres Can Be Returned toCrop Production under Conservation Compliance Provisions*
Percent ofrespondents**
Mean(acres)Construction or practice
Uncertain 49.0 71.6
No conservation practices/construction required 22.5 29.2
Conservation tillageor residue management 22.1 43.9
23.1
4.0
3.8
Terraces 19.6
Waterways 7.5
No-till 2.7
Crop rotations that includegrass or legume pasture 2.7 2.4
3.4
1.5
Contours without terraces 2.5
Ridge-till 1.1
*Total respondents = 883**Includes only those respondents who plan to return some acres to crop production
under conservation compliance provisions
37

Table 22. Construction Required before CRP Acres Can Be Returned to Grazing*
respondents** (acres)
Fencing
Uncertain
Percent of Mean
56.8 51.6
33.7 41.5
Livestock water development 21.9 20.8
No small construction required 14.0 8.6
Livestock handling facilities 12.1 10.9
*Includes only those respondents who plan to return some acres to grazing**Total respondents = 1,179
38

Table 23. Importance of Likely Influences on the Decision of What to Do when CRP Contracts Expire
Influences
Market prices for crops/livestockthat could be produced onthe CRP contract acres afterthe contract expires
Availability of cost-sharing forfencing and livestock waterdevelopment that may berequired before CRP acrescan be returned to livestockgrazing
Expected costs of planting,growing, and harvestingcrops that could be grown onthe CRP acres after thecontract expires
Government price supports forcrops that could be grownon the CRP acres after thecontract expires
Availability of cost-sharing forsoil conservation practicesthat may be required beforeCRP acres can be returnedto annual crop production
Cost of soil conservationpractices that may berequired before CRP acrescan be returned to production
Expected price the land will sellfor after the CRP contractexpires
Availability of cost-sharing forestablishing or improvingwildlife habitat
Percent of respondentsNot Very
Important Important1 2 3 4 5 Mean*
13.2 5.8 16.0 19.6 45.5 3.8
24.7 9.4 15.9 15.8 34.3 3.3
23.6 9.9 19.2 19.3 28.0 3.2
24.3 10.6 18.5 16.6 30.0 3.2
29.0 10.4 16.4 16.2 28.0 3.0
28.5 11.6 16.5 15.3 28.2 3.0
36.0 11.3 16.1 12.6 24.0 2.8
41.0 14.8 17.6 10.3 16.4 2.5
*Mean values based on the scale 1 = Not Important to 5 = Very Important
39
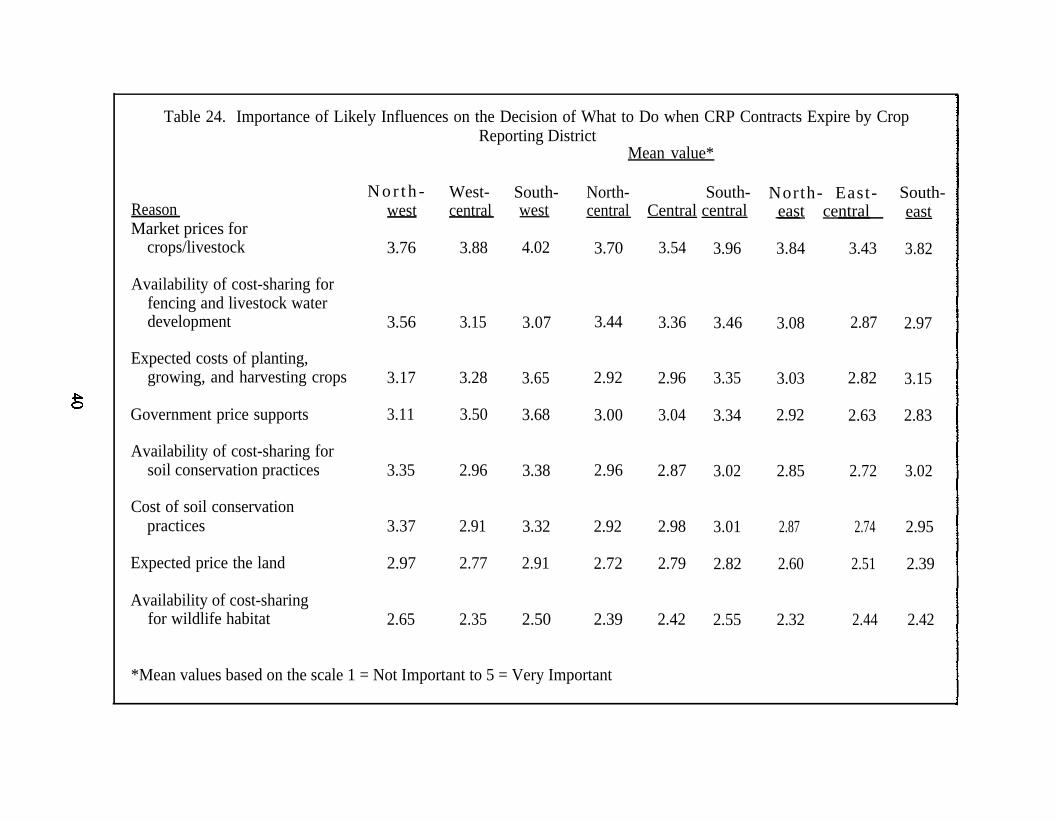
Table 24. Importance of Likely Influences on the Decision of What to Do when CRP Contracts Expire by Crop
Mean value*
ReasonMarket prices for
crops/livestock
Availability of cost-sharing forfencing and livestock waterdevelopment
Expected costs of planting,growing, and harvesting crops
Government price supports
Availability of cost-sharing forsoil conservation practices
Cost of soil conservationpractices
Expected price the land
Availability of cost-sharingfor wildlife habitat
N o r t h -west
3.76
3.56
3.17
3.11
3.35
3.37
2.97
2.65
Reporting District
West-central
3.88
3.15
3.28
3.50
2.96
2.91
2.77
2.35
South-west
4.02
3.07
3.65
3.68
3.38
3.32
2.91
2.50
North-central
3.70
3.44
2.92
3.00
2.96
2.92
2.72
2.39
*Mean values based on the scale 1 = Not Important to 5 = Very Important
South-Central central
3.54
3.36
2.96
3.04
2.87
2.98
2.79
2.42
3.96
3.46
3.35
3.34
3.02
3.01
2.82
2.55
North- East-east central
3.84 3.43
3.08 2.87
3.03 2.82
2.92 2.63
2.85 2.72
2.87 2.74
2.60 2.51
2.32 2.44
South-east
3.82
2.97
3.15
2.83
3.02
2.95
2.39
2.42
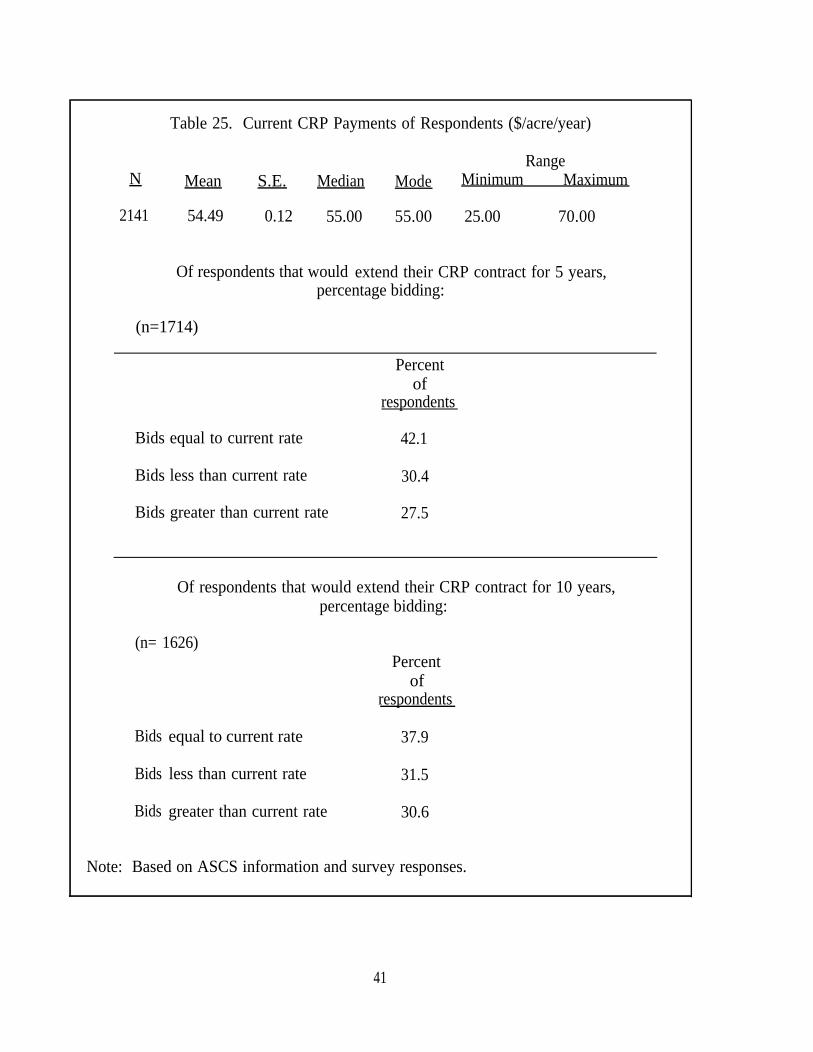
Table 25. Current CRP Payments of Respondents ($/acre/year)
N
2141
Mean
54.49
S.E. Median
0.12 55.00
Mode
55.00
Of respondents that would
RangeMinimum Maximum
25.00 70.00
extend their CRP contract for 5 years,percentage bidding:
(n=1714)
Bids equal to current rate
Bids less than current rate
Bids greater than current rate
Percentof
respondents
42.1
30.4
27.5
Of respondents that would extend their CRP contract for 10 years,
(n= 1626)
Bids
Bids
Bids
percentage bidding:
Percentof
respondents
equal to current rate
less than current rate
greater than current rate
37.9
31.5
30.6
Note: Based on ASCS information and survey responses.
41
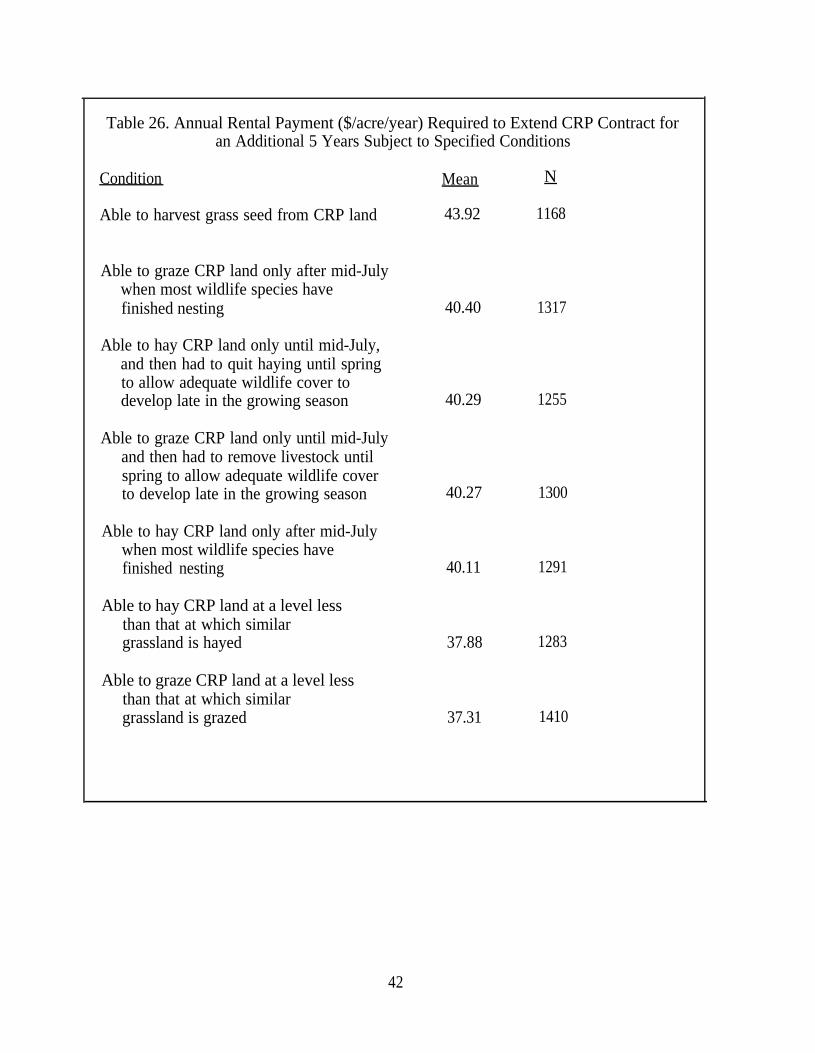
Table 26. Annual Rental Payment ($/acre/year) Required to Extend CRP Contract foran Additional 5 Years Subject to Specified Conditions
Condition
Able to harvest grass seed from CRP land
Able to graze CRP land only after mid-Julywhen most wildlife species havefinished nesting 1317
Able to hay CRP land only until mid-July,and then had to quit haying until springto allow adequate wildlife cover todevelop late in the growing season
Able to graze CRP land only until mid-Julyand then had to remove livestock untilspring to allow adequate wildlife coverto develop late in the growing season
Able to hay CRP land only after mid-Julywhen most wildlife species havefinished nesting
Able to hay CRP land at a level lessthan that at which similargrassland is hayed 1283
Able to graze CRP land at a level lessthan that at which similargrassland is grazed
Mean N
43.92 1168
40.40
40.29
40.27
40.11
37.88
37.31
1255
1300
1291
1410
42

Table 27. Respondents Believing that an Increase in Wildlife Species Has Taken Placeon Their Farm Because of Enrollment in CRP
Wildlife Percent ofspecies respondents*
Deer 68.0
Pheasant 67.8
Quail 60.8
Coyote 49.0
Rabbit 40.5
Wildlifespecies
Dove
Turkey
Prairie chicken
Songbirds
Squirrel
Wildlifein general
Percentrespondents*
25.3
25.1
17.0
16.8
7.2
37.8
*Total respondents = 2,092
43

Table 28. Respondents Believing that an Increase in Wildlife Species Has Taken Place on Their Farmbecause of Enrollment in CRP by Crop Reporting District
Percent of respondents
South- North-west central Central72.3 67.7 69.7
South-central76.3
North-east62.5
East-central72.5
29.8
73.6
26.4
38.2
20.2
32.6
23.6
23.6
14.6
47.8
WildlifeSpeciesdeer
North-west71.8
West-central
80.2
South-east
73.5
9.0
70.5
35.5
42.8
24.1
38.6
17.5
21.7
16.3
39.8
80.0 87.3 83.8 83.9 80.9pheasant 82.7 80.8
82.0 79.434.0 16.8 51.7 80.9 72.7quail
54.5 70.3 51.8 56.2 60.6 29.454.5coyote
43.3 42.2 42.4 45.1 50.0rabbit 37.2 44.3
32.5 23.516.7 22.8 26.7 32.3 31.3dove
12.0 7.7 37.1 29.3 30.9 28.7turkey 27.6
15.0 37.8 18.9 7.3 17.6prairie chicken 19.2 6.6
22.112.2 15.6 12.3 18.3 16.5 20.8songbirds
.7 8.0 5.1 8.2 17.6squirrel 1.9 4.2
41.6 46.3wildlife in general 32.1 40.1 33.0 41.4 41.1
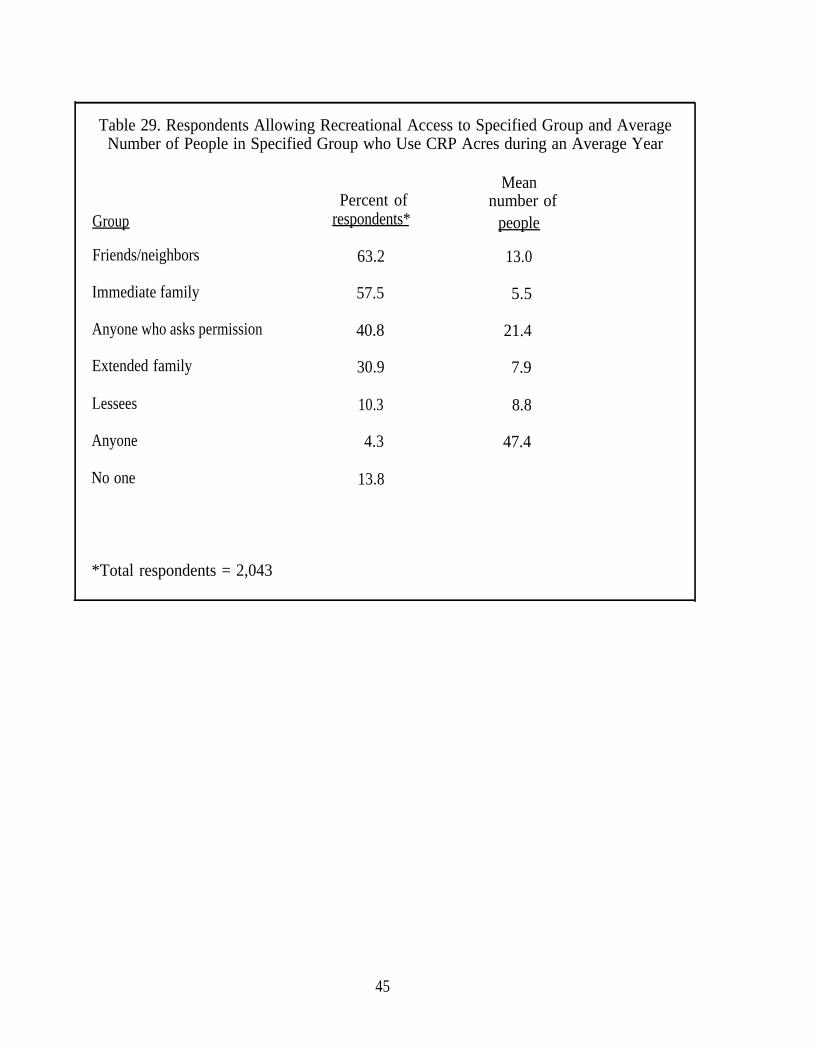
Table 29. Respondents Allowing Recreational Access to Specified Group and AverageNumber of People in Specified Group who Use CRP Acres during an Average Year
MeanPercent of number of
Group respondents* people
Friends/neighbors 63.2 13.0
Immediate family 57.5 5.5
Anyone who asks permission 40.8 21.4
Extended family 30.9 7.9
Lessees 10.3 8.8
Anyone 4.3 47.4
No one 13.8
*Total respondents = 2,043
45
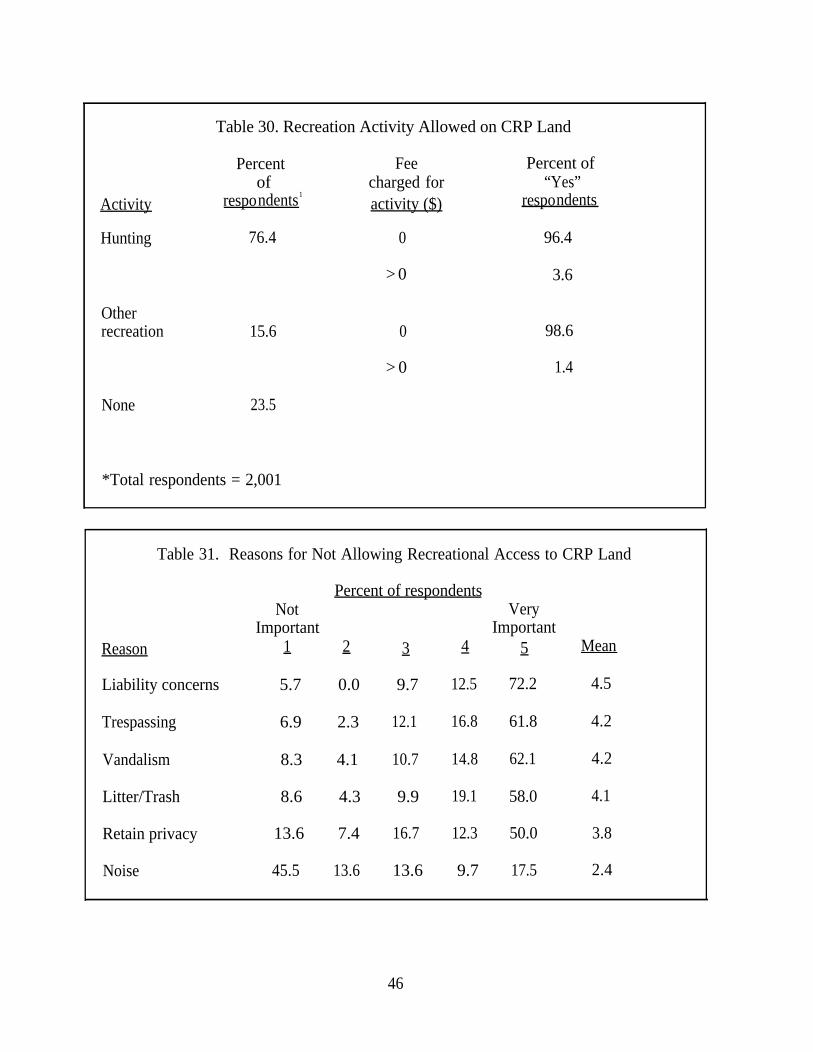
Table 30. Recreation Activity Allowed on CRP Land
Percent Fee Percent ofof charged for “Yes”
Activity respondents1
activity ($) respondents
Hunting 76.4 0 96.4
> 0 3.6
Otherrecreation 0 98.615.6
> 0 1.4
None 23.5
*Total respondents = 2,001
Table 31. Reasons for Not Allowing Recreational Access to CRP Land
Percent of respondentsNot Very
Important ImportantReason 1 2 3 4 5 Mean
Liability concerns 5.7 0.0 9.7 12.5 72.2 4.5
Trespassing 6.9 2.3 12.1 16.8 61.8 4.2
Vandalism 8.3 4.1 10.7 14.8 62.1 4.2
Litter/Trash 8.6 4.3 9.9 19.1 58.0 4.1
Retain privacy 13.6 7.4 16.7 12.3 50.0 3.8
Noise 45.5 13.6 13.6 9.7 17.5 2.4
46
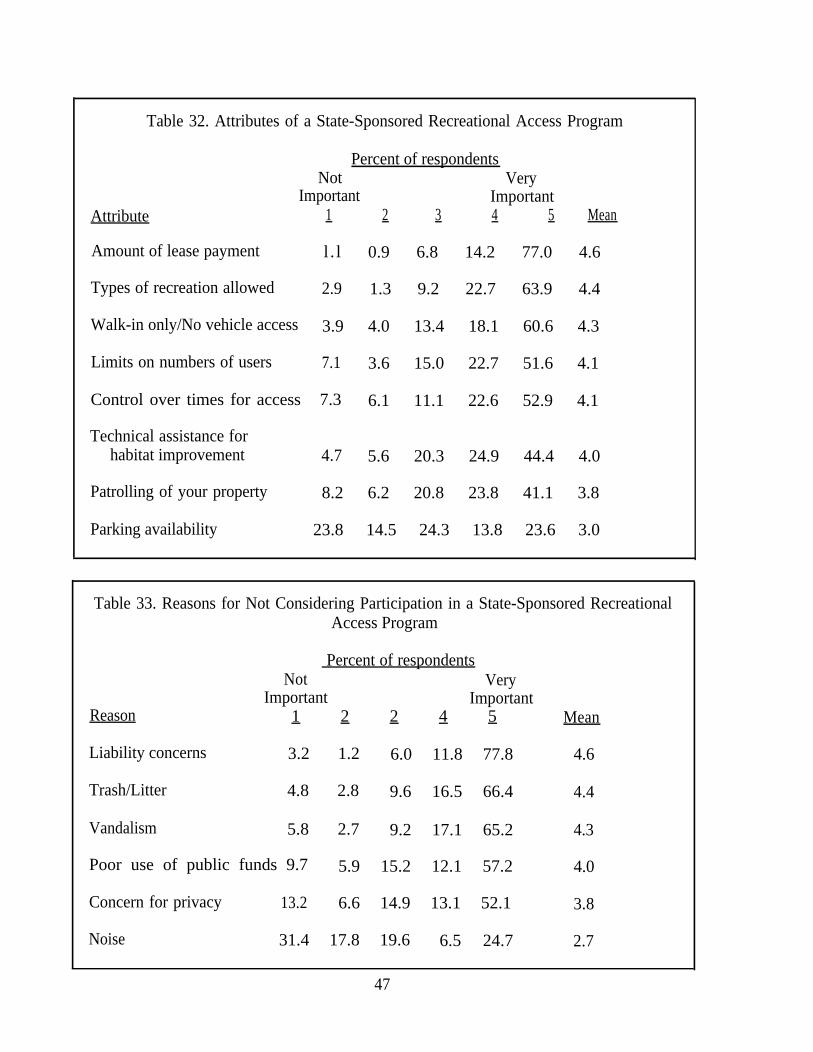
Table 32. Attributes of a State-Sponsored Recreational Access Program
Percent of respondentsNot Very
Important ImportantAttribute 1 2 3 4 5 Mean
Amount of lease payment l . l 0.9 6.8 14.2 77.0 4.6
Types of recreation allowed 2.9 1.3 9.2 22.7 63.9 4.4
Walk-in only/No vehicle access 3.9 4.0 13.4 18.1 60.6 4.3
Limits on numbers of users 7.1 3.6 15.0 22.7 51.6 4.1
Control over times for access 7.3 6.1 11.1 22.6 52.9 4.1
Technical assistance forhabitat improvement 4.7 5.6 20.3 24.9 44.4 4.0
Patrolling of your property 8.2 6.2 20.8 23.8 41.1 3.8
Parking availability 23.8 14.5 24.3 13.8 23.6 3.0
Table 33. Reasons for Not Considering Participation in a State-Sponsored RecreationalAccess Program
Percent of respondentsNot Very
Important ImportantReason 1 2 2 4 5 Mean
Liability concerns 3.2 1.2 6.0 11.8 77.8 4.6
Trash/Litter 4.8 2.8 9.6 16.5 66.4 4.4
Vandalism 5.8 2.7 9.2 17.1 65.2 4.3
Poor use of public funds 9.7 5.9 15.2 12.1 57.2 4.0
Concern for privacy 13.2 6.6 14.9 13.1 52.1 3.8
Noise 31.4 17.8 19.6 6.5 24.7 2.7
47
APPENDIX - QUESTIONNAIRE
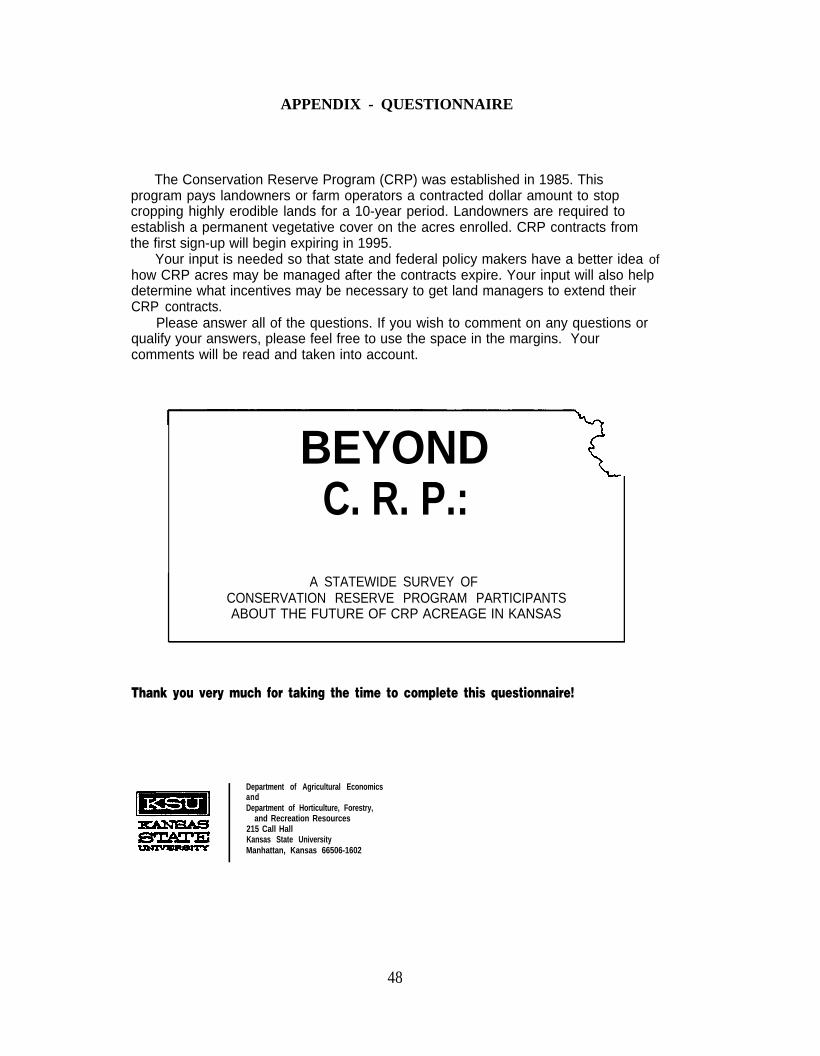
The Conservation Reserve Program (CRP) was established in 1985. Thisprogram pays landowners or farm operators a contracted dollar amount to stopcropping highly erodible lands for a 10-year period. Landowners are required toestablish a permanent vegetative cover on the acres enrolled. CRP contracts fromthe first sign-up will begin expiring in 1995.
Your input is needed so that state and federal policy makers have a better idea ofhow CRP acres may be managed after the contracts expire. Your input will also helpdetermine what incentives may be necessary to get land managers to extend theirCRP contracts.
Please answer all of the questions. If you wish to comment on any questions orqualify your answers, please feel free to use the space in the margins. Yourcomments will be read and taken into account.
BEYONDC. R. P.:
A STATEWIDE SURVEY OFCONSERVATION RESERVE PROGRAM PARTICIPANTSABOUT THE FUTURE OF CRP ACREAGE IN KANSAS
Thank you very much for taking the time to complete this questionnaire!
Department of Agricultural EconomicsandDepartment of Horticulture, Forestry,
and Recreation Resources215 Call HallKansas State UniversityManhattan, Kansas 66506-1602
48
The following questions ask about acres under a specific CRP contract with ASCS.The contract number is listed on the mailing label and in the cover letteraccompanying this questionnaire. Please answer the following questions in relation tothe acres covered by that particular contract.
1. When this CRP contract ends, who will decide how the land under contract willbe used? (Check one.)
I WILL DECIDE --- GO TO QUESTION 3.ANOTHER PERSON WILL DECIDE --- GO TO QUESTION 2UNCERTAIN --- GO TO QUESTION 3.
2. Could we please have the name and address of the person who you anticipatewill decide how this land now under CRP contract will be used after the contractexpires?NAME
ADDRESS
Please place this questionnaire in the return envelope and send itback to us. Thank you for your time and information.
SECTION A. Your CRP Contract
3. Please rate the importance of each of the following in your decision to enrollthese particular acres in CRP? (Circle one number for each item.)
a.
b.
c.
d.
e.
f.
g.h.
i.
NOT VERYIMPORTANT-——-- - - - - - - - - - . - - - - IMPORTANT
Able to retire/semi-retire. 1 2 3 4 5Able to reduce labor/increase timefor other activities. 1 2 3 4 5Concern for soil erosion. 1 2 3 4 5Most profitable use of land. 1 2 3 4 5Easiest way to meet conservationcompliance. 1 2 3 4 5Low risk associated with payments. 1 2 3 4 5Provide wildlife habitat. 1 2 3 4 5Made tree planting affordable. 1 2 3 4 5Other: please specify
4.
5.
6.
What improvements are currently on this CRP land? (Check all that apply to thiscontract.)
WATERWAYS LIVESTOCK WATER SOURCES
TERRACES LIVESTOCK HANDLING FACILITIES
FENCES OTHER: please specify
Which of the following management practices have you applied to these CRPacres in the past 2-3 years? (Check all that apply to this contract).
NO ACTIVE MANAGEMENT
PRESCRIBED BURNING
MOWING
WEED CONTROL
OTHER: please specify
Please indicate what you plan to do with the CRP acres in this contract when itexpires. (Fill in the number of acres for each response that applies to thisparticular contract.)
a.b.
c.
d.
e.
f.
gh.
i.
j.k.
No plans/uncertain.
Return to annual crop production underconservation compliance provisions.
Return to annual crop production withoutconservation compliance provisions.
Keep in grass for erosion control.
Keep in grass for hay production.
Keep in grass for livestock grazing.
Keep in trees for erosion control.
Keep in trees for timber production.
Keep in grass and/or trees for wildlifehabitat.
Sell the land.
Other: please specify
ACRES
ACRES
ACRES
ACRES
ACRES
ACRES
ACRES
ACRES
ACRES
ACRES
ACRES1 2 3 4 5
1 2
7. Do you plan to return some acres to crop production under conservationcompliance provisions? (Check one.)
YESNO --- GO TO QUESTION 8.
please estimate the number of acres requiring the construction orimplementation of the following: (Fill in the number of acres for eachresponse that applies to this particular contract.)
a.
b.
c.
d.
e.
f.
g.h.
i.
j.
Uncertain
No conservation practices/structures required
Waterways
Terraces
Contour without terraces
Conservation tillage or residue management
No-till
Ridge-till
Crop rotations that include grassor legume pasture
Other: please specify
ACRES
ACRES
ACRES
ACRES
ACRES
ACRES
ACRES
ACRES
ACRES
ACRES
8. Do you plan to return some acres to grazing? (Check one.)
YES
NO --- GO TO QUESTlON 9.
please estimate the number of acres requiring the construction of thefollowing: (Fill in the number of acres for each response that applies to thisparticular contract.)
a. Uncertain
b. No construction required
c. Fencing
d. Livestock water development
e. Livestock handling facilities
f. Other: please specify
3
ACRES
ACRES
ACRES
ACRES
ACRES
ACRES
9. Many considerations will likely influence what you do with your CRP acres oncethe 10-year contract expires. Please rate each of the following factors accordingto its importance to you. (Circle one number per item.)
a.
b.
c.
d.
e.
f.
g.
h.
i .
Market prices for crops/livestockthat could be produced on theCRP acres after the contractexpires.
Government price supports for cropsthat could be grown on the CRPacres after the contract expires.
Cost of soil conservation practicesthat may be required before CRPacres can be returned toproduction.
Availability of cost-sharing for soilconservation practices that maybe required before CRP acres canbe returned to annual crop production.
Availability of cost-sharing for fencingand livestock water development thatmay be required before CRP acrescan be returned to livestock grazing.
Availability of cost-sharing forestablishing or improvingwildlife habitat.
Expected costs of planting, growing,and harvesting crops thatcould be grown on the CRP acresafter the contract expires.
Expected price the land will sell forafter the CRP contract expires.
Other: please specify
NOT VERYIMPORTANT------------------------IMPORTANT
1
1
1
1
1
1
1
1
1
2
2
2
2
2
2
2
2
2
3
3
3
3
3
3
3
3
3
4
4
4
4
4
4
4
4
4
5
5
5
5
5
5
5
5
5

10. IF crop prices and government commodity payments remain at 1991-92 levels,would you extend your CRP contract for 5 additional years? (Check one.)
YES
NO --- GO TO QUESTION 11.
What annual rental payment per acre would you require to extend yourcurrent CRP contract for an additional 5 years? (Fill in the number.)
$ /ACRE/YEAR
11. IF crop prices and government commodity payments remain at 1991-92 levels,would you extend your CRP contract for 10 additional years? (Check one.)
YES
NO ---GO TO QUESTION 12
What annual rental payment per acre would you require to extend yourcurrent CRP contract for an additional 10 years? (Fill in the number.)
$ /ACRE/YEAR
12. What crop was planted on the CRP land during the growing season prior to itbeing enrolled in CRP? (Check all that apply.)
NONE B A R L E Y _____ SOYBEANS
WHEAT _____ OATS _____ GRASSCORN COTTON _____ ALFALFA
_____ SORGHUM _____ TOBACCO _____ OTHER: please specify _
14.
15.
13. In which of the following USDA commodity programs do you currently participate?(Check all that apply.)
NONE SOYBEANS
WHEAT BARLEY
——–- CORN _____ OATS
SORGHUM
COTTON
TOBACCOOTHER: please specify _
The commodity base acres (wheat, feed grain, etc.) on land you enrolled in theCRP are protected for the 10-year period covered by the contract. Would you bewilling to keep your CRP acres in permanent vegetative cover after the contractexpires, without an annual rental payment, if those acres continued to beprotected as commodity base acres and could be used for annual set-asiderequirements? (Check one.)
YES
NO
UNCERTAIN
What annual rental payment would you require to extend your current CRPcontract for an additional 5 years,
a.
b.
c.
d.
e.
f.
g.
IF you could graze your CRP land at alevel less than that at which you grazesimilar grassland?
IF you could hay your CRP land at a levelless than that at which you hay similargrassland?
IF you could graze your CRP land onlyafter mid-July when most wildlife specieshave finished nesting?
IF you could hay your CRP land only aftermid-July when most wildlife species havefinished nesting?
IF you could graze your CRP land onlyuntil mid-July, and then had to remove thelivestock until spring to allow adequatewildlife cover to develop late in thegrowing season?
IF you could hay your CRP land only untilmid-July, and then had to quit haying untilspring to allow adequate wildlife cover todevelop late in the growing season?
IF you could harvest grass seed fromyour CRP land?
$ /ACRE/YEAR
$ /ACRE/YEAR
$ /ACRE/YEAR
$ /ACRE/YEAR
$ /ACRE/YEAR
$ /ACRE/YEAR
$ /ACRE/YEAR
5 6
IMPORTANT!The following questions relate to your participation in CRP in general, not to thespecific CRP contract listed on the mailing label and in the letter.
SECTION B. CRP in General
16. a.
b.
c.
How many acres of land for which you are the decision maker were eligiblefor CRP? (Fill in number.)
ACRES
How many total acres did you enroll in all your CRP contracts? (Fill innumber.)
ACRES
How many of the total acres in all your CRP contracts are highly erodible?(Fill in number.)
ACRES
How many CRP contracts do you have on all lands that you manage? (Fill innumber.)
CRP CONTRACTS
17. Please rate the importance of each of the following reasons in your decision notto enroll some eligible land in CRP. (Circle one number for each item.)
a.b.
c.
d.
e.
f.
g.
NOT VERYIMPORTANT-----------------------------IMPORTANT
Needed crops for livestock feed. 1 2 3 4 5
Better able to utilize my laborand/or equipment. 1 2 3 4 5
Needed to keep family member ortenant in farming. 1 2 3 4 5Crop production was more profitablethan receiving CRP payments. 1 2 3 4 5Profits from haying/grazinghigher than CRP payments. 1 2 3 4 5Potential for increased crop prices. 1 2 3 4 5Other: please specify
1 2 3 4 5
18. How satisfied are you with your past decision to enroll land in the CRP? (Circleone number.)
VERY VERYDISSATISFIED DISSATISFIED NEUTRAL SATISFIED SATISFIED
1 2 3 4 5
SECTION C. CRP, Wildlife, and Recreation
19.
20.
21.
Is helping wildlife an important consideration in your choice of farming practices?(Check one.)
NO
a.
b.
c.
Which of the following wildlife species have increased on your farm due toenrollment in CRP? (Check all that apply.)
DEER PRAIRIE CHICKEN COYOTEPHEASANT TURKEY WILDLIFE INQUAIL RABBIT GENERAL
DOVE SQUIRREL ——— OTHER: please
SONGBIRDS specify
Have any of the increases checked above been undesirable?
YES: list speciesNO
What is your opinion regarding the following statement: Enrollment in CRPhas increased the number of different kinds of wildlife on my farm. (Circle onenumber.)
STRONGLY STRONGLYDISAGREE DtSAGREE NEUTRAL AGREE AGREE
1 2 3 4 5
After your CRP contracts expire, would you be willing to change some of thevegetative cover now on your CRP acres to increase wildlife if 50% cost-sharingfunds were available? (Check one.)
YESNOUNCERTAIN
7 8
22.
23.
For each of the following groups of people, please indicate whether you allowrecreational access to your CRP acres and estimate how many people from eachgroup use your CRP acres during an average year.
Check if you allow access to Estimate number of
FRIENDS/NEIGHBORS
IMMEDIATE FAMILY
EXTENDED FAMILY
LESSEES
ANYONE WHO ASKS PERMISSION
ANYONE
NO ONE
OTHER: please specify
people per year:
N/A
Which of the following activities do you allow on your CRP acres? Check all thatapply. If you allow an activity and lease or charge for it, please fill in the amountthat you charge. If you do not charge for the activity write "O" for the price.
NONE
HUNTING $
(price)(circle one) (circle one)
OTHERRECREATION $
(price)(circle one) (circle one)
9
24.
25.
IF you do not allow recreational access to anyone, please rate the importance ofthe following reasons in your decision not to allow access to your CRP land?(Circle one number for each item.)
NOT VERY
IMPORTANT ----------------------------------IMPORTANT
a. Trespassing 1 2 3 4 5
b. Noise 1 2 3 4 5
c. Litter/Trash 1 2 3 4 5
d. Vandalism 1 2 3 4 5
e. Liability concerns 1 2 3 4 5
f. Retain privacy 1 2 3 4 5
g. Other: please specify
1 2 3 4 5
Recreational access programs pay landowners a contracted amount to allowmembers of the general public to recreate on their land. If the state providedmoney for a program to allow recreational access to your CRP acres would youconsider participating? (Check one.)
YES --- GO TO QUESTION 26.
——–- NO
IF you would not consider participating in a state-sponsored recreationalaccess program to your CRP acres, please rate the importance of thefollowing reasons in your decision not to participate: (Circle one number foreach item.)
a.
b.
c.
d.
e.
f .
g.
NOT VERY
lMPORTANT---- ----------------------IMPORTANT
Vandalism 1 2 3 4 5Trash/litter 1 2 3 4 5Liability concerns 1 2 3 4 5Noise 1 2 3 4 5Concern for privacy 1 2 3 4 5
Poor use of public funds 1 2 3 4 5
Other: please specify
1 2 3 4 5
GO TO QUESTION 27.
10

26. a. IF you would consider participating in a state sponsored recreational accessprogram to your CRP acres, please rate the importance of the followingattributes of a program in your decision whether or not to participate: (Circleone number for each item.)
1.
2.
3.
4.
5.
6.
7.
8.
9.
Amount of lease payment
Types of recreation allowed
Walk-in only/No vehicle access
Parking availability
Limits on the number of users
Control over times for access
Patrolling of your property
Technical assistance forhabitat improvement
Other: please specify
NOT VERY
IMPORTANT-------------------------IMPORTANT
1 2 3 4 5
1 2 3 4 5
1 2 3 4 5
1 2 3 4 5
1 2 3 4 5
1 2 3 4 5
1 2 3 4 5
1 2 3 4 5
1 2 3 4 5
b. What annual payment per acre would you require to participate in a statesponsored recreational access program on your CRP acres?
$ /ACRE/YEAR
SECTION D. General Characteristics
The folIowing questions will help us learn more about CRP participants in Kansas.All of your answers are strictly confidential and cannot be associatedwith you personally.
27. Are you a Kansas resident? (Check one.)
YES
NO
28.
29.
30.
31.
32.
Which of the following best describes your legal relationship to the CRP acrescovered by the contract specified in the letter accompanying your questionnaire?(Check one.)
OWNER AND OPERATOR
RENTER AND OPERATOR
OWNER BUT NON-OPERATOR (ABSENTEE LANDOWNER)
OTHER: PLEASE SPECIFY
What is the total number of acres that you manage? (Fill in number.)
ACRES
What is your gender? (Check one.)
FEMALE
MALE
What is your age? (Fill in number.)
YEARS
IF you are 65 years old or older,
a.
b.
How many more years do you plan to continue farming? (Fill in number.)
YEARS
Which of the following best describes what will happen to your land when youretire? (Check one.)
I WILL SELL THE LAND
I WILL LEASE OUT THE LAND, BUT WILL CONTINUE TO MAKEMANAGEMENT DECISIONS ABOUT THE LAND
I WILL LEASE OUT THE LAND, AND NOT MAKE ANY MANAGEMENTDECISIONS ABOUT THE LAND
A RELATIVE WILL MANAGE/INHERIT THE LAND
OTHER: PLEASE SPECIFY
11 12

33. What is the highest level of education you have obtained? (Check one.)
SOME ELEMENTARY VOCATIONAL OR TECHNICALSCHOOL SCHOOLSOME HIGH SCHOOL BACHELORS DEGREEHIGH SCHOOL DIPLOMA GRADUATE DEGREESOME COLLEGE OR POSTHIGH SCHOOL
34. Which of the following best describes your total annual income from agriculturalsources? (Check one.)
LESS THAN $10,000 $30,000-$49,000$10,000-$19,999 $50,000-$74,999$20,000-$24,999 $75,000 or more
_____ $25,000-$29,999
35. Which of the following best describes your total annual income from non-agricultural sources? (Check one.)
LESS THAN $10,000 $30,000-$49,000$10,000-$19,999 $50,000-$74,999$20,000-$24,999 $75,000 or more
_____ $25,000-$29,999
36. Which of the following best describes your total annual income from all sources?(Check one.)
LESS THAN $10,000_____ . $30,000-$49,000$10,000-$19,999 $50,000-$74,999$20,000-$24,999 _____ $75,000 or more
_____ $25,000-$29,999
37. Which of the following best describes the value of your farm’s land andbuildings? (Check one.)
LESS THAN $40,000 $150,000-$199,999$40,000-$69,999 $200,000-$499,999$70,000-$99,999 $500,000-$999,999$100,000-$149,999 $1,000,000 or more
38. Which of the following best describes the value of your farm’s machinery andequipment? (Check one.)
LESS THAN $10,000 $100,000-$199,999$10,000-$29,999 $200,000-$499,999$30,000-$49,999 $500,000-$999,999$50,000-$99,999 _____ $1,000,000 or more
39. What percent of your farm assets are owned, debt free?
PERCENT
13 14

Is there is anything else you would like to tell us about the CRP or this survey? If so,please use this space for that purpose.
Your contribution to this effort is greatly appreciated. If you would like a summary ofthe results, please print your name, address, and "Results Requested" on the back ofthe return envelope (NOT on the questionnaire so that we can assure youranonymity). We will see that you get it.
THANK YOU!
56

Agricultural Experiment Station, Kansas State University, Manhattan 66506-4008Report of Progress 690 Reprint November 1993Kansas State University is committed to a policy of non-discrimination on the basis of race, sex, national origin, disability, religion, age, sexual orientation, or other non-merit reasons, inadmissions, educational programs or activities, and employment all as required by applicable laws and regulations. Responsibility for coordination of compliance efforts and receipt of inquiries,including those concerning Title IX of the Education Amendments of 1972 and section 5504 of the Rehabilitation Act of 1973, and the Americana with Disabilities Act, has been delegatedto Jane D. Rowlett, Ph. D., Director, Unclassified Affairs and University Compliance, 214 Anderson Hall, Kansas State University, Manhattan, KS 66506-0124 (913/532.4392). 5M