stad03
DESCRIPTION
Omega Research System Trading andDevelopment ClubTRANSCRIPT

Information in this document is subject to change without notice.
THE TRADING SYSTEMS IN THIS BOOK ARE EXAMPLES ONLY, AND HAVE BEEN INCLUDED SOLELY FOR EDUCATIONAL PURPOSES. OMEGA RESEARCH DOES NOT RECOMMEND THAT YOU USE ANY SUCH TRADING SYSTEM, AS THE USE OF ANY SUCH TRADING SYSTEM DOES NOT GUARANTEE THAT YOU WILL MAKE PROFITS, INCREASE PROFITS, OR MINIMIZE LOSSES. THE SOLE INTENDED USES OF THE TRADING SYSTEMS INCLUDED IN THIS BOOK ARE TO DEMONSTRATE THE WAYS IN WHICH EASYLANGUAGE CAN BE USED TO DESIGN PERSONAL TRADING SYSTEMS AND TO SHOW SOME EXAMPLES OF HOW CERTAIN POPULAR, WELL-KNOWN TRADING STRATEGIES MAY BE INCORPORATED INTO PERSONAL TRADING SYSTEMS. OMEGA RESEARCH, INC. IS NOT ENGAGED IN RENDERING ANY INVESTMENT OR OTHER PROFESSIONAL ADVICE. IF INVESTMENT OR OTHER PROFESSIONAL ADVICE IS REQUIRED, THE SERVICES OF A COMPETENT PROFESSIONAL SHOULD BE SOUGHT.
Copyright © 1998 Omega Research Inc.
All rights reserved. No part of this publication may be reproduced, stored in a retrieval system, or transmitted in any form or by any means, electronic, mechanical, photocopying, recording, or otherwise, without prior written permission of Omega Research, Inc. Printed in the United States of America.
TradeStation® and SuperCharts® are registered trademarks of Omega Research, Inc. EasyLanguage, Portfolio Maximizer, PaintBar and ShowMe are trademarks of Omega Research, Inc. Microsoft is a registered trademark of Microsoft Corporation and MS-DOS, Windows, and Excel are trademarks of Microsoft Corporation. DBC Signal and BMI are trademarks of Data Broadcasting Corp. Price data supplied courtesy of Global Market Information, Inc.

/4:85*;):/54úììììììììììììììììììììììììììììììììììììììììììììììììììììììììììììììììììììììììììììììììììììììììììììììììììììììììììììììììììììììììììììììììì è)UTZKTZYúGZúGú-RGTIKúììììììììììììììììììììììììììììììììììììììììììììììììììììììììììììììììììììììììììììììììììììììììììììììììììììììììììììììììììììììììììììììììììììììììììììììììììììììììì è
'JJOZOUTGRú+J[IGZOUTGRú9KX\OIKYúìììììììììììììììììììììììììììììììììììììììììììììììììììììììììììììììììììììììììììììììììììììììììììììììììììììììììììììììììììììììììììììììììììììì è
Video Courses ................................................................................................................................................ 2
Workshops ...................................................................................................................................................... 3
EasyLanguage Resource Center ..................................................................................................................... 3
-KZZOTMú9ZGXZKJú ìììììììììììììììììììììììììììììììììììììììììììììììììììììììììììììììììììììììììììììììììììììììììììììììììììììììììììììììììììììììììììììììììììììììììììììììììììììììììììììììììì ç
5HZGOTOTMú:KINTOIGRú9[VVUXZú ììììììììììììììììììììììììììììììììììììììììììììììììììììììììììììììììììììììììììììììììììììììììììììììììììììììììììììììììììììììììììììììììììììììììììì æ
EasyLanguage Support Department ............................................................................................................... 4
STAD Club E-Mail Address .......................................................................................................................... 4
).'6:+8úé ú-KTKXGRú9_YZKSú*K\KRUVSKTZú)UTIKVZYúìììììììììììììììììììììììììììììììììììììììììììììììììììììììììììììììììì å;TJKXYZGTJOTMúZNKú9_YZKSú8KVUXZú ìììììììììììììììììììììììììììììììììììììììììììììììììììììììììììììììììììììììììììììììììììììììììììììììììììììììììììììììììììììììììììììììììì ä
;YOTMúZNKú9_YZKSú+W[OZ_ú)[X\K ìììììììììììììììììììììììììììììììììììììììììììììììììììììììììììììììììììììììììììììììììììììììììììììììììììììììììììììììììììììììììììììììììììììììì â
;YOTMú6UXZLUROUú3G^OSO`KXúLUXú:XGJK9ZGZOUT ìììììììììììììììììììììììììììììììììììììììììììììììììììììììììììììììììììììììììììììììììììììììììììììììììììììììììììììììììììì á
).'6:+8úè úú:XKTJOTMú9_YZKSYúìììììììììììììììììììììììììììììììììììììììììììììììììììììììììììììììììììììììììììììììììììììììììììììììììììì éé([_ú*OVYë9KRRú8GRROKYúììììììììììììììììììììììììììììììììììììììììììììììììììììììììììììììììììììììììììììììììììììììììììììììììììììììììììììììììììììììììììììììììììììììììììììììììììììììì éæ
Defining your Trading Rules ........................................................................................................................ 16
Designing & Formatting ............................................................................................................................... 16
Testing & Improving .................................................................................................................................... 20
([RROYNúôú(KGXOYNú+TM[RLOTMú6GZZKXTYúìììììììììììììììììììììììììììììììììììììììììììììììììììììììììììììììììììììììììììììììììììììììììììììììììììììììììììììììììììììììììììì èé
Defining your Trading Rules ........................................................................................................................ 23
Designing & Formatting ............................................................................................................................... 24
Testing & Improving .................................................................................................................................... 27
)UTZKTZY
OOúúúúúúúúúú)UTZKTZY
5VKTúíú)RUYKú.OYZUMXGSú ììììììììììììììììììììììììììììììììììììììììììììììììììììììììììììììììììììììììììììììììììììììììììììììììììììììììììììììììììììììììììììììììììììììììììììììììììèâ
Defining your Trading Rules ........................................................................................................................29
Designing & Formatting ...............................................................................................................................30
Testing and Improving ..................................................................................................................................32
).'6:+8úç ú9[VVUXZúôú8KYOYZGTIKú9_YZKSYìììììììììììììììììììììììììììììììììììììììììììììììììììììììììììììììììììììììììììììììì çå(URROTMKXú(GTJYú ìììììììììììììììììììììììììììììììììììììììììììììììììììììììììììììììììììììììììììììììììììììììììììììììììììììììììììììììììììììììììììììììììììììììììììììììììììììììììììììììçä
Defining your Trading Rules ........................................................................................................................37
Designing & Formatting ...............................................................................................................................38
Testing & Improving ....................................................................................................................................41
5Tú(GRGTIKú:X[Kú8GTMKúìììììììììììììììììììììììììììììììììììììììììììììììììììììììììììììììììììììììììììììììììììììììììììììììììììììììììììììììììììììììììììììììììììììììììììììììììììæç
Defining your Trading Rules ........................................................................................................................43
Designing & Formatting ...............................................................................................................................44
Testing & Improving ....................................................................................................................................46
3OIXUí3úôú3OIXUí=ú,UXSGZOUTYú ììììììììììììììììììììììììììììììììììììììììììììììììììììììììììììììììììììììììììììììììììììììììììììììììììììììììììììììììììììììììììììììììììììììæã
Defining your Trading Rules ........................................................................................................................48
Designing & Formatting ...............................................................................................................................49
Testing & Improving ....................................................................................................................................56
<GXOGHRKú@UTKYú ìììììììììììììììììììììììììììììììììììììììììììììììììììììììììììììììììììììììììììììììììììììììììììììììììììììììììììììììììììììììììììììììììììììììììììììììììììììììììììììììììåâ
Defining your Trading Rules ........................................................................................................................61
Designing & Formatting ...............................................................................................................................61
Testing & Improving ....................................................................................................................................64
).'6:+8úæ ú<URGZOROZ_ú9_YZKSY ìììììììììììììììììììììììììììììììììììììììììììììììììììììììììììììììììììììììììììììììììììììììììììììììììììììì åã/TYOJKú*G_ú(XKGQU[Zú,GOR[XKúììììììììììììììììììììììììììììììììììììììììììììììììììììììììììììììììììììììììììììììììììììììììììììììììììììììììììììììììììììììììììììììììììììììììììììåâ
Defining your Trading Rules ........................................................................................................................59
Designing & Formatting ...............................................................................................................................59
Testing & Improving ....................................................................................................................................62
9ZGTJGXJú*K\OGZOUTúíú<URGZOROZ_ ìììììììììììììììììììììììììììììììììììììììììììììììììììììììììììììììììììììììììììììììììììììììììììììììììììììììììììììììììììììììììììììììììììììììììäè
Defining your Trading Rules ........................................................................................................................64
Designing & Formatting ...............................................................................................................................64
Testing & Improving ....................................................................................................................................67
<URGZOROZ_ú)R[YZKXYúìììììììììììììììììììììììììììììììììììììììììììììììììììììììììììììììììììììììììììììììììììììììììììììììììììììììììììììììììììììììììììììììììììììììììììììììììììììììììììììäâ
Defining your Trading Rules ........................................................................................................................70
Designing & Formatting ...............................................................................................................................70
Testing & Improving ....................................................................................................................................74
'66+4*/>ú' ú<UR[SKúOTú8K\OK]ììììììììììììììììììììììììììììììììììììììììììììììììììììììììììììììììììììììììììììììììììììììììììììììììììììì ãá-KTKXGRú)USSKTZYú ììììììììììììììììììììììììììììììììììììììììììììììììììììììììììììììììììììììììììììììììììììììììììììììììììììììììììììììììììììììììììììììììììììììììììììììììììììììììììâæ
-KTKXGRú,KKJHGIQú ììììììììììììììììììììììììììììììììììììììììììììììììììììììììììììììììììììììììììììììììììììììììììììììììììììììììììììììììììììììììììììììììììììììììììììììììììììììììììììâæ
5VKTOTMú-GVú9_YZKSúìììììììììììììììììììììììììììììììììììììììììììììììììììììììììììììììììììììììììììììììììììììììììììììììììììììììììììììììììììììììììììììììììììììììììììììììììììììììâæ

I N T R O D U C T I O N
=KRIUSKúZUú<UR[SKúç
Welcome to Volume 3 of the Omega Research System Trading and Development Club, the newest learning tool offered by Omega Research to help you make the most of your trading potential.
This third volume of the Omega Research System Trading and Development Club contains 10 new systems we’ve created to help you get started developing your own systems. I t also includes a new appendix, Appendix A, ti t led, “Volume in Review,” which contains feedback on and corrections, when necessary, to the previous volume, which in this case is Volume 2. Those wanting additional discussion on the systems wil l benefit from this appendix.
The systems presented in this volume incorporate popular concepts such as Boll inger Bands, volati l i ty, key reversals, DMI and variable zones. We identify the most common problems with these types of systems and provide techniques to overcome them as well as present dif ferent ways of using them. By reviewing and testing these 10 systems, you’l l be able to understand these techniques and use them, or a variation of them, in your own systems.
This book walks you step-by-step through the process we went through to develop these systems, from coming up with a feasible trading idea, to writing down your trading rules, to writ ing them in EasyLanguage, to taking into consideration money management and risk control factors. Our goal is for you to understand why we wrote these systems the way we did.

èúúúúúúúúúúúúúúúúúúúú 5SKMGú8KYKGXINú9_YZKSú:XGJOTMúGTJú*K\KRUVSKTZú)R[Húíú<UR[SKúç
We recommend you study the EasyLanguage techniques we used, look at the System Report, read about the factors we took into account to deem that a system may have merit, and think about how you can combine some of these popular ideas with your own to develop a system you want to trade.
IMPORTANT NOTICE: The trading systems in this book are examples only, and have been included solely for educational purposes. Omega Research does not recommend that you use any such trading system, as the use of any such trading system does not guarantee that you will make profits, increase profits, or minimize losses. The sole intended uses of the trading systems included in this book are to demonstrate the ways in which EasyLanguage can be used to design personal trading systems and to show some examples of how certain popular, well-known trading strategies may be incorporated into personal trading systems.
This book begins by discussing some of the broader concepts of system development before moving on to the description of each system. We grouped the different types of systems together. The contents are:
� Chapter 1: General System Development Concepts
� Chapter 2: Trending Systems
� Chapter 3: Support & Resistance Systems
� Chapter 4: Volatility Breakout Systems
� Appendix A: Volume in Review
� Index
IMPORTANT NOTE: We suggest you read the book from front to back because there is instructional material in each section and it is not repeated throughout.
Omega Research is committed to enhancing individual trading potential through quality education. To learn more about system trading, an Omega Research product, or EasyLanguage, visit our web site at www.omegaresearch.com or call (800) 439-7995 (outside US 305-551-9991) and ask about the following educational services:
<OJKUú)U[XYKYWe offer a comprehensive video course, called Becoming Fluent in EasyLanguage. This course introduces you to EasyLanguage, starting with the very basics and taking you through writing actual trading systems. It includes a follow-along workbook that contains exercises and real-life examples and applications.
Once you finish this course, you’ll be able to write your own indicators, ShowMe and PaintBar studies, and trading systems. This course is perfect for those who want to learn EasyLanguage at their own pace. See for yourself—call now to place a risk-free order.
=UXQYNUVYOmega Research offers a variety of workshops on the products and technical analysis. Workshops are an excellent way to learn how to use the products, learn about technical analysis and system trading and/or EasyLanguage. Spend a day with a Product Training Specialist and exchange ideas with other users like yourself. All workshops provide a 100% satisfaction guarantee. Call now for more information or to register—space is limited!
)UTZKTZYúGZúGú-RGTIK
'JJOZOUTGRú+J[IGZOUTGRú9KX\OIKY
/TZXUJ[IZOUT úúúúúúúúúúç
+GY_2GTM[GMKú8KYU[XIKú)KTZKXOne of the best ways to learn is by example, and the EasyLanguage Resource Center on our web site is an excellent source of examples. In this Resource Center, we list all the analysis techniques—indicators and trading systems—published in the Technical Analysis of Stocks and Commodities magazine, as well as popular analysis techniques worth taking a look at. Access to this Resource Center is free of charge. Feel free to download and review any of the analysis techniques and their descriptions. Our web site address is www.omegaresearch.com.
To begin reviewing your systems, transfer the analysis techniques into your TradeStation library and then apply the system you want to review to a chart. Use the System Report to view the system results and take a look at the EasyLanguage instructions by opening the system in the PowerEditor.
To transfer the analysis techniques into TradeStation:
1. Place the System Trading and Development Club CD in the CD-ROM drive.
2. Start the PowerEditor. In Windows 95, click Start, choose Programs, choose Omega Research and choose TradeStation PowerEditor. In Windows 3.x, choose TradeStation PowerEditor from the Omega Research program group.
3. In the PowerEditor, use the File - Open menu sequence.
4. Click Transfer.
5. Select the Transfer analysis techniques FROM EasyLanguage Archive File option and click OK .
6. Click Scan.
7. In the Enter drive letter to scan edit box, enter the drive letter for your CD-ROM drive (normally D), and click OK . The ELA file on the CD is placed in the list.
8. Choose MAYJUN98.ELA from the list and click OK .
9. In the Transfer dialog box, select Transfer All and click OK .
10. Once the files are transferred and verified, a dialog box appears informing you that the transfer was performed successfully. Click OK .
For your convenience, the names of the systems in this volume all begin with STAD3. You can now open the systems in the PowerEditor and view the EasyLanguage instructions and/or apply them to a chart in TradeStation. You can remove your CD from the CD-ROM drive and store it in a safe place. As you apply the systems and work with them, refer to this book for detailed explanations of the systems and the EasyLanguage used to create them. For instructions on applying systems and viewing the System Report, please refer to your TradeStation User’s Manual.
Note to SuperCharts 4 Users: To transfer the systems into SuperCharts, use the Tools - QuickEditor menu sequence and select Transfer. Keep in mind, however, that although you can apply the systems in SuperCharts, you will not be able to view the EasyLanguage instructions in the QuickEditor. This is because the systems were designed in the PowerEditor. Also, if you are using SuperCharts End of Day, some of the systems will not apply as they are designed for intraday trading. Since the purpose of the Club is to provide you with a learning tool, and viewing the EasyLanguage instructions is an essential part of this learning process, the use of this club for SuperCharts users is limited.
Note to TradeStation or SuperCharts 3.x Users: The systems for the Club were designed using TradeStation 4. As such, some of the features used, such as automatic drawing of trendlines and/or text, are not available in previous versions of TradeStation (or SuperCharts). An effort is made to provide a variety of systems that incorporate both long standing and new features; however, keep in mind that as new features are developed, we will naturally want to showcase and educate users on these features; therefore, users of the most recent version of our software will be able to make the most use of the Club.
-KZZOTMú9ZGXZKJ

æúúúúúúúúúúúúúúúúúúúú 5SKMGú8KYKGXINú9_YZKSú:XGJOTMúGTJú*K\KRUVSKTZú)R[Húíú<UR[SKúç
Depending on your question, there are two resources at your disposal: the EasyLanguage Support Department and the STAD Club E-Mail Address.
+GY_2GTM[GMKú9[VVUXZú*KVGXZSKTZThe EasyLanguage Support Department provides EasyLanguage support via fax and is designed to help you troubleshoot an analysis technique or trading system you are currently working on. For example, if you are incorporating a trading system from the Club into your own and have a question about the implementation, the EasyLanguage Support Department can answer it.
Please keep in mind that while this department can answer any EasyLanguage question, it cannot answer questions about the STAD Club specifically, such as the theory behind a system in the Club, why a system was developed a certain way, or why the system is not performing as you expect it to, etc.
Fax Number:(305) 221-6831
E-Mail Address:[email protected]
Be sure to include the following information in your fax:
� Name � Security Block or Customer ID Number� Telephone Number� Fax Number� Product you own� EasyLanguage instructions you are working on� Detailed description of your problem
Please allow 48 hours for a response.
9:'*ú)R[Hú+í3GORú'JJXKYYAnother resource at your disposal is the STAD Club e-mail address:
Please send any comment, suggestion, or question regarding the systems in the Club to the STAD Club e-mail address, and each subsequent volume we will publish the most common suggestions and questions.
IMPORTANT: When you send a message to this e-mail address, you will not receive a response directly; your message will be reviewed and the answer incorporated into the next volume of the STAD Club, when applicable.
5HZGOTOTMú:KINTOIGRú9[VVUXZ

C H A P T E R 1
-KTKXGRú9_YZKSú*K\KRUVSKTZú)UTIKVZY
Two of the most frequently-asked questions among system developers are, “How do I know if this system is tradable? How can I know if the system will work for me?”
And the reason so many traders keep asking themselves these questions is because there is no straight answer, there is no one number you can look at in the results of a system to answer these questions. There are some numbers that are more important than the others, but there is no one single number. And actually, evaluating a system is a complicated task and you should give it the time and effort it deserves.
The purpose of this chapter is to provide you with some insight into system evaluation and discuss the numbers in TradeStation’s System Report that we think are most important to look at when evaluating trading systems. You need to fully understand a system and its behavior before you should trade it. We also discuss some of the enhanced system testing functionality found in Portfolio Maximizer 4, the portfolio analysis software also available from Omega Research.
The information in this chapter will help you better determine if you can and should trade a particular system.
/Tú:NOYú)NGVZKX
� Understanding the System Report ......6
� Using the System Equity Curve..........8
� Using Portfolio Maximizer for TradeStation9
äúúúúúúúúúú;TJKXYZGTJOTMúZNKú9_YZKSú8KVUXZúúúúúúúúúú 5SKMGú8KYKGXINú9_YZKSú:XGJOTMúGTJú*K\KRUVSKTZú)R[Húíú<UR[SKúç
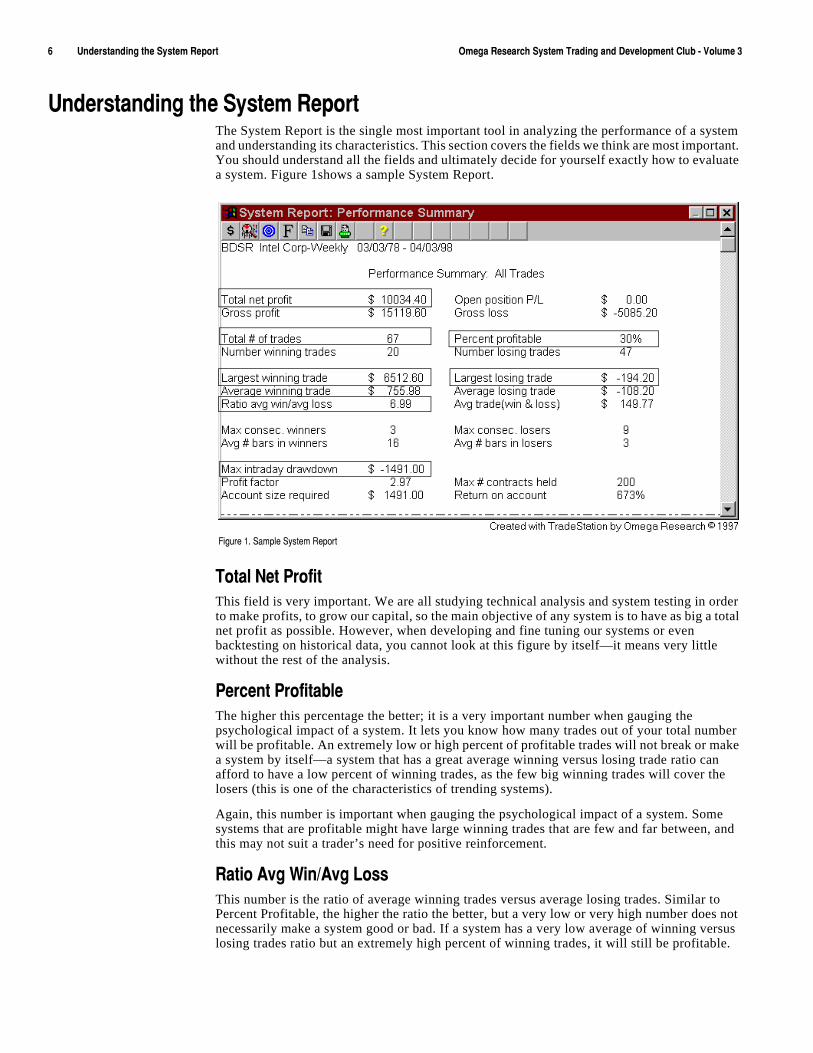
;TJKXYZGTJOTMúZNKú9_YZKSú8KVUXZThe System Report is the single most important tool in analyzing the performance of a system and understanding its characteristics. This section covers the fields we think are most important. You should understand all the fields and ultimately decide for yourself exactly how to evaluate a system. Figure 1shows a sample System Report.
:UZGRú4KZú6XULOZThis field is very important. We are all studying technical analysis and system testing in order to make profits, to grow our capital, so the main objective of any system is to have as big a total net profit as possible. However, when developing and fine tuning our systems or even backtesting on historical data, you cannot look at this figure by itself—it means very little without the rest of the analysis.
6KXIKTZú6XULOZGHRKThe higher this percentage the better; it is a very important number when gauging the psychological impact of a system. It lets you know how many trades out of your total number will be profitable. An extremely low or high percent of profitable trades will not break or make a system by itself—a system that has a great average winning versus losing trade ratio can afford to have a low percent of winning trades, as the few big winning trades will cover the losers (this is one of the characteristics of trending systems).
Again, this number is important when gauging the psychological impact of a system. Some systems that are profitable might have large winning trades that are few and far between, and this may not suit a trader’s need for positive reinforcement.
8GZOUú'\Mú=OTë'\Mú2UYYThis number is the ratio of average winning trades versus average losing trades. Similar to Percent Profitable, the higher the ratio the better, but a very low or very high number does not necessarily make a system good or bad. If a system has a very low average of winning versus losing trades ratio but an extremely high percent of winning trades, it will still be profitable.
,OM[XKúéìú9GSVRKú9_YZKSú8KVUXZ
)NGVZKXúéúúúúúú-KTKXGRú9_YZKSú*K\KRUVSKTZú)UTIKVZY ;TJKXYZGTJOTMúZNKú9_YZKSú8KVUXZúúúúúúúúúã
The many small profitable trades will more than cover the infrequent, but bigger, losing trades (this is one of the characteristics of volatility expansion systems). These last two numbers should always be looked at side by side when studying system results.
3G^OS[Sú/TZXGíJG_ú*XG]JU]TThis number tells you what the maximum equity dip was during the time period represented in the chart. Many traders argue that a system is good if the maximum intra-day drawdown is under 20% of the total net profit, but drawdown, regardless of how small it is, can make a system untradable because of what it represents with respect to the size of the account used to trade the system.
To put it in very simple terms, say you currently have $1,000 in your checking account, and that during the month you will receive $500 in payment and pay out $1,300 in expenses. The payment comes at the middle of the month. Even though your monthly balance is positive, you still may not make it to the end of the month without running out of money. For example, if during the first week of the month you pay $600 in rent, $300 for your car and insurance, and $100 for food, and then you need to pay $20 for gas to start week two, you won’t have the money for gas; your drawdown was $1,020 before you were able to collect the $500.
:UZGRú÷úULú:XGJKYThis number, although many disregard it, represents the cost of the system. A system that is extremely active will require much more attention and follow up (and much more in commissions). If a system that is put on a daily chart going back one year produces 100 trades, it means that it produced a little over two trades per week. This might be too frequent for someone trading part time but too slow for someone trading full time.
2GXMKYZú=OTTOTMú:XGJKúThe largest winning trade should NOT represent a significant percent of the total net profit; the effect of over-optimizing (or curve fitting) your systems is usually expressed as a very large winning trade. You need to be comfortable with the results after removing the largest winning trade from the System Report.
For example, evaluate the total net profit after subtracting from it the largest winning trade and look at the percentage the drawdown represents of the total net profit after taking out the largest winning trade. You always want the largest winning trade to be a number as close as possible to the average winning trade—the closer these two numbers are the more stable the system will prove to be.
This is the rule of thumb for any system, but keep in mind that when you’re dealing with trending systems, which are designed to cash in on the big moves, a few large winning trades will probably make most of the profits.
2GXMKYZú2UYOTMú:XGJKWhile the largest winning trade is the most irrelevant trade, the largest losing trade is the single most important trade of the entire simulation. It invariably points to the weakness of your system. The first step to take when improving any system is to find the largest losing trade and then try to determine why the system did not protect you against this loss, and how you can make the system avoid a trade similar to this one in the future.
You always want the largest losing trade to be a number as close as possible to the average losing trade—the closer these two numbers are the more stable the system will prove to be.
âúúúúúúúúúú;YOTMúZNKú9_YZKSú+W[OZ_ú)[X\Kúúúúúúúúúú 5SKMGú8KYKGXINú9_YZKSú:XGJOTMúGTJú*K\KRUVSKTZú)R[Húíú<UR[SKúç
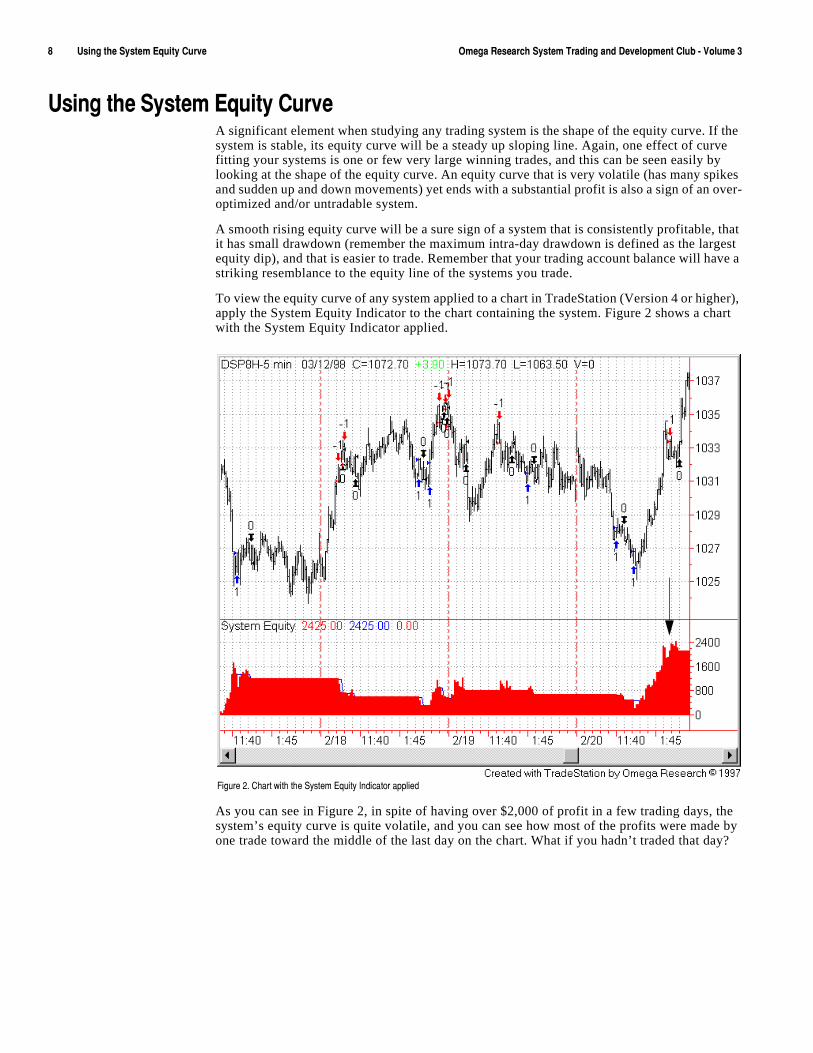
;YOTMúZNKú9_YZKSú+W[OZ_ú)[X\KA significant element when studying any trading system is the shape of the equity curve. If the system is stable, its equity curve will be a steady up sloping line. Again, one effect of curve fitting your systems is one or few very large winning trades, and this can be seen easily by looking at the shape of the equity curve. An equity curve that is very volatile (has many spikes and sudden up and down movements) yet ends with a substantial profit is also a sign of an over-optimized and/or untradable system.
A smooth rising equity curve will be a sure sign of a system that is consistently profitable, that it has small drawdown (remember the maximum intra-day drawdown is defined as the largest equity dip), and that is easier to trade. Remember that your trading account balance will have a striking resemblance to the equity line of the systems you trade.
To view the equity curve of any system applied to a chart in TradeStation (Version 4 or higher), apply the System Equity Indicator to the chart containing the system. Figure 2 shows a chart with the System Equity Indicator applied.
As you can see in Figure 2, in spite of having over $2,000 of profit in a few trading days, the system’s equity curve is quite volatile, and you can see how most of the profits were made by one trade toward the middle of the last day on the chart. What if you hadn’t traded that day?
,OM[XKúèìú)NGXZú]OZNúZNKú9_YZKSú+W[OZ_ú/TJOIGZUXúGVVROKJ
)NGVZKXúéúúúúúú-KTKXGRú9_YZKSú*K\KRUVSKTZú)UTIKVZY ;YOTMú6UXZLUROUú3G^OSO`KXúLUXú:XGJK9ZGZOUTúúúúúúúúúá
;YOTMú6UXZLUROUú3G^OSO`KXúLUXú:XGJK9ZGZOUTPortfolio Maximizer for TradeStation gives you the power to create and historically test groups of trading systems and securities combined in portfolios, revealing trading combinations that are stronger and more profitable than individual systems or markets alone. Also, Portfolio Maximizer provides an extensive performance report that opens the door to a host of new ways to gauge your portfolio’s true performance. It provides an individual report on one system as well as a portfolio report. This section describes the more important fields on the individual report.
9ZGTJGXJú*K\OGZOUTúULú'\Mú=OTTOTMú:XGJKYë9ZJú*K\úULú'\Mú2UYOTMú:XGJKYOne of the most desirable traits of a trading system is predictability. The reason we backtest our systems is to know how they behaved in the past in order to know what to expect from them in the future. One way to statistically determine stability is by calculating the standard deviation of the trades from the average. When we calculate the average winning trade and determine the standard deviation of the trades from the average, we can then state that approximately 96% of the trades will fall between the average plus or minus the standard deviation. For example, if the average winning trade gives us $500 profit, and the standard deviation is 100, we know that most of the winning trades (about 96%) will give us profits between $400 and $600. If the standard deviation is 490, we know that the trades will most likely fall between $10 and $990.
Once you begin looking at this number you will notice that invariably the equity curve smooths out as the standard deviation of winning and losing trades decreases.
:OSKú'TGR_YOYA figure as important as any other when testing your systems is how much time the system has your capital in the market. A system can provide great results, but it might require significant capital to be dedicated exclusively to it. There are several reasons why you want to study time when looking at system results:
1. Risk. The more time the system has money in the market, the more the capital is exposed to violent moves in the market, thus higher risk.
2. Availability of funds . If system A can provide you with a 20% annual return, and system B can provide you with 30% annual return, yet A is in the market 40% of the time versus 75% for system B, this means that you will have your capital at your disposal for seven months out of the year versus only three for system B. In those four months (difference between spare time of system A and B), you could have been investing your capital elsewhere.
,XKW[KTI_úULú:XGJKúúúYou should always keep an eye on how frequently the system trades because it will have an effect on how much of your time you will spend following the system and how.
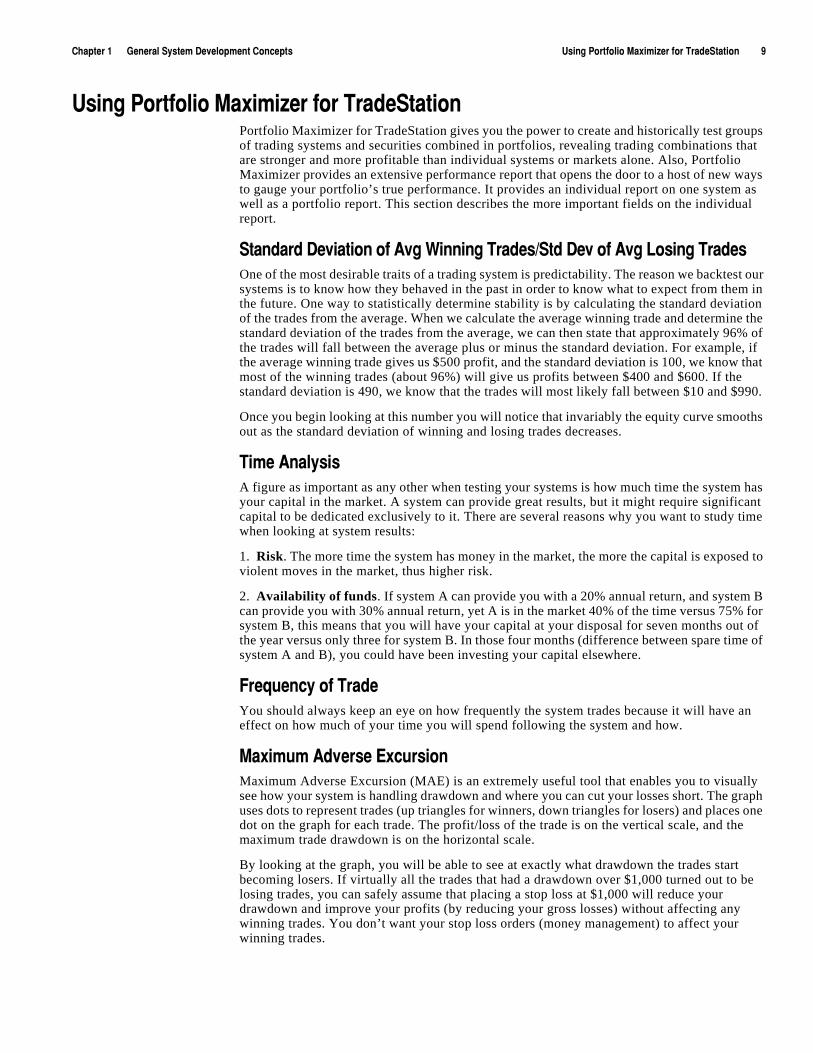
3G^OS[Sú'J\KXYKú+^I[XYOUTMaximum Adverse Excursion (MAE) is an extremely useful tool that enables you to visually see how your system is handling drawdown and where you can cut your losses short. The graph uses dots to represent trades (up triangles for winners, down triangles for losers) and places one dot on the graph for each trade. The profit/loss of the trade is on the vertical scale, and the maximum trade drawdown is on the horizontal scale.
By looking at the graph, you will be able to see at exactly what drawdown the trades start becoming losers. If virtually all the trades that had a drawdown over $1,000 turned out to be losing trades, you can safely assume that placing a stop loss at $1,000 will reduce your drawdown and improve your profits (by reducing your gross losses) without affecting any winning trades. You don’t want your stop loss orders (money management) to affect your winning trades.
éêúúúúúúúúúú;YOTMú6UXZLUROUú3G^OSO`KXúLUXú:XGJK9ZGZOUTúúúúúúúúúú 5SKMGú8KYKGXINú9_YZKSú:XGJOTMúGTJú*K\KRUVSKTZú)R[Húíú<UR[SKúç
Figure 3 shows the Maximum Adverse Excursion graph. Notice that after a drawdown of 3 points the majority of trades were losers. Placing a stop loss at that point should substantially help reduce drawdown and gross losses.
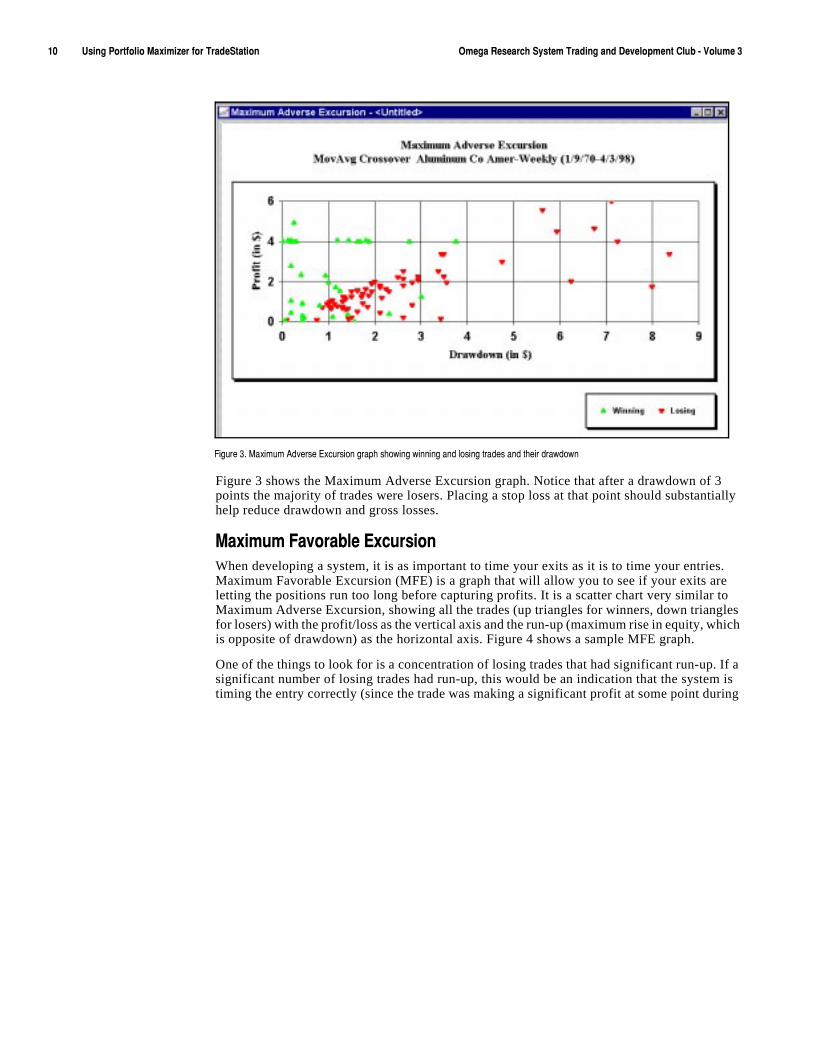
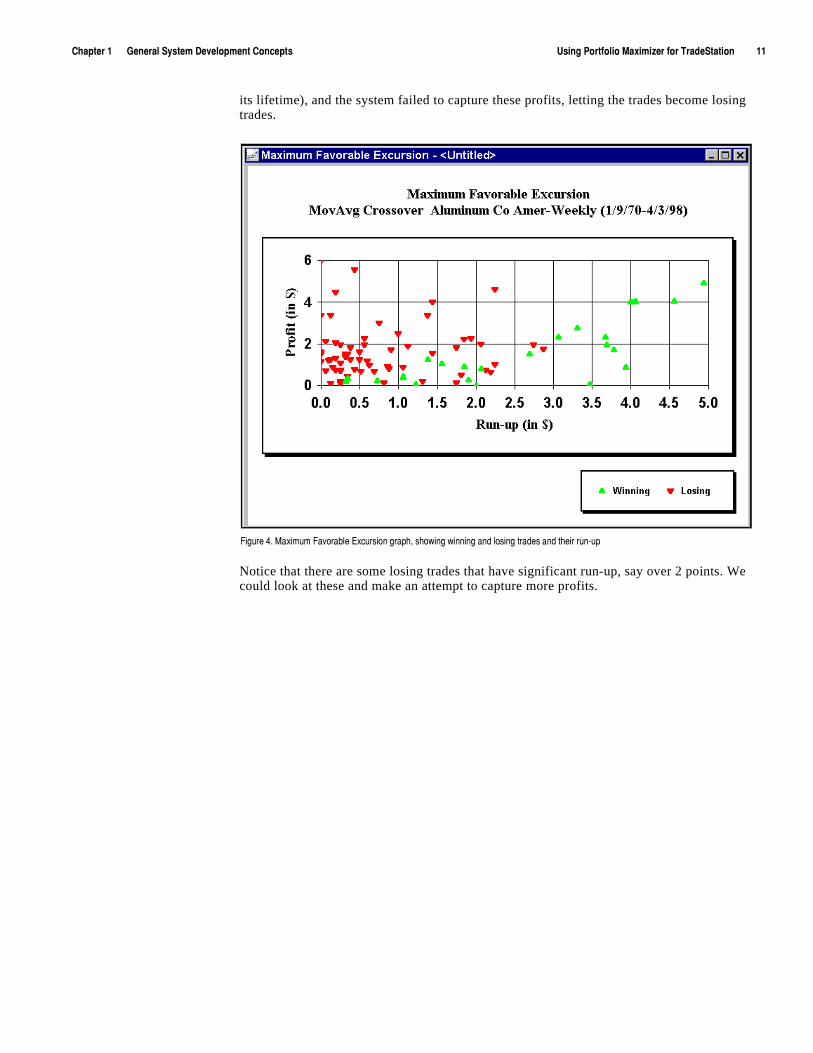
3G^OS[Sú,G\UXGHRKú+^I[XYOUTúWhen developing a system, it is as important to time your exits as it is to time your entries. Maximum Favorable Excursion (MFE) is a graph that will allow you to see if your exits are letting the positions run too long before capturing profits. It is a scatter chart very similar to Maximum Adverse Excursion, showing all the trades (up triangles for winners, down triangles for losers) with the profit/loss as the vertical axis and the run-up (maximum rise in equity, which is opposite of drawdown) as the horizontal axis. Figure 4 shows a sample MFE graph.
One of the things to look for is a concentration of losing trades that had significant run-up. If a significant number of losing trades had run-up, this would be an indication that the system is timing the entry correctly (since the trade was making a significant profit at some point during
,OM[XKúçìú3G^OS[Sú'J\KXYKú+^I[XYOUTúMXGVNúYNU]OTMú]OTTOTMúGTJúRUYOTMúZXGJKYúGTJúZNKOXúJXG]JU]T
)NGVZKXúéúúúúúú-KTKXGRú9_YZKSú*K\KRUVSKTZú)UTIKVZY ;YOTMú6UXZLUROUú3G^OSO`KXúLUXú:XGJK9ZGZOUTúúúúúúúúúéé
its lifetime), and the system failed to capture these profits, letting the trades become losing trades.
Notice that there are some losing trades that have significant run-up, say over 2 points. We could look at these and make an attempt to capture more profits.
,OM[XKúæìú3G^OS[Sú,G\UXGHRKú+^I[XYOUTúMXGVNîúYNU]OTMú]OTTOTMúGTJúRUYOTMúZXGJKYúGTJúZNKOXúX[Tí[Vú

éèúúúúúúúúúú;YOTMú6UXZLUROUú3G^OSO`KXúLUXú:XGJK9ZGZOUTúúúúúúúúúú 5SKMGú8KYKGXINú9_YZKSú:XGJOTMúGTJú*K\KRUVSKTZú)R[Húíú<UR[SKúç

C H A P T E R 2
:XKTJOTMú9_YZKSY
Trending systems are systems designed for trending markets—they have the following characteristics:
� The systems are designed never to miss the big move; they will either always be in the market or contain stop orders that will stop you into the market.
� They attempt to limit losses during the market’s sideways mode; no system will make money in every market condition, but a good system will limit losses in market conditions for which it was not designed.
� Profits are concentrated in a few big trades; they have a low percentage of profitable trades. This makes them psychologically difficult to trade and underscores the importance of never missing a big move.
Even though trending systems are difficult to trade, they are popular—it’s human nature to want to cash in on the big moves. In this chapter, we present three trending systems that differ in their approach but that are all designed to capture big moves and limit losses during directionless and/or volatile phases.
/Tú:NOYú)NGVZKX
� Buy Dips/Sell Rallies ...................... 14
� Bearish & Bullish EngulfingPatterns ............................................ 21
� Open-Close Histogram.....................28
éæúúúúúúúúúú([_ú*OVYë9KRRú8GRROKYúúúúúúúúúú 5SKMGú8KYKGXINú9_YZKSú:XGJOTMúGTJú*K\KRUVSKTZú)R[Húíú<UR[SKúç
([_ú*OVYë9KRRú8GRROKYThe idea behind the Buy Dips/Sell Rallies trading system is to buy after a countertrend decline in an uptrend but only once the uptrend resumes, and likewise, to sell short after a countertrend rally in a downtrend but only once the downtrend resumes. It is commonly accepted that trending markets will experience one or more corrections as they continue along the trend. We want to be able to identify a trend but then find the best possible point to enter the market in order to take advantage of the trend. Our thinking is that we will identify a trend but wait until a countertrend occurs. Then, if the trend continues after the countertrend decline or rally, indicating that the trend is strong and likely to continue for an acceptable period, we will enter the market.
First, we needed a way to determine the existence and direction of the trend. Most systems use moving averages to determine the direction of the trend, so we wanted to use something a little different. We decided to use the Relative Strength Index (RSI) Indicator. The RSI is an oscillator generally used to find overbought and oversold conditions and to show divergence from the price. Most commonly, markets with an RSI over 70 or 80 are considered to be overbought, and markets with an RSI below 20 or 30 are considered to be oversold. In addition, the value of 50 can serve the same purpose as the zero line in other oscillators. A crossing above or below 50 can signal the slowing down of a current trend or a trend reversal.
In Buy Dips/Sell Rallies, we will use the RSI and this 50 level to determine the overall direction of the market. We will assume that when the RSI is greater than 50, the market is in an uptrend, and when the RSI is less than 50, the market is in a downtrend.
We also needed to incorporate a way to identify countertrend price swings. We decided to use the Directional Movement Index (DMI) spread. The traditional DMI Indicator consists of three values: the DMI Plus, the DMI Minus, and the ADX. For the purpose of our analysis, we will use the DMI spread, in other words, the difference between DMI Plus and DMI Minus. DMI Plus measures upward price movement and DMI Minus measures downward price movement. When the difference between them is less than zero in an uptrend, or greater than zero in a downtrend, we’ll assume a countertrend price swing
The key is to use a longer period for the calculation of the RSI than for the calculation of the DMI spread. For this system, we will use 20 bars to calculate the RSI and 5 to calculate the DMI values. This enables us to use the RSI to determine the overall trend and the DMI to identify shorter-term corrections within the overall trend.
Therefore, we wrote our system so that when the RSI is greater then 50 and the DMI spread is less than zero, we have a buy setup. After the buy setup, we wait for the DMI spread to cross above zero. When this happens, we obtain the high price of the current bar and place a buy stop at the high. This way, to enter the market, price movement has to confirm our setup.
Likewise, when the RSI is less than 50 and the DMI spread is greater than zero, we have a sell setup. After the sell setup, we wait for the DMI spread to cross below zero. When this happens, we obtain the low price of the current bar and place a sell stop at the low. Again, by using a sell stop, price movement has to confirm our setup in order for us to enter the market.
The buy and sell orders remain active until the market conditions reverse, i.e., the RSI or DMI spread crosses back over its respective limit. They remain active with the original entry price, the high or low price of the bar on which the buy or sell setup conditions first became true.
Once we determined how we were going to enter the market, we had to decide how to exit. We’ll use a standard trending system exit, as follows: once we enter the market on the buy stop, we’ll calculate the 4-bar average of the range and subtract this value from the low. This will be our long exit price for bar 2. On the subsequent bar, we’ll get the exit price calculated in the last point and add to it a third of the difference between the low and the previous stop price. Repeating this operation at the end of every bar will give us our exit price for bar 3 and beyond.
Likewise, once we enter the market on the sell stop, we’ll calculate the 4-bar average of the range and add this value to the high. This will be our short exit price for bar 2. On the subsequent
)NGVZKXúèúúúúúú:XKTJOTMú9_YZKSY ([_ú*OVYë9KRRú8GRROKYúúúúúúúúúúéå
bar, we’ll get the exit price calculated in the last point and subtract from it a third of the difference between the previous stop price and the high. Repeating this operation at the end of every bar will give us the exit price for bar 3 and beyond.
We will also use a money management stop (stop loss), the dollar amount of which will depend on what and how many shares/contracts we are trading.
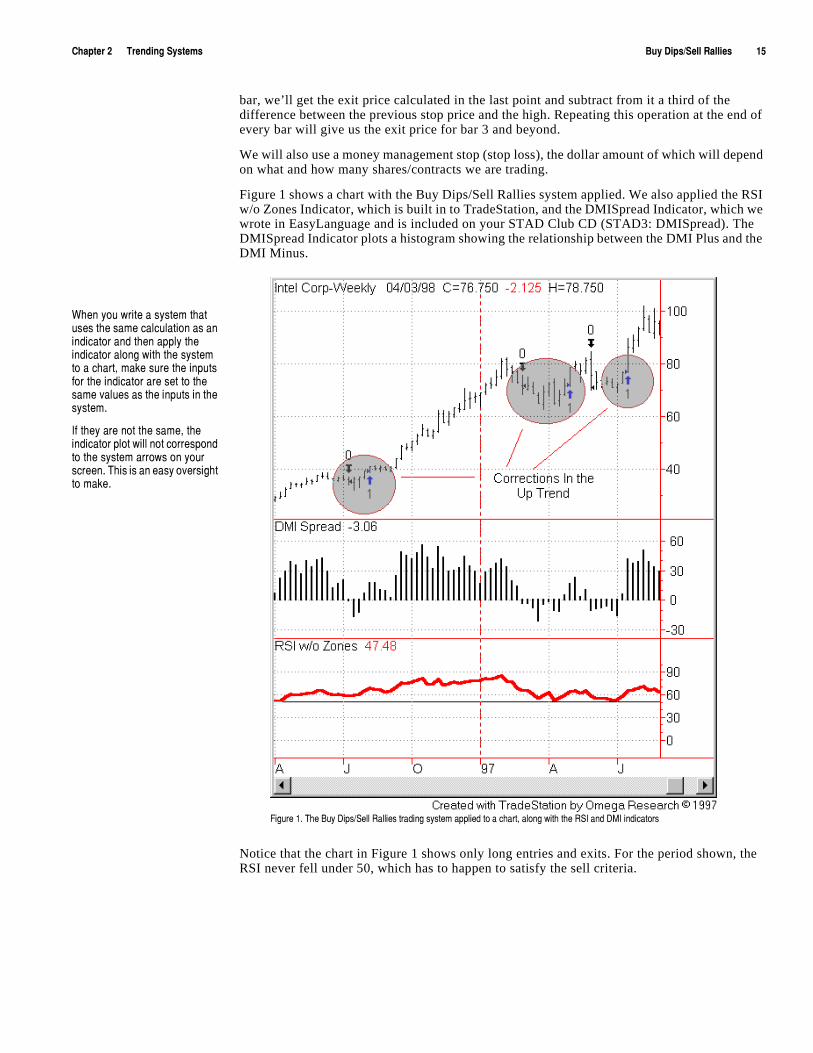
Figure 1 shows a chart with the Buy Dips/Sell Rallies system applied. We also applied the RSI w/o Zones Indicator, which is built in to TradeStation, and the DMISpread Indicator, which we wrote in EasyLanguage and is included on your STAD Club CD (STAD3: DMISpread). The DMISpread Indicator plots a histogram showing the relationship between the DMI Plus and the DMI Minus.
Notice that the chart in Figure 1 shows only long entries and exits. For the period shown, the RSI never fell under 50, which has to happen to satisfy the sell criteria.
,OM[XKúéìú:NKú([_ú*OVYë9KRRú8GRROKYúZXGJOTMúY_YZKSúGVVROKJúZUúGúINGXZîúGRUTMú]OZNúZNKú89/úGTJú*3/úOTJOIGZUXYú
=NKTú_U[ú]XOZKúGúY_YZKSúZNGZú[YKYúZNKúYGSKúIGRI[RGZOUTúGYúGTúOTJOIGZUXúGTJúZNKTúGVVR_úZNKúOTJOIGZUXúGRUTMú]OZNúZNKúY_YZKSúZUúGúINGXZîúSGQKúY[XKúZNKúOTV[ZYúLUXúZNKúOTJOIGZUXúGXKúYKZúZUúZNKúYGSKú\GR[KYúGYúZNKúOTV[ZYúOTúZNKúY_YZKSìú
/LúZNK_úGXKúTUZúZNKúYGSKîúZNKúOTJOIGZUXúVRUZú]ORRúTUZúIUXXKYVUTJúZUúZNKúY_YZKSúGXXU]YúUTú_U[XúYIXKKTìú:NOYúOYúGTúKGY_úU\KXYOMNZúZUúSGQKìú
éäúúúúúúúúúú([_ú*OVYë9KRRú8GRROKYúúúúúúúúúú 5SKMGú8KYKGXINú9_YZKSú:XGJOTMúGTJú*K\KRUVSKTZú)R[Húíú<UR[SKúç
*KLOTOTMú_U[Xú:XGJOTMú8[RKYIn this system, we defined both long entries and short entries as well as exit orders. We also did some setup work to calculate the RSI and the DMI spread. The setup, entries and exits are described next:
9KZ[Va) Calculate the RSI value and compare it to 50 to determine the overall direction of the market.
b) Calculate the DMI spread and compare it to zero to identify a countertrend decline or rally.
2UTMú+TZXOKYa) When the buy setup criteria are met (RSI is greater than 50 and DMI is less than zero) and then the DMI spread crosses above zero, place a buy stop at today’s high.
9NUXZú+TZXOKYúa) When the sell setup criteria are met (RSI is less than 50 and DMI is greater than zero) and then the DMI spread crosses below zero, place a sell stop at today’s low.
+^OZú5XJKXYúa) Once the bar of entry of a long position has closed, calculate the 4-bar average of the range and subtract this value from the low. This is our long exit price for bar 2.
b) On the subsequent bar, get the exit price calculated in the last point and add to it a third of the difference between the low and the previous stop price. Repeating this operation at the end of every bar gives us our exit price for bar 3 and beyond.
c) Once the bar of entry of a short position is closed, calculate the 4-bar average of the range and add this value to the high. This is our short exit price for bar 2.
d) On the subsequent bar, we’ll get the exit price calculated in the last point and subtract from it a third of the difference between the previous stop price and the high. Repeating this operation at the end of every bar gives us the exit price for bar 3 and beyond.
e) Place a money management stop (stop loss), the dollar amount of which will depend on what and how many shares/contracts you are trading.
*KYOMTOTMúôú,UXSGZZOTMThis section presents the EasyLanguage instructions and formatting for the system, with the EasyLanguage instructions broken down and explained line by line.
+GY_2GTM[GMKú/TYZX[IZOUTY ú([_ú*OVYë9KRRú8GRROKYúò9:'*ç ú([_*ú9KRR8ñ
/TV[Z ú6XOIKò)RUYKñîú89/2KTòèêñîú89/2K\KRòåêñîú*3/2KTòåñ!úú
<GXY ú;V:XKTJò,GRYKñîú*T:XKTJò,GRYKñîú*3/9VXKGJòêñîú([_9KZ[Vò,GRYKñîú9KRR9KZ[Vò,GRYKñîú2UTM+TZX_6XOIKòêñîú9NUXZ+TZX_6XOIKòêñ!
aú*KZKXSOTOTMúZNKúH[_úGTJúYKRRúYKZ[Vúc;V:XKTJú#ú89/ò6XOIKîú89/2KTñú$#ú89/2K\KR!ú*T:XKTJú#ú89/ò6XOIKîú89/2+Tñú"ú89/2K\KR!
*3/9VXKGJú#ú*3/6R[Yò*3/2KTñúíú*3/3OT[Yò*3/2KTñ!
/Lú;V:XKTJúGTJú*3/9VXKGJú"úêúZNKTú(KMOT([_9KZ[Vú#ú:X[K!9KRR9KZ[Vú#ú,GRYK!
+TJ!
)NGVZKXúèúúúúúú:XKTJOTMú9_YZKSY ([_ú*OVYë9KRRú8GRROKYúúúúúúúúúúéã
/Lú*4:XKTJúGTJú*3/9VXKGJú$úêúZNKTú(KMOT9KRR9KZ[Vú#ú:X[K!([_9KZ[Vú#ú,GRYK!
+TJ!
aú2UTMúKTZX_úUXJKXYúc/Lú([_9KZ[VúZNKTú(KMOT
/Lú([_9KZ[VAéCú#ú,GRYKúZNKTú2UTM+TZX_VXOIKú#ú.OMN!([_úTK^ZúHGXúGZú2UTM+TZX_6XOIKú9ZUV!
+TJ!
aú9NUXZúKTZX_úUXJKXYúc/Lú9KRR9KZ[Vú#ú:X[KúZNKTú(KMOT
/Lú9KRR9KZ[VAéCú#ú,GRYKúZNKTú9NUXZ+TZX_6XOIKú#ú2U]!9KRRúTK^ZúHGXúGZú9NUXZ+TZX_VXOIKú9ZUV!
+TJ!
aú+^OZúUXJKXYúc36ú#ú3GXQKZ6UYOZOUT!/Lú36ú#úéúGTJú36AéCú"$úéúZNKT9ZUV6XOIKú#ú2U]úíú'\KXGMKò8GTMKîæñ!/Lú36ú#úíéúGTJú36AéCú"$úíéúZNKT9ZUV6XOIKú#ú.OMNúïú'\KXGMKò8GTMKîæñ!/Lú36ú#úéúZNKTú(KMOT
+^OZRUTMúTK^ZúHGXúGZú9ZUV6XOIKú9ZUV!9ZUV6XOIKú#ú9ZUV6XOIKúïúò2U]úíú9ZUV6XOIKñëç!
+TJ!
/Lú36ú#úíéúZNKTú(KMOT+^OZYNUXZúTK^ZúHGXúGZú9ZUV6XOIKú9ZUV!9ZUV6XOIKú#ú9ZUV6XOIKúíúò9ZUV6XOIKúíú.OMNñëç!
+TJ!
/TV[ZYFollowing is the list of all the inputs we used in this system:
In addition to these inputs, we define the following variables:
<GXY ú;V:XKTJò,GRYKñîú*T:XKTJò,GRYKñîú*3/9VXKGJòêñîú([_9KZ[Vò,GRYKñîú9KRR9KZ[Vò,GRYKñîú2UTM+TZX_6XOIKòêñîú9NUXZ+TZX_6XOIKòêñ!
We first calculate the RSI and compare it to 50, storing the values in the variables ;V:XKTJ and *T:XKTJ. We also calculate the DMI spread and store the value in the variable *3/9VXKGJ.
Input Default Description
Price Close Price used to calculate the RSI.
RSILen 20 Length, expressed in bars, used to calculate the RSI.
RSILevel 50 Value under which the RSI must fall for the market to be considered in a downtrend, and over which it must rise for an uptrend.
DMILen 5 Length, expressed in bars, to use to calculate the DMI Plus and DMI Minus values.
éâúúúúúúúúúú([_ú*OVYë9KRRú8GRROKYúúúúúúúúúú 5SKMGú8KYKGXINú9_YZKSú:XGJOTMúGTJú*K\KRUVSKTZú)R[Húíú<UR[SKúç
;V:XKTJú#ú89/ò6XOIKîú89/2KTñú$#ú89/2K\KR!*T:XKTJú#ú89/ò6XOIKîú89/2+Tñú"ú89/2K\KR!*3/9VXKGJú#ú*3/6R[Yò*3/2KTñúíú*3/3OT[Yò*3/2KTñ!
Then, we look at the values in the ;V:XKTJ and *T:XKTJ variables and evaluate the DMI spread. When the RSI is greater than 50 (;V:XKTJ = True) and *3/9VXKGJ is less than zero, ([_9KZ[V is set to true and 9KRR9KZ[V is set to false. When RSI is less than 50 (*T:XKTJ = True) and *3/9VXKGJ is greater than zero, 9KRR9KZ[V is set to true and ([_9KZ[V is set to false.
/Lú;V:XKTJúGTJú*3/9VXKGJú"úêúZNKTú(KMOT([_9KZ[Vú#ú:X[K!9KRR9KZ[Vú#ú,GRYK!
+TJ!
/Lú*4:XKTJúGTJú*3/9VXKGJú$úêúZNKTú(KMOT9KRR9KZ[Vú#ú:X[K!([_9KZ[Vú#ú,GRYK!
+TJ!
Placing the results of the evaluations in the 9KRR9KZ[V and ([_9KZ[V variables enables us subsequently to use them in our IF-THEN statements in order to place our buy and sell stop orders.
2UTMú+TZXOKYúWhen the variable ([_9KZ[V is true, which means the RSI is greater than 50 and the DMI Spread is less than zero, we check to make sure that the value of the variable ([_9KZ[V on the previous bar was false. If it was, we set the variable 2UTM+TZX_6XOIK to the high of the current bar. We want to make sure that we set the entry price to the high of the bar on which the buy setup conditions first became true. We hold on to this price until the order is generated or until conditions reverse.
We also place a buy stop order for the next bar at the high of the current bar.
/Lú([_9KZ[VúZNKTú(KMOT/Lú([_9KZ[VAéCú#ú,GRYKúZNKTú2UTM+TZX_VXOIKú#ú.OMN!([_úTK^ZúHGXúGZú2UTM+TZX_6XOIKú9ZUV!
+TJ!
9NUXZú+TZXOKYúWhen the variable 9KRR9KZ[V is true, which means the RSI is less than 50 and the DMI Spread is greater than zero, we check to make sure that the value of the variable 9KRR9KZ[V on the previous bar was false. If it was, we set the variable 9NUXZ+TZX_6XOIK to the low of the current bar. We want to make sure that we set the entry price to the low of the bar on which the sell setup conditions first became true. We hold on to this price until the order is generated or until conditions reverse.
We also place a sell stop order for the next bar at the low of the current bar.
/Lú9KRR9KZ[Vú#ú:X[KúZNKTú(KMOT/Lú9KRR9KZ[VAéCú#ú,GRYKúZNKTú9NUXZ+TZX_6XOIKú#ú2U]!9KRRúTK^ZúHGXúGZú9NUXZ+TZX_VXOIKú9ZUV!
+TJ!
+^OZú5XJKXYúMarket conditions could be such that the system will reverse without exiting; however, because of the way in which we designed the system, it is highly unlikely that the system will reverse. Instead, it will exit from a long or short position when the exit price is met.
)NGVZKXúèúúúúúú:XKTJOTMú9_YZKSY ([_ú*OVYë9KRRú8GRROKYúúúúúúúúúúéá
First, we obtain our market position using the 3GXQKZ6UYOZOUT function. Then, on the first bar after we establish our long position, we set the variable 9ZUV6XOIK to the low of the current bar minus the 4-bar average of the range. Likewise, on the first bar after we establish our short position, we set the variable 9ZUV6XOIK to the high of the current bar plus the 4-bar average of the range.
36ú#ú3GXQKZ6UYOZOUT!/Lú36ú#úéúGTJú36AéCú"$úéúZNKTú9ZUV6XOIKú#ú2U]úíú'\KXGMKò8GTMKîæñ!/Lú36ú#úíéúGTJú36AéCú"$úíéúZNKT9ZUV6XOIKú#ú.OMNúïú'\KXGMKò8GTMKîæñ!
Then, when in a long position, we place an stop order to exit our long position at the 9ZUV6XOIK or better, and reset our 9ZUV6XOIK to the original 9ZUV6XOIK plus a third of the difference between the low of the current bar and the original 9ZUV6XOIK. Similarly, when in a short position, we place a stop order to exit our short position at the 9ZUV6XOIK or better, and reset our 9ZUV6XOIK to the original 9ZUV6XOIK minus a third of the difference between the original 9ZUV6XOIK and the high of the current bar.
/Lú36ú#úéúZNKTú(KMOT+^OZRUTMúTK^ZúHGXúGZú9ZUV6XOIKú9ZUV!9ZUV6XOIKú#ú9ZUV6XOIKúïúò2U]úíú9ZUV6XOIKñëç!
+TJ!
/Lú36ú#úíéúZNKTú(KMOT+^OZYNUXZúTK^ZúHGXúGZú9ZUV6XOIKú9ZUV!9ZUV6XOIKú#ú9ZUV6XOIKúíúò9ZUV6XOIKúíú.OMNñëç!
+TJ!
-KTKXGRú9_YZKSú,UXSGZWhen we apply this system to a chart, we use the options in the Format dialog box to format it as follows:
a) In the Costs tab, we entered the appropriate amounts for commission and slippage. We did not include margin because we designed this system for stocks, and we specified 200 as the default number of contracts to trade per order.
Note: Remember that commissions are calculated on a per contract/share basis. When you are trading stocks, you would enter the average commission you are charged divided by the number of shares the system is buying and selling. In this system, this is determined by the Default Contracts option on this tab.
b) Under the Stops tab, we enabled a money management stop (the Money Mngmnt check box) and entered an appropriate dollar amount in the edit box. This option holds the dollar amount per position or dollar amount per contract/share we want to risk before exiting out of the position.
Note: When you are trading stocks and you choose the stop to be tracked on a per share (contract) basis, you will type in the number of points you are willing to lose before you are exited out. When you are trading futures or any instrument that has a different dollar-point value, you would type the maximum number of dollars you are willing to risk per contract traded.
c) In the Properties tab, we selected the Do not allow multiple entries in same direction option. If the system is in a long position and market conditions generate another long entry order, the order is ignored. This is also the case when we’re in a short position and market conditions generate another short entry order.
èêúúúúúúúúúú([_ú*OVYë9KRRú8GRROKYúúúúúúúúúú 5SKMGú8KYKGXINú9_YZKSú:XGJOTMúGTJú*K\KRUVSKTZú)R[Húíú<UR[SKúç
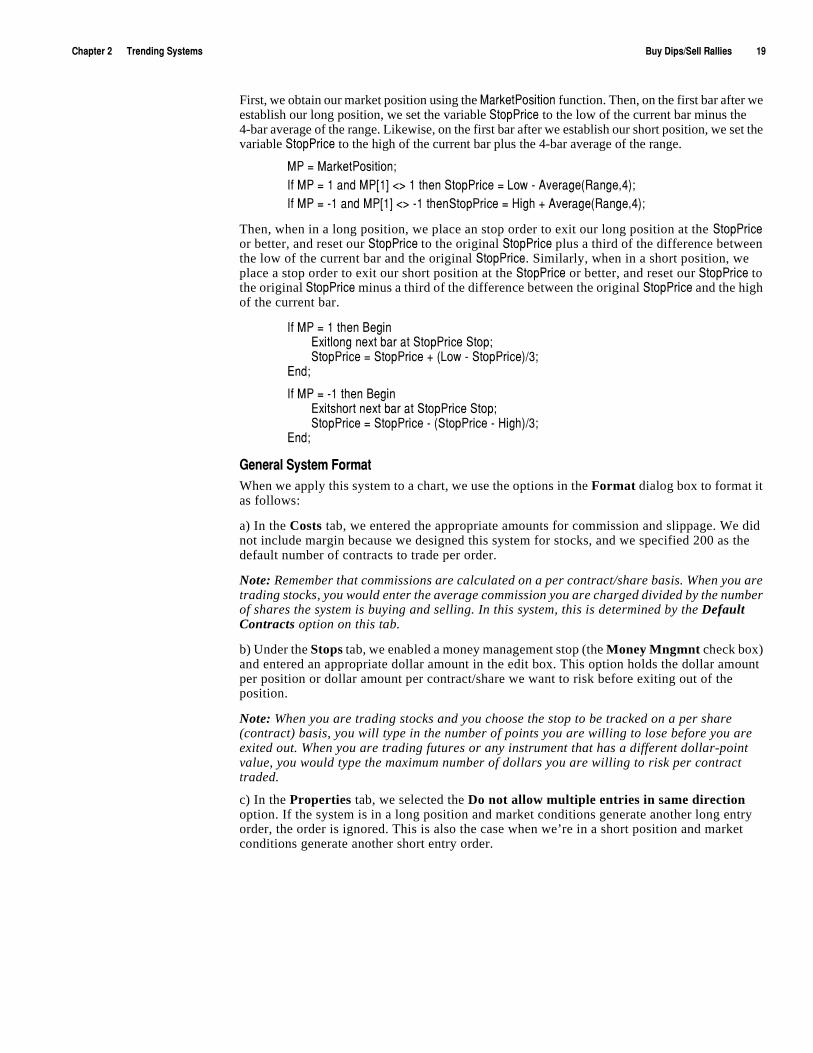
:KYZOTMúôú/SVXU\OTMFigure 2 shows a sample System Report for the Buy Dips/Sell Rallies trading system.
On the surface, this system returns some great numbers, for example, the impressive ratio of winning vs. losing trades (6.99). Also, 30 as the percent of profitable trades is to be expected since the system is a trending system that looks to enter the trade once there is a correction. But let’s look a little deeper.
First, the largest wining trade is approximately 60% of the total net profit. This is not necessarily a bad statistic, since a trending system is designed to capture and make the most profit from the big moves. However, if we look at the equity curve of the system, we’ll notice that it remains around the break even point, and it’s only the last few trades that give the system decent results.
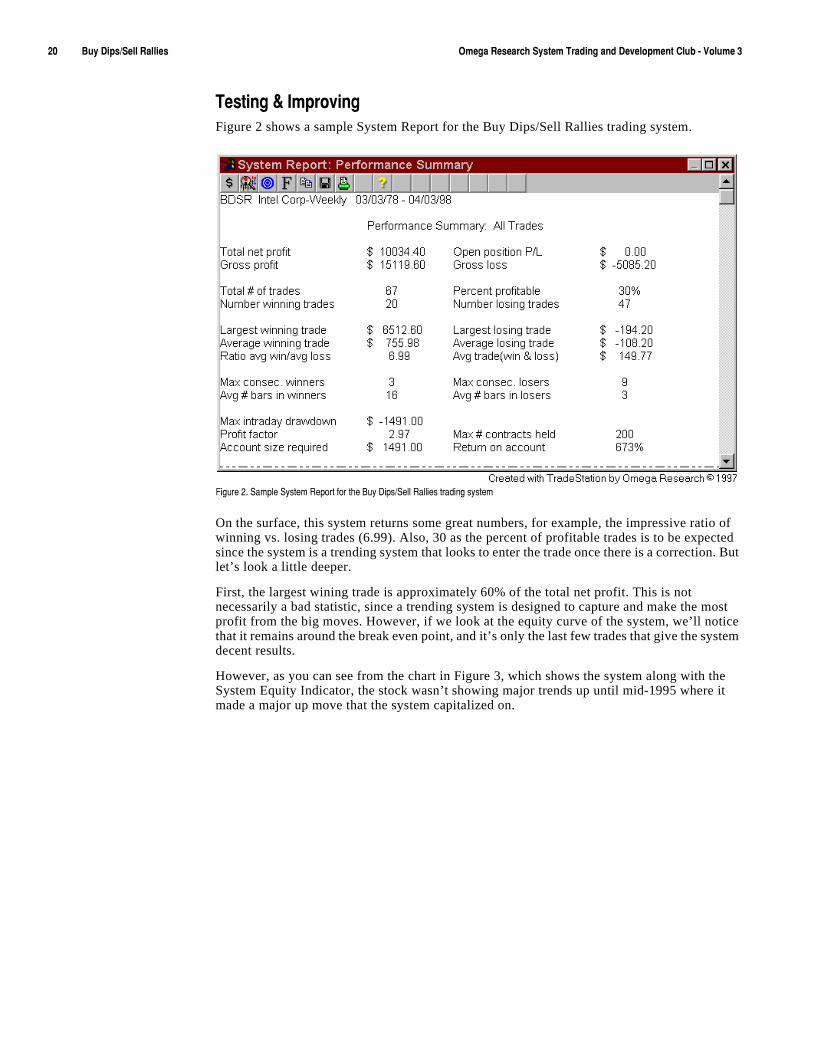
However, as you can see from the chart in Figure 3, which shows the system along with the System Equity Indicator, the stock wasn’t showing major trends up until mid-1995 where it made a major up move that the system capitalized on.
,OM[XKúèìú9GSVRKú9_YZKSú8KVUXZúLUXúZNKú([_ú*OVYë9KRRú8GRROKYúZXGJOTMúY_YZKS
)NGVZKXúèúúúúúú:XKTJOTMú9_YZKSY ([RROYNúôú(KGXOYNú+TM[RLOTMú6GZZKXTYúúúúúúúúúúèé
Overall, this system seems to behave as expected, capitalizing on trends and cutting losses short when the trend goes against its positions. We need to test it on additional data to determine its robustness.
9[MMKYZOUTYúLUXú/SVXU\KSKTZEven though the system appears to recognize bad trades early and exit with minimal losses, the 30/70 profit/loss ratio can be discouraging and makes the system psychologically difficult to trade. It’s difficult to withstand losing trades 70% of the time!
To improve the system, we may want to add to our criteria such that we enter the market not only when the DMI spread crosses the zero line, but also when the DMI spread ticks up from below zero (meaning that the DMI spread is greater than the DMI spread yesterday) or ticks down from above zero (meaning that the DMI spread is less than the DMI spread yesteday).
We could also use other filters, such as the ADX, to detect when the market is in a stronger long-term trend, or use historical fundamental information, such as the EPS reports available through Dial Data, and design the system to enter trades during minor corrections in the overall trend.
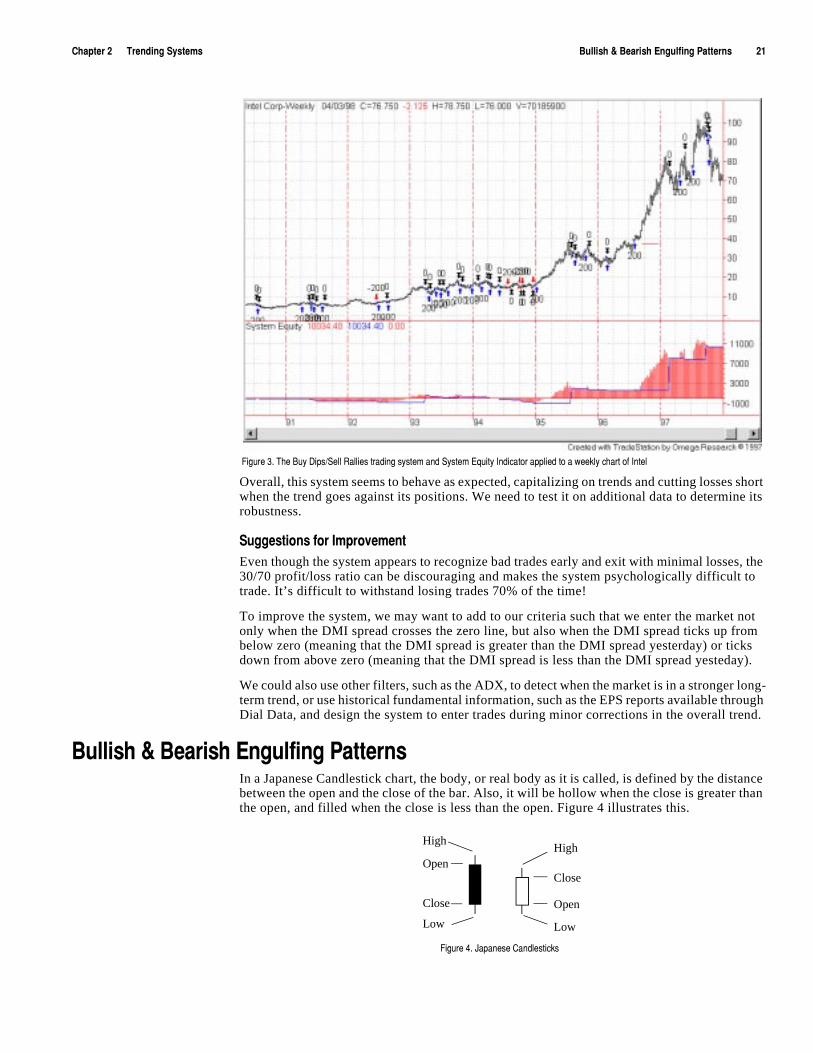
([RROYNúôú(KGXOYNú+TM[RLOTMú6GZZKXTYIn a Japanese Candlestick chart, the body, or real body as it is called, is defined by the distance between the open and the close of the bar. Also, it will be hollow when the close is greater than the open, and filled when the close is less than the open. Figure 4 illustrates this.
,OM[XKúçìú:NKú([_ú*OVYë9KRRú8GRROKYúZXGJOTMúY_YZKSúGTJú9_YZKSú+W[OZ_ú/TJOIGZUXúGVVROKJúZUúGú]KKQR_úINGXZúULú/TZKR
,OM[XKúæìú0GVGTKYKú)GTJRKYZOIQY
Close
Open
Open
Close
High
Low
High
Low

èèúúúúúúúúúú([RROYNúôú(KGXOYNú+TM[RLOTMú6GZZKXTYúúúúúúúúúú 5SKMGú8KYKGXINú9_YZKSú:XGJOTMúGTJú*K\KRUVSKTZú)R[Húíú<UR[SKúç
Japanese Candlestick chartists look at not only the individual candlesticks but also at the patterns and formations that result from a group of candlesticks in an attempt to determine market action. One interesting pattern is the engulfing pattern. A Bullish Engulfing pattern is defined as a large, hollow real body that engulfs a small, filled real body in a downtrend, and a Bearish Engulfing pattern is defined as a large, filled real body that engulfs a small, hollow real body in an uptrend.
This pattern is interesting because it is considered to be an indication of a reversal. For example, it can be argued that if the market is in an uptrend and you find a Bearish Engulfing pattern, a trend reversal is likely, and vice versa. We decided to build a system using these patterns to identify trend reversals.
First we had to decide what to use to identify whether or not the market is trending, and in what direction. We decided to use an exponential moving average calculation. We’ll say that the market is in an uptrend when the 10-day exponential average of the close is greater than the same average one bar ago, and we’ll say the market is in a downtrend when the 10-day exponential average of the close is less than the same average one bar ago.
Then, we had to define the specifications for the patterns. We’ll say that a real body is large when it is at least 125% the size of the 10-day average real body, and we’ll say it’s small when it is no more than 75% the size of the 10-day average real body.
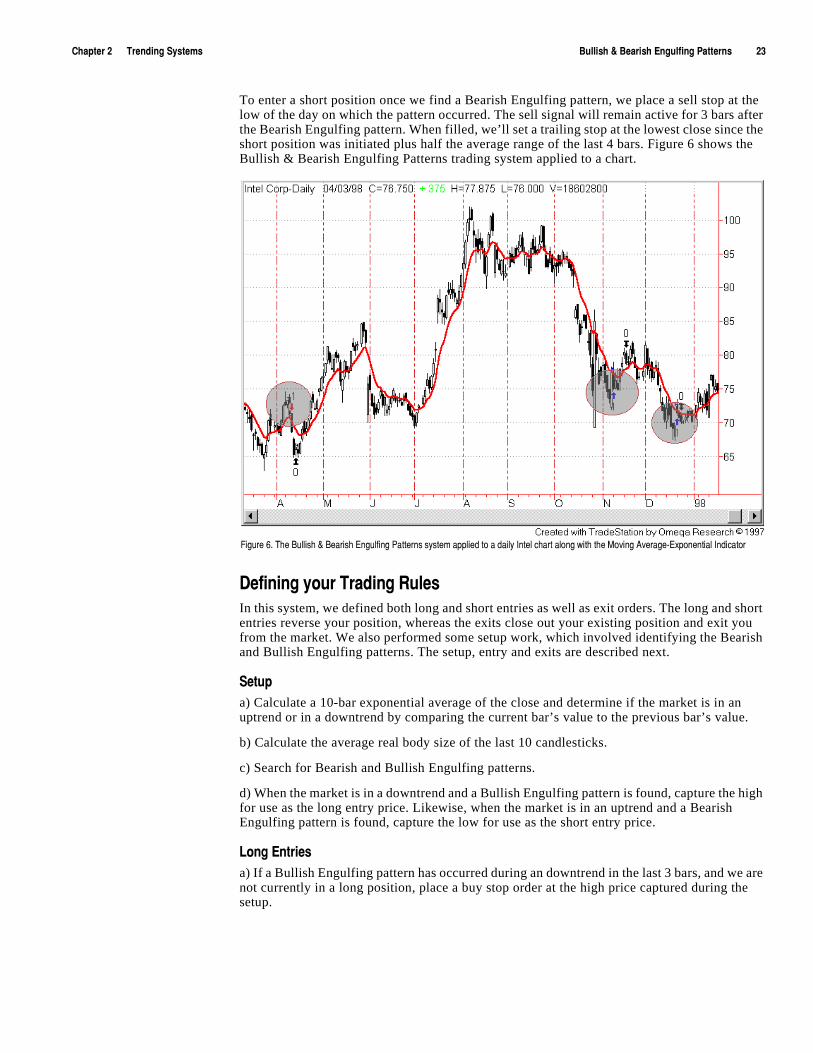
The chart in Figure 5 shows an example of a Bullish Engulfing pattern. We also applied the Moving Average-Exponential Indicator plotting the 10-day exponential average of the closes.
To enter a long position once we find a Bullish Engulfing pattern, we place a buy stop at the high of the day on which the pattern occurred. The buy signal will remain active for 3 bars after the Bullish Engulfing pattern. When filled, we’ll set a trailing stop at the highest close since the long position was initiated minus half the average range of the last 4 bars.
,OM[XKúåìú)NGXZúYNU]OTMúGú([RROYNú+TM[RLOTMúVGZZKXT
1KKVúOTúSOTJúZNGZúZNKúVGZZKXTYúGXKúLU[TJúZNXU[MNúSGZNKSGZOIGRúK\GR[GZOUTúULúZNKúVXOIKúJGZG!ú_U[úJUT©ZúNG\KúZUúGVVR_úZNKúY_YZKSúZUúGú)GTJRKYZOIQúINGXZìú
?U[úIGTúGVVR_úZNOYúY_YZKSúZUúGTú5.2)úHGXúINGXZúUXúGT_úUZNKXúZ_VKúULúINGXZúGTJú:XGJK9ZGZOUTú]ORRúYZORRúOJKTZOL_úZNKúVGZZKXTYìú
)NGVZKXúèúúúúúú:XKTJOTMú9_YZKSY ([RROYNúôú(KGXOYNú+TM[RLOTMú6GZZKXTYúúúúúúúúúúèç
To enter a short position once we find a Bearish Engulfing pattern, we place a sell stop at the low of the day on which the pattern occurred. The sell signal will remain active for 3 bars after the Bearish Engulfing pattern. When filled, we’ll set a trailing stop at the lowest close since the short position was initiated plus half the average range of the last 4 bars. Figure 6 shows the Bullish & Bearish Engulfing Patterns trading system applied to a chart.
*KLOTOTMú_U[Xú:XGJOTMú8[RKYIn this system, we defined both long and short entries as well as exit orders. The long and short entries reverse your position, whereas the exits close out your existing position and exit you from the market. We also performed some setup work, which involved identifying the Bearish and Bullish Engulfing patterns. The setup, entry and exits are described next.
9KZ[Vúa) Calculate a 10-bar exponential average of the close and determine if the market is in an uptrend or in a downtrend by comparing the current bar’s value to the previous bar’s value.
b) Calculate the average real body size of the last 10 candlesticks.
c) Search for Bearish and Bullish Engulfing patterns.
d) When the market is in a downtrend and a Bullish Engulfing pattern is found, capture the high for use as the long entry price. Likewise, when the market is in an uptrend and a Bearish Engulfing pattern is found, capture the low for use as the short entry price.
2UTMú+TZXOKYúa) If a Bullish Engulfing pattern has occurred during an downtrend in the last 3 bars, and we are not currently in a long position, place a buy stop order at the high price captured during the setup.
,OM[XKúäìú:NKú([RROYNúôú(KGXOYNú+TM[RLOTMú6GZZKXTYúY_YZKSúGVVROKJúZUúGúJGOR_ú/TZKRúINGXZúGRUTMú]OZNúZNKú3U\OTMú'\KXGMKí+^VUTKTZOGRú/TJOIGZUX
èæúúúúúúúúúú([RROYNúôú(KGXOYNú+TM[RLOTMú6GZZKXTYúúúúúúúúúú 5SKMGú8KYKGXINú9_YZKSú:XGJOTMúGTJú*K\KRUVSKTZú)R[Húíú<UR[SKúç
9NUXZú+TZXOKYúa) If a Bearish Engulfing pattern has occurred in an uptrend the last 3 bars, and we are not currently in a short position, place a sell stop order at the low price captured during the setup.
+^OZYúa) Once our buy stop order is filled, set a trailing stop at the highest close since the long position was initiated minus half the average range of the last 4 bars.
b) Once our sell stop order is filled, set a trailing stop at the lowest close since the short position was initiated plus half the average range of the last 4 bars.
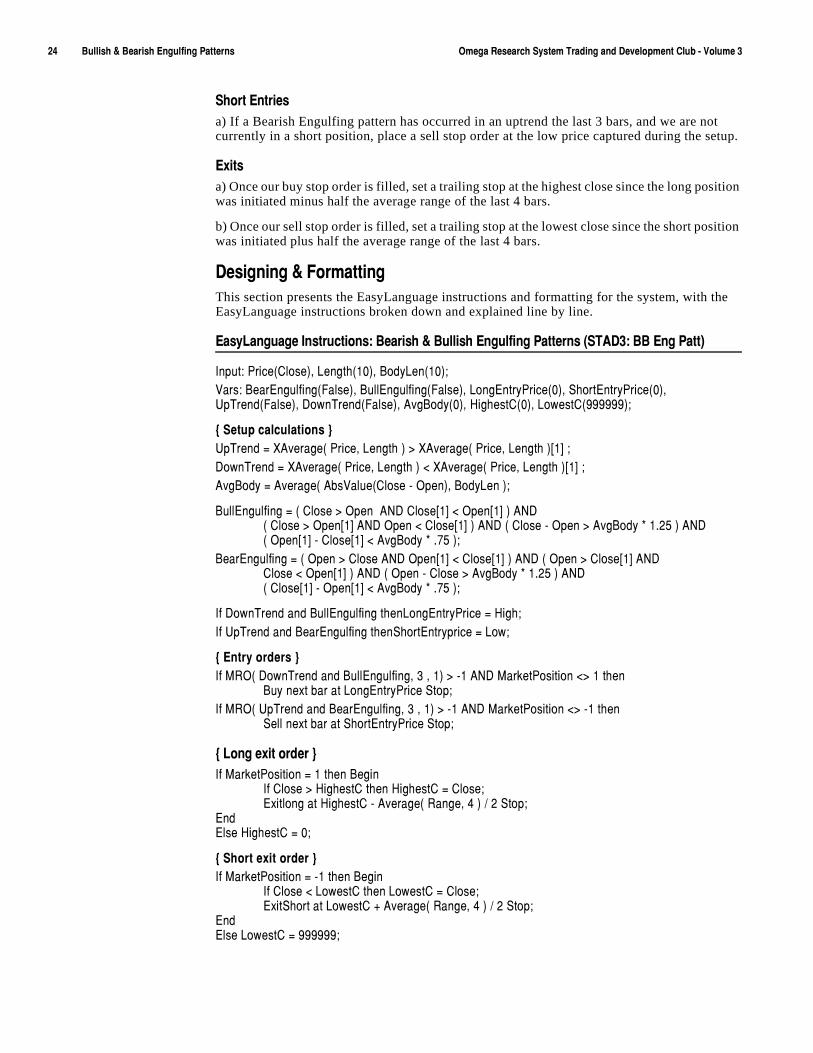
*KYOMTOTMúôú,UXSGZZOTMThis section presents the EasyLanguage instructions and formatting for the system, with the EasyLanguage instructions broken down and explained line by line.
+GY_2GTM[GMKú/TYZX[IZOUTY ú(KGXOYNúôú([RROYNú+TM[RLOTMú6GZZKXTYúò9:'*ç ú((ú+TMú6GZZñ
/TV[Z ú6XOIKò)RUYKñîú2KTMZNòéêñîú(UJ_2KTòéêñ!<GXY ú(KGX+TM[RLOTMò,GRYKñîú([RR+TM[RLOTMò,GRYKñîú2UTM+TZX_6XOIKòêñîú9NUXZ+TZX_6XOIKòêñîú;V:XKTJò,GRYKñîú*U]T:XKTJò,GRYKñîú'\M(UJ_òêñîú.OMNKYZ)òêñîú2U]KYZ)òááááááñ!
aú9KZ[VúIGRI[RGZOUTYúc;V:XKTJú#ú>'\KXGMKòú6XOIKîú2KTMZNúñú$ú>'\KXGMKòú6XOIKîú2KTMZNúñAéCú!*U]T:XKTJú#ú>'\KXGMKòú6XOIKîú2KTMZNúñú"ú>'\KXGMKòú6XOIKîú2KTMZNúñAéCú!'\M(UJ_ú#ú'\KXGMKòú'HY<GR[Kò)RUYKúíú5VKTñîú(UJ_2KTúñ!
([RR+TM[RLOTMú#úòú)RUYKú$ú5VKTúú'4*ú)RUYKAéCú"ú5VKTAéCúñú'4*úòú)RUYKú$ú5VKTAéCú'4*ú5VKTú"ú)RUYKAéCúñú'4*úòú)RUYKúíú5VKTú$ú'\M(UJ_úðúéìèåúñú'4*úòú5VKTAéCúíú)RUYKAéCú"ú'\M(UJ_úðúìãåúñ!
(KGX+TM[RLOTMú#úòú5VKTú$ú)RUYKú'4*ú5VKTAéCú"ú)RUYKAéCúñú'4*úòú5VKTú$ú)RUYKAéCú'4*ú)RUYKú"ú5VKTAéCúñú'4*úòú5VKTúíú)RUYKú$ú'\M(UJ_úðúéìèåúñú'4*úòú)RUYKAéCúíú5VKTAéCú"ú'\M(UJ_úðúìãåúñ!
/Lú*U]T:XKTJúGTJú([RR+TM[RLOTMúZNKT2UTM+TZX_6XOIKú#ú.OMN!/Lú;V:XKTJúGTJú(KGX+TM[RLOTMúZNKT9NUXZ+TZX_VXOIKú#ú2U]!
aú+TZX_úUXJKXYúc/Lú385òú*U]T:XKTJúGTJú([RR+TM[RLOTMîúçúîúéñú$úíéú'4*ú3GXQKZ6UYOZOUTú"$úéúZNKT
([_úTK^ZúHGXúGZú2UTM+TZX_6XOIKú9ZUV!/Lú385òú;V:XKTJúGTJú(KGX+TM[RLOTMîúçúîúéñú$úíéú'4*ú3GXQKZ6UYOZOUTú"$úíéúZNKT
9KRRúTK^ZúHGXúGZú9NUXZ+TZX_6XOIKú9ZUV!
aú2UTMúK^OZúUXJKXúc/Lú3GXQKZ6UYOZOUTú#úéúZNKTú(KMOT
/Lú)RUYKú$ú.OMNKYZ)úZNKTú.OMNKYZ)ú#ú)RUYK!+^OZRUTMúGZú.OMNKYZ)úíú'\KXGMKòú8GTMKîúæúñúëúèú9ZUV!
+TJ+RYKú.OMNKYZ)ú#úê!
aú9NUXZúK^OZúUXJKXúc/Lú3GXQKZ6UYOZOUTú#úíéúZNKTú(KMOT
/Lú)RUYKú"ú2U]KYZ)úZNKTú2U]KYZ)ú#ú)RUYK!+^OZ9NUXZúGZú2U]KYZ)úïú'\KXGMKòú8GTMKîúæúñúëúèú9ZUV!
+TJú+RYKú2U]KYZ)ú#úáááááá!
)NGVZKXúèúúúúúú:XKTJOTMú9_YZKSY ([RROYNúôú(KGXOYNú+TM[RLOTMú6GZZKXTYúúúúúúúúúúèå
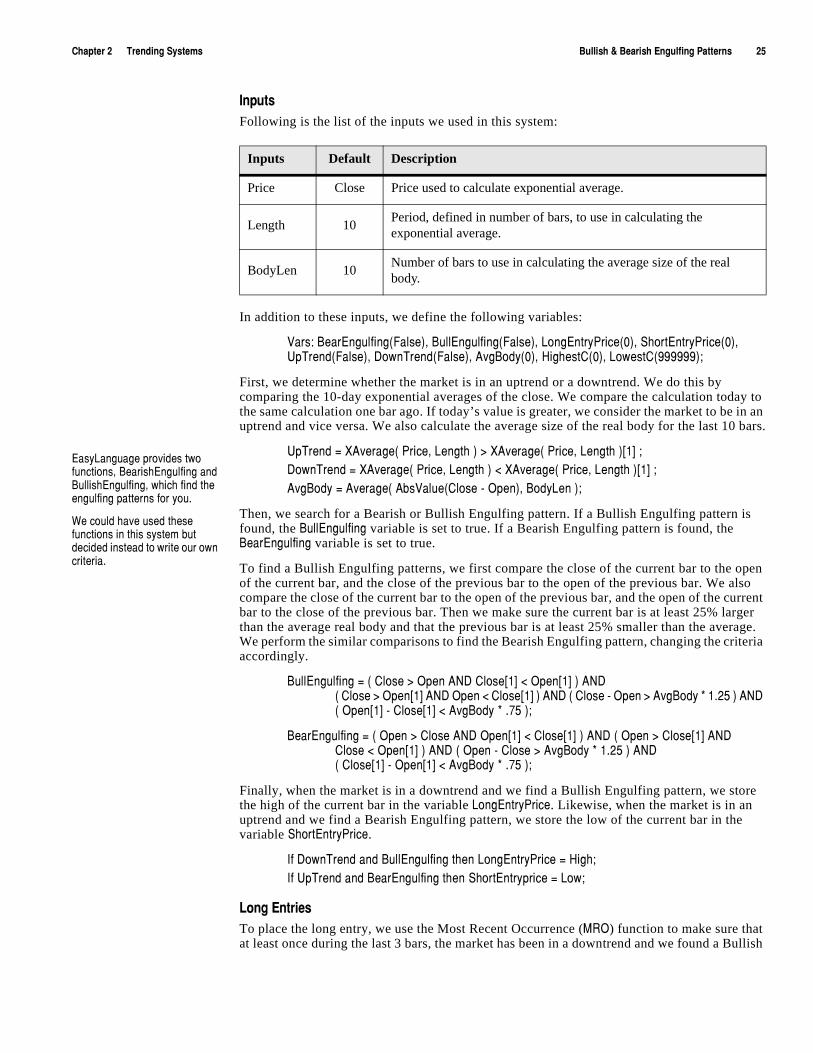
/TV[ZYúFollowing is the list of the inputs we used in this system:
In addition to these inputs, we define the following variables:
<GXY ú(KGX+TM[RLOTMò,GRYKñîú([RR+TM[RLOTMò,GRYKñîú2UTM+TZX_6XOIKòêñîú9NUXZ+TZX_6XOIKòêñîú;V:XKTJò,GRYKñîú*U]T:XKTJò,GRYKñîú'\M(UJ_òêñîú.OMNKYZ)òêñîú2U]KYZ)òááááááñ!
First, we determine whether the market is in an uptrend or a downtrend. We do this by comparing the 10-day exponential averages of the close. We compare the calculation today to the same calculation one bar ago. If today’s value is greater, we consider the market to be in an uptrend and vice versa. We also calculate the average size of the real body for the last 10 bars.
;V:XKTJú#ú>'\KXGMKòú6XOIKîú2KTMZNúñú$ú>'\KXGMKòú6XOIKîú2KTMZNúñAéCú!*U]T:XKTJú#ú>'\KXGMKòú6XOIKîú2KTMZNúñú"ú>'\KXGMKòú6XOIKîú2KTMZNúñAéCú!'\M(UJ_ú#ú'\KXGMKòú'HY<GR[Kò)RUYKúíú5VKTñîú(UJ_2KTúñ!
Then, we search for a Bearish or Bullish Engulfing pattern. If a Bullish Engulfing pattern is found, the ([RR+TM[RLOTM variable is set to true. If a Bearish Engulfing pattern is found, the (KGX+TM[RLOTM variable is set to true.
To find a Bullish Engulfing patterns, we first compare the close of the current bar to the open of the current bar, and the close of the previous bar to the open of the previous bar. We also compare the close of the current bar to the open of the previous bar, and the open of the current bar to the close of the previous bar. Then we make sure the current bar is at least 25% larger than the average real body and that the previous bar is at least 25% smaller than the average. We perform the similar comparisons to find the Bearish Engulfing pattern, changing the criteria accordingly.
([RR+TM[RLOTMú#úòú)RUYKú$ú5VKTú'4*ú)RUYKAéCú"ú5VKTAéCúñú'4*úòú)RUYKú$ú5VKTAéCú'4*ú5VKTú"ú)RUYKAéCúñú'4*úòú)RUYKúíú5VKTú$ú'\M(UJ_úðúéìèåúñú'4*úòú5VKTAéCúíú)RUYKAéCú"ú'\M(UJ_úðúìãåúñ!
(KGX+TM[RLOTMú#úòú5VKTú$ú)RUYKú'4*ú5VKTAéCú"ú)RUYKAéCúñú'4*úòú5VKTú$ú)RUYKAéCú'4*ú)RUYKú"ú5VKTAéCúñú'4*úòú5VKTúíú)RUYKú$ú'\M(UJ_úðúéìèåúñú'4*úòú)RUYKAéCúíú5VKTAéCú"ú'\M(UJ_úðúìãåúñ!
Finally, when the market is in a downtrend and we find a Bullish Engulfing pattern, we store the high of the current bar in the variable 2UTM+TZX_6XOIK. Likewise, when the market is in an uptrend and we find a Bearish Engulfing pattern, we store the low of the current bar in the variable 9NUXZ+TZX_6XOIK.
/Lú*U]T:XKTJúGTJú([RR+TM[RLOTMúZNKTú2UTM+TZX_6XOIKú#ú.OMN!/Lú;V:XKTJúGTJú(KGX+TM[RLOTMúZNKTú9NUXZ+TZX_VXOIKú#ú2U]!
2UTMú+TZXOKYúTo place the long entry, we use the Most Recent Occurrence (385) function to make sure that at least once during the last 3 bars, the market has been in a downtrend and we found a Bullish
Inputs Default Description
Price Close Price used to calculate exponential average.
Length 10Period, defined in number of bars, to use in calculating the exponential average.
BodyLen 10Number of bars to use in calculating the average size of the real body.
+GY_2GTM[GMKúVXU\OJKYúZ]UúL[TIZOUTYîú(KGXOYN+TM[RLOTMúGTJú([RROYN+TM[RLOTMîú]NOINúLOTJúZNKúKTM[RLOTMúVGZZKXTYúLUXú_U[ìú
=KúIU[RJúNG\Kú[YKJúZNKYKúL[TIZOUTYúOTúZNOYúY_YZKSúH[ZúJKIOJKJúOTYZKGJúZUú]XOZKúU[XúU]TúIXOZKXOGìú
èäúúúúúúúúúú([RROYNúôú(KGXOYNú+TM[RLOTMú6GZZKXTYúúúúúúúúúú 5SKMGú8KYKGXINú9_YZKSú:XGJOTMúGTJú*K\KRUVSKTZú)R[Húíú<UR[SKúç
Engulfing pattern. We also make sure we are not currently in a long position. If these two criteria are true, we place a buy stop order at the high price we captured in the variable 2UTM+TZX_6XOIK during our setup calculations.
/Lú385òú*U]T:XKTJúGTJú([RR+TM[RLOTMîúçúîúéñú$úíéú'4*ú3GXQKZ6UYOZOUTú"$úéúZNKT([_úTK^ZúHGXúGZú2UTM+TZX_6XOIKú9ZUV!
9NUXZú+TZXOKYúThe short side is similar to the long side. To place the short entry, we use the 385 function to make sure that at least once during the last 3 bars, the market has been in an uptrend and we found a Bearish Engulfing pattern. We also make sure we are not currently in a short position. If these two criteria are true, we place a sell stop order at the low price we captured in the variable 9NUXZ+TZX_6XOIK during our setup calculations.
/Lú385òú;V:XKTJúGTJú(KGX+TM[RLOTMîúçúîúéñú$úíéú'4*ú3GXQKZ6UYOZOUTú"$úíéúZNKT9KRRúTK^ZúHGXúGZú9NUXZ+TZX_6XOIKú9ZUV!
As discussed in Chapter 2 of the previous volume, the 385 function enables you to specify criteria to look for, the number of occurrences that you want to look for, and the number of bars back to search. The function then returns the bar number on which the most recent occurrence of the criteria you specified occurred. It has to have occurred the specified number of times in order to return the number of the bar for the most recent occurrence. If the criteria was not found during the number of bars you specified, or the necessary number of occurrences was not found, the function returns -1.
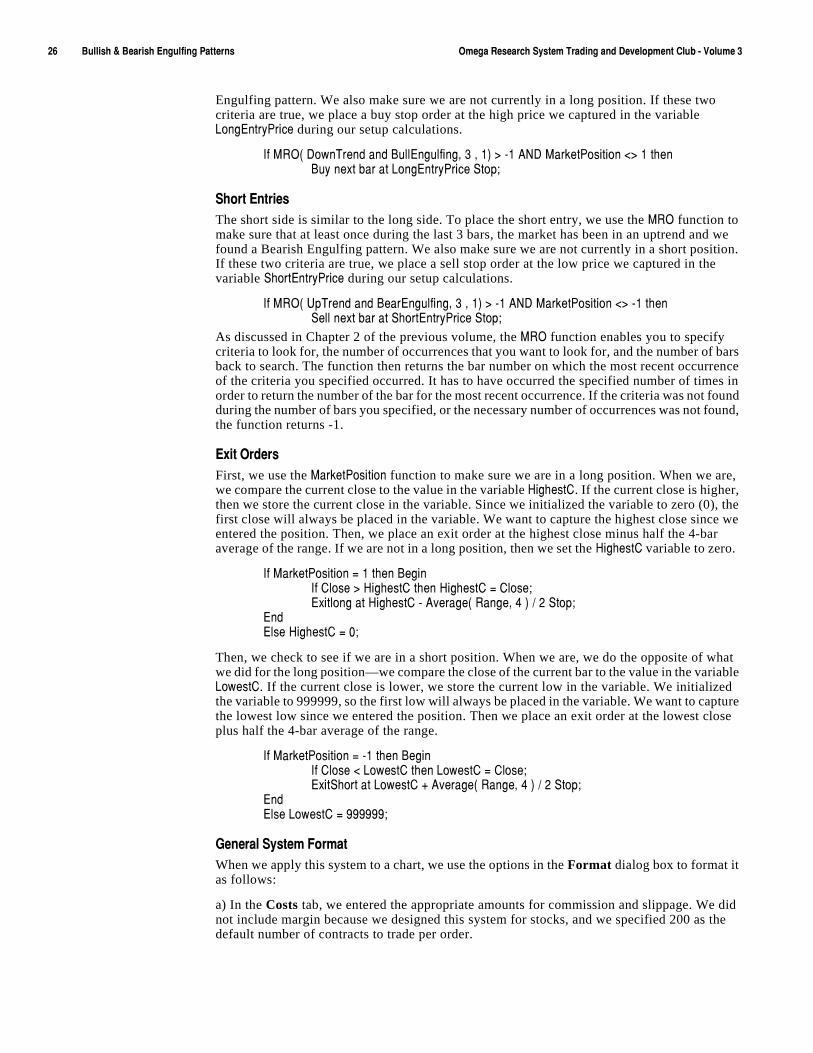
+^OZú5XJKXYFirst, we use the 3GXQKZ6UYOZOUT function to make sure we are in a long position. When we are, we compare the current close to the value in the variable .OMNKYZ). If the current close is higher, then we store the current close in the variable. Since we initialized the variable to zero (0), the first close will always be placed in the variable. We want to capture the highest close since we entered the position. Then, we place an exit order at the highest close minus half the 4-bar average of the range. If we are not in a long position, then we set the .OMNKYZ) variable to zero.
/Lú3GXQKZ6UYOZOUTú#úéúZNKTú(KMOT/Lú)RUYKú$ú.OMNKYZ)úZNKTú.OMNKYZ)ú#ú)RUYK!+^OZRUTMúGZú.OMNKYZ)úíú'\KXGMKòú8GTMKîúæúñúëúèú9ZUV!
+TJ+RYKú.OMNKYZ)ú#úê!
Then, we check to see if we are in a short position. When we are, we do the opposite of what we did for the long position—we compare the close of the current bar to the value in the variable 2U]KYZ). If the current close is lower, we store the current low in the variable. We initialized the variable to 999999, so the first low will always be placed in the variable. We want to capture the lowest low since we entered the position. Then we place an exit order at the lowest close plus half the 4-bar average of the range.
/Lú3GXQKZ6UYOZOUTú#úíéúZNKTú(KMOT/Lú)RUYKú"ú2U]KYZ)úZNKTú2U]KYZ)ú#ú)RUYK!+^OZ9NUXZúGZú2U]KYZ)úïú'\KXGMKòú8GTMKîúæúñúëúèú9ZUV!
+TJú+RYKú2U]KYZ)ú#úáááááá!
-KTKXGRú9_YZKSú,UXSGZWhen we apply this system to a chart, we use the options in the Format dialog box to format it as follows:
a) In the Costs tab, we entered the appropriate amounts for commission and slippage. We did not include margin because we designed this system for stocks, and we specified 200 as the default number of contracts to trade per order.
)NGVZKXúèúúúúúú:XKTJOTMú9_YZKSY ([RROYNúôú(KGXOYNú+TM[RLOTMú6GZZKXTYúúúúúúúúúúèã
Note: Remember that commissions are calculated on a per contract/share basis. When you are trading stocks, you would enter the average commission you are charged divided by the number of shares the system is buying and selling. In this system, this is determined by the Default Contracts option on this tab.
b) Under the Stops tab, we enabled a money management stop (the Money Mngmnt check box) and entered an appropriate dollar amount in the edit box. This option can hold the dollar amount per position or dollar amount per contract/share you want to risk before exiting out of the position.
Note: When you are trading stocks and you choose the stop to be tracked on a per share (contract) basis, you will type in the number of points you are willing to lose before you are exited out. When you are trading futures or any instrument that has a different dollar-point value, you would type the maximum number of dollars you are willing to risk per contract traded.
c) In the Properties tab, we selected the Do not allow multiple entries in same direction option. If the system is in a long position and market conditions generate another long entry order, the order is ignored. This is also the case when we’re in a short position and market conditions generate another short entry order.
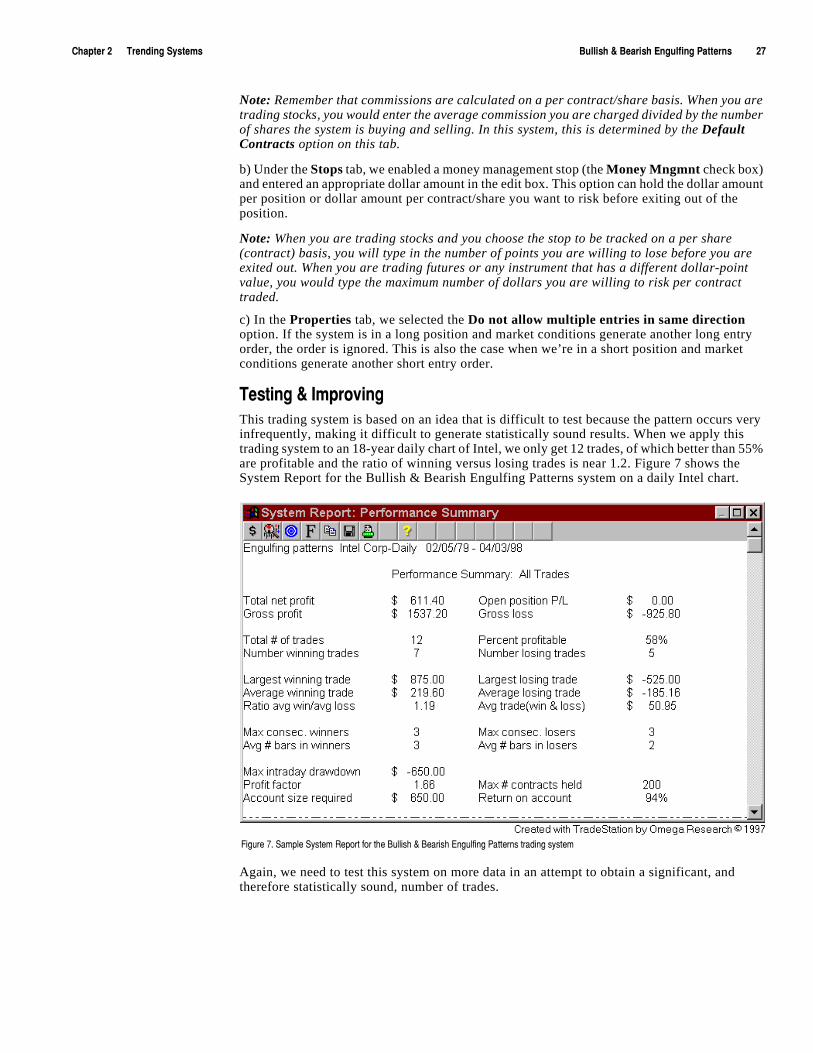
:KYZOTMúôú/SVXU\OTMThis trading system is based on an idea that is difficult to test because the pattern occurs very infrequently, making it difficult to generate statistically sound results. When we apply this trading system to an 18-year daily chart of Intel, we only get 12 trades, of which better than 55% are profitable and the ratio of winning versus losing trades is near 1.2. Figure 7 shows the System Report for the Bullish & Bearish Engulfing Patterns system on a daily Intel chart.
Again, we need to test this system on more data in an attempt to obtain a significant, and therefore statistically sound, number of trades.
,OM[XKúãìú9GSVRKú9_YZKSú8KVUXZúLUXúZNKú([RROYNúôú(KGXOYNú+TM[RLOTMú6GZZKXTYúZXGJOTMúY_YZKS
èâúúúúúúúúúú5VKTí)RUYKú.OYZUMXGSúúúúúúúúúú 5SKMGú8KYKGXINú9_YZKSú:XGJOTMúGTJú*K\KRUVSKTZú)R[Húíú<UR[SKúç
9[MMKYZOUTYúLUXú/SVXU\KSKTZThe timing of the entries seems to be acceptable; however, the exit criteria seems to be affecting the profitability of some of the trades by exiting us from the market before the big move occurs. Therefore, we may want to relax the exit criteria to give the trades some room to move. However, we have to keep in mind that this will affect our drawdown.
Also, this system attempts to pick tops and bottoms, i.e., the point at which a downtrend is reversing and vice versa, so we may want to use an additional filter like the RSI, Stochastic or another oversold/overbought oscillator to confirm the reversal.
5VKTí)RUYKú.OYZUMXGSThe Open-Close Histogram trading system is one of the few systems we’ve presented that includes the opening price in its calculations. The system idea is based on the observation that in an uptrend, a market generally closes above its open, and in a downtrend, a market generally closes below its open. This relationship is certainly not true on every bar, because the market tends to go through correction periods during trending periods, but it’s true on average.
Therefore, we will use the relationship between the open and close prices to determine whether the market is in an uptrend on in a downtrend. We will calculate an exponential moving average of the last 10 opens and the exponential moving average of the last 10 closes. We will then subtract the exponential average of the opens from the exponential average of the closes and draw the difference as a histogram.
When the histogram crosses from below zero to above zero, it means that the average close is greater than the average open and the market is in an uptrend; conversely, when the histogram crosses from above zero to below zero, it means that the average close is less than the average open and the market is in a downtrend.
To enter a long position, we will wait for the histogram to cross from below zero to above zero. Then, we’ll place a buy stop at the high of that bar plus half the 10-bar average true range. The buy stop will remain in effect at that price for 10 bars or until the histogram crosses from above zero to below zero, whichever occurs first.
Once we enter a long position, we’ll set a protective stop at the low of the bar where the histogram crossed over zero minus half of the 10-bar average true range. Also, we will exit from the long position whenever the histogram crosses under zero.
To enter a short position, we will wait for the histogram to cross from above zero to below zero. Then, we’ll place a sell stop at the low of that price bar minus half of the 10-bar average true range. The sell stop will remain in effect at that price for 10-bars or until the histogram crosses from below zero to above zero, whichever occurs first.
Once we enter into a short position, we’ll set our protective stop at the high of the bar on which the histogram crossed under zero plus half of the average true range. We will exit from the short position when the histogram crosses above zero.
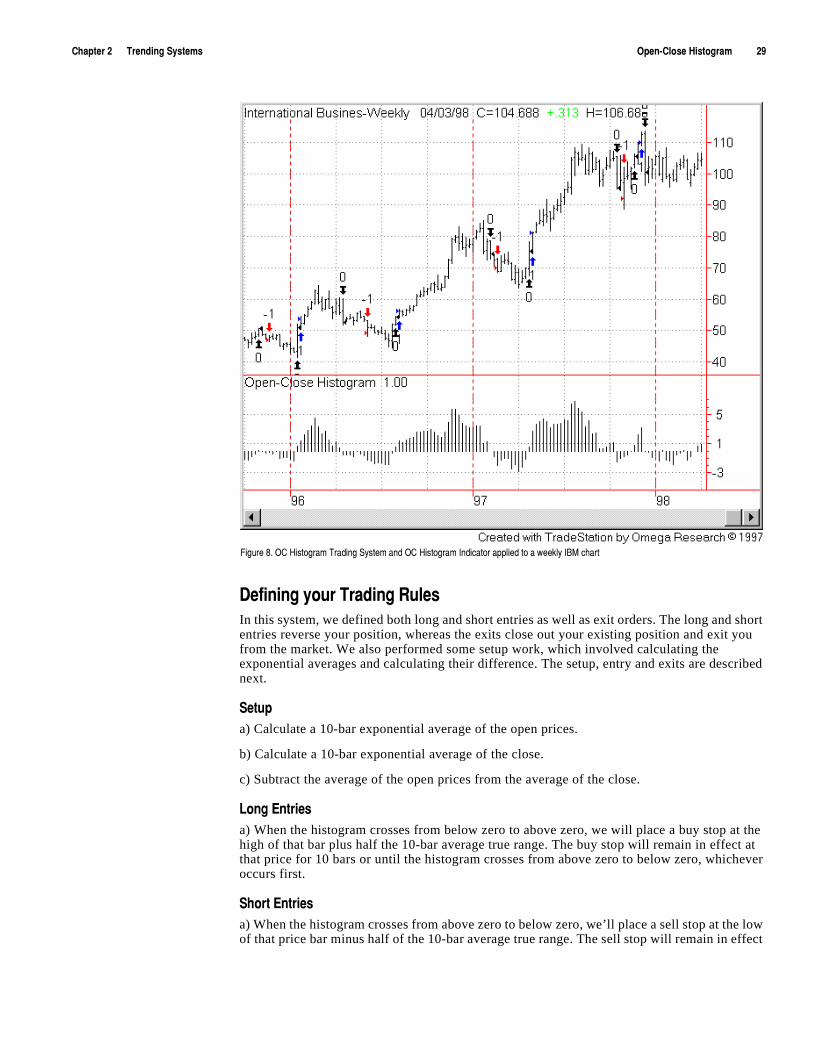
Figure 8 shows the Open-Close Histogram system applied to a weekly chart of IBM. We also applied the OC Histogram Indicator, which we wrote and included on your CD (STAD3: OC Histogram).
)NGVZKXúèúúúúúú:XKTJOTMú9_YZKSY 5VKTí)RUYKú.OYZUMXGSúúúúúúúúúúèá
*KLOTOTMú_U[Xú:XGJOTMú8[RKYIn this system, we defined both long and short entries as well as exit orders. The long and short entries reverse your position, whereas the exits close out your existing position and exit you from the market. We also performed some setup work, which involved calculating the exponential averages and calculating their difference. The setup, entry and exits are described next.
9KZ[Vúa) Calculate a 10-bar exponential average of the open prices.
b) Calculate a 10-bar exponential average of the close.
c) Subtract the average of the open prices from the average of the close.
2UTMú+TZXOKYúa) When the histogram crosses from below zero to above zero, we will place a buy stop at the high of that bar plus half the 10-bar average true range. The buy stop will remain in effect at that price for 10 bars or until the histogram crosses from above zero to below zero, whichever occurs first.
9NUXZú+TZXOKYúa) When the histogram crosses from above zero to below zero, we’ll place a sell stop at the low of that price bar minus half of the 10-bar average true range. The sell stop will remain in effect
,OM[XKúâìú5)ú.OYZUMXGSú:XGJOTMú9_YZKSúGTJú5)ú.OYZUMXGSú/TJOIGZUXúGVVROKJúZUúGú]KKQR_ú/(3úINGXZú
çêúúúúúúúúúú5VKTí)RUYKú.OYZUMXGSúúúúúúúúúú 5SKMGú8KYKGXINú9_YZKSú:XGJOTMúGTJú*K\KRUVSKTZú)R[Húíú<UR[SKúç
at that price for 10-bars or until the histogram crosses from below zero to above zero, whichever occurs first.
+^OZYúa) We will exit from the long position whenever the histogram crosses under zero.
b) Also, on the first bar of the long position, we’ll set a protective stop at the low of the bar where the histogram crossed over zero minus half of the 10-bar average true range.
c) We will exit from the short position when the histogram crosses above zero.
d) Also, once we enter into a short position, we’ll set a protective stop at the high of the bar on which the histogram crossed under zero plus half of the average true range.
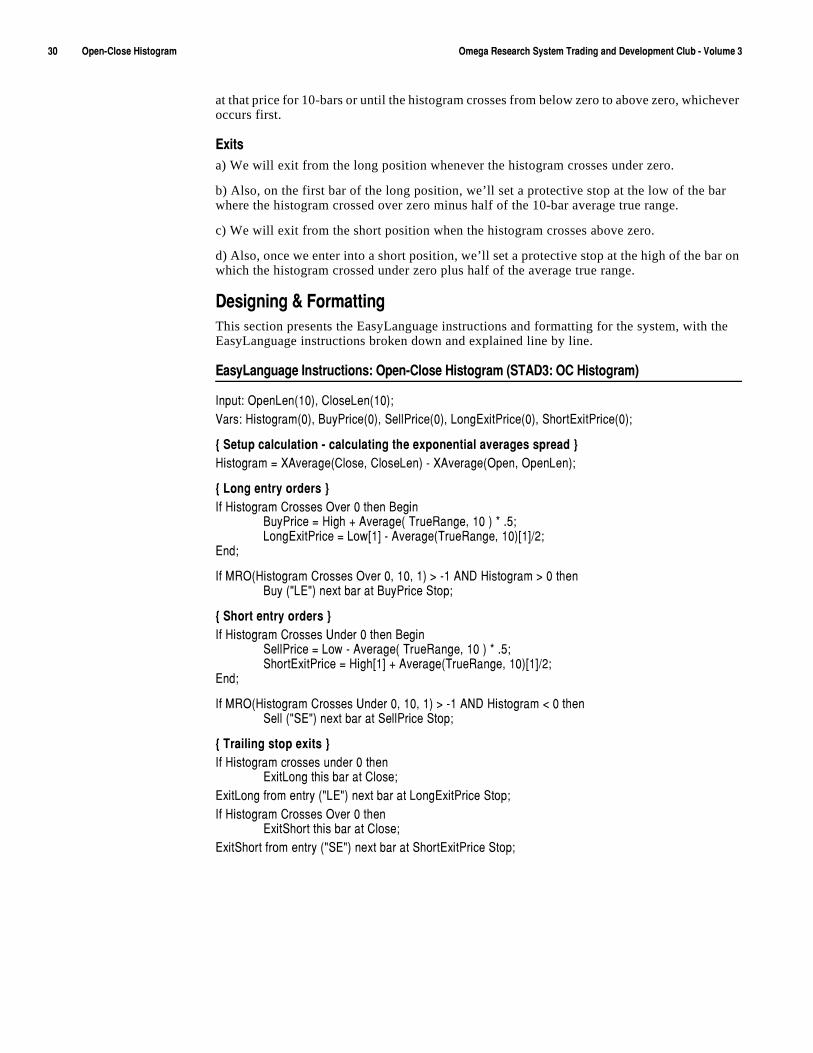
*KYOMTOTMúôú,UXSGZZOTMThis section presents the EasyLanguage instructions and formatting for the system, with the EasyLanguage instructions broken down and explained line by line.
+GY_2GTM[GMKú/TYZX[IZOUTY ú5VKTí)RUYKú.OYZUMXGSúò9:'*ç ú5)ú.OYZUMXGSñ
/TV[Z ú5VKT2KTòéêñîú)RUYK2KTòéêñ!<GXY ú.OYZUMXGSòêñîú([_6XOIKòêñîú9KRR6XOIKòêñîú2UTM+^OZ6XOIKòêñîú9NUXZ+^OZ6XOIKòêñ!
aú9KZ[VúIGRI[RGZOUTúíúIGRI[RGZOTMúZNKúK^VUTKTZOGRúG\KXGMKYúYVXKGJúc.OYZUMXGSú#ú>'\KXGMKò)RUYKîú)RUYK2KTñúíú>'\KXGMKò5VKTîú5VKT2KTñ!
aú2UTMúKTZX_úUXJKXYúc/Lú.OYZUMXGSú)XUYYKYú5\KXúêúZNKTú(KMOT
([_6XOIKú#ú.OMNúïú'\KXGMKòú:X[K8GTMKîúéêúñúðúìå!2UTM+^OZ6XOIKú#ú2U]AéCúíú'\KXGMKò:X[K8GTMKîúéêñAéCëè!
+TJ!
/Lú385ò.OYZUMXGSú)XUYYKYú5\KXúêîúéêîúéñú$úíéú'4*ú.OYZUMXGSú$úêúZNKT([_úòø2+øñúTK^ZúHGXúGZú([_6XOIKú9ZUV!
aú9NUXZúKTZX_úUXJKXYúc/Lú.OYZUMXGSú)XUYYKYú;TJKXúêúZNKTú(KMOT
9KRR6XOIKú#ú2U]úíú'\KXGMKòú:X[K8GTMKîúéêúñúðúìå!9NUXZ+^OZ6XOIKú#ú.OMNAéCúïú'\KXGMKò:X[K8GTMKîúéêñAéCëè!
+TJ!
/Lú385ò.OYZUMXGSú)XUYYKYú;TJKXúêîúéêîúéñú$úíéú'4*ú.OYZUMXGSú"úêúZNKT9KRRúòø9+øñúTK^ZúHGXúGZú9KRR6XOIKú9ZUV!
aú:XGOROTMúYZUVúK^OZYúc/Lú.OYZUMXGSúIXUYYKYú[TJKXúêúZNKT
+^OZ2UTMúZNOYúHGXúGZú)RUYK!+^OZ2UTMúLXUSúKTZX_úòø2+øñúTK^ZúHGXúGZú2UTM+^OZ6XOIKú9ZUV!/Lú.OYZUMXGSú)XUYYKYú5\KXúêúZNKT
+^OZ9NUXZúZNOYúHGXúGZú)RUYK!+^OZ9NUXZúLXUSúKTZX_úòø9+øñúTK^ZúHGXúGZú9NUXZ+^OZ6XOIKú9ZUV!
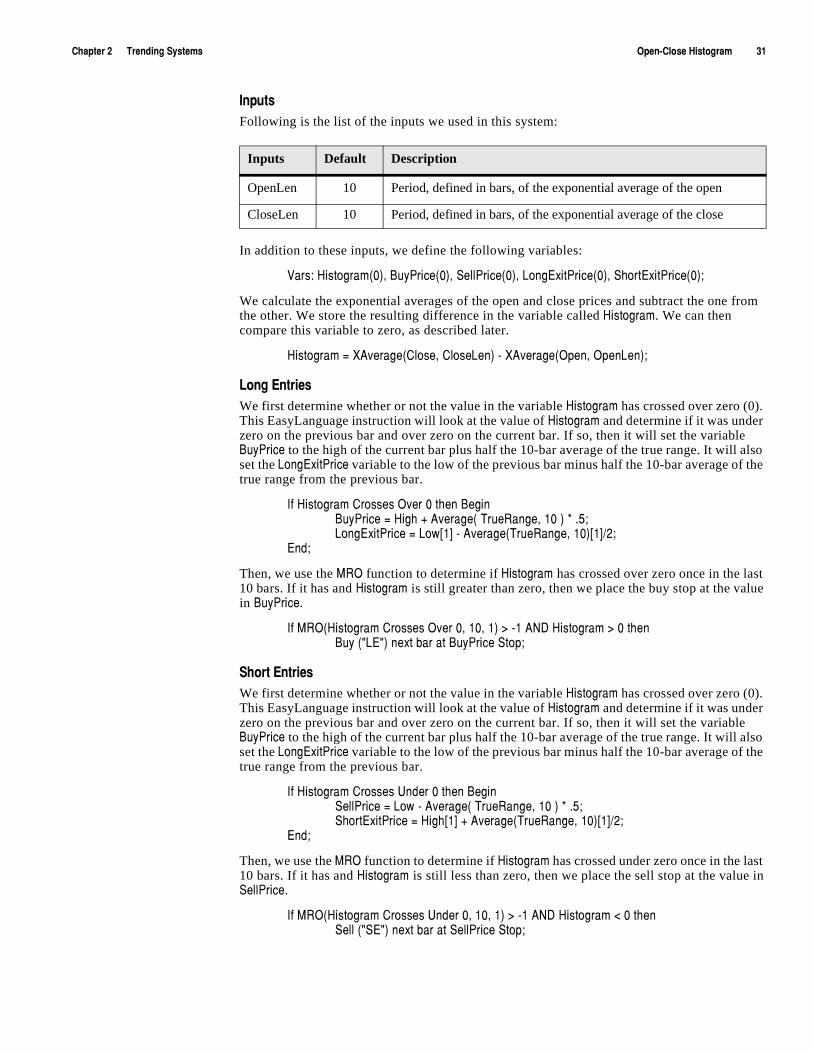
)NGVZKXúèúúúúúú:XKTJOTMú9_YZKSY 5VKTí)RUYKú.OYZUMXGSúúúúúúúúúúçé
/TV[ZYFollowing is the list of the inputs we used in this system:
In addition to these inputs, we define the following variables:
<GXY ú.OYZUMXGSòêñîú([_6XOIKòêñîú9KRR6XOIKòêñîú2UTM+^OZ6XOIKòêñîú9NUXZ+^OZ6XOIKòêñ!
We calculate the exponential averages of the open and close prices and subtract the one from the other. We store the resulting difference in the variable called .OYZUMXGS. We can then compare this variable to zero, as described later.
.OYZUMXGSú#ú>'\KXGMKò)RUYKîú)RUYK2KTñúíú>'\KXGMKò5VKTîú5VKT2KTñ!
2UTMú+TZXOKYWe first determine whether or not the value in the variable .OYZUMXGS has crossed over zero (0). This EasyLanguage instruction will look at the value of .OYZUMXGS and determine if it was under zero on the previous bar and over zero on the current bar. If so, then it will set the variable ([_6XOIK to the high of the current bar plus half the 10-bar average of the true range. It will also set the 2UTM+^OZ6XOIK variable to the low of the previous bar minus half the 10-bar average of the true range from the previous bar.
/Lú.OYZUMXGSú)XUYYKYú5\KXúêúZNKTú(KMOT([_6XOIKú#ú.OMNúïú'\KXGMKòú:X[K8GTMKîúéêúñúðúìå!2UTM+^OZ6XOIKú#ú2U]AéCúíú'\KXGMKò:X[K8GTMKîúéêñAéCëè!
+TJ!
Then, we use the 385 function to determine if .OYZUMXGS has crossed over zero once in the last 10 bars. If it has and .OYZUMXGS is still greater than zero, then we place the buy stop at the value in ([_6XOIK.
/Lú385ò.OYZUMXGSú)XUYYKYú5\KXúêîúéêîúéñú$úíéú'4*ú.OYZUMXGSú$úêúZNKT([_úòø2+øñúTK^ZúHGXúGZú([_6XOIKú9ZUV!
9NUXZú+TZXOKYWe first determine whether or not the value in the variable .OYZUMXGS has crossed over zero (0). This EasyLanguage instruction will look at the value of .OYZUMXGS and determine if it was under zero on the previous bar and over zero on the current bar. If so, then it will set the variable ([_6XOIK to the high of the current bar plus half the 10-bar average of the true range. It will also set the 2UTM+^OZ6XOIK variable to the low of the previous bar minus half the 10-bar average of the true range from the previous bar.
/Lú.OYZUMXGSú)XUYYKYú;TJKXúêúZNKTú(KMOT9KRR6XOIKú#ú2U]úíú'\KXGMKòú:X[K8GTMKîúéêúñúðúìå!9NUXZ+^OZ6XOIKú#ú.OMNAéCúïú'\KXGMKò:X[K8GTMKîúéêñAéCëè!
+TJ!
Then, we use the 385 function to determine if .OYZUMXGS has crossed under zero once in the last 10 bars. If it has and .OYZUMXGS is still less than zero, then we place the sell stop at the value in 9KRR6XOIK.
/Lú385ò.OYZUMXGSú)XUYYKYú;TJKXúêîúéêîúéñú$úíéú'4*ú.OYZUMXGSú"úêúZNKT9KRRúòø9+øñúTK^ZúHGXúGZú9KRR6XOIKú9ZUV!
Inputs Default Description
OpenLen 10 Period, defined in bars, of the exponential average of the open
CloseLen 10 Period, defined in bars, of the exponential average of the close
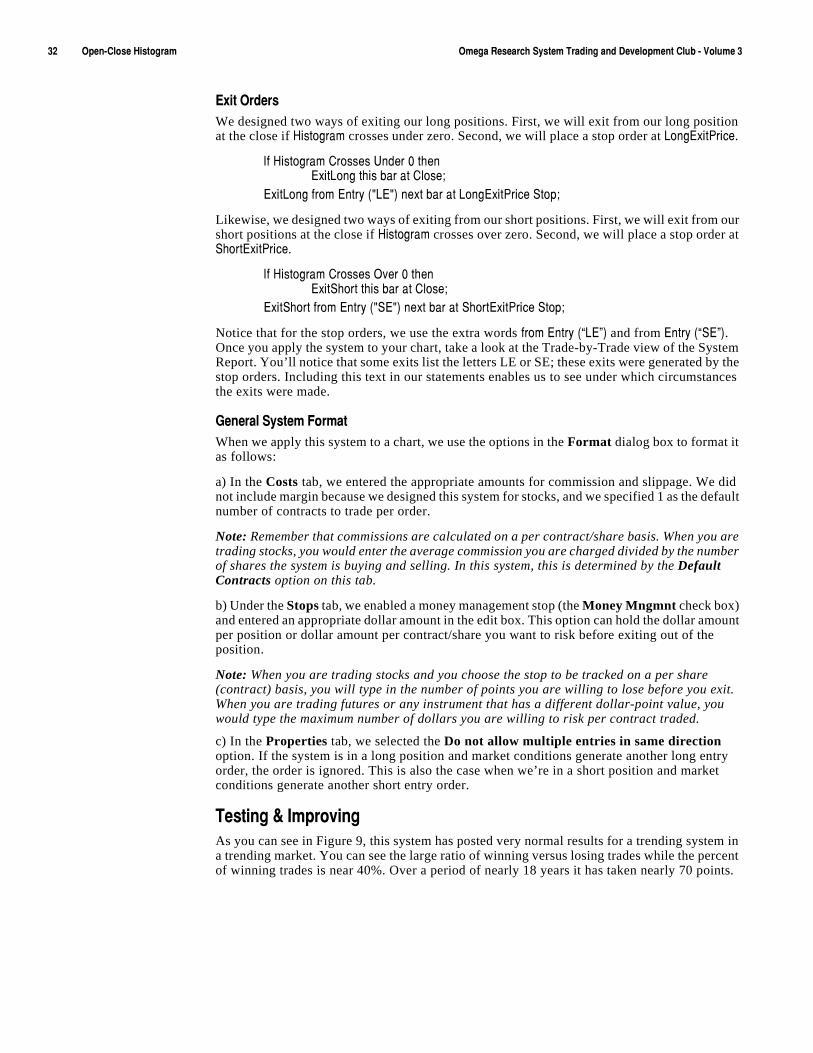
çèúúúúúúúúúú5VKTí)RUYKú.OYZUMXGSúúúúúúúúúú 5SKMGú8KYKGXINú9_YZKSú:XGJOTMúGTJú*K\KRUVSKTZú)R[Húíú<UR[SKúç
+^OZú5XJKXYWe designed two ways of exiting our long positions. First, we will exit from our long position at the close if .OYZUMXGS crosses under zero. Second, we will place a stop order at 2UTM+^OZ6XOIK.
/Lú.OYZUMXGSú)XUYYKYú;TJKXúêúZNKT+^OZ2UTMúZNOYúHGXúGZú)RUYK!
+^OZ2UTMúLXUSú+TZX_úòø2+øñúTK^ZúHGXúGZú2UTM+^OZ6XOIKú9ZUV!
Likewise, we designed two ways of exiting from our short positions. First, we will exit from our short positions at the close if .OYZUMXGS crosses over zero. Second, we will place a stop order at 9NUXZ+^OZ6XOIK.
/Lú.OYZUMXGSú)XUYYKYú5\KXúêúZNKT+^OZ9NUXZúZNOYúHGXúGZú)RUYK!
+^OZ9NUXZúLXUSú+TZX_úòø9+øñúTK^ZúHGXúGZú9NUXZ+^OZ6XOIKú9ZUV!
Notice that for the stop orders, we use the extra words LXUSú+TZX_úò¦2+§ñúand fromú+TZX_úò¦9+§ñ. Once you apply the system to your chart, take a look at the Trade-by-Trade view of the System Report. You’ll notice that some exits list the letters LE or SE; these exits were generated by the stop orders. Including this text in our statements enables us to see under which circumstances the exits were made.
-KTKXGRú9_YZKSú,UXSGZWhen we apply this system to a chart, we use the options in the Format dialog box to format it as follows:
a) In the Costs tab, we entered the appropriate amounts for commission and slippage. We did not include margin because we designed this system for stocks, and we specified 1 as the default number of contracts to trade per order.
Note: Remember that commissions are calculated on a per contract/share basis. When you are trading stocks, you would enter the average commission you are charged divided by the number of shares the system is buying and selling. In this system, this is determined by the Default Contracts option on this tab.
b) Under the Stops tab, we enabled a money management stop (the Money Mngmnt check box) and entered an appropriate dollar amount in the edit box. This option can hold the dollar amount per position or dollar amount per contract/share you want to risk before exiting out of the position.
Note: When you are trading stocks and you choose the stop to be tracked on a per share (contract) basis, you will type in the number of points you are willing to lose before you exit. When you are trading futures or any instrument that has a different dollar-point value, you would type the maximum number of dollars you are willing to risk per contract traded.
c) In the Properties tab, we selected the Do not allow multiple entries in same direction option. If the system is in a long position and market conditions generate another long entry order, the order is ignored. This is also the case when we’re in a short position and market conditions generate another short entry order.
:KYZOTMúôú/SVXU\OTMAs you can see in Figure 9, this system has posted very normal results for a trending system in a trending market. You can see the large ratio of winning versus losing trades while the percent of winning trades is near 40%. Over a period of nearly 18 years it has taken nearly 70 points.
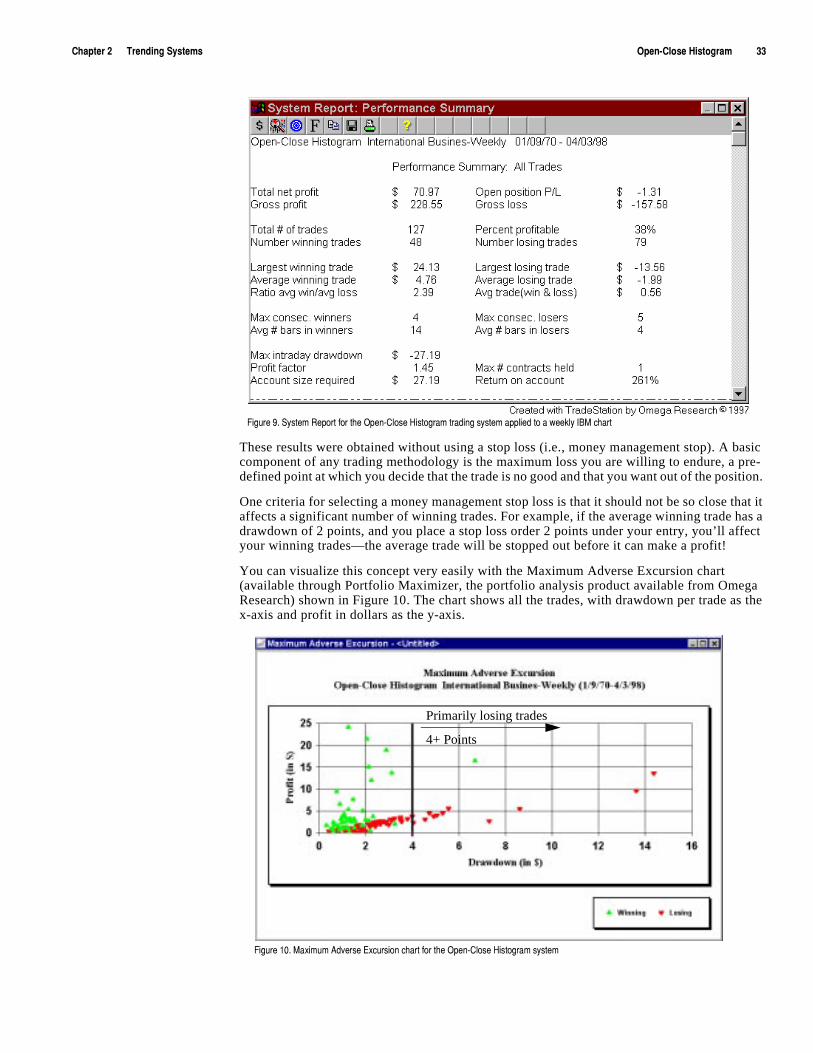
)NGVZKXúèúúúúúú:XKTJOTMú9_YZKSY 5VKTí)RUYKú.OYZUMXGSúúúúúúúúúúçç
These results were obtained without using a stop loss (i.e., money management stop). A basic component of any trading methodology is the maximum loss you are willing to endure, a pre-defined point at which you decide that the trade is no good and that you want out of the position.
One criteria for selecting a money management stop loss is that it should not be so close that it affects a significant number of winning trades. For example, if the average winning trade has a drawdown of 2 points, and you place a stop loss order 2 points under your entry, you’ll affect your winning trades—the average trade will be stopped out before it can make a profit!
You can visualize this concept very easily with the Maximum Adverse Excursion chart (available through Portfolio Maximizer, the portfolio analysis product available from Omega Research) shown in Figure 10. The chart shows all the trades, with drawdown per trade as the x-axis and profit in dollars as the y-axis.
,OM[XKúáìú9_YZKSú8KVUXZúLUXúZNKú5VKTí)RUYKú.OYZUMXGSúZXGJOTMúY_YZKSúGVVROKJúZUúGú]KKQR_ú/(3úINGXZú
Primarily losing trades
4+ Points
,OM[XKúéêìú3G^OS[Sú'J\KXYKú+^I[XYOUTúINGXZúLUXúZNKú5VKTí)RUYKú.OYZUMXGSúY_YZKS
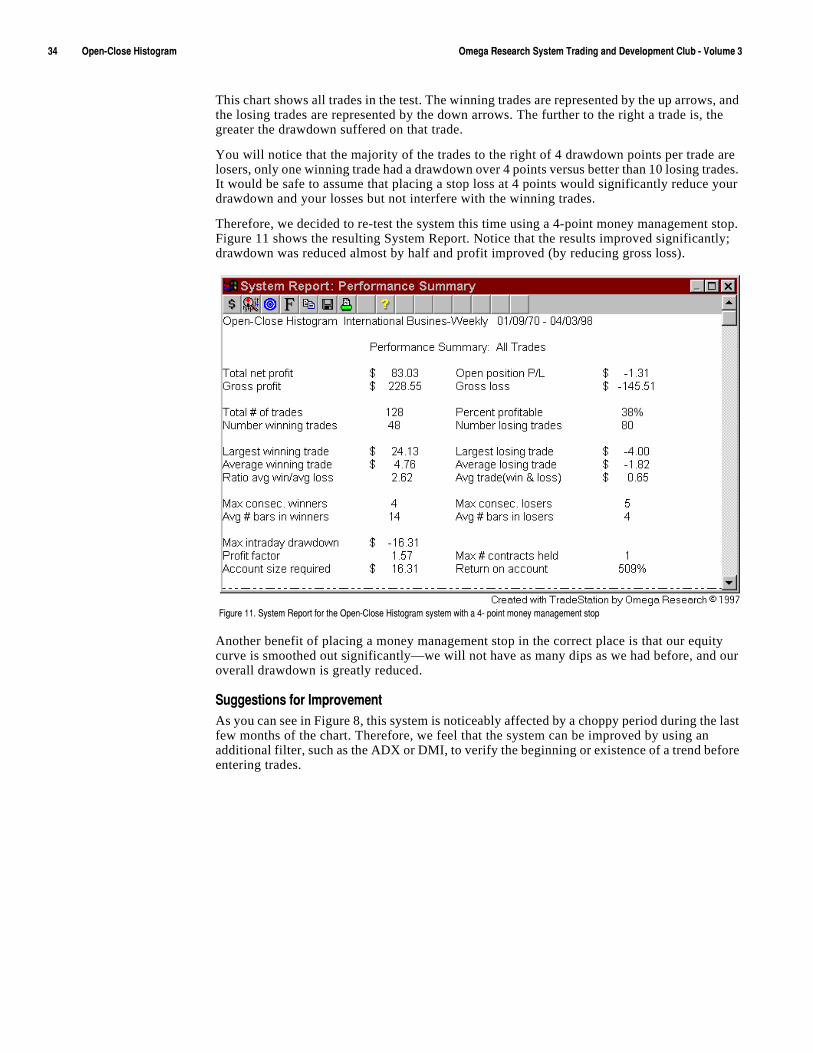
çæúúúúúúúúúú5VKTí)RUYKú.OYZUMXGSúúúúúúúúúú 5SKMGú8KYKGXINú9_YZKSú:XGJOTMúGTJú*K\KRUVSKTZú)R[Húíú<UR[SKúç
This chart shows all trades in the test. The winning trades are represented by the up arrows, and the losing trades are represented by the down arrows. The further to the right a trade is, the greater the drawdown suffered on that trade.
You will notice that the majority of the trades to the right of 4 drawdown points per trade are losers, only one winning trade had a drawdown over 4 points versus better than 10 losing trades. It would be safe to assume that placing a stop loss at 4 points would significantly reduce your drawdown and your losses but not interfere with the winning trades.
Therefore, we decided to re-test the system this time using a 4-point money management stop. Figure 11 shows the resulting System Report. Notice that the results improved significantly; drawdown was reduced almost by half and profit improved (by reducing gross loss).
Another benefit of placing a money management stop in the correct place is that our equity curve is smoothed out significantly—we will not have as many dips as we had before, and our overall drawdown is greatly reduced.
9[MMKYZOUTYúLUXú/SVXU\KSKTZAs you can see in Figure 8, this system is noticeably affected by a choppy period during the last few months of the chart. Therefore, we feel that the system can be improved by using an additional filter, such as the ADX or DMI, to verify the beginning or existence of a trend before entering trades.
,OM[XKúééìú9_YZKSú8KVUXZúLUXúZNKú5VKTí)RUYKú.OYZUMXGSúY_YZKSú]OZNúGúæíúVUOTZúSUTK_úSGTGMKSKTZúYZUV

C H A P T E R 3
9[VVUXZúôú8KYOYZGTIKú9_YZKSY
Support & Resistance systems are designed for sideways or directionless markets, and they typically have the following attributes:
� They buy low and sell high in an attempt to take advantage of the sideways price movement characterizing directionless markets.
� They have a high number of winning trades, with small profits on each trade. They sell as the market goes higher and take small losses until the market finally turns down and results in a profitable trade.
� They are easier to trade emotionally.
By design, these systems miss the big move—they usually have small profits and larger losses as markets trend. The system keeps shorting a market that is in an uptrend or buying a market that is in a downtrend. Therefore, when traders use Support &Resistance systems, they use them within a group of systems that also includes trending systems and perhaps one or more volatility systems.
In this chapter, we present four Support & Resistance systems that differ in their approach but that are all designed to make the most of the sideways movement of a market.
/Tú:NOYú)NGVZKX
� Bollinger Bands ..............................36
� On Balance True Range...................43
� Micro-M & Micro-W Formations....47
� Variable Zones .................................58
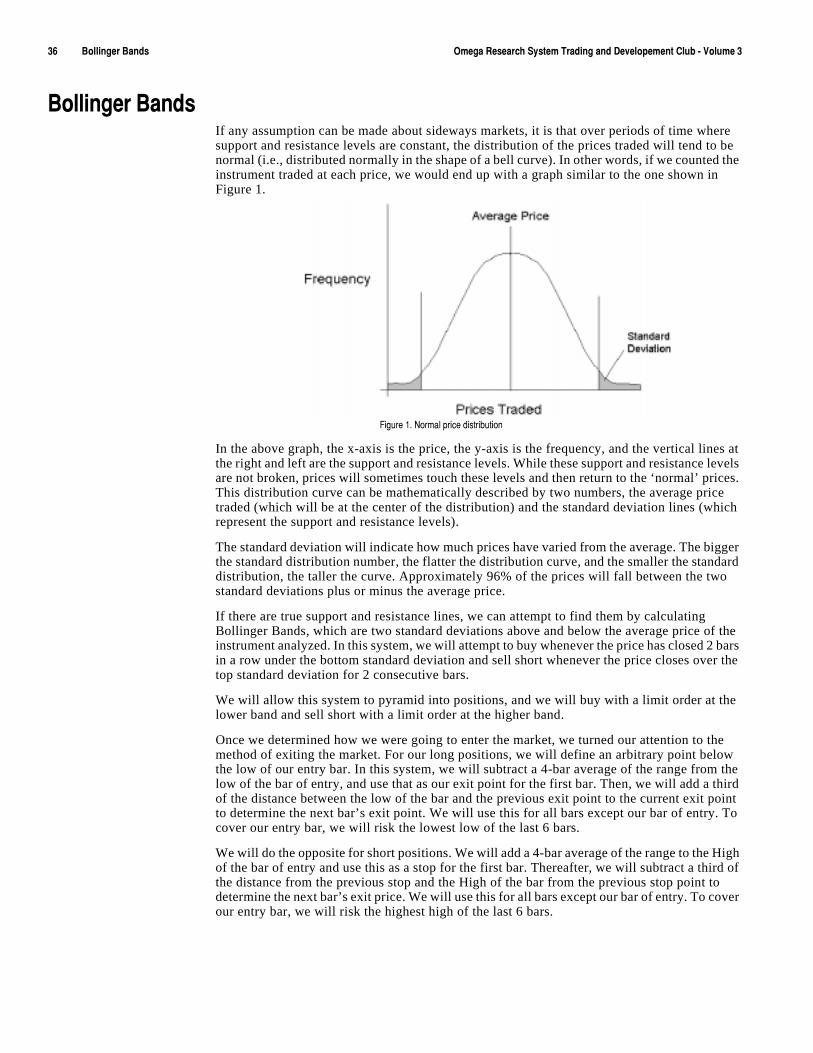
çäúúúúúúúúúú(URROTMKXú(GTJYúúúúúúúúúú 5SKMGú8KYKGXINú9_YZKSú:XGJOTMúGTJú*K\KRUVKSKTZú)R[Húíú<UR[SKúç
(URROTMKXú(GTJYIf any assumption can be made about sideways markets, it is that over periods of time where support and resistance levels are constant, the distribution of the prices traded will tend to be normal (i.e., distributed normally in the shape of a bell curve). In other words, if we counted the instrument traded at each price, we would end up with a graph similar to the one shown in Figure 1.
In the above graph, the x-axis is the price, the y-axis is the frequency, and the vertical lines at the right and left are the support and resistance levels. While these support and resistance levels are not broken, prices will sometimes touch these levels and then return to the ‘normal’ prices. This distribution curve can be mathematically described by two numbers, the average price traded (which will be at the center of the distribution) and the standard deviation lines (which represent the support and resistance levels).
The standard deviation will indicate how much prices have varied from the average. The bigger the standard distribution number, the flatter the distribution curve, and the smaller the standard distribution, the taller the curve. Approximately 96% of the prices will fall between the two standard deviations plus or minus the average price.
If there are true support and resistance lines, we can attempt to find them by calculating Bollinger Bands, which are two standard deviations above and below the average price of the instrument analyzed. In this system, we will attempt to buy whenever the price has closed 2 bars in a row under the bottom standard deviation and sell short whenever the price closes over the top standard deviation for 2 consecutive bars.
We will allow this system to pyramid into positions, and we will buy with a limit order at the lower band and sell short with a limit order at the higher band.
Once we determined how we were going to enter the market, we turned our attention to the method of exiting the market. For our long positions, we will define an arbitrary point below the low of our entry bar. In this system, we will subtract a 4-bar average of the range from the low of the bar of entry, and use that as our exit point for the first bar. Then, we will add a third of the distance between the low of the bar and the previous exit point to the current exit point to determine the next bar’s exit point. We will use this for all bars except our bar of entry. To cover our entry bar, we will risk the lowest low of the last 6 bars.
We will do the opposite for short positions. We will add a 4-bar average of the range to the High of the bar of entry and use this as a stop for the first bar. Thereafter, we will subtract a third of the distance from the previous stop and the High of the bar from the previous stop point to determine the next bar’s exit price. We will use this for all bars except our bar of entry. To cover our entry bar, we will risk the highest high of the last 6 bars.
,OM[XKúéìú4UXSGRúVXOIKúJOYZXOH[ZOUT
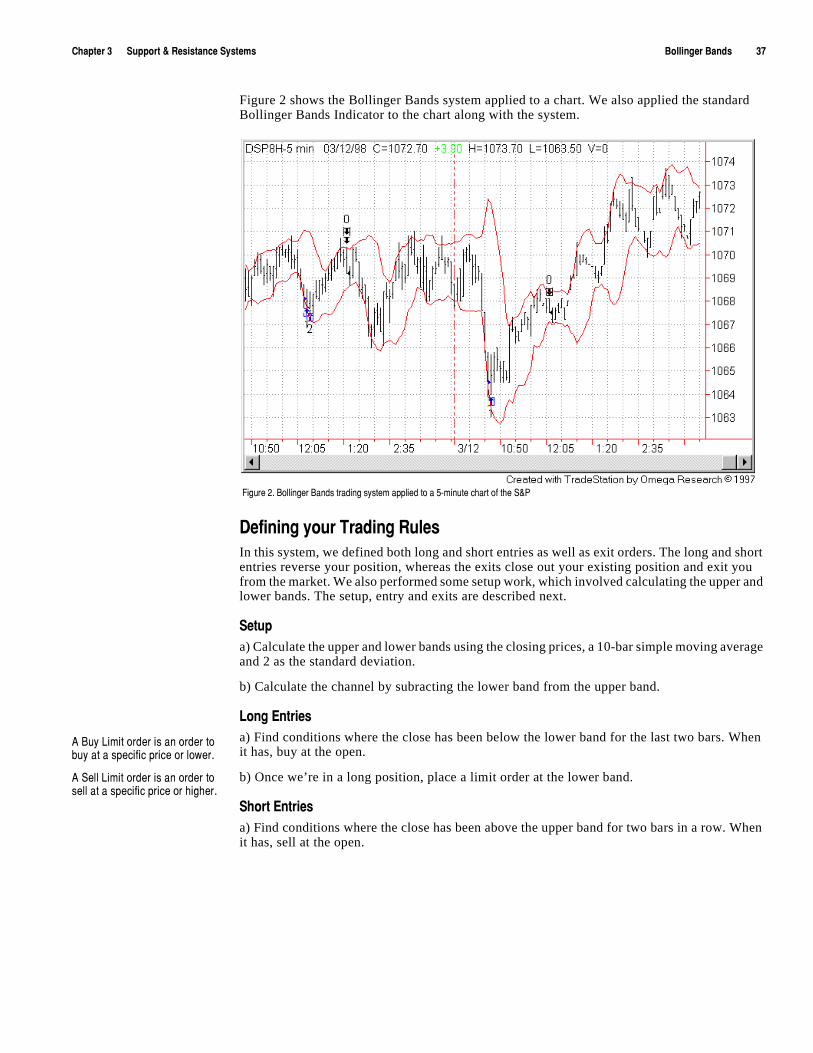
)NGVZKXúçúúúúúú9[VVUXZúôú8KYOYZGTIKú9_YZKSY (URROTMKXú(GTJYúúúúúúúúúúçã
Figure 2 shows the Bollinger Bands system applied to a chart. We also applied the standard Bollinger Bands Indicator to the chart along with the system.
*KLOTOTMú_U[Xú:XGJOTMú8[RKYIn this system, we defined both long and short entries as well as exit orders. The long and short entries reverse your position, whereas the exits close out your existing position and exit you from the market. We also performed some setup work, which involved calculating the upper and lower bands. The setup, entry and exits are described next.
9KZ[Vúa) Calculate the upper and lower bands using the closing prices, a 10-bar simple moving average and 2 as the standard deviation.
b) Calculate the channel by subracting the lower band from the upper band.
2UTMú+TZXOKYúa) Find conditions where the close has been below the lower band for the last two bars. When it has, buy at the open.
b) Once we’re in a long position, place a limit order at the lower band.
9NUXZú+TZXOKYúa) Find conditions where the close has been above the upper band for two bars in a row. When it has, sell at the open.
,OM[XKúèìú(URROTMKXú(GTJYúZXGJOTMúY_YZKSúGVVROKJúZUúGúåíSOT[ZKúINGXZúULúZNKú9ô6
'ú([_ú2OSOZúUXJKXúOYúGTúUXJKXúZUúH[_úGZúGúYVKIOLOIúVXOIKúUXúRU]KXì
'ú9KRRú2OSOZúUXJKXúOYúGTúUXJKXúZUúYKRRúGZúGúYVKIOLOIúVXOIKúUXúNOMNKXìú
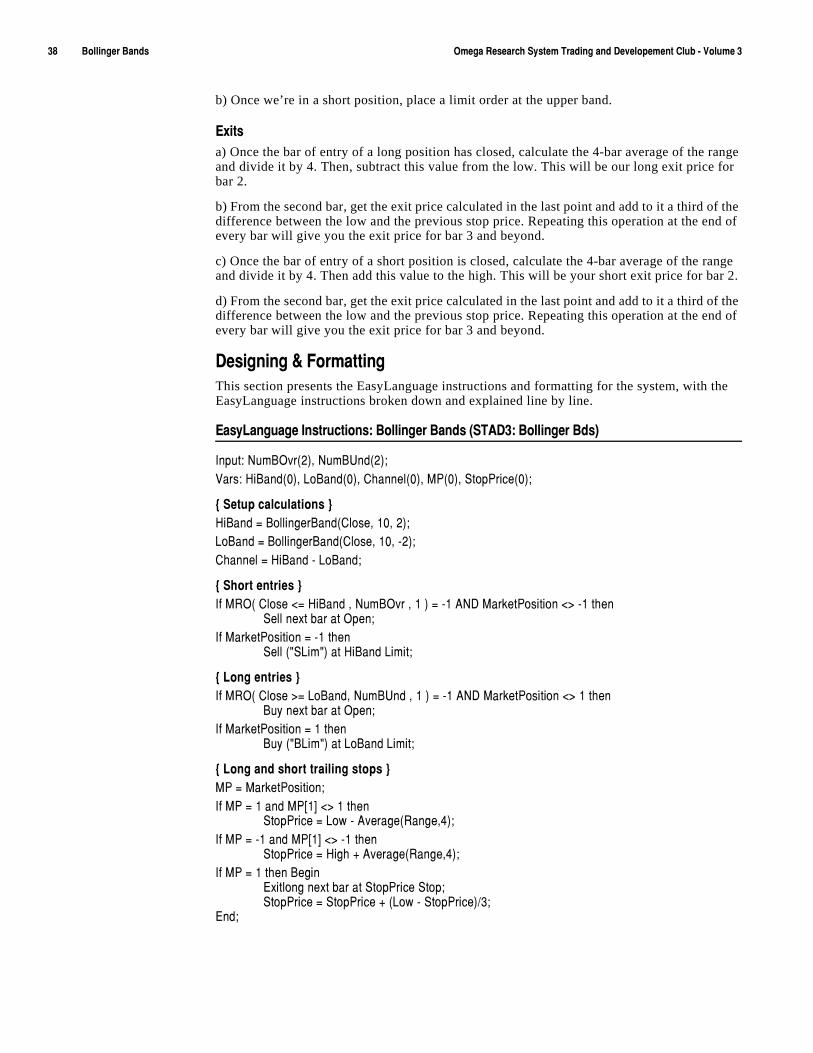
çâúúúúúúúúúú(URROTMKXú(GTJYúúúúúúúúúú 5SKMGú8KYKGXINú9_YZKSú:XGJOTMúGTJú*K\KRUVKSKTZú)R[Húíú<UR[SKúç
b) Once we’re in a short position, place a limit order at the upper band.
+^OZYúa) Once the bar of entry of a long position has closed, calculate the 4-bar average of the range and divide it by 4. Then, subtract this value from the low. This will be our long exit price for bar 2.
b) From the second bar, get the exit price calculated in the last point and add to it a third of the difference between the low and the previous stop price. Repeating this operation at the end of every bar will give you the exit price for bar 3 and beyond.
c) Once the bar of entry of a short position is closed, calculate the 4-bar average of the range and divide it by 4. Then add this value to the high. This will be your short exit price for bar 2.
d) From the second bar, get the exit price calculated in the last point and add to it a third of the difference between the low and the previous stop price. Repeating this operation at the end of every bar will give you the exit price for bar 3 and beyond.
*KYOMTOTMúôú,UXSGZZOTMThis section presents the EasyLanguage instructions and formatting for the system, with the EasyLanguage instructions broken down and explained line by line.
+GY_2GTM[GMKú/TYZX[IZOUTY ú(URROTMKXú(GTJYúò9:'*ç ú(URROTMKXú(JYñ
/TV[Z ú4[S(5\Xòèñîú4[S(;TJòèñ!<GXY ú.O(GTJòêñîú2U(GTJòêñîú)NGTTKRòêñîú36òêñîú9ZUV6XOIKòêñ!
aú9KZ[VúIGRI[RGZOUTYúc.O(GTJú#ú(URROTMKX(GTJò)RUYKîúéêîúèñ!2U(GTJú#ú(URROTMKX(GTJò)RUYKîúéêîúíèñ!)NGTTKRú#ú.O(GTJúíú2U(GTJ!
aú9NUXZúKTZXOKYúcú/Lú385òú)RUYKú"#ú.O(GTJúîú4[S(5\Xúîúéúñú#úíéú'4*ú3GXQKZ6UYOZOUTú"$úíéúZNKT
9KRRúTK^ZúHGXúGZú5VKT!/Lú3GXQKZ6UYOZOUTú#úíéúZNKT
9KRRúòø92OSøñúGZú.O(GTJú2OSOZ!
aú2UTMúKTZXOKYúc/Lú385òú)RUYKú$#ú2U(GTJîú4[S(;TJúîúéúñú#úíéú'4*ú3GXQKZ6UYOZOUTú"$úéúZNKT
([_úTK^ZúHGXúGZú5VKT!/Lú3GXQKZ6UYOZOUTú#úéúZNKT
([_úòø(2OSøñúGZú2U(GTJú2OSOZ!
aú2UTMúGTJúYNUXZúZXGOROTMúYZUVYúc36ú#ú3GXQKZ6UYOZOUT!/Lú36ú#úéúGTJú36AéCú"$úéúZNKT
9ZUV6XOIKú#ú2U]úíú'\KXGMKò8GTMKîæñ!/Lú36ú#úíéúGTJú36AéCú"$úíéúZNKT
9ZUV6XOIKú#ú.OMNúïú'\KXGMKò8GTMKîæñ!/Lú36ú#úéúZNKTú(KMOT
+^OZRUTMúTK^ZúHGXúGZú9ZUV6XOIKú9ZUV!9ZUV6XOIKú#ú9ZUV6XOIKúïúò2U]úíú9ZUV6XOIKñëç!
+TJ!
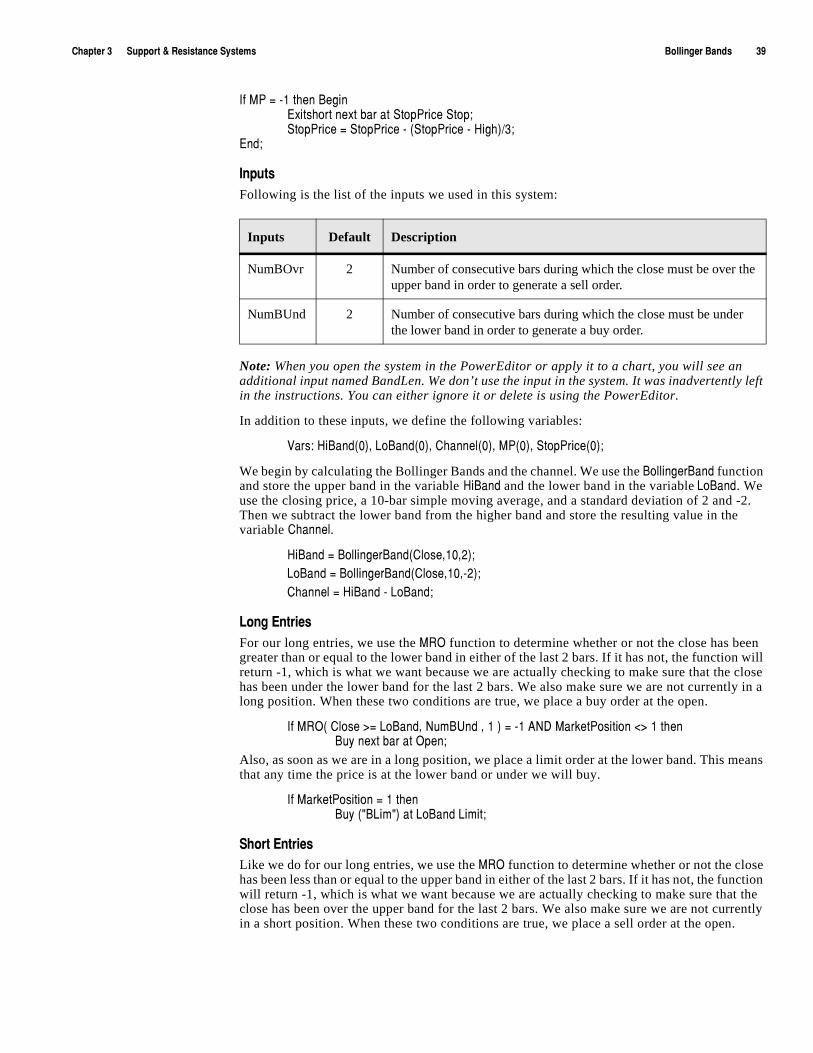
)NGVZKXúçúúúúúú9[VVUXZúôú8KYOYZGTIKú9_YZKSY (URROTMKXú(GTJYúúúúúúúúúúçá
/Lú36ú#úíéúZNKTú(KMOT+^OZYNUXZúTK^ZúHGXúGZú9ZUV6XOIKú9ZUV!9ZUV6XOIKú#ú9ZUV6XOIKúíúò9ZUV6XOIKúíú.OMNñëç!
+TJ!
/TV[ZYúFollowing is the list of the inputs we used in this system:
Note: When you open the system in the PowerEditor or apply it to a chart, you will see an additional input named BandLen. We don’t use the input in the system. It was inadvertently left in the instructions. You can either ignore it or delete is using the PowerEditor.
In addition to these inputs, we define the following variables:
<GXY ú.O(GTJòêñîú2U(GTJòêñîú)NGTTKRòêñîú36òêñîú9ZUV6XOIKòêñ!
We begin by calculating the Bollinger Bands and the channel. We use the (URROTMKX(GTJ function and store the upper band in the variable .O(GTJ and the lower band in the variable 2U(GTJ. We use the closing price, a 10-bar simple moving average, and a standard deviation of 2 and -2. Then we subtract the lower band from the higher band and store the resulting value in the variable )NGTTKR.
.O(GTJú#ú(URROTMKX(GTJò)RUYKîéêîèñ!2U(GTJú#ú(URROTMKX(GTJò)RUYKîéêîíèñ!)NGTTKRú#ú.O(GTJúíú2U(GTJ!
2UTMú+TZXOKYFor our long entries, we use the 385 function to determine whether or not the close has been greater than or equal to the lower band in either of the last 2 bars. If it has not, the function will return -1, which is what we want because we are actually checking to make sure that the close has been under the lower band for the last 2 bars. We also make sure we are not currently in a long position. When these two conditions are true, we place a buy order at the open.
/Lú385òú)RUYKú$#ú2U(GTJîú4[S(;TJúîúéúñú#úíéú'4*ú3GXQKZ6UYOZOUTú"$úéúZNKT([_úTK^ZúHGXúGZú5VKT!
Also, as soon as we are in a long position, we place a limit order at the lower band. This means that any time the price is at the lower band or under we will buy.
/Lú3GXQKZ6UYOZOUTú#úéúZNKT([_úòø(2OSøñúGZú2U(GTJú2OSOZ!
9NUXZú+TZXOKYLike we do for our long entries, we use the 385 function to determine whether or not the close has been less than or equal to the upper band in either of the last 2 bars. If it has not, the function will return -1, which is what we want because we are actually checking to make sure that the close has been over the upper band for the last 2 bars. We also make sure we are not currently in a short position. When these two conditions are true, we place a sell order at the open.
Inputs Default Description
NumBOvr 2 Number of consecutive bars during which the close must be over the upper band in order to generate a sell order.
NumBUnd 2 Number of consecutive bars during which the close must be under the lower band in order to generate a buy order.
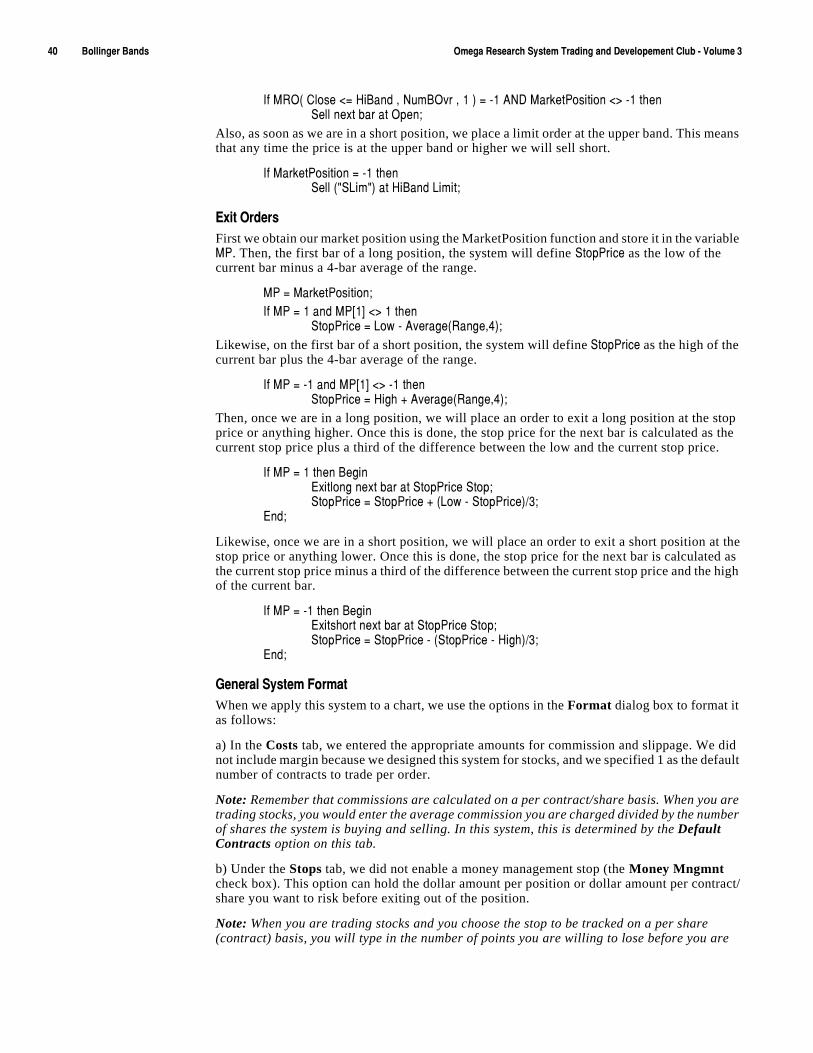
æêúúúúúúúúúú(URROTMKXú(GTJYúúúúúúúúúú 5SKMGú8KYKGXINú9_YZKSú:XGJOTMúGTJú*K\KRUVKSKTZú)R[Húíú<UR[SKúç
/Lú385òú)RUYKú"#ú.O(GTJúîú4[S(5\Xúîúéúñú#úíéú'4*ú3GXQKZ6UYOZOUTú"$úíéúZNKT9KRRúTK^ZúHGXúGZú5VKT!
Also, as soon as we are in a short position, we place a limit order at the upper band. This means that any time the price is at the upper band or higher we will sell short.
/Lú3GXQKZ6UYOZOUTú#úíéúZNKT9KRRúòø92OSøñúGZú.O(GTJú2OSOZ!
+^OZú5XJKXYFirst we obtain our market position using the MarketPosition function and store it in the variable 36. Then, the first bar of a long position, the system will define 9ZUV6XOIK as the low of the current bar minus a 4-bar average of the range.
36ú#ú3GXQKZ6UYOZOUT!/Lú36ú#úéúGTJú36AéCú"$úéúZNKT
9ZUV6XOIKú#ú2U]úíú'\KXGMKò8GTMKîæñ!Likewise, on the first bar of a short position, the system will define 9ZUV6XOIK as the high of the current bar plus the 4-bar average of the range.
/Lú36ú#úíéúGTJú36AéCú"$úíéúZNKT9ZUV6XOIKú#ú.OMNúïú'\KXGMKò8GTMKîæñ!
Then, once we are in a long position, we will place an order to exit a long position at the stop price or anything higher. Once this is done, the stop price for the next bar is calculated as the current stop price plus a third of the difference between the low and the current stop price.
/Lú36ú#úéúZNKTú(KMOT+^OZRUTMúTK^ZúHGXúGZú9ZUV6XOIKú9ZUV!9ZUV6XOIKú#ú9ZUV6XOIKúïúò2U]úíú9ZUV6XOIKñëç!
+TJ!
Likewise, once we are in a short position, we will place an order to exit a short position at the stop price or anything lower. Once this is done, the stop price for the next bar is calculated as the current stop price minus a third of the difference between the current stop price and the high of the current bar.
/Lú36ú#úíéúZNKTú(KMOT+^OZYNUXZúTK^ZúHGXúGZú9ZUV6XOIKú9ZUV!9ZUV6XOIKú#ú9ZUV6XOIKúíúò9ZUV6XOIKúíú.OMNñëç!
+TJ!
-KTKXGRú9_YZKSú,UXSGZWhen we apply this system to a chart, we use the options in the Format dialog box to format it as follows:
a) In the Costs tab, we entered the appropriate amounts for commission and slippage. We did not include margin because we designed this system for stocks, and we specified 1 as the default number of contracts to trade per order.
Note: Remember that commissions are calculated on a per contract/share basis. When you are trading stocks, you would enter the average commission you are charged divided by the number of shares the system is buying and selling. In this system, this is determined by the Default Contracts option on this tab.
b) Under the Stops tab, we did not enable a money management stop (the Money Mngmnt check box). This option can hold the dollar amount per position or dollar amount per contract/share you want to risk before exiting out of the position.
Note: When you are trading stocks and you choose the stop to be tracked on a per share (contract) basis, you will type in the number of points you are willing to lose before you are

)NGVZKXúçúúúúúú9[VVUXZúôú8KYOYZGTIKú9_YZKSY (URROTMKXú(GTJYúúúúúúúúúúæé
exited out. When you are trading futures or any instrument that has a different dollar-point value, you would type the maximum number of dollars you are willing to risk per contract traded.
c) In the Properties tab, we selected the Allow multiple entries in same direction from same or different signals option. This option allows us to enter the market as many times as the signal is generated.
:KYZOTMúôú/SVXU\OTMOn a 5-minute chart of the S&P, this system behaves very much like the typical Support and Resistance system. Figure 3 shows the sample System Report.
It has almost 50% accuracy and the winning versus losing trades are near 1.5. The problem with this system is the drawdown; it requires over $10,000 in drawdown over a period of 2 months in order to return $5,400. These numbers are far from desirable.
However, keep in mind that we did not enable a money management stop. In order to determine where we should place our stop, we used the Maximum Adverse Excursion chart available in Portfolio Maximizer. Figure 4 shows the Maximum Adverse Excursion chart for the Bollinger Bands system.
,OM[XKúçìú9_YZKSú8KVUXZúLUXúZNKú(URROTMKXú(GTJYúY_YZKS
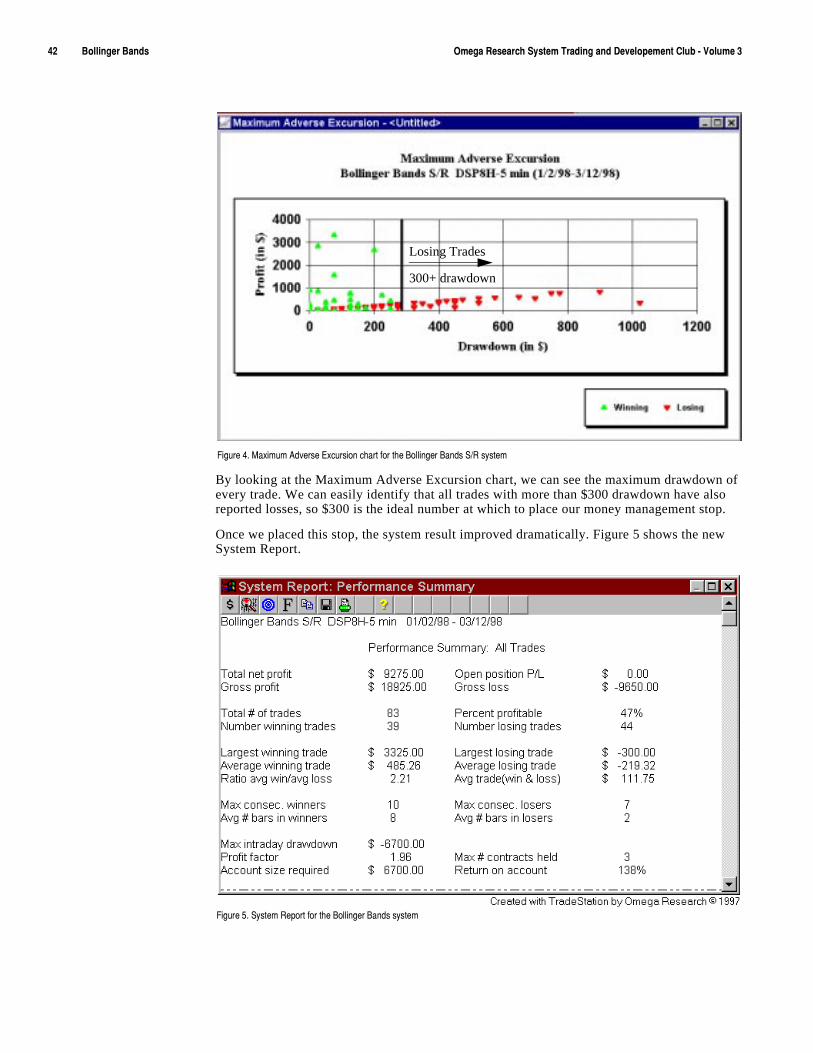
æèúúúúúúúúúú(URROTMKXú(GTJYúúúúúúúúúú 5SKMGú8KYKGXINú9_YZKSú:XGJOTMúGTJú*K\KRUVKSKTZú)R[Húíú<UR[SKúç
By looking at the Maximum Adverse Excursion chart, we can see the maximum drawdown of every trade. We can easily identify that all trades with more than $300 drawdown have also reported losses, so $300 is the ideal number at which to place our money management stop.
Once we placed this stop, the system result improved dramatically. Figure 5 shows the new System Report.
,OM[XKúæìú3G^OS[Sú'J\KXYKú+^I[XYOUTúINGXZúLUXúZNKú(URROTMKXú(GTJYú9ë8úY_YZKS
Losing Trades
300+ drawdown
,OM[XKúåìú9_YZKSú8KVUXZúLUXúZNKú(URROTMKXú(GTJYúY_YZKS
)NGVZKXúçúúúúúú9[VVUXZúôú8KYOYZGTIKú9_YZKSY 5Tú(GRGTIKú:X[Kú8GTMKúúúúúúúúúúæç
We have not only reduced the drawdown but improved our profit by reducing some of the losing trades.
9[MMKYZOUTYúLUXú/SVXU\KSKTZAs we have discussed in previous volumes, trending markets don’t have support or resistance levels capable of turning the direction of the instrument traded, and trends are the worst enemy of Support & Resistance systems. A Support & Resistance system will repeatedly try to buy in a downtrend and sell short in an uptrend.
A way of trying to improve this and other Support & Resistance systems is to filter out trades when a strong trend is detected and relaxing the entry criteria when support or resistance levels begin to show.
5Tú(GRGTIKú:X[Kú8GTMKThe On Balance True Range system builds on the long side of the above Bollinger Bands system. One way to improve the Bollinger Bands system is to add further criteria to determine whether or not a market is oversold before taking a position. The On Balance True Range system uses the long side of the Bollinger Bands system and demonstrates the use of on balance true range as a filter.
As discussed in the description of the Bollinger Bands system, when the market becomes extremely oversold, prices tend to get close to the lower band, and as soon as two consecutive closes are below the lower band, we establish a long position. For this system, however, we will add the condition that the on balance true range must also be under its 9-bar exponential average.
Our reasoning is that since we are looking for the market to be oversold in order to try to buy at the bottom, the on balance true range line will decline more rapidly as the market closes down in bars that have larger ranges, thus providing an even stronger indication that the market is oversold.
We’ll use the same exit technique as the Bollinger Bands system. We will subtract a 4-bar average of the range from the low of the bar of entry, and use that as our exit point for the first bar. We will use inputs so that we can tighten this stop. Then, we will add a third of the distance between the low of the bar and the previous exit point to the current exit point to determine the next bar’s exit point. We will use this for all bars except our bar of entry. To cover our entry bar, we will risk the lowest low of the last 6 bars.
*KLOTOTMú_U[Xú:XGJOTMú8[RKYIn this system, we defined long entries only as well as exit orders. We also performed some setup work, which involved calculating the upper and lower bands as well as the on balance true range. The setup, entry and exits are described next.
9KZ[Vúa) Calculate the on balance true range for the current bar and compare it to the 9-bar exponential average of the on balance true range. If it is less, continue with the remaining instructions, if not, then don’t.
b) Calculate the upper and lower bands using the closing prices, a 10-bar simple moving average, and 2 as the standard deviation.
c) Calculate the channel by subracting the lower band from the upper band.
2UTMú+TZXOKYúa) Find conditions where the close has been below the lower band for the last two bars. When it has, buy at the open.
5Tú(GRGTIKú:X[Kú8GTMKúOYúGúX[TTOTMúZUZGRúULúZNKúZX[KúXGTMKú\GR[KYìú/ZúOYúP[YZúROQKú5Tú(GRGTIKú<UR[SKúK^IKVZúOZúOYúZNKúZX[KúXGTMKúZNGZú_U[úGXKúGJJOTMúGTJúY[HZXGIZOTMìú
=NKTúZNKúIRUYKúULúZNKúVXK\OU[YúHGXúOYúNOMNKXúZNGTúZNKúIRUYKúULúZNKúI[XXKTZúHGXîúZNKúZX[KúXGTMKúULúZNKúI[XXKTZúHGXúOYúGJJKJúZUúZNKúX[TTOTMúZUZGR!ú]NKTúZNKúIRUYKúOYúRKYYîúZNKúZX[KúXGTMKúOYúY[HZXGIZKJìúúúúúúú
ææúúúúúúúúúú5Tú(GRGTIKú:X[Kú8GTMKúúúúúúúúúú 5SKMGú8KYKGXINú9_YZKSú:XGJOTMúGTJú*K\KRUVKSKTZú)R[Húíú<UR[SKúç
b) Once we’re in a long position, place a limit order at the lower band.
+^OZYúa) Once the bar of entry of a long position has closed, calculate the 4-bar average of the range and divide it by 4. Then, subtract this value from the low. This will be our long exit price for bar 2.
b) From the second bar, get the exit price calculated in the last point and add to it a third of the difference between the low and the previous stop price. Repeating this operation at the end of every bar will give you the exit price for bar three and beyond.
*KYOMTOTMúôú,UXSGZZOTMThis section presents the EasyLanguage instructions and formatting for the system, with the EasyLanguage instructions broken down and explained line by line.
+GY_2GTM[GMKú/TYZX[IZOUTY ú5Tú(GRGTIKú:X[Kú8GTMKúò9:'*ç ú5T(GRú:X[Kú8Mñ
/TV[Z ú4[S(5\Xòèñîú4[S(;TJòèñ!<GXY ú.O(GTJòêñîú2U(GTJòêñîú)NGTTKRòêñîú36òêñîú9ZUV6XOIKòêñ!
/Lú5(:8ú"ú>'\KXGMKò5(:8îúáñúZNKTú(KMOT.O(GTJú#ú(URROTMKX(GTJò)RUYKîéêîèñ!2U(GTJú#ú(URROTMKX(GTJò)RUYKîéêîíèñ!)NGTTKRú#ú.O(GTJúíú2U(GTJ!aú2UTMú+TZXOKYúc/Lú385òú)RUYKú$#ú2U(GTJîú4[S(;TJúîúéúñú#úíéú'4*ú3GXQKZ6UYOZOUTú"$úéúZNKT
([_úTK^ZúHGXúGZú5VKT!/Lú3GXQKZ6UYOZOUTú#úéúZNKT
([_úòø(2OSøñúGZú2U(GTJú2OSOZ!aú2UTMúGTJú9NUXZú:XGOROTMú9ZUVúc36ú#ú3GXQKZ6UYOZOUT!/Lú36ú#úéúGTJú36AéCú"$úéúZNKT
9ZUV6XOIKú#ú2U]úíú'\KXGMKò8GTMKîæñ!/Lú36ú#úéúZNKTúHKMOT
+^OZRUTMúTK^ZúHGXúGZú9ZUV6XOIKú9ZUV!9ZUV6XOIKú#ú9ZUV6XOIKúïúò2U]úíú9ZUV6XOIKñëç!
+TJ!+TJ!
/TV[ZYFollowing is the list of the inputs we used in this system:
Note: When you open the system in the PowerEditor or apply it to a chart, you will see an additional input named BandLen. We don’t use the input in the system. It was inadvertently left in the instructions. You can either ignore it or delete is using the PowerEditor.
Inputs Default Description
NumBOvr 2 Number of consecutive bars during which the close must be over the upper band in order to generate a sell order.
NumBUnd 2 Number of consecutive bars during which the close must be under the lower band in order to generate a buy order.
)NGVZKXúçúúúúúú9[VVUXZúôú8KYOYZGTIKú9_YZKSY 5Tú(GRGTIKú:X[Kú8GTMKúúúúúúúúúúæå
In addition to these inputs, we define the following variables:
<GXY ú.O(GTJòêñîú2U(GTJòêñîú)NGTTKRòêñîú36òêñîú9ZUV6XOIKòêñ!
We begin by calculating the on balance true range for the current bar and comparing it to the 9-bar exponential average of the on balance true range. We use the 5(:8 function. If the current 5(:8 is less than the 9-bar exponential average, then we will proceed. We only evaluate the remaining instructions when the condition is met.
When the on balance true range is less than the 9-bar exponential average, we then calculate the Bollinger Bands and the channel. We use the (URROTMKX(GTJ function and store the upper band in the variable .O(GTJ and the lower band in the variable 2U(GTJ. We use the closing price, a 10-bar simple moving average, and a standard deviation of 2 and -2. Then we subtract the lower band from the higher band and store the resulting value in the variable )NGTTKR.
/Lú5(:8ú"ú>'\KXGMKò5(:8îúáñúZNKTú(KMOT.O(GTJú#ú(URROTMKX(GTJò)RUYKîéêîèñ!2U(GTJú#ú(URROTMKX(GTJò)RUYKîéêîíèñ!)NGTTKRú#ú.O(GTJúíú2U(GTJ!
2UTMú+TZXOKYFor our long entries, we use the 385 function to determine whether or not the close has been greater than or equal to the lower band in either of the last 2 bars. If it has not, the function will return -1, which is what we want because we are actually checking to make sure that the close has been under the lower band for the last 2 bars. We also make sure we are not currently in a long position. When these two conditions are true, we place a buy order at the open.
/Lú385òú)RUYKú$#ú2U(GTJîú4[S(;TJîúéúñú#úíéú'4*ú3GXQKZ6UYOZOUTú"$úéúZNKT([_úTK^ZúHGXúGZú5VKT!
Also, as soon as we are in a long position, we place a limit order at the lower band.
/Lú3GXQKZ6UYOZOUTú#úéúZNKT([_úòø(2OSøñúGZú2U(GTJú2OSOZ!
+^OZú5XJKXYFirst we obtain our market position using the 3GXQKZ6UYOZOUT function and store it in the variable 36. Then, the first bar of a long position, the system will define 9ZUV6XOIK as the low of the current bar minus a 4-bar average of the range.
36ú#ú3GXQKZ6UYOZOUT!/Lú36ú#úéúGTJú36AéCú"$úéúZNKT
9ZUV6XOIKú#ú2U]úíú'\KXGMKò8GTMKîæñ!Then, once we are in a long position, we will place an order to exit a long position at the stop price or anything higher. Once this is done, the stop price for the next bar is calculated as the current stop price plus a third of the difference between the low and the current stop price.
/Lú36ú#úéúZNKTú(KMOT+^OZRUTMúTK^ZúHGXúGZú9ZUV6XOIKú9ZUV!9ZUV6XOIKú#ú9ZUV6XOIKúïúò2U]úíú9ZUV6XOIKñëç!
+TJ!
-KTKXGRú9_YZKSú,UXSGZWhen we apply this system to a chart, we use the options in the Format dialog box to format it as follows:
a) In the Costs tab, we entered the appropriate amounts for commission and slippage. We did not include margin because we designed this system for stocks, and we specified 1 as the default number of contracts to trade per order.

æäúúúúúúúúúú5Tú(GRGTIKú:X[Kú8GTMKúúúúúúúúúú 5SKMGú8KYKGXINú9_YZKSú:XGJOTMúGTJú*K\KRUVKSKTZú)R[Húíú<UR[SKúç
Note: Remember that commissions are calculated on a per contract/share basis. When you are trading stocks, you would enter the average commission you are charged divided by the number of shares the system is buying and selling. In this system, this is determined by the Default Contracts option on this tab.
b) Under the Stops tab, we enabled a money management stop (the Money Mngmnt check box) and entered an appropriate dollar amount in the edit box. This option can hold the dollar amount per position or dollar amount per contract/share you want to risk before exiting out of the position.
Note: When you are trading stocks and you choose the stop to be tracked on a per share (contract) basis, you will type in the number of points you are willing to lose before you are exited out. When you are trading futures or any instrument that has a different dollar-point value, you would type the maximum number of dollars you are willing to risk per contract traded.
c) In the Properties tab, we selected the Allow multiple entries in same direction by same or different signals option. This option allows us to enter the market as many times as the signal is generated.
:KYZOTMúôú/SVXU\OTMChecking the on balance true range against its exponential moving average can serve as a very effective filter for other signals. Figure 6 shows the System Results for the long side of the system provided as Bollinger Bands during a period of 2 months on a 5-minute chart of the S&P.
The results are quite acceptable, with 51% winning trades and almost a 2.5 ratio of average winning versus losing trade. However, once we add a condition to only take trades when the on balance true range is under its 9-bar exponential average, we obtain substantially better results, with better profits, improved numbers in winning versus losing trades and a lower average losing trade. Figure 7 shows the System Report for the On Balance True Range system.
,OM[XKúäìú9_YZKSú8KVUXZúLUXúZNKúRUTMúYOJKúULúZNKú(URROTMKXú(GTJYúY_YZKS
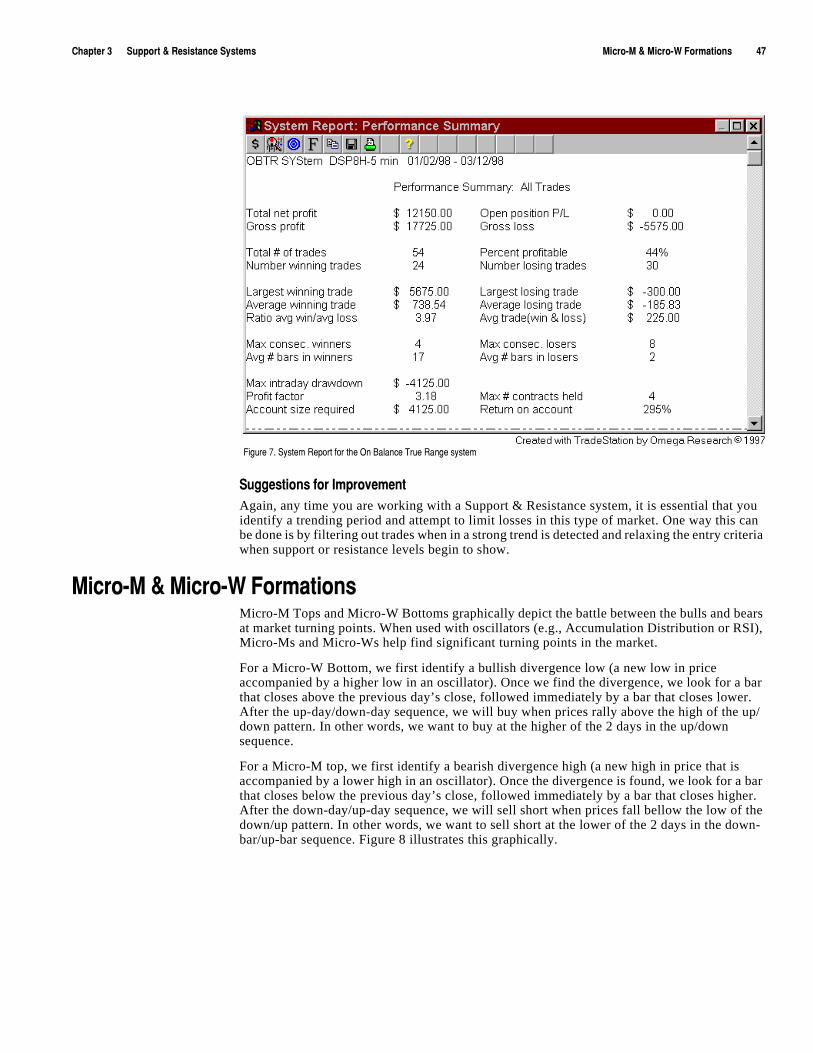
)NGVZKXúçúúúúúú9[VVUXZúôú8KYOYZGTIKú9_YZKSY 3OIXUí3úôú3OIXUí=ú,UXSGZOUTYúúúúúúúúúúæã
9[MMKYZOUTYúLUXú/SVXU\KSKTZAgain, any time you are working with a Support & Resistance system, it is essential that you identify a trending period and attempt to limit losses in this type of market. One way this can be done is by filtering out trades when in a strong trend is detected and relaxing the entry criteria when support or resistance levels begin to show.
3OIXUí3úôú3OIXUí=ú,UXSGZOUTYMicro-M Tops and Micro-W Bottoms graphically depict the battle between the bulls and bears at market turning points. When used with oscillators (e.g., Accumulation Distribution or RSI), Micro-Ms and Micro-Ws help find significant turning points in the market.
For a Micro-W Bottom, we first identify a bullish divergence low (a new low in price accompanied by a higher low in an oscillator). Once we find the divergence, we look for a bar that closes above the previous day’s close, followed immediately by a bar that closes lower. After the up-day/down-day sequence, we will buy when prices rally above the high of the up/down pattern. In other words, we want to buy at the higher of the 2 days in the up/down sequence.
For a Micro-M top, we first identify a bearish divergence high (a new high in price that is accompanied by a lower high in an oscillator). Once the divergence is found, we look for a bar that closes below the previous day’s close, followed immediately by a bar that closes higher. After the down-day/up-day sequence, we will sell short when prices fall bellow the low of the down/up pattern. In other words, we want to sell short at the lower of the 2 days in the down-bar/up-bar sequence. Figure 8 illustrates this graphically.
,OM[XKúãìú9_YZKSú8KVUXZúLUXúZNKú5Tú(GRGTIKú:X[Kú8GTMKúY_YZKS
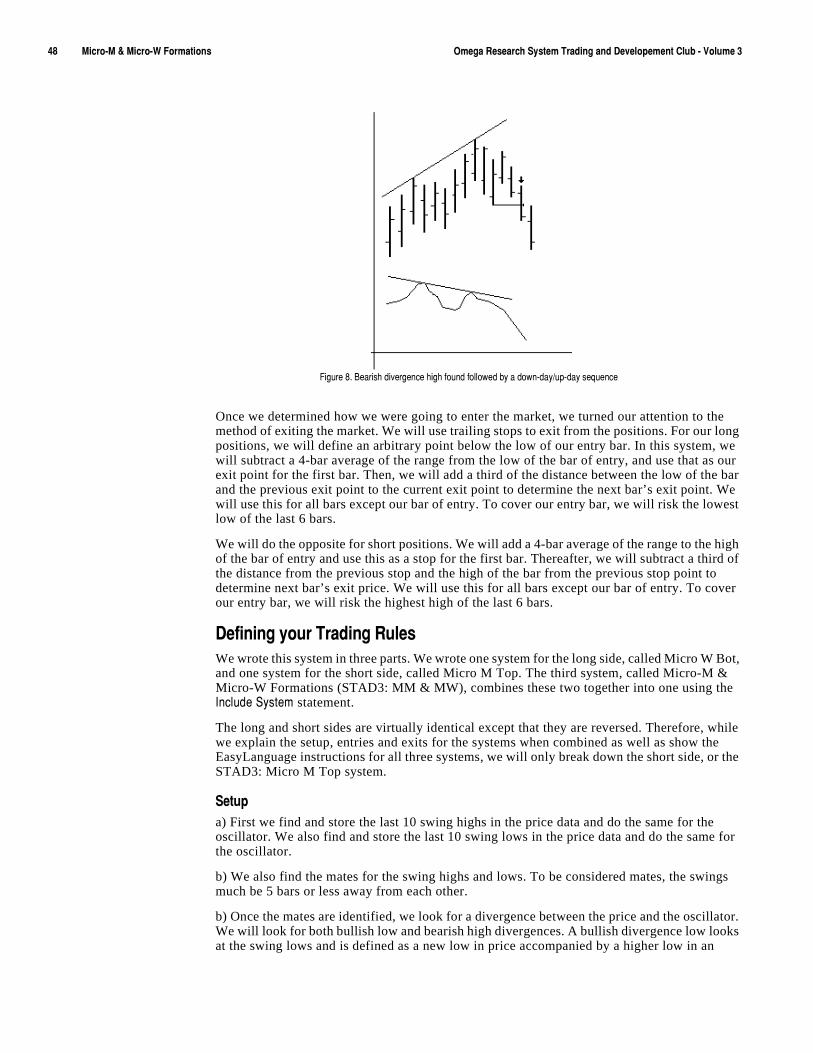
æâúúúúúúúúúú3OIXUí3úôú3OIXUí=ú,UXSGZOUTYúúúúúúúúúú 5SKMGú8KYKGXINú9_YZKSú:XGJOTMúGTJú*K\KRUVKSKTZú)R[Húíú<UR[SKúç
Once we determined how we were going to enter the market, we turned our attention to the method of exiting the market. We will use trailing stops to exit from the positions. For our long positions, we will define an arbitrary point below the low of our entry bar. In this system, we will subtract a 4-bar average of the range from the low of the bar of entry, and use that as our exit point for the first bar. Then, we will add a third of the distance between the low of the bar and the previous exit point to the current exit point to determine the next bar’s exit point. We will use this for all bars except our bar of entry. To cover our entry bar, we will risk the lowest low of the last 6 bars.
We will do the opposite for short positions. We will add a 4-bar average of the range to the high of the bar of entry and use this as a stop for the first bar. Thereafter, we will subtract a third of the distance from the previous stop and the high of the bar from the previous stop point to determine next bar’s exit price. We will use this for all bars except our bar of entry. To cover our entry bar, we will risk the highest high of the last 6 bars.
*KLOTOTMú_U[Xú:XGJOTMú8[RKYWe wrote this system in three parts. We wrote one system for the long side, called Micro W Bot, and one system for the short side, called Micro M Top. The third system, called Micro-M & Micro-W Formations (STAD3: MM & MW), combines these two together into one using theú/TIR[JKú9_YZKS statement.
The long and short sides are virtually identical except that they are reversed. Therefore, while we explain the setup, entries and exits for the systems when combined as well as show the EasyLanguage instructions for all three systems, we will only break down the short side, or the STAD3: Micro M Top system.
9KZ[Vúa) First we find and store the last 10 swing highs in the price data and do the same for the oscillator. We also find and store the last 10 swing lows in the price data and do the same for the oscillator.
b) We also find the mates for the swing highs and lows. To be considered mates, the swings much be 5 bars or less away from each other.
b) Once the mates are identified, we look for a divergence between the price and the oscillator. We will look for both bullish low and bearish high divergences. A bullish divergence low looks at the swing lows and is defined as a new low in price accompanied by a higher low in an
,OM[XKúâìú(KGXOYNúJO\KXMKTIKúNOMNúLU[TJúLURRU]KJúH_úGúJU]TíJG_ë[VíJG_úYKW[KTIKú
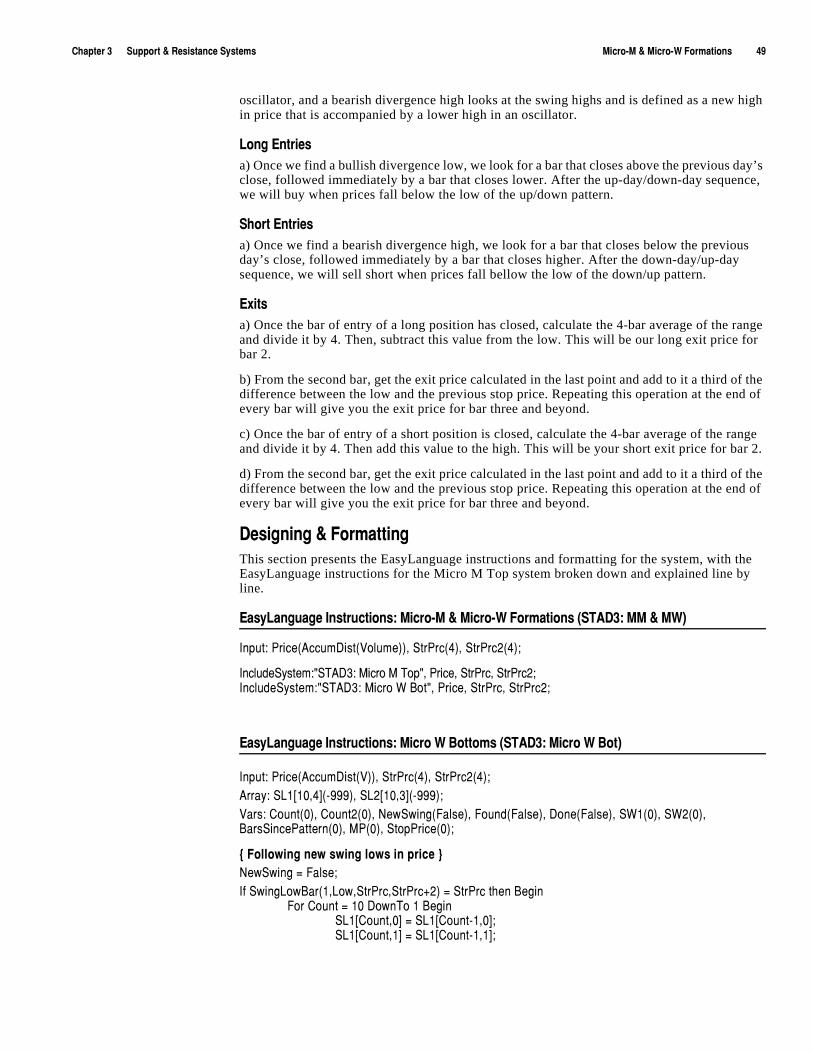
)NGVZKXúçúúúúúú9[VVUXZúôú8KYOYZGTIKú9_YZKSY 3OIXUí3úôú3OIXUí=ú,UXSGZOUTYúúúúúúúúúúæá
oscillator, and a bearish divergence high looks at the swing highs and is defined as a new high in price that is accompanied by a lower high in an oscillator.
2UTMú+TZXOKYúa) Once we find a bullish divergence low, we look for a bar that closes above the previous day’s close, followed immediately by a bar that closes lower. After the up-day/down-day sequence, we will buy when prices fall below the low of the up/down pattern.
9NUXZú+TZXOKYúa) Once we find a bearish divergence high, we look for a bar that closes below the previous day’s close, followed immediately by a bar that closes higher. After the down-day/up-day sequence, we will sell short when prices fall bellow the low of the down/up pattern.
+^OZYúa) Once the bar of entry of a long position has closed, calculate the 4-bar average of the range and divide it by 4. Then, subtract this value from the low. This will be our long exit price for bar 2.
b) From the second bar, get the exit price calculated in the last point and add to it a third of the difference between the low and the previous stop price. Repeating this operation at the end of every bar will give you the exit price for bar three and beyond.
c) Once the bar of entry of a short position is closed, calculate the 4-bar average of the range and divide it by 4. Then add this value to the high. This will be your short exit price for bar 2.
d) From the second bar, get the exit price calculated in the last point and add to it a third of the difference between the low and the previous stop price. Repeating this operation at the end of every bar will give you the exit price for bar three and beyond.
*KYOMTOTMúôú,UXSGZZOTMThis section presents the EasyLanguage instructions and formatting for the system, with the EasyLanguage instructions for the Micro M Top system broken down and explained line by line.
+GY_2GTM[GMKú/TYZX[IZOUTY ú3OIXUí3úôú3OIXUí=ú,UXSGZOUTYúò9:'*ç ú33úôú3=ñ
/TV[Z ú6XOIKò'II[S*OYZò<UR[SKññîú9ZX6XIòæñîú9ZX6XIèòæñ!
/TIR[JK9_YZKS ø9:'*ç ú3OIXUú3ú:UVøîú6XOIKîú9ZX6XIîú9ZX6XIè!/TIR[JK9_YZKS ø9:'*ç ú3OIXUú=ú(UZøîú6XOIKîú9ZX6XIîú9ZX6XIè!
+GY_2GTM[GMKú/TYZX[IZOUTY ú3OIXUú=ú(UZZUSYúò9:'*ç ú3OIXUú=ú(UZñ
/TV[Z ú6XOIKò'II[S*OYZò<ññîú9ZX6XIòæñîú9ZX6XIèòæñ!'XXG_ ú92éAéêîæCòíáááñîú92èAéêîçCòíáááñ!<GXY ú)U[TZòêñîú)U[TZèòêñîú4K]9]OTMò,GRYKñîú,U[TJò,GRYKñîú*UTKò,GRYKñîú9=éòêñîú9=èòêñîú(GXY9OTIK6GZZKXTòêñîú36òêñîú9ZUV6XOIKòêñ!
aú,URRU]OTMúTK]úY]OTMúRU]YúOTúVXOIKúc4K]9]OTMú#ú,GRYK!/Lú9]OTM2U](GXòéî2U]î9ZX6XIî9ZX6XIïèñú#ú9ZX6XIúZNKTú(KMOT
,UXú)U[TZú#úéêú*U]T:Uúéú(KMOT92éA)U[TZîêCú#ú92éA)U[TZíéîêC!92éA)U[TZîéCú#ú92éA)U[TZíéîéC!
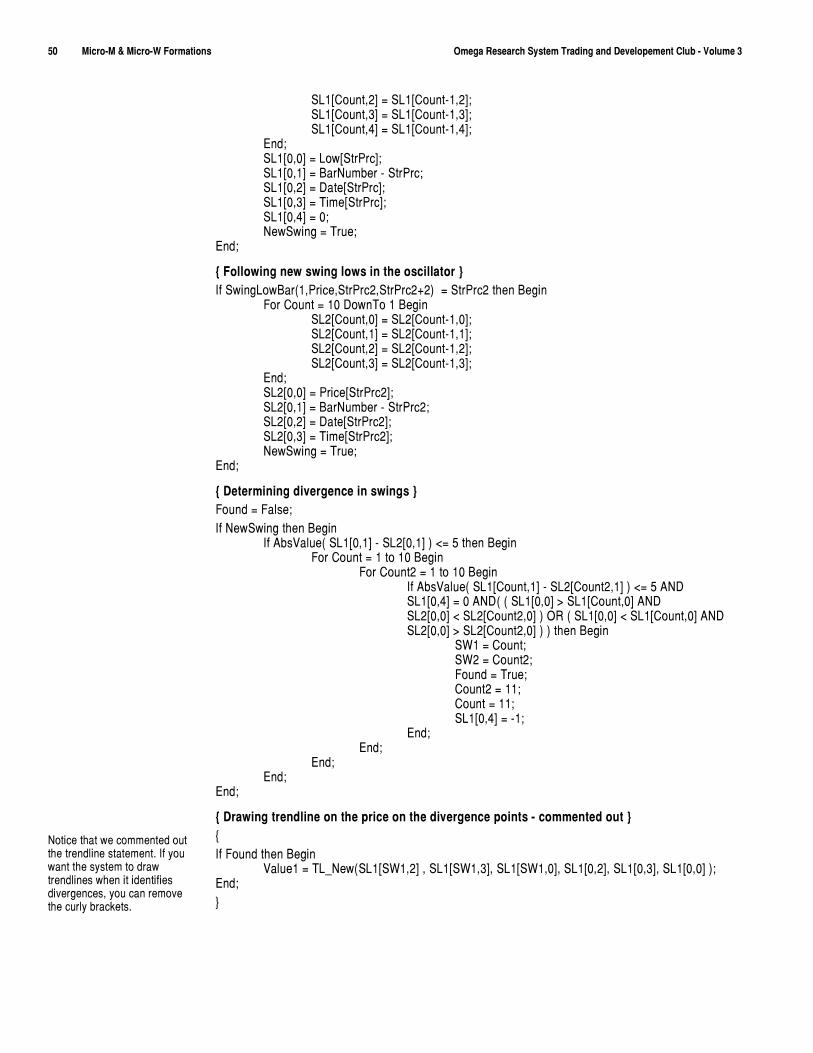
åêúúúúúúúúúú3OIXUí3úôú3OIXUí=ú,UXSGZOUTYúúúúúúúúúú 5SKMGú8KYKGXINú9_YZKSú:XGJOTMúGTJú*K\KRUVKSKTZú)R[Húíú<UR[SKúç
92éA)U[TZîèCú#ú92éA)U[TZíéîèC!92éA)U[TZîçCú#ú92éA)U[TZíéîçC!92éA)U[TZîæCú#ú92éA)U[TZíéîæC!
+TJ!92éAêîêCú#ú2U]A9ZX6XIC!92éAêîéCú#ú(GX4[SHKXúíú9ZX6XI!92éAêîèCú#ú*GZKA9ZX6XIC!92éAêîçCú#ú:OSKA9ZX6XIC!92éAêîæCú#úê!4K]9]OTMú#ú:X[K!
+TJ!
aú,URRU]OTMúTK]úY]OTMúRU]YúOTúZNKúUYIORRGZUXúc/Lú9]OTM2U](GXòéî6XOIKî9ZX6XIèî9ZX6XIèïèñúú#ú9ZX6XIèúZNKTú(KMOT
,UXú)U[TZú#úéêú*U]T:Uúéú(KMOT92èA)U[TZîêCú#ú92èA)U[TZíéîêC!92èA)U[TZîéCú#ú92èA)U[TZíéîéC!92èA)U[TZîèCú#ú92èA)U[TZíéîèC!92èA)U[TZîçCú#ú92èA)U[TZíéîçC!
+TJ!92èAêîêCú#ú6XOIKA9ZX6XIèC!92èAêîéCú#ú(GX4[SHKXúíú9ZX6XIè!92èAêîèCú#ú*GZKA9ZX6XIèC!92èAêîçCú#ú:OSKA9ZX6XIèC!4K]9]OTMú#ú:X[K!
+TJ!
aú*KZKXSOTOTMúJO\KXMKTIKúOTúY]OTMYúc,U[TJú#ú,GRYK!/Lú4K]9]OTMúZNKTú(KMOT
/Lú'HY<GR[Kòú92éAêîéCúíú92èAêîéCúñú"#úåúZNKTú(KMOT,UXú)U[TZú#úéúZUúéêú(KMOT
,UXú)U[TZèú#úéúZUúéêú(KMOT/Lú'HY<GR[Kòú92éA)U[TZîéCúíú92èA)U[TZèîéCúñú"#úåú'4*92éAêîæCú#úêú'4*òúòú92éAêîêCú$ú92éA)U[TZîêCú'4*
ú 92èAêîêCú"ú92èA)U[TZèîêCúñú58úòú92éAêîêCú"ú92éA)U[TZîêCú'4*ú 92èAêîêCú$ú92èA)U[TZèîêCúñúñúZNKTú(KMOT
9=éú#ú)U[TZ!9=èú#ú)U[TZè!,U[TJú#ú:X[K!)U[TZèú#úéé!)U[TZú#úéé!92éAêîæCú#úíé!
+TJ!+TJ!
+TJ!+TJ!
+TJ!
aú*XG]OTMúZXKTJROTKúUTúZNKúVXOIKúUTúZNKúJO\KXMKTIKúVUOTZYúíúIUSSKTZKJúU[Zúca/Lú,U[TJúZNKTú(KMOT
<GR[Kéú#ú:2E4K]ò92éA9=éîèCúîú92éA9=éîçCîú92éA9=éîêCîú92éAêîèCîú92éAêîçCîú92éAêîêCúñ!+TJ!c
4UZOIKúZNGZú]KúIUSSKTZKJúU[ZúZNKúZXKTJROTKúYZGZKSKTZìú/Lú_U[ú]GTZúZNKúY_YZKSúZUúJXG]úZXKTJROTKYú]NKTúOZúOJKTZOLOKYúJO\KXMKTIKYîú_U[úIGTúXKSU\KúZNKúI[XR_úHXGIQKZYì
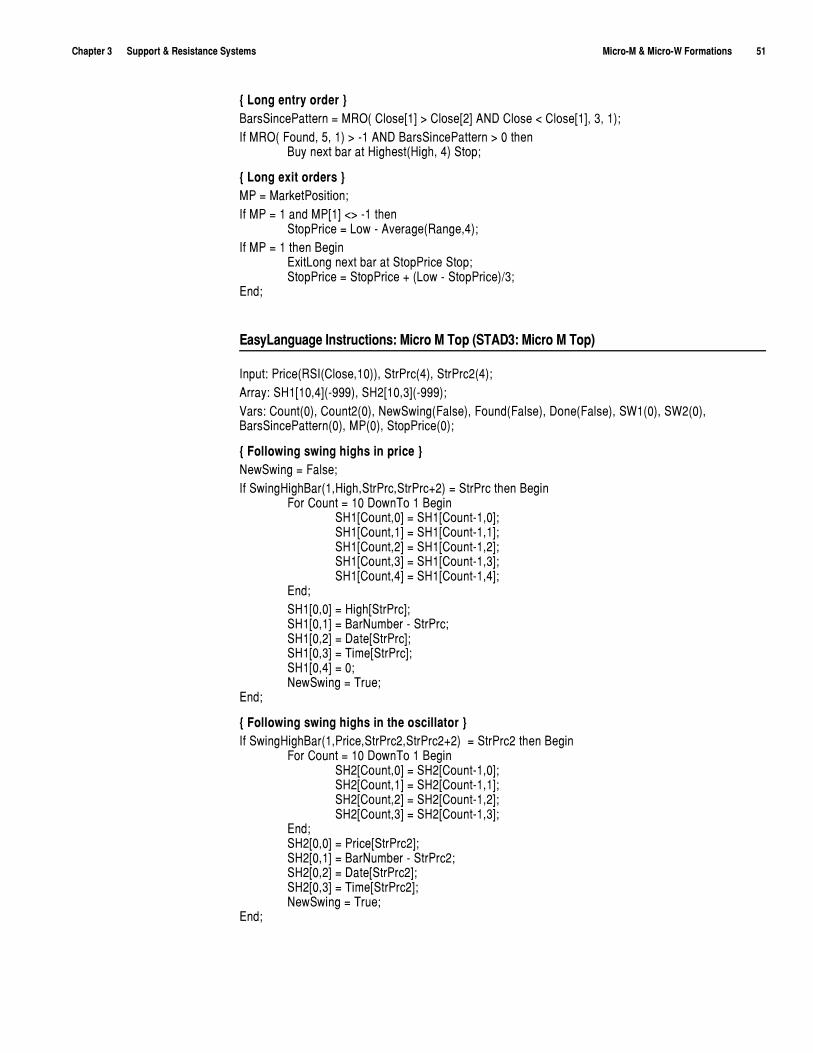
)NGVZKXúçúúúúúú9[VVUXZúôú8KYOYZGTIKú9_YZKSY 3OIXUí3úôú3OIXUí=ú,UXSGZOUTYúúúúúúúúúúåé
aú2UTMúKTZX_úUXJKXúc(GXY9OTIK6GZZKXTú#ú385òú)RUYKAéCú$ú)RUYKAèCú'4*ú)RUYKú"ú)RUYKAéCîúçîúéñ!/Lú385òú,U[TJîúåîúéñú$úíéú'4*ú(GXY9OTIK6GZZKXTú$úêúZNKT
([_úTK^ZúHGXúGZú.OMNKYZò.OMNîúæñú9ZUV!ú
aú2UTMúK^OZúUXJKXYúc36ú#ú3GXQKZ6UYOZOUT!/Lú36ú#úéúGTJú36AéCú"$úíéúZNKT
9ZUV6XOIKú#ú2U]úíú'\KXGMKò8GTMKîæñ!/Lú36ú#úéúZNKTú(KMOT
+^OZ2UTMúTK^ZúHGXúGZú9ZUV6XOIKú9ZUV!9ZUV6XOIKú#ú9ZUV6XOIKúïúò2U]úíú9ZUV6XOIKñëç!
+TJ!
+GY_2GTM[GMKú/TYZX[IZOUTY ú3OIXUú3ú:UVúò9:'*ç ú3OIXUú3ú:UVñ
/TV[Z ú6XOIKò89/ò)RUYKîéêññîú9ZX6XIòæñîú9ZX6XIèòæñ!'XXG_ ú9.éAéêîæCòíáááñîú9.èAéêîçCòíáááñ!<GXY ú)U[TZòêñîú)U[TZèòêñîú4K]9]OTMò,GRYKñîú,U[TJò,GRYKñîú*UTKò,GRYKñîú9=éòêñîú9=èòêñîú(GXY9OTIK6GZZKXTòêñîú36òêñîú9ZUV6XOIKòêñ!
aú,URRU]OTMúY]OTMúNOMNYúOTúVXOIKúc4K]9]OTMú#ú,GRYK!/Lú9]OTM.OMN(GXòéî.OMNî9ZX6XIî9ZX6XIïèñú#ú9ZX6XIúZNKTú(KMOT
,UXú)U[TZú#úéêú*U]T:Uúéú(KMOT9.éA)U[TZîêCú#ú9.éA)U[TZíéîêC!9.éA)U[TZîéCú#ú9.éA)U[TZíéîéC!9.éA)U[TZîèCú#ú9.éA)U[TZíéîèC!9.éA)U[TZîçCú#ú9.éA)U[TZíéîçC!9.éA)U[TZîæCú#ú9.éA)U[TZíéîæC!
+TJ!9.éAêîêCú#ú.OMNA9ZX6XIC!9.éAêîéCú#ú(GX4[SHKXúíú9ZX6XI!9.éAêîèCú#ú*GZKA9ZX6XIC!9.éAêîçCú#ú:OSKA9ZX6XIC!9.éAêîæCú#úê!4K]9]OTMú#ú:X[K!
+TJ!
aú,URRU]OTMúY]OTMúNOMNYúOTúZNKúUYIORRGZUXúc/Lú9]OTM.OMN(GXòéî6XOIKî9ZX6XIèî9ZX6XIèïèñúú#ú9ZX6XIèúZNKTú(KMOT
,UXú)U[TZú#úéêú*U]T:Uúéú(KMOT9.èA)U[TZîêCú#ú9.èA)U[TZíéîêC!9.èA)U[TZîéCú#ú9.èA)U[TZíéîéC!9.èA)U[TZîèCú#ú9.èA)U[TZíéîèC!9.èA)U[TZîçCú#ú9.èA)U[TZíéîçC!
+TJ!9.èAêîêCú#ú6XOIKA9ZX6XIèC!9.èAêîéCú#ú(GX4[SHKXúíú9ZX6XIè!9.èAêîèCú#ú*GZKA9ZX6XIèC!9.èAêîçCú#ú:OSKA9ZX6XIèC!4K]9]OTMú#ú:X[K!
+TJ!
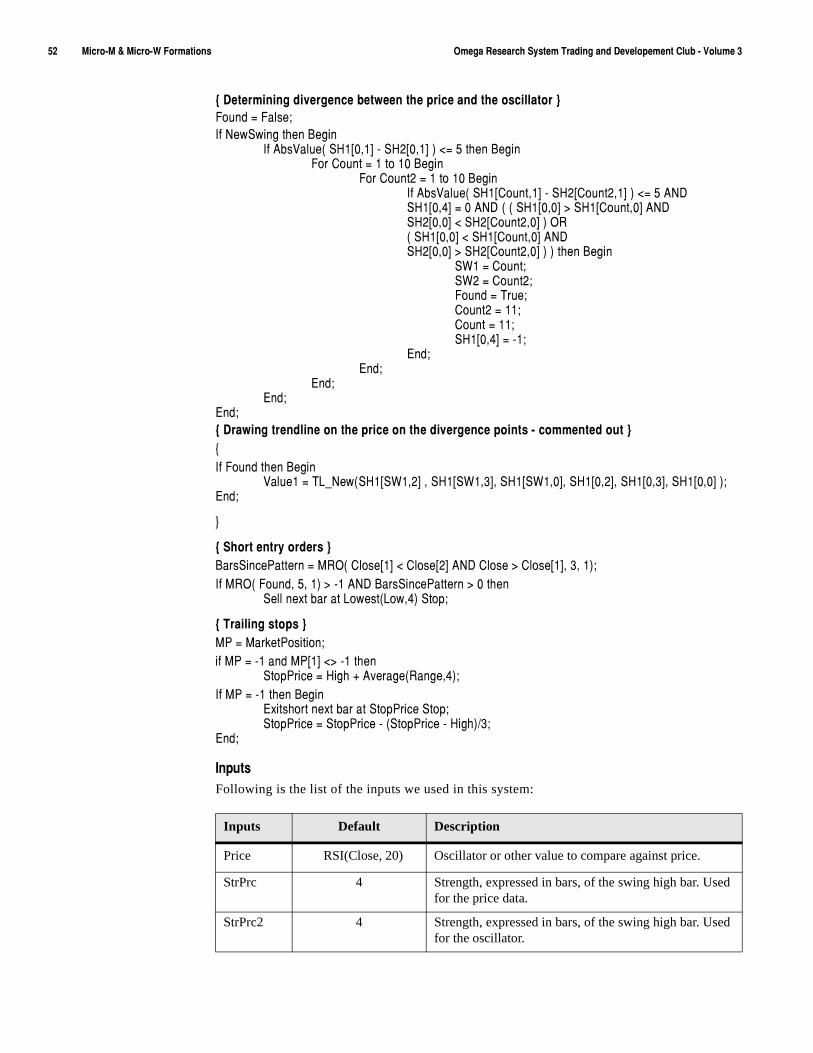
åèúúúúúúúúúú3OIXUí3úôú3OIXUí=ú,UXSGZOUTYúúúúúúúúúú 5SKMGú8KYKGXINú9_YZKSú:XGJOTMúGTJú*K\KRUVKSKTZú)R[Húíú<UR[SKúç
aú*KZKXSOTOTMúJO\KXMKTIKúHKZ]KKTúZNKúVXOIKúGTJúZNKúUYIORRGZUXúc,U[TJú#ú,GRYK!/Lú4K]9]OTMúZNKTú(KMOT
/Lú'HY<GR[Kòú9.éAêîéCúíú9.èAêîéCúñú"#úåúZNKTú(KMOT,UXú)U[TZú#úéúZUúéêú(KMOT
,UXú)U[TZèú#úéúZUúéêú(KMOT/Lú'HY<GR[Kòú9.éA)U[TZîéCúíú9.èA)U[TZèîéCúñú"#úåú'4*ú9.éAêîæCú#úêú'4*úòúòú9.éAêîêCú$ú9.éA)U[TZîêCú'4*
ú 9.èAêîêCú"ú9.èA)U[TZèîêCúñú58òú9.éAêîêCú"ú9.éA)U[TZîêCú'4*ú9.èAêîêCú$ú9.èA)U[TZèîêCúñúñúZNKTú(KMOT
9=éú#ú)U[TZ!9=èú#ú)U[TZè!,U[TJú#ú:X[K!)U[TZèú#úéé!)U[TZú#úéé!9.éAêîæCú#úíé!
+TJ!+TJ!
+TJ!+TJ!
+TJ!aú*XG]OTMúZXKTJROTKúUTúZNKúVXOIKúUTúZNKúJO\KXMKTIKúVUOTZYúíúIUSSKTZKJúU[Zúca/Lú,U[TJúZNKTú(KMOT
<GR[Kéú#ú:2E4K]ò9.éA9=éîèCúîú9.éA9=éîçCîú9.éA9=éîêCîú9.éAêîèCîú9.éAêîçCîú9.éAêîêCúñ!+TJ!
c
aú9NUXZúKTZX_úUXJKXYúc(GXY9OTIK6GZZKXTú#ú385òú)RUYKAéCú"ú)RUYKAèCú'4*ú)RUYKú$ú)RUYKAéCîúçîúéñ!/Lú385òú,U[TJîúåîúéñú$úíéú'4*ú(GXY9OTIK6GZZKXTú$úêúZNKT
9KRRúTK^ZúHGXúGZú2U]KYZò2U]îæñú9ZUV!ú
aú:XGOROTMúYZUVYúc36ú#ú3GXQKZ6UYOZOUT!OLú36ú#úíéúGTJú36AéCú"$úíéúZNKT
9ZUV6XOIKú#ú.OMNúïú'\KXGMKò8GTMKîæñ!/Lú36ú#úíéúZNKTú(KMOT
+^OZYNUXZúTK^ZúHGXúGZú9ZUV6XOIKú9ZUV!9ZUV6XOIKú#ú9ZUV6XOIKúíúò9ZUV6XOIKúíú.OMNñëç!
+TJ!
/TV[ZYFollowing is the list of the inputs we used in this system:
Inputs Default Description
Price RSI(Close, 20) Oscillator or other value to compare against price.
StrPrc 4 Strength, expressed in bars, of the swing high bar. Used for the price data.
StrPrc2 4 Strength, expressed in bars, of the swing high bar. Used for the oscillator.
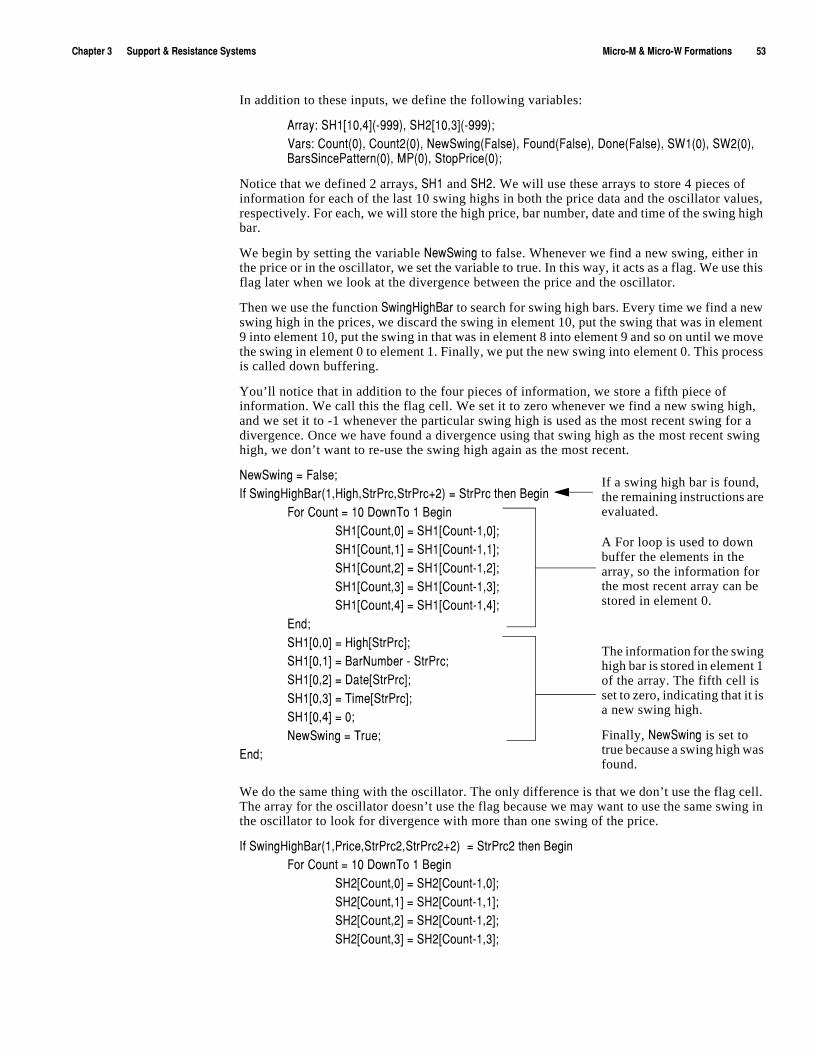
)NGVZKXúçúúúúúú9[VVUXZúôú8KYOYZGTIKú9_YZKSY 3OIXUí3úôú3OIXUí=ú,UXSGZOUTYúúúúúúúúúúåç
In addition to these inputs, we define the following variables:
'XXG_ ú9.éAéêîæCòíáááñîú9.èAéêîçCòíáááñ!<GXY ú)U[TZòêñîú)U[TZèòêñîú4K]9]OTMò,GRYKñîú,U[TJò,GRYKñîú*UTKò,GRYKñîú9=éòêñîú9=èòêñîú(GXY9OTIK6GZZKXTòêñîú36òêñîú9ZUV6XOIKòêñ!
Notice that we defined 2 arrays, 9.é and 9.è. We will use these arrays to store 4 pieces of information for each of the last 10 swing highs in both the price data and the oscillator values, respectively. For each, we will store the high price, bar number, date and time of the swing high bar.
We begin by setting the variable 4K]9]OTM to false. Whenever we find a new swing, either in the price or in the oscillator, we set the variable to true. In this way, it acts as a flag. We use this flag later when we look at the divergence between the price and the oscillator.
Then we use the function 9]OTM.OMN(GX to search for swing high bars. Every time we find a new swing high in the prices, we discard the swing in element 10, put the swing that was in element 9 into element 10, put the swing in that was in element 8 into element 9 and so on until we move the swing in element 0 to element 1. Finally, we put the new swing into element 0. This process is called down buffering.
You’ll notice that in addition to the four pieces of information, we store a fifth piece of information. We call this the flag cell. We set it to zero whenever we find a new swing high, and we set it to -1 whenever the particular swing high is used as the most recent swing for a divergence. Once we have found a divergence using that swing high as the most recent swing high, we don’t want to re-use the swing high again as the most recent.
4K]9]OTMú#ú,GRYK!/Lú9]OTM.OMN(GXòéî.OMNî9ZX6XIî9ZX6XIïèñú#ú9ZX6XIúZNKTú(KMOT
,UXú)U[TZú#úéêú*U]T:Uúéú(KMOT9.éA)U[TZîêCú#ú9.éA)U[TZíéîêC!9.éA)U[TZîéCú#ú9.éA)U[TZíéîéC!9.éA)U[TZîèCú#ú9.éA)U[TZíéîèC!9.éA)U[TZîçCú#ú9.éA)U[TZíéîçC!9.éA)U[TZîæCú#ú9.éA)U[TZíéîæC!
+TJ!9.éAêîêCú#ú.OMNA9ZX6XIC!9.éAêîéCú#ú(GX4[SHKXúíú9ZX6XI!9.éAêîèCú#ú*GZKA9ZX6XIC!9.éAêîçCú#ú:OSKA9ZX6XIC!9.éAêîæCú#úê!4K]9]OTMú#ú:X[K!
+TJ!
We do the same thing with the oscillator. The only difference is that we don’t use the flag cell. The array for the oscillator doesn’t use the flag because we may want to use the same swing in the oscillator to look for divergence with more than one swing of the price.
/Lú9]OTM.OMN(GXòéî6XOIKî9ZX6XIèî9ZX6XIèïèñúú#ú9ZX6XIèúZNKTú(KMOT,UXú)U[TZú#úéêú*U]T:Uúéú(KMOT
9.èA)U[TZîêCú#ú9.èA)U[TZíéîêC!9.èA)U[TZîéCú#ú9.èA)U[TZíéîéC!9.èA)U[TZîèCú#ú9.èA)U[TZíéîèC!9.èA)U[TZîçCú#ú9.èA)U[TZíéîçC!
If a swing high bar is found, the remaining instructions are evaluated.
A For loop is used to down buffer the elements in the array, so the information for the most recent array can be stored in element 0.
The information for the swing high bar is stored in element 1 of the array. The fifth cell is set to zero, indicating that it is a new swing high.
Finally, 4K]9]OTM is set to true because a swing high was found.
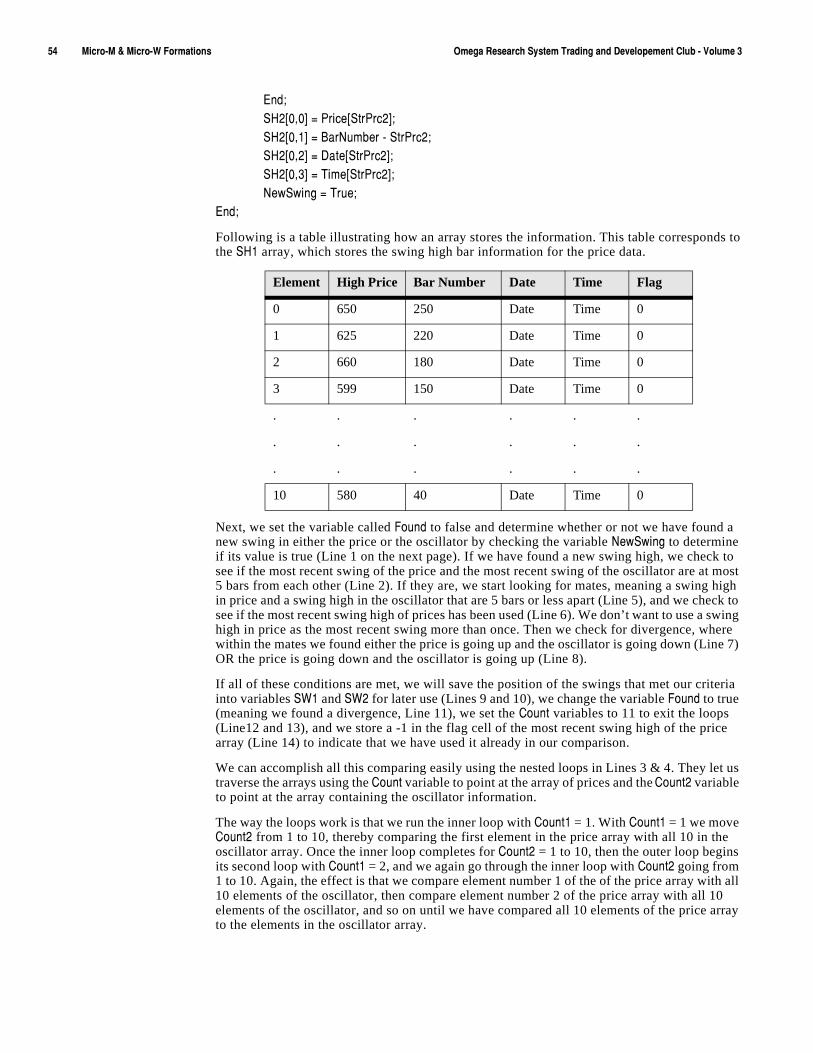
åæúúúúúúúúúú3OIXUí3úôú3OIXUí=ú,UXSGZOUTYúúúúúúúúúú 5SKMGú8KYKGXINú9_YZKSú:XGJOTMúGTJú*K\KRUVKSKTZú)R[Húíú<UR[SKúç
+TJ!9.èAêîêCú#ú6XOIKA9ZX6XIèC!9.èAêîéCú#ú(GX4[SHKXúíú9ZX6XIè!9.èAêîèCú#ú*GZKA9ZX6XIèC!9.èAêîçCú#ú:OSKA9ZX6XIèC!4K]9]OTMú#ú:X[K!
+TJ!
Following is a table illustrating how an array stores the information. This table corresponds to the 9.é array, which stores the swing high bar information for the price data.
Next, we set the variable called ,U[TJ to false and determine whether or not we have found a new swing in either the price or the oscillator by checking the variable 4K]9]OTM to determine if its value is true (Line 1 on the next page). If we have found a new swing high, we check to see if the most recent swing of the price and the most recent swing of the oscillator are at most 5 bars from each other (Line 2). If they are, we start looking for mates, meaning a swing high in price and a swing high in the oscillator that are 5 bars or less apart (Line 5), and we check to see if the most recent swing high of prices has been used (Line 6). We don’t want to use a swing high in price as the most recent swing more than once. Then we check for divergence, where within the mates we found either the price is going up and the oscillator is going down (Line 7) OR the price is going down and the oscillator is going up (Line 8).
If all of these conditions are met, we will save the position of the swings that met our criteria into variables 9=é and 9=è for later use (Lines 9 and 10), we change the variable ,U[TJ to true (meaning we found a divergence, Line 11), we set the )U[TZ variables to 11 to exit the loops (Line12 and 13), and we store a -1 in the flag cell of the most recent swing high of the price array (Line 14) to indicate that we have used it already in our comparison.
We can accomplish all this comparing easily using the nested loops in Lines 3 & 4. They let us traverse the arrays using the )U[TZ variable to point at the array of prices and the )U[TZè variable to point at the array containing the oscillator information.
The way the loops work is that we run the inner loop with )U[TZé = 1. With )U[TZé = 1 we move )U[TZè from 1 to 10, thereby comparing the first element in the price array with all 10 in the oscillator array. Once the inner loop completes for )U[TZè = 1 to 10, then the outer loop begins its second loop with )U[TZé = 2, and we again go through the inner loop with )U[TZè going from 1 to 10. Again, the effect is that we compare element number 1 of the of the price array with all 10 elements of the oscillator, then compare element number 2 of the price array with all 10 elements of the oscillator, and so on until we have compared all 10 elements of the price array to the elements in the oscillator array.
Element High Price Bar Number Date Time Flag
0 650 250 Date Time 0
1 625 220 Date Time 0
2 660 180 Date Time 0
3 599 150 Date Time 0
. . . . . .
. . . . . .
. . . . . .
10 580 40 Date Time 0
)NGVZKXúçúúúúúú9[VVUXZúôú8KYOYZGTIKú9_YZKSY 3OIXUí3úôú3OIXUí=ú,UXSGZOUTYúúúúúúúúúúåå
aú*KZKXSOTOTMúJO\KXMKTIKúHKZ]KKTúZNKúVXOIKúGTJúZNKúUYIORRGZUXúc,U[TJú#ú,GRYK!
é /Lú4K]9]OTMúZNKTú(KMOTè /Lú'HY<GR[Kòú9.éAêîéCúíú9.èAêîéCúñú"#úåúZNKTú(KMOTç ,UXú)U[TZú#úéúZUúéêú(KMOTæ ,UXú)U[TZèú#úéúZUúéêú(KMOTå /Lú'HY<GR[Kòú9.éA)U[TZîéCúíú9.èA)U[TZèîéCúñú"#úåú'4*äú 9.éAêîæCú#úêú'4*ã òòú9.éAêîêC$9.éA)U[TZîêCú'4*ú9.èAêîêC"9.èA)U[TZèîêCúñú58âú òú9.éAêîêCú"ú9.éA)U[TZîêCú'4*ú9.èAêîêCú$ú9.èA)U[TZèîêCúññúZNKTú(KMOTá 9=éú#ú)U[TZ!éê 9=èú#ú)U[TZè!éé ,U[TJú#ú:X[K!éè )U[TZèú#úéé!éç )U[TZú#úéé!éæ 9.éAêîæCú#úíé!éå +TJ!éä +TJ!éã +TJ!éâ +TJ!éá +TJ!
2UTMú+TZXOKYWe use the 385 function to determine whether or not the down-day/up-day pattern occurred wthin the last 3 bars. If it did, the 385 function will return the bar number on which the pattern was completed, and we’ll store this number in the varible (GXY9OTIK6GZZKXT.
We also use the 385 function to determine whether or not the variable ,U[TJ has been true once at any time during the last 5 bars (the variable ,U[TJ is true once a divergence is found), and we look to make sure that the (GXY9OTIK6GZZKXT variable holds a value greater than 0.
When these conditions are true (there was a divergence followed by the down-day/up-day pattern), then will place a sell stop order at the lowest low of the last 4 bars.
(GXY9OTIK6GZZKXTú#ú385òú)RUYKAéCú"ú)RUYKAèCú'4*ú)RUYKú$ú)RUYKAéCîúçîúéñ!/Lú385òú,U[TJîúåîúéñú$úíéú'4*ú(GXY9OTIK6GZZKXTú$úêúZNKT
9KRRúTK^ZúHGXúGZú2U]KYZò2U]îæñú9ZUV!ú
+^OZú5XJKXYFirst we obtain our market position using the 3GXQKZ6UYOZOUT function and store it in the variable 36. Then, on the first bar of a short position, the system will define 9ZUV6XOIK as the high of the current bar plus a 4-bar average of the range.
36ú#ú3GXQKZ6UYOZOUT!/Lú36ú#úíéúGTJú36AéCú"$úíéúZNKT
9ZUV6XOIKú#ú.OMNúïú'\KXGMKò8GTMKîæñ!
Then, once we are in a short position, we will place an order to exit a short position at the stop price or anything higher. Once this is done, the stop price for the next bar is calculated as the current stop price minus a third of the difference between the current stop price and the high of the current bar.
/Lú36ú#úíéúZNKTú(KMOT+^OZYNUXZúTK^ZúHGXúGZú9ZUV6XOIKú9ZUV!9ZUV6XOIKú#ú9ZUV6XOIKúíúò9ZUV6XOIKúíú.OMNñëç!
+TJ!
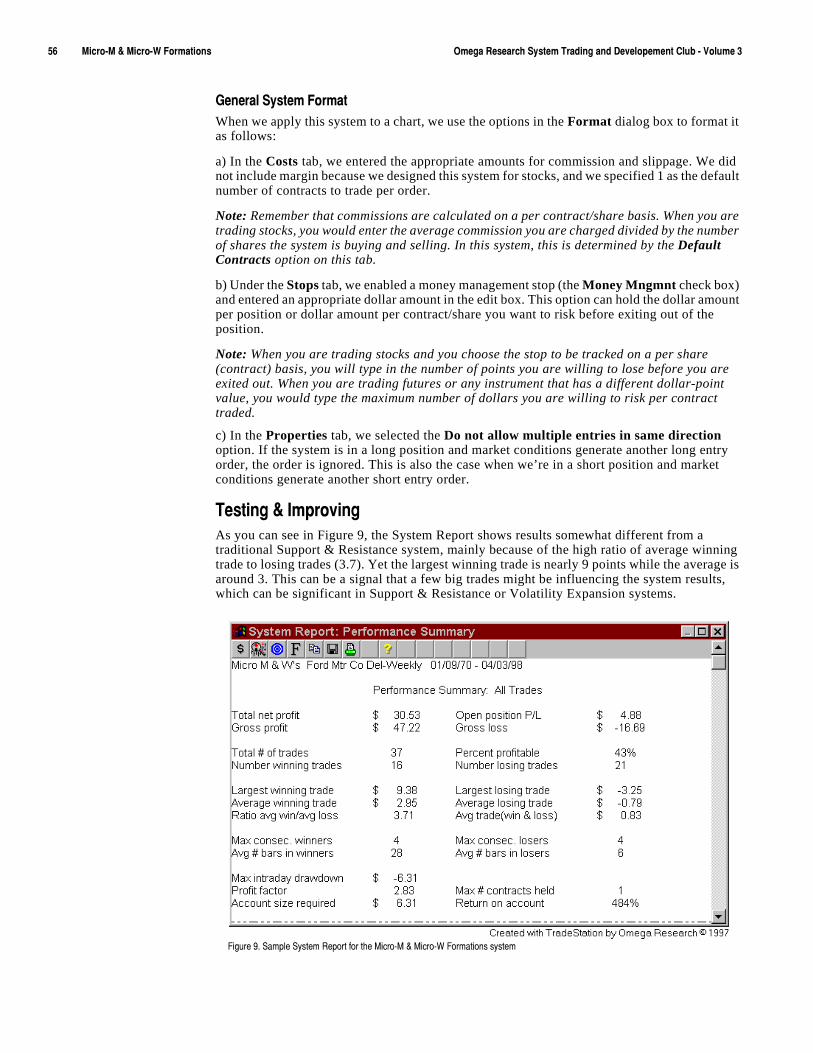
åäúúúúúúúúúú3OIXUí3úôú3OIXUí=ú,UXSGZOUTYúúúúúúúúúú 5SKMGú8KYKGXINú9_YZKSú:XGJOTMúGTJú*K\KRUVKSKTZú)R[Húíú<UR[SKúç
-KTKXGRú9_YZKSú,UXSGZWhen we apply this system to a chart, we use the options in the Format dialog box to format it as follows:
a) In the Costs tab, we entered the appropriate amounts for commission and slippage. We did not include margin because we designed this system for stocks, and we specified 1 as the default number of contracts to trade per order.
Note: Remember that commissions are calculated on a per contract/share basis. When you are trading stocks, you would enter the average commission you are charged divided by the number of shares the system is buying and selling. In this system, this is determined by the Default Contracts option on this tab.
b) Under the Stops tab, we enabled a money management stop (the Money Mngmnt check box) and entered an appropriate dollar amount in the edit box. This option can hold the dollar amount per position or dollar amount per contract/share you want to risk before exiting out of the position.
Note: When you are trading stocks and you choose the stop to be tracked on a per share (contract) basis, you will type in the number of points you are willing to lose before you are exited out. When you are trading futures or any instrument that has a different dollar-point value, you would type the maximum number of dollars you are willing to risk per contract traded.
c) In the Properties tab, we selected the Do not allow multiple entries in same direction option. If the system is in a long position and market conditions generate another long entry order, the order is ignored. This is also the case when we’re in a short position and market conditions generate another short entry order.
:KYZOTMúôú/SVXU\OTMAs you can see in Figure 9, the System Report shows results somewhat different from a traditional Support & Resistance system, mainly because of the high ratio of average winning trade to losing trades (3.7). Yet the largest winning trade is nearly 9 points while the average is around 3. This can be a signal that a few big trades might be influencing the system results, which can be significant in Support & Resistance or Volatility Expansion systems.
,OM[XKúáìú9GSVRKú9_YZKSú8KVUXZúLUXúZNKú3OIXUí3úôú3OIXUí=ú,UXSGZOUTYúY_YZKSúú
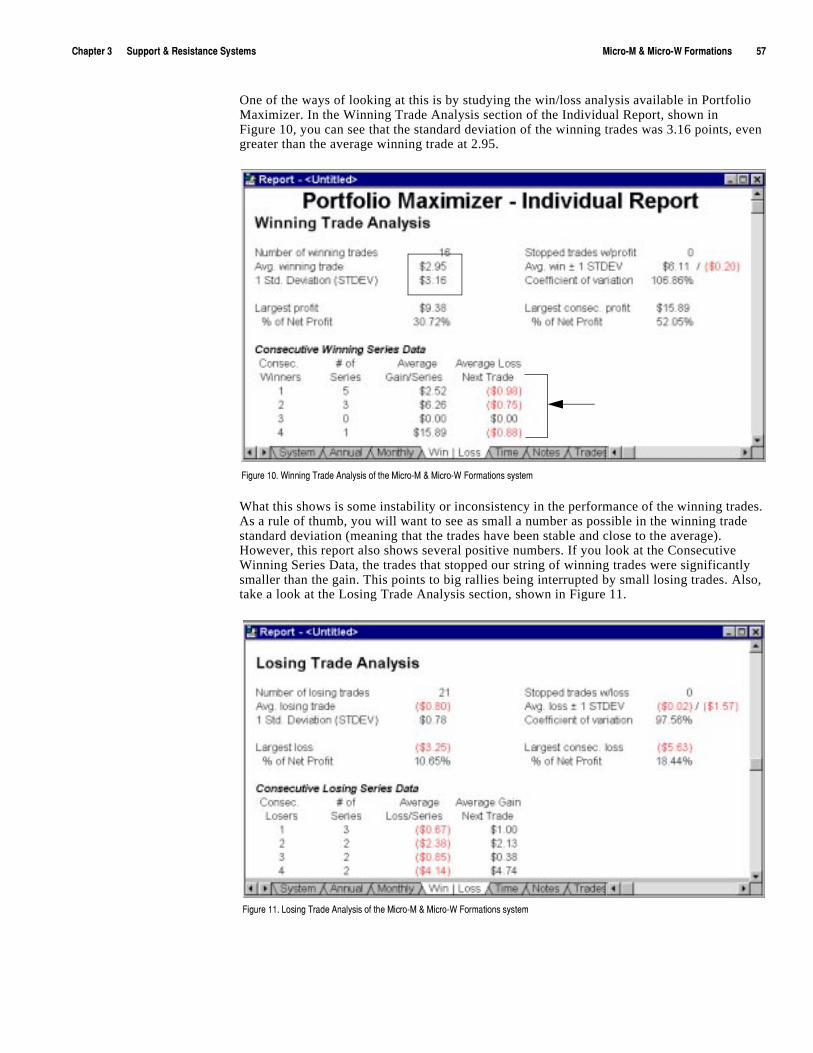
)NGVZKXúçúúúúúú9[VVUXZúôú8KYOYZGTIKú9_YZKSY 3OIXUí3úôú3OIXUí=ú,UXSGZOUTYúúúúúúúúúúåã
One of the ways of looking at this is by studying the win/loss analysis available in Portfolio Maximizer. In the Winning Trade Analysis section of the Individual Report, shown in Figure 10, you can see that the standard deviation of the winning trades was 3.16 points, even greater than the average winning trade at 2.95.
What this shows is some instability or inconsistency in the performance of the winning trades. As a rule of thumb, you will want to see as small a number as possible in the winning trade standard deviation (meaning that the trades have been stable and close to the average). However, this report also shows several positive numbers. If you look at the Consecutive Winning Series Data, the trades that stopped our string of winning trades were significantly smaller than the gain. This points to big rallies being interrupted by small losing trades. Also, take a look at the Losing Trade Analysis section, shown in Figure 11.
,OM[XKúéêìú=OTTOTMú:XGJKú'TGR_YOYúULúZNKú3OIXUí3úôú3OIXUí=ú,UXSGZOUTYúY_YZKSú
,OM[XKúééìú2UYOTMú:XGJKú'TGR_YOYúULúZNKú3OIXUí3úôú3OIXUí=ú,UXSGZOUTYúY_YZKSú
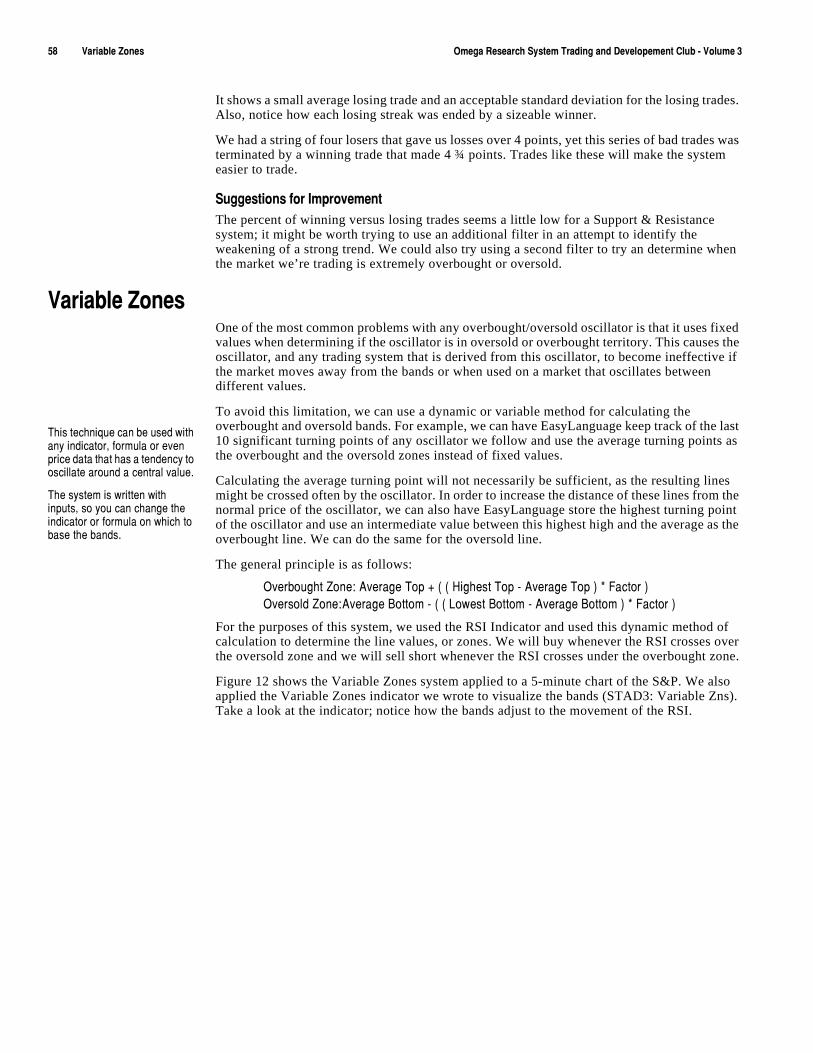
åâúúúúúúúúúú<GXOGHRKú@UTKYúúúúúúúúúú 5SKMGú8KYKGXINú9_YZKSú:XGJOTMúGTJú*K\KRUVKSKTZú)R[Húíú<UR[SKúç
It shows a small average losing trade and an acceptable standard deviation for the losing trades. Also, notice how each losing streak was ended by a sizeable winner.
We had a string of four losers that gave us losses over 4 points, yet this series of bad trades was terminated by a winning trade that made 4 ¾ points. Trades like these will make the system easier to trade.
9[MMKYZOUTYúLUXú/SVXU\KSKTZThe percent of winning versus losing trades seems a little low for a Support & Resistance system; it might be worth trying to use an additional filter in an attempt to identify the weakening of a strong trend. We could also try using a second filter to try an determine when the market we’re trading is extremely overbought or oversold.
<GXOGHRKú@UTKYOne of the most common problems with any overbought/oversold oscillator is that it uses fixed values when determining if the oscillator is in oversold or overbought territory. This causes the oscillator, and any trading system that is derived from this oscillator, to become ineffective if the market moves away from the bands or when used on a market that oscillates between different values.
To avoid this limitation, we can use a dynamic or variable method for calculating the overbought and oversold bands. For example, we can have EasyLanguage keep track of the last 10 significant turning points of any oscillator we follow and use the average turning points as the overbought and the oversold zones instead of fixed values.
Calculating the average turning point will not necessarily be sufficient, as the resulting lines might be crossed often by the oscillator. In order to increase the distance of these lines from the normal price of the oscillator, we can also have EasyLanguage store the highest turning point of the oscillator and use an intermediate value between this highest high and the average as the overbought line. We can do the same for the oversold line.
The general principle is as follows:
5\KXHU[MNZú@UTK ú'\KXGMKú:UVúïúòúòú.OMNKYZú:UVúíú'\KXGMKú:UVúñúðú,GIZUXúñ5\KXYURJú@UTK '\KXGMKú(UZZUSúíúòúòú2U]KYZú(UZZUSúíú'\KXGMKú(UZZUSúñúðú,GIZUXúñ
For the purposes of this system, we used the RSI Indicator and used this dynamic method of calculation to determine the line values, or zones. We will buy whenever the RSI crosses over the oversold zone and we will sell short whenever the RSI crosses under the overbought zone.
Figure 12 shows the Variable Zones system applied to a 5-minute chart of the S&P. We also applied the Variable Zones indicator we wrote to visualize the bands (STAD3: Variable Zns). Take a look at the indicator; notice how the bands adjust to the movement of the RSI.
:NOYúZKINTOW[KúIGTúHKú[YKJú]OZNúGT_úOTJOIGZUXîúLUXS[RGúUXúK\KTúVXOIKúJGZGúZNGZúNGYúGúZKTJKTI_úZUúUYIORRGZKúGXU[TJúGúIKTZXGRú\GR[Kì
:NKúY_YZKSúOYú]XOZZKTú]OZNúOTV[ZYîúYUú_U[úIGTúINGTMKúZNKúOTJOIGZUXúUXúLUXS[RGúUTú]NOINúZUúHGYKúZNKúHGTJYìú
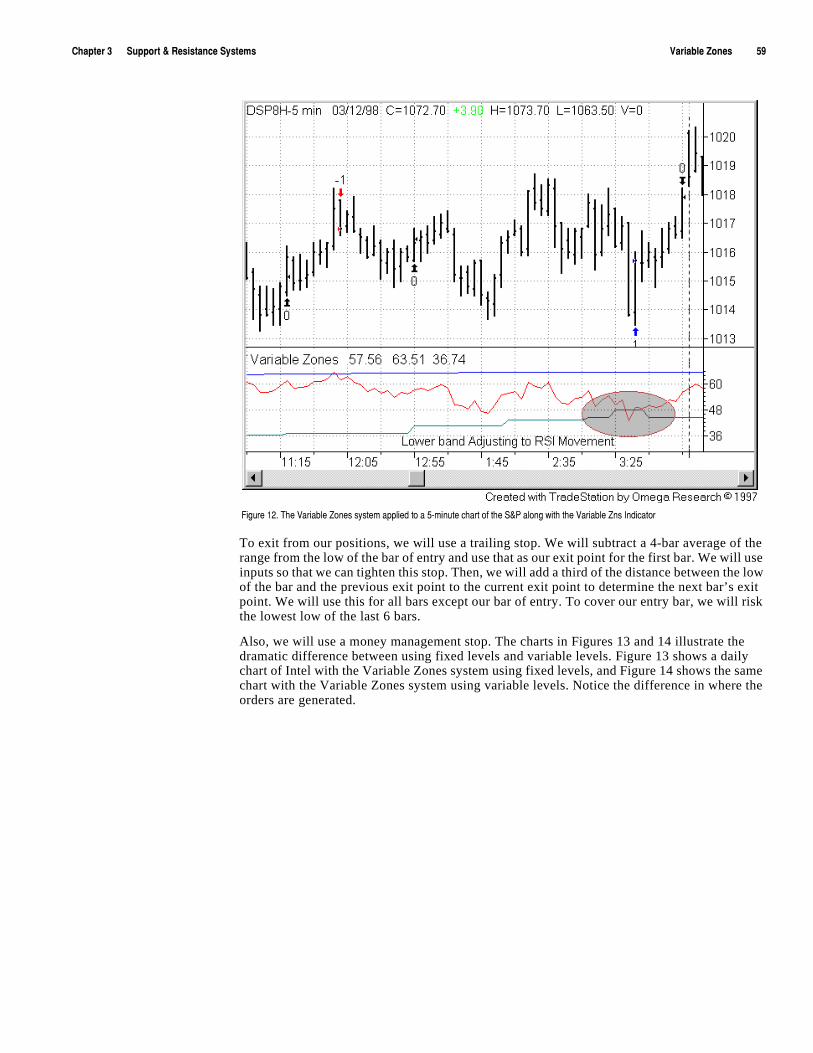
)NGVZKXúçúúúúúú9[VVUXZúôú8KYOYZGTIKú9_YZKSY <GXOGHRKú@UTKYúúúúúúúúúúåá
To exit from our positions, we will use a trailing stop. We will subtract a 4-bar average of the range from the low of the bar of entry and use that as our exit point for the first bar. We will use inputs so that we can tighten this stop. Then, we will add a third of the distance between the low of the bar and the previous exit point to the current exit point to determine the next bar’s exit point. We will use this for all bars except our bar of entry. To cover our entry bar, we will risk the lowest low of the last 6 bars.
Also, we will use a money management stop. The charts in Figures 13 and 14 illustrate the dramatic difference between using fixed levels and variable levels. Figure 13 shows a daily chart of Intel with the Variable Zones system using fixed levels, and Figure 14 shows the same chart with the Variable Zones system using variable levels. Notice the difference in where the orders are generated.
,OM[XKúéèìú:NKú<GXOGHRKú@UTKYúY_YZKSúGVVROKJúZUúGúåíSOT[ZKúINGXZúULúZNKú9ô6úGRUTMú]OZNúZNKú<GXOGHRKú@TYú/TJOIGZUX

äêúúúúúúúúúú<GXOGHRKú@UTKYúúúúúúúúúú 5SKMGú8KYKGXINú9_YZKSú:XGJOTMúGTJú*K\KRUVKSKTZú)R[Húíú<UR[SKúç
,OM[XKúéçìú<GXOGHRKú@UTKYúY_YZKSúGVVROKJú]OZNúLO^KJú\GR[KY
,OM[XKúéæìú<GXOGHRKú@UTKYúY_YZKSúGVVROKJú]OZNúZNKú\GXOGHRKú\GR[KY
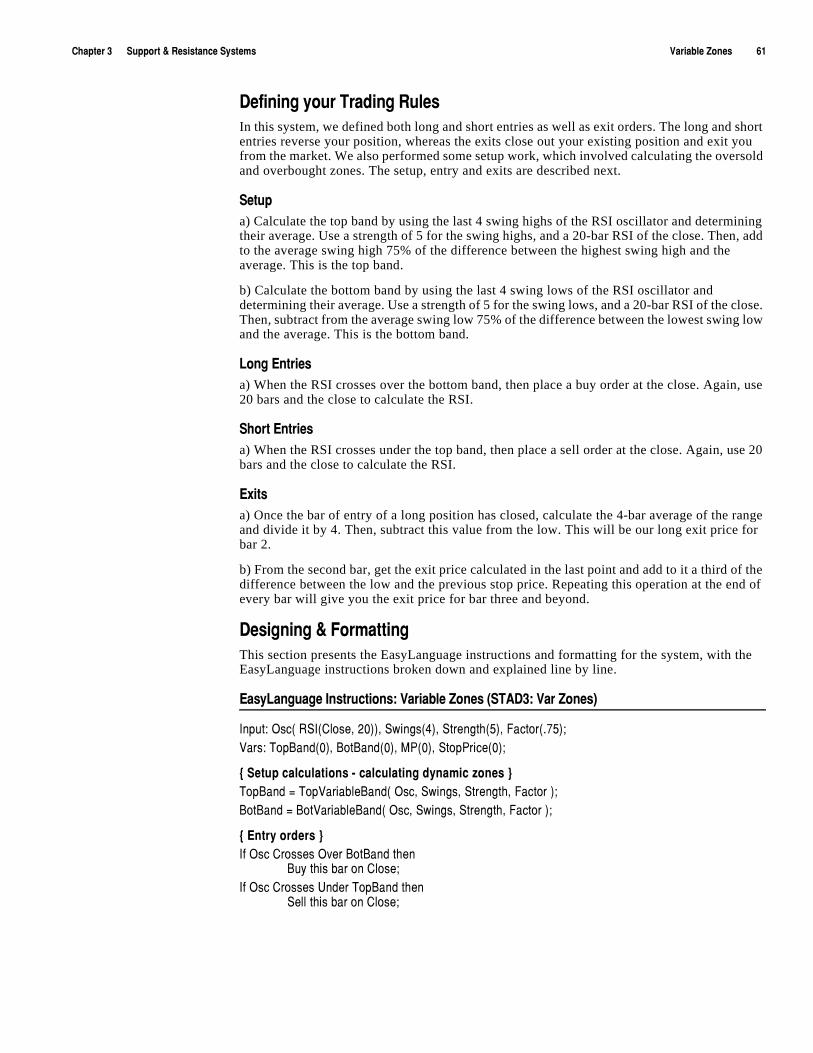
)NGVZKXúçúúúúúú9[VVUXZúôú8KYOYZGTIKú9_YZKSY <GXOGHRKú@UTKYúúúúúúúúúúäé
*KLOTOTMú_U[Xú:XGJOTMú8[RKYIn this system, we defined both long and short entries as well as exit orders. The long and short entries reverse your position, whereas the exits close out your existing position and exit you from the market. We also performed some setup work, which involved calculating the oversold and overbought zones. The setup, entry and exits are described next.
9KZ[Vúa) Calculate the top band by using the last 4 swing highs of the RSI oscillator and determining their average. Use a strength of 5 for the swing highs, and a 20-bar RSI of the close. Then, add to the average swing high 75% of the difference between the highest swing high and the average. This is the top band.
b) Calculate the bottom band by using the last 4 swing lows of the RSI oscillator and determining their average. Use a strength of 5 for the swing lows, and a 20-bar RSI of the close. Then, subtract from the average swing low 75% of the difference between the lowest swing low and the average. This is the bottom band.
2UTMú+TZXOKYúa) When the RSI crosses over the bottom band, then place a buy order at the close. Again, use 20 bars and the close to calculate the RSI.
9NUXZú+TZXOKYúa) When the RSI crosses under the top band, then place a sell order at the close. Again, use 20 bars and the close to calculate the RSI.
+^OZYúa) Once the bar of entry of a long position has closed, calculate the 4-bar average of the range and divide it by 4. Then, subtract this value from the low. This will be our long exit price for bar 2.
b) From the second bar, get the exit price calculated in the last point and add to it a third of the difference between the low and the previous stop price. Repeating this operation at the end of every bar will give you the exit price for bar three and beyond.
*KYOMTOTMúôú,UXSGZZOTMThis section presents the EasyLanguage instructions and formatting for the system, with the EasyLanguage instructions broken down and explained line by line.
+GY_2GTM[GMKú/TYZX[IZOUTY ú<GXOGHRKú@UTKYúò9:'*ç ú<GXú@UTKYñ
/TV[Z ú5YIòú89/ò)RUYKîúèêññîú9]OTMYòæñîú9ZXKTMZNòåñîú,GIZUXòìãåñ!<GXY ú:UV(GTJòêñîú(UZ(GTJòêñîú36òêñîú9ZUV6XOIKòêñ!
aú9KZ[VúIGRI[RGZOUTYúíúIGRI[RGZOTMúJ_TGSOIú`UTKYúc:UV(GTJú#ú:UV<GXOGHRK(GTJòú5YIîú9]OTMYîú9ZXKTMZNîú,GIZUXúñ!(UZ(GTJú#ú(UZ<GXOGHRK(GTJòú5YIîú9]OTMYîú9ZXKTMZNîú,GIZUXúñ!
aú+TZX_úUXJKXYúc/Lú5YIú)XUYYKYú5\KXú(UZ(GTJúZNKT
([_úZNOYúHGXúUTú)RUYK!/Lú5YIú)XUYYKYú;TJKXú:UV(GTJúZNKT
9KRRúZNOYúHGXúUTú)RUYK!
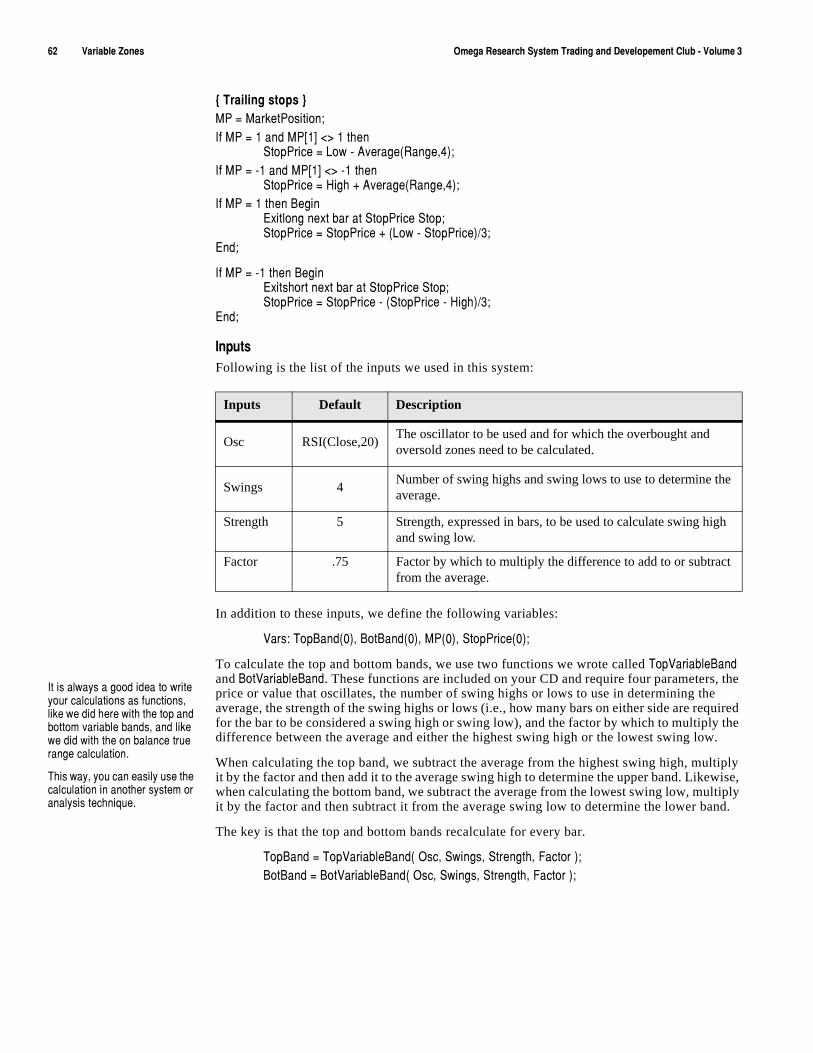
äèúúúúúúúúúú<GXOGHRKú@UTKYúúúúúúúúúú 5SKMGú8KYKGXINú9_YZKSú:XGJOTMúGTJú*K\KRUVKSKTZú)R[Húíú<UR[SKúç
aú:XGOROTMúYZUVYúc36ú#ú3GXQKZ6UYOZOUT!/Lú36ú#úéúGTJú36AéCú"$úéúZNKT
9ZUV6XOIKú#ú2U]úíú'\KXGMKò8GTMKîæñ!/Lú36ú#úíéúGTJú36AéCú"$úíéúZNKT
9ZUV6XOIKú#ú.OMNúïú'\KXGMKò8GTMKîæñ!/Lú36ú#úéúZNKTú(KMOT
+^OZRUTMúTK^ZúHGXúGZú9ZUV6XOIKú9ZUV!9ZUV6XOIKú#ú9ZUV6XOIKúïúò2U]úíú9ZUV6XOIKñëç!
+TJ!
/Lú36ú#úíéúZNKTú(KMOT+^OZYNUXZúTK^ZúHGXúGZú9ZUV6XOIKú9ZUV!9ZUV6XOIKú#ú9ZUV6XOIKúíúò9ZUV6XOIKúíú.OMNñëç!
+TJ!
/TV[ZYFollowing is the list of the inputs we used in this system:
In addition to these inputs, we define the following variables:
<GXY ú:UV(GTJòêñîú(UZ(GTJòêñîú36òêñîú9ZUV6XOIKòêñ!
To calculate the top and bottom bands, we use two functions we wrote called :UV<GXOGHRK(GTJ and (UZ<GXOGHRK(GTJ. These functions are included on your CD and require four parameters, the price or value that oscillates, the number of swing highs or lows to use in determining the average, the strength of the swing highs or lows (i.e., how many bars on either side are required for the bar to be considered a swing high or swing low), and the factor by which to multiply the difference between the average and either the highest swing high or the lowest swing low.
When calculating the top band, we subtract the average from the highest swing high, multiply it by the factor and then add it to the average swing high to determine the upper band. Likewise, when calculating the bottom band, we subtract the average from the lowest swing low, multiply it by the factor and then subtract it from the average swing low to determine the lower band.
The key is that the top and bottom bands recalculate for every bar.
:UV(GTJú#ú:UV<GXOGHRK(GTJòú5YIîú9]OTMYîú9ZXKTMZNîú,GIZUXúñ!(UZ(GTJú#ú(UZ<GXOGHRK(GTJòú5YIîú9]OTMYîú9ZXKTMZNîú,GIZUXúñ!
Inputs Default Description
Osc RSI(Close,20)The oscillator to be used and for which the overbought and oversold zones need to be calculated.
Swings 4Number of swing highs and swing lows to use to determine the average.
Strength 5 Strength, expressed in bars, to be used to calculate swing high and swing low.
Factor .75 Factor by which to multiply the difference to add to or subtract from the average.
/ZúOYúGR]G_YúGúMUUJúOJKGúZUú]XOZKú_U[XúIGRI[RGZOUTYúGYúL[TIZOUTYîúROQKú]KúJOJúNKXKú]OZNúZNKúZUVúGTJúHUZZUSú\GXOGHRKúHGTJYîúGTJúROQKú]KúJOJú]OZNúZNKúUTúHGRGTIKúZX[KúXGTMKúIGRI[RGZOUTìú
:NOYú]G_îú_U[úIGTúKGYOR_ú[YKúZNKúIGRI[RGZOUTúOTúGTUZNKXúY_YZKSúUXúGTGR_YOYúZKINTOW[Kìú
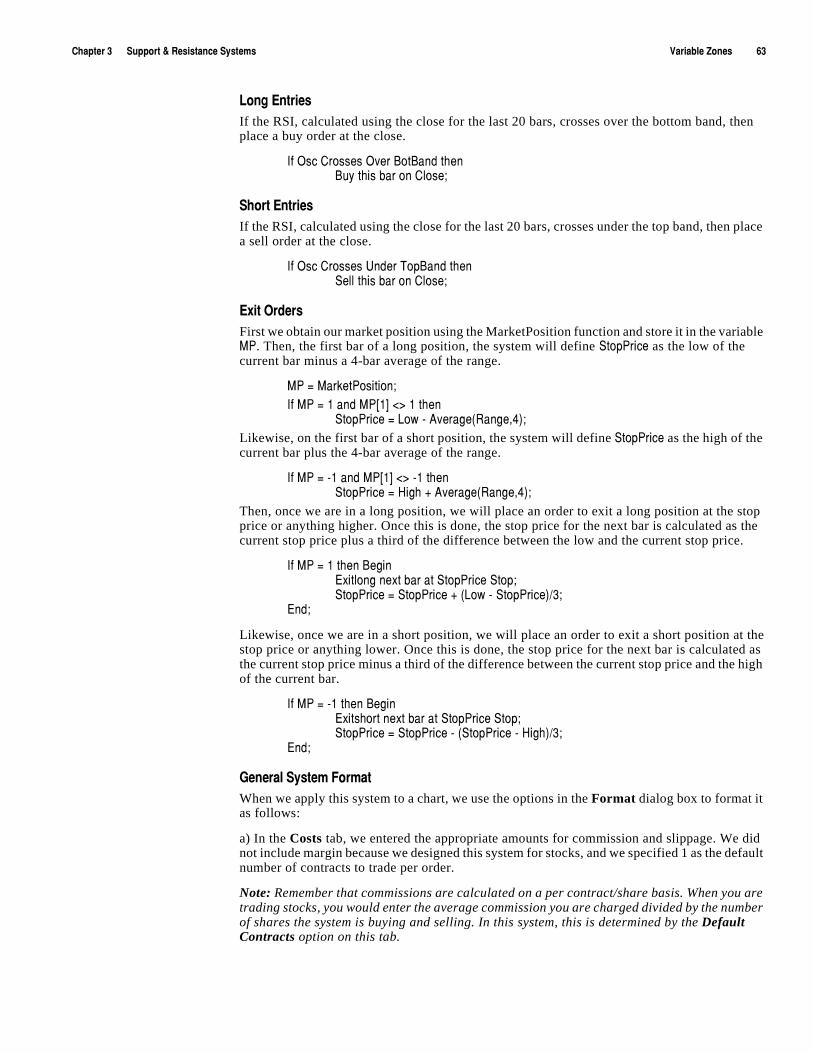
)NGVZKXúçúúúúúú9[VVUXZúôú8KYOYZGTIKú9_YZKSY <GXOGHRKú@UTKYúúúúúúúúúúäç
2UTMú+TZXOKYIf the RSI, calculated using the close for the last 20 bars, crosses over the bottom band, then place a buy order at the close.
/Lú5YIú)XUYYKYú5\KXú(UZ(GTJúZNKT([_úZNOYúHGXúUTú)RUYK!
9NUXZú+TZXOKYIf the RSI, calculated using the close for the last 20 bars, crosses under the top band, then place a sell order at the close.
/Lú5YIú)XUYYKYú;TJKXú:UV(GTJúZNKT9KRRúZNOYúHGXúUTú)RUYK!
+^OZú5XJKXYFirst we obtain our market position using the MarketPosition function and store it in the variable 36. Then, the first bar of a long position, the system will define 9ZUV6XOIK as the low of the current bar minus a 4-bar average of the range.
36ú#ú3GXQKZ6UYOZOUT!/Lú36ú#úéúGTJú36AéCú"$úéúZNKT
9ZUV6XOIKú#ú2U]úíú'\KXGMKò8GTMKîæñ!Likewise, on the first bar of a short position, the system will define 9ZUV6XOIK as the high of the current bar plus the 4-bar average of the range.
/Lú36ú#úíéúGTJú36AéCú"$úíéúZNKT9ZUV6XOIKú#ú.OMNúïú'\KXGMKò8GTMKîæñ!
Then, once we are in a long position, we will place an order to exit a long position at the stop price or anything higher. Once this is done, the stop price for the next bar is calculated as the current stop price plus a third of the difference between the low and the current stop price.
/Lú36ú#úéúZNKTú(KMOT+^OZRUTMúTK^ZúHGXúGZú9ZUV6XOIKú9ZUV!9ZUV6XOIKú#ú9ZUV6XOIKúïúò2U]úíú9ZUV6XOIKñëç!
+TJ!
Likewise, once we are in a short position, we will place an order to exit a short position at the stop price or anything lower. Once this is done, the stop price for the next bar is calculated as the current stop price minus a third of the difference between the current stop price and the high of the current bar.
/Lú36ú#úíéúZNKTú(KMOT+^OZYNUXZúTK^ZúHGXúGZú9ZUV6XOIKú9ZUV!9ZUV6XOIKú#ú9ZUV6XOIKúíúò9ZUV6XOIKúíú.OMNñëç!
+TJ!
-KTKXGRú9_YZKSú,UXSGZWhen we apply this system to a chart, we use the options in the Format dialog box to format it as follows:
a) In the Costs tab, we entered the appropriate amounts for commission and slippage. We did not include margin because we designed this system for stocks, and we specified 1 as the default number of contracts to trade per order.
Note: Remember that commissions are calculated on a per contract/share basis. When you are trading stocks, you would enter the average commission you are charged divided by the number of shares the system is buying and selling. In this system, this is determined by the Default Contracts option on this tab.
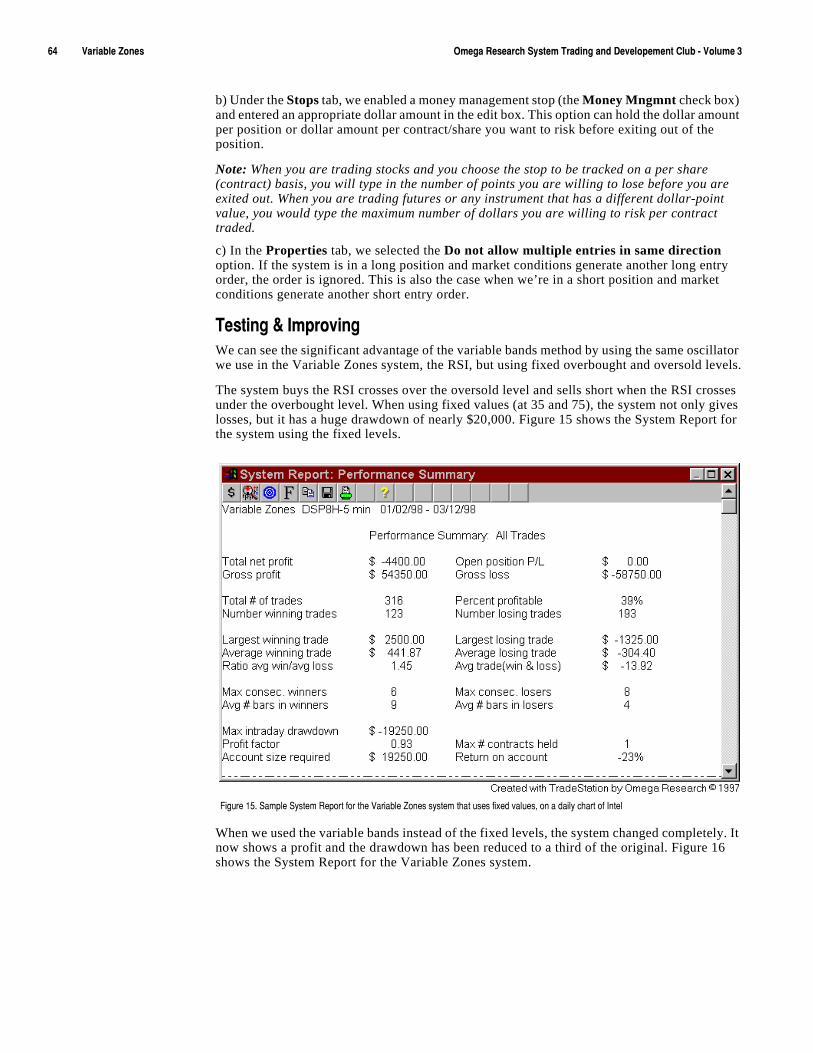
äæúúúúúúúúúú<GXOGHRKú@UTKYúúúúúúúúúú 5SKMGú8KYKGXINú9_YZKSú:XGJOTMúGTJú*K\KRUVKSKTZú)R[Húíú<UR[SKúç
b) Under the Stops tab, we enabled a money management stop (the Money Mngmnt check box) and entered an appropriate dollar amount in the edit box. This option can hold the dollar amount per position or dollar amount per contract/share you want to risk before exiting out of the position.
Note: When you are trading stocks and you choose the stop to be tracked on a per share (contract) basis, you will type in the number of points you are willing to lose before you are exited out. When you are trading futures or any instrument that has a different dollar-point value, you would type the maximum number of dollars you are willing to risk per contract traded.
c) In the Properties tab, we selected the Do not allow multiple entries in same direction option. If the system is in a long position and market conditions generate another long entry order, the order is ignored. This is also the case when we’re in a short position and market conditions generate another short entry order.
:KYZOTMúôú/SVXU\OTMWe can see the significant advantage of the variable bands method by using the same oscillator we use in the Variable Zones system, the RSI, but using fixed overbought and oversold levels.
The system buys the RSI crosses over the oversold level and sells short when the RSI crosses under the overbought level. When using fixed values (at 35 and 75), the system not only gives losses, but it has a huge drawdown of nearly $20,000. Figure 15 shows the System Report for the system using the fixed levels.
When we used the variable bands instead of the fixed levels, the system changed completely. It now shows a profit and the drawdown has been reduced to a third of the original. Figure 16 shows the System Report for the Variable Zones system.
,OM[XKúéåìú9GSVRKú9_YZKSú8KVUXZúLUXúZNKú<GXOGHRKú@UTKYúY_YZKSúZNGZú[YKYúLO^KJú\GR[KYîúUTúGúJGOR_úINGXZúULú/TZKR
)NGVZKXúçúúúúúú9[VVUXZúôú8KYOYZGTIKú9_YZKSY <GXOGHRKú@UTKYúúúúúúúúúúäå
,OM[XKúéäìú9GSVRKú9_YZKSú8KVUXZúLUXúZNKú<GXOGHRKú@UTKYúY_YZKSîúZNOYúZOSKú[YOTMúZNKú\GXOGHRKú`UTKY

ääúúúúúúúúúú<GXOGHRKú@UTKYúúúúúúúúúú 5SKMGú8KYKGXINú9_YZKSú:XGJOTMúGTJú*K\KRUVKSKTZú)R[Húíú<UR[SKúç
C H A P T E R 4
<URGZOROZ_ú(XKGQU[Zú9_YZKSY
Volatile markets are characterized by sharp jumps in price, and volatility breakout systems are designed to take advantage of this type of change in volatility. Volatility breakout systems generally have the following characteristics:
� Substantial amount of time out of the market.
� High percentage of winning trades, but with a small profit per trade.
� Don’t take advantage of big moves.
� Exciting to trade because trades are quick and short-term.
� Based solely on price movement.
When designing this type of system, the key is to effectively anticipate and take advantage of a significant change in volatility and then exit the position before a loss of profit. In this chapter, we present three volatility breakout systems, all of which are designed to capture significant change in volatility and limit losses during directionless and/or trending phases. We also present a somewhat different section on determining short-term market outlook.
/Tú:NOYú)NGVZKX
� Inside Day Breakout Failure............68
� Standard Deviation - Volatility........72
� Volatility Clusters ............................77
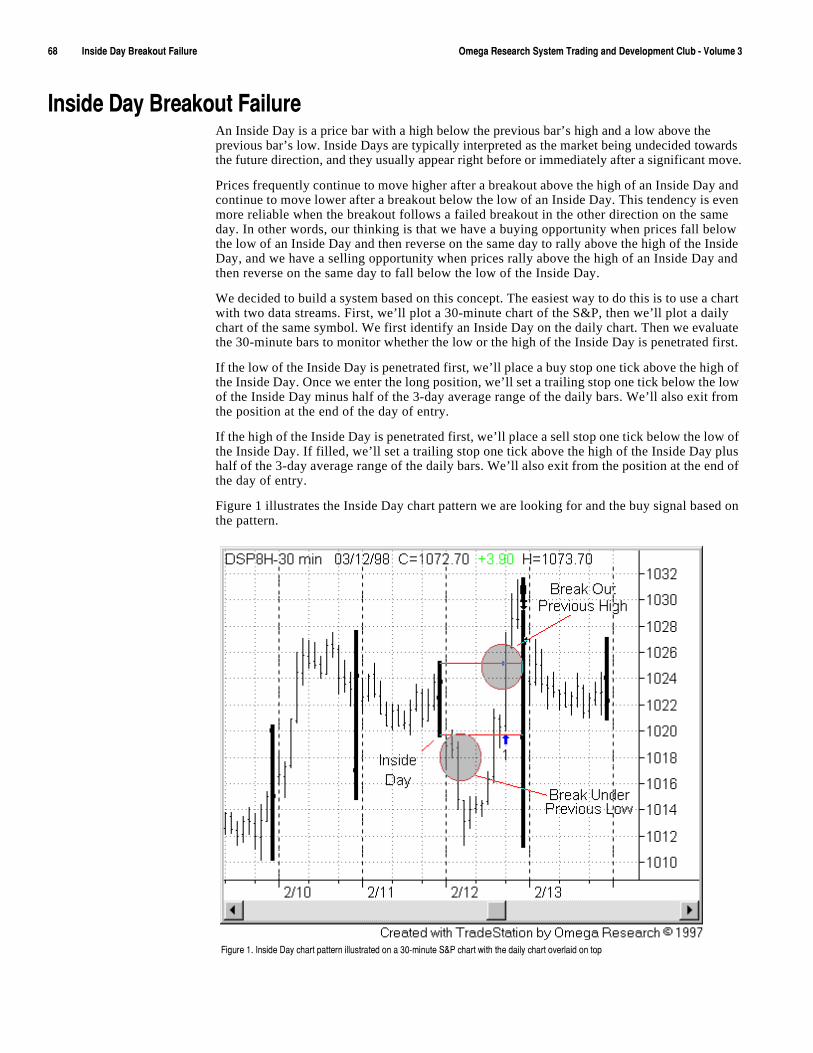
äâúúúúúúúúúú/TYOJKú*G_ú(XKGQU[Zú,GOR[XKúúúúúúúúúú 5SKMGú8KYKGXINú9_YZKSú:XGJOTMúGTJú*K\KRUVSKTZú)R[Húíú<UR[SKúç
/TYOJKú*G_ú(XKGQU[Zú,GOR[XKAn Inside Day is a price bar with a high below the previous bar’s high and a low above the previous bar’s low. Inside Days are typically interpreted as the market being undecided towards the future direction, and they usually appear right before or immediately after a significant move.
Prices frequently continue to move higher after a breakout above the high of an Inside Day and continue to move lower after a breakout below the low of an Inside Day. This tendency is even more reliable when the breakout follows a failed breakout in the other direction on the same day. In other words, our thinking is that we have a buying opportunity when prices fall below the low of an Inside Day and then reverse on the same day to rally above the high of the Inside Day, and we have a selling opportunity when prices rally above the high of an Inside Day and then reverse on the same day to fall below the low of the Inside Day.
We decided to build a system based on this concept. The easiest way to do this is to use a chart with two data streams. First, we’ll plot a 30-minute chart of the S&P, then we’ll plot a daily chart of the same symbol. We first identify an Inside Day on the daily chart. Then we evaluate the 30-minute bars to monitor whether the low or the high of the Inside Day is penetrated first.
If the low of the Inside Day is penetrated first, we’ll place a buy stop one tick above the high of the Inside Day. Once we enter the long position, we’ll set a trailing stop one tick below the low of the Inside Day minus half of the 3-day average range of the daily bars. We’ll also exit from the position at the end of the day of entry.
If the high of the Inside Day is penetrated first, we’ll place a sell stop one tick below the low of the Inside Day. If filled, we’ll set a trailing stop one tick above the high of the Inside Day plus half of the 3-day average range of the daily bars. We’ll also exit from the position at the end of the day of entry.
Figure 1 illustrates the Inside Day chart pattern we are looking for and the buy signal based on the pattern.
,OM[XKúéìú/TYOJKú*G_úINGXZúVGZZKXTúORR[YZXGZKJúUTúGúçêíSOT[ZKú9ô6úINGXZú]OZNúZNKúJGOR_úINGXZúU\KXRGOJúUTúZUV
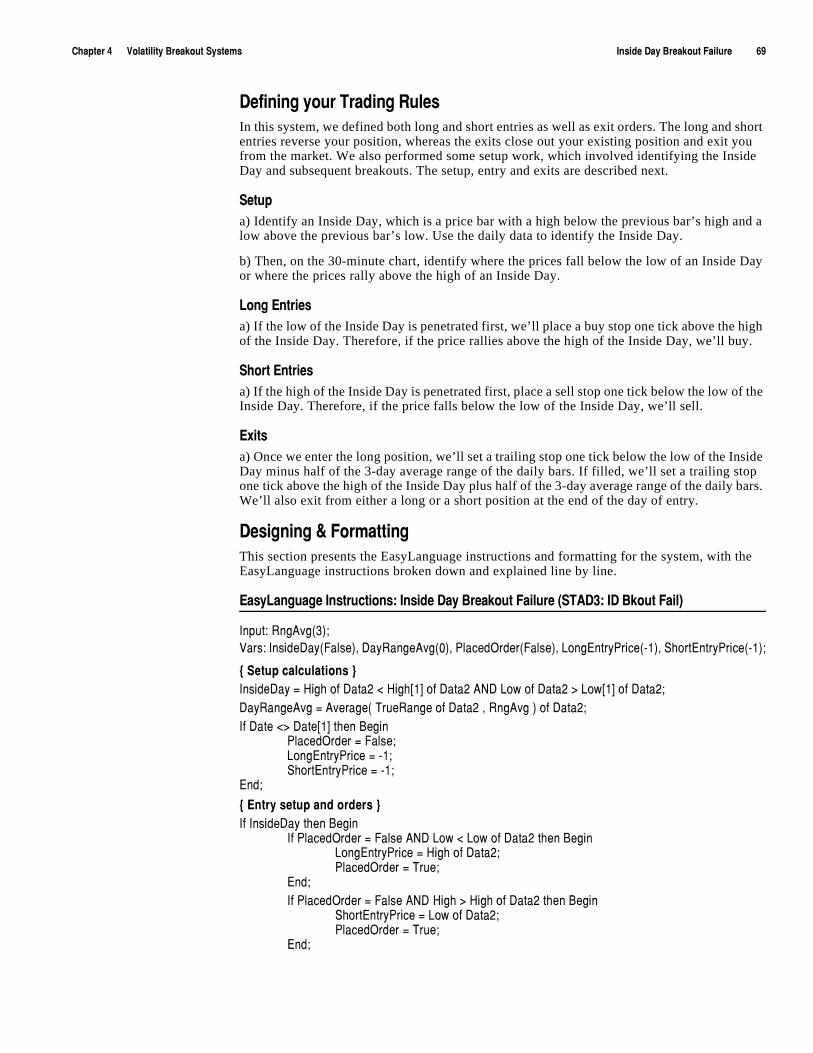
)NGVZKXúæúúúúúú<URGZOROZ_ú(XKGQU[Zú9_YZKSY /TYOJKú*G_ú(XKGQU[Zú,GOR[XKúúúúúúúúúúäá
*KLOTOTMú_U[Xú:XGJOTMú8[RKYIn this system, we defined both long and short entries as well as exit orders. The long and short entries reverse your position, whereas the exits close out your existing position and exit you from the market. We also performed some setup work, which involved identifying the Inside Day and subsequent breakouts. The setup, entry and exits are described next.
9KZ[Vúa) Identify an Inside Day, which is a price bar with a high below the previous bar’s high and a low above the previous bar’s low. Use the daily data to identify the Inside Day.
b) Then, on the 30-minute chart, identify where the prices fall below the low of an Inside Day or where the prices rally above the high of an Inside Day.
2UTMú+TZXOKYúa) If the low of the Inside Day is penetrated first, we’ll place a buy stop one tick above the high of the Inside Day. Therefore, if the price rallies above the high of the Inside Day, we’ll buy.
9NUXZú+TZXOKYúa) If the high of the Inside Day is penetrated first, place a sell stop one tick below the low of the Inside Day. Therefore, if the price falls below the low of the Inside Day, we’ll sell.
+^OZYúa) Once we enter the long position, we’ll set a trailing stop one tick below the low of the Inside Day minus half of the 3-day average range of the daily bars. If filled, we’ll set a trailing stop one tick above the high of the Inside Day plus half of the 3-day average range of the daily bars. We’ll also exit from either a long or a short position at the end of the day of entry.
*KYOMTOTMúôú,UXSGZZOTMThis section presents the EasyLanguage instructions and formatting for the system, with the EasyLanguage instructions broken down and explained line by line.
+GY_2GTM[GMKú/TYZX[IZOUTY ú/TYOJKú*G_ú(XKGQU[Zú,GOR[XKúò9:'*ç ú/*ú(QU[Zú,GORñ
/TV[Z ú8TM'\Mòçñ!<GXY ú/TYOJK*G_ò,GRYKñîú*G_8GTMK'\Mòêñîú6RGIKJ5XJKXò,GRYKñîú2UTM+TZX_6XOIKòíéñîú9NUXZ+TZX_6XOIKòíéñ!
aú9KZ[VúIGRI[RGZOUTYúc/TYOJK*G_ú#ú.OMNúULú*GZGèú"ú.OMNAéCúULú*GZGèú'4*ú2U]úULú*GZGèú$ú2U]AéCúULú*GZGè!*G_8GTMK'\Mú#ú'\KXGMKòú:X[K8GTMKúULú*GZGèúîú8TM'\MúñúULú*GZGè!/Lú*GZKú"$ú*GZKAéCúZNKTú(KMOT
6RGIKJ5XJKXú#ú,GRYK!2UTM+TZX_6XOIKú#úíé!9NUXZ+TZX_6XOIKú#úíé!
+TJ!
aú+TZX_úYKZ[VúGTJúUXJKXYúc/Lú/TYOJK*G_úZNKTú(KMOT
/Lú6RGIKJ5XJKXú#ú,GRYKú'4*ú2U]ú"ú2U]úULú*GZGèúZNKTú(KMOT2UTM+TZX_6XOIKú#ú.OMNúULú*GZGè!6RGIKJ5XJKXú#ú:X[K!
+TJ!/Lú6RGIKJ5XJKXú#ú,GRYKú'4*ú.OMNú$ú.OMNúULú*GZGèúZNKTú(KMOT
9NUXZ+TZX_6XOIKú#ú2U]úULú*GZGè!6RGIKJ5XJKXú#ú:X[K!
+TJ!
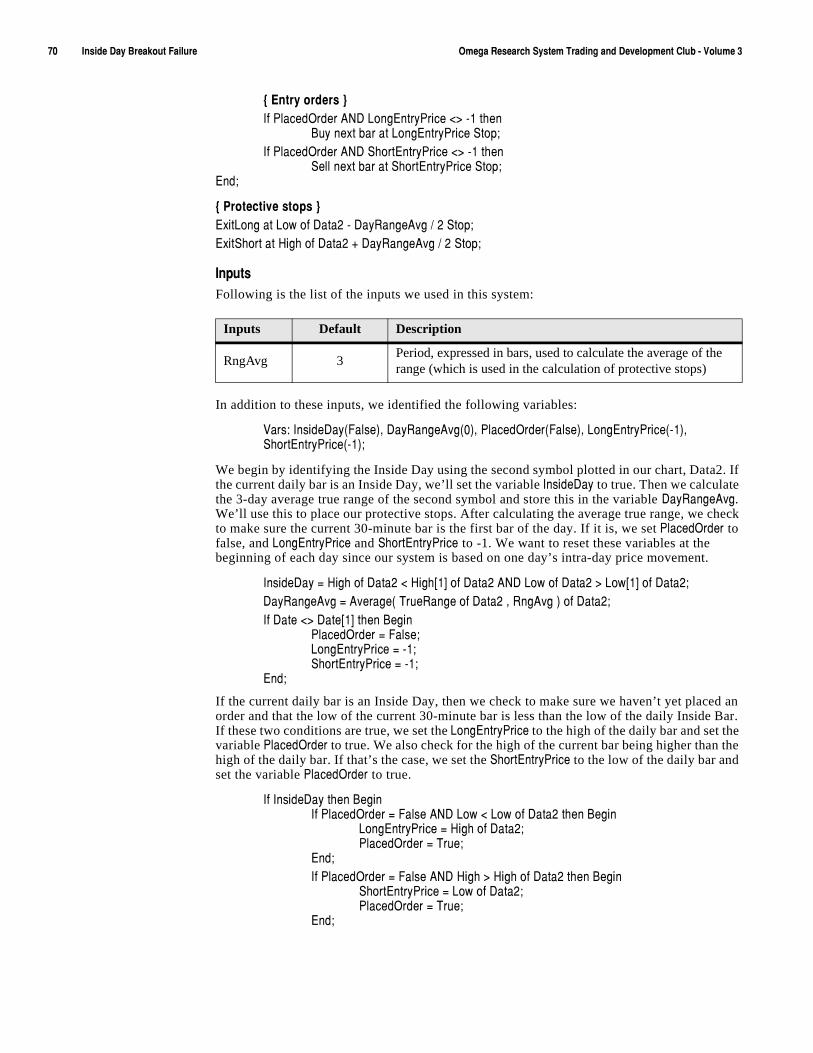
ãêúúúúúúúúúú/TYOJKú*G_ú(XKGQU[Zú,GOR[XKúúúúúúúúúú 5SKMGú8KYKGXINú9_YZKSú:XGJOTMúGTJú*K\KRUVSKTZú)R[Húíú<UR[SKúç
aú+TZX_úUXJKXYúc/Lú6RGIKJ5XJKXú'4*ú2UTM+TZX_6XOIKú"$úíéúZNKTú
([_úTK^ZúHGXúGZú2UTM+TZX_6XOIKú9ZUV!/Lú6RGIKJ5XJKXú'4*ú9NUXZ+TZX_6XOIKú"$úíéúZNKT
9KRRúTK^ZúHGXúGZú9NUXZ+TZX_6XOIKú9ZUV!+TJ!
aú6XUZKIZO\KúYZUVYúc+^OZ2UTMúGZú2U]úULú*GZGèúíú*G_8GTMK'\Múëúèú9ZUV!+^OZ9NUXZúGZú.OMNúULú*GZGèúïú*G_8GTMK'\Múëúèú9ZUV!
/TV[ZYúFollowing is the list of the inputs we used in this system:
In addition to these inputs, we identified the following variables:
<GXY ú/TYOJK*G_ò,GRYKñîú*G_8GTMK'\Mòêñîú6RGIKJ5XJKXò,GRYKñîú2UTM+TZX_6XOIKòíéñî9NUXZ+TZX_6XOIKòíéñ!
We begin by identifying the Inside Day using the second symbol plotted in our chart, Data2. If the current daily bar is an Inside Day, we’ll set the variable /TYOJK*G_ to true. Then we calculate the 3-day average true range of the second symbol and store this in the variable *G_8GTMK'\M. We’ll use this to place our protective stops. After calculating the average true range, we check to make sure the current 30-minute bar is the first bar of the day. If it is, we set 6RGIKJ5XJKX to false, and 2UTM+TZX_6XOIK and 9NUXZ+TZX_6XOIK to -1. We want to reset these variables at the beginning of each day since our system is based on one day’s intra-day price movement.
/TYOJK*G_ú#ú.OMNúULú*GZGèú"ú.OMNAéCúULú*GZGèú'4*ú2U]úULú*GZGèú$ú2U]AéCúULú*GZGè!*G_8GTMK'\Mú#ú'\KXGMKòú:X[K8GTMKúULú*GZGèúîú8TM'\MúñúULú*GZGè!/Lú*GZKú"$ú*GZKAéCúZNKTú(KMOT
6RGIKJ5XJKXú#ú,GRYK!2UTM+TZX_6XOIKú#úíé!9NUXZ+TZX_6XOIKú#úíé!
+TJ!
If the current daily bar is an Inside Day, then we check to make sure we haven’t yet placed an order and that the low of the current 30-minute bar is less than the low of the daily Inside Bar. If these two conditions are true, we set the 2UTM+TZX_6XOIK to the high of the daily bar and set the variable 6RGIKJ5XJKX to true. We also check for the high of the current bar being higher than the high of the daily bar. If that’s the case, we set the 9NUXZ+TZX_6XOIK to the low of the daily bar and set the variable 6RGIKJ5XJKX to true.
/Lú/TYOJK*G_úZNKTú(KMOT/Lú6RGIKJ5XJKXú#ú,GRYKú'4*ú2U]ú"ú2U]úULú*GZGèúZNKTú(KMOT
2UTM+TZX_6XOIKú#ú.OMNúULú*GZGè!6RGIKJ5XJKXú#ú:X[K!
+TJ!/Lú6RGIKJ5XJKXú#ú,GRYKú'4*ú.OMNú$ú.OMNúULú*GZGèúZNKTú(KMOT
9NUXZ+TZX_6XOIKú#ú2U]úULú*GZGè!6RGIKJ5XJKXú#ú:X[K!
+TJ!
Inputs Default Description
RngAvg 3Period, expressed in bars, used to calculate the average of the range (which is used in the calculation of protective stops)
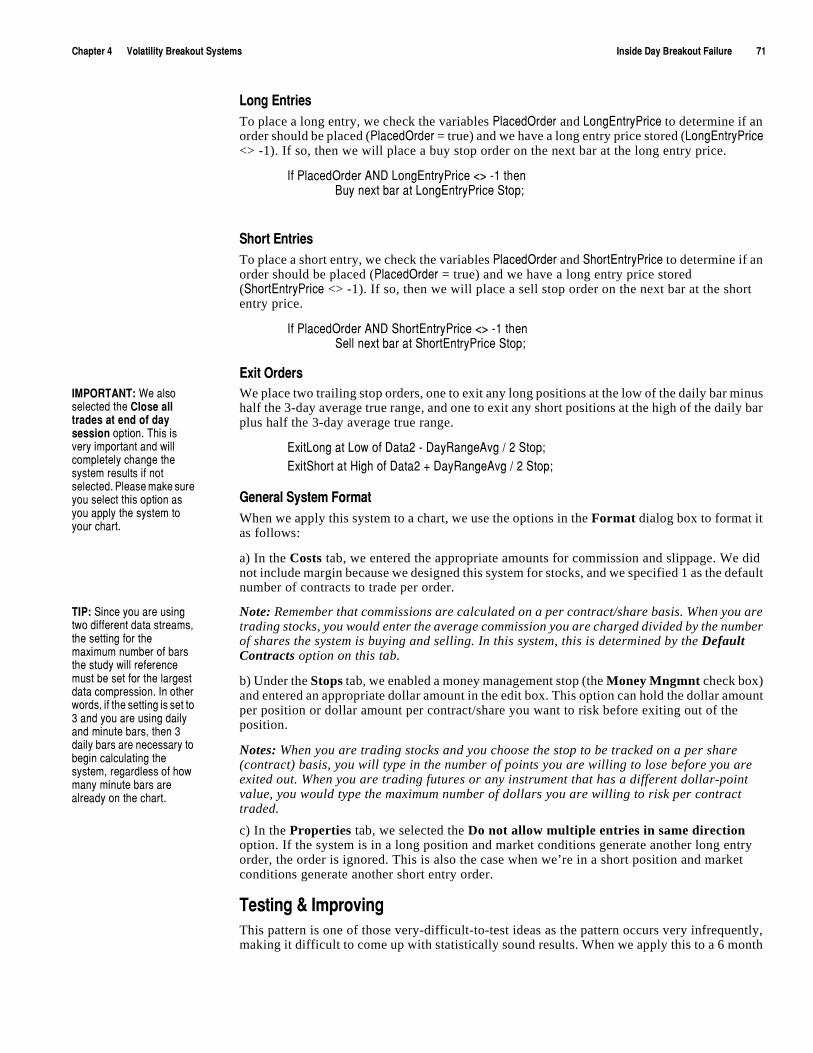
)NGVZKXúæúúúúúú<URGZOROZ_ú(XKGQU[Zú9_YZKSY /TYOJKú*G_ú(XKGQU[Zú,GOR[XKúúúúúúúúúúãé
2UTMú+TZXOKYTo place a long entry, we check the variables 6RGIKJ5XJKX and 2UTM+TZX_6XOIK to determine if an order should be placed (6RGIKJ5XJKX = true) and we have a long entry price stored (2UTM+TZX_6XOIK <> -1). If so, then we will place a buy stop order on the next bar at the long entry price.
/Lú6RGIKJ5XJKXú'4*ú2UTM+TZX_6XOIKú"$úíéúZNKTú([_úTK^ZúHGXúGZú2UTM+TZX_6XOIKú9ZUV!
9NUXZú+TZXOKYTo place a short entry, we check the variables 6RGIKJ5XJKX and 9NUXZ+TZX_6XOIK to determine if an order should be placed (6RGIKJ5XJKX = true) and we have a long entry price stored (9NUXZ+TZX_6XOIK <> -1). If so, then we will place a sell stop order on the next bar at the short entry price.
/Lú6RGIKJ5XJKXú'4*ú9NUXZ+TZX_6XOIKú"$úíéúZNKT9KRRúTK^ZúHGXúGZú9NUXZ+TZX_6XOIKú9ZUV!
+^OZú5XJKXY/3658:'4: ú=KúGRYUúYKRKIZKJúZNKú)RUYKúGRRúZXGJKYúGZúKTJúULúJG_úYKYYOUTúUVZOUTìú:NOYúOYú\KX_úOSVUXZGTZúGTJú]ORRúIUSVRKZKR_úINGTMKúZNKúY_YZKSúXKY[RZYúOLúTUZúYKRKIZKJìú6RKGYKúSGQKúY[XKú_U[úYKRKIZúZNOYúUVZOUTúGYú_U[úGVVR_úZNKúY_YZKSúZUú_U[XúINGXZìúú
We place two trailing stop orders, one to exit any long positions at the low of the daily bar minus half the 3-day average true range, and one to exit any short positions at the high of the daily bar plus half the 3-day average true range.
+^OZ2UTMúGZú2U]úULú*GZGèúíú*G_8GTMK'\Múëúèú9ZUV!+^OZ9NUXZúGZú.OMNúULú*GZGèúïú*G_8GTMK'\Múëúèú9ZUV!
-KTKXGRú9_YZKSú,UXSGZWhen we apply this system to a chart, we use the options in the Format dialog box to format it as follows:
a) In the Costs tab, we entered the appropriate amounts for commission and slippage. We did not include margin because we designed this system for stocks, and we specified 1 as the default number of contracts to trade per order.
:/6 ú9OTIKú_U[úGXKú[YOTMúZ]UúJOLLKXKTZúJGZGúYZXKGSYîúZNKúYKZZOTMúLUXúZNKúSG^OS[SúT[SHKXúULúHGXYúZNKúYZ[J_ú]ORRúXKLKXKTIKúS[YZúHKúYKZúLUXúZNKúRGXMKYZúJGZGúIUSVXKYYOUTìú/TúUZNKXú]UXJYîúOLúZNKúYKZZOTMúOYúYKZúZUúçúGTJú_U[úGXKú[YOTMúJGOR_úGTJúSOT[ZKúHGXYîúZNKTúçúJGOR_úHGXYúGXKúTKIKYYGX_úZUúHKMOTúIGRI[RGZOTMúZNKúY_YZKSîúXKMGXJRKYYúULúNU]úSGT_úSOT[ZKúHGXYúGXKúGRXKGJ_úUTúZNKúINGXZìú
Note: Remember that commissions are calculated on a per contract/share basis. When you are trading stocks, you would enter the average commission you are charged divided by the number of shares the system is buying and selling. In this system, this is determined by the Default Contracts option on this tab.
b) Under the Stops tab, we enabled a money management stop (the Money Mngmnt check box) and entered an appropriate dollar amount in the edit box. This option can hold the dollar amount per position or dollar amount per contract/share you want to risk before exiting out of the position.
Notes: When you are trading stocks and you choose the stop to be tracked on a per share (contract) basis, you will type in the number of points you are willing to lose before you are exited out. When you are trading futures or any instrument that has a different dollar-point value, you would type the maximum number of dollars you are willing to risk per contract traded.
c) In the Properties tab, we selected the Do not allow multiple entries in same direction option. If the system is in a long position and market conditions generate another long entry order, the order is ignored. This is also the case when we’re in a short position and market conditions generate another short entry order.
:KYZOTMúôú/SVXU\OTMThis pattern is one of those very-difficult-to-test ideas as the pattern occurs very infrequently, making it difficult to come up with statistically sound results. When we apply this to a 6 month
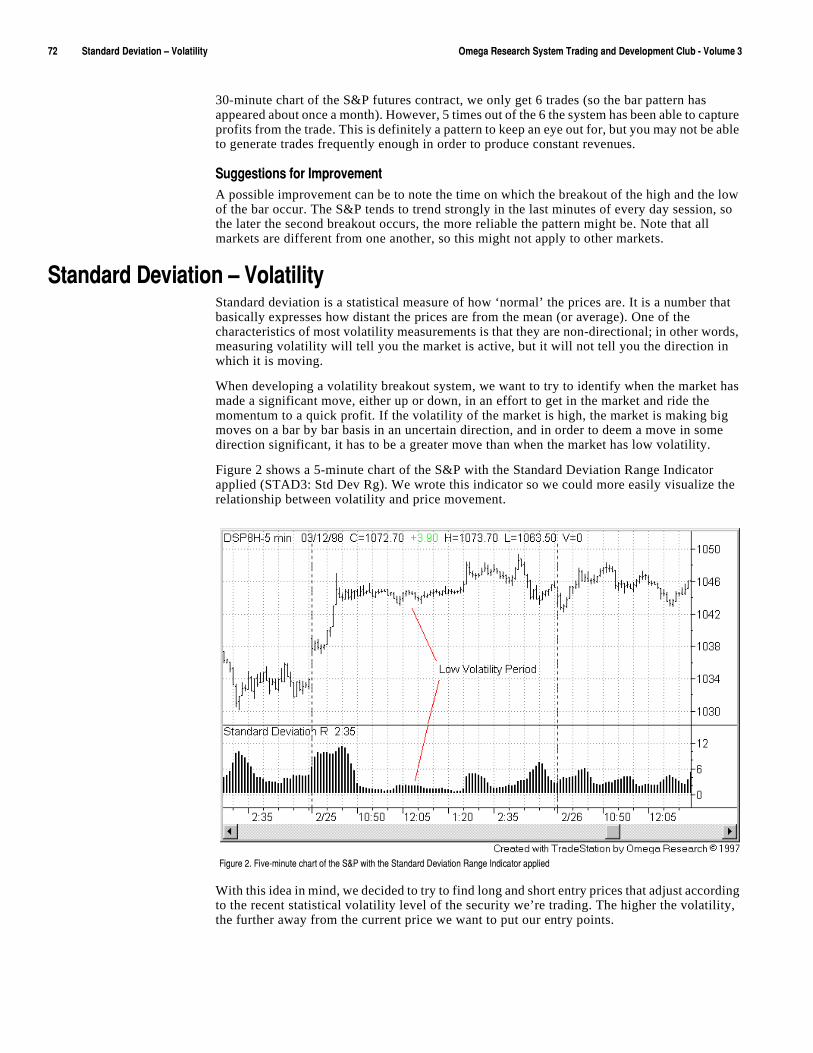
ãèúúúúúúúúúú9ZGTJGXJú*K\OGZOUTú¤ú<URGZOROZ_úúúúúúúúúú 5SKMGú8KYKGXINú9_YZKSú:XGJOTMúGTJú*K\KRUVSKTZú)R[Húíú<UR[SKúç
30-minute chart of the S&P futures contract, we only get 6 trades (so the bar pattern has appeared about once a month). However, 5 times out of the 6 the system has been able to capture profits from the trade. This is definitely a pattern to keep an eye out for, but you may not be able to generate trades frequently enough in order to produce constant revenues.
9[MMKYZOUTYúLUXú/SVXU\KSKTZA possible improvement can be to note the time on which the breakout of the high and the low of the bar occur. The S&P tends to trend strongly in the last minutes of every day session, so the later the second breakout occurs, the more reliable the pattern might be. Note that all markets are different from one another, so this might not apply to other markets.
9ZGTJGXJú*K\OGZOUTú¤ú<URGZOROZ_úStandard deviation is a statistical measure of how ‘normal’ the prices are. It is a number that basically expresses how distant the prices are from the mean (or average). One of the characteristics of most volatility measurements is that they are non-directional; in other words, measuring volatility will tell you the market is active, but it will not tell you the direction in which it is moving.
When developing a volatility breakout system, we want to try to identify when the market has made a significant move, either up or down, in an effort to get in the market and ride the momentum to a quick profit. If the volatility of the market is high, the market is making big moves on a bar by bar basis in an uncertain direction, and in order to deem a move in some direction significant, it has to be a greater move than when the market has low volatility.
Figure 2 shows a 5-minute chart of the S&P with the Standard Deviation Range Indicator applied (STAD3: Std Dev Rg). We wrote this indicator so we could more easily visualize the relationship between volatility and price movement.
With this idea in mind, we decided to try to find long and short entry prices that adjust according to the recent statistical volatility level of the security we’re trading. The higher the volatility, the further away from the current price we want to put our entry points.
,OM[XKúèìú,O\KíSOT[ZKúINGXZúULúZNKú9ô6ú]OZNúZNKú9ZGTJGXJú*K\OGZOUTú8GTMKú/TJOIGZUXúGVVROKJ
)NGVZKXúæúúúúúú<URGZOROZ_ú(XKGQU[Zú9_YZKSY 9ZGTJGXJú*K\OGZOUTú¤ú<URGZOROZ_úúúúúúúúúúãç
In order to accomplish this, we will define an initial upper and lower band by calculating 2 standard deviations above and below the 9-bar average price of the close. We will then divide this band range by the 4-bar average of the close and add to 1 for the upper band and subtract from 1 for the lower band. The general idea is as follows:
éúïúòú(GTJúXGTMKúëúæíHGXú'\KXGMKúULúZNKú)RUYKúñéú¤úòú(GTJúXGTMKúëúæíHGXú'\KXGMKúULúZNKú)RUYKúñ
This gives us, expressed as a percentage (for example, 1.02 and .98 with the bandwidth at 2% of the prices), the relationship between volatility and the price. Finally, we multiply each of these values by the close of the current bar to obtain our long and short entry points.
éúïúòú(GTJúXGTMKúëúæíHGXú'\KXGMKúULúZNKú)RUYKúñúðú)RUYKéú¤úòú(GTJúXGTMKúëúæíHGXú'\KXGMKúULúZNKú)RUYKúñúðú)RUYK
As you look at the formula, you will notice that the higher the distance between the standard deviation lines (in other words the higher the volatility, the further away the bands will be).
Once we establish our positions, we will exit at the first profitable open as well as place a money management stop, the amount of which will be based on what we’re trading.
*KLOTOTMú_U[Xú:XGJOTMú8[RKYIn this system, we defined both long and short entries as well as exit orders. The long and short entries reverse your position, whereas the exits close out your existing position and exit you from the market. We also performed some setup work, which involved calculating the standard deviation of the price and the entry points. The setup, entry and exits are described next.
9KZ[Vúa) Calculate 2 standard deviations above and below the average price; these are the initial upper and lower bands. Divide the range of the bands by the 4-bar average of the close, then add this number to 1 to obtain the upper band and subtract from 1 to obtain the lower band.
2UTMú+TZXOKYúa) Multiply the two values obtained in the setup by the close of the current bar to obtain the long and short entry points. Place a buy stop order at the long entry price.
9NUXZú+TZXOKYúa) Multiply the two values obtained in the setup by the close of the current bar to obtain the long and short entry points. Place a sell stop order at the short entry price.
+^OZYúa) Exit at the first profitable open, which is calculated by comparing the open with the entry price (accounting for a desired profit expressed in points and commission).
*KYOMTOTMúôú,UXSGZZOTMThis section presents the EasyLanguage instructions and formatting for the system, with the EasyLanguage instructions broken down and explained line by line.
+GY_2GTM[GMKú/TYZX[IZOUTY ú9ZGTJGXJú*K\OGZOUTúíú<URGZOROZ_úò9:'*ç 9ZJú*K\úíú<ñ
/TV[Z ú6XOIKò)RUYKñîú9ZJ*\òèñîú2KTMZNòáñîú6XULOZ6Zòêñ!<GXY ú:UV(GTJòêñîú(UZ(GTJòêñîú(GTJ8GTMKòêñîú9KRR6XOIKòêñîú([_6XOIKòêñ!
ãæúúúúúúúúúú9ZGTJGXJú*K\OGZOUTú¤ú<URGZOROZ_úúúúúúúúúú 5SKMGú8KYKGXINú9_YZKSú:XGJOTMúGTJú*K\KRUVSKTZú)R[Húíú<UR[SKúç
a9KZ[VúIGRI[RGZOUTYúíúIGRI[RGZOTMúHGTJYúôúH[_úGTJúYKRRúVXOIKYúc:UV(GTJú#ú'\KXGMKò)RUYKîú2KTMZNñúïú9ZJ*K\ò6XOIKîú2KTMZNñúðú9ZJ*\!(UZ(GTJú#ú'\KXGMKò)RUYKîú2KTMZNñúíú9ZJ*K\ò6XOIKîú2KTMZNñúðú9ZJ*\!(GTJ8GTMKú#ú:UV(GTJúíú(UZ(GTJ!([_6XOIKú#ú)RUYKúúðúòúéúïú(GTJ8GTMKúëú'\KXGMKò)RUYKîúæñúñ!9KRRVXOIKú#ú)RUYKúúðúòúéúíú(GTJ8GTMKúëú'\KXGMKò)RUYKîúæñúñú!
aú+TZX_úUXJKXYúc([_úúTK^ZúHGXúGZú([_6XOIKú9ZUV!9KRRúúTK^ZúHGXúGZú9KRR6XOIKú9ZUV!
aú+^OZúGZúLOXYZúVXULOZGHRKúUVKTúc/Lú3GXQKZ6UYOZOUTú#úéúGTJú5VKTúTK^ZúHGXú$ú+TZX_6XOIKúïú6XULOZ6Zúïú)USSOYYOUTúðú
)[XXKTZ)UTZXGIZYúëú(OM6UOTZ<GR[KúZNKTú+^OZ2UTMúòø2UTMú6XULOZøñúTK^ZúHGXúGZú5VKT!/Lú3GXQKZ6UYOZOUTú#úíéúGTJú5VKTúTK^ZúHGXú"ú+TZX_6XOIKúíú6XULOZ6Zúíú)USSOYYOUTúðú
)[XXKTZ)UTZXGIZYúëú(OM6UOTZ<GR[KúZNKTú+^OZ9NUXZúòø9NUXZú6XULOZøñúTK^ZúHGXúGZú5VKT!
/TV[ZYFollowing is the list of the inputs we used in this system:
In addition to these inputs, we define the following variables:
<GXY ú:UV(GTJòêñîú(UZ(GTJòêñîú(GTJ8GTMKòêñîú9KRR6XOIKòêñîú([_6XOIKòêñ!
We begin by calculating the top and bottom bands. For the top band, we calculate the 9-bar average of the close and add it to twice the standard deviation of the last 10 closing prices. For the bottom band, we calculate the same 9-bar average but subtract from it twice the standard deviation. Once we have the bands, we calculate their range by subtracting the bottom band from the top band.
:UV(GTJú#ú'\KXGMKòú)RUYKîú2KTMZNúñúïú9ZJ*K\òú6XOIKîú2KTMZNúñúðú9ZJ*\!(UZ(GTJú#ú'\KXGMKòú)RUYKîú2KTMZNúñúíú9ZJ*K\òú6XOIKîú2KTMZNúñúðú9ZJ*\!(GTJ8GTMKú#ú:UV(GTJúíú(UZ(GTJ!
Then, we obtain the buy and sell prices by dividing the band range by a 4-bar average of the close and then adding or subtracting this from 1, respectively. Then we multiply the resulting number by the close.
([_6XOIKú#ú)RUYKúúðúòúéúïú(GTJ8GTMKúëú'\KXGMKò)RUYKîúæñúñ!9KRRVXOIKú#ú)RUYKúúðúòúéúíú(GTJ8GTMKúëú'\KXGMKò)RUYKîúæñúñú!
Inputs Default Description
Price ClosePrice to use in calculating the standard deviation and on which to base the entry points
StdDv 2 Number of standard deviations used to calculate the upper and lower bands
Length 9 Period, expressed in bars, used to calculate the standard deviation as well as the average of the close used to establish the initial bands
ProfitPt 0 Number of points desired in profit before exiting position
)NGVZKXúæúúúúúú<URGZOROZ_ú(XKGQU[Zú9_YZKSY 9ZGTJGXJú*K\OGZOUTú¤ú<URGZOROZ_úúúúúúúúúúãå
2UTMú+TZXOKYOnce we calculate the buy price, we place a buy stop order at this price.
([_úTK^ZúHGXúGZú([_6XOIKú9ZUV!
9NUXZú+TZXOKYOnce we calculate the sell price, we place a sell stop order at this price.
9KRRúTK^ZúHGXúGZú9KRR6XOIKú9ZUV!
+^OZú5XJKXYThis system will exit from any position at the first profitable open. To determine when the first profitable open occurs, we compare the open of the next bar to the entry price, making sure we take into account commissions.
Commissions are specified on a per contract/share basis; therefore, we have to multiply the value returned by the )USSOYYOUT function by the number of contracts held (returned by the )[XXKTZ)UTZXGIZY function), and then divide this value by the big point value of the instrument. The big point value is the dollar value of a full point move; we can easily obtain it using the (OM6UOTZ<GR[K function:
/Lú3GXQKZ6UYOZOUTú#úéúGTJú5VKTúTK^ZúHGXú$ú+TZX_6XOIKúïú6XULOZ6Zúïú)USSOYYOUTúðú)[XXKTZ)UTZXGIZYúëú(OM6UOTZ<GR[KúZNKTú+^OZ2UTMúòø2UTMú6XULOZøñúTK^ZúHGXúGZú5VKT!
/Lú3GXQKZ6UYOZOUTú#úíéúGTJú5VKTúTK^ZúHGXú"ú+TZX_6XOIKúíú6XULOZ6Zúíú)USSOYYOUTúðú)[XXKTZ)UTZXGIZYúëú(OM6UOTZ<GR[KúZNKTú+^OZ9NUXZúòø9NUXZú6XULOZøñúTK^ZúHGXúGZú5VKT!
We’ll also use a money management stop, as discussed in the next section.
-KTKXGRú9_YZKSú,UXSGZWhen we apply this system to a chart, we use the options in the Format dialog box to format it as follows:
a) In the Costs tab, we entered the appropriate amounts for commission and slippage. We did not include margin because we designed this system for stocks, and we specified 100 as the default number of contracts to trade per order.
Note: Remember that commissions are calculated on a per contract/share basis. When you are trading stocks, you would enter the average commission you are charged divided by the number of shares the system is buying and selling. In this system, this is determined by the Default Contracts option on this tab.
b) Under the Stops tab, we enabled a money management stop (the Money Mngmnt check box) and entered an appropriate dollar amount in the edit box. This option can hold the dollar amount per position or dollar amount per contract/share you want to risk before exiting out of the position.
Note: When you are trading stocks and you choose the stop to be tracked on a per share (contract) basis, you will type in the number of points you are willing to lose before you are exited out. When you are trading futures or any instrument that has a different dollar-point value, you would type the maximum number of dollars you are willing to risk per contract traded.
c) In the Properties tab, we selected the Do not allow multiple entries in same direction option. If the system is in a long position and market conditions generate another long entry order, the order is ignored. This is also the case when we’re in a short position and market conditions generate another short entry order.
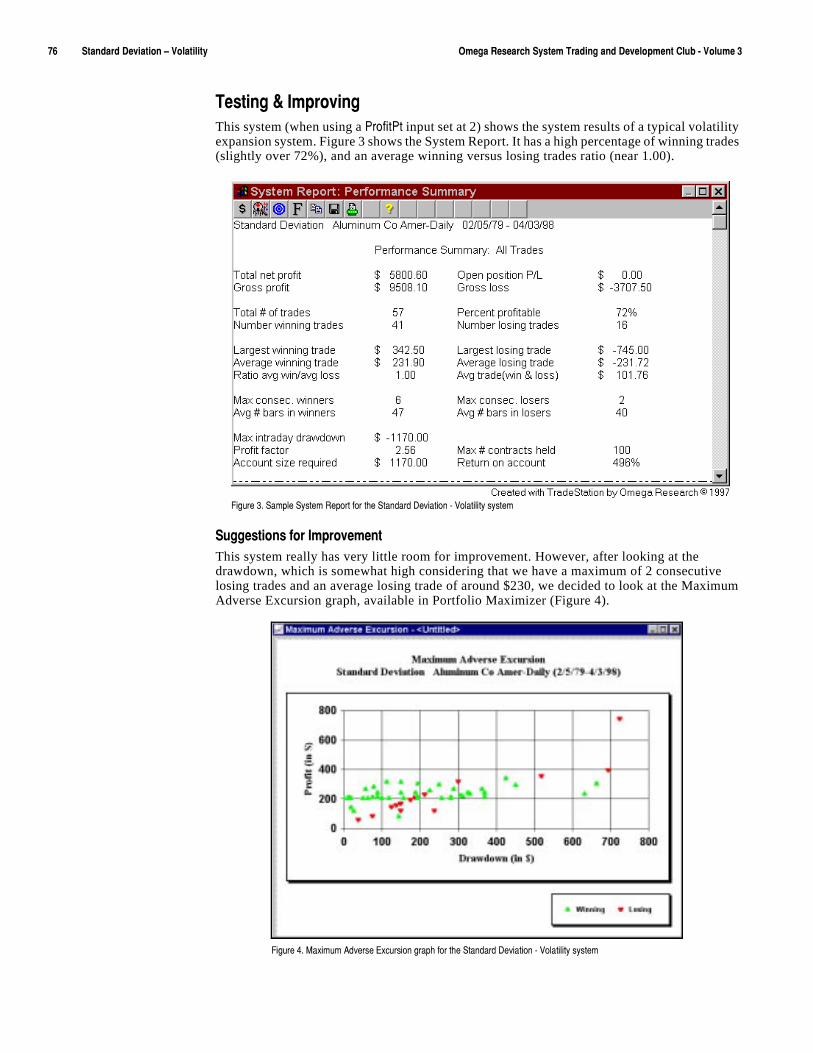
ãäúúúúúúúúúú9ZGTJGXJú*K\OGZOUTú¤ú<URGZOROZ_úúúúúúúúúú 5SKMGú8KYKGXINú9_YZKSú:XGJOTMúGTJú*K\KRUVSKTZú)R[Húíú<UR[SKúç
:KYZOTMúôú/SVXU\OTMThis system (when using a 6XULOZ6Z input set at 2) shows the system results of a typical volatility expansion system. Figure 3 shows the System Report. It has a high percentage of winning trades (slightly over 72%), and an average winning versus losing trades ratio (near 1.00).
9[MMKYZOUTYúLUXú/SVXU\KSKTZThis system really has very little room for improvement. However, after looking at the drawdown, which is somewhat high considering that we have a maximum of 2 consecutive losing trades and an average losing trade of around $230, we decided to look at the Maximum Adverse Excursion graph, available in Portfolio Maximizer (Figure 4).
,OM[XKúçìú9GSVRKú9_YZKSú8KVUXZúLUXúZNKú9ZGTJGXJú*K\OGZOUTúíú<URGZOROZ_úY_YZKS
,OM[XKúæìú3G^OS[Sú'J\KXYKú+^I[XYOUTúMXGVNúLUXúZNKú9ZGTJGXJú*K\OGZOUTúíú<URGZOROZ_úY_YZKS
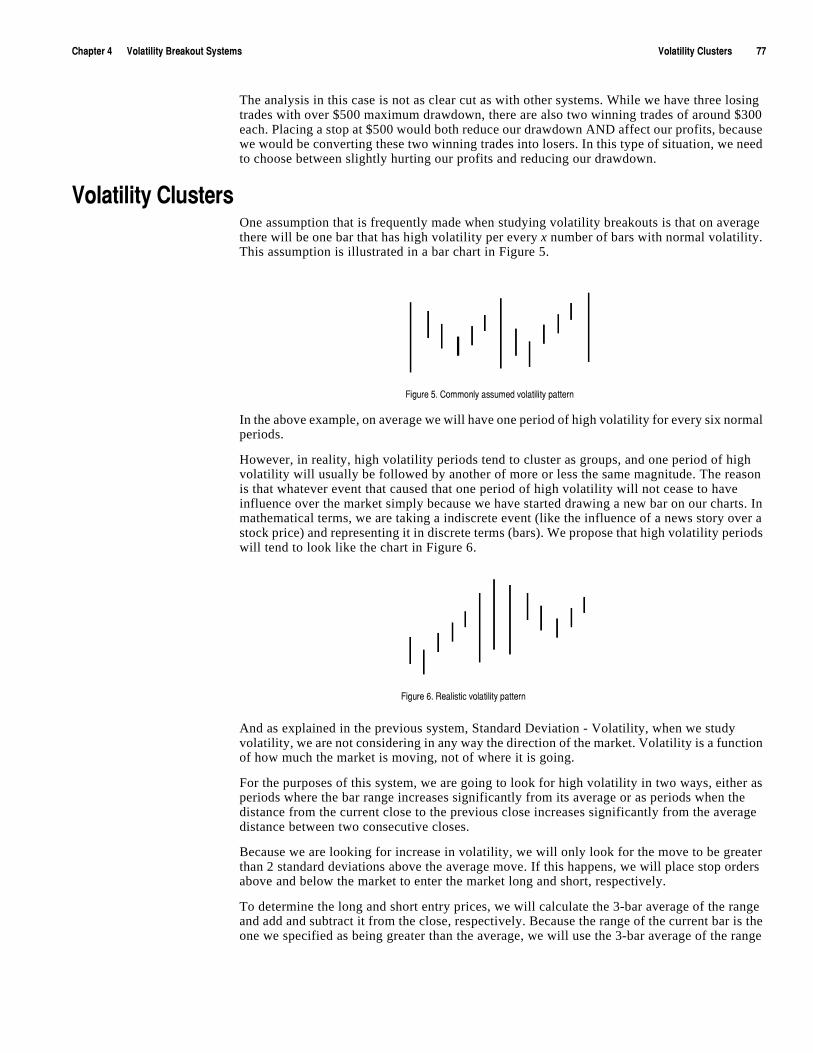
)NGVZKXúæúúúúúú<URGZOROZ_ú(XKGQU[Zú9_YZKSY <URGZOROZ_ú)R[YZKXYúúúúúúúúúúãã
The analysis in this case is not as clear cut as with other systems. While we have three losing trades with over $500 maximum drawdown, there are also two winning trades of around $300 each. Placing a stop at $500 would both reduce our drawdown AND affect our profits, because we would be converting these two winning trades into losers. In this type of situation, we need to choose between slightly hurting our profits and reducing our drawdown.
<URGZOROZ_ú)R[YZKXYOne assumption that is frequently made when studying volatility breakouts is that on average there will be one bar that has high volatility per every x number of bars with normal volatility. This assumption is illustrated in a bar chart in Figure 5.
In the above example, on average we will have one period of high volatility for every six normal periods.
However, in reality, high volatility periods tend to cluster as groups, and one period of high volatility will usually be followed by another of more or less the same magnitude. The reason is that whatever event that caused that one period of high volatility will not cease to have influence over the market simply because we have started drawing a new bar on our charts. In mathematical terms, we are taking a indiscrete event (like the influence of a news story over a stock price) and representing it in discrete terms (bars). We propose that high volatility periods will tend to look like the chart in Figure 6.
And as explained in the previous system, Standard Deviation - Volatility, when we study volatility, we are not considering in any way the direction of the market. Volatility is a function of how much the market is moving, not of where it is going.
For the purposes of this system, we are going to look for high volatility in two ways, either as periods where the bar range increases significantly from its average or as periods when the distance from the current close to the previous close increases significantly from the average distance between two consecutive closes.
Because we are looking for increase in volatility, we will only look for the move to be greater than 2 standard deviations above the average move. If this happens, we will place stop orders above and below the market to enter the market long and short, respectively.
To determine the long and short entry prices, we will calculate the 3-bar average of the range and add and subtract it from the close, respectively. Because the range of the current bar is the one we specified as being greater than the average, we will use the 3-bar average of the range
,OM[XKúåìú)USSUTR_úGYY[SKJú\URGZOROZ_úVGZZKXT
,OM[XKúäìú8KGROYZOIú\URGZOROZ_úVGZZKXT
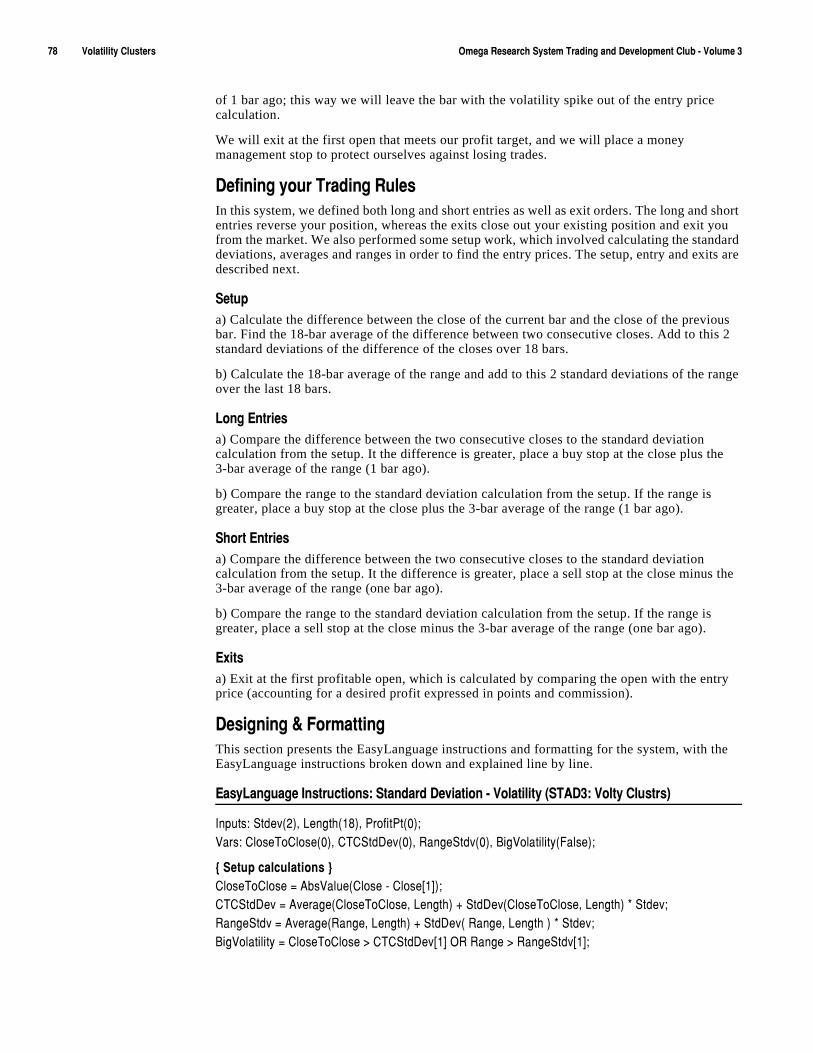
ãâúúúúúúúúúú<URGZOROZ_ú)R[YZKXYúúúúúúúúúú 5SKMGú8KYKGXINú9_YZKSú:XGJOTMúGTJú*K\KRUVSKTZú)R[Húíú<UR[SKúç
of 1 bar ago; this way we will leave the bar with the volatility spike out of the entry price calculation.
We will exit at the first open that meets our profit target, and we will place a money management stop to protect ourselves against losing trades.
*KLOTOTMú_U[Xú:XGJOTMú8[RKYIn this system, we defined both long and short entries as well as exit orders. The long and short entries reverse your position, whereas the exits close out your existing position and exit you from the market. We also performed some setup work, which involved calculating the standard deviations, averages and ranges in order to find the entry prices. The setup, entry and exits are described next.
9KZ[Vúa) Calculate the difference between the close of the current bar and the close of the previous bar. Find the 18-bar average of the difference between two consecutive closes. Add to this 2 standard deviations of the difference of the closes over 18 bars.
b) Calculate the 18-bar average of the range and add to this 2 standard deviations of the range over the last 18 bars.
2UTMú+TZXOKYúa) Compare the difference between the two consecutive closes to the standard deviation calculation from the setup. It the difference is greater, place a buy stop at the close plus the 3-bar average of the range (1 bar ago).
b) Compare the range to the standard deviation calculation from the setup. If the range is greater, place a buy stop at the close plus the 3-bar average of the range (1 bar ago).
9NUXZú+TZXOKYúa) Compare the difference between the two consecutive closes to the standard deviation calculation from the setup. It the difference is greater, place a sell stop at the close minus the 3-bar average of the range (one bar ago).
b) Compare the range to the standard deviation calculation from the setup. If the range is greater, place a sell stop at the close minus the 3-bar average of the range (one bar ago).
+^OZYúa) Exit at the first profitable open, which is calculated by comparing the open with the entry price (accounting for a desired profit expressed in points and commission).
*KYOMTOTMúôú,UXSGZZOTMThis section presents the EasyLanguage instructions and formatting for the system, with the EasyLanguage instructions broken down and explained line by line.
+GY_2GTM[GMKú/TYZX[IZOUTY ú9ZGTJGXJú*K\OGZOUTúíú<URGZOROZ_úò9:'*ç ú<URZ_ú)R[YZXYñ
/TV[ZY ú9ZJK\òèñîú2KTMZNòéâñîú6XULOZ6Zòêñ!<GXY ú)RUYK:U)RUYKòêñîú):)9ZJ*K\òêñîú8GTMK9ZJ\òêñîú(OM<URGZOROZ_ò,GRYKñ!
aú9KZ[VúIGRI[RGZOUTYúc)RUYK:U)RUYKú#ú'HY<GR[Kò)RUYKúíú)RUYKAéCñ!):)9ZJ*K\ú#ú'\KXGMKò)RUYK:U)RUYKîú2KTMZNñúïú9ZJ*K\ò)RUYK:U)RUYKîú2KTMZNñúðú9ZJK\!8GTMK9ZJ\ú#ú'\KXGMKò8GTMKîú2KTMZNñúïú9ZJ*K\òú8GTMKîú2KTMZNúñúðú9ZJK\!(OM<URGZOROZ_ú#ú)RUYK:U)RUYKú$ú):)9ZJ*K\AéCú58ú8GTMKú$ú8GTMK9ZJ\AéC!
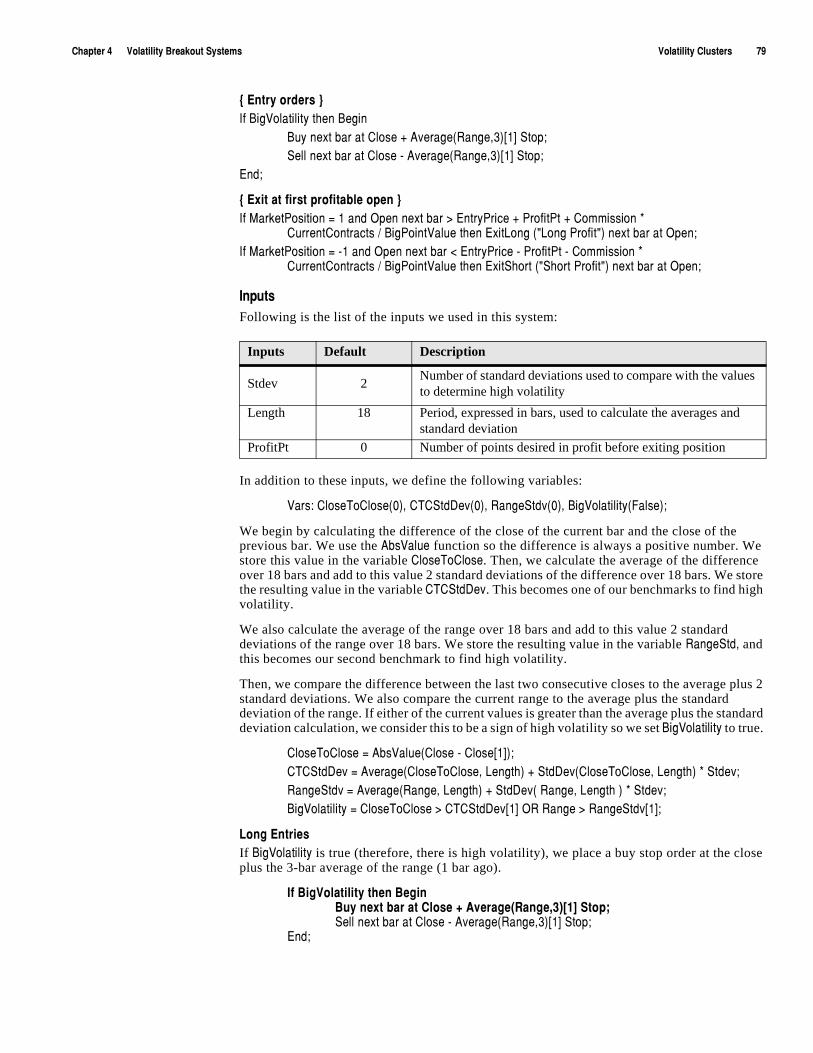
)NGVZKXúæúúúúúú<URGZOROZ_ú(XKGQU[Zú9_YZKSY <URGZOROZ_ú)R[YZKXYúúúúúúúúúúãá
aú+TZX_úUXJKXYúc/Lú(OM<URGZOROZ_úZNKTú(KMOT
([_úTK^ZúHGXúGZú)RUYKúïú'\KXGMKò8GTMKîçñAéCú9ZUV!9KRRúTK^ZúHGXúGZú)RUYKúíú'\KXGMKò8GTMKîçñAéCú9ZUV!
+TJ!ú
aú+^OZúGZúLOXYZúVXULOZGHRKúUVKTúc/Lú3GXQKZ6UYOZOUTú#úéúGTJú5VKTúTK^ZúHGXú$ú+TZX_6XOIKúïú6XULOZ6Zúïú)USSOYYOUTúðú
)[XXKTZ)UTZXGIZYúëú(OM6UOTZ<GR[KúZNKTú+^OZ2UTMúòø2UTMú6XULOZøñúTK^ZúHGXúGZú5VKT!/Lú3GXQKZ6UYOZOUTú#úíéúGTJú5VKTúTK^ZúHGXú"ú+TZX_6XOIKúíú6XULOZ6Zúíú)USSOYYOUTúðú
)[XXKTZ)UTZXGIZYúëú(OM6UOTZ<GR[KúZNKTú+^OZ9NUXZúòø9NUXZú6XULOZøñúTK^ZúHGXúGZú5VKT!
/TV[ZYFollowing is the list of the inputs we used in this system:
In addition to these inputs, we define the following variables:
<GXY ú)RUYK:U)RUYKòêñîú):)9ZJ*K\òêñîú8GTMK9ZJ\òêñîú(OM<URGZOROZ_ò,GRYKñ!
We begin by calculating the difference of the close of the current bar and the close of the previous bar. We use the 'HY<GR[K function so the difference is always a positive number. We store this value in the variable )RUYK:U)RUYK. Then, we calculate the average of the difference over 18 bars and add to this value 2 standard deviations of the difference over 18 bars. We store the resulting value in the variable ):)9ZJ*K\. This becomes one of our benchmarks to find high volatility.
We also calculate the average of the range over 18 bars and add to this value 2 standard deviations of the range over 18 bars. We store the resulting value in the variable 8GTMK9ZJî and this becomes our second benchmark to find high volatility.
Then, we compare the difference between the last two consecutive closes to the average plus 2 standard deviations. We also compare the current range to the average plus the standard deviation of the range. If either of the current values is greater than the average plus the standard deviation calculation, we consider this to be a sign of high volatility so we set (OM<URGZOROZ_ to true.
)RUYK:U)RUYKú#ú'HY<GR[Kò)RUYKúíú)RUYKAéCñ!):)9ZJ*K\ú#ú'\KXGMKò)RUYK:U)RUYKîú2KTMZNñúïú9ZJ*K\ò)RUYK:U)RUYKîú2KTMZNñúðú9ZJK\!8GTMK9ZJ\ú#ú'\KXGMKò8GTMKîú2KTMZNñúïú9ZJ*K\òú8GTMKîú2KTMZNúñúðú9ZJK\!(OM<URGZOROZ_ú#ú)RUYK:U)RUYKú$ú):)9ZJ*K\AéCú58ú8GTMKú$ú8GTMK9ZJ\AéC!
2UTMú+TZXOKYIf (OM<URGZOROZ_ is true (therefore, there is high volatility), we place a buy stop order at the close plus the 3-bar average of the range (1 bar ago).
/Lú(OM<URGZOROZ_úZNKTú(KMOT([_úTK^ZúHGXúGZú)RUYKúïú'\KXGMKò8GTMKîçñAéCú9ZUV!9KRRúTK^ZúHGXúGZú)RUYKúíú'\KXGMKò8GTMKîçñAéCú9ZUV!
+TJ!ú
Inputs Default Description
Stdev 2Number of standard deviations used to compare with the values to determine high volatility
Length 18 Period, expressed in bars, used to calculate the averages and standard deviation
ProfitPt 0 Number of points desired in profit before exiting position
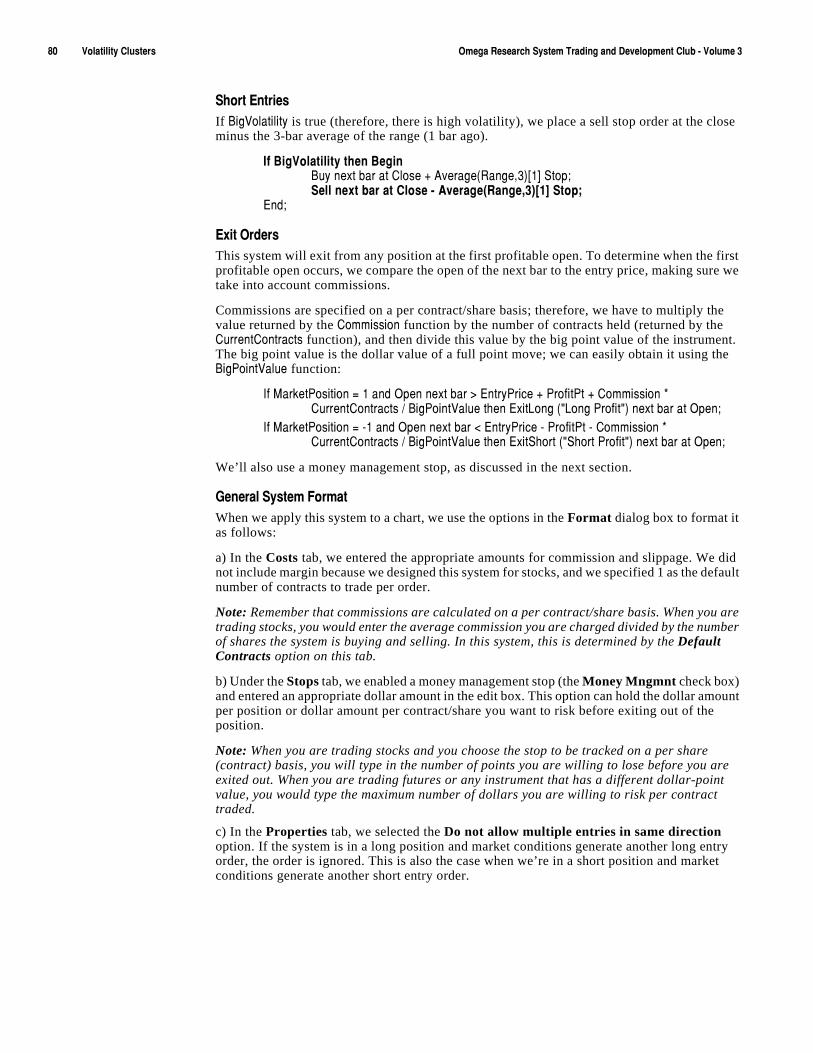
âêúúúúúúúúúú<URGZOROZ_ú)R[YZKXYúúúúúúúúúú 5SKMGú8KYKGXINú9_YZKSú:XGJOTMúGTJú*K\KRUVSKTZú)R[Húíú<UR[SKúç
9NUXZú+TZXOKYIf (OM<URGZOROZ_ is true (therefore, there is high volatility), we place a sell stop order at the close minus the 3-bar average of the range (1 bar ago).
/Lú(OM<URGZOROZ_úZNKTú(KMOT([_úTK^ZúHGXúGZú)RUYKúïú'\KXGMKò8GTMKîçñAéCú9ZUV!9KRRúTK^ZúHGXúGZú)RUYKúíú'\KXGMKò8GTMKîçñAéCú9ZUV!
+TJ!ú
+^OZú5XJKXYThis system will exit from any position at the first profitable open. To determine when the first profitable open occurs, we compare the open of the next bar to the entry price, making sure we take into account commissions.
Commissions are specified on a per contract/share basis; therefore, we have to multiply the value returned by the )USSOYYOUT function by the number of contracts held (returned by the )[XXKTZ)UTZXGIZY function), and then divide this value by the big point value of the instrument. The big point value is the dollar value of a full point move; we can easily obtain it using the (OM6UOTZ<GR[K function:
/Lú3GXQKZ6UYOZOUTú#úéúGTJú5VKTúTK^ZúHGXú$ú+TZX_6XOIKúïú6XULOZ6Zúïú)USSOYYOUTúðú)[XXKTZ)UTZXGIZYúëú(OM6UOTZ<GR[KúZNKTú+^OZ2UTMúòø2UTMú6XULOZøñúTK^ZúHGXúGZú5VKT!
/Lú3GXQKZ6UYOZOUTú#úíéúGTJú5VKTúTK^ZúHGXú"ú+TZX_6XOIKúíú6XULOZ6Zúíú)USSOYYOUTúðú)[XXKTZ)UTZXGIZYúëú(OM6UOTZ<GR[KúZNKTú+^OZ9NUXZúòø9NUXZú6XULOZøñúTK^ZúHGXúGZú5VKT!
We’ll also use a money management stop, as discussed in the next section.
-KTKXGRú9_YZKSú,UXSGZWhen we apply this system to a chart, we use the options in the Format dialog box to format it as follows:
a) In the Costs tab, we entered the appropriate amounts for commission and slippage. We did not include margin because we designed this system for stocks, and we specified 1 as the default number of contracts to trade per order.
Note: Remember that commissions are calculated on a per contract/share basis. When you are trading stocks, you would enter the average commission you are charged divided by the number of shares the system is buying and selling. In this system, this is determined by the Default Contracts option on this tab.
b) Under the Stops tab, we enabled a money management stop (the Money Mngmnt check box) and entered an appropriate dollar amount in the edit box. This option can hold the dollar amount per position or dollar amount per contract/share you want to risk before exiting out of the position.
Note: When you are trading stocks and you choose the stop to be tracked on a per share (contract) basis, you will type in the number of points you are willing to lose before you are exited out. When you are trading futures or any instrument that has a different dollar-point value, you would type the maximum number of dollars you are willing to risk per contract traded.
c) In the Properties tab, we selected the Do not allow multiple entries in same direction option. If the system is in a long position and market conditions generate another long entry order, the order is ignored. This is also the case when we’re in a short position and market conditions generate another short entry order.
)NGVZKXúæúúúúúú<URGZOROZ_ú(XKGQU[Zú9_YZKSY <URGZOROZ_ú)R[YZKXYúúúúúúúúúúâé
:KYZOTMúôú/SVXU\OTMThe System Report for this system (with a 6XULOZ6Z of 1.5 points) is typical of a volatility breakout system, as shown in Figure 7. It has a high percentage of winning trades at 60% and an average winning versus losing trades ratio slightly under 1(.84).
9[MMKYZOUTYúLUXú/SVXU\KSKTZThis system may trade too often and therefore be somewhat difficult to trade. In order to ‘slow it down’ we may want to use a filter that would further indicate a significant move, for example, an increase of volume over the average volume, or divergence between the on balance true range and the price. Such a change also will probably improve the percentage of winning trades.
,OM[XKúãìú9GSVRKú9_YZKSú8KVUXZúLUXúZNKú<URGZOROZ_ú)R[YZKXYúY_YZKS

âèúúúúúúúúúú<URGZOROZ_ú)R[YZKXYúúúúúúúúúú 5SKMGú8KYKGXINú9_YZKSú:XGJOTMúGTJú*K\KRUVSKTZú)R[Húíú<UR[SKúç

A P P E N D I X A
<UR[SKúOTú8K\OK]
Each volume of the System Trading and Development Club provides feedback on the previous volume. This appendix provides feedback on Volume 2.
Feedback can include general comments f rom cl ients as wel l as answers to specif ic quest ions c l ients may have asked regarding one of the systems. This appendix wi l l a lso address any discrepancies or ommissions, i f any, made from the systems in the previous volume.
Please feel f ree to send us your comments and/or quest ions on the current volume, and we wi l l inc lude them in the next volume. Send your comments v ia e-mai l to:
Thank you for your cont inued support!
âæúúúúúúúúúú-KTKXGRú)USSKTZYúúúúúúúúúú 5SKMGú8KYKGXINú9_YZKSú:XGJOTMúGTJú*K\KRUVSKTZú)R[Húíú<UR[SKúç
-KTKXGRú)USSKTZYSTAD Club Volume 2 contained a section in Chapter 4 called, “Determining Short-Term Market Outlook” (page 75). The section presented 3 systems and discussed the use of systems in helping you determine the short-term market outlook by providing you with statistical information. Two of the three systems discussed in the section were contributed by Joe Krutsinger. We apologize for not giving due credit in the previous manual.
Joe is a Commodity Trading Advisor, registered with the CFTC and President both of Joe Krutsinger, Inc., a consulting firm, and Krutsinger & Krutsinger, Inc. an Omega Solution Provider and publisher of PORTANA-The Portfolio Analyzer.
He has constructed dozens of futures trading systems over the years for his own clients and other traders. Joe has authored and co-authored multiple books, including The Trading Systems ToolKit, and is a popular speaker at futures industry trading conferences.
-KTKXGRú,KKJHGIQCarlos Lourenco wrote:
Hi:
Enjoying the 2 system volumes so far.
I’m having lots of problems with multi-data/2 time-frame type of systems and was wondering if you’d consider developing/showcasing something for users to study. I’m having trouble with a system that used 30-minute bars on Data1 and daily bars on Datas 2-6.
Hope you’ll take me up on this request.
Thanks,
Carlos Lourenco
Omega Research: Please take a look at Chapter 4, Volatility Breakout Systems. The Inside Day Breakout Failure system is an intra-day system based on 2 data streams. Data1 is a 30-minute chart, and Data2 is the same symbol plotted daily.
5VKTOTMú-GVú9_YZKSThe following e-mail was received from Peter Perry:
Folks,
First, the club is first rate! Keep up the quality work.
Second, while trying to use the volatility breakout sysytem “Opening Gap,” the one using Data1 and Data2, I had difficulty getting the system to work. Finally, after a few calls to the Omega Research Technical Support Department, we realized that the Max Bars Back setting in the Properties [tab] must be set to the SMALLEST number of bars of the two “Datas” (e.g., Data2 in this case) or else the system (and any indicators, ShowMe studies, etc.) vanish! I could not find a discussion of this phenomenon anywhere in the documentation. Perhaps others have had this problem too.
Third, would you consider hosting an Internet site where club members could discuss and exchange ideas and experiences relating to the systems you provide—someting similar to the www.realtraders.com site.
Cheers,
Peter Perry

'VVKTJO^ú'úúúúúú,KKJHGIQúUTú<UR[SKúè 5VKTOTMú-GVú9_YZKSúúúúúúúúúúâå
Omega Research: We are in the process of creating such a site, actually a newsgroup, where club members can do just that—exchange ideas and experiences relating to the systems we provide. While we will announce it as soon as it’s ready, keep an eye on our web site for up-to-the-minute details... Thanks for the feedback!
Regarding the Opening Gap System, we apologize for not making it clear that when you are dealing with multiple data streams, the maximum number of bars to reference refers to all data streams. For example, say you have a chart with 3 symbols, one is daily, one is 30-minute and the other is 5-minute. Also assume you are plotting an indicator based on the 3 symbols and its maximum number of bars to reference setting is set to 10. In this case, the analysis technique will not plot until there are 10 daily bars.

âäúúúúúúúúúú5VKTOTMú-GVú9_YZKSúúúúúúúúúú 5SKMGú8KYKGXINú9_YZKSú:XGJOTMúGTJú*K\KRUVSKTZú)R[Húíú<UR[SKúç
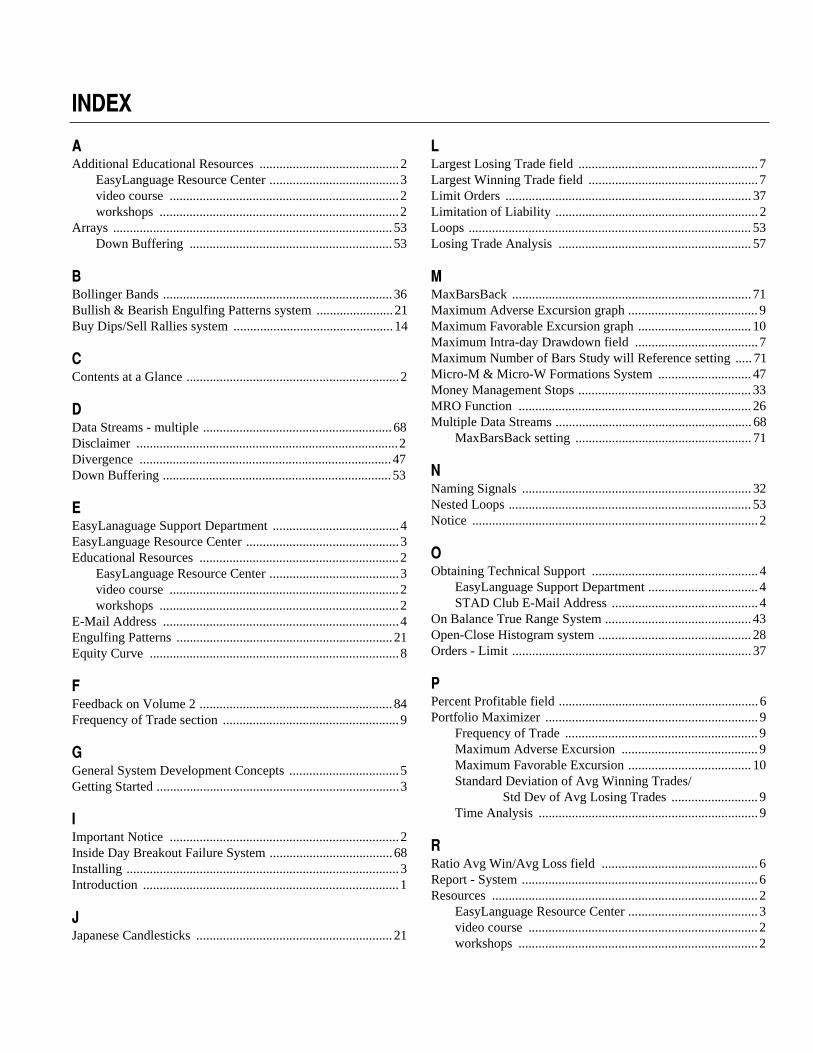
/4*+>
'Additional Educational Resources ..........................................2
EasyLanguage Resource Center .......................................3video course .....................................................................2workshops ........................................................................2
Arrays ....................................................................................53Down Buffering .............................................................53
(Bollinger Bands .....................................................................36Bullish & Bearish Engulfing Patterns system .......................21Buy Dips/Sell Rallies system ................................................14
)Contents at a Glance ................................................................2
*Data Streams - multiple .........................................................68Disclaimer ...............................................................................2Divergence ............................................................................47Down Buffering .....................................................................53
+EasyLanaguage Support Department ......................................4EasyLanguage Resource Center ..............................................3Educational Resources ............................................................2
EasyLanguage Resource Center .......................................3video course .....................................................................2workshops ........................................................................2
E-Mail Address .......................................................................4Engulfing Patterns .................................................................21Equity Curve ...........................................................................8
,Feedback on Volume 2 ..........................................................84Frequency of Trade section .....................................................9
-General System Development Concepts .................................5Getting Started .........................................................................3
/Important Notice .....................................................................2Inside Day Breakout Failure System .....................................68Installing ..................................................................................3Introduction .............................................................................1
0Japanese Candlesticks ...........................................................21
2Largest Losing Trade field ......................................................7Largest Winning Trade field ...................................................7Limit Orders .......................................................................... 37Limitation of Liability .............................................................2Loops ..................................................................................... 53Losing Trade Analysis .......................................................... 57
3MaxBarsBack ........................................................................71Maximum Adverse Excursion graph .......................................9Maximum Favorable Excursion graph .................................. 10Maximum Intra-day Drawdown field .....................................7Maximum Number of Bars Study will Reference setting ..... 71Micro-M & Micro-W Formations System ............................ 47Money Management Stops .................................................... 33MRO Function ...................................................................... 26Multiple Data Streams ........................................................... 68
MaxBarsBack setting ..................................................... 71
4Naming Signals ..................................................................... 32Nested Loops ......................................................................... 53Notice ......................................................................................2
5Obtaining Technical Support ..................................................4
EasyLanguage Support Department .................................4STAD Club E-Mail Address ............................................4
On Balance True Range System ............................................43Open-Close Histogram system .............................................. 28Orders - Limit ........................................................................37
6Percent Profitable field ............................................................6Portfolio Maximizer ................................................................9
Frequency of Trade ..........................................................9Maximum Adverse Excursion .........................................9Maximum Favorable Excursion ..................................... 10Standard Deviation of Avg Winning Trades/
Std Dev of Avg Losing Trades ..........................9Time Analysis ..................................................................9
8Ratio Avg Win/Avg Loss field ...............................................6Report - System .......................................................................6Resources ................................................................................2
EasyLanguage Resource Center .......................................3video course .....................................................................2workshops ........................................................................2
ââúúúúúúúúú/TJK^úúúúúúúúú
9Signal Names .........................................................................32STAD Club E-Mail Address ...................................................4Standard Deviation ................................................................36Standard Deviation – Volatility System ................................72Standard Deviation of Avg Winning Trades/
Std Dev of Avg Losing Trades field .........................9Stops - Money Management ..................................................33Support ....................................................................................4Support & Resistance Systems
Bollinger Bands ..............................................................36Micro-M & Micro-W Formations ..................................47On Balance True Range .................................................43Variable Zones ...............................................................58
System Equity Curve ...............................................................8System Evaluation ...................................................................6System Report .........................................................................6
Enhanced Report ..............................................................9Largest Losing Trade .......................................................7Largest Winning Trade .....................................................7Maximum Intra-day Drawdown .......................................7Percent Profitable .............................................................6Ratio Avg Win/Avg Loss .................................................6Total # of Trades ..............................................................7Total Net Profit .................................................................6
Systems - Installing .................................................................3
:Technical Support ....................................................................4Time Analysis section .............................................................9Total # of Trades field .............................................................7Total Net Profit field ...............................................................6Trending Systems
Bullish & Bearish Engulfing Patterns ............................21Buy Dips/Sell Rallies .....................................................14Open-Close Histogram ...................................................28
<Variable Zones System ..........................................................58Video Courses .........................................................................2Volatility Breakout Systems
Inside Day Breakout Failure ..........................................68Standard Deviation – Volatility ......................................72Volatility Clusters ..........................................................77
Volatility Clusters System .....................................................77
=Winning Trade Analysis ........................................................57Workshops ...............................................................................2