stage 3b – unit 20 data entry 2: interpreting line graphs...
TRANSCRIPT
Maths K–6Stage 3B
P/M 3B 43865 Centre for Learning Innovation
Stage 3B – Unit 20
Data
Entry 2: Interpreting Line Graphs
This booklet includes:
• Teacher notes (to be detached before sending to the student and supervisor)
• Supervisor notes
• Student and supervisor guide

Number: 43865 Title: Using Maths Tracks Stage 3B Unit 20
All reasonable efforts have been made to obtain copyright permissions. All claims will be settled in good faith.
Published byCentre for Learning Innovation (CLI)51 Wentworth RdStrathfield NSW 2135________________________________________________________________________________________________Copyright of this material is reserved to the Crown in the right of the State of New South Wales. Reproduction ortransmittal in whole, or in part, other than in accordance with provisions of the Copyright Act, is prohibited withoutthe written authority of the Centre for Learning Innovation (CLI).
© State of New South Wales, Department of Education and Training 2006.
This publication is copyright New South Wales Department of Education and Training (DET), however it may containmaterial from other sources which is not owned by DET. We would like to acknowledge the following people andorganisations whose material has been used:
Extracts from Mathematics Syllabus Years K-6 © Board of Studies, NSW 2002 Teacher notes p 5,Supervisor notes p 5
Maths Tracks Teacher’s Resource Book, Harcourt Education, 1st ed., 2004, by Trish Leigh andJennifer Vincent.Maths Tracks Student Book, Harcourt Education, 1st ed., 2004, by Trish Leigh and JenniferVincent.The copyright in the Maths Tracks material is vested in the publisher, Reed International BooksAustralia Pty Ltd, trading as Harcourt Education Australia. Maths Tracks for NSW has beenpublished under the Rigby imprint and the series covers seven stages from Early Stage 1 toStage 3B. Each stage has a Teacher’s Resource Book, Student Book and Homework Book.For professional development and support, view online at www.rigby.com.au/pd/event.asp
Supervisor notes p 7
COMMONWEALTH OF AUSTRALIA
Copyright Regulations 1969
WARNING
This material has been reproduced and communicated to you on behalf of theNew South Wales Department of Education and Training
(Centre for Learning Innovation)pursuant to Part VB of the Copyright Act 1968 (the Act).
The material in this communication may be subject to copyright under the Act.Any further reproduction or communication of this material by you may be the
subject of copyright protection under the Act.
CLI Project Team acknowledgement:
Writer: Averil GriffithEditors: Alan Barnes, Maree CamilleriIllustrators/Photographers Barbara Gurney, David StanleyDesktop publishing: Esta Tserpes

Using Maths Tracks, Stage 3B, Unit 20 1 Teacher notes
Stage 3B – Unit 20
These Teacher notes support ‘Using Maths Tracks’. The teacher should detach them before sending the Supervisor notes and the Student and supervisor guide to the supervisor and student. They contain:
• Student outcomes• Prior knowledge• Language• What is needed• Preparation• Interactivity• Resources (including websites)• Returns• Checking up answers• Assessment record
Student outcomes
Outcomes from the Mathematics K–6 Syllabus, © Board of Studies NSW 2002
DataDS3.1 Displays and interprets data in graphs with scales of many-to-one
correspondence
Working MathematicallyWMS3.1 Questioning Asks questions that could be explored using mathematics in relation to Stage 3 content
WMS3.3 Communicating Describes and represents a mathematical situation in a variety of ways using mathematical terminology and some conventions
Students will learn about:• determining a suitable scale for the data and recording the scale on the vertical axis• using the scale to determine the placement of each point when drawing a line graph• interpreting a given line graph using the scales on the axes
Prior knowledge
• Naming and labelling the horizontal and vertical axes• Drawing a line graph to represent any data that demonstrates a continuous change
Language
line graph, data, axis, axes, horizontal, vertical, scale, many-to-one correspondence

Using Maths Tracks, Stage 3B, Unit 20 2 Teacher notes
What is needed
Introduction• stopwatch or watch with second hand
Activity 2• Microsoft Excel
Activity 3• Maths Tracks Student Book Stage 3B, page 104
Activity 4• Maths Tracks Student Book Stage 3B, page 105
Activity 5• Draw a diagram problem-solving poster
Maths Tracks Homework Book Book Stage 3B, page 27 (if you are using it)
Preparation
Select the activities you think suitable for the student by ticking the boxes beside the activity numbers in the Student and supervisor guide.
Introduction (explicit teaching) – for all studentsActivity 1 (beginning) – can provide extra supportActivity 2 (additional assistance) – can provide extra supportActivity 3 (consolidating) – for all studentsActivity 4 (establishing) – for all studentsActivity 5 (problem solving) – can provide extra challengeReflection – for all studentsChecking up – for all students
Interactivity
Reflection: Students need to give examples of line graphs where the line is straight and the distance between increments is equal. In a Satellite lesson or minischool, students could discuss where they found examples of these line graphs by showing a website to their class or a line graph found in the media. Make sure the students state where they found their graphs.
Discussion:
• What types of graphs did the class find?• Were they easy or hard to find?• What type of information is represented on these sorts of graphs?

Using Maths Tracks, Stage 3B, Unit 20 3 Teacher notes
Resources
Add any you find suitable.
Websites [accessed 21 February 2006]
Check all websites before recommending them to students.
<www.newspapers.com.au> may contain examples of line graphs in the media. Add any others you find suitable.
Returns
Student sheet 1, My line graph – Introduction
Student sheet 2, Another line graph – Activity 1
Student sheet 3, Computer activity – Activity 2
Student sheet 4, Problem-solving – Activity 5
Checking up sheet
personal tape or recording – Reflection and Checking up
Supervisor and Student Feedback sheets
the guide (if you ask for it)
Checking up answers
1 a and d are not appropriate for line graphs because the data is not continuous. b and c are suitable because a line graph will let you see, for example, how many mL in 3.5 cups or how long it will take to produce 10 toys.
2 b 1 unit = 100 mL c 1 unit = 6 toys
3 Student is to draw a line graph based on (b) Measuring water or (c) Toy production.
4 Student is to ask four appropriate questions about the graph they have drawn in 3.

Using Maths Tracks, Stage 3B, Unit 20 4 Teacher notes
Using Maths Tracks, Stage 3B, Unit 20 5 Teacher notes
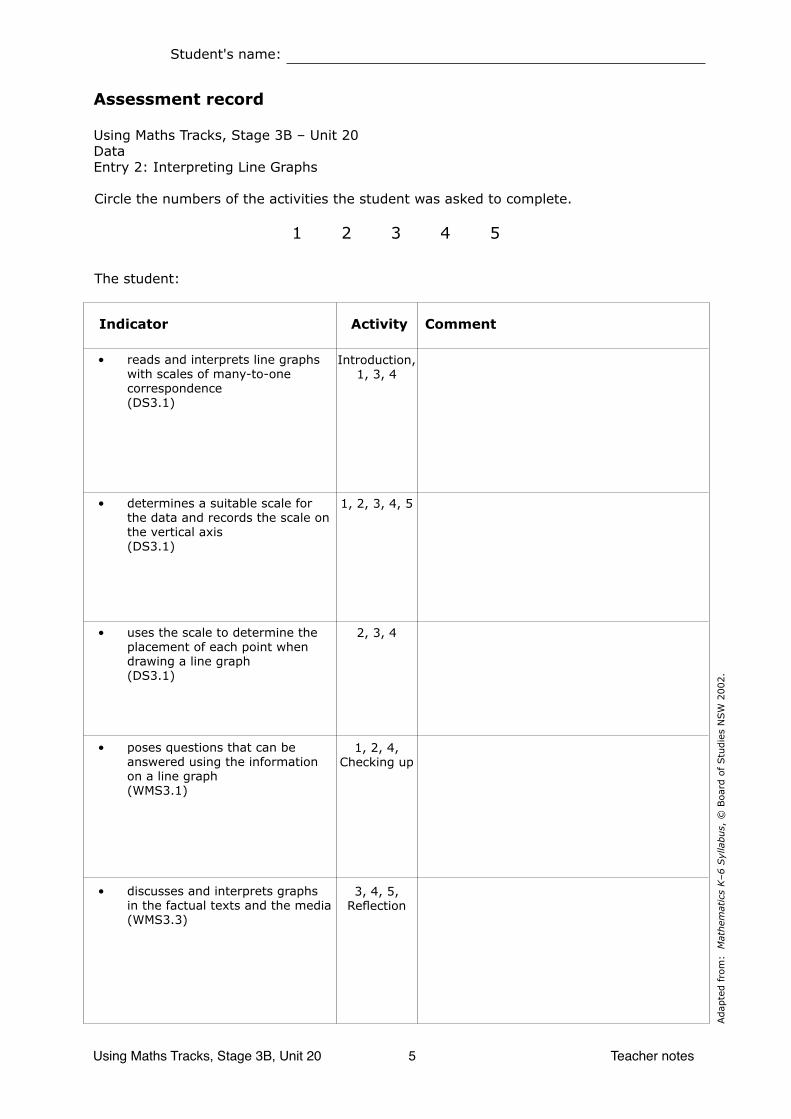
Assessment record
Using Maths Tracks, Stage 3B – Unit 20DataEntry 2: Interpreting Line Graphs
Student's name:
Adap
ted fro
m:
Mat
hem
atic
s K–6 S
ylla
bus,
© B
oar
d o
f Stu
die
s N
SW
2002.
Indicator Activity Comment
• reads and interprets line graphs with scales of many-to-one correspondence (DS3.1)
• determines a suitable scale for the data and records the scale on the vertical axis (DS3.1)
• uses the scale to determine the placement of each point when drawing a line graph (DS3.1)
• poses questions that can be answered using the information on a line graph (WMS3.1)
• discusses and interprets graphs in the factual texts and the media (WMS3.3)
Introduction, 1, 3, 4
1, 2, 3, 4, 5
2, 3, 4
1, 2, 4, Checking up
3, 4, 5, Reflection
Circle the numbers of the activities the student was asked to complete.
1 2 3 4 5
The student:

Using Maths Tracks, Stage 3B, Unit 20 6 Teacher notes

Maths K–6
P/M 3B 43865 Centre for Learning Innovation
Supervisor notesand
Student and supervisor guide
Stage 3B – Unit 20
Data
Entry 2: Interpreting Line Graphs
Number: 43865 Title: Using Maths Tracks Stage 3B Unit 20
All reasonable efforts have been made to obtain copyright permissions. All claims will be settled in good faith.
Published byCentre for Learning Innovation (CLI)51 Wentworth RdStrathfield NSW 2135________________________________________________________________________________________________Copyright of this material is reserved to the Crown in the right of the State of New South Wales. Reproduction ortransmittal in whole, or in part, other than in accordance with provisions of the Copyright Act, is prohibited withoutthe written authority of the Centre for Learning Innovation (CLI).
© State of New South Wales, Department of Education and Training 2006.
This publication is copyright New South Wales Department of Education and Training (DET), however it may containmaterial from other sources which is not owned by DET. We would like to acknowledge the following people andorganisations whose material has been used:
Extracts from Mathematics Syllabus Years K-6 © Board of Studies, NSW 2002 Teacher notes p 5,Supervisor notes p 5
Maths Tracks Teacher’s Resource Book, Harcourt Education, 1st ed., 2004, by Trish Leigh andJennifer Vincent.Maths Tracks Student Book, Harcourt Education, 1st ed., 2004, by Trish Leigh and JenniferVincent.The copyright in the Maths Tracks material is vested in the publisher, Reed International BooksAustralia Pty Ltd, trading as Harcourt Education Australia. Maths Tracks for NSW has beenpublished under the Rigby imprint and the series covers seven stages from Early Stage 1 toStage 3B. Each stage has a Teacher’s Resource Book, Student Book and Homework Book.For professional development and support, view online at www.rigby.com.au/pd/event.asp
Supervisor notes p 7
COMMONWEALTH OF AUSTRALIA
Copyright Regulations 1969
WARNING
This material has been reproduced and communicated to you on behalf of theNew South Wales Department of Education and Training
(Centre for Learning Innovation)pursuant to Part VB of the Copyright Act 1968 (the Act).
The material in this communication may be subject to copyright under the Act.Any further reproduction or communication of this material by you may be the
subject of copyright protection under the Act.
CLI Project Team acknowledgement:
Writer: Averil GriffithEditors: Alan Barnes, Maree CamilleriIllustrators/Photographers Barbara Gurney, David StanleyDesktop publishing: Esta Tserpes
Using Maths Tracks, Stage 3B, Unit 20 1 Supervisor notes
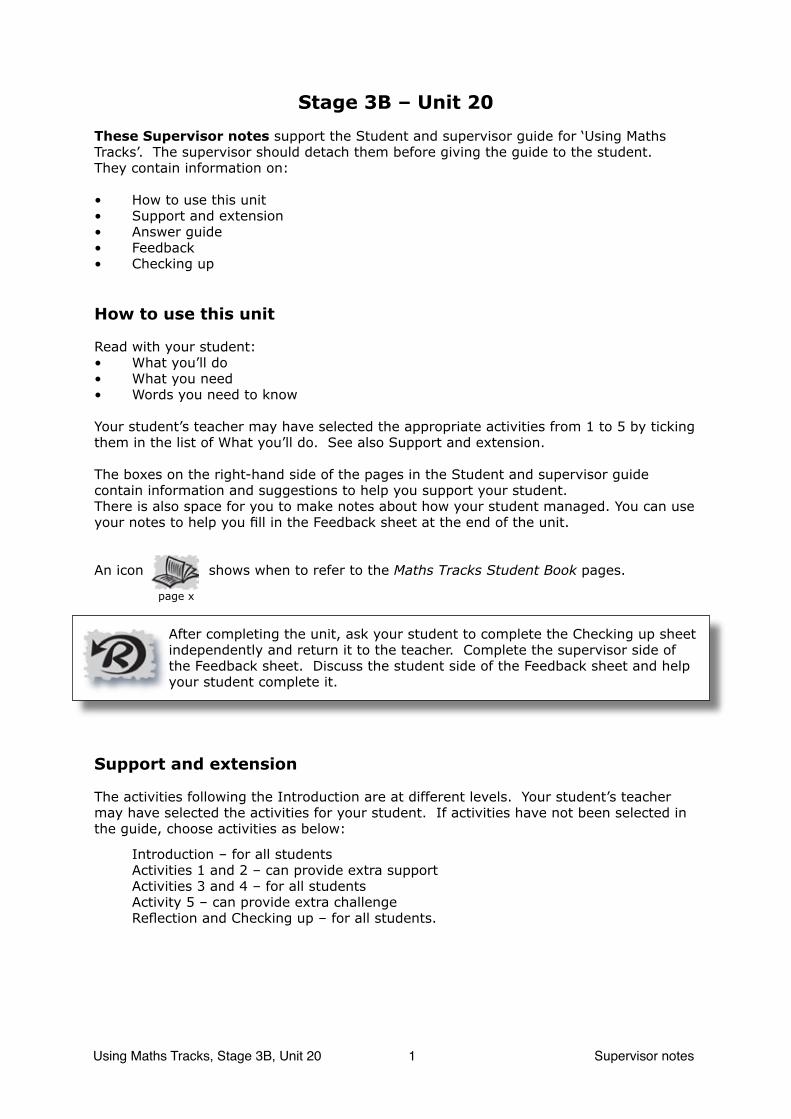
Stage 3B – Unit 20
These Supervisor notes support the Student and supervisor guide for ‘Using Maths Tracks’. The supervisor should detach them before giving the guide to the student. They contain information on:
• How to use this unit• Support and extension• Answer guide• Feedback• Checking up
How to use this unit
Read with your student:• What you’ll do• What you need• Words you need to know
Your student’s teacher may have selected the appropriate activities from 1 to 5 by ticking them in the list of What you’ll do. See also Support and extension.
The boxes on the right-hand side of the pages in the Student and supervisor guide contain information and suggestions to help you support your student. There is also space for you to make notes about how your student managed. You can use your notes to help you fill in the Feedback sheet at the end of the unit.
An icon shows when to refer to the Maths Tracks Student Book pages.
After completing the unit, ask your student to complete the Checking up sheet independently and return it to the teacher. Complete the supervisor side of the Feedback sheet. Discuss the student side of the Feedback sheet and help your student complete it.
Support and extension
The activities following the Introduction are at different levels. Your student’s teacher may have selected the activities for your student. If activities have not been selected in the guide, choose activities as below:
Introduction – for all students Activities 1 and 2 – can provide extra support Activities 3 and 4 – for all students Activity 5 – can provide extra challenge Reflection and Checking up – for all students.
page x

Using Maths Tracks, Stage 3B, Unit 20 2 Supervisor notes
Answer guide
This guide helps you give your student feedback on questions and tasks in the unit or the Maths Tracks Student Book, especially where answers will vary.
Introduction
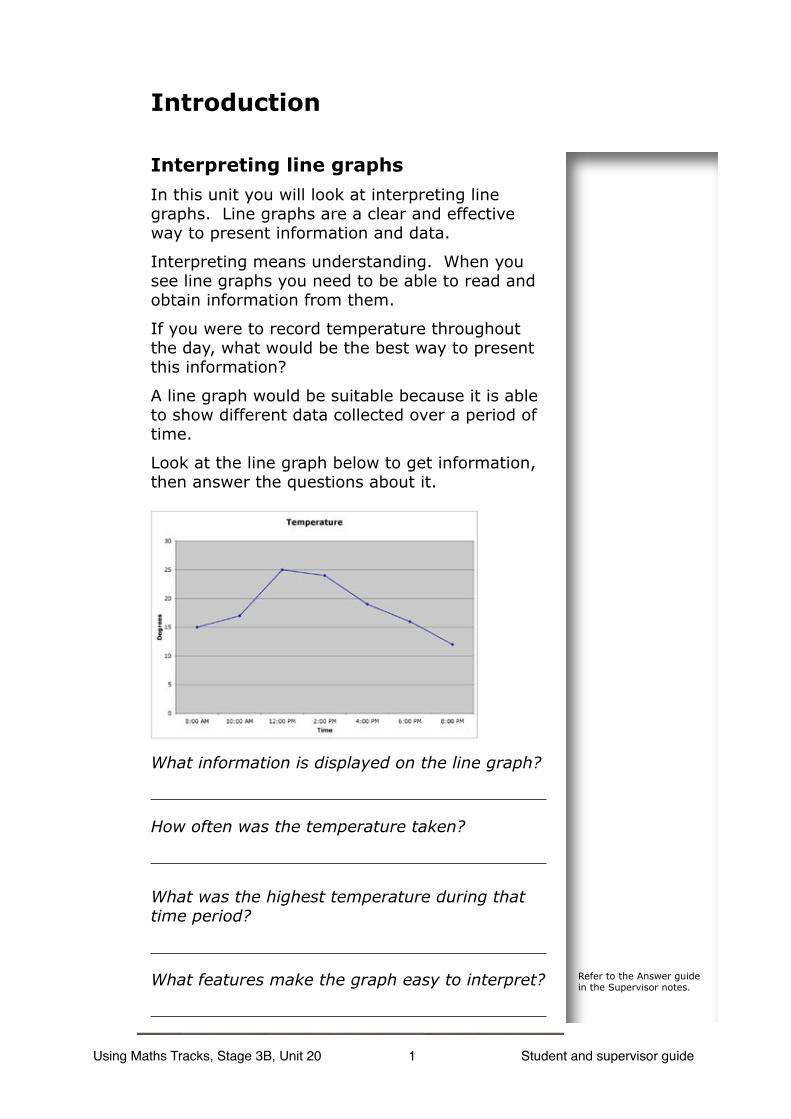
What information is displayed on the line graph? temperature during a dayHow often was the temperature taken? every two hoursWhat was the highest temperature during that time period? 25 degrees C.What features make the graph easy to interpret? answers will vary
Suggested graph:
My pulse rate
0153045607590
105120135150165180
30 secs 60 secs 90 secs 120 secs 150 secs
time
Pu
lses
Series1
When might information on pulse rates be important? Information on pulse rates might be important to doctors, dieticians, sports trainers as it gives information about how healthy the heart is.
Activity 1
Suggested title: Hourly wages
Suggested graph:
Hourly Wages
06
121824303642485460667278
One Two Three Four Five Six
Hours
Am
ou
nt
$
Supervisor answers these questions so they need to be checked by the student.What does the line graph show? hourly wagesWhat makes the line graph easy to read and to interpret?• It has a title to tell you what the graph is about.• X and Y axes are labelled clearly.• The increment is $6 so it is easy to work out hourly and half-hourly rates.

Using Maths Tracks, Stage 3B, Unit 20 3 Supervisor notes
Activity 2
Suggested graph:
Measuring Milk
0
5
10
15
20
25
30
1 Jug 2 Jugs 3 Jugs 4 Jugs 5 Jugs 6 Jugs
Jugs
Litr
es
Activity 3
Height of person during their lifetime Increments of 20 cm (0, 20, 40, 60, 80, 100, 120, 140, 160 etc.)
Distance travelled over a period of time Increments of 100 km(0, 100, 200, 300, 400, 500, 600, 700 etc.)
Plant growth over one month Increments of 2 cm(0, 2, 4, 6, 8, 10, 12, 14 etc.)
Rainfall over one week in Hobart Increments of 0.5 mm(0, 0.5, 1.0, 1.5, 2.0, 2.5, 3.0 etc.)
Activity 4
Page 10:What is it’s title? Female height from 2 – 18 years of ageWhat is the scale and label on the Y axis? increments of 20 cmWhat is the scale and label for the X axis? every two years, spaced evenly
Page 11:Suggested questions:1 At what age did she reach 160 cm?2 How tall was she at 18 years of age?3 How many centimetres did she grow between 2 and 18?
Has the information shown on the graphs changed? The information has not changed.How has changing the increment changed the appearance of the graphs? The growth rate is not as obvious so the graph loses its impact or meaning.Which graph best shows the height of females aged 2 to 18? the graph that uses the increment of 20 years
Page 12:What increment is used on Graph a? 1% incrementWhat increment is used on Graph b? 20% incrementWhich graph shows the changes in male unemployment more clearly? Graph a

Using Maths Tracks, Stage 3B, Unit 20 4 Supervisor notes
Maths Tracks Student Book, Stage 3B, page 105.1 b How do you know?
Suggested answer: labels are the same; the increments are the same although they have different scales; the days represented are the same although Graph C looks at every fourth day while Graphs A and B look at every second day
Activity 5
Justine is measuring the growth rate of bean shoots. On Day 1, they are 0.5 cm tall. By Day 5, they are 1.5 cm tall.
• On which day did the shoots grow the most? Day 1 (0.5 cm; every other day they grow 0.25 cm)
• How big were the bean shoots on the second, third and fourth days? Day 2 = 0.75 cm; Day 3 = 1 cm; Day 4 = 1.25 cm.
• If they continue to grow at the same rate, how tall would they be on the tenth day? Day 6 = 1.75 cm; Day 7 = 2 cm; Day 8 = 2.25 cm; Day 9 = 2.50 cm;
Day 10 = 2.75 cm
Suggested graph:
Reflection
Page 15:Name your line graph examples where the line is a straight diagonal. Money increasing/decreasing at the same rate, speed, distance, wages etc.Explain how the look of a line graph can change if you alter the scale on the Y axis.
The look of a graph can change if you alter the scale used on the Y axis especially if you choose an increment that is too large to represent the data. The message can get lost if the rate or increase in value is not obvious.
Page 16:Can you think why the sales of CDs is not a very good subject for a line graph? Line graphs are best used for continuous data, such as growth rates, rising water
levels etc. Line graphs allow you to see information ‘between’ and ‘beyond’ known information. For example, according to the CD sales graph, 80 CDs were sold at a midpoint between Monday and Tuesday while 100 CDs were sold between Wednesday and Thursday and again between Saturday and Sunday. Of course, this is not correct.
What would be a better type of graph to show CD sales? CD sales would be more accurately shown on a column graph or bar graph.
Plant growth
0
0.5
1
1.5
2
2.5
3
1st 2nd 3rd 4th 5th 6th 7th 8th 9th 10th
Day
Heig
ht
(cm
)

Using Maths Tracks, Stage 3B, Unit 20 5 Supervisor notes
Feedback
Supervisor
The feedback you provide will help teachers assess your student’s progress and plan future learning experiences. Please mark the scale and comment on the activities that your student completed.
• read and interpret line graphs with scales of many-to-one correspondence (DS3.1)
Introduction, 1, 3, 4
2, 3, 4
1, 2, 4, Checking up
3, 4, 5, Reflection
(Tick along line)with with independentlydifficulty help
Did your student: Activity
• determine a suitable scale for the data and record the scale on the vertical axis (DS3.1)
Adap
ted fro
m:
Mat
hem
atic
s K–6 S
ylla
bus,
© B
oar
d o
f Stu
die
s N
SW
2002.
Student’s name
Date
• pose questions that can be answered using the information on a line graph (WMS3.1)
• discuss and interpret graphs in factual texts and the media (WMS3.3)

Using Maths Tracks, Stage 3B, Unit 20 6 Supervisor notes
Feedback
Student
In this unit I learnt how to ________________________________________________
______________________________________________________________________.
Line graphs are effective because ___________________________________________
______________________________________________________________________
______________________________________________________________________.
You can find line graphs in _________________________________________________
______________________________________________________________________.
You need to be careful when choosing the increment for the Y axis scale because
______________________________________________________________________.
Help your student to give feedback on their learning for completed activities.

Using Maths Tracks, Stage 3B, Unit 20 7 Supervisor notes
Make sure your student completes this work independently for return to the teacher.
Checking up
Student's name:
Using Maths Tracks, Stage 3B – Unit 20Data Entry 2: Interpreting Line Graphs
Adap
ted fro
m:
Mat
hs
Tra
cks
Tea
cher
’s R
esourc
e Book
Sta
ge
3B ©
Har
court
Educa
tion,
2004.
1 Two of the topics in 2 are not suitable for line graphs. Which ones? __________
2 Write the scale you would use on the Y axis to represent the remaining two sets of data on a line graph.
a b
Scale: _________________________________ Scale: _________________________________
c d
Scale: _________________________________ Scale: _________________________________
3 Select one of the two appropriate sets of data from above. Draw the data on a line graph, labelling the X and Y axes.
4 Write 4 questions you could ask about the graph.

Using Maths Tracks, Stage 3B, Unit 20 8 Supervisor notes

Using Maths Tracks, Stage 3B, Unit 20 i Student and supervisor guide
Stage 3B – Unit 20
Student and supervisor guide
Unit contents
About this unit .................................................................................... ii What you’ll do ................................................................................ ii What you need .............................................................................. iii Words you need to know .......................................................... iii Icons .................................................................................................. iii Using this guide ............................................................................ iv Returns ............................................................................................. iv
Introduction .......................................................................................... 1
Activity 1 ................................................................................................. 4
Activity 2 ................................................................................................. 6
Activity 3 ................................................................................................. 8
Activity 4 .............................................................................................. 10
Activity 5 .............................................................................................. 14
Reflection ............................................................................................. 15
Checking up ....................................................................................... 16
Student sheets ................................................................................ 19

Using Maths Tracks, Stage 3B, Unit 20 ii Student and supervisor guide
About this unit
What you’ll do
Introduction• measure your pulse for different time periods and record your
results on a frequency table• draw up a line graph for your results and label correctly
Activity 1• suggest a title for data on a chart• plot data on a line graph• write questions about the line graph
Activity 2• use an Excel spreadsheet to enter data onto a line graph• experiment with changing values to see how the graph changes
Activity 3• revise how to decide on the scale for the axes on line graphs• use graphs to answer questions Activity 4• review how to decide on a correct scale for the Y axis to emphasise
information• decide whether three graphs contain the same information
Activity 5• use the Draw a diagram problem-solving poster to help solve a
problem• draw a line graph to show your results are correct
Reflection• give examples of line graphs where the line is straight and the
distance between increments is equal• look at how the line graph can change if you alter the scale used
on the Y axis
Checking up• select data which is inappropriate for a line graph• draw a line graph to show data• write four questions about the graph• write the scale you would use on the Y axis to represent data.
√
√
√
Using Maths Tracks, Stage 3B, Unit 20 iii Student and supervisor guide
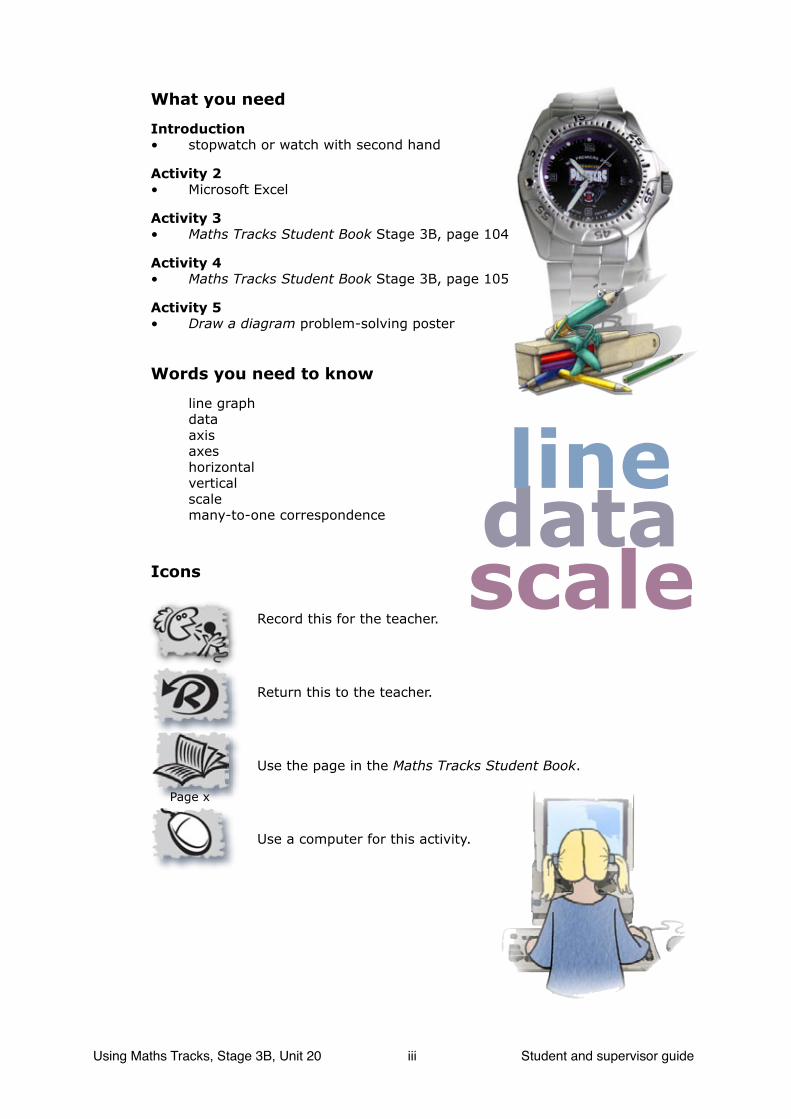
What you need
Introduction• stopwatch or watch with second hand
Activity 2• Microsoft Excel
Activity 3• Maths Tracks Student Book Stage 3B, page 104
Activity 4• Maths Tracks Student Book Stage 3B, page 105
Activity 5• Draw a diagram problem-solving poster
Words you need to know
line graph data axis axes horizontal vertical scale many-to-one correspondence
Icons
Record this for the teacher.
Return this to the teacher.
Use the page in the Maths Tracks Student Book.
Use a computer for this activity.
Page x
datascale
line
Using Maths Tracks, Stage 3B, Unit 20 iv Student and supervisor guide
Using this guide
The boxes on the right-hand side of pages in the Student and supervisor guide contain information and suggestions for the supervisor.
After each activity, circle the face that shows how you feel about your work and talk about it with your supervisor.
Returns
Student sheet 1 – My line graph – Introduction
Student sheet 2 – Another line graph – Activity 1
Student sheet 3 – Computer activity – Activity 2
Student sheet 4 – Problem-solving – Activity 5
Checking up sheet
personal tape or recording – Reflection, Checking up
Supervisor and Student Feedback sheets
this guide (if the teacher asks for it)
Using Maths Tracks, Stage 3B, Unit 20 1 Student and supervisor guide
Introduction
Interpreting line graphs
In this unit you will look at interpreting line graphs. Line graphs are a clear and effective way to present information and data.
Interpreting means understanding. When you see line graphs you need to be able to read and obtain information from them.
If you were to record temperature throughout the day, what would be the best way to present this information?
A line graph would be suitable because it is able to show different data collected over a period of time.
Look at the line graph below to get information, then answer the questions about it.
What information is displayed on the line graph?
How often was the temperature taken?
What was the highest temperature during that time period?
What features make the graph easy to interpret? Refer to the Answer guide in the Supervisor notes.

Using Maths Tracks, Stage 3B, Unit 20 2 Student and supervisor guide
Find a stopwatch or a watch with a second hand.
You are going to collect some data about your pulse rate.
Locate your pulse and use the watch to time the number of beats over 30 seconds.
Record it on the following table.
Pulse rates
Seconds 30 60 90 120 150
Pulse
Repeat, taking your pulse rate over 60 seconds, 90 seconds, 120 seconds and 150 seconds. Record your rates in the table above.
Student’s may have difficulty finding their pulse. Their wrist, or neck just under and right of their chin, are probably the easiest places to find their pulse.You will probably have to time them while they count their own pulse.
PulsePulsePulsePulse60–100
An average person’s resting pulse rate is
60 – 100 beats per minute. A very fit person’s resting
pulse rate could be 40 – 60 beats per minute.
Pulse

Using Maths Tracks, Stage 3B, Unit 20 3 Student and supervisor guide
Feedback:
lots of some nohelp help help
Find Student sheet 1 and use it to draw a line graph of your pulse rate.Decide on a title, label the X and Y axes and decide on the increments for the Y axis.
Plot your pulse rates, then join up your dots to form a line graph.
After you have finished your graph, answer the following questions.
What was your pulse rate at 30 seconds?
Was your pulse rate double that amount at 60 seconds?
Was your pulse rate between 60 and 100 pulses per minute?
When might information on pulse rates be important?
Refer to the Answer guide in the Supervisor notes.
PulsePulsePulsePulse
You may need to remind your student that the X axis is horizontal and the Y axis is vertical.

Using Maths Tracks, Stage 3B, Unit 20 4 Student and supervisor guide
Activity 1
Interpreting more graphs
Look at the following data chart (it’s called a frequency table).
Dave has just started a new job after school and on weekends. The table below shows his pay rate for each hour up to six hours.
Title: __________________________
Hours 1 2 3 4 5 6
Wage 12 24 36 48 60 72
Can you suggest a title for this information?Write it in the space above the data.
Find Student sheet 2 and use it to draw a line graph to represent this information.
What should be on the X axis?
What scale should we use for the Y axis?
Label the Y axis.
Give your graph a title.
Plot the data on the line graph.
Your student should write the hours and label the X axis.
Emphasise the need for equal increments on the Y axis. Your student could choose 0, 6, 12 etc. as the hourly amount goes up in multiples of 12.
Refer to the Answer guide in the Supervisor notes.
Using Maths Tracks, Stage 3B, Unit 20 5 Student and supervisor guide
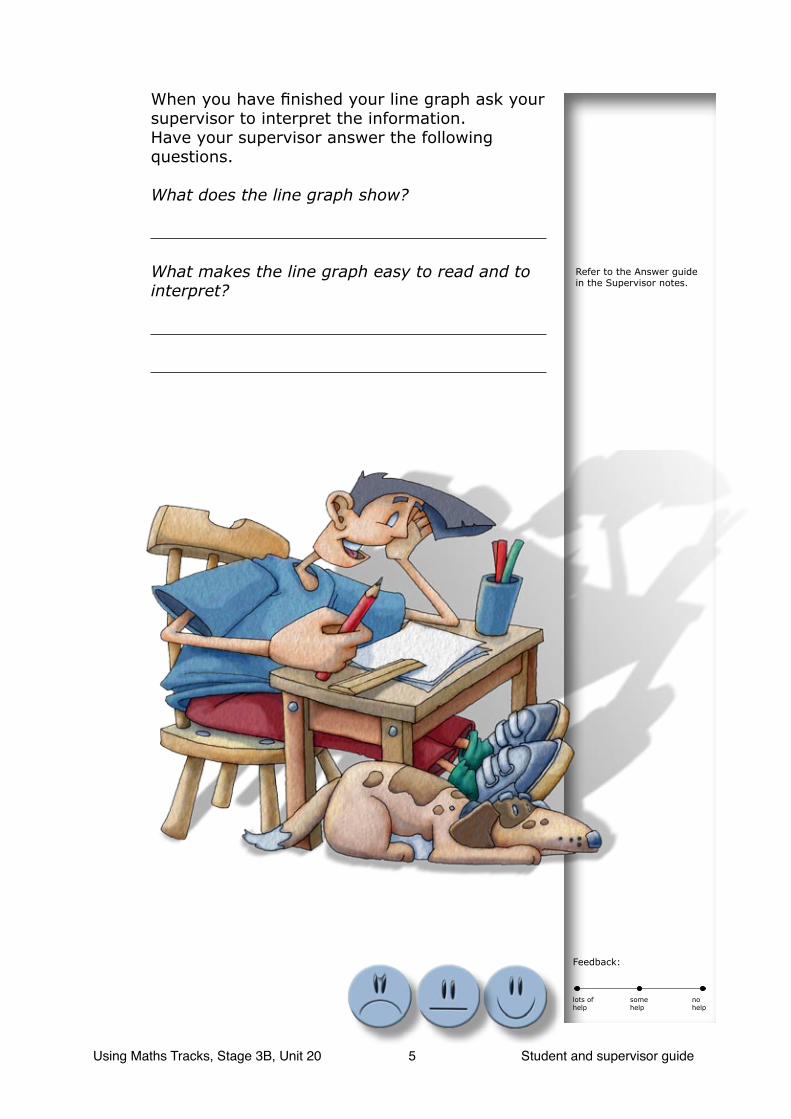
When you have finished your line graph ask your supervisor to interpret the information.Have your supervisor answer the following questions.
What does the line graph show?
What makes the line graph easy to read and to interpret?
Feedback:
lots of some nohelp help help
Refer to the Answer guide in the Supervisor notes.

Using Maths Tracks, Stage 3B, Unit 20 6 Student and supervisor guide
Activity 2
Open an Excel spread sheet.
Measuring Milk
Jugs 1 2 3 4 5 6
Litres 4 8 12 16 20 24
• In Row 1, type the number of jugs from the
above table.• In row 2, type the number of litres.• Highlight A to F for Rows 1 and 2.• Select and open Chart Wizard from the Toolbar, then follow the steps on the next
page.
Scr
eensh
ot
of
Exc
el r
eprinte
d b
y per
mis
sion fro
m M
icro
soft
Corp
ora
tion

Using Maths Tracks, Stage 3B, Unit 20 7 Student and supervisor guide
Feedback:
lots of some nohelp help help
Step 4: Click ‘Finish’.
In the following box, write four questions you could ask from the graph, such as ‘How many jugs would you need for 19 litres?’.
Refer to the Answer guide in the Supervisor notes.
Step1: Step 2: Step 3:
• Print your graph and paste onto Student sheet 3.
• Try changing the values on the computer to see how the graph changes.
Scr
eensh
ots
of Exc
el r
eprinte
d b
y per
mis
sion fro
m M
icro
soft
Corp
ora
tion
Using Maths Tracks, Stage 3B, Unit 20 8 Student and supervisor guide
Activity 3
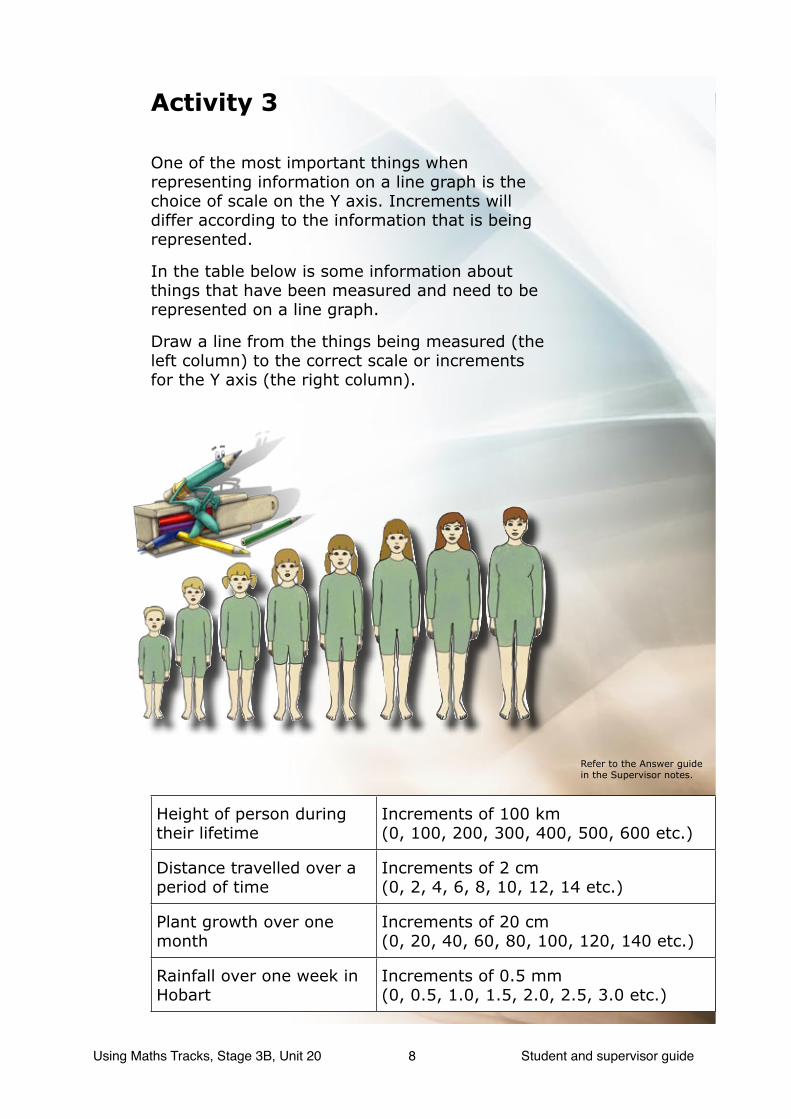
One of the most important things when representing information on a line graph is the choice of scale on the Y axis. Increments will differ according to the information that is being represented.
In the table below is some information about things that have been measured and need to be represented on a line graph.
Draw a line from the things being measured (the left column) to the correct scale or increments for the Y axis (the right column).
Height of person during their lifetime
Increments of 100 km(0, 100, 200, 300, 400, 500, 600 etc.)
Distance travelled over a period of time
Increments of 2 cm(0, 2, 4, 6, 8, 10, 12, 14 etc.)
Plant growth over one month
Increments of 20 cm(0, 20, 40, 60, 80, 100, 120, 140 etc.)
Rainfall over one week in Hobart
Increments of 0.5 mm(0, 0.5, 1.0, 1.5, 2.0, 2.5, 3.0 etc.)
Refer to the Answer guide in the Supervisor notes.

Using Maths Tracks, Stage 3B, Unit 20 9 Student and supervisor guide
Find page 104 in the Maths Tracks Student Book.
1 Use the graphs to answer the questions.
2 Use the graph to help you answer the questions.
Mark your answers for this page at the back of the Maths Tracks Student Book. Have another try if you went off the track.
Page 104
Feedback:
lots of some nohelp help help

Using Maths Tracks, Stage 3B, Unit 20 10 Student and supervisor guide
Activity 4
Look at the frequency chart below.
Female height
Age 2 4 6 8 10 12 14 16 18
Height in cm 85 100 115 130 135 149 161 165 167
Below is a graph based on the information from this frequency table.
What is its title?
What is the scale and label on the Y axis?
What is the scale and label for the X axis?Refer to the Answer guide in the Supervisor notes.

Using Maths Tracks, Stage 3B, Unit 20 11 Student and supervisor guide
Make up three questions about the graph.
1.
2.
3.
Below is another graph showing the same information. This time the increment on the Y axis has been changed from 20 cm to 100 cm.
Compare the two graphs.
Refer to the Answer guide in the Supervisor notes.
Has the information shown on the graphs changed?
How has changing the increment changed the appearance of the graphs?
Which graph best shows the height of females aged 2 to 18?
Why do you think so?
_______________________________________
Using Maths Tracks, Stage 3B, Unit 20 12 Student and supervisor guide
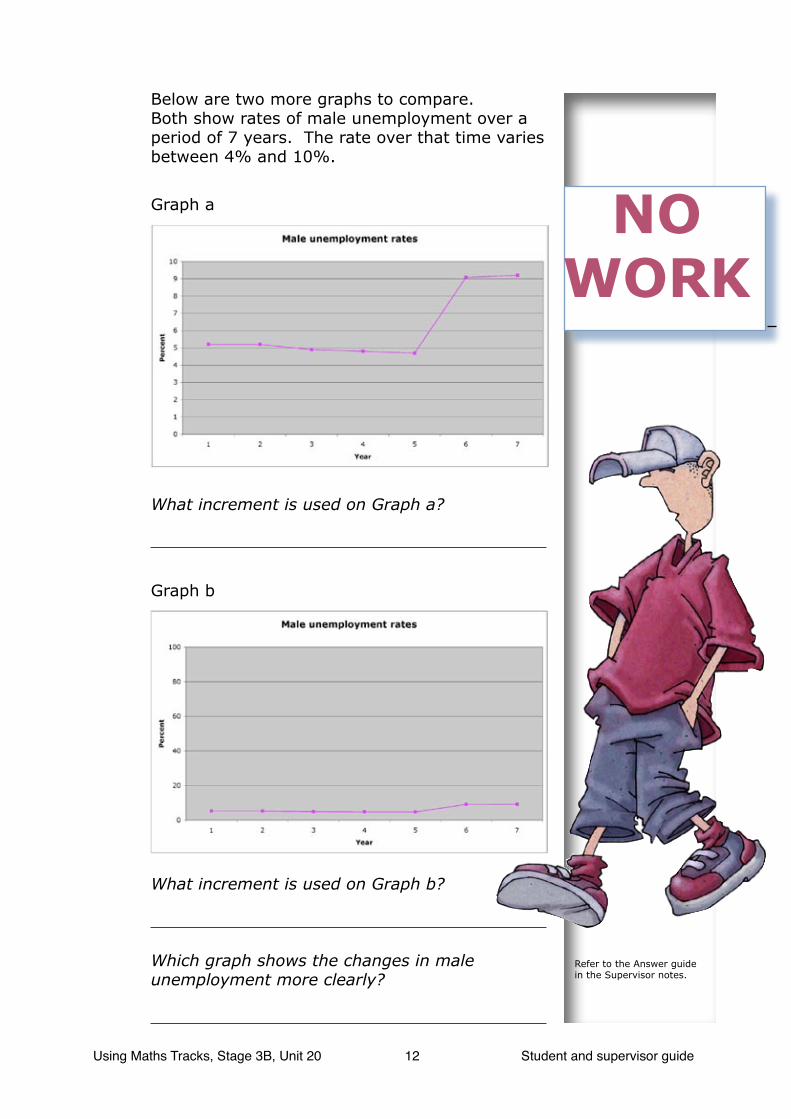
Below are two more graphs to compare.Both show rates of male unemployment over a period of 7 years. The rate over that time varies between 4% and 10%.
Graph a
What increment is used on Graph a?
Graph b
What increment is used on Graph b?
Which graph shows the changes in male unemployment more clearly?
NO WORK
Refer to the Answer guide in the Supervisor notes.
Using Maths Tracks, Stage 3B, Unit 20 13 Student and supervisor guide
Feedback:
lots of some nohelp help help
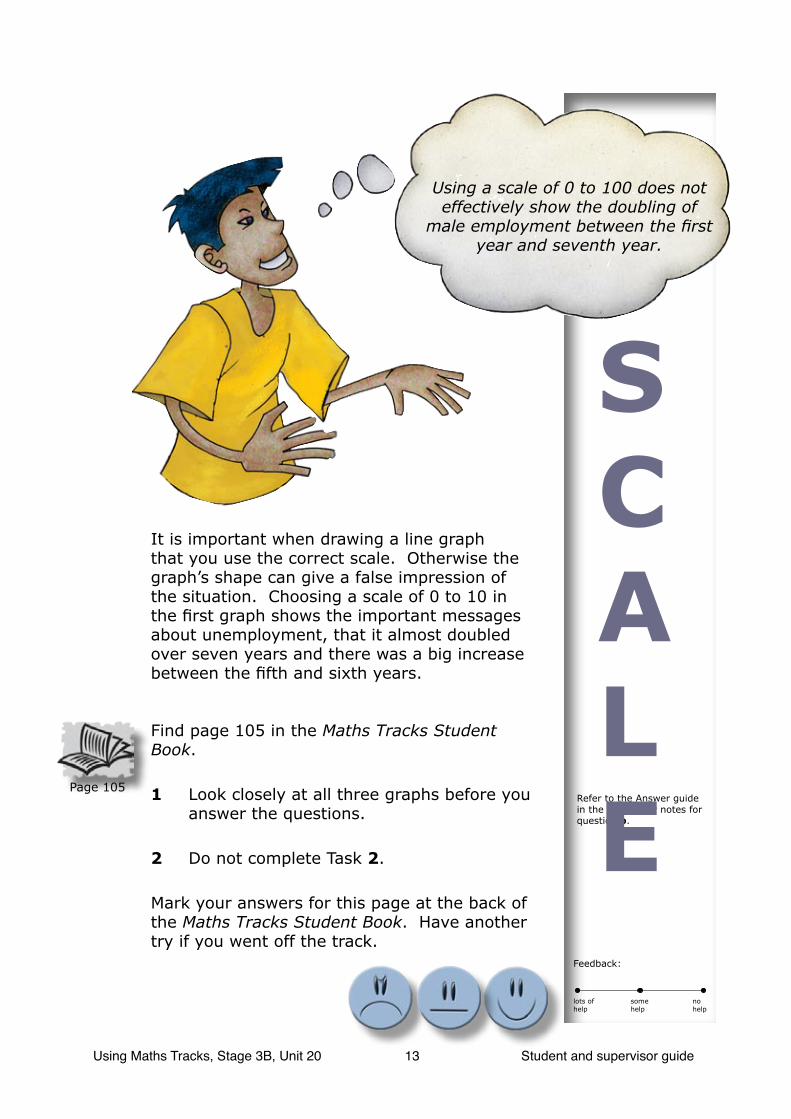
It is important when drawing a line graph that you use the correct scale. Otherwise the graph’s shape can give a false impression of the situation. Choosing a scale of 0 to 10 in the first graph shows the important messages about unemployment, that it almost doubled over seven years and there was a big increase between the fifth and sixth years.
Find page 105 in the Maths Tracks Student Book.
1 Look closely at all three graphs before you answer the questions.
2 Do not complete Task 2.
Mark your answers for this page at the back of the Maths Tracks Student Book. Have another try if you went off the track.
Refer to the Answer guide in the Supervisor notes for question b.
Page 105
Using a scale of 0 to 100 does not effectively show the doubling of
male employment between the first year and seventh year.
SCALE
Using Maths Tracks, Stage 3B, Unit 20 14 Student and supervisor guide
Feedback:
lots of some nohelp help help
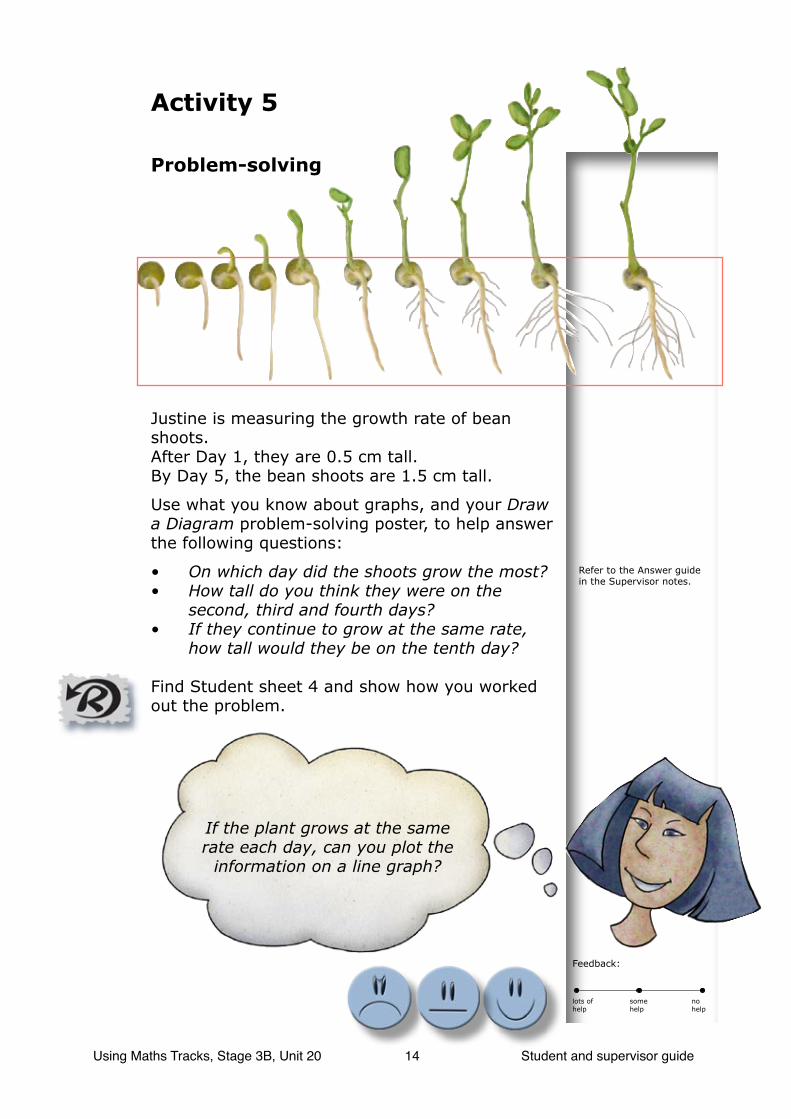
Activity 5
Problem-solving
Justine is measuring the growth rate of bean shoots.After Day 1, they are 0.5 cm tall.By Day 5, the bean shoots are 1.5 cm tall.
Use what you know about graphs, and your Draw a Diagram problem-solving poster, to help answer the following questions:
• On which day did the shoots grow the most?• How tall do you think they were on the
second, third and fourth days?• If they continue to grow at the same rate,
how tall would they be on the tenth day?
Find Student sheet 4 and show how you worked out the problem.
Refer to the Answer guide in the Supervisor notes.
If the plant grows at the same rate each day, can you plot the
information on a line graph?

Using Maths Tracks, Stage 3B, Unit 20 15 Student and supervisor guide
Feedback:
lots of some nohelp help help
Reflection
Can you think of examples of any information that, when plotted on a line graph, would make a straight diagonal with equal distance between the increments?
For example, if you bank the same amount of money every week, the line would be a straight diagonal.
Write your examples in this box.
Record this talk for your teacher.
• Name your line graph examples where the line is a straight diagonal.
• Explain how the look of a line graph can change if you alter the scale on the Y axis. (For example, what would happen if you changed the increment used in the pulse rate graph in the Introduction to 30 rather than 15?)
Stop the recording now.
If your student has trouble thinking of examples, they could ask family members, do an Internet search or look in magazines and newspapers.

Using Maths Tracks, Stage 3B, Unit 20 16 Student and supervisor guide
Have a close look at the graph below.It is based on the following data:
CD sales
Mon Tue Wed Thu Fri Sat Sun
85 74 83 126 98 132 34
Record this for your teacher.
Can you think why the sales of CDs is not a very good subject for a line graph?
What would be a better type of graph to show CD sales?
Stop the recording now.
Refer to the Answer guide in the Supervisor notes.
Using Maths Tracks, Stage 3B, Unit 20 17 Student and supervisor guide
Feedback:
lots of some nohelp help help
The Checking up sheet and Feedback sheet are near the back of the Supervisor notes for this unit. Make sure your student works on this assessment task independently with your assistance to read and interpret the instructions. Return the Checking up sheet to the teacher unmarked.
Checking up
Complete the Checking up sheet without any help from your supervior.
After you have finished the Checking up sheet, fill in the student side of the Feedback sheet. You may need to look back at the smiley faces you circled, to remind you how you felt about each activity.

Using Maths Tracks, Stage 3B, Unit 20 18 Student and supervisor guide
Using Maths Tracks, Stage 3B, Unit 20 19 Student sheet 1
Name:
My line graph Introduction

Using Maths Tracks, Stage 3B, Unit 20 20 Student sheet 1

Using Maths Tracks, Stage 3B, Unit 20 21 Student sheet 2
Another line graph Activity 1
Name:

Using Maths Tracks, Stage 3B, Unit 20 22 Student sheet 2

Using Maths Tracks, Stage 3B, Unit 20 23 Student sheet 3
Name:
Computer activity Activity 2
Paste your graph onto this page.
Using Maths Tracks, Stage 3B, Unit 20 24 Student sheet 3

Using Maths Tracks, Stage 3B, Unit 20 25 Student sheet 4
Problem-solving Activity 5
Show your working out on this page.

Using Maths Tracks, Stage 3B, Unit 20 26 Student sheet 4

Centre for Learning InnovationNSW Department of Education and Training
51 Wentworth RoadStrathfield NSW 2135