standardized energy measurement concept for data centers
TRANSCRIPT
Amstein + Walthert SA, Rue Pécolat 1, CP 1044, CH-1211 Geneva Telephone +41 22 731 83 80, Fax +41 22 738 88 13, www.amstein-walthert.ch
Standardized energy measurement concept for data centers and their infrastructures
© Bigfoot Technology
Version 05 / 30 June 2008 / English translation / 10 February 2009

H:\Cepe\Projekte\Data Centers\2007-\ScanE\Messkonzept\english\Measurement-concept_aebischer_10-2-09.doc 2/20
Masthead
Instructing party
Dr. Bernard Aebischer CEPE (Centre for Energy Policy and Economics) ETH Zürich Zürichbergstrasse 18 CH-8032 Zurich
Tel : +41-44-632 41 95 Fax : +41-44-632 10 50
e-mail [email protected] www.cepe.ethz.ch
Agent AMSTEIN + WALTHERT SA Rue Pécolat 1 CP 1044 CH-1211 Genève 1 Tel. +41 22 731 83 80 Fax +41 22 738 88 13 www.amstein-walthert.ch
JOBST WILLERS Engineering AG Quellenstrasse 1 CH-4310 Rheinfelden Tel. +41 61 836 97 01 Fax +41 61 831 28 83 www.willers.ch
Corentin Maucoronel Jobst Willers
Pierre-Jean Duc
Authors
Dr. Bernard Aebischer
Distribution
Versions Version 5 Validation Date Signature 30.06.2008 Entitled R2728MC5_Coefficient_C1.doc

H:\Cepe\Projekte\Data Centers\2007-\ScanE\Messkonzept\english\Measurement-concept_aebischer_10-2-09.doc 3/20
Contents
Accepted modifications .................................................................................... 4 List of the main abbreviations.......................................................................... 5 1 Presentation of the study................................................................ 6 2 Methodology .................................................................................... 7 2.1 Consumers to take into account ........................................................ 7 2.2 Configurations.................................................................................... 9 3 Energy measurement principle .................................................... 14 3.1 Basic data ........................................................................................ 14 3.2 Aim of the energy measurement concept........................................ 14 3.3 Structure of the measurement concept ........................................... 14 3.4 Data processing............................................................................... 16 4 Measuring devices......................................................................... 18 4.1 Requirements of measuring devices ............................................... 18 4.2 Recommended measuring devices ................................................. 18 4.3 Costs................................................................................................ 19 5 Annexes.......................................................................................... 20
H:\Cepe\Projekte\Data Centers\2007-\ScanE\Messkonzept\english\Measurement-concept_aebischer_10-2-09.doc 4/20
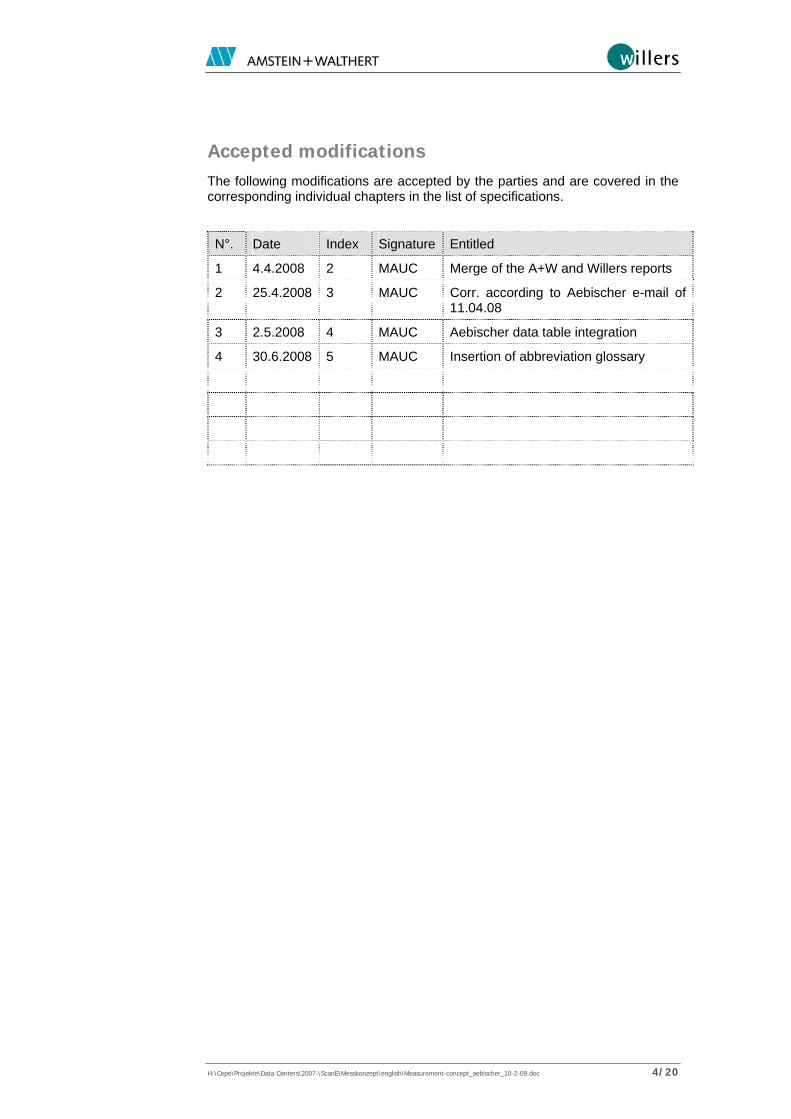
Accepted modifications The following modifications are accepted by the parties and are covered in the corresponding individual chapters in the list of specifications.
N°. Date Index Signature Entitled
1 4.4.2008 2 MAUC Merge of the A+W and Willers reports
2 25.4.2008 3 MAUC Corr. according to Aebischer e-mail of 11.04.08
3 2.5.2008 4 MAUC Aebischer data table integration
4 30.6.2008 5 MAUC Insertion of abbreviation glossary

H:\Cepe\Projekte\Data Centers\2007-\ScanE\Messkonzept\english\Measurement-concept_aebischer_10-2-09.doc 5/20
List of the main abbreviations
AHU: Air Handling Unit.
Critical MCC (Motor Controlled Center): motorized systems outside of com-puter racks which need to be supplied with backed-up power (for example pumps, ventilators, etc.).
C1 = DCiE = 1/PUE
DCiE = 1/PUE = C1
EJPD: Federal Justice and Police Department.
CSV file: A CSV file is a tabular file containing data on each line separated by a separator character (generally a comma or a semi-colon).
GEN: Diesel motor type back-up group.
Gen Sw Gear: electricity distribution cabinet for the back-up power supply
IEC: International Electrotechnical Commission.
M-bus: The M-Bus (Meter Bus) is a European standard for remote reading of heat or electricity meters.
Mech Sw Gear: electricity distribution cabinet for ventilation and air conditioning systems.
No-break: Uninterruptible electrical power supply systems with flywheel.
NOE: New Electricity Supply developed by the utility Geneva Industrial Ser-vices.
OPC: OLE (object linking and embedding) for Process Control is a technical specification defining a standard set of interfaces based on OLE COM/DCOM technology developed by Microsoft.
PDU: Power Distribution Unit.
SICC: Society of Heating and Air Conditioning Engineers.
UPS/ASC: Uninterruptible power supply system, battery-powered inverter.
Utility Sw Gear: Main electricity distribution cabinet.

H:\Cepe\Projekte\Data Centers\2007-\ScanE\Messkonzept\english\Measurement-concept_aebischer_10-2-09.doc 6/20
1 Presentation of the study The Standards Commission of the Canton of Geneva mandated Bernard Ae-bischer from CEPE (Centre for Energy Policy and Economics) at ETH Zürich to prepare a standardized measurement concept for DCiE.
DCiE is the ratio between the electrical energy consumed by the IT equipment inside a data center and the total electrical energy needed for the correct func-tioning of the same data center (IT equipment and infrastructure).
Electricity consumption of IT equipment DCiE = 1/PUE = C1 = ---------------------------------------------------------------
Total electricity consumption of the data center
This measurement concept shall then be used by mandated engineering firms to measure DCiE of individual data centres. The collected data of all data cen-tres will be pooled together in a benchmarking process. To get comparable data, the measurement concept must present a clear methodology to perform measurements according to the same principles, in order to guarantee reliable results and optimal costs.
This document has been jointly drawn up by Amstein + Walthert Genève SA and Jobst Willers Engineering AG.

H:\Cepe\Projekte\Data Centers\2007-\ScanE\Messkonzept\english\Measurement-concept_aebischer_10-2-09.doc 7/20
2 Methodology
2.1 Consumers to take into account
The different main consumers to take into account for the coefficient DCiE measurement are presented in the table below. We also give some comments regarding the measurement principle and the possible alternatives.
The comments are of a general nature and an in situ analysis/study of the data center and building configuration is indispensable before installing energy me-ters.
The main difficulty remains the calculation of the electrical energy consumed by air conditioning as, in most cases, a single cooling system supplies refrigeration to the whole building housing the data center.
Main consumers Comments on energy measurements
IT equipment (computer racks and servers).
Measuring devices to be installed on the PDU(s) incoming power supply line if power is supplied only to the IT equipment. Otherwise, one meter per outgoing power supply line from the PDU(s).
Uninterruptible power supply systems (UPS/ASC, No-break)
The short-break back-up units (ex: diesel back-up units) may be disregarded as they have very little or no electricity consumption in “stand-by” and “operating” mode, unlike no-break systems.
Server room lighting If the lighting is not powered by the PDU or a specific power supply unit for the server room, a specific electrical meter should be installed to measure the energy consumed by lighting.
If the lighting power supply comes from a unit shared by the whole building, it is possible to calculate the installed capacity in person and install a light-detecting meter.
Air conditioning cabinets Most data centers are cooled using air conditioners located in the data center itself or in adjoining premises. The electricity consumption of these devices can essentially be imputed to the ventilators, but sometimes also to directly integrated thermodynamic systems (compressors – Split system).

H:\Cepe\Projekte\Data Centers\2007-\ScanE\Messkonzept\english\Measurement-concept_aebischer_10-2-09.doc 8/20
Main consumers Comments on energy measurements
Ventilation If an air handling unit (AHU) is dedicated exclusively to the data center, then it will be necessary to install an electricity meter on this AHU.
Proposal: if the air renewal system of the data center is part of a general AHU for the building, for which the total flow is >80% of the air renewal flow for the data center, then the consumption of this general AHU does not need to be measured.
Refrigerating machines If the refrigerating machines supply refrigeration to consumers other than those dedicated to data center air conditioning, it will be necessary to install a refrigeration energy meter on the primary chilled water circuit as well as a meter on the secondary distribution circuit(s) to the consumers dedicated to data center air conditioning.
Air coolers and cooling towers Measuring devices to be installed on the power supply unit of this piece of equipment.
Cooling pump(s) If this (these) pump(s) is (are) supplied by a different electrical power unit from the power supply unit of the air coolers or cooling towers, or by a different electrical power unit from the hydraulic refrigeration distribution power supply unit, it must be fitted with an electrical energy meter, on the condition that its electrical power or the total electrical power of the pumps is above 1.5 kW
Primary and secondary chilled water pumps
If these pumps are supplied by a different electrical power unit from the hydraulic refrigeration distribution power supply unit, they must be fitted with electrical energy meters on the condition that their electrical power or the total electrical power of the pumps is above 1.5 kW (proposal).
Table 1: main consumers and particular comments

H:\Cepe\Projekte\Data Centers\2007-\ScanE\Messkonzept\english\Measurement-concept_aebischer_10-2-09.doc 9/20
2.2 Configurations
The configuration of data centers is not uniform and varies strongly from one site to another and according to year of completion. This variety is the main difficulty in defining a “global and universal” measurement concept.
We can classify the data centers based on the electrical distribution topology and the type of cooling system.
2.2.1 Main electrical configurations
The electrical configuration types (electrical distribution to servers and infra-structure) are the simplest to define: for this purpose, we can take the 4 configu-rations presented by the Uptime Institute for “Tier Level” classification1 (see Figures 1 to 3).
Figure 1: typical configuration of the electrical system topology of a data center at Tier Level I (left) and Tier Level II (right) – source: Uptime Institute
1 http://uptimeinstitute.org/content/view/22/56/

H:\Cepe\Projekte\Data Centers\2007-\ScanE\Messkonzept\english\Measurement-concept_aebischer_10-2-09.doc 10/20
Figure 2 : typical configuration of the electrical system topology of a data center at Tier Level III – source: Uptime Institute
Figure 3 : typical configuration of the electrical system topology of a data center at Tier Level IV – source: Uptime Institute
Air conditioning systems for data centers can be classified in two main areas:
• Technology used: chilled water, direct expansion refrigeration system, cooling by air conditioning cabinet, centralized monoblock, autonomous racks, use of cooling towers, air coolers, air condensers, etc.
• Refrigeration production dedicated to the Data center or not.
It is in relation to this last comment that we shall distinguish the two main meth-ods of measurement.

H:\Cepe\Projekte\Data Centers\2007-\ScanE\Messkonzept\english\Measurement-concept_aebischer_10-2-09.doc 11/20
2.2.2 Refrigeration production dedicated to the Data center
This is the simplest and most favourable case for electricity measurement. To explain the measurement principle, we shall detail the distribution of energy meters on the schematic diagram of Tier Level IV (which is the most complex).
We present below two typical diagrams, which summarize certain comments from Table 1. When refrigeration production is dedicated to the data center, electricity measurements are simplified. However, it is advised to pay attention to the position of the electrical meter measuring the power supplied to the serv-ers:
• The elctrical meter shall be installed on the PDU incoming power line if, and only if, the PDU only supplies power to the IT equipment (computer and server racks) and not to other ancillary component that is part of the infrastructure (lighting, decentralized ventilator, etc.).
• An electrical meter shall be installed on every outgoing power supply line of the PDU (so there may be several meters) from the racks and/or servers if the PDU supplies other ancillary components which are part of the ’infra-structure (lighting, decentralized ventilator, etc.).
These different variants are illustrated in figures 4 and 5.
Figure 4: measurement principle with dedicated refrigeration production and two light-ing variants
Electricity meter

H:\Cepe\Projekte\Data Centers\2007-\ScanE\Messkonzept\english\Measurement-concept_aebischer_10-2-09.doc 12/20
NOBREAK(standby)
Figure 5: measurement principle with dedicated refrigeration production, another light-ing variant and no break
2.2.3 Refrigeration production not dedicated to the data center
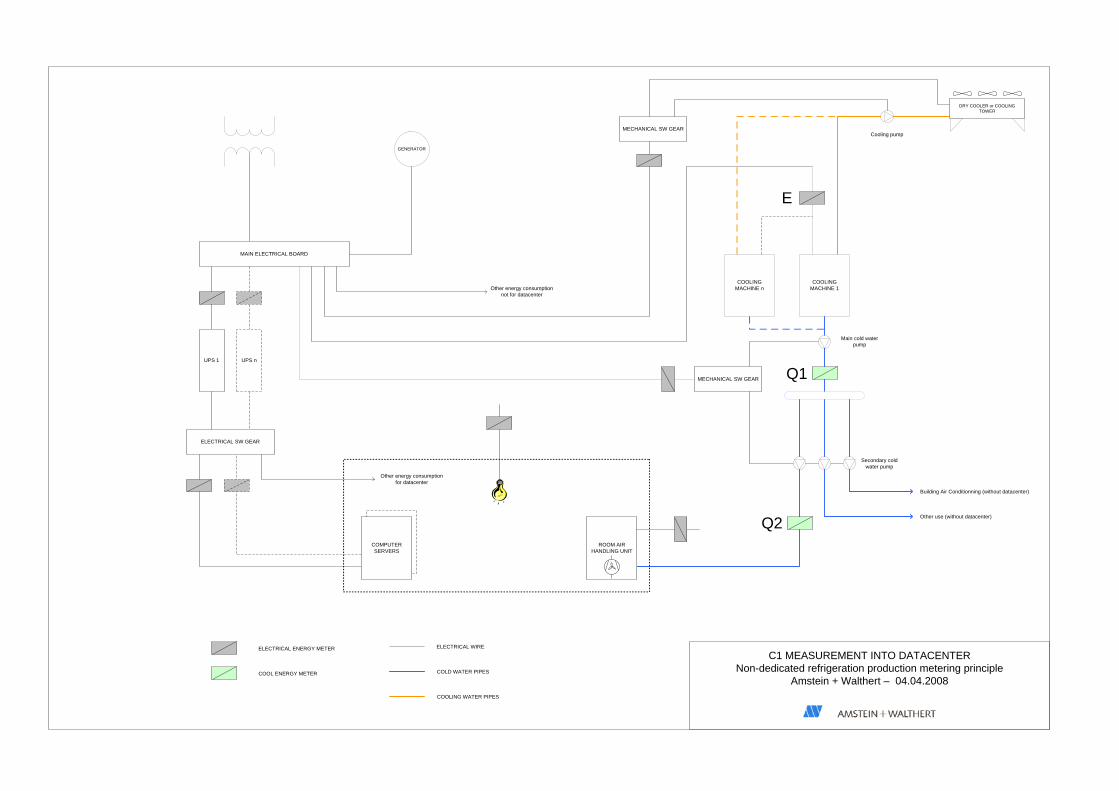
For refrigeration production not dedicated to the data center, we have produced a typical diagram which we feel reflects the vast majority of data center chilled water supply systems.
This is a system of chilled water production from 1 or 2 refrigerating units cooled by air via air coolers or cooling towers.
Based on this diagram (see annex 5.1), it is easy to deduce other system con-figurations such as cooling by water for example (one need only blank the air cooling system to have the measurement principle for water cooling of the re-frigerating units (municipal water, river water, lake water).
To deduce the consumption of electrical energy dedicated to data center air conditioning, it is necessary to measure refrigerating energy. These measure-ments shall be taken:
• On the primary chilled water circuit to measure the total quantity of cooling energy produced by refrigeration machines.
• On the secondary circuit, on the outgoing line to consumers dedicated to data center air conditioning.
H:\Cepe\Projekte\Data Centers\2007-\ScanE\Messkonzept\english\Measurement-concept_aebischer_10-2-09.doc 13/20
Machinefroid 1
Machinefroid n
Autres consommateurs
Datacenter
E Q1
Q2
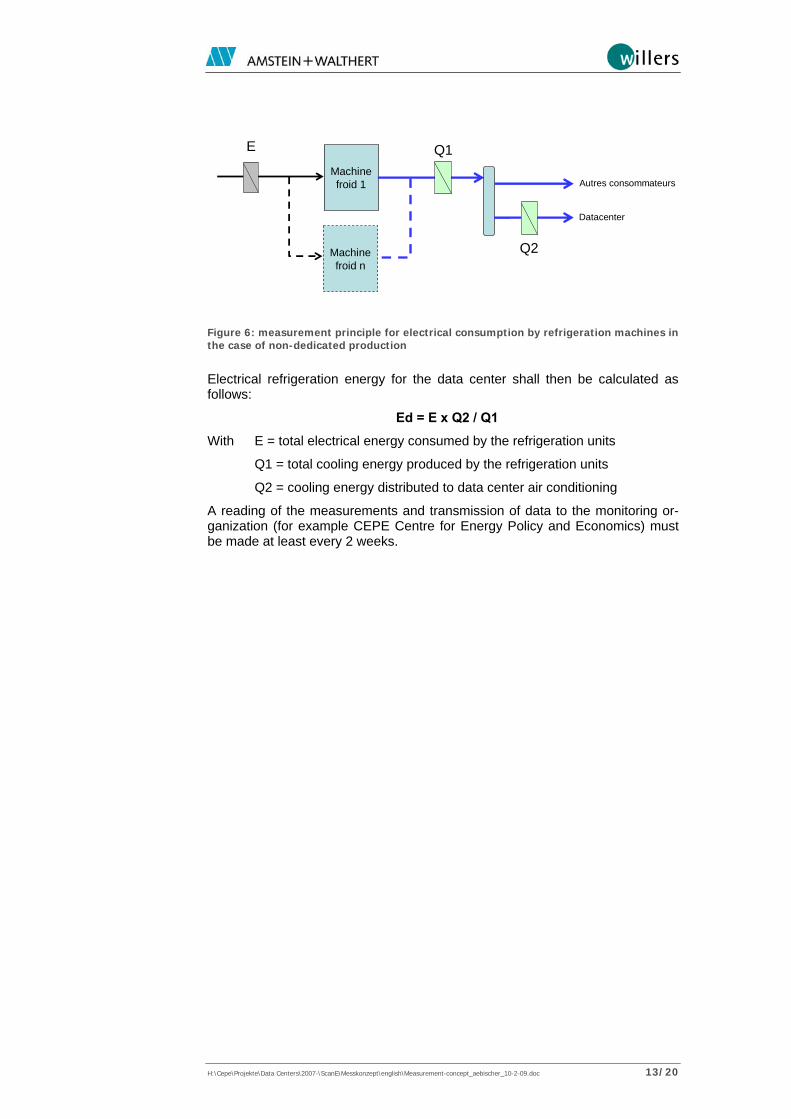
Figure 6: measurement principle for electrical consumption by refrigeration machines in the case of non-dedicated production
Electrical refrigeration energy for the data center shall then be calculated as follows:
Ed = E x Q2 / Q1
With E = total electrical energy consumed by the refrigeration units
Q1 = total cooling energy produced by the refrigeration units
Q2 = cooling energy distributed to data center air conditioning
A reading of the measurements and transmission of data to the monitoring or-ganization (for example CEPE Centre for Energy Policy and Economics) must be made at least every 2 weeks.

H:\Cepe\Projekte\Data Centers\2007-\ScanE\Messkonzept\english\Measurement-concept_aebischer_10-2-09.doc 14/20
3 Energy measurement principle
3.1 Basic data
In building technology, there are different standards and directives for the log-ging and analysis of energy consumption. In Switzerland, the directive SICC 98-1 “energy and fluid measurement concept” establishes the basis for most pro-jects.
On an international level, USA institutes and businesses are particularly in-volved in standardized consumption logging in data centers. Energy efficiency expressed by coefficient DCiE has been generally imposed.
3.2 Aim of the energy measurement concept
The energy measurement concept must create the conditions to reach the fol-lowing goals:
• homogenous and consistent measurement concept,
• simple analysis with report on several installations,
• assessment of coefficient DCiE.
• presentation of areas to investigate for optimization measures.
3.3 Structure of the measurement concept
3.3.1 Data recording
Recording data can be done automatically or manually.
In the case of manual recording, the measurements are taken on-site, from meters, periodically. They are then entered into a table provided for this.
In the case of automatic data recording, it is advised to connect the meter to a bus system using the M-bus protocol. Using this system, it is also possible to read data in a monthly/weekly/daily or even hourly basis.
3.3.2 Measurement concept with M-Bus (OPC server)
The M-Bus is a system that has been developed to read data from the meter. The M-Bus has the following advantages:
• widely accepted by measuring device manufacturers,
• protected against polarity inversion,
• freedom of network topology: bus, star or tree-type,
• economical due to low installation costs.
Meter information is collected, via de bus, using a signal converter (master) It is possible to connect up to 64 M-Bus meters (slaves) to a signal converter. Once the meters fitted with an M-Bus interface are installed, they are directly con-nected to the bus. Meters that do not have an M-Bus interface are incorporated using an pulse meter on the M-Bus. The structure of the system with M-Bus appears as follows:

H:\Cepe\Projekte\Data Centers\2007-\ScanE\Messkonzept\english\Measurement-concept_aebischer_10-2-09.doc 15/20
Figure 7: M-Bus system topology
The signal converters are connected to the OPC server using a TCP/ IP router.
In order to avoid excessive calculation loads, it is advised to avoid connecting more than 40 meters (maximum theoretical expansion: 254 components) to an OPC server.
3.3.3 Remote analysis
Remote data analysis can be beneficial in the case of a measurement concept aimed at several installations or a large data center. In this case, data transfer must be controlled using a web inquiry.
Figure 8: M-Bus system topology with remote analysis
For example, the structure of the system can be as above. Data can be re-corded using a Programmable Logic Controler (PLC) with M-Bus interface and integrated web server. The data can then be made available on the internet.
H:\Cepe\Projekte\Data Centers\2007-\ScanE\Messkonzept\english\Measurement-concept_aebischer_10-2-09.doc 16/20
Another possibility consists of transmitting the data to the central workstation periodically by e-mail.
3.3.4 Data retrieval
There are many possible ways to retrieve data collected with the OPC server (M-Bus), the remote reading system via internet, or through manual readings.
For manual readings, the data recorded are entered into a table prepared in an MS Excel spreadsheet.
In the case of data recorded using an OPC server (M-Bus), the data is loaded via an OPC Datalogger. The latter provides a CSV file for processing at a later date. The data can be read either with an Excel spreadsheet, or processed using an analytical tool.
Regarding remote analysis via internet, the PLC provides a CSV file containing the data collected. The CSV file can be read either with an Excel spreadsheet, or processed using an analytical tool.
3.3.5 Measurement periodicity
We recommend that measurements are taken every ¼ of an hour. This time interval is sufficient for energy measurements and reduce the risk of overload-ing the memory of measurement devices.
3.4 Data processing
For the analysis of energy data, different tables and graphics must be provided for the user. The aim of these tables is to provide a clear overview of data cen-ter energy consumption.
Here below are the aims of these tables and graphics:
Controlling energy consumption
Here, the consumption data of an installation or system is monitored in order to determine the variations in energy consumption under constant load conditions.
Installations in the area of building technology (ventilation, heating, air condi-tioning) often work according to the outdoor temperature. Consequently, out-door temperatures must also be taken into account in the analysis. (Meteo-suisse supplies average outdoor temperatures by week and by month).
Infrastructure energy efficiency indicator (DCiE)
The energy efficiency of a data center (represented by DCiE) can be calculated on the condition that all the required values are recorded. This coefficient is obtained using the following formula:
Electricity consumption of IT equipment DCiE = ------------------------------------------------------------------------------------------- Total electricity consumption of the data center (infrastructures + IT)
H:\Cepe\Projekte\Data Centers\2007-\ScanE\Messkonzept\english\Measurement-concept_aebischer_10-2-09.doc 17/20
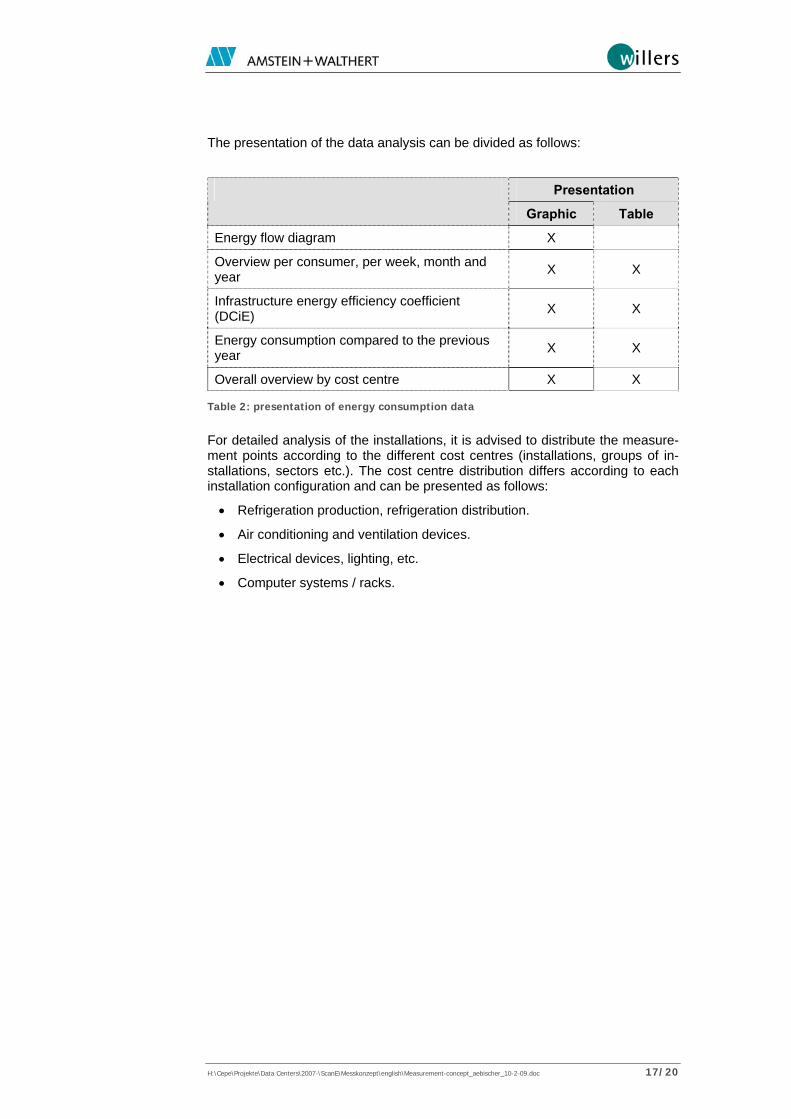
The presentation of the data analysis can be divided as follows:
Presentation
Graphic Table
Energy flow diagram X
Overview per consumer, per week, month and year X X
Infrastructure energy efficiency coefficient (DCiE) X X
Energy consumption compared to the previous year X X
Overall overview by cost centre X X
Table 2: presentation of energy consumption data
For detailed analysis of the installations, it is advised to distribute the measure-ment points according to the different cost centres (installations, groups of in-stallations, sectors etc.). The cost centre distribution differs according to each installation configuration and can be presented as follows:
• Refrigeration production, refrigeration distribution.
• Air conditioning and ventilation devices.
• Electrical devices, lighting, etc.
• Computer systems / racks.
H:\Cepe\Projekte\Data Centers\2007-\ScanE\Messkonzept\english\Measurement-concept_aebischer_10-2-09.doc 18/20
4 Measuring devices
4.1 Requirements of measuring devices
An appropriate measuring device must meet the following requirements:
• according to decree SR 941.251 by the EJPD, regarding business prem-ises, it is compulsory to install meters which are classed in accuracy cate-gory B at least. This corresponds to class 1 according to IEC 62053 -11 (accuracy of 1%).
• The device must have an M-Bus interface or impulse output to read meas-urement values and transfer energy data,
• Devices installed for electrical energy rebilling must be monitored and cali-brated by certified calibration organizations. Specific provisions apply here regarding the periodical calibration of these devices. These provisions are described here below: If electrical energy is rebilled, meters must be calibrated by a certified cali-bration organization. The devices must be re-calibrated at regular inter-vals. Decree SR 941.251 by the EJPD specifies that active energy meters must be re-calibrated every ten years by a certified calibration organiza-tion. For electromechanical measurement system meters, the calibration frequency is 15 years.
4.2 Recommended measuring devices
4.2.1 Electricity measurements
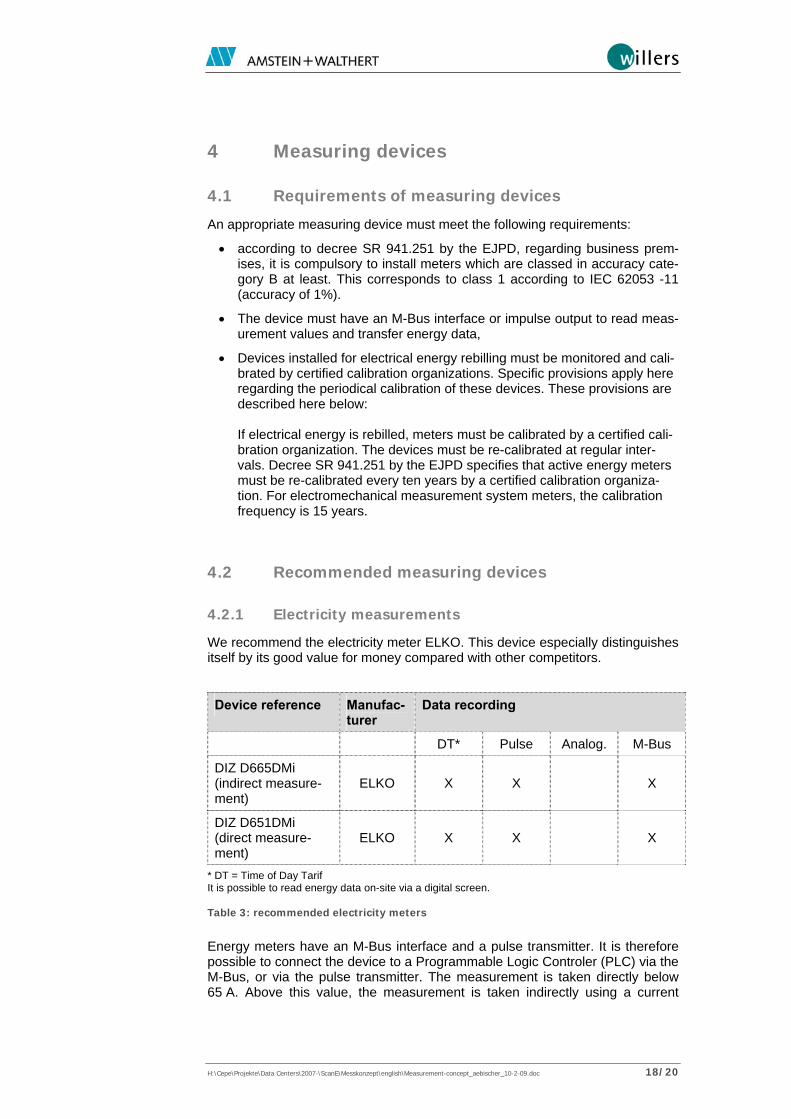
We recommend the electricity meter ELKO. This device especially distinguishes itself by its good value for money compared with other competitors.
Device reference Manufac-turer
Data recording
DT* Pulse Analog. M-Bus
DIZ D665DMi (indirect measure-ment)
ELKO X X X
DIZ D651DMi (direct measure-ment)
ELKO X X X
* DT = Time of Day Tarif It is possible to read energy data on-site via a digital screen.
Table 3: recommended electricity meters
Energy meters have an M-Bus interface and a pulse transmitter. It is therefore possible to connect the device to a Programmable Logic Controler (PLC) via the M-Bus, or via the pulse transmitter. The measurement is taken directly below 65 A. Above this value, the measurement is taken indirectly using a current
H:\Cepe\Projekte\Data Centers\2007-\ScanE\Messkonzept\english\Measurement-concept_aebischer_10-2-09.doc 19/20
transformer The mode of operation of the current transformer can be set on the device.
4.2.2 Thermal measurements
The recommended brands for thermal energy metering are Aquametro type Amflo Sonic (ultrasonic) Ambus.
4.3 Costs
4.3.1 Electricity meter
The average cost of an electricity measurement point without a datalogger is estimated at:
Meter (≤ 63A inc. M-Bus) + wiring + assembly = CHF 1’500 (EUR 1’000)
4.3.2 Heat meter
To avoid any additional pressure drop which would disrupt operation, we rec-ommend installing ultrasonic heat meters.
The average cost of a heat measurement point without a datalogger is esti-mated at:
Meter + M-Bus interface + wiring + assembly = CHF 3’400 (EUR 2’300)
This estimate is based on a meter for a hydraulic line of DN50.
4.3.3 Datalogger
The datalogger is only necessary if the site does not possess a supervision system or if it is not possible to integrate measurement points easily, or if the client does not wish to integrate these points into their B.M.S. (Building Man-agement System).
The average cost of a datalogger is estimated at:
Datalogger + program + commissioning = CHF 4’000 (EUR 2’700)
H:\Cepe\Projekte\Data Centers\2007-\ScanE\Messkonzept\english\Measurement-concept_aebischer_10-2-09.doc 20/20
5 Annexes 5.1 Non-dedicated refrigeration production metering principle 5.2 Example of measurement results presentation
COOLING MACHINE 1
DRY COOLER or COOLING TOWER
COOLING MACHINE n
Main cold water pump
Secondary cold water pump
Cooling pump
Building Air Conditionning (without datacenter)
Other use (without datacenter)
ROOM AIR HANDLING UNIT
MAIN ELECTRICAL BOARD
GENERATOR
UPS 1 UPS n
ELECTRICAL SW GEAR
Other energy consumption not for datacenter
ELECTRICAL ENERGY METER
COOL ENERGY METER
ORDINATEURS SERVEURSCOMPUTER
SERVERS
Other energy consumption for datacenter
MECHANICAL SW GEAR
MECHANICAL SW GEAR
C1 MEASUREMENT INTO DATACENTERNon-dedicated refrigeration production metering principle
Amstein + Walthert – 04.04.2008
ELECTRICAL WIRE
COLD WATER PIPES
COOLING WATER PIPES
E
Q1
Q2

Annex 5.2 Example of data sheet Source: CEPE - Aebischer
Data Centre nr 1Location Zurich
Current year 2006
Month Total consumption Consommation IT-equipment DCiE Mean electric load IT-
equipment Floor area IT rooms Mean electric load IT-equipment by floor area
Mean outside temperature
[kWh] [kWh] [KW] [m2] [W / m2] [°C]January 657221 490978 0.75 682 1500 455 -2.2February 622156 454333 0.73 631 1500 421 0.0March 744073 510267 0.69 709 1500 472 3.1April 832835 506544 0.61 704 1500 469 8.8Mai 925911 554581 0.60 770 1500 514 13.3June 969427 551493 0.57 766 1500 511 17.7July 1083802 626113 0.58 870 1500 580 22.5August 1088671 623864 0.57 866 1500 578 14.7September 1132036 648006 0.57 900 1500 600 16.9October 1156820 679537 0.59 944 1500 629 12.7November 1099209 667764 0.61 927 1500 618 7.0December 999948 712962 0.71 990 1500 660 2.5Total 11'312'109 7'026'442 0.62 813 1'500 542
Past year 2005
Month Total consumption Consommation IT-equipment DCiE Mean electric load IT-
equipment Floor area IT rooms Mean electric load IT-equipment by floor area
Mean outside temperature
[kWh] [kWh] [KW] [m2] [W / m2] [°C]January 588127 389743 0.66 541 1500 361 0.5February 540416 358771 0.66 498 1500 332 -1.1March 631550 434849 0.69 604 1500 403 5.6April 647777 392029 0.61 544 1500 363 9.3Mai 726211 487646 0.67 677 1500 452 13.7June 819132 433186 0.53 602 1500 401 18.3July 769453 466029 0.61 647 1500 432 18.3August 861543 536702 0.62 745 1500 497 16.3September 692336 458961 0.66 637 1500 425 15.6October 790281 446074 0.56 620 1500 413 11.0November 738710 497624 0.67 691 1500 461 3.9December 657221 429861 0.65 597 1500 398 -0.4Total 8'462'758 5'331'476 0.63 617 1'500 411