standards and procedures for site specific soil mapping...
TRANSCRIPT
Standards and Procedures for Site Specific Soil Mapping in Rhode
Island
Pg 1
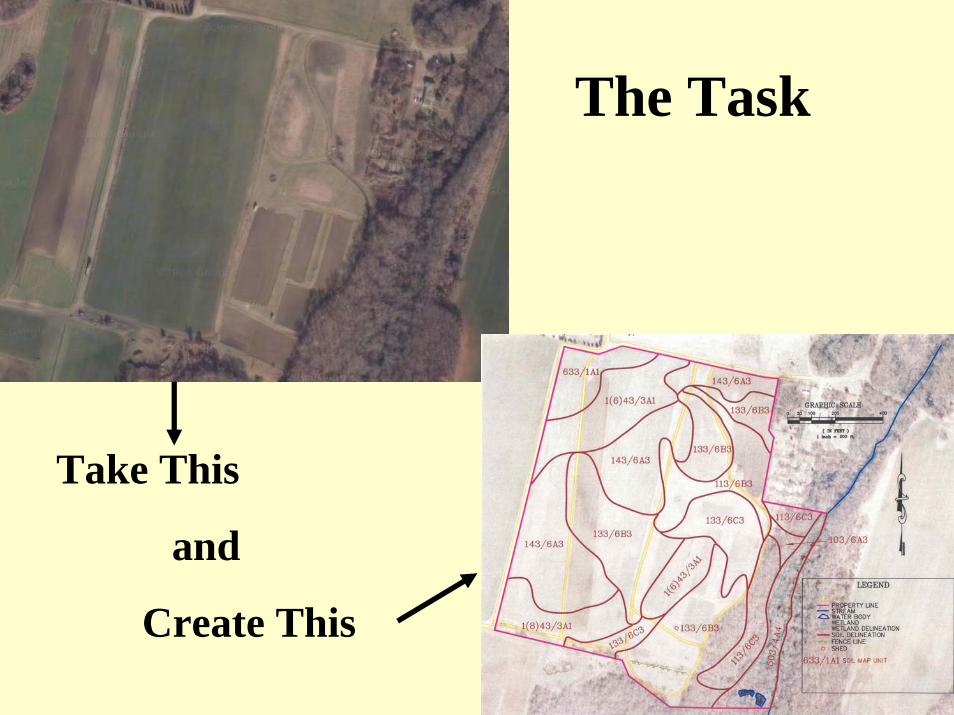
The Task
Take This
and
Create This
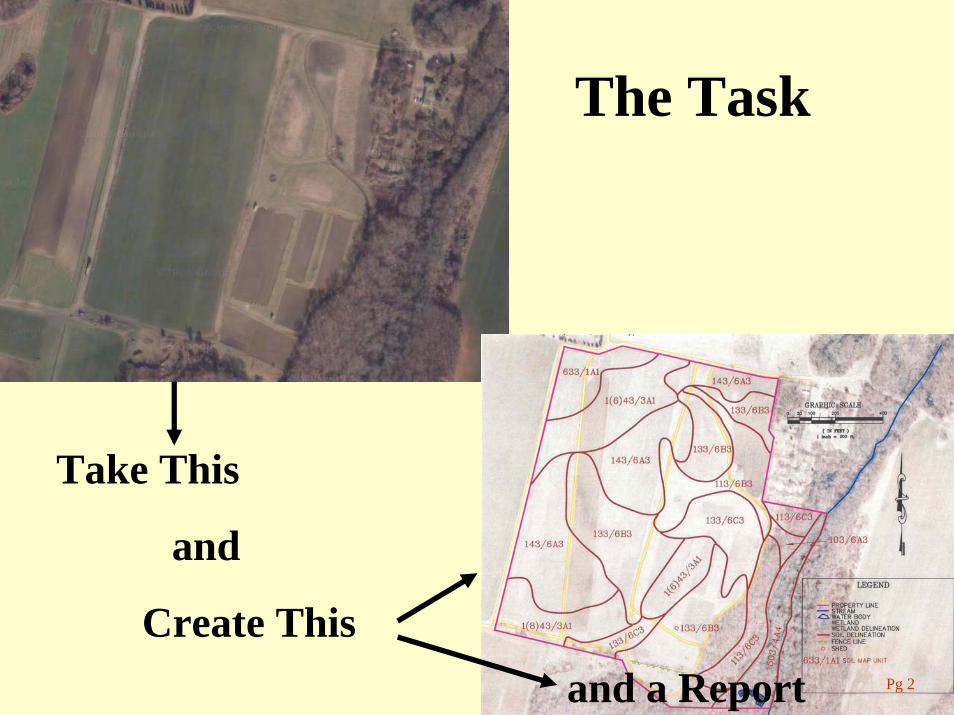
The Task
Take This
and
Create Thisand a Report Pg 2
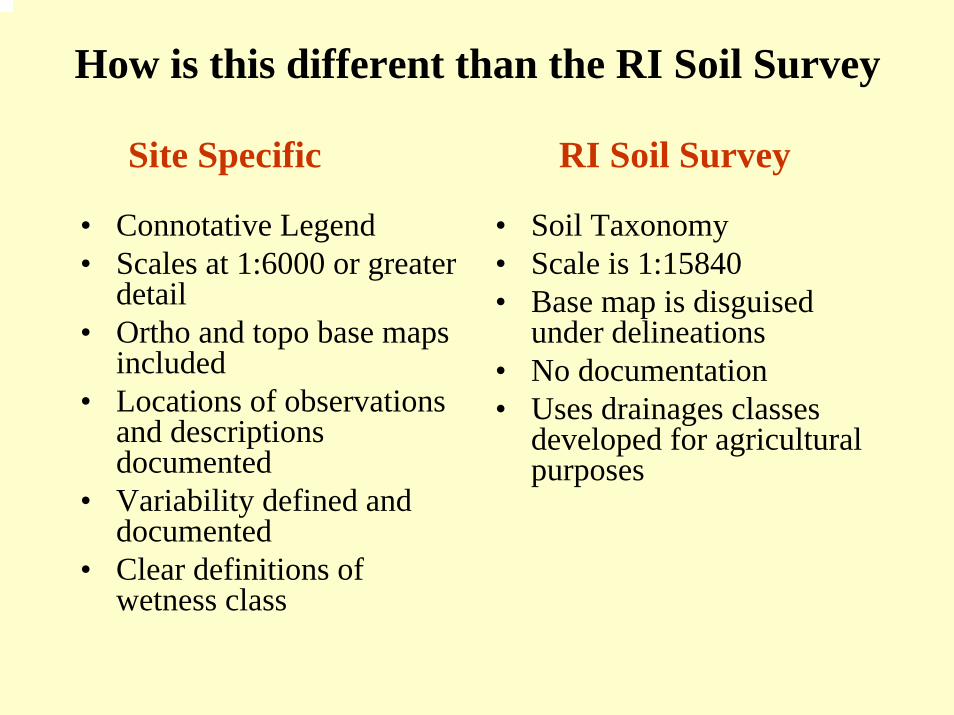
How is this different than the RI Soil Survey
• Connotative Legend• Scales at 1:6000 or greater
detail• Ortho and topo base maps
included• Locations of observations
and descriptions documented
• Variability defined and documented
• Clear definitions of wetness class
• Soil Taxonomy• Scale is 1:15840• Base map is disguised
under delineations• No documentation• Uses drainages classes
developed for agricultural purposes
Site Specific RI Soil Survey
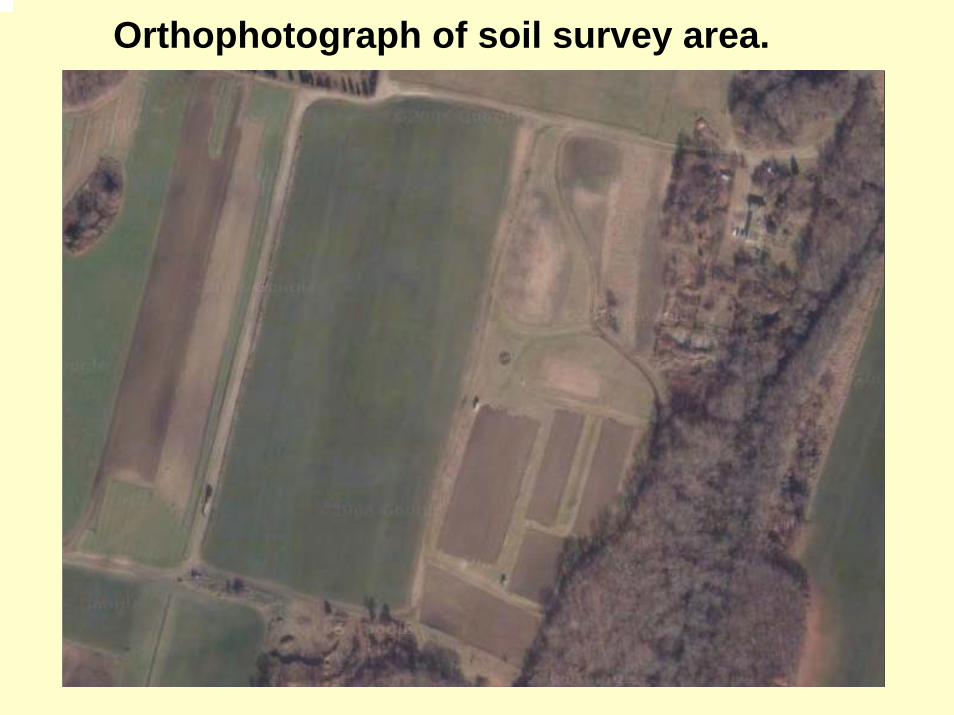
Orthophotograph of soil survey area.
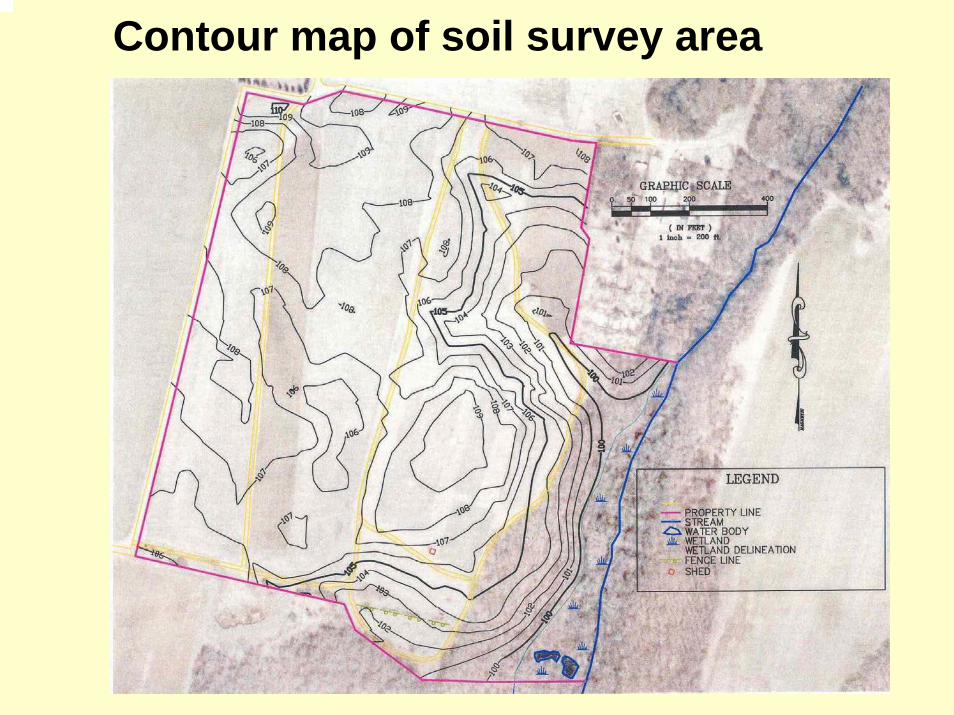
Contour map of soil survey area
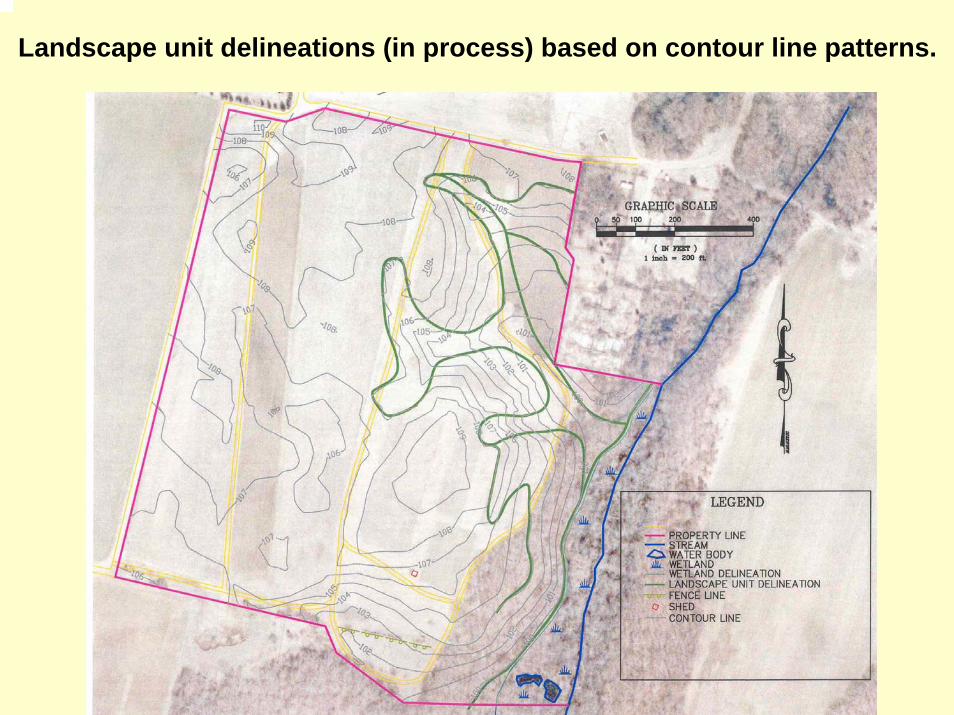
Landscape unit delineations (in process) based on contour line patterns.
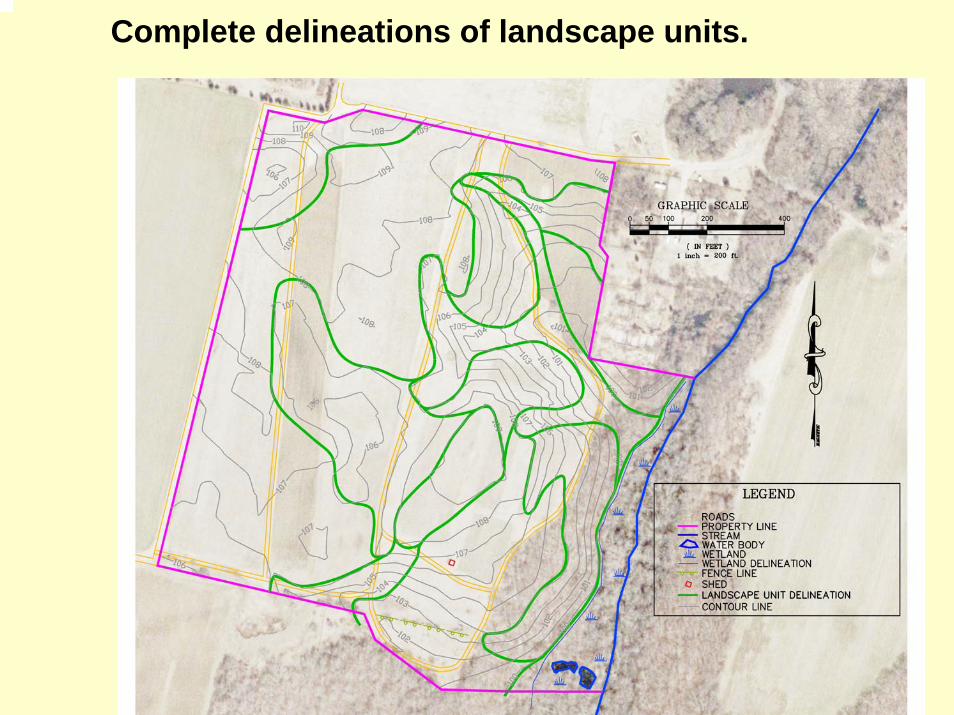
Complete delineations of landscape units.
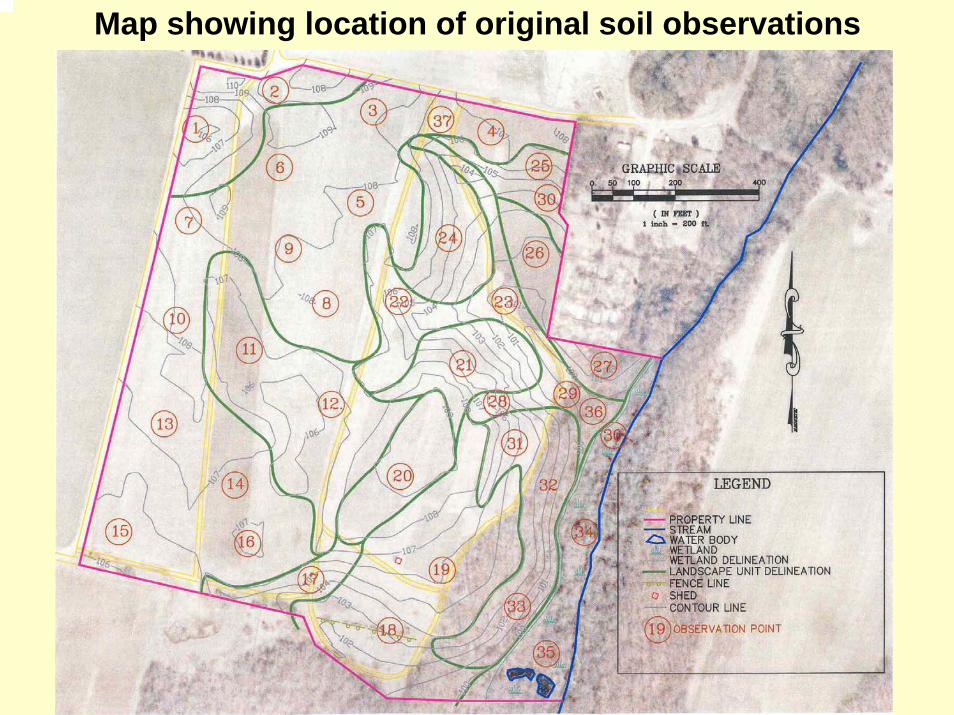
Map showing location of original soil observations
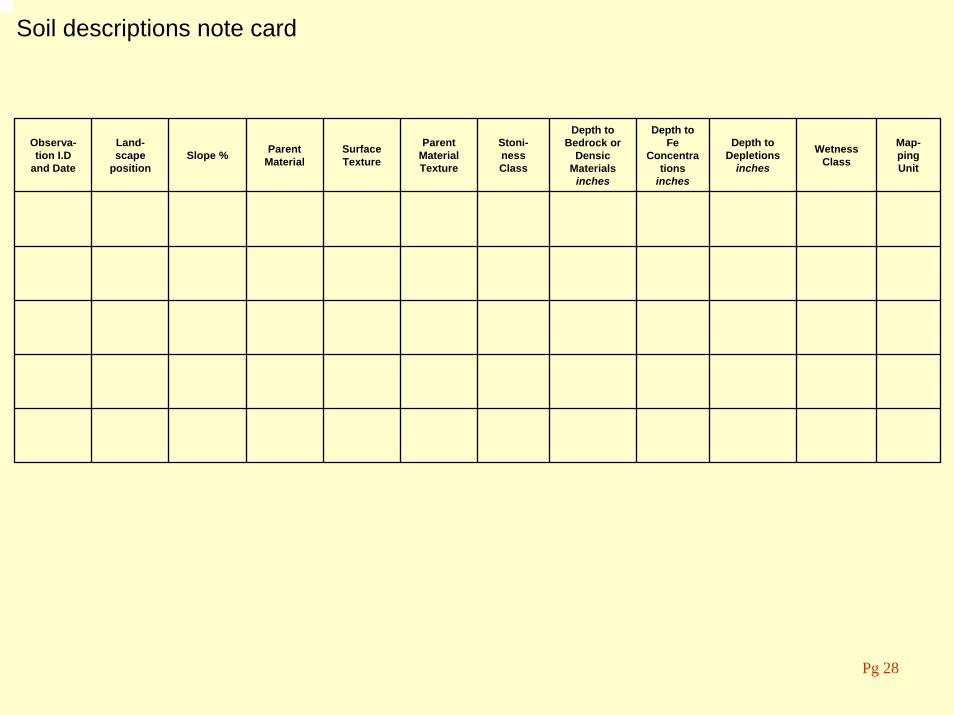
Soil descriptions note card
Observa-tion I.D
and Date
Land-scape
positionSlope % Parent
MaterialSurface Texture
Parent Material Texture
Stoni-nessClass
Depth to Bedrock or
Densic Materials
inches
Depth to Fe
Concentrations
inches
Depth toDepletions
inches
Wetness Class
Map-ping Unit
Pg 28
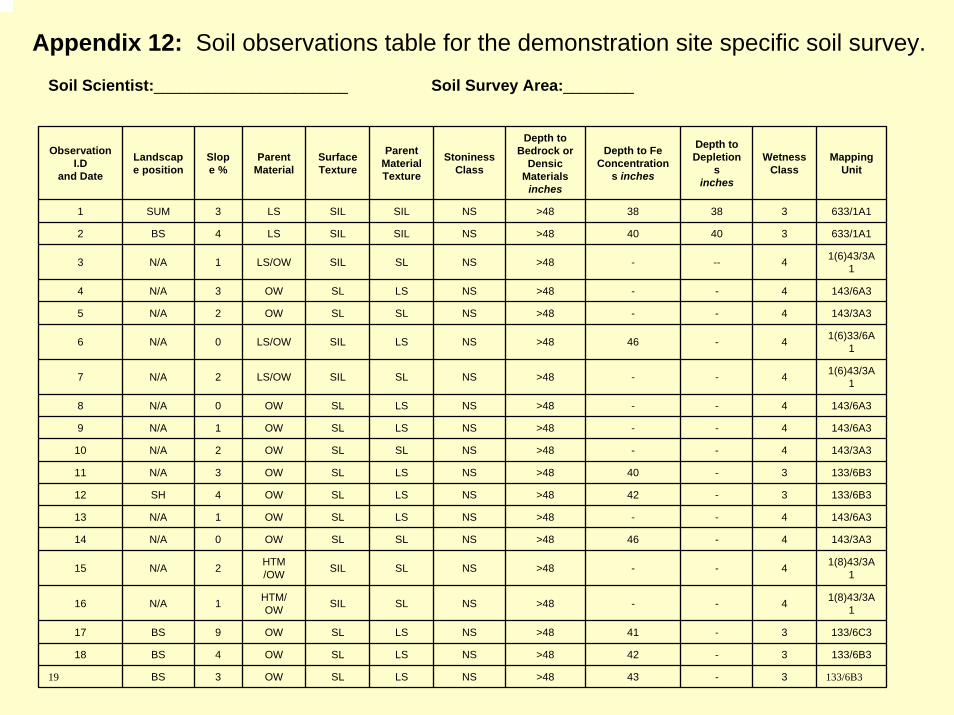
Appendix 12: Soil observations table for the demonstration site specific soil survey.
Soil Scientist:______________________ Soil Survey Area:________
Observation I.D
and Date
Landscape position
Slope %
Parent Material
Surface Texture
Parent Material Texture
StoninessClass
Depth to Bedrock or
Densic Materials
inches
Depth to Fe Concentration
s inches
Depth toDepletion
sinches
Wetness Class
Mapping Unit
1 SUM 3 LS SIL SIL NS >48 38 38 3 633/1A1
2 BS 4 LS SIL SIL NS >48 40 40 3 633/1A1
3 N/A 1 LS/OW SIL SL NS >48 - -- 4 1(6)43/3A1
4 N/A 3 OW SL LS NS >48 - - 4 143/6A3
5 N/A 2 OW SL SL NS >48 - - 4 143/3A3
6 N/A 0 LS/OW SIL LS NS >48 46 - 4 1(6)33/6A1
7 N/A 2 LS/OW SIL SL NS >48 - - 4 1(6)43/3A1
8 N/A 0 OW SL LS NS >48 - - 4 143/6A3
9 N/A 1 OW SL LS NS >48 - - 4 143/6A3
10 N/A 2 OW SL SL NS >48 - - 4 143/3A3
11 N/A 3 OW SL LS NS >48 40 - 3 133/6B3
12 SH 4 OW SL LS NS >48 42 - 3 133/6B3
13 N/A 1 OW SL LS NS >48 - - 4 143/6A3
14 N/A 0 OW SL SL NS >48 46 - 4 143/3A3
15 N/A 2 HTM/OW SIL SL NS >48 - - 4 1(8)43/3A
1
16 N/A 1 HTM/OW SIL SL NS >48 - - 4 1(8)43/3A
1
17 BS 9 OW SL LS NS >48 41 - 3 133/6C3
18 BS 4 OW SL LS NS >48 42 - 3 133/6B3
19 BS 3 OW SL LS NS >48 43 - 3 133/6B3
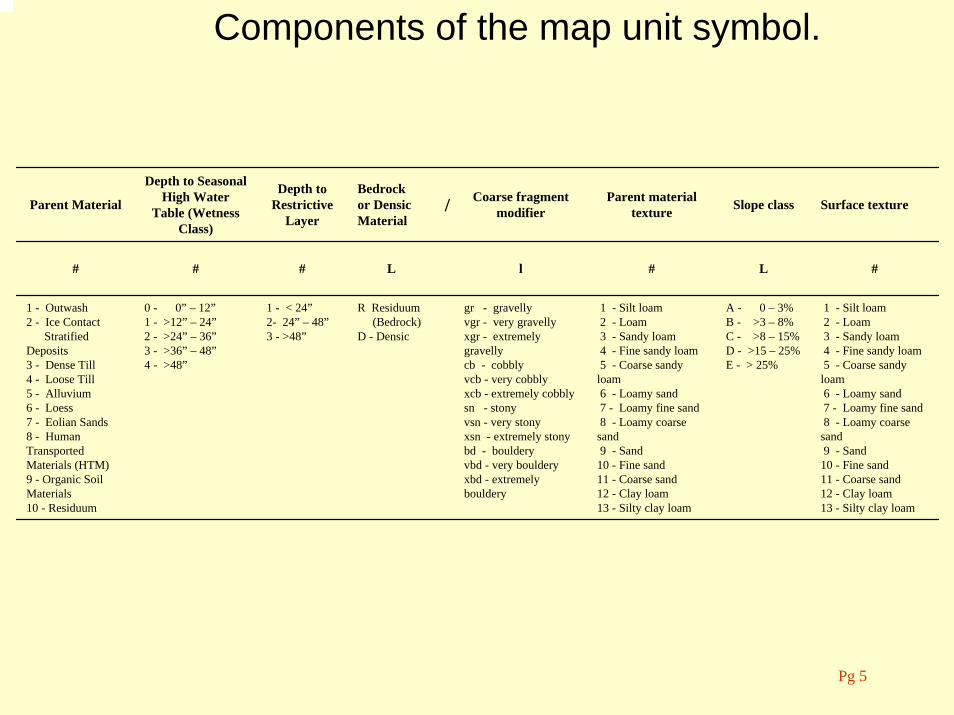
Components of the map unit symbol.
Parent Material
Depth to Seasonal High Water
Table (Wetness Class)
Depth to Restrictive
Layer
Bedrock or Densic Material
/ Coarse fragment modifier
Parent material texture Slope class Surface texture
# # # L l # L #
1 - Outwash2 - Ice Contact
Stratified Deposits3 - Dense Till4 - Loose Till5 - Alluvium6 - Loess7 - Eolian Sands8 - Human Transported Materials (HTM)9 - Organic Soil Materials10 - Residuum
0 - 0” – 12”1 - >12” – 24”2 - >24” – 36”3 - >36” – 48”4 - >48”
1 - < 24”2- 24” – 48”3 - >48”
R Residuum(Bedrock)
D - Densic
gr - gravellyvgr - very gravellyxgr - extremely gravellycb - cobblyvcb - very cobblyxcb - extremely cobblysn - stonyvsn - very stonyxsn - extremely stonybd - boulderyvbd - very boulderyxbd - extremely bouldery
1 - Silt loam2 - Loam3 - Sandy loam4 - Fine sandy loam5 - Coarse sandy
loam6 - Loamy sand7 - Loamy fine sand8 - Loamy coarse
sand9 - Sand
10 - Fine sand11 - Coarse sand12 - Clay loam13 - Silty clay loam
A - 0 – 3%B - >3 – 8%C - >8 – 15%D - >15 – 25%E - > 25%
1 - Silt loam2 - Loam3 - Sandy loam4 - Fine sandy loam5 - Coarse sandy
loam6 - Loamy sand7 - Loamy fine sand8 - Loamy coarse
sand9 - Sand
10 - Fine sand11 - Coarse sand12 - Clay loam13 - Silty clay loam
Pg 5
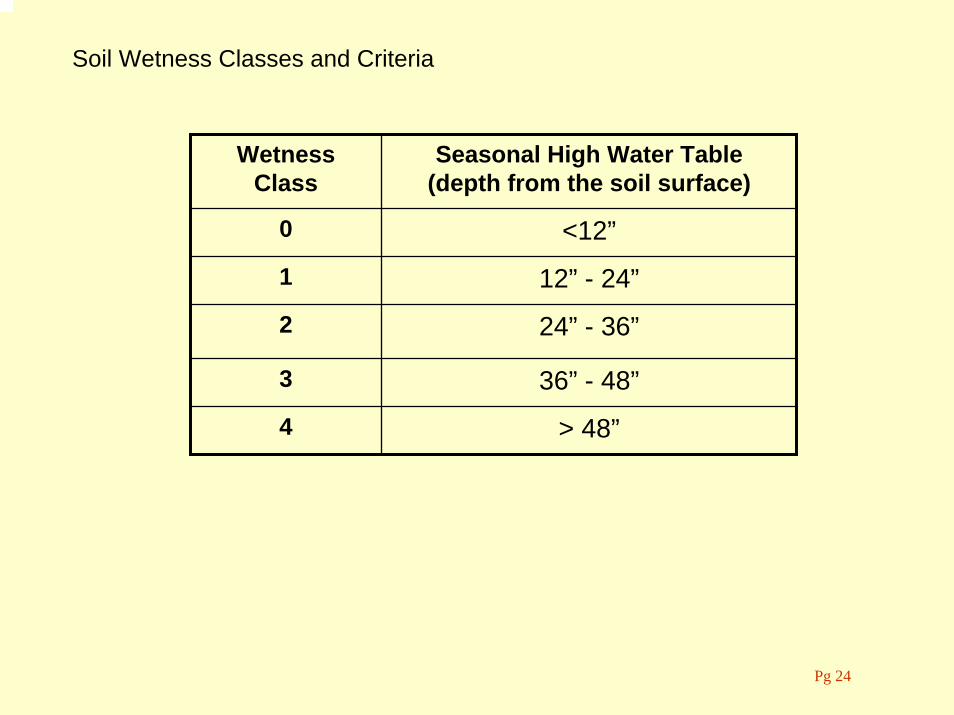
Soil Wetness Classes and Criteria
Wetness Class
Seasonal High Water Table (depth from the soil surface)
0 <12”
1 12” - 24”
2 24” - 36”
3 36” - 48”
4 > 48”
Pg 24
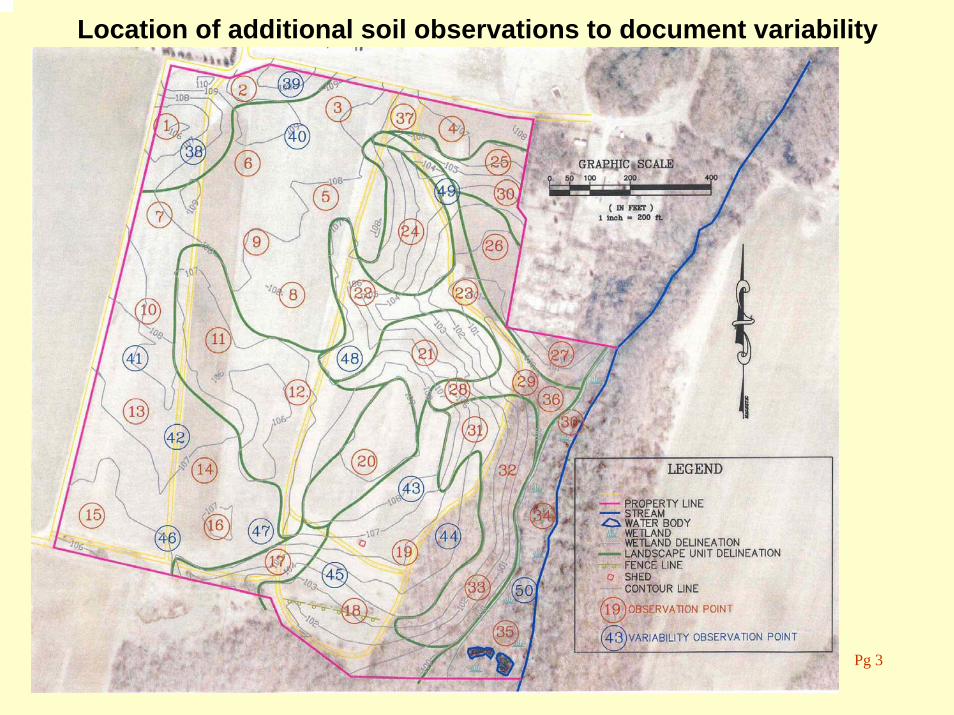
Location of additional soil observations to document variability
Pg 3
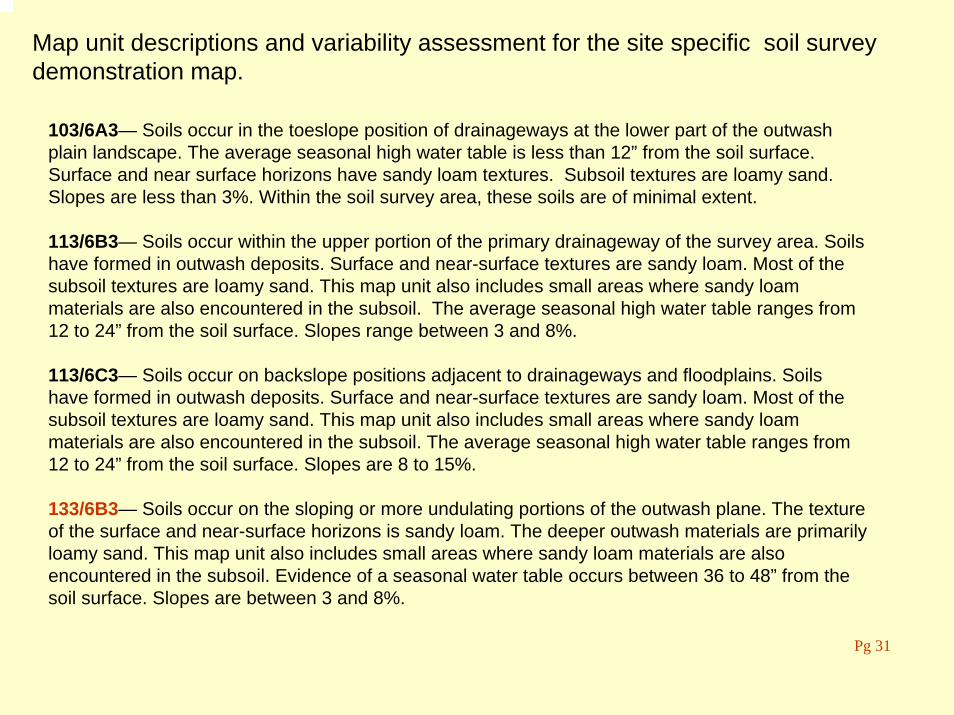
Map unit descriptions and variability assessment for the site specific soil survey demonstration map.
103/6A3— Soils occur in the toeslope position of drainageways at the lower part of the outwash plain landscape. The average seasonal high water table is less than 12” from the soil surface. Surface and near surface horizons have sandy loam textures. Subsoil textures are loamy sand. Slopes are less than 3%. Within the soil survey area, these soils are of minimal extent.
113/6B3— Soils occur within the upper portion of the primary drainageway of the survey area. Soils have formed in outwash deposits. Surface and near-surface textures are sandy loam. Most of the subsoil textures are loamy sand. This map unit also includes small areas where sandy loam materials are also encountered in the subsoil. The average seasonal high water table ranges from 12 to 24” from the soil surface. Slopes range between 3 and 8%.
113/6C3— Soils occur on backslope positions adjacent to drainageways and floodplains. Soils have formed in outwash deposits. Surface and near-surface textures are sandy loam. Most of the subsoil textures are loamy sand. This map unit also includes small areas where sandy loam materials are also encountered in the subsoil. The average seasonal high water table ranges from 12 to 24” from the soil surface. Slopes are 8 to 15%.
133/6B3— Soils occur on the sloping or more undulating portions of the outwash plane. The texture of the surface and near-surface horizons is sandy loam. The deeper outwash materials are primarily loamy sand. This map unit also includes small areas where sandy loam materials are also encountered in the subsoil. Evidence of a seasonal water table occurs between 36 to 48” from the soil surface. Slopes are between 3 and 8%.
Pg 31
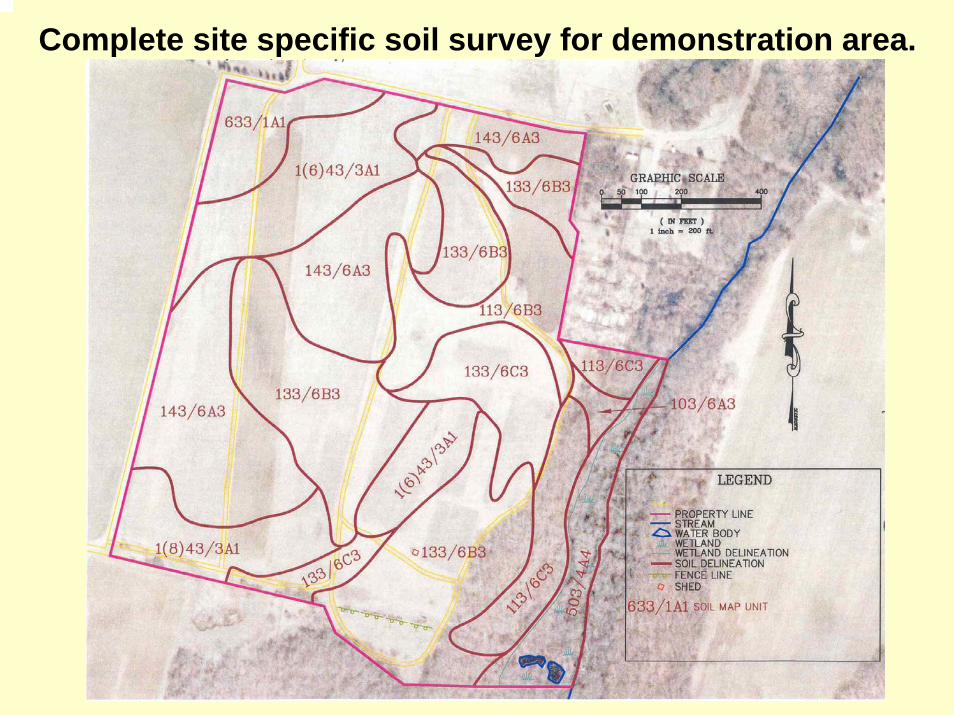
Complete site specific soil survey for demonstration area.