field standard operating procedures - university of...
TRANSCRIPT
Field Standard Operating Procedures University of Rhode Island Watershed Watch
Date: Revision: Author:
3/05 1 Linda Green
Description Field SOP Number
Safety First 001
Where We Monitor: Pin-Pointing Your Monitoring Location 002
Monitoring Postcard Instructions 003
Handling and Transporting Water Samples 004
Secchi Depth Transparency 005
Water Temperature 006
Chlorophyll (Algae) And Nutrients 007
Bacterial Monitoring 008
Collecting Unfiltered Water Samples 009
Dissolved Oxygen Monitoring 010
Shallow Water Sampler Operation 011
Deep Water Sampler Operation 012
Monitoring Salinity 013
Field Standard Operating Procedure List S:\WW\awwword\LABPROC\all QAPPs\FieldQAPP-05\Appendicies\NewFieldSOPS\SOP-List.doc

SAFETY FIRST! (Field SOP 001)
University of Rhode Island Watershed Watch
Date: Revision: Author:
3/05 1 Linda Green
Being a Watershed Watch volunteer usually involves going out on the water. It also may involve using chemical reagents to perform water quality tests. Here are some simple rules to follow. Remember that your safety is far more important than any monitoring data. When getting ready to go on the water:
Familiarize yourself with all monitoring instructions before you go on the water. Have a personal flotation device on board for each person. Wear it! If your boat has a motor, bring along oars too! Have an anchor with an attached anchor line on board. Bring along a supply of drinking water, especially in the summer. Stay off the water if high winds, a storm, or lightning is expected soon or has started. If at all possible, monitor with a partner. The old adage about “safety in numbers” applies
here. (Having a partner helps improve quality data collection, too.) Watch out for other boats on busy days – especially those towing water-skiers! Stay off the water if you do not feel well.
When using monitoring kits:
Familiarize yourself with all instructions. Follow the instructions step-by step, in the order written. Keep a supply of paper towels, some dampened, on hand to quickly mop up spills. Wear glasses or goggles and gloves when using reagent chemicals. Avoid contact between reagent chemicals and your skin, eyes, nose, mouth. If you spill anything on yourself, immediately flush thoroughly with lots of water. It is
perfectly acceptable to use nearby lake or stream water – do NOT wait until you get home or to a faucet!
Use stoppers or bottle caps, not your fingers or hands, to cover bottles during shaking or mixing.
Rinse and wipe up any regent chemical spills, liquids, or powder as they occur. Thoroughly rinse all your testing apparatus with tap water after use. Thoroughly rinse your hands after performing your tests, even if you wore gloves. Keep equipment and reagent chemicals out of sunlight, extreme heat or cold (such as car
trunks), or moist areas (such as under sinks.) Keep all equipment and supplies away from children, just like you would household cleaning
products.
If you have any questions or concerns call URI Watershed Watch (401)-874-2905
Safety First Field SOP 001 S:\WW\awwword\LABPROC\all QAPPs\FieldQAPP-05\Appendicies\NewFieldSOPS\Safety001.doc 1 of 1
WHERE WE MONITOR:
PIN-POINTING YOUR MONITORING LOCATION
(Field SOP 002)
University of Rhode Island Watershed Watch
Date: Revision: Author:
3/05 1 Linda Green
All URI Watershed Watch volunteers monitor a particular lake or pond for an entire monitoring season. The lakes and ponds range from less than ten to hundreds of acres in size. Water quality monitoring is done at the deepest part of each water body. We have several ways of determining where the deepest spot is. For many of our locations we rely on maps found in Fisheries Investigations and Management in Rhode Island Lakes and Ponds, by Richard Guthrie and John A. Stolgitis, available from the Rhode Island Division of Fish and Wildlife. This book contains bathymetric maps, which are maps of the bottom contours of lakes and ponds. The contours have three-foot intervals. For locations not in this book we rely on United States Geological Survey (USGS) topographic maps. Unfortunately those maps don’t show bottom contours. What we rely on most is your knowledge of your particular monitoring location. Supplies:
boat, anchor, personal flotation device map, clipboard, pencil Secchi disk
Directions: 1. Bring your map to your lake and orient yourself. Mark your starting location (dock, launch
ramp, etc.) on the map.
2. Go out to where you think the deepest spot is.
3. Check the depth to the bottom using your Secchi disk.
4. Try some nearby areas, marking the bottom depths on your map. It may take you some time to find the deepest spot.
5. When you find the deepest spot, anchor your boat and take a look around.
6. Facing forward in your boat, what distinguishing landmarks do you see in front of you, in back of you, to your left and right? You will use these landmarks to locate your spot every time you monitor.
7. Mark down these landmarks on your map. Write them down on a separate piece of paper.
Think about how you would explain your location to someone who isn’t as familiar with the spot as you are. This is very important, both for future monitoring efforts and for supplementary monitoring by water quality professionals.
Where We Monitor: Pin-Pointing Your Monitoring Location Field SOP 002 S:\WW\awwword\LABPROC\all QAPPs\FieldQAPP-05\Appendicies\NewFieldSOPS\Location002.doc 1 of 1

MONITORING POSTCARD
INSTRUCTIONS (Field SOP 003)
University of Rhode Island Watershed Watch
Date: Revision: Author:
3/05 1 Linda Green
At the bottom of this page is a copy of the monitoring postcard. Please fill one out each time you do your water quality monitoring. The postcards are pre-stamped. Please be sure to mail it to us right away. Also, remember to record data on the Watershed Watch Field Data Sheet in your Monitoring Manual. It will be invaluable in case any postcards are lost.
Often monitors forget to write their name, their location, and/or the date. Without this information we cannot record and use your valuable data. Please check over your postcard before you mail it to be sure you have included everything needed.
Note that “Salinity” is only applicable to sites that are influenced by the ocean such as the Narrow River, Salt Ponds, estuaries and Narragansett Bay. If “Salinity” is not determined at your site write “N/A” or Not Applicable in this area of the postcard. Codes for “Light”, “Wind” and “State of Tide” are described below under “Codes for Environmental Conditions”.
Please read the monitoring postcard carefully. Some additional information is requested from certain monitors or groups and would have been described during your training. If you still have questions, call us at 401-874-2905. Example of a Monitoring Postcard filled out for a freshwater pond site: LOCATION: Easy Pond MONITOR(S): Monica Monitor DATE MONITORED: 07/04/05 TIME: 08:45 (mo/day/yr) (military) SECCHI DEPTH (measure 4 times):
4.0 4.0 4.1 3.9 meters
Depth to bottom is ___6.0__ meters. Is Secchi visible on bottom? yes or no CHLOROPHYLL SAMPLES: FILTERED and FROZEN: yes or no Record actual depth DEPTH MONITORED (meters) Surface 1 meter 5.5 m deep 5.5 m deep WATER TEMPERATURE (deg. C) 27 26 19 19
DISSOLVED OXYGEN (mg/L) (Measure twice at each depth)
N/A 10.0 10.0
8.0¦8.2 ¦
7.8¦8.0 ¦
SALINITY (ppt) N/A NA NA NA
(for below, circle best description, see monitoring manual for details) LIGHT: 1= Distinct shadows 2= No shadows 3= Very overcast WIND: 0= Calm 1= Light 2= Gentle 3= Moderate 4= Strong RAIN W/IN 48 Hrs. 1= None 2= Light 3= Moderate 4= Heavy -------------------------------------------------------------------------------------------------------------------------------------------------------
STATE OF TIDE: EBB ____ FLOOD ____ HIGH ____ LOW ____ N/A _X___
Fill out this section if you are sampling salty waters. Use “NA” if you are sampling fresh water.
Monitoring Postcard Instructions Field SOP 003 S:\WW\awwword\LABPROC\all QAPPs\FieldQAPP-05\Appendicies\NewFieldSOPS\Postcard-SOP003.doc 1 of 2

CODES FOR ENVIRONMENTAL CONDITIONS These codes describe environmental conditions when you are monitoring. Please enter the code number that best describes the conditions on your monitoring postcard. Light conditions:
Code Number Description
1 Bright, distinct shadows
2 Cloudy-bright, no shadows
3 Heavily overcast Wind speed:
Code Number Wind Velocity (mph)
Weather Term Condition of Water surface
0 0 Calm Completely calm
1 1 - 7 Light Smooth or rippled to small wavelets
2 8 - 11 Gentle Large wavelets, crests begin to break, few whitecaps
3 12 - 16 Moderate Small waves, frequent whitecaps
4 17 - 24 Fresh Moderate crested waves, many whitecaps
5 25 - 35 Strong Large waves, white foam crests
everywhere, wind blown spray – too dangerous for monitoring!!!
State of Tide:
State of Tide Description EBB Tide is flowing OUT toward the ocean
FLOOD Tide is flowing IN toward land
HIGH At high tide
LOW At low tide
N/A None of the above apply (site is inland and not connected to the ocean)
Monitoring Postcard Instructions Field SOP 003 S:\WW\awwword\LABPROC\all QAPPs\FieldQAPP-05\Appendicies\NewFieldSOPS\Postcard-SOP003.doc 2 of 2

HANDLING AND TRANSPORTING
WATER SAMPLES (Field SOP 004)
University of Rhode Island Watershed Watch
Date: Revision: Author:
3/05 1 Linda Green
How you handle your water samples once they are out of the water is extremely important in ensuring that the results of what you test truly reflect the condition of the water. Sunlight and warm air temperatures can dramatically affect your samples. Here are some important points for transporting your water samples: Before you go on the water:
Bring a cooler/bag and a cold pack with you for chlorophyll monitoring and on water collection days.
Have a zip lock bag and a separate cold pack on shore to store your chlorophyll filters in. On hot, sunny days store your deep water sampler in the cooler/bag while you are on
your way out to your monitoring site. The dark grey plastic of the sampler absorbs heat readily, which can raise the temperature of the water inside it if not kept cool.
On the water, after you collect your water samples:
Check the water temperature of one sample and then… Immediately put your two chlorophyll bottles in the cooler/bag. It is a good practice to store your dissolved oxygen bottles in the cooler/bag too! If you forget your cooler/bag at least store your water samples out of the direct sunlight.
On-shore: Find some shade! Chlorophyll filtering must be done out of direct sunlight if outside and
in subdued light if indoors. Keep the processed filters cold! If you filter your samples at home put the filters right in
the freezer when you are done. If you aren’t home, put the filters in a zip lock bag next to a cold pack. Do not store the filters directly on ice.
Water samples should be stored in your refrigerator until you are ready to bring them to the URI Watershed Watch laboratory.
Bringing your water samples and chlorophyll filters to the lab: Keep ‘em cold! Use an insulated cooler/bag with cold packs or ice. If you choose to use
ice, please put the ice in its own zip lock bag or put your water bottles in a bag so that the melting ice doesn’t cause the labels to slip off your bottles.
Please put your bag of chlorophyll filters right next to a cold pack. Either put the pack inside the zip lock bag with your filters or use a rubber band to keep the chlorophyll bag right next to the cold pack.
Handling and Transporting Water Samples Field SOP 004 S:\WW\awwword\LABPROC\all QAPPs\FieldQAPP-05\Appendicies\NewFieldSOPS\SampleTransport-SOP004.doc 1 of 1

SECCHI DEPTH TRANSPARENCY
(Field SOP 005)
University of Rhode Island Watershed Watch
Date: Revision: Author:
3/05 1 Linda Green
1. Make your measurements between 10 AM and 2 PM, preferably at the same
time, each time you go out.
2. Position your boat over the deepest point in your pond and anchor it. 3. Secchi depth measurements are taken with the aid of a view tube. 4. Make your measurements from the sunny side of the boat. Wear your regular
prescription glasses, but not sunglasses.
5. Hold the view tube vertically by the handle so that it extends into the water about 4 inches.
6. Using your free hand, lower the Secchi disk slowly until it just disappears from sight.
7. At this point mark where your line meets the water with a clothespin. This is the descending Secchi depth transparency.
8. Now, lower your line a few feet more, then slowly raise it. When you can just make out the Secchi disk, mark the line with another clothespin. This is the ascending Secchi depth transparency.
9. Bring your disk back on board your boat.
10. The line attached to your Secchi disk is marked at each meter. Some volunteers have a line that is made of engineering tape which is already marked in meters and tenth’s of meters. (1 meter = 3 1/4 feet).
11. Measure the distance to each clothespin from the Secchi disk. Estimate the distance to the nearest 1/10 meter. Record your measurements in your field note pad, using a pencil. (Pencils write when wet, pens usually don’t).
12. After any other monitoring procedures are competed, make a second set of Secchi depth transparency measurements following Steps 4-11. Record those too.
13. After all monitoring procedures are completed determine bottom depth by dropping the Secchi disk all the way to the bottom of the pond. It is important to do this last because when the Secchi disk hits the bottom it will stir up sediment.
14. When you are back on shore, transfer your readings and other appropriate monitoring information to the pre-stamped postcard and drop it a mailbox as soon as possible. Postcards should be mailed weekly, not just when biweekly chlorophyll filtering is done.
PLEEEZE remember to put your monitoring location, your name, date and time on your monitoring postcard. We can’t use your data if we don’t know from where and when it came!
Secchi Disk Transparency Field SOP 005 S:\WW\awwword\LABPROC\all QAPPs\FieldQAPP-05\Appendicies\NewFieldSOPS\SecchiDisk-SOP005.doc 1 of 1
WATER TEMPERATURE (Field SOP 006)
University of Rhode Island Watershed Watch
Date: Revision: Author:
3/05 1 Linda Green
General Points to remember:
Keep your water samples out of direct sunlight. Preferably measure water temperature while on the water, using the water sample collected
in one of the plastic chlorophyll bottles. Using Spirit-filled Thermometers:
Your thermometer has a clear plastic cover. That cover does not need to be removed before use. If you notice that water is not getting inside the cover, loosen it a bit. (You can also remove the cover, heat a pin over a flame and push it through the plastic cover to create a vent hole.)
Take your temperature reading while the bulb of the thermometer is still in the water. The thermometer will respond very quickly to temperature changes.
The thermometer does not need to be completely submerged to take a reading. The thermometers we use measure temperature in degrees Celsius. On the next page is a
conversion chart to Fahrenheit. It is best to store the thermometer upright.
Using Electronic (yellow lollipop) Thermometers:
This thermometer can accidentally be turned on if the on/off button hits other equipment in your monitoring supply bag – so please be careful to check it before storing your supplies between sampling trips (the batteries will not last long if left on.)
To operate the thermometer, press the on/off button. Once the thermometer is on, check to be sure the instrument is reading in degrees
centigrade (oC), if not press the oF/ oC button. URI Watershed Watch records temperature in oC.
Remove the plastic cover from the stem of the thermometer and insert it into the sample bottle to make a temperature reading. Only the metal stem need be submerged to obtain a temperature reading.
(continued on next page)
Water Temperature Field SOP 006 S:\WW\awwword\LABPROC\all QAPPs\FieldQAPP-05\Appendicies\NewFieldSOPS\Temperature-SOP006.doc 1 of 3

To Determine Water Temperature from Shallow Lake, Pond and River Locations: 1. Put the thermometer into the water sample contained in the plastic chlorophyll bottle.
2. Read and record the temperature on your Monitoring Postcard and Field Data Sheet, once the thermometer has stabilized. This usually takes a minute or two.
To Determine Water Temperature from Deep Lake and Pond Locations: 1. There is a place inside the clear LaMotte deep water sampler for your spirit-thermometer.
2. Put the spirit-thermometer in the sampler before you collect your water sample. Position it so that you can read the thermometer without taking it out.
3. If you are collecting water for dissolved oxygen as well as temperature, please read the water temperature after you have capped the dissolved oxygen bottle.
4. Record water temperature for both 1 meter and deep sample depths on your Monitoring Postcard and Field Data Sheet. The temperature at the 1 meter depth can be taken from the water sample in the plastic chlorophyll bottle (filled from a depth of 1 meter).
Optional surface water temperature measurements: In certain years URI Watershed Watch volunteers measure surface water temperature. You will be given a small plastic bottle to collect a water sample from a depth of approximately 6 inches. You will measure the water temperature of that sample as indicated in Steps 1-2 under “To Determine Water Temperature from Shallow Lake, Pond and River Locations”, recording the temperature on your monitoring postcard where indicated.
(continued on next page)
Water Temperature Field SOP 006 S:\WW\awwword\LABPROC\all QAPPs\FieldQAPP-05\Appendicies\NewFieldSOPS\Temperature-SOP006.doc 2 of 3

Comparison of Celsius and Fahrenheit Temperatures
Celsius Temperature (ºC)
Fahrenheit Temperature (ºF)
0 32.0 1 33.8 2 35.6 3 37.4 4 39.2 5 41.0 6 42.8 7 44.6 8 46.4 9 48.2
10 50.0 11 51.8 12 53.6 13 55.4 14 57.2 15 59.0 16 60.8 17 62.6 18 64.4 19 66.2 20 68.0 21 69.8 22 71.6 23 73.4 24 75.2 25 77.0 26 78.8 27 80.6 28 82.4 29 84.2 30 86.0 31 87.8 32 89.6 33 91.4 34 93.2 35 95.0
Water Temperature Field SOP 006 S:\WW\awwword\LABPROC\all QAPPs\FieldQAPP-05\Appendicies\NewFieldSOPS\Temperature-SOP006.doc 3 of 3

CHLOROPHYLL (ALGAE) AND
DISSOLVED NUTRIENTS (Field SOP 007)
University of Rhode Island Watershed Watch
Date: Revision: Author:
3/05 1 Linda Green
Equipment Insulated cooler/bag with freezer pack 2 white lidded plastic bottles (labeled for chlorophyll) of sample water
Chlorophyll filtering apparatus: 60 mL plastic syringe, marked at 50 mL 2 round white plastic filter holders Small glass fiber filters (stored in 35 mm film canister) Wrapping paper, coffee filters or paper toweling (provided by you) Tweezers or large safety pin 4" squares of aluminum foil (your own) Sheet of chlorophyll labels Squeeze bottle containing magnesium carbonate (MgCO3) Re-sealable plastic bag containing blue or orange desiccant chips Brown glass bottle with a yellow label "filtered" (for collection of nutrient sample when
necessary) Getting Started… Measuring chlorophyll tells us how much algae are in your water. Sample collection and filtering for chlorophyll is done on water from a depth of 1 meter (approximately 3.25 ft). Remember, it is very important to keep the water samples in an insulated cooler/bag and out of the light until you are ready to begin the chlorophyll filtration. If you are doing this on a scheduled water collection day, you will save your filtered water, if not you can discard it.
1. Before you go out on the water, on shore and out of direct sunlight, set out your filtering apparatus, making sure you have everything you need, including paper toweling for wrapping filters, aluminum foil for sealing them and labels for them.
2. Collect two separate 1 meter water samples using your water sampler. After rinsing your plastic chlorophyll bottle with water from the sampler, fill the first bottle with your first sample and the second bottle with your second sample. Cap the bottles, and put them into your insulated cooler/bag. They must be kept out of sunlight.
3. Finish your other monitoring activities and return to shore.
(continued on next page)
Chlorophyll (Alage) and Dissolved Nutrients Field SOP 007
S:\WW\awwword\LABPROC\all QAPPs\FieldQAPP-05\Appendicies\NewFieldSOPS\CHLA&Nuts-SOP007a.doc
1 of 3

Rinse and prepare the syringe. 4. Thoroughly shake one of the plastic bottles containing your water sample. 5. Using your syringe, draw up approximately 20 mL of water from the bottle into the
syringe. 6. Rinse the syringe by pushing the water back and forth using the syringe plunger or by
shaking the syringe. 7. Then, push the water out of the syringe. The syringe is now rinsed. 8. Take apart your syringe by pulling the plunger all the way out.
Prepare the filtering apparatus (out of direct sunlight):
9. Open one round white filter holder assembly.
10. Using tweezers, remove 1 small filter circle from its container (35 mm film canister).
11. Put the filter circle in the filter holder. • Handle the filter circle with your tweezers, not your fingers. • Center the filter circle rough side up, gridded side down, on the metal screen on
the bottom of the filter assembly. • Place the black rubber gasket on top of the filter and • screw the filter holder back together.
12. Attach the round white filter holder to the syringe by twisting it on. You will see that there is only one way in which it will fit.
Filter your water sample. 13. Cap your sample bottle and shake well again. 14. Hold the syringe with filter holder facing down. 15. Pour your water sample into the syringe up to the 50 mL line marked on the syringe. 16. Shake the flip top bottle of magnesium carbonate. Squeeze four drops of magnesium
carbonate into the water sample in the syringe. 17. Attach the syringe plunger and slowly push the water through the filter apparatus with
even pressure. Take your time! 18. (Usually you will discard the filtered water. If you are collecting a sample for
nutrients save the filtered water in the brown glass or plastic bottle with the yellow “filtered”. Use some of the first bit of filtered water to rinse the bottle. Then collect about half of the remaining filtered water.)
CAUTION: On some lakes with intense algal blooms the algae will completely clog the filter before you have filtered all 50 mL of water. You should not have to push with all your strength to filter the water sample. If this is the case or if you see water drops coming out from between the top and bottom of the white plastic filter holder the filter has become clogged (either with algae or sediment.) You must start over with a fresh filter and water sample. Use less water, say 25 mL, and record the amount used on your postcard and on the filter label itself. The amount of water filtered should be the same for all four filters in the aluminum foil packet. If the volumes are different, then package the filters separately with labels indicating the volume filtered.
Chlorophyll (Alage) and Dissolved Nutrients Field SOP 007 S:\WW\awwword\LABPROC\all QAPPs\FieldQAPP-05\Appendicies\NewFieldSOPS\CHLA&Nuts-SOP007a.doc
2 of 3

After you have filtered a water sample. 19. Take the filter holder off the syringe. 20. Unscrew the two halves. Using tweezers lift out the black rubber gasket.
21. Again using tweezers (or the tip of a large safety pin), lift out the filter circle by an edge.
22. Place the filter circle on a piece of blotting/wrapping paper (paper towel/coffee filter). If the filter breaks while you are removing it, try to get all the pieces onto the blotting/wrapping filter paper.
23. Fold the filter in half with the rough sides together. BE SURE TO FOLD THE FILTER SO THAT THE CHLOROPHYLL SAMPLE IS ON THE INSIDE – your filter will be a half circle, like pita bread! Wrap the blotting/wrapping paper over the filter.
24. Place the folded filter paper on a piece of aluminum foil. Cover it loosely with foil.
Filter three more water samples. 25. Shake your first water sample in the white plastic bottle again. Repeat steps 9 – 24 to
filter a second sample of water from the first chlorophyll bottle. 26. Then repeat these steps twice with the water from the second chlorophyll sample
bottle.
bYou will have filtered a total of 4 samples of water!
Finish processing the four filter circles. 27. Securely fold a piece of aluminum foil around the four filters.
28. Attach a chlorophyll label, filling in your name, the date, the amount of water you filtered, and the number of filters in the foil packet.
29. Place the aluminum foil packet in the re-sealable plastic bag containing desiccant chips and then into your freezer.
Rinse the filtering apparatus & fill out your postcard. 30. Take apart the syringe and filter assembly.
• Rinse all apparatus with tap water - DO NOT USE DETERGENTS. • Place upside down on a paper towel to dry. Reassemble loosely when dry.
31. Circle “Yes” on your Monitoring Postcard in the section: “CHLOROPHYLL SAMPLES: FILTERED and FROZEN: yes or no.
Only on water collection days: 32. Save the filtered water in the brown or plastic bottle with the yellow “filtered”
label. 33. Add the filtered water from second, third and fourth chlorophyll samples to that from the
first sample. You will have more than enough water to rinse and fill your bottle. We use this water to test for nitrate-N, ammonia-N, dissolved phosphorus, and chloride.
Chlorophyll (Alage) and Dissolved Nutrients Field SOP 007
S:\WW\awwword\LABPROC\all QAPPs\FieldQAPP-05\Appendicies\NewFieldSOPS\CHLA&Nuts-SOP007a.doc
3 of 3

BACTERIAL MONITORING
(Field SOP 008)
University of Rhode Island Watershed Watch
Date: Revision: Author:
3/05 1 Linda Green
In bacterial monitoring maintaining sterility is essential, because bacteria are everywhere! All the sample bottles have been sterilized. They have a piece of tape with the word ”sterile” across the bottle cap. Since bacteria are everywhere – in the air, in the water, on our skin and on the outside of the sample bottles, it is important to avoid getting anything in the sample bottle, on the mouth of the bottle, or inside the lid except the water sample you are collecting. Bacterial samples are collected at the same monitoring location as the rest of your samples. However the sample is collected at arm’s length using your arm, not any water sampler. DO NOT REMOVE THE TAPE FROM THE LID UNTIL YOU ARE ABOUT TO COLLECT YOUR
SAMPLE.
1. Roll the sleeve on your sampling arm up as close to your shoulder as possible. 2. When you are ready to sample, remove the “sterile” tape from the bottle cap and place it on
the side of the bottle, as shown below.
STER
STERI
3. Take the cap off the sample bottle. Be careful not to touch the inside of the cap or the rim of the bottle. Hold the lid in your other hand. Don’t put the lid down on the seat of your boat.
4. Grasp the middle of the bottle with your sampling arm.
5. Holding the bottle upside down, push the bottle as far down into the water as you can reach. Turn the bottle up and scoop it forward and up out of the water. Do this in one sweeping motion. Make sure you sample forward and away from you so that there is no chance that you will contaminate the sample with bacteria from your arm. The figure below shows this motion.
Scoop Forward and Up
6. Pour off water in the bottle so the water level in the bottle is at the bottle neck. This provides necessary space for mixing.
7. Cap the bottle. Store the bottle in your cooler with ice or an ice pack. 8. Bring your water sample to the URI Watershed Watch laboratory as soon as possible.
Bacterial Monitoring Field SOP 008 S:\WW\awwword\LABPROC\all QAPPs\FieldQAPP-05\Appendicies\NewFieldSOPS\Bacteria-SOP008.doc
1 of 1

COLLECTING UNFILTERED
WATER SAMPLES (Field SOP 009)
University of Rhode Island Watershed Watch
Date: Revision: Author:
11/04 1 Linda Green
Unfiltered water samples are collected for pH, alkalinity, total phosphorus and total nitrogen, from both deep and shallow water depths. We collect water samples in plastic bottles for pH and alkalinity and in glass bottles for total phosphorus and nitrogen.
1. Collect a shallow water sample using the shallow water sampler (see Shallow Water
Sampler Operation Field SOP 011) or a deep water sample using the deep water sampler (see Deep Water Sampler Operation Field SOP 012).
2. Un-cap and rinse the sample bottle(s) for collection of unfiltered water sample(s) with some of the collected water. Discard the water used to rinse the bottle.
3. Fill the sample bottle to within approximately 1 inch of the bottle top. This will leave an air space in the sample bottle to allow for mixing of the sample in the laboratory.
4. Cap the sample bottle and place it into your cooler. 5. Repeat the sampling procedure until all surface or deep unfiltered water sample bottles are
filled. 6. Finish your other monitoring activities and return to shore.
Collecting Unfiltered Water Samples Field SOP 009 S:\WW\awwword\LABPROC\all QAPPs\FieldQAPP-05\Appendicies\NewFieldSOPS\UnfilteredH20-SOP009.doc 1 of 1

DISSOLVED OXYGEN
MONITORING (SOP 010)
University of Rhode Island Watershed Watch
Date: Revision: Author:
3/05 1 Linda Green
The most common deep-water sampler URI Watershed Watch uses is the LaMotte #3-0026 water sampler. Detailed instructions for this water sampler are in Deep Water Sampler Operation Field Standard Operating Procedure (SOP) 012. Briefly: 1. Remove the cap of a glass dissolved oxygen bottle and place it in the sampler. 2. Put the lid on the sampler making sure the inlet tube on the sampler lid goes into the glass
bottle. 3. Put the black plug firmly into the hole in the top of the sampler lid. 4. Lower the sampler to the desired depth. 5. Jerk sharply on the sampler line to pop the plug out of the lid. Water flows through the inlet
tube into the glass bottle and then overflows, flushing the glass bottle a number of times before filling it and the sampler.
6. As the water fills the sampler a steady stream of air bubbles will rise to the water surface, how close to your boat depends on the water current. Sometimes you may not see them. Often they come up under the boat and you may hear them popping softly.
7. Wait at least five minutes before bringing your sampler to the surface or until there are no more bubbles.
8. After the sampler is taken out of the water you can do one of two things. You can cap the glass bottle and then remove it from the sampler. Alternatively and preferably, if no other sample is being taken re-insert the plug and keep the lid on the water sampler, leaving the dissolved oxygen bottle right in the sampler until you get to shore and are ready to start the dissolved oxygen tests.
9. Remember to read the thermometer right away when you pull your deep water sampler onto the boat. More information on how to collect temperature samples is found in the “Water Temperature” procedure (SOP 006).
The most important first step is to make sure your dissolved oxygen bottle is filled to the brim and that there are no air bubbles. When obtaining water samples for dissolved oxygen measurement you must be very careful to minimize contact of the water sample with air. While our lake water samples will typically contain 0-12 ppm oxygen, the air we breathe contains about 210,000 ppm oxygen. This is especially important with deep samples since deep water can become depleted of much of its oxygen during the summer. If you are collecting both a shallow and deep water sample, collect the deep water sample after collecting the 1 meter water sample. This way the deep water sample does not sit in the boat as long, decreasing the chances of introducing oxygen into the deep samples.
Dissolved Oxygen Field SOP 010 S:\WW\awwword\LABPROC\all QAPPs\FieldQAPP-05\Appendicies\NewFieldSOPS\Oxygen-SOP010.doc
1 of 11

When you arrive back on shore, the dissolved oxygen test must be started before any other measurements. We use LaMotte test kits. The specific instructions for the kit are on the next pages as well as in the kit itself. Please familiarize yourself with the procedure before you begin. The basic procedure involves "fixing" the oxygen by reacting it with several different chemical reagents. Once the dissolved oxygen is "fixed" atmospheric oxygen cannot affect the results.
Read the information contained on the Material Safety Data Sheets (MSDS) that come with each kit. Glasses or safety goggles and gloves should be worn because of the chemical reagents used. The dissolved oxygen kits must be kept out of the reach of children. Keep a supply of paper towels on hand to mop up any spills right away.
After the tests are completed all the equipment must be carefully rinsed with tap water and allowed to air dry on a paper towel. The chemical reagents used in the analysis can safely be flushed down the drain with plenty of water or poured onto the ground. Wash your hands thoroughly when you are done.
If you spill any of the chemical reagents on yourself, immediately flush the affected area with lots of water. It is perfectly acceptable to use lake or stream water. Do not wait to wash off until you are at a faucet.
Remember to enter your Dissolved Oxygen data on the Monitoring Postcard (as shown below) and on the Field Data Sheet in the Monitoring Manual.
Monitoring Postcard example:
LOCATION: Easy Pond MONITOR(S): Monica Monitor DATE MONITORED: 07/04/05 TIME: 08:45 (mo/day/yr) (military) SECCHI DEPTH (measure 4 times):
4.0 4.0 4.1 3.9 meters
Depth to bottom is ___6.0__ meters. Is Secchi visible on bottom? yes or no CHLOROPHYLL SAMPLES: FILTERED and FROZEN: yes or no Record actual depth DEPTH MONITORED (meters) Surface 1 meter 5.5 m deep 5.5 m deepWATER TEMPERATURE (deg. C) 27 26 19 19
DISSOLVED OXYGEN (mg/L) (Measure twice at each depth)
N/A 10.0 10.0
8.0¦8.2 ¦
7.8¦8.0 ¦
SALINITY (ppt) N/A NA NA NA
(for below, circle best description, see monitoring manual for details) LIGHT: 1= Distinct shadows 2= No shadows 3= Very overcast WIND: 0= Calm 1= Light 2= Gentle 3= Moderate 4= Strong RAIN W/IN 48 Hrs. 1= None 2= Light 3= Moderate 4= Heavy -------------------------------------------------------------------------------------------------------------------------------------------------------
STATE OF TIDE: EBB ____ FLOOD ____ HIGH ____ LOW ____ N/A _X___
Fill out this section with your Dissolved Oxygen data.
Dissolved Oxygen Field SOP 010 S:\WW\awwword\LABPROC\all QAPPs\FieldQAPP-05\Appendicies\NewFieldSOPS\Oxygen-SOP010.doc
2 of 11
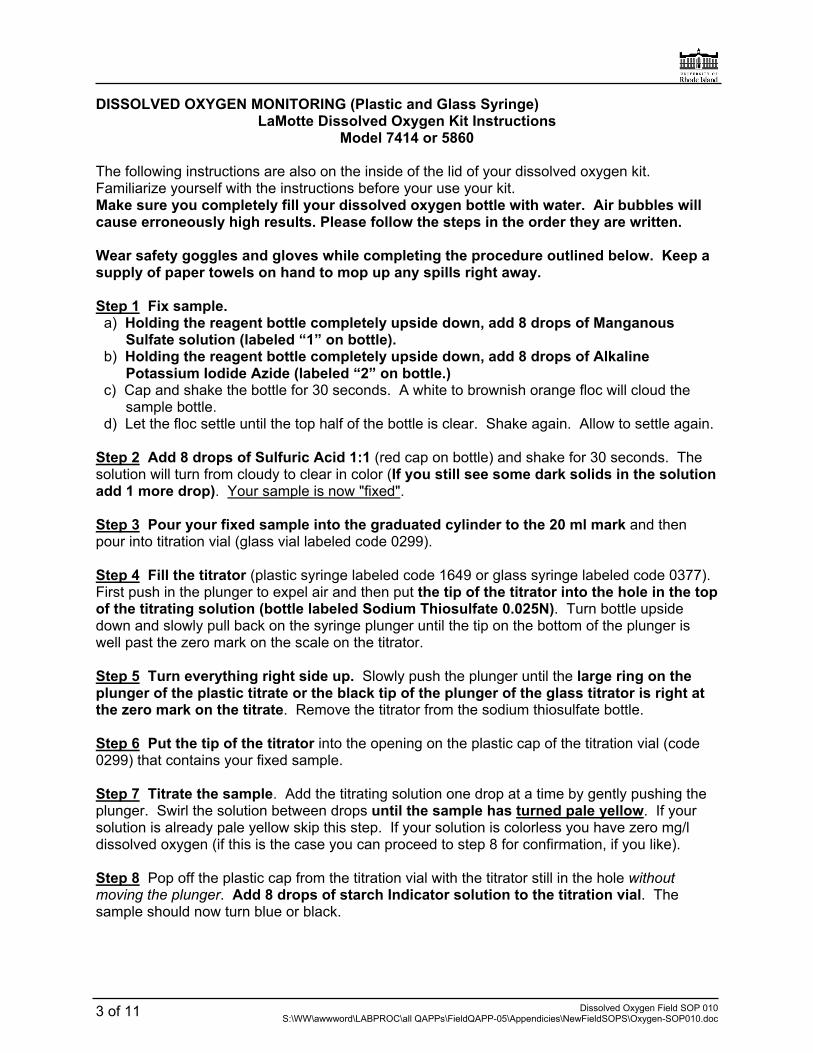
DISSOLVED OXYGEN MONITORING (Plastic and Glass Syringe) LaMotte Dissolved Oxygen Kit Instructions
Model 7414 or 5860
The following instructions are also on the inside of the lid of your dissolved oxygen kit. Familiarize yourself with the instructions before your use your kit. Make sure you completely fill your dissolved oxygen bottle with water. Air bubbles will cause erroneously high results. Please follow the steps in the order they are written. Wear safety goggles and gloves while completing the procedure outlined below. Keep a supply of paper towels on hand to mop up any spills right away. Step 1 Fix sample. a) Holding the reagent bottle completely upside down, add 8 drops of Manganous
Sulfate solution (labeled “1” on bottle). b) Holding the reagent bottle completely upside down, add 8 drops of Alkaline
Potassium Iodide Azide (labeled “2” on bottle.) c) Cap and shake the bottle for 30 seconds. A white to brownish orange floc will cloud the
sample bottle. d) Let the floc settle until the top half of the bottle is clear. Shake again. Allow to settle again. Step 2 Add 8 drops of Sulfuric Acid 1:1 (red cap on bottle) and shake for 30 seconds. The solution will turn from cloudy to clear in color (If you still see some dark solids in the solution add 1 more drop). Your sample is now "fixed". Step 3 Pour your fixed sample into the graduated cylinder to the 20 ml mark and then pour into titration vial (glass vial labeled code 0299). Step 4 Fill the titrator (plastic syringe labeled code 1649 or glass syringe labeled code 0377). First push in the plunger to expel air and then put the tip of the titrator into the hole in the top of the titrating solution (bottle labeled Sodium Thiosulfate 0.025N). Turn bottle upside down and slowly pull back on the syringe plunger until the tip on the bottom of the plunger is well past the zero mark on the scale on the titrator. Step 5 Turn everything right side up. Slowly push the plunger until the large ring on the plunger of the plastic titrate or the black tip of the plunger of the glass titrator is right at the zero mark on the titrate. Remove the titrator from the sodium thiosulfate bottle. Step 6 Put the tip of the titrator into the opening on the plastic cap of the titration vial (code 0299) that contains your fixed sample. Step 7 Titrate the sample. Add the titrating solution one drop at a time by gently pushing the plunger. Swirl the solution between drops until the sample has turned pale yellow. If your solution is already pale yellow skip this step. If your solution is colorless you have zero mg/l dissolved oxygen (if this is the case you can proceed to step 8 for confirmation, if you like). Step 8 Pop off the plastic cap from the titration vial with the titrator still in the hole without moving the plunger. Add 8 drops of starch Indicator solution to the titration vial. The sample should now turn blue or black.
Dissolved Oxygen Field SOP 010 S:\WW\awwword\LABPROC\all QAPPs\FieldQAPP-05\Appendicies\NewFieldSOPS\Oxygen-SOP010.doc
3 of 11

Step 9 Continue titration. Put the cap and titrator back on the titration bottle and continue to add one drop at a time, swirling the solution between each drop. Stop right when the solution turns from blue to colorless. (If no color change occurs by the time the plunger tip reaches the bottom of the scale on the titrator, refill the titrator by filling with titrant to the zero mark and continue the titration. Include both titration amounts in the final test results.) Step 10 Read the test result directly from where the scale intersects the ring of the plunger for plastic titrator or the tip of the plunger for the glass titrator. The titrator is marked at 0.2 ppm increments. So if the titrator ring or tip (as appropriate) is touching the third line below the line marked “7” the result would be 7.6 mg/l dissolved oxygen. (If the titrator has been refilled once before, the result would be 17.6 mg/l dissolved oxygen.) Step 11 Repeat steps 1 through 9 for a duplicate test. If the results are more than 1 mg/l apart between the two tests, repeat the test again and record all three results on your monitoring postcard.
Dissolved Oxygen Field SOP 010 S:\WW\awwword\LABPROC\all QAPPs\FieldQAPP-05\Appendicies\NewFieldSOPS\Oxygen-SOP010.doc
4 of 11
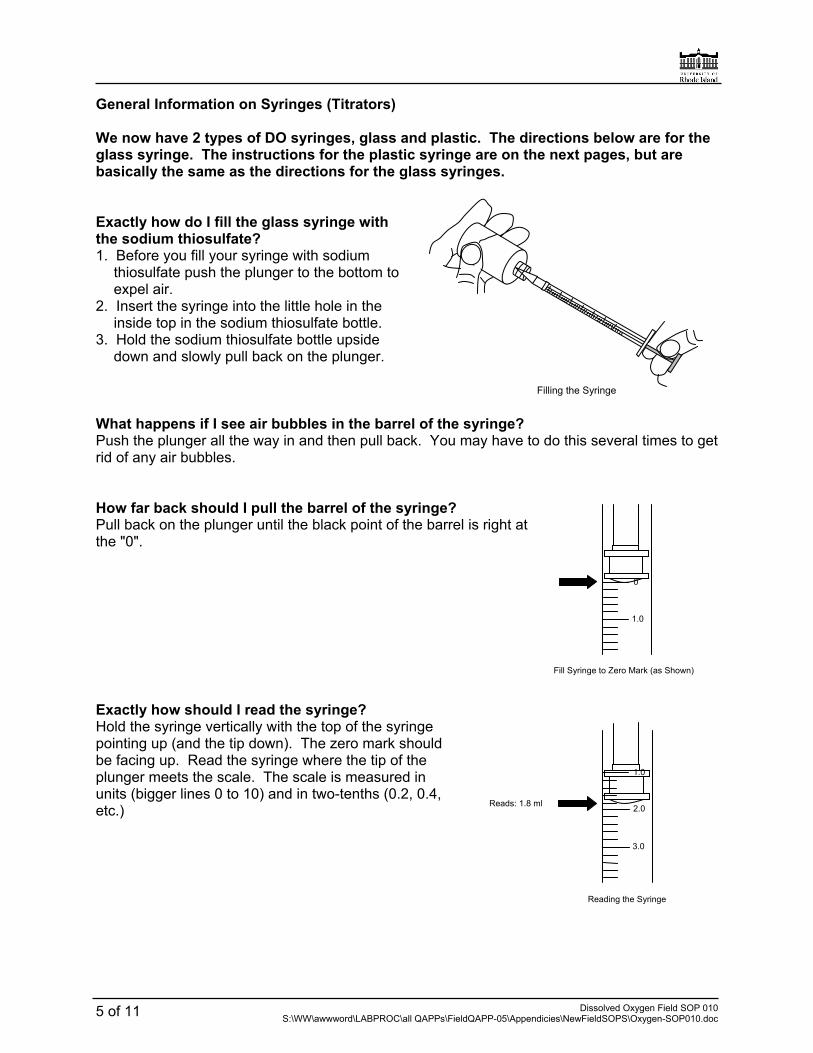
General Information on Syringes (Titrators) We now have 2 types of DO syringes, glass and plastic. The directions below are for the glass syringe. The instructions for the plastic syringe are on the next pages, but are basically the same as the directions for the glass syringes. Exactly how do I fill the glass syringe with the sodium thiosulfate? 1. Before you fill your syringe with sodium
thiosulfate push the plunger to the bottom to expel air.
2. Insert the syringe into the little hole in the inside top in the sodium thiosulfate bottle.
3. Hold the sodium thiosulfate bottle upside down and slowly pull back on the plunger.
Filling the Syringe
What happens if I see air bubbles in the barrel of the syringe? Push the plunger all the way in and then pull back. You may have to do this several times to get rid of any air bubbles. How far back should I pull the barrel of the syringe? Pull back on the plunger until the black point of the barrel is right at the "0". 0
1.0
Fill Syringe to Zero Mark (as Shown) Exactly how should I read the syringe? Hold the syringe vertically with the top of the syringe pointing up (and the tip down). The zero mark should be facing up. Read the syringe where the tip of the plunger meets the scale. The scale is measured in units (bigger lines 0 to 10) and in two-tenths (0.2, 0.4, etc.)
2.0
1.0
Reads: 1.8 ml
3.0
Reading the Syringe
Dissolved Oxygen Field SOP 010 S:\WW\awwword\LABPROC\all QAPPs\FieldQAPP-05\Appendicies\NewFieldSOPS\Oxygen-SOP010.doc
5 of 11

Supplemental Dissolved Oxygen Titration Information – Plastic Titrator
Pink Green
Dissolved Oxygen Field SOP 010 S:\WW\awwword\LABPROC\all QAPPs\FieldQAPP-05\Appendicies\NewFieldSOPS\Oxygen-SOP010.doc
6 of 11

Dissolved Oxygen Field SOP 010 S:\WW\awwword\LABPROC\all QAPPs\FieldQAPP-05\Appendicies\NewFieldSOPS\Oxygen-SOP010.doc
7 of 11

Dissolved Oxygen Field SOP 010 S:\WW\awwword\LABPROC\all QAPPs\FieldQAPP-05\Appendicies\NewFieldSOPS\Oxygen-SOP010.doc
8 of 11
LaMotte PO Box 329 Chestertown, MD 21620 800-344-3100 www.lamotte.com

COMMON QUESTIONS ABOUT ANALYZING DISSOLVED OXYGEN
This assumes that you have collected your water sample(s) and have capped the bottle(s). Should I pour off any of the water in my sample bottle before I add the reagents? NO! If you pour off some water you are introducing air (and oxygen). When you cap the bottle and shake it this oxygen can cause erroneously high results. Put the bottle on a paper towel if necessary to catch any water that spills over when you add the reagents. How should I hold the dropper bottles to dispense each reagent? Hold the dropper bottles completely upside down. This ensures a uniform drop size. The liquid reagents won’t come out until you squeeze the bottle. Why must I shake the bottle and let the floc settle twice? Doing this twice ensures that the chemical reactions are complete and that all the oxygen molecules have reacted with the chemical reagents. Sometimes after I add the eight drops of sulfuric acid some brown particles remain. Is this OK? The brown particles should be dissolved before you continue with your test. First, try shaking the sample bottle quite hard to see if they dissolve. If this doesn't work add one more drop of sulfuric acid (red capped bottle). Occasionally in water with an algae bloom there may be some organic matter present in you sample. This won't dissolve. You should be able to tell the difference between this and the chemical particles. What does it mean by saying that the sample is "fixed"? In a practical sense it means that contact with atmospheric oxygen will not affect your test results. Fixed samples may be stored up to eight hours, if kept refrigerated and in the dark. The chemical reactions that occur in this analysis are e
xplained after these questions.
hat is the best way to measure the amount of
er, use it to one
kay, now I've got my syringe filled and through the hole in the cap on the titration vial.
ed to the fixed
r
Wfixed sample that I should titrate? If you have a plastic graduated cylind 20 ml Line measure 20 ml of fixed sample. If you don't have pour the fixed sample directly into the titration vial (glass bottle labeled 0299) to the white 20 ml line.
Code 0299
Titration Vial OSometimes the drops don't seem to fall right into the water sample. Why? Each cap should have a tiny vent hole in it so that as the sodium thiosulfate is addwater sample the displaced air can escape. If you don't have this tiny hole, when you add the sodium thiosulfate instead of it dropping into the liquid it will run down the side of the bottle. This will also happen if a drop of liquid on top of the cap covers the vent hole. So, make surethat 1) your cap has a vent hole and 2) that is remains unobstructed during the titration. If youcap doesn't have a vent hole you can easily make one or enlarge an existing one by heating a pin and pushing it through the plastic.
Dissolved Oxygen Field SOP 010 S:\WW\awwword\LABPROC\all QAPPs\FieldQAPP-05\Appendicies\NewFieldSOPS\Oxygen-SOP010.doc
9 of 11

The directions say to add sodium thiosulfate until the water samples turns a straw yellow. How much does the color matter? Why shouldn't I add the starch indicator all at once in the beginning? I checked with Steve Wildberger of LaMotte Chemical Company about these questions. He feels that if you add the starch indicator all at once you will be likely to overshoot the end point. The color change from dark blue to colorless is much more abrupt than the more gradual change from brown to yellow. The pale yellow color in itself is an indicator that you are nearing the end point of the titration. He suggests that the yellow color you should be looking for when adding the indicator is "a manila folder yellow" rather than a straw yellow. I have also found that in high oxygen water if you add the starch indicator in the beginning the dark blue color seems to coat the sides of the titration vial, which makes the visual determination of the endpoint more difficult. My water sample is pale yellow right after it is fixed. Do I still have to see it get lighter before I add the starch indicator? If your water sample is already a pale yellow after it is fixed, add the starch indicator before you begin your titration. If your sample is completely colorless after it is fixed and remains that way after you add the indicator this means that there is no dissolved oxygen in your sample. If this is the case you might want to check the dissolved oxygen content of the 1 meter water just to make sure that the reagents in your kit are still functioning properly. If the surface water also has no detectable dissolved oxygen, call URI Watershed Watch at 874-2905 so that we can check your reagents to make sure everything is OK. How many times should I run the test on my water sample? You should run the dissolved oxygen test at least twice on each of your water samples. If the results are more than 1.0 ppm apart run it a third time. Remember to report all the results on your monitoring postcard. What should I do with any leftover sodium thiosulfate in the syringe? Discard any remaining sodium thiosulfate into your titrator vial. Do not put it back into the bottle it came from. Then take apart your syringe and rinse it with tap water. Store it with the plunger backed off from the bottom of the syringe.
Dissolved Oxygen Field SOP 010 S:\WW\awwword\LABPROC\all QAPPs\FieldQAPP-05\Appendicies\NewFieldSOPS\Oxygen-SOP010.doc
10 of 11

Chemical Reactions when Using the Azide Modification of the Winkler Method to Test for Dissolved Oxygen
(from: Clean Water: A Guide to Water Quality Monitoring, by E. Stancioff, University of Maine Cooperative Extension.) The first step in a dissolved oxygen (DO) titration is the addition of manganous sulfate solution (4167) and alkaline potassium iodide azide (7166) to the water sample. These reagents react with each other to form a precipitate, or floc, of manganous hydroxide, Mn(OH)2. Chemically the reaction is: MnSO4 + 2KOH Mn(OH)2 + K2SO4 manganous sulfate + potassium sulfate manganous hydroxide + potassium sulfate Immediately upon formation of the precipitate, the oxygen in the water oxidizes an equivalent amount of the manganous hydroxide to manganic hydroxide. In other words, for every molecule of oxygen in the water one molecule of manganous hydroxide is converted to manganic hydroxide. The reaction is: 2 Mn(OH)2 + O2 + 2H2O 2Mn(OH)4manganous hydroxide + oxygen + water manganic hydroxide After the precipitate is formed a strong acid, sulfuric acid 1:1 (6141WT) is added to the water sample. The acid converts the manganic hydroxide to manganic sulfate. At this point the sample is considered “fixed”. Any concern for additional oxygen being introduced into the sample is reduced. The chemical reaction is: 2Mn(OH)4 + 4H2SO4 2Mn(SO4)2 + 8H2O manganic hydroxide + sulfuric acid manganic sulfate + water Simultaneously, iodine from the potassium iodide in the alkaline potassium iodide azide solution is replaced by sulfate, releasing free iodine into the water. Since the sulfate for this reaction comes from the manganic sulfate which was formed from the reaction between the manganic hydroxide and oxygen; the amount of iodine released is directly proportional to the amount of oxygen present in the original sample. The release of free iodine is indicated by the sample turning a yellow-brown color. This chemical reaction is: 2Mn(SO4)2 + 4KI 2Mn(SO4) + 2K2SO4 + 2I2 manganic sulfate + potassium iodide manganic sulfate + potassium sulfate + iodine The final step in the Winkler titration is the addition of sodium thiosulfate. The sodium thiosulfate reacts with the free iodine to produce sodium iodide. When all the iodine had been converted the sample changes color from yellow-brown to colorless. Often a starch indicator is added to enhance the final endpoint. This chemical reaction is: 4NaS2O3 + 2I2 Na2S4O6 + 4NaI sodium thiosulfate + iodine sodium tetrathionate + sodium iodide
Dissolved Oxygen Field SOP 010 S:\WW\awwword\LABPROC\all QAPPs\FieldQAPP-05\Appendicies\NewFieldSOPS\Oxygen-SOP010.doc
11 of 11

SHALLOW WATER SAMPLER
OPERATION (Field SOP 011)
University of Rhode Island Watershed Watch
Date: Revision: Author:
3/05 1 Linda Green
Introduction The Shallow water sampler was designed by Jim Geib, a volunteer monitor with the URIWW program. A marine gasoline tank primer bulb acts as a pump and can be operated with one hand. The other hand is left free to hold the tubing securely inside the mouth of the collection bottle. To maintain the proper sampling depth, Geib made a float by cutting pieces from a polyethylene foam noodle pool toy. The float is held securely in place at 1 meter above the end of the sampling tube. The sampler should not be used to collect samples for bacteria since its not sterile or dissolved oxygen since the collection procedure introduces oxygen into the sample. Instructions for use 1. Place the end of the sampler with the brass pipe into the water
and lower it until it is supported by the float. 2. Squeeze the bulb 10 times to rinse out the sampler. Do not use
this water as your sample. 3. Holding the sample bottle in one hand, pump the bulb with the
other hand and fill the bottle. You are sampling at a depth of 1 meter.
The Shallow Water Sampler in use.
Shallow Water Sampler Operation Field SOP 011 S:\WW\awwword\LABPROC\all QAPPs\FieldQAPP-05\Appendicies\NewFieldSOPS\ShallowSampler-SOP011.doc 1 of 1

DEEP WATER SAMPLER
OPERATION (Field SOP 012)
University of Rhode Island Watershed Watch
Date: Revision: Author:
3/05 1 Linda Green
Introduction The LaMotte Water Sampling Bottle (3-0026) is a unique device that collects water samples representative of specific depths and is particularly suited to the collection of dissolved oxygen samples. Samples may be taken at specific depths by using the attached stopper and an optional calibrated line and 2 pound weight. Simply lower the bottle to the sample depth. When the trip line is pulled the sample collection bottle will begin to fill, overflowing and flushing more than 5 times. During retrieval, decreasing water pressure prevents exchange of air and water with the sample. Excess water in the sample chamber can be used for other tests. The interior chamber also accommodates LaMotte Model 545 Armored Thermometer for accurate sample temperature readings. The thermometer can be pressed gently into a hole in the base of the sampler chamber, and the sample temperature can be read through the clear body of the sampler. Operation 1. To release the wire lid retainer lift it up and
away from the sampler. 2. Remove the plastic lid with attached inlet
tube, by sliding it up the rope bridle. 3. Insert a Dissolved Oxygen collecting bottle,
with the cap removed, into the inner chamber of the sampler.
4. Replace the plastic lid, inserting the inlet tube into the collecting bottle.
5. Snap the wire lid retainer into the grooves othe lid by lifting up and in.
n
lamp 6. Attach a two pound weight to the snap cat the bottom of the rope bridle.
7. Attach a calibrated line to the loop at the top of the rope bridle
Deep Water Sampler Operation Field SOP 012 S:\WW\awwword\LABPROC\all QAPPs\FieldQAPP-05\Appendicies\NewFieldSOPS\DeepSampler-SOP012.doc
1 of 2

8. Press the plastic stopper securely into the center inlet hold. 9. Lower the water sampling bottle to the desired depth. 10. Collect the water sample by removing the stopper from the inlet hole with a quick jerk of the
calibrated line. 11. Note: As air is displaced by water entering the sampler, bubbles will be observed rising to
the surface (downstream). When the water sampler is filled, bubbles will no longer appear. Filling takes about 45 seconds to one minute.
12. Use a steady, hand-over-hand motion, to retrieve the water sampler. 13. If the thermometer is used with the sampler, read the temperature through the clear sample
body without removing the thermometer from the sampler. Record the temperature. 14. Place the sampler on a flat surface. 15. Release the wire lid retainer and remove the plastic lid with inlet tube attached, sliding it up
the rope bridle. 16. Remove the collecting bottle from the inner chamber of the sampler. If the dissolved oxygen
test is to be performed on this sample follow the directions in your dissolved oxygen test kit. 17. The remaining water in the sampler can be used to perform additional tests.
LaMotte Company
PO Box 329 Chestertown, MD 21620 1-800-344-3100
Deep Water Sampler Operation Field SOP 012 S:\WW\awwword\LABPROC\all QAPPs\FieldQAPP-05\Appendicies\NewFieldSOPS\DeepSampler-SOP012.doc
2 of 2

MONITORING SALINITY
(Field SOP 013)
University of Rhode Island Watershed Watch
Date: Revision: Author:
3/05 1 Linda Green
Introduction Salinity is usually expressed in parts per thousand (ppt). Seawater has approximately 35 parts salt per thousand parts of water. Drinking water has less than 0.5 ppt. Measuring Salinity Using the LaMotte Salinity Titration Kit 1. Safety goggles and gloves must be worn when completing this analysis. Care must
be taken with this kit as the chemical reagents will permanently stain counter tops, tables and clothing as well as create long lasting stains on skin. Cover working surfaces with newspapers and wear gloves and protective clothing when using this kit.
2. Fill the demineralizer bottle with tap water. It is the big bottle with the brown-black crystals in it.
3. Recap, making sure that the spout is closed, and shake vigorously for 30 seconds. 4. Fill the titration vial (code 0648) to the 10 mL line with demineralized water. 5. Fill the 1 mL titrator syringe (code 0376) with your water sample. Wipe off tip of the
titrator syringe. 6. Dispense 0.5 mL of sample water into the titration vial containing demineralized water. 7. Add 3 drops salinity reagent A. Cap the titration vial and swirl gently to mix. The solution
will turn yellow. 8. Fill the 0 - 20 mL titrator syringe (code 0378) with salinity reagent B. 9. Insert that titrator syringe into the hole in the cap of the titration vial. 10. Depress the plunger to add reagent B dropwise. Swirl gently to mix the reagent with the
water sample. 11. The end point of the reaction is when the color changes from yellow to cloudy pink-
brown, sort of a grapefruit pink. 12. Read the titrator syringe where the tip of the plunger crosses the scale. Record your result
on the Monitoring Postcard and the Field Data Sheet in the Monitoring Manual. (Remember that the smallest divisions are 0.4 ppt.). See the chart on page 3 for help in reading the scale.
13. Repeat the test with another sample of water. 14. Clean-up: Flush all unused reagents in the syringes and the solution in the titration vial
down the drain with plenty of water. Take apart the syringes and rinse with tap water. Invert the syringe barrels to dry. Rinse the titration vial with tap water and invert to dry.
Monitoring Salinity Field SOP 013 S:\WW\awwword\LABPROC\all QAPPs\FieldQAPP-05\Appendicies\NewFieldSOPS\Salinity-SOP013.doc
1 of 3

Chemical Reactions When Using the Silver Nitrate Titration Method
to Measure Salinity Using the Argentometric Equation
1. The water sample is initially diluted with demineralized water. 2. The water sample is then mixed with an indicator (potassium chromate). The liquid will
turn a transparent yellow color due to the chromate ion. This mixture contains both chloride ions and chromate ions in solution.
3. The prepared solution is then titrated with silver nitrate until the solution changes from yellow to pink-orange.
4. The reaction takes place in two steps:
I. The silver nitrate reacts with the chloride ions from the water sample to produce insoluble white silver chloride (AgCl):
AgNO3 (aq) + Cl- (aq) AgCl (s) + NO3
- (aq) Silver nitrate + Chloride ion Silver chloride + Nitrate ion (aqueous) (aqueous) (solid) (aqueous)
II. When all the chloride ion has been converted to silver chloride, the remaining silver
nitrate will react with the chromate, the indicator, to form the pink-orange colored silver chromate precipitate. This color change signals the end of the reaction shown above.
5. The volume of the titrant (silver nitrate), added in the procedure will be used to calculate
the salinity of the original water sample. The amount of silver nitrate used is convert to the amount of chloride in the original water sample.
6. The amount of chloride can then be converted to the salinity using a multiplier dependent on the sample volume and the concentration of the silver nitrate. It is based on the Knudson equation:
Salinity (ppt) = 1.805 (Cl-) + 0.030
Modified by Harvey for the LaMotte kit we use. (Personal communication, Charlie Gloyd, LaMotte Chemical Products Company, May 2001.)
Monitoring Salinity Field SOP 013 S:\WW\awwword\LABPROC\all QAPPs\FieldQAPP-05\Appendicies\NewFieldSOPS\Salinity-SOP013.doc
2 of 3

Monitoring Salinity Field SOP 013 S:\WW\awwword\LABPROC\all QAPPs\FieldQAPP-05\Appendicies\NewFieldSOPS\Salinity-SOP013.doc
3 of 3
0
2
4
6
8
10
12
14
16
18
20
0.0 ppt 0.4 ppt 0.8 ppt 1.2 ppt 1.6 ppt 2.0 ppt 2.4 ppt 2.8 ppt 3.2 ppt 3.6 ppt 4.0 ppt 4.4 ppt 4.8 ppt 5.2 ppt 5.6 ppt 6.0 ppt 6.4 ppt 6.8 ppt 7.2 ppt 7.6 ppt 8.0 ppt 8.4 ppt 8.8 ppt 9.2 ppt 9.6 ppt 10.0 ppt 10.4 ppt 10.8 ppt 11.2 ppt 11.6 ppt 12.0 ppt 12.4 ppt 12.8 ppt 13.2 ppt 13.6 ppt 14.0 ppt 14.4 ppt 14.8 ppt 15.2 ppt 15.6 ppt 16.0 ppt 16.4 ppt 16.8 ppt 17.2 ppt 17.6 ppt 18.0 ppt 18.4 ppt 18.8 ppt 19.2 ppt 19.6 ppt 20.0 ppt
Salinity Chart This chart may be used to more quickly determine salinity when the value falls on one of the subdivisions between the numbered lines. For example: If we were to have titrated to the end point shown by the arrow below, our salinity would be: 9.2 ppt