state and trends of carbon pricing 2021 - world bank
TRANSCRIPT
Carbon Pricing 2021State and Trends of
Carbon Pricing 2021

© 2021 International Bank for Reconstruction and Development / The World Bank
1818 H Street NW, Washington DC 20433Telephone: 202-473-1000; Internet: www.worldbank.org
Some rights reserved1 2 3 4 24 23 22 21
This work is a product of the staff of The World Bank with external contributions. The findings, interpretations, and conclusions expressed in this work do not necessarily re-flect the views of The World Bank, its Board of Executive Directors, or the governments they represent. The World Bank does not guarantee the accuracy of the data included in this work. The boundaries, colors, denominations, and other information shown on any map in this work do not imply any judgment on the part of The World Bank con-cerning the legal status of any territory or the endorsement or acceptance of such boundaries.Nothing herein shall constitute or be considered to be a limitation upon or waiver of the privileges and immunities of The World Bank, all of which are specifically reserved.
RIGHTS AND PERMISSIONS
This work is available under the Creative Commons Attribution 3.0 IGO license (CC BY 3.0 IGO) http://creativecommons.org/licenses/by/3.0/igo. Under the Creative Com-mons Attribution license, you are free to copy, distribute, transmit, and adapt this work, including for commercial purposes, under the following conditions:
Attribution—Please cite the work as follows: The World Bank. 2021. “State and Trends of Carbon Pricing 2021” (May), World Bank, Washington, DC. Doi: 10.1596/978-1-4648-1728-1. License: Creative Commons Attribution CC BY 3.0 IGO
Translations—If you create a translation of this work, please add the following disclai-mer along with the attribution: This translation was not created by The World Bank and should not be considered an official World Bank translation. The World Bank shall not be liable for any content or error in this translation.
Adaptations—If you create an adaptation of this work, please add the following dis-claimer along with the attribution: This is an adaptation of an original work by The World Bank. Responsibility for the views and opinions expressed in the adaptation rests solely with the author or authors of the adaptation and are not endorsed by The World Bank.
Third-party content—The World Bank does not necessarily own each component of the content contained within the work. The World Bank therefore does not warrant that the use of any third-party-owned individual component or part contained in the work will not infringe on the rights of those third parties. The risk of claims resulting from such infringement rests solely with you. If you wish to re-use a component of the work, it is your responsibility to determine whether permission is needed for that re-use and to obtain permission from the copyright owner. Examples of components can include, but are not limited to, tables, figures, or images.
All queries on rights and licenses should be addressed to the Publishing and Knowledge Division, The World Bank, 1818 H Street NW, Washington, DC 20433, USA; fax: 202-522-2625; e-mail: [email protected].
ISBN (electronic): 978-1-4648-1728-1DOI: 10.1596/ 978-1-4648-1728-1
2

The development of this report was led by the World Bank and prepared by experts from the World Bank and Climate Focus. Additional contributions were provided by the International Carbon Action Partnership and the Carbon Disclosure Project.
Ecosystem Marketplace and Sinocarbon Innovation & Investment also supported this report.
The World Bank task team responsible for this report was composed of Marissa San-tikarn, Angela Naneu Churie Kallhauge, Mustafa Ozgur Bozcaga, Leyla Sattler, Michael McCormick, and Ana Ferran Torres.
The Climate Focus team included Darragh Conway, Leo Mongendre, Carolina Inclan, Szymon Mikolajczyk, Lieke ‘t Gilde, Imogen Long, Felipe Bravo, Federico De Lorenzo, and Adriaan Korthuis.
This report benefited greatly from the insights and contributions from: Malin Ahlberg, Keyongah Ahn, Erik van Andel, Botagoz Akhmetova, Jelena Ban, Imre Banyasz, Nicolet-te Bartlett, Hélène M.E. de Beer, Pierre Bouchard, David M. Brock, Tómas Brynjólfsson, Cyril Cassisa, Marcos Castro Rodriguez, Petr Charnik, Sandeep Roy Chaudhury, Satoshi Chida, Mischa Classen, Ximena Aristizabal Clavijo, Tom Coleman, John Cooper, Hous-seini Coulibaly, Francisco Dall’Orso, the Department for Business, Energy and Indus-trial Strategy (United Kingdom), Department of Climate Change, Ministry of Natural Resources and Environment (Viet Nam), the Department of Finance (Government of the Northwest Territories, Canada), the Department of Finance (Ireland), Felipe Andres Diaz, Bill Drumheller, Virender K. Duggal, Thomas Duchaine, Todd Dupuis, the East Afri-ca Alliance national focal points, Jane Ellis, Dominik Englert, Simon Fellermeyer, Hari-kumar Gadde, the GIZ Global Carbon Markets team (Uganda), Aric Gliesche, the Gover-nment of Argentina, the Government of Singapore, Jason Gray, Stephane Hallegatte, Sharlin Hemraj, Anukriti S. Hittle, Dmitry Halubouski, Aminul Haque, Keisuke Iyadomi, Syeda Hadika Jamshaid, Yuji Jigata, Olga Sanda Jurča, Brad Kerin, Krzysztof Kobyłka, Anna Konovalov, Steven Kuski, Allen Landis, Jesús Abraham Bartolomé Lasa, Teody Leano, Sungwoo Lee, Stéphane Legros, Lucas Lo Re, Pongvipa Lohsomboon, Memory Machingambi, Judy Meltzer, the Ministry of Environment and Climate Change Strategy (British Columbia), the Ministry for Environment and Parks (Alberta), the Ministry of Environment and Planning (Slovenia), the Ministry of Finance (British Columbia), the Ministry of Finance (Luxembourg), the Ministry of Finance (Slovenia), Antonio Morga-do, Daniel Nachtigall, Nives Nared, Lucy Naydenova, the Office of Market Mechanisms,
Global Environmental Bureau, Environment and Economy Division, Environmental Policy Bureau (Japan), Takuya Ozawa, Gareth Phillips, Margrét Þórólfsdóttir, Namita Rajesh, the Regional Collaboration Centre (Kampala), Elizabeth Rine, Rajinder Sahota, Sufina Salleh, Anothai Sangthong, Arantzazu Mojarrieta Sanz, Ousamne Fall Sarr, Juan Pedro Searle, Kristen Sheeran, Jessica Shirley, Chandra Shekar Sinha, Øystein Bieltvedt Skeie, Jason Smith, William Space, Sandhya Srivasan, Katie Sullivan, Heike Summer, Eva Suur-kaev, Nuyi Tao, Katherine Teeple, Lavinia Teodorescu, Michael Themann, Dino Toljan, Simon Tudiver, Priscilla Ulloa, Carolina Urmenata, Mónica Leticia Lazcano Velasco, Da-vid Victor, Teresa Solana Mendez de Vigo, Daniel Waluszewski, Philippe Wen, Brittany White, Dina Yahya, Olga Yukhymchuk, Christopher Zink, and Gusts Zustenieks.
Report design was done by Kynda and editing was done by EpsteinWords.
This report was supported through the Partnership for Market Readiness Program.
3
LIST
OF
FIG
URE
S Figure 1.1 Carbon pricing landscape 17
Figure 2.1 Map of carbon taxes and emissions trading systems 22
Figure 2.2 Share of global greenhouse gas emissions covered by carbon taxes and emissions trading systems 23
Figure 2.3 Carbon prices as of April 1, 2021 26
Figure 2.4 2020 Allowance price developments in emissions trading systems 27
Figure 2.5 Carbon price, coverage and revenues generated by carbon taxes 29
Figure 2.6 Carbon price, coverage and revenues generated by emissions trading systems 30
Figure 3.1 Cumulative credit issuance of credits (2019-2020) 40
Figure 3.2 Credit issuance and number of projects registered by mechanism 41
Figure 3.3 Volumes transacted and prices per sector (2019) 43
Figure 3.4 Map of domestic crediting mechanisms 44
Figure 3.5 Article 6 pilots by stage of development and sector 50
Figure 4.1Motivations for internal carbon pricing 53
Figure 4.2Internal carbon pricing across industries 57
Figure C.1Credits issued, registered activities, average 2020 price and sectors covered by crediting mechanisms 75
4
LIST
OF
TABL
ES A
ND
BO
XES
Table 2.1Price increases in carbon taxes and emissions trading systems 28
Table 2.2Price or supply adjustment mechanisms in existing emissions trading systems (Source: own elaboration based on data from the International Carbon Action Partnership). 32
Table 3Voluntary credit buyers and projects purchased by region 45
Table B.1Carbon pricing developments in Canadian provinces and territories 63
Table B.2Developments in China’s subnational pilotss 65
Table C.1Article 6 pilots and support activities 79
Box 2.1Other policy developments in China 24
Box 2.2The EU Market Stability Reserve 31
Box 2.3An illustrative role of carbon pricing in countries’ net-zero commitments: New Zealand 34
Box 2.4Opportunities for carbon pricing to support a sustainable recovery 35
Box 2.5Role of carbon pricing in Canada’s Healthy Environment and Healthy Economy Plan 36
Box 3.1Example of digital technologies in nature-based solution credits 48
5
LIST
OF
ABB
REV
IATI
ON
SBMU Ministry for Environment, Nature Conservation and Nuclear SafetyCARB California Air Resources BoardCCER China Certified Emissions Reduction CDM Clean Development Mechanism CORSIA Carbon Offsetting and Reduction Scheme for International Aviation CPIs Carbon pricing instruments D-MRV Digitalized MRV ECR Emissions Containment Reserve ETS Emissions trading systemGEO Global Emission OffsetGHG Greenhouse GasICAO International Civil Aviation Organization IMO International Maritime Organization ITMOs Internationally Transferred Mitigation Outcomes JCM Joint Crediting Mechanism MoU Memorandum of Understanding MRV Monitoring, reporting, and verification MSR Market Stability Reserve NDC Nationally Determined Contribution OBPS Output-Based Pricing System PSAMs Price or supply adjustment mechanisms RGGI Regional Greenhouse Gas Initiative SBTi Science-based Targets Initiative T-VER Thailand Voluntary Emission Reduction Program TCAF Transformative Carbon Asset Facility TCFD Task Force on Climate-related Financial Disclosures TCI-P Transportation and Climate Initiative Program TSVCM Task Force on Scaling the Voluntary Markets VCS Verified Carbon Standard
6
TABL
E O
F C
ON
TEN
TS
7
As we start to emerge from the global pandemic, there is strong consensus on the need to strengthen our preparedness for future global crises, including those posed by climate change. The last year has shown us that cooperation is essential to address pro-blems that transcend national borders. Achieving a resilient recove-ry therefore requires enhanced cooperation and collaboration. This, too, is the case for climate change.
The annual State and Trends report provides us with a snapshot of the progress on explicit carbon pricing at the jurisdictional, sectoral, and corporate levels in the past year. It is encouraging to see how governments and companies are integrating carbon pricing into their climate strategies. This year, for instance, saw the long-awai-ted launch of China’s national emissions trading system (ETS) — the world’s largest carbon market. With net-zero commitments conti-nuing to proliferate, including carbon pricing as part of the strate-gies can help jurisdictions and corporations internalize the cost of greenhouse gas (GHG) emissions and enable a shift to a low-car-bon economy.
However, it is clear the potential of carbon pricing is still largely untapped, with most carbon prices below the levels needed to drive significant decarbonization. More broadly, global emissions have continued to rise and current climate policies from governments and the private sector also continue to fall far short of what is nee-ded to reach the temperature goals of the Paris Agreement. While the frameworks for climate action — including for robust carbon pricing policies — are in place in many jurisdictions, there is an ur-gent need to scale the scope and ambition of these instruments. The World Bank has continued its commitment to support client countries to prepare, plan, and implement carbon pricing measures as part of their strategies to address climate change and achieve sustainable development. Our Partnership for Market Readiness program, which wrapped up work this year, provided funding and technical assistance to carbon pricing readiness programs. It sup-ported 23 developing countries that together account for 46% of the
global GHG emissions. We have since launched the Partnership for Market Implementation, a 10-year program that will support coun-tries embarking on carbon pricing move from readiness to rollout.
Equally important to the World Bank’s work on supporting the use of carbon pricing is providing support to enable the development of policies that are fair and do not impose an undue burden on the poor in developing countries. Small changes to basic commodity prices may have a significant impact on lower-income groups. As such, working with all relevant stakeholders to assess these im-pacts, as well as design and implement policies to enable a just transition to a low-carbon economy, is a critical component to car-bon pricing design.
We affirm our committed to work with all stakeholders to put a pri-ce on carbon to advance climate action in an effective and sustai-nable way.
BERNICE VAN BRONKHORST, Climate Change Global Director, World Bank GroupFO
REW
ORD
8
CARBON PRICING – A NECESSARY BUT NOT SUFFICIENT POLICY
• Carbon pricing can play a role in incentivizing low-carbon acti-on by internalizing the cost of greenhouse gas emissions
• However, for it to work, several things are needed:• It must be sufficiently AMBITIOUS. Experts say prices of
USD 40-80/tCO2e are needed to meet the 2°C goal.• It must be WELL DESIGNED AND ADAPTED to the jurisdicti-
onal context.• It must FORM PART OF A SUPPORTIVE POLICY PACKAGE
– other policies are needed to drive research and develop-ment, unlock non-economic barriers to mitigation and to target emissions reductions with very high abatement costs
EXEC
UTIV
E SU
MM
ARY
HOW DOES CARBON PRICING FIT WITH NET ZERO COMMITMENTS?
• Despite the economic and social upheaval of COVID-19, most governments continued rolling out or increasing the ambition of their carbon pricing instruments.
• The proliferation of net zero commitments from govern-ments and the private sector is also a positive sign. But they must be backed up by ambitious short- and medi-um-term action.
• But what do these net zero commitments mean for the role of carbon pricing and how these instruments will look like in order to reach net zero targets?
SOME EARLY SIGNS OF MORE AMBITIOUS CARBON PRICING POLICIES
• More governments are adopting net zero targets and we are beginning to see MORE AMBITIOUS CARBON PRICING INSTRUMENTS:• In the EU, allowance prices have hit all-time highs as the bloc steps up both
long and short term climate ambition and the market foresees caps tighte-ning following the announcement of the Green Deal.
• Prices are increasing in countries like Canada, Germany and Ireland• New Zealand’s Climate Change Act sets out changes to its ETS and outli-
nes a national mitigation framework in line with a 2050 net zero target• Greater ambition is also leading more governments to consider CARBON
BORDER ADJUSTMENTS. These may in turn may spur more climate ambition (but are also facing opposition)
NEW CARBON PRICING INSTRUMENTS LAUNCHED
• China’s emissions trading system came online – the LARGEST CARBON MAR-KET IN THE WORLD, initially covering around 4,000 MtCO2 or 30% of its natio-nal GHG emissions.
• The UK and Germany both launched national carbon markets and carbon taxes in the Netherlands and Luxem-bourg came into operation.
9
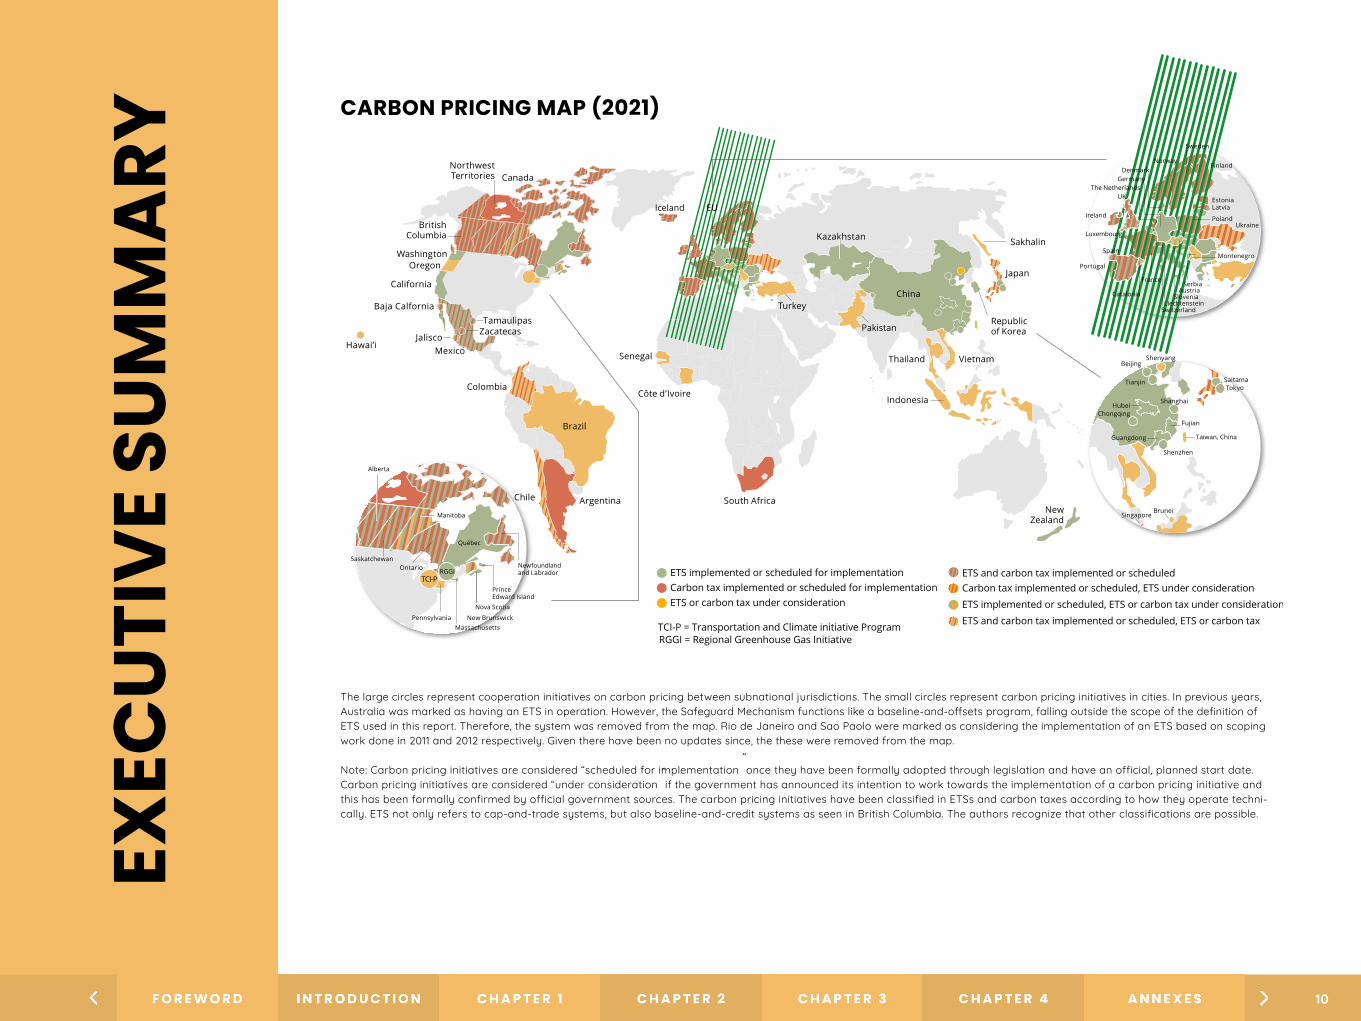
CARBON PRICING MAP (2021)
ETS implemented or scheduled for implementation
Carbon tax implemented or scheduled for implementation
ETS or carbon tax under consideration
RGGI = Regional Greenhouse Gas InitiativeTCI-P = Transportation and Climate initiative Program
ETS and carbon tax implemented or scheduled Carbon tax implemented or scheduled, ETS under consideration
ETS implemented or scheduled, ETS or carbon tax under consideration
ETS and carbon tax implemented or scheduled, ETS or carbon tax
Prince Edward Island
Alberta
Nova Scotia
SaskatchewanOntario
Québec
Manitoba
New Brunswick
Newfoundlandand Labrador
MassachusettsPennsylvania
TCI-PRGGI
Ukraine
Norway
UK
Portugal
France
Switzerland
Slovenia
Montenegro
Poland
LatviaEstonia
Finland
Sweden
GermanyDen mark
Ireland
LiechtensteinCatalonia
Spain
Luxembourg
The Netherlands
AustriaSerbia
Shanghai
Shenzhen
Fujian
Beijing
Tianjin
HubeiChongqing
Guangdong
TokyoSaitama
Taiwan, China
Brunei
Shenyang
Singapore
Chile
Turkey
Pakistan
China
Northwest Territories Canada
British Columbia
WashingtonOregon
California
Baja Calfornia
Mexico
TamaulipasZacatecas
Brazil
South AfricaNew
Zealand
Thailand
EU
Kazakhstan
Republic
Sakhalin
Japan
Iceland
Colombia
Vietnam
Argentina
Côte d’Ivoire
SenegalHawai’i
Jaliscoof Korea
Indonesia
The large circles represent cooperation initiatives on carbon pricing between subnational jurisdictions. The small circles represent carbon pricing initiatives in cities. In previous years, Australia was marked as having an ETS in operation. However, the Safeguard Mechanism functions like a baseline-and-offsets program, falling outside the scope of the definition of ETS used in this report. Therefore, the system was removed from the map. Rio de Janeiro and Sao Paolo were marked as considering the implementation of an ETS based on scoping work done in 2011 and 2012 respectively. Given there have been no updates since, the these were removed from the map.
Note: Carbon pricing initiatives are considered “scheduled for implementation” once they have been formally adopted through legislation and have an official, planned start date. Carbon pricing initiatives are considered “under consideration” if the government has announced its intention to work towards the implementation of a carbon pricing initiative and this has been formally confirmed by official government sources. The carbon pricing initiatives have been classified in ETSs and carbon taxes according to how they operate techni-cally. ETS not only refers to cap-and-trade systems, but also baseline-and-credit systems as seen in British Columbia. The authors recognize that other classifications are possible.
EXEC
UTIV
E SU
MM
ARY
ETS implemented or scheduled for implementation
Carbon tax implemented or scheduled for implementation
ETS or carbon tax under consideration
RGGI = Regional Greenhouse Gas InitiativeTCI-P = Transportation and Climate initiative Program
ETS and carbon tax implemented or scheduled Carbon tax implemented or scheduled, ETS under consideration
ETS implemented or scheduled, ETS or carbon tax under consideration
ETS and carbon tax implemented or scheduled, ETS or carbon tax
Prince Edward Island
Alberta
Nova Scotia
SaskatchewanOntario
Québec
Manitoba
New Brunswick
Newfoundlandand Labrador
MassachusettsPennsylvania
TCI-PRGGI
Ukraine
Norway
UK
Portugal
France
Switzerland
Slovenia
Montenegro
Poland
LatviaEstonia
Finland
Sweden
GermanyDen mark
Ireland
LiechtensteinCatalonia
Spain
Luxembourg
The Netherlands
AustriaSerbia
Shanghai
Shenzhen
Fujian
Beijing
Tianjin
HubeiChongqing
Guangdong
TokyoSaitama
Taiwan, China
Brunei
Shenyang
Singapore
Chile
Turkey
Pakistan
China
Northwest Territories Canada
British Columbia
WashingtonOregon
California
Baja Calfornia
Mexico
TamaulipasZacatecas
Brazil
South AfricaNew
Zealand
Thailand
EU
Kazakhstan
Republic
Sakhalin
Japan
Iceland
Colombia
Vietnam
Argentina
Côte d’Ivoire
SenegalHawai’i
Jaliscoof Korea
Indonesia
10

EXEC
UTIV
E SU
MM
ARY
COMPANIES ARE ADOPTING NET ZERO TARGETS, DRIVING DEMAND IN THE VOLUNTARY CARBON MARKET
2,874
2,948
616
803
Cumulativeissuance
in MtCO2e(since 2002)
+3% +30% +25%
2019
2020
391
488
Crediting mechanisms: InternationalIndependentDomestic
11
EXEC
UTIV
E SU
MM
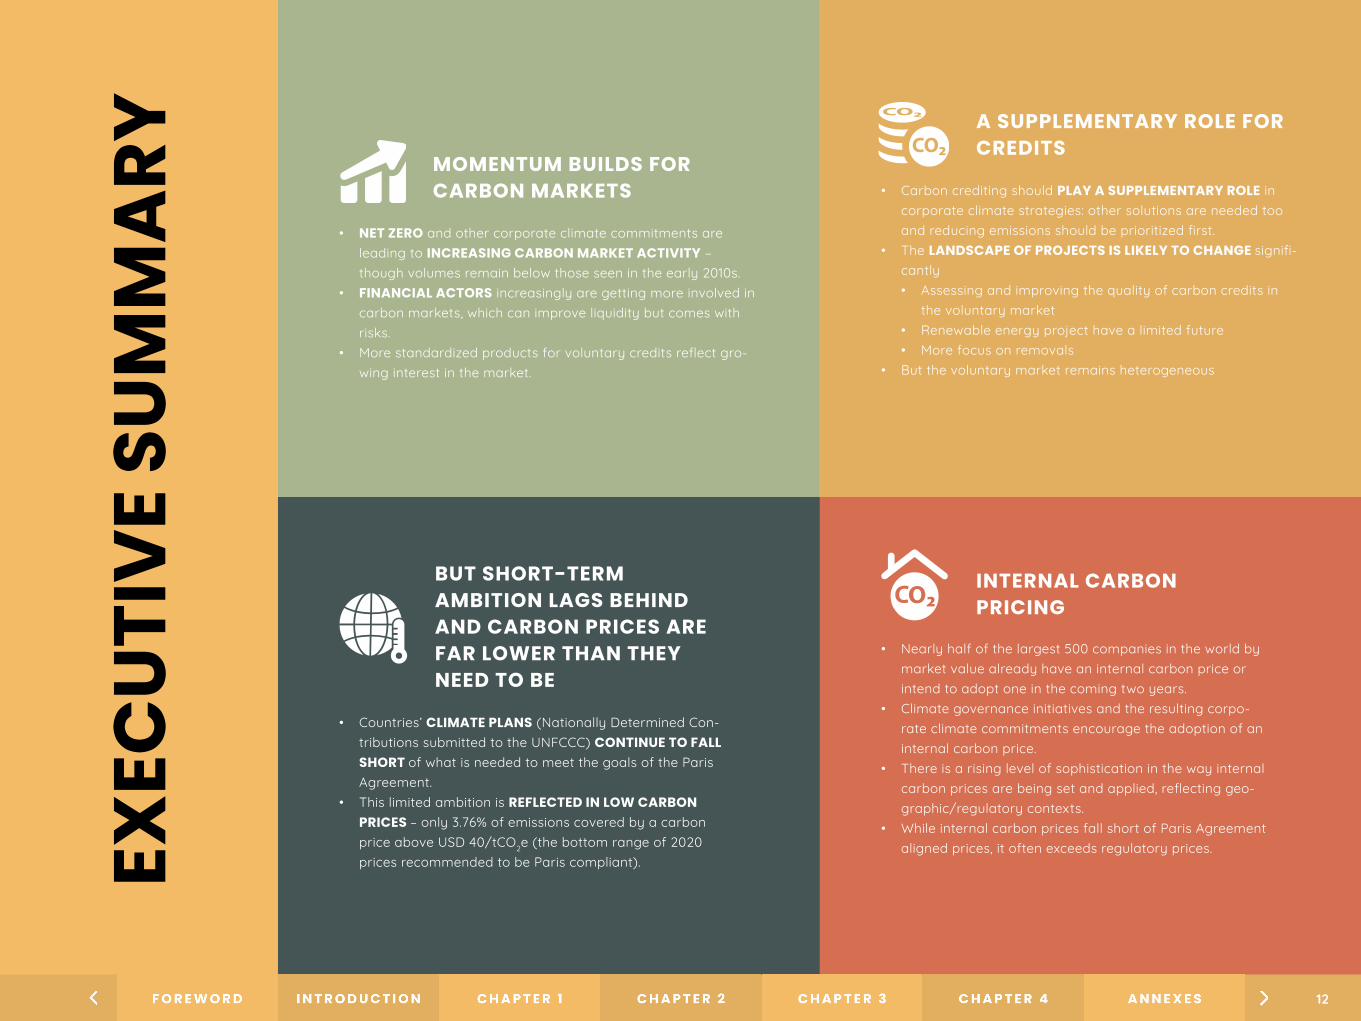
ARY MOMENTUM BUILDS FOR
CARBON MARKETS
• NET ZERO and other corporate climate commitments are leading to INCREASING CARBON MARKET ACTIVITY – though volumes remain below those seen in the early 2010s.
• FINANCIAL ACTORS increasingly are getting more involved in carbon markets, which can improve liquidity but comes with risks.
• More standardized products for voluntary credits reflect gro-wing interest in the market.
A SUPPLEMENTARY ROLE FOR CREDITS
• Carbon crediting should PLAY A SUPPLEMENTARY ROLE in corporate climate strategies: other solutions are needed too and reducing emissions should be prioritized first.
• The LANDSCAPE OF PROJECTS IS LIKELY TO CHANGE signifi-cantly• Assessing and improving the quality of carbon credits in
the voluntary market• Renewable energy project have a limited future• More focus on removals
• But the voluntary market remains heterogeneous
BUT SHORT-TERM AMBITION LAGS BEHIND AND CARBON PRICES ARE FAR LOWER THAN THEY NEED TO BE
• Countries’ CLIMATE PLANS (Nationally Determined Con-tributions submitted to the UNFCCC) CONTINUE TO FALL SHORT of what is needed to meet the goals of the Paris Agreement.
• This limited ambition is REFLECTED IN LOW CARBON PRICES – only 3.76% of emissions covered by a carbon price above USD 40/tCO2e (the bottom range of 2020 prices recommended to be Paris compliant).
INTERNAL CARBON PRICING
• Nearly half of the largest 500 companies in the world by market value already have an internal carbon price or intend to adopt one in the coming two years.
• Climate governance initiatives and the resulting corpo-rate climate commitments encourage the adoption of an internal carbon price.
• There is a rising level of sophistication in the way internal carbon prices are being set and applied, reflecting geo-graphic/regulatory contexts.
• While internal carbon prices fall short of Paris Agreement aligned prices, it often exceeds regulatory prices.
12
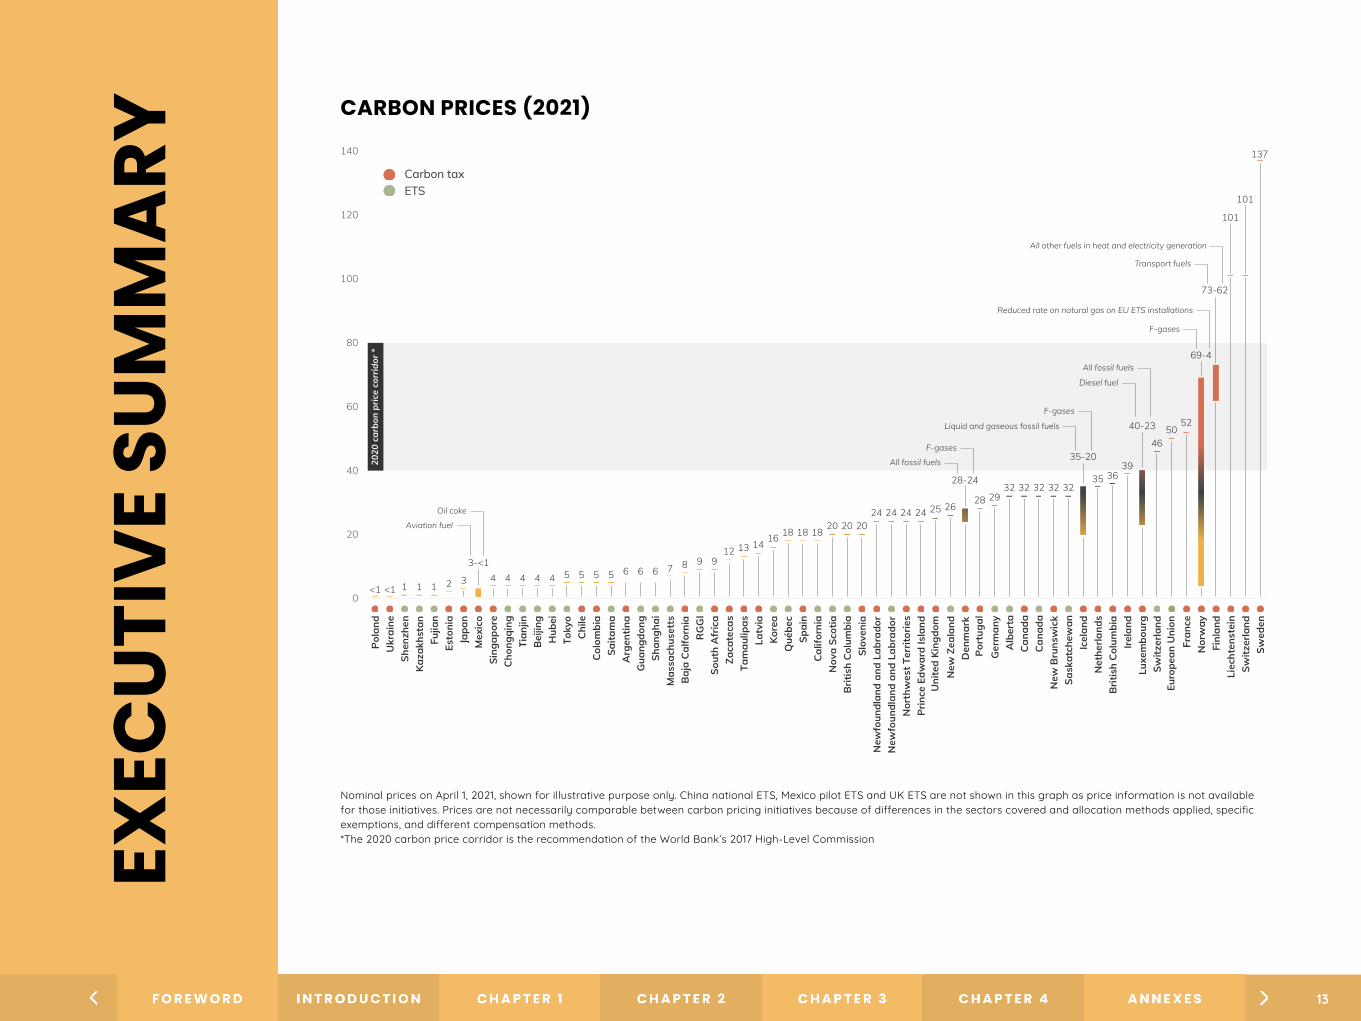
CARBON PRICES (2021)
Nominal prices on April 1, 2021, shown for illustrative purpose only. China national ETS, Mexico pilot ETS and UK ETS are not shown in this graph as price information is not available for those initiatives. Prices are not necessarily comparable between carbon pricing initiatives because of differences in the sectors covered and allocation methods applied, specific exemptions, and different compensation methods.*The 2020 carbon price corridor is the recommendation of the World Bank’s 2017 High-Level CommissionEX
ECUT
IVE
SUM
MA
RY
0
20
40
60
80
100
120
140
Pola
ndU
krai
neSh
enzh
enKa
zakh
stan
Fujia
nEs
toni
aJa
pan
Mex
ico
Sing
apor
eC
hong
qing
Tian
jinB
eijin
gH
ubei
Toky
oCh
ileCo
lom
bia
Saita
ma
Arg
entin
aG
uang
dong
Shan
ghai
Mas
sach
uset
tsB
aja
Calfo
rnia
RG
GI
Sout
h A
fric
aZa
cate
cas
Tam
aulip
asLa
tvia
Kore
aQ
uébe
cSp
ain
Calif
orni
aN
ova
Scot
ia
Euro
pean
Uni
on
Brit
ish
Colu
mbi
aSl
oven
iaN
ewfo
undl
and
and
Labr
ador
New
foun
dlan
d an
d La
brad
orN
orth
wes
t Ter
ritor
ies
Prin
ce E
dwar
d Is
land
New
Zea
land
Port
ugal
Den
mar
k
Ger
man
yA
lber
taCa
nada
New
Bru
nsw
ick
Sask
atch
ewan
Icel
and
Net
herla
nds
Brit
ish
Colu
mbi
aIre
land
Luxe
mbo
urg
Switz
erla
nd
Fran
ceN
orw
ayFi
nlan
dLi
echt
enst
ein
Switz
erla
ndSw
eden
3-<1
<1 <1 1 1 1 2 3
Aviation fuel
Oil coke
4 4 4 4 4 5 5 5 5 6 6 6 7 8 9 912 13 14 16 18 18
20 20 2024 24 24 24 25 26
28
All fossil fuels
F-gases
28-24
2932 32 32 32 32
Liquid and gaseous fossil fuels
F-gases
35-20
35 3639
40-23
4650
52
69-4
73-62
101
101
137
All other fuels in heat and electricity generation
Transport fuels
F-gases
Reduced rate on natural gas on EU ETS installations
Diesel fuel
All fossil fuels20
20 c
arbo
n pr
ice
corr
idor
*
18
Nominal prices on April 1, 2021, shown for illustrative purpose only. China national ETS, Mexico pilot ETS and UK ETS are not shown in this graph as price information is not available for those initiatives. Prices are not necessarily comparable between carbon pricing initiatives because of differences in the sectors covered and allocation methods applied, specific exemptions, and different compensation methods. * The 2020 carbon price corridor is the recommendation of the World Bank’s 2017 High-Level Commission on Carbon Prices Report.
Uni
ted
King
dom
Cana
da
Carbon taxETS
13
Despite the social and economic upheaval caused by COVID-19, jurisdictions and companies have not wavered in their commitment to fighting climate change. The COVID-19 pandemic and its impacts made it clear that massive efforts are needed to enable recovery from the ongoing socioeconomic crisis. The limited effect of the COVID-19 pandemic on carbon pricing instruments demonstrates the resilience of this policy tool. In most ETSs, reduced economic activity resulted in a temporary reduction in allowance prices be-fore quickly recovering, demonstrating the resilience of the price or supply adjustment mechanisms (PSAMs) to safeguard the system’s prices in the face of external shocks. Most scheduled carbon tax rate increases also went ahead as planned, with only a few delays in some jurisdictions. The pandemic also had little impact on the crediting market, which continues to see significant growth as a result of a still-growing corporate interest in using credits from the voluntary market to meet part of their climate targets.
As governments now look toward recovery, building back better will be critical to ensure emissions fall rapidly and we change course to keep global temperatures from increasing more than 1.5˚C. Global economies will need to embark immediately on processes to build green, sustainable, and low-carbon systems while ensuring that social concerns are addressed to ensure that we restructure our economies and societies in a socially fair and just manner. Making the right investments now can unlock short-term gains, such as promoting job creation and restoring economic growth, and deliver long-term benefits in the form of stability and decarbonization. This would also set both countries and companies on the right trajectory to deliver the 2030 emissions reductions needed to align with the temperature goals of the Paris Agreement, as well as longer-term net-zero commitments. As the latest assessment of national clima-te (Nationally Determined Contribution [NDC]) targets and early
1 Data-Driven EnviroLab and NewClimate Institute. (2020). Accelerating Net Zero: Exploring Cities, Regions, and Companies’ Pledges to Decarbonise, https://newcli-mate.org/wp-content/uploads/2020/09/NewClimate_Accelerating_Net_Zero_Sept2020.pdf.
assessments of corporate net-zero targets show, short- and medi-um-term action is woefully misaligned with more ambitious 2050 net-zero targets.
The year 2020 also saw growth in attention to net-zero commit-ments by midcentury, with initiatives like the Race to Zero and the Climate Ambition Alliance. As of December 2020, 127 countries, 823 cities, 101 regions, and 1,541 companies have committed to decarbo-nizing their activities by midcentury.1 Carbon pricing can play a role in reaching net-zero emissions but on its own will not be sufficient to reach net-zero emissions. Other policies are needed both to drive research and development, unlock noneconomic barriers to miti-gation, and target emissions reductions with very high abatement costs. Carbon pricing, if appropriately designed, can help play a role by sending a price signal to incentivize low-carbon action and avoid locking in more fossil fuel-intensive investments.
Carbon pricing instruments can also generate revenues that can be channeled to catalyze clean investment flows, ensure the shift to a sustainable and just transition in the long term, as well as sof-ten distributional impacts and support poverty alleviation. In 2020, initiatives around the world generated USD 53 billion in revenue and covered 21.7% of global GHG emissions.
At the start of this year, China launched its national ETS, becoming the world’s largest carbon market. At the corporate level, more than 850 companies globally across different sectors are using an internal carbon price to integrate climate risks and opportunities into their business strategies and corporate governance structures — an increase of 20% compared to last year’s report. The net-zero debate is also raising questions about the role and design of cre-diting mechanisms as part of a broader net-zero strategy. As the
INTR
OD
UC
TIO
N
14

voluntary market sees increased demand, more information on how the environmental quality of these credits can be assessed and greater transparency of these projects will be important. Offsetting can play a useful role in catalyzing action, but this should not come at the expense or delay of emissions reductions and investments in low-carbon, zero-carbon, or net-negative technologies. Clarity will also be needed on how the vo-luntary market and private sector action can be accounted for in light of government action and their GHG inventories.
As in previous years, this report takes stock of the latest developments in carbon pri-cing initiatives across the globe. It presents trends surrounding their development, their role in various economic sectors, and the policy choices involved. A new addition to the report is a framing chapter illustrating the carbon pricing landscape and clarifying which mechanisms fall within the scope of this report. Chapter 2 provides an overview of carbon taxes and ETSs at the regional, national, and subnational level, with more details on each of these instruments in Annex B. Chapter 3 looks at crediting mechanis-ms, with more detailed updates in Annex C. Chapter 4 looks at internal carbon pricing. Annex A provides general notes on the methodologies, sources, and assumptions used in the report.
15
I N T R O D U C T I O N
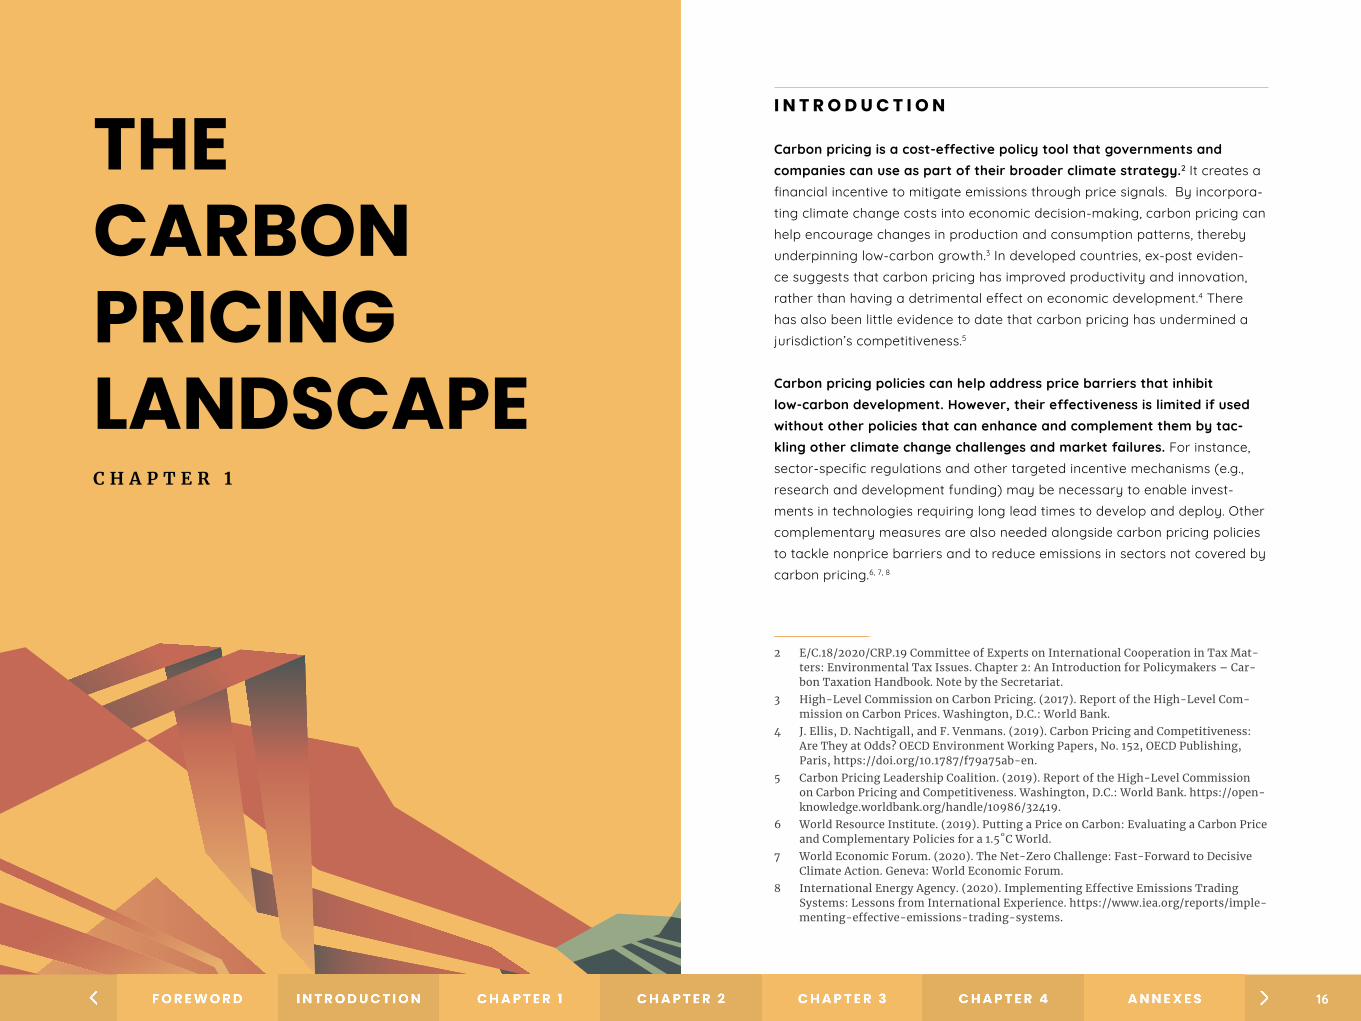
THE CARBON PRICING LANDSCAPEC H A P T E R 1
Carbon pricing is a cost-effective policy tool that governments and companies can use as part of their broader climate strategy.2 It creates a financial incentive to mitigate emissions through price signals. By incorpora-ting climate change costs into economic decision-making, carbon pricing can help encourage changes in production and consumption patterns, thereby underpinning low-carbon growth.3 In developed countries, ex-post eviden-ce suggests that carbon pricing has improved productivity and innovation, rather than having a detrimental effect on economic development.4 There has also been little evidence to date that carbon pricing has undermined a jurisdiction’s competitiveness.5
Carbon pricing policies can help address price barriers that inhibit low-carbon development. However, their effectiveness is limited if used without other policies that can enhance and complement them by tac-kling other climate change challenges and market failures. For instance, sector-specific regulations and other targeted incentive mechanisms (e.g., research and development funding) may be necessary to enable invest-ments in technologies requiring long lead times to develop and deploy. Other complementary measures are also needed alongside carbon pricing policies to tackle nonprice barriers and to reduce emissions in sectors not covered by carbon pricing.6, 7, 8
2 E/C.18/2020/CRP.19 Committee of Experts on International Cooperation in Tax Mat-ters: Environmental Tax Issues. Chapter 2: An Introduction for Policymakers – Car-bon Taxation Handbook. Note by the Secretariat.
3 High-Level Commission on Carbon Pricing. (2017). Report of the High-Level Com-mission on Carbon Prices. Washington, D.C.: World Bank.
4 J. Ellis, D. Nachtigall, and F. Venmans. (2019). Carbon Pricing and Competitiveness: Are They at Odds? OECD Environment Working Papers, No. 152, OECD Publishing, Paris, https://doi.org/10.1787/f79a75ab-en.
5 Carbon Pricing Leadership Coalition. (2019). Report of the High-Level Commission on Carbon Pricing and Competitiveness. Washington, D.C.: World Bank. https://open-knowledge.worldbank.org/handle/10986/32419.
6 World Resource Institute. (2019). Putting a Price on Carbon: Evaluating a Carbon Price and Complementary Policies for a 1.5˚C World.
7 World Economic Forum. (2020). The Net-Zero Challenge: Fast-Forward to Decisive Climate Action. Geneva: World Economic Forum.
8 International Energy Agency. (2020). Implementing Effective Emissions Trading Systems: Lessons from International Experience. https://www.iea.org/reports/imple-menting-effective-emissions-trading-systems.
16
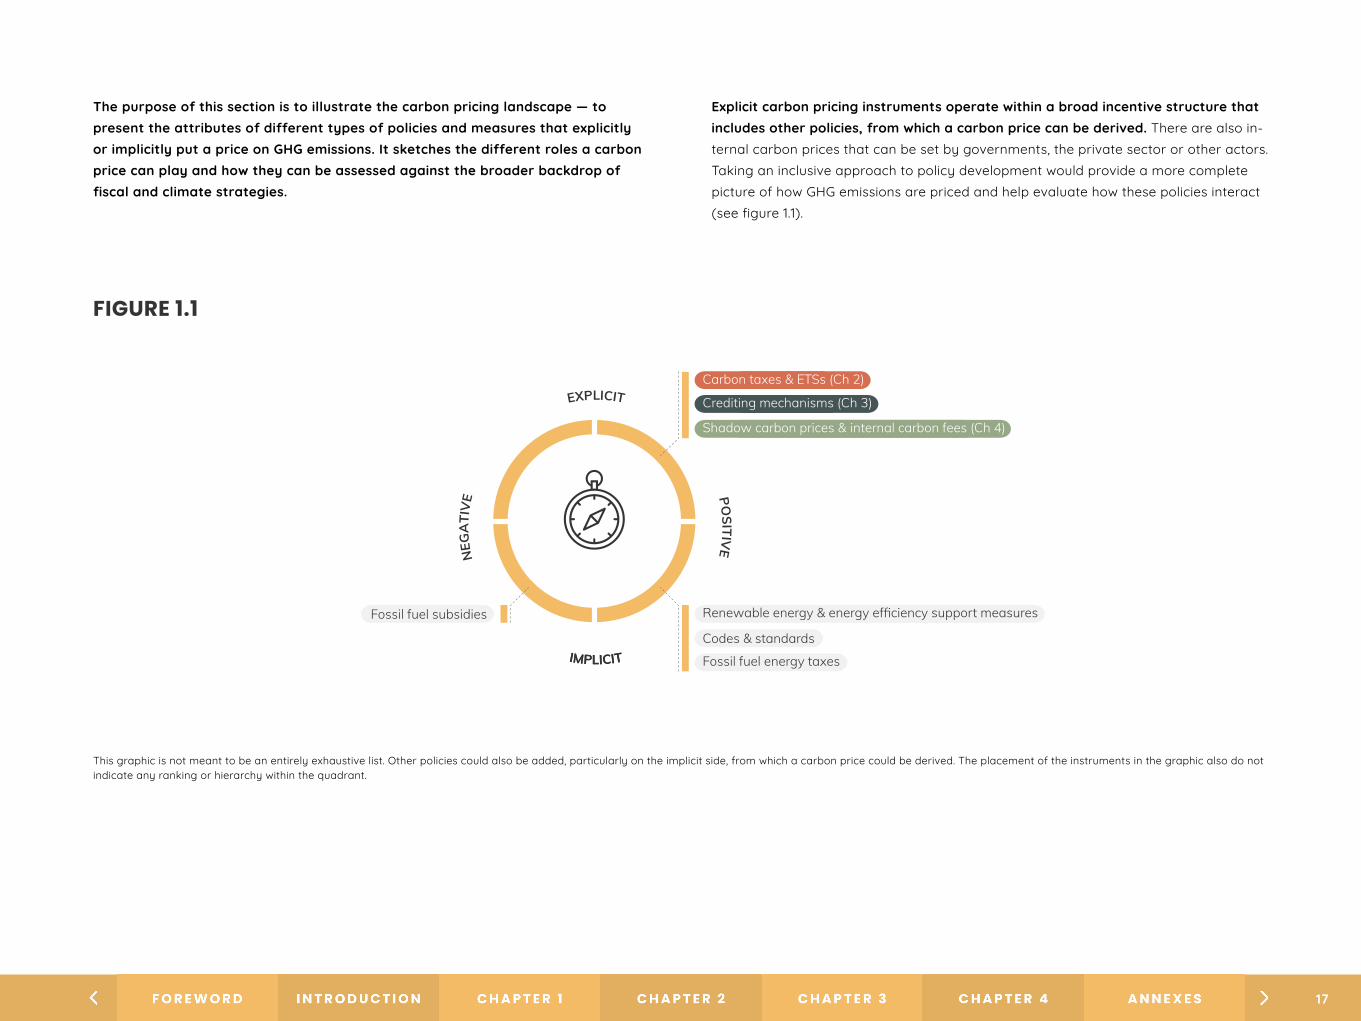
The purpose of this section is to illustrate the carbon pricing landscape — to present the attributes of different types of policies and measures that explicitly or implicitly put a price on GHG emissions. It sketches the different roles a carbon price can play and how they can be assessed against the broader backdrop of fiscal and climate strategies.
Explicit carbon pricing instruments operate within a broad incentive structure that includes other policies, from which a carbon price can be derived. There are also in-ternal carbon prices that can be set by governments, the private sector or other actors. Taking an inclusive approach to policy development would provide a more complete picture of how GHG emissions are priced and help evaluate how these policies interact (see figure 1.1).
FIGURE 1.1 Carbon pricing landscape
POSITIV
E
NEG
ATI
VE
Carbon taxes & ETSs (Ch 2)
This graphic is not meant to be an entirely exhaustive list, other policies could also be added, particularly on the implicit side, from which a carbon price could be derived. The placement of the instruments in the graphic also do not indicate any ranking or hierarchy within the quadrant.
Crediting mechanisms (Ch 3)
Shadow carbon prices & internal carbon fees (Ch 4)
Renewable energy & energy efficiency support measures
Codes & standards
Fossil fuel energy taxes
Fossil fuel subsidies
This graphic is not meant to be an entirely exhaustive list. Other policies could also be added, particularly on the implicit side, from which a carbon price could be derived. The placement of the instruments in the graphic also do not indicate any ranking or hierarchy within the quadrant.
17

Tracking and analyzing all of these carbon pricing concepts and instruments is beyond the scope of this report. The 2021 State and Trends of Carbon Pricing focuses on expli-cit carbon pricing mechanisms, which include carbon taxes, ETSs, and crediting me-chanisms (see Chapters 2 and 3). This includes mechanisms that are under operation, scheduled, and under consideration. It also covers internal carbon pricing by corporati-ons, which can be used for a number of reasons, most commonly to guide their analy-ses and investment decisions but also to raise revenue for other mitigation/adaptation programs (see Chapter 4). Assessments and tracking of implicit carbon pricing policies are not covered in this report.
E X P L I C I T C A R B O N P R I C I N G
Explicit carbon pricing policies are enacted by a government mandate and impo-se a price based on carbon content. They are primarily implemented to encourage cost-effective mitigation as they provide flexibility as to how and when emissions are reduced. Depending on their design, they also generate development benefits by rai-sing revenue for public investment, create new industries and jobs, boost low-carbon investment, improve air quality, and enhance energy security.9
Most commonly, they are enacted by a government mandate through either a carbon tax or an ETS.10 In the case of a carbon tax, the government determines the price and lets market forces determine emissions reductions. The two main forms of an ETS are: cap-and-trade and baseline-and-credit. For cap and trade, the government determines a limit on emissions (“the cap”) in a particular period and al-lowances that make up the cap are either auctioned or allocated according to criteria. The market determines the carbon price. Under a baseline-and-credit system, base-lines are set for regulated emitters. Emitters with emissions above their designated baseline need to surrender credits to make up for these emissions. Emitters that have reduced their emissions below their baseline receive credits for these emission reduc-tions, which they can sell to other emitters. Cap and trade systems and carbon taxes can also generate revenue for governments, which can then be used to further other development goals.
9 Partnership for Market Readiness. Benefits of Carbon Pricing (Forthcoming). Washington, D.C.: World Bank Group.10 Governments may add design elements (e.g., price floors or ceilings in an ETS) that reduce the differences between these two mechanisms.11 World Bank. (2019). State and Trends of Carbon Pricing 2019. Washington, D.C.: World Bank.
Crediting mechanisms create tradable credits from voluntarily implemented emis-sion reduction or removal activities. Crediting activities can range from stand-alone projects to programmatic or sectoral activities that have a broader geographical or technical scope. Credits can be issued through domestic crediting mechanisms, where governments set the rules and basis for generating credits. Alternatively, credits can be issued under international mechanisms, like the potential Article 6.4 mechanism under the Paris Agreement. Credits are also generated through independent standard-setting organizations, like Verra or Gold Standard. Credits can be used to meet compliance de-mand, for instance, in helping companies meet their obligations under a carbon tax or ETS. They may also be used to meet voluntary demand, as part of a company’s net-ze-ro strategy or for other purposes. The sum of credit transactions used for voluntary commitments is commonly referred to as the “voluntary carbon market.” Credits from voluntary market programs can be used for compliance under some carbon taxes or ETSs. However, compliance and voluntary credits are not necessarily fungible.
I M P L I C I T C A R B O N P R I C I N G
By calculating the equivalent monetary value per tonne of carbon associated with a given policy instrument, many policies can theoretically derive an implicit carbon price.11 The calculation of such a carbon price, known as an implicit carbon price, seeks to find a common means to compare the stringency of different mitigation policies, like performance/efficiency standards (e.g., for buildings or appliances) or regulations that mandate the use of specific low- or zero-carbon technologies (e.g., renewable energy targets). In these cases, the policy does not directly apply a cost to emitting carbon and are usually put in place to address other climate objectives and tackle nonpri-ce barriers. An implicit carbon price would need to be calculated separately for such policies. In some instances, policies and measures have a positive implicit carbon price, whereas others have a negative price.
18
Estimating implicit carbon prices of policy instruments requires a quantification approach, which can be complex in many cases. There is also considerable debate as to which policies can be considered implicit carbon prices and the methodologies used to calculate these prices. The 2019 State and Trends of Carbon Pricing Report explored this issue, focusing on fuel taxes and fossil fuel subsidies as the two policies most closely related to explicit carbon pricing.
Fossil fuel taxes have traditionally been enacted to achieve nonclimate objectives, such as raising public revenue to fund road construction and maintenance. These taxes increase the cost of using fossil fuels and as such put a price on GHG causing activities. If they are not calibrated to reflect a fuel’s carbon content (and therefore a fuel’s relative climate impact), it may not encourage fuel switching, which can support decarbonization in the power sector. The Organisation for Economic Cooperation and Development regularly compiles effective carbon rates, which derive a total carbon price from carbon taxes, energy taxes on fossil fuels, and ETS allowance prices.12 The 2021 analysis measures how close countries are to meeting carbon pricing targets for all energy-related emissions at current and forward-looking benchmark values for carbon costs.13
Fossil fuel subsidies create an implicit negative carbon price, as they reduce the cost of fossil fuel consumption or production (depending on the nature of the sub-sidy). Subsidies have traditionally been used to support strategic sectors or disadvan-taged groups.14 However, removing fossil fuel subsidies is a useful step toward decar-bonizing economies, as they promote greater use of high-carbon fuels, undermining low-carbon development policies — especially carbon pricing. International initiatives to track fossil fuel production and consumption subsidies are maintained by the Orga-nisation for Economic Cooperation and Development, the International Energy Agency, the International Monetary Fund, and the Global Subsidies Initiative.15 These organiza-
12 OECD. (2019). Taxing Energy Use 2019: Using Taxes for Climate Action. Paris: OECD Publishing.13 OECD. Effective Carbon Rates 2021 (Forthcoming).14 Other subsidies, for instance, on water, agriculture, or construction can also create incentives to increase emissions.15 There are also nonfossil fuel subsidies that can be considered. Subsidies to support renewable energy resources can be seen as imposing a positive price on carbon.16 An additional complication is the substantial nonclimate externalities generated from burning fossil fuels. Such implicit subsidies due to the underpricing of externalities are tracked by the International Mone-
tary Fund. See David Coady, Ian Parry, Nghia-piotr Le, and Baoping Shang. (2019). Global Fossil Fuel Subsidies Remain Large: An Update Based on Country-Level Estimates.17 B. Smith. (2020). Microsoft Will Be Carbon Negative by 2030. https://blogs.microsoft.com/blog/2020/01/16/microsoft-will-be-carbon-negative-by-2030/#:~:text=In%20July%202020%2C%20we%20wil-
l,plus%20scope%203%20travel%20emissions.
tions regularly analyze and report the current status of fossil fuel subsidies and their cost to governments.16
Assessing explicit and implicit carbon prices can give governments a nuanced understanding of how incentive structures may perform and allow them to under-stand distributional impacts and address other design issues.
I N T E R N A L C A R B O N P R I C I N G
Carbon pricing is also used voluntarily by corporations, organizations, and go-vernments. This is often done through an internal carbon price, which helps guide investment decisions and promote efficiencies in business operations. However, deeper analysis and assessments of internal carbon pricing is challenging given the lack of transparency and consistency surrounding methodologies, price levels, and use of an internal carbon price. A firm may announce its use or intention to use an internal carbon price, for instance, without explaining how it will be used or what impact it will have. However, the extent to which a shadow price can drive change or be effective depends on how it is applied and the level of the assumed price.
In some cases, a firm can use an internal carbon price as an internal carbon fee where different units pay a carbon price. This can be used to raise revenue or gene-rate an investment stream for other corporate climate policies. Microsoft, for instance, applies an internal carbon fee on its emissions (scope 1, 2, and 3 travel emissions). The revenue raised is invested in sustainability and carbon removal activities.17
19
Unlike a carbon tax or an ETS, an internal carbon price may not actually incur a cost,18 for instance, if it is used as a benchmark or screen for financial appraisals. Multilateral development banks, including the World Bank, and some governments use a shadow carbon price when evaluating public investments. For governments, these monetary estimates can help assess the costs and benefits of government actions and provide a common metric to assess the relative ambition of policies in other jurisdicti-ons.
18 An alternative way internal carbon pricing can be used by the private sector is to create an internal carbon fee. In this case, it functions like a government-levied carbon tax, creating an economic incentive to mitigate corporate emissions and generating resources from within the company that are most often used to fund clean energy and climate-related corporate programs.
20

HOOFSTUK TITEL OVER MEERDERE REGELSN U M M E R
This year there are 64 carbon pricing instruments (CPIs) in operation and three scheduled for implementation (see figure 2.1). This is an increase of six instruments compared to 2020, which had 58 carbon taxes and ETSs in operation.19
In 2021, 21.5% of global GHG emissions are covered by carbon pricing in-struments in operation, representing a significant increase on 2020, when only 15.1% of global emissions were covered (see figure 2.2). This incre-ase is largely due to the launch of China’s national ETS. In previous years, coverage was also calculated including CPIs scheduled for implementation, therefore, as this year’s report only focuses on CPIs in operation, the percen-tage of GHG emissions covered is the same as last year’s report.
China’s national ETS launched in February 2021, becoming the world’s largest carbon market. Initially covering around 2,225 entities in the power generation industry, the plan regulates annual emissions of around 4,000 MtCO2. Regulated entities will need to surrender allowances to cover their 2019 and 2020 emissions in 2021. Penalties for the national ETS are currently being drafted by the State Council, with interim regulations proposing fines for entities that fail to surrender sufficient allowances by the compliance deadline: CNY 100,000–500,000 (USD 15,217–76,087).20 Trading is planned to start before the end of June 2021. The national carbon market will be a tool to promote China’s commitment to peak carbon before 2030 and achieve carbon neutrality before 2060.21 More details on the role of the ETS in China’s overall climate policy mix are outlined in box 2.1.
19 In previous editions, the Report included both in operation and scheduled mecha-nisms, as such, last year’s Report shows a total figure for 2020 of 61 carbon pricing instruments.
20 The Ministry of Environment and Ecology is urging the State Council to approve the State Council Regulation for the National ETS, which could impose a penalty for non-compliance of two to five times the average market price.
21 Interim Regulations on the Management of Carbon Emissions Trading (Draft for Comment).
C O V E R A G E A N D N E W I N S T R U M E N T S
CARBON TAXES AND EMISSIONS TRADING SYSTEMSC H A P T E R 2
21
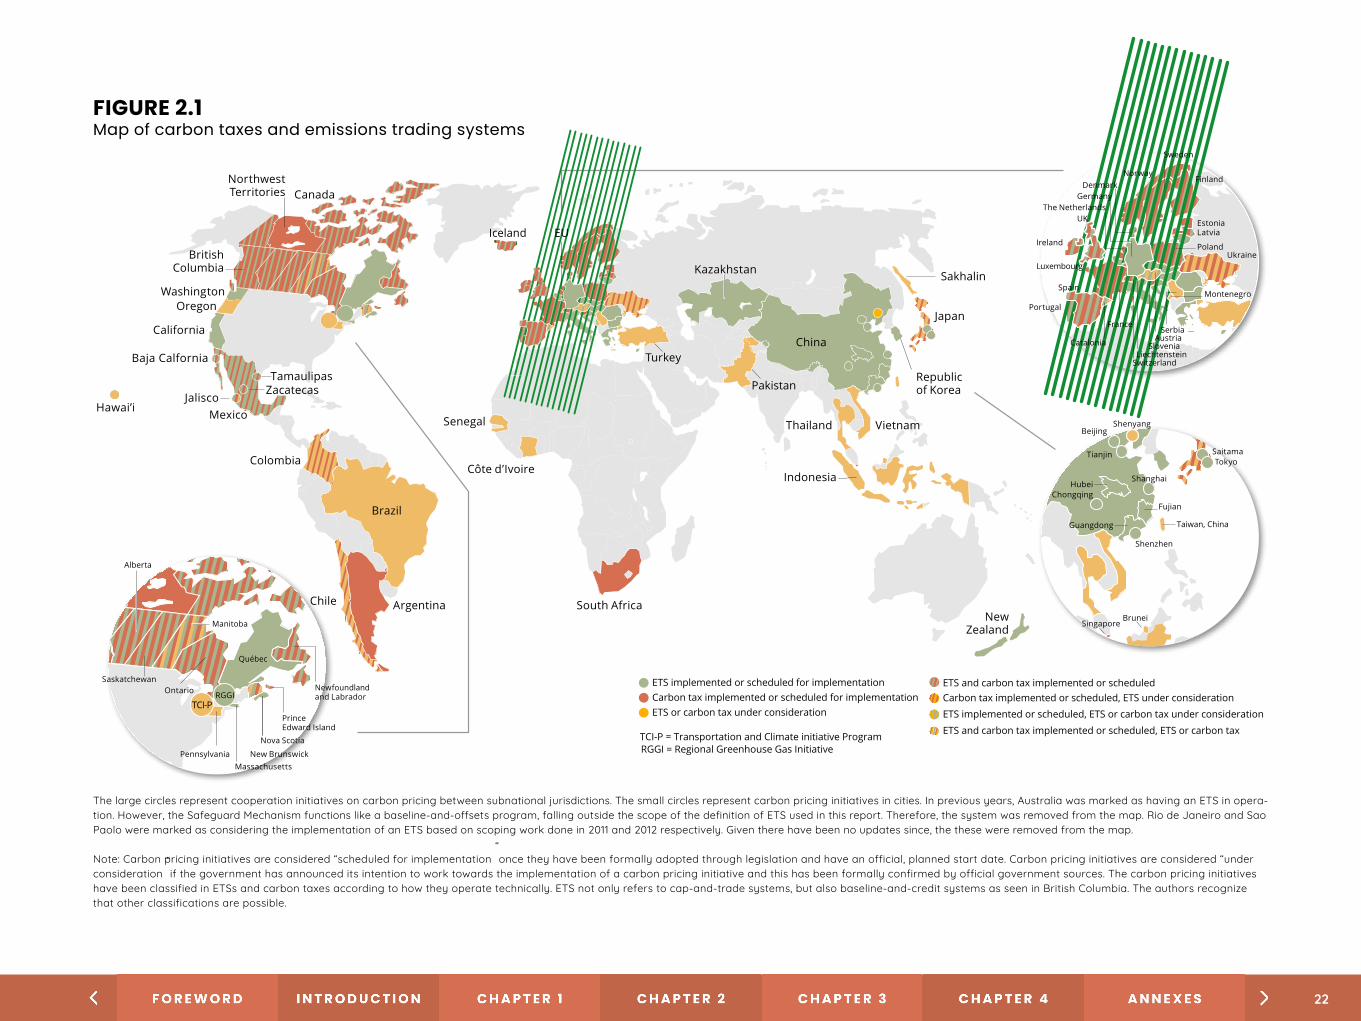
FIGURE 2.1 Map of carbon taxes and emissions trading systems
ETS implemented or scheduled for implementation
Carbon tax implemented or scheduled for implementation
ETS or carbon tax under consideration
RGGI = Regional Greenhouse Gas InitiativeTCI-P = Transportation and Climate initiative Program
ETS and carbon tax implemented or scheduled Carbon tax implemented or scheduled, ETS under consideration
ETS implemented or scheduled, ETS or carbon tax under consideration
ETS and carbon tax implemented or scheduled, ETS or carbon tax
Prince Edward Island
Alberta
Nova Scotia
SaskatchewanOntario
Québec
Manitoba
New Brunswick
Newfoundlandand Labrador
MassachusettsPennsylvania
TCI-PRGGI
Ukraine
Norway
UK
Portugal
France
Switzerland
Slovenia
Montenegro
Poland
LatviaEstonia
Finland
Sweden
GermanyDen mark
Ireland
LiechtensteinCatalonia
Spain
Luxembourg
The Netherlands
AustriaSerbia
Shanghai
Shenzhen
Fujian
Beijing
Tianjin
HubeiChongqing
Guangdong
TokyoSaitama
Taiwan, China
Brunei
Shenyang
Singapore
Chile
Turkey
Pakistan
China
Northwest Territories Canada
British Columbia
WashingtonOregon
California
Baja Calfornia
Mexico
TamaulipasZacatecas
Brazil
South AfricaNew
Zealand
Thailand
EU
Kazakhstan
Republic
Sakhalin
Japan
Iceland
Colombia
Vietnam
Argentina
Côte d’Ivoire
SenegalHawai’i
Jaliscoof Korea
Indonesia
The large circles represent cooperation initiatives on carbon pricing between subnational jurisdictions. The small circles represent carbon pricing initiatives in cities. In previous years, Australia was marked as having an ETS in opera-tion. However, the Safeguard Mechanism functions like a baseline-and-offsets program, falling outside the scope of the definition of ETS used in this report. Therefore, the system was removed from the map. Rio de Janeiro and Sao Paolo were marked as considering the implementation of an ETS based on scoping work done in 2011 and 2012 respectively. Given there have been no updates since, the these were removed from the map.
Note: Carbon pricing initiatives are considered “scheduled for implementation” once they have been formally adopted through legislation and have an official, planned start date. Carbon pricing initiatives are considered “under consideration” if the government has announced its intention to work towards the implementation of a carbon pricing initiative and this has been formally confirmed by official government sources. The carbon pricing initiatives have been classified in ETSs and carbon taxes according to how they operate technically. ETS not only refers to cap-and-trade systems, but also baseline-and-credit systems as seen in British Columbia. The authors recognize that other classifications are possible.
22
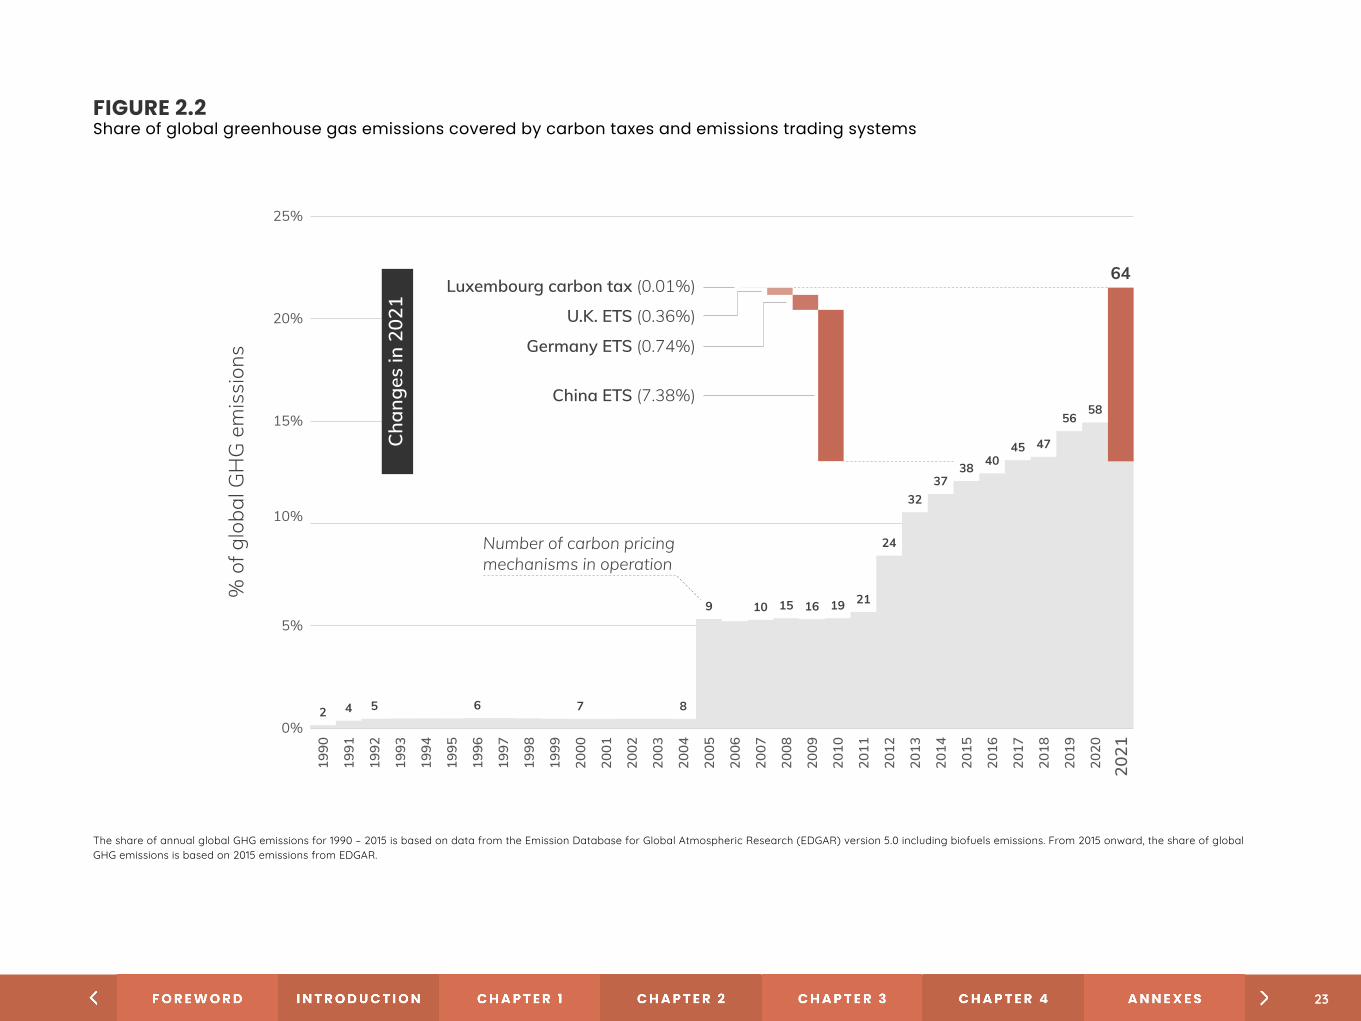
FIGURE 2.2 Share of global greenhouse gas emissions covered by carbon taxes and emissions trading systems
2 4 5 6 7 8
9 10 15 16 19 21
24
3237
38 4045 47
5658
1990
1991
1992
1993
1994
1995
1996
1997
1998
1999
2000
2001
2002
2003
2004
2005
2006
2007
2008
2009
2010
2011
2012
2013
2014
2015
2016
2017
2018
2019
2020
0%
5%
10%
15%
20%
25%%
of g
loba
l GH
G e
mis
sion
s
2021
64
Number of carbon pricing mechanisms in operation
China ETS (7.38%)
Germany ETS (0.74%)
U.K. ETS (0.36%)
Luxembourg carbon tax (0.01%)
Cha
nges
in 2
021
The share of annual global GHG emissions for 1990 – 2015 is based on data from the Emission Database for Global Atmospheric Research (EDGAR) version 5.0 including biofuels emissions. From 2015 onward, the share of global GHG emissions is based on 2015 emissions from EDGAR.
23
BOX 2.1Other policy developments in China
China’s national ETS will interact with a wide array of existing policy instruments in the power sector, as well as other sectoral policies, as the carbon market expands its coverage. This will only increase with new energy and climate policies or targets from both the national and provincial level expected in the wake of China’s 2030 and 2060 goals.
In March 2021, the government announced the 14th Five Year Plan, which included energy and climate goals for 2021–2025. The plan proposes a 13.5% reduction in energy intensity and an 18% reduction in CO2 emissions intensity from 2020 levels. A 20% target for nonfossil energy in total energy consumption was also outlined. More detailed climate targets, including an economy-wide CO2 emissions cap (independent of the ETS), will likely be outlined in the forthcoming 14th Five Year Plan on GHG Emissions Control and Prevention. Energy sector-specific plans are expected to be re-leased later in 2021, which are also anticipated to contain targets on coal consumption and produc-tion, as well as renewable energy development.
The Ministry of Ecology and Environment is also working on an action plan to peak CO2 emissions by 2030, including the development of action plans and targets at the provincial and industry level. These targets can help design an absolute cap for the national ETS.
In addition, policy developments in the energy sector will also interact with China’s national ETS. These include the energy use quota exchange policy, which has been identified as a priority for 2021 and is being developed by the Environment and Natural Resource Department at the Natio-nal Development and Reform Commission. The design for the national energy use quota market is due to be released by the end of 2021. As this market also targets the energy consumption of energy-intensive industries, it will likely have an impact on the national ETS. The national Renewa-ble Portfolio Standard was launched in 2020, with province-, grid-, and companywide targets to be established. Covered entities can also trade green certificates to reach their targets. The influence of these policies on the electricity market will have a bearing on the national ETS cap and alloca-tion. Finally, China’s ongoing structural reform to liberalize the power sector may also open the possibility of regulating direct emissions in the future. Currently, due to China’s regulated power structure, both direct and indirect emissions are covered under the national ETS.
The announcement of the European Green Deal recovery pack-age and new 2030 mitigation targets has triggered wide-ranging changes for the European Union ETS. In 2020, the European Green Deal was also announced, including a proposal for the European Climate Law legislating a 2050 climate neutrality objective and a 2030 Climate Target Plan to reduce net emissions by at least 55% by 2030. As part of this, there will be a revision of the EU ETS, with a proposal expected in June 2021 to align it with the more ambi-tious 2030 target. In addition to considering a more ambitious cap trajectory and reviewing the Market Stability Reserve (MSR), the EU is planning to extend the ETS to maritime transport, ensure the contribution of the aviation sector is in line with new objectives, and assess the possibility of also extending carbon pricing to the trans-port and buildings sectors with a view to harmonizing economic incentives to reduce emissions while also raising revenue for climate action and addressing social and distributional concerns.22
National carbon pricing instruments were also launched in se-veral European countries. Following its departure from the EU, the United Kingdom stopped participating in the EU ETS on January 1, 2021. On the same day, the U.K. ETS came into operation, close-ly resembling the design of Phase 4 of the EU ETS. Covering the power, industry, and domestic aviation sector, the cap will reduce emissions by 4.2 Mt annually and will be revised in 2024 in line with the country’s 2050 net-zero trajectory. Germany’s national fuel ETS also came into operation, covering all fuel emissions not regulated under the EU ETS — around 40% of national GHG emissions. The Netherlands Industry Carbon Tax Act (Wet CO₂-heffing industrie) entered into force on January 1, 2021, with a rate of EUR 30 (USD
22 European Commission. (2020). Stepping up Europe’s 2030 Cli-mate Ambition: Investing in a Climate-Neutral Future for the Benefit of our People. https://eur-lex.europa.eu/resource.ht-ml?uri=cellar:749e04bb-f8c5-11ea-991b-01aa75ed71a1.0001.02/DOC_1&-format=PDF.
24

35.24)/tCO2e.23 The policy targets industrial installations in the Netherlands subject to the EU ETS — acting as a top up fee — as well as waste incinerators and facilities emitting large amounts of nitrous oxide that are not covered under the EU ETS. Luxem-bourg’s carbon tax, which covers emissions from transport, shipping, and buildings, also started operation at EUR 31.56 (USD 37.07)/tCO2 for petrol, EUR 34.16 (USD 40.12)/tCO2 for diesel, and EUR 20 (USD 23.49)/tCO2 for all other energy products except electricity.
On the subnational level, two carbon taxes came into effect in Mexico. The Baja California carbon tax entered into force on May 1, 2020, for the sale of gasoline, diesel, natural gas, and liquefied petroleum gas. Revenues from the carbon tax will be redistri-buted to the five municipalities and will be allocated to the state budget. In July 2020, the Mexican state of Tamaulipas passed legislation enacting a carbon tax starting in 2021, equivalent to about MXN 250 (USD 12.23)/tCO2e to fixed sources and facilities that emit more than 25 tCO2e of GHG monthly.
P R I C E D E V E L O P M E N T S
A majority of carbon prices still remain far below the USD 40–80/tCO2e range nee-ded in 2020 to meet the 2°C temperature goal of the Paris Agreement24 — only 3.76% of global emissions are covered by a carbon price at and above this range (see figure 2.4). Even higher prices will be needed over the next decade to reach the 1.5°C target.25
Reduced economic activity as a result of COVID-19 saw allowance prices briefly dip before quickly recovering in most ETSs. The allowance price in the EU ETS and New Zealand quickly recovered and prices in both systems reached record highs in ear-ly 2021 (see figure 2.5). In the Republic of Korea, prices fell from May onward before starting to move up again in late summer, while the California–Québec market price
23 Rijksoverheid. (2020). Bill CO2 Tax Industry. https://www.rijksoverheid.nl/documenten/kamerstukken/2020/09/15/wetsvoorstel-wet-co2-heffing-industrie.24 This is the price range for 2020 recommended in the World Bank’s High-Level Commission on Carbon Prices Report (2017). Note: a carbon price at these levels will not be sufficient to generate the kind of chan-
ges at the speed and scale required to reach the Paris targets. Other complementary policies will be needed as part of a comprehensive climate change portfolio. For more see https://www.carbonpricingleader-ship.org/report-of-the-highlevel-commission-on-carbon-prices.
25 According to a recent study by Woodmac, carbon prices of USD 160/tCO2e would be needed over the coming decade to meet the 1.5°C target. https://www.woodmac.com/press-releases/significant-increase-in-carbon-pricing-is-key-in-1.5-degree-world/.
26 For more information, also see the ICAP Status Report (2021).
stayed around the auction floor price of USD 16.68. Though auctions were undersubscri-bed in May and August 2020, stronger demand returned by November. In the Regional Greenhouse Gas Initiative (RGGI), prices also remained relatively stable. This provides a stark contrast to the 2007–2008 financial crisis and subsequent economic downturn, which led to sustained price depressions across multiple systems. This recovery was li-kely aided by the existence of PSAMs in ETSs (see below) and announcements of more ambitious mitigation targets and related adjustments, such as the reform to the New Zealand system.26
25
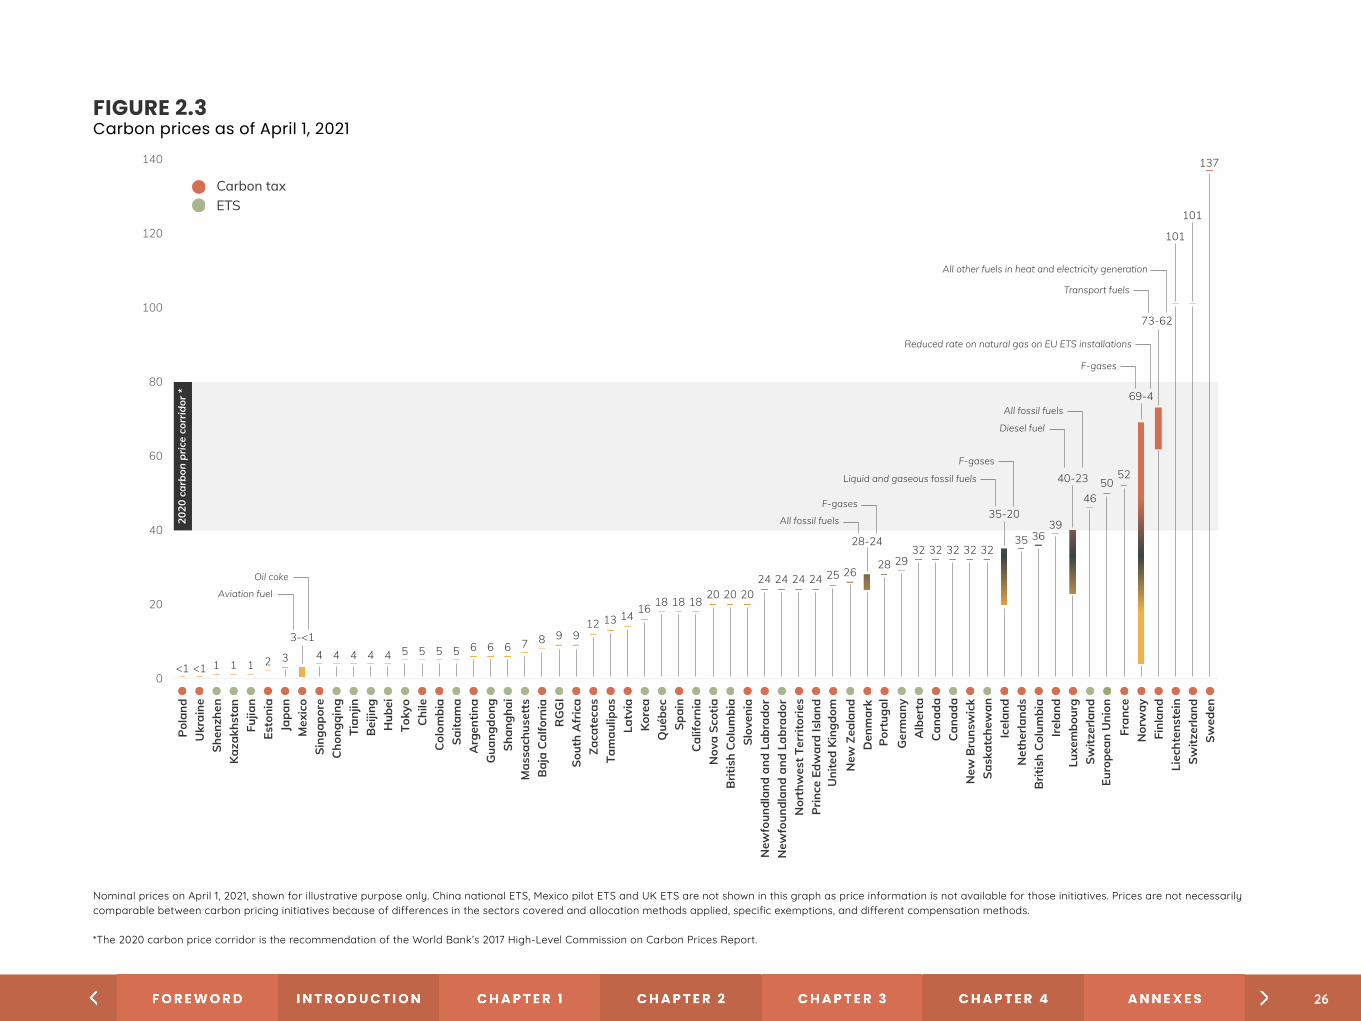
FIGURE 2.3Carbon prices as of April 1, 2021
0
20
40
60
80
100
120
140
Pola
ndU
krai
neSh
enzh
enKa
zakh
stan
Fujia
nEs
toni
aJa
pan
Mex
ico
Sing
apor
eC
hong
qing
Tian
jinB
eijin
gH
ubei
Toky
oCh
ileCo
lom
bia
Saita
ma
Arg
entin
aG
uang
dong
Shan
ghai
Mas
sach
uset
tsB
aja
Calfo
rnia
RG
GI
Sout
h A
fric
aZa
cate
cas
Tam
aulip
asLa
tvia
Kore
aQ
uébe
cSp
ain
Calif
orni
aN
ova
Scot
ia
Euro
pean
Uni
on
Brit
ish
Colu
mbi
aSl
oven
iaN
ewfo
undl
and
and
Labr
ador
New
foun
dlan
d an
d La
brad
orN
orth
wes
t Ter
ritor
ies
Prin
ce E
dwar
d Is
land
New
Zea
land
Port
ugal
Den
mar
k
Ger
man
yA
lber
taCa
nada
New
Bru
nsw
ick
Sask
atch
ewan
Icel
and
Net
herla
nds
Brit
ish
Colu
mbi
aIre
land
Luxe
mbo
urg
Switz
erla
nd
Fran
ceN
orw
ayFi
nlan
dLi
echt
enst
ein
Switz
erla
ndSw
eden
3-<1
<1 <1 1 1 1 2 3
Aviation fuel
Oil coke
4 4 4 4 4 5 5 5 5 6 6 6 7 8 9 912 13 14 16 18 18
20 20 2024 24 24 24 25 26
28
All fossil fuels
F-gases
28-24
2932 32 32 32 32
Liquid and gaseous fossil fuels
F-gases
35-20
35 3639
40-23
4650
52
69-4
73-62
101
101
137
All other fuels in heat and electricity generation
Transport fuels
F-gases
Reduced rate on natural gas on EU ETS installations
Diesel fuel
All fossil fuels
2020
car
bon
pric
e co
rrid
or *
18
Nominal prices on April 1, 2021, shown for illustrative purpose only. China national ETS, Mexico pilot ETS and UK ETS are not shown in this graph as price information is not available for those initiatives. Prices are not necessarily comparable between carbon pricing initiatives because of differences in the sectors covered and allocation methods applied, specific exemptions, and different compensation methods. * The 2020 carbon price corridor is the recommendation of the World Bank’s 2017 High-Level Commission on Carbon Prices Report.
Uni
ted
King
dom
Cana
da
Carbon taxETS
Nominal prices on April 1, 2021, shown for illustrative purpose only. China national ETS, Mexico pilot ETS and UK ETS are not shown in this graph as price information is not available for those initiatives. Prices are not necessarily comparable between carbon pricing initiatives because of differences in the sectors covered and allocation methods applied, specific exemptions, and different compensation methods.
*The 2020 carbon price corridor is the recommendation of the World Bank’s 2017 High-Level Commission on Carbon Prices Report.
26
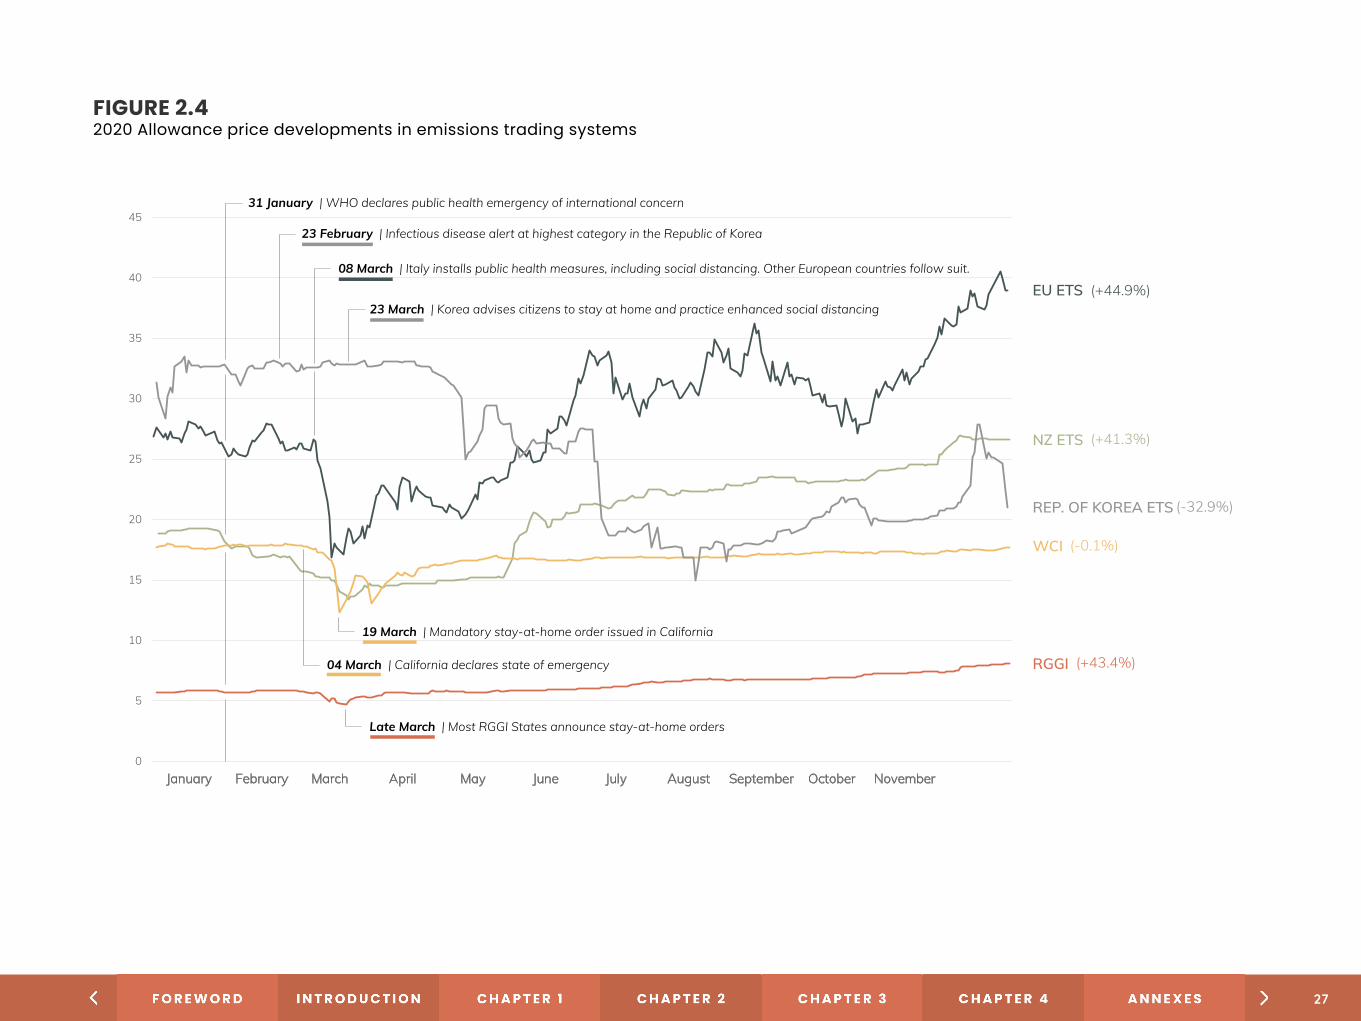
FIGURE 2.42020 Allowance price developments in emissions trading systems
(+44.9%)
0
5
10
15
20
25
30
35
40
45
January February March April May June July August September October November
December
EU ETS
NZ ETS
REP. OF KOREA ETS
WCI
RGGI
31 January | WHO declares public health emergency of international concern
23 February | Infectious disease alert at highest category in the Republic of Korea
04 March | California declares state of emergency
08 March | Italy installs public health measures, including social distancing. Other European countries follow suit.
19 March | Mandatory stay-at-home order issued in California
23 March | Korea advises citizens to stay at home and practice enhanced social distancing
(+41.3%)
(-32.9%)
(-0.1%)
(+43.4%)
Late March | Most RGGI States announce stay-at-home orders
27
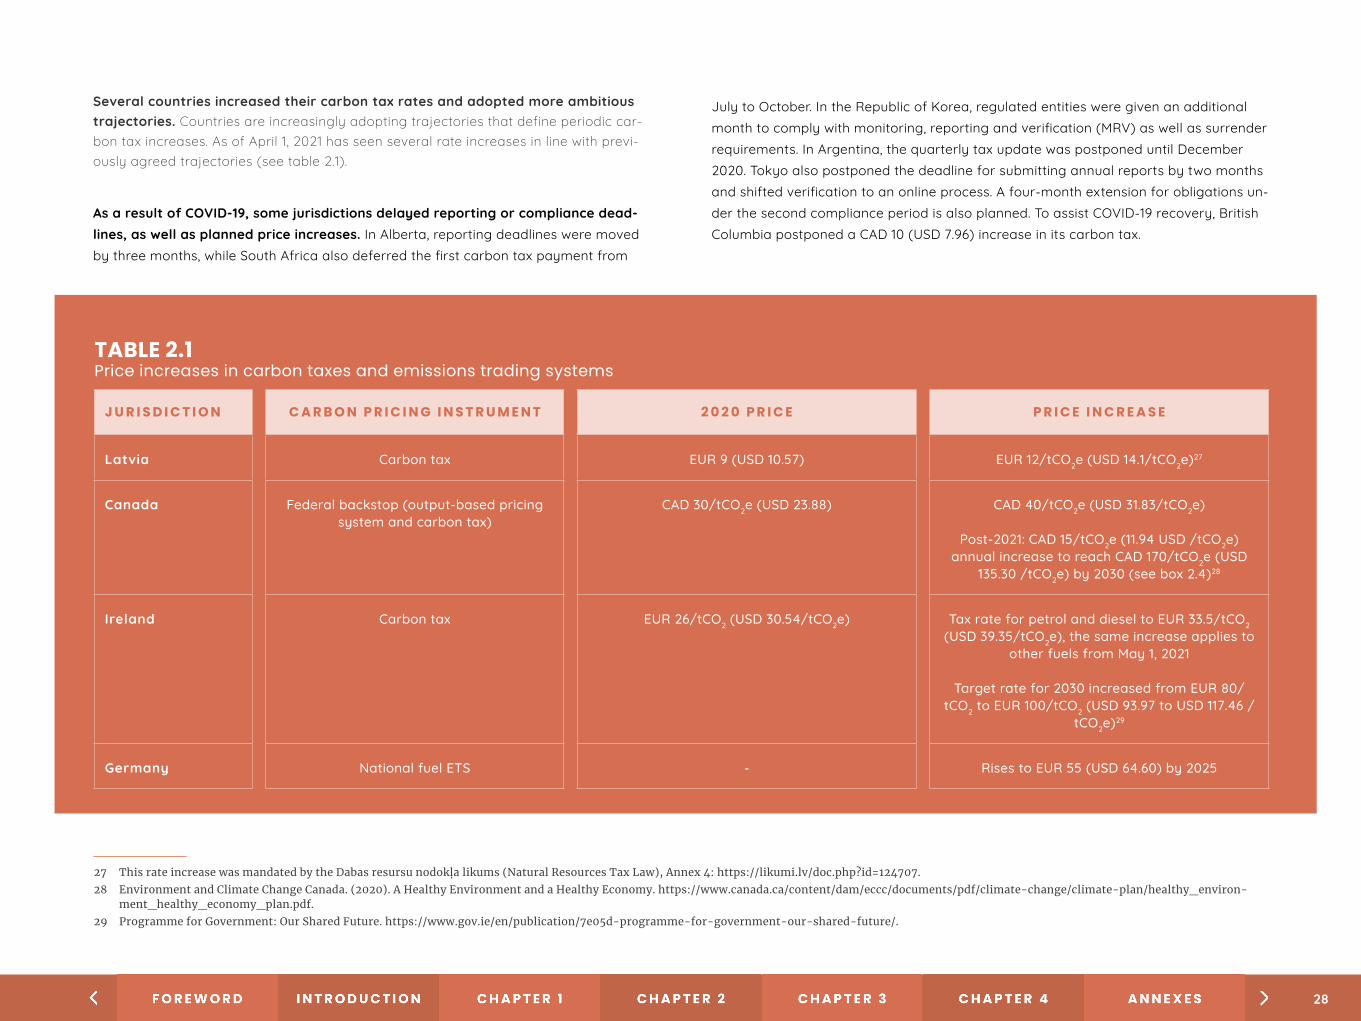
TABLE 2.1 Price increases in carbon taxes and emissions trading systems
Several countries increased their carbon tax rates and adopted more ambitious trajectories. Countries are increasingly adopting trajectories that define periodic car-bon tax increases. As of April 1, 2021 has seen several rate increases in line with previ-ously agreed trajectories (see table 2.1).
As a result of COVID-19, some jurisdictions delayed reporting or compliance dead-lines, as well as planned price increases. In Alberta, reporting deadlines were moved by three months, while South Africa also deferred the first carbon tax payment from
July to October. In the Republic of Korea, regulated entities were given an additional month to comply with monitoring, reporting and verification (MRV) as well as surrender requirements. In Argentina, the quarterly tax update was postponed until December 2020. Tokyo also postponed the deadline for submitting annual reports by two months and shifted verification to an online process. A four-month extension for obligations un-der the second compliance period is also planned. To assist COVID-19 recovery, British Columbia postponed a CAD 10 (USD 7.96) increase in its carbon tax.
J U R I S D I C T I O N C A R B O N P R I C I N G I N S T R U M E N T 2 0 2 0 P R I C E P R I C E I N C R E A S E
Latvia Carbon tax EUR 9 (USD 10.57) EUR 12/tCO2e (USD 14.1/tCO2e)27
Canada Federal backstop (output-based pricing system and carbon tax)
CAD 30/tCO2e (USD 23.88) CAD 40/tCO2e (USD 31.83/tCO2e)
Post-2021: CAD 15/tCO2e (11.94 USD /tCO2e) annual increase to reach CAD 170/tCO2e (USD
135.30 /tCO2e) by 2030 (see box 2.4)28
Ireland Carbon tax EUR 26/tCO2 (USD 30.54/tCO2e) Tax rate for petrol and diesel to EUR 33.5/tCO2 (USD 39.35/tCO2e), the same increase applies to
other fuels from May 1, 2021
Target rate for 2030 increased from EUR 80/tCO2 to EUR 100/tCO2 (USD 93.97 to USD 117.46 /
tCO2e)29
Germany National fuel ETS - Rises to EUR 55 (USD 64.60) by 2025
27 This rate increase was mandated by the Dabas resursu nodokļa likums (Natural Resources Tax Law), Annex 4: https://likumi.lv/doc.php?id=124707.28 Environment and Climate Change Canada. (2020). A Healthy Environment and a Healthy Economy. https://www.canada.ca/content/dam/eccc/documents/pdf/climate-change/climate-plan/healthy_environ-
ment_healthy_economy_plan.pdf.29 Programme for Government: Our Shared Future. https://www.gov.ie/en/publication/7e05d-programme-for-government-our-shared-future/.
28
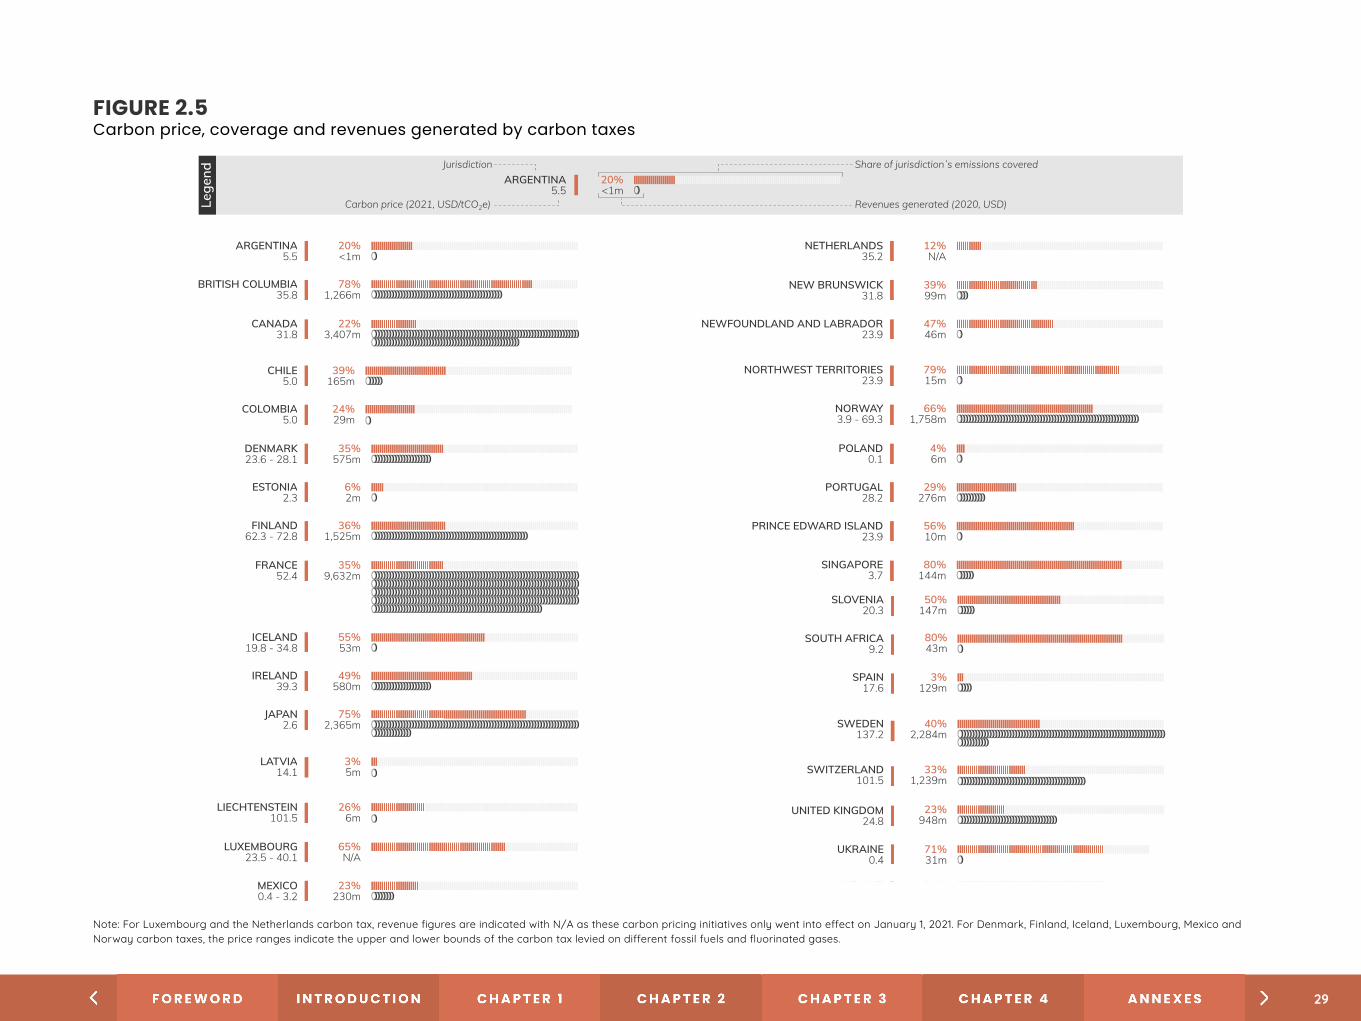
FIGURE 2.5Carbon price, coverage and revenues generated by carbon taxes
ARGENTINA5.5
20%<1m
BRITISH COLUMBIA35.8
78%1,266m
CANADA31.8
22%3,407m
12%N/A
NETHERLANDS35.2
NEW BRUNSWICK31.8
39%99m
NEWFOUNDLAND AND LABRADOR23.9
47%46m
ARGENTINA5.5
20%<1m
Jurisdiction
Carbon price (2021, USD/tCO2e)
Share of jurisdictionʾs emissions covered
Revenues generated (2020, USD)Lege
nd
26%6m
LIECHTENSTEIN101.5
65%N/A
LUXEMBOURG23.5 - 40.1
MEXICO0.4 - 3.2
23%230m
UKRAINE0.4
71%31m
33%1,239m
SWITZERLAND101.5
UNITED KINGDOM24.8
23%948m
Note: For Luxembourg and the Netherlands carbon tax, revenue figures are indicated with N/A as these carbon pricing initiatives only went into effect on January 1, 2021. For Denmark, Finland, Iceland, Luxembourg, Mexico and Norway carbon taxes, the price ranges indicate the upper and lower bounds of the carbon tax levied on different fossil fuels and fluorinated gases.
CHILE5.0
39%165m
COLOMBIA5.0
24%29m
DENMARK23.6 - 28.1
35%575m
ESTONIA2.3
6%2m
FINLAND62.3 - 72.8
36%1,525m
FRANCE52.4
35%9,632m
NORTHWEST TERRITORIES23.9
79%15m
NORWAY3.9 - 69.3
66%1,758m
POLAND0.1
4%6m
PORTUGAL28.2
29%276m
PRINCE EDWARD ISLAND23.9
56%10m
SINGAPORE3.7
80%144m
ICELAND19.8 - 34.8
55%53m
IRELAND39.3
49%580m
JAPAN2.6
75%2,365m
SLOVENIA20.3
50%147m
SOUTH AFRICA9.2
80%43m
SPAIN17.6
3%129m
LATVIA14.1
3%5m
SWEDEN137.2
40%2,284m
Note: For Luxembourg and the Netherlands carbon tax, revenue figures are indicated with N/A as these carbon pricing initiatives only went into effect on January 1, 2021. For Denmark, Finland, Iceland, Luxembourg, Mexico and Norway carbon taxes, the price ranges indicate the upper and lower bounds of the carbon tax levied on different fossil fuels and fluorinated gases.
ARGENTINA5.5
20%<1m
BRITISH COLUMBIA35.8
78%1,266m
CANADA31.8
22%3,407m
12%N/A
NETHERLANDS35.2
NEW BRUNSWICK31.8
39%99m
NEWFOUNDLAND AND LABRADOR23.9
47%46m
ARGENTINA5.5
20%<1m
Jurisdiction
Carbon price (2021, USD/tCO2e)
Share of jurisdictionʾs emissions covered
Revenues generated (2020, USD)Lege
nd
26%6m
LIECHTENSTEIN101.5
65%N/A
LUXEMBOURG23.5 - 40.1
MEXICO0.4 - 3.2
23%230m
UKRAINE0.4
71%31m
33%1,239m
SWITZERLAND101.5
UNITED KINGDOM24.8
23%948m
Note: For Luxembourg and the Netherlands carbon tax, revenue figures are indicated with N/A as these carbon pricing initiatives only went into effect on January 1, 2021. For Denmark, Finland, Iceland, Luxembourg, Mexico and Norway carbon taxes, the price ranges indicate the upper and lower bounds of the carbon tax levied on different fossil fuels and fluorinated gases.
CHILE5.0
39%165m
COLOMBIA5.0
24%29m
DENMARK23.6 - 28.1
35%575m
ESTONIA2.3
6%2m
FINLAND62.3 - 72.8
36%1,525m
FRANCE52.4
35%9,632m
NORTHWEST TERRITORIES23.9
79%15m
NORWAY3.9 - 69.3
66%1,758m
POLAND0.1
4%6m
PORTUGAL28.2
29%276m
PRINCE EDWARD ISLAND23.9
56%10m
SINGAPORE3.7
80%144m
ICELAND19.8 - 34.8
55%53m
IRELAND39.3
49%580m
JAPAN2.6
75%2,365m
SLOVENIA20.3
50%147m
SOUTH AFRICA9.2
80%43m
SPAIN17.6
3%129m
LATVIA14.1
3%5m
SWEDEN137.2
40%2,284m
29
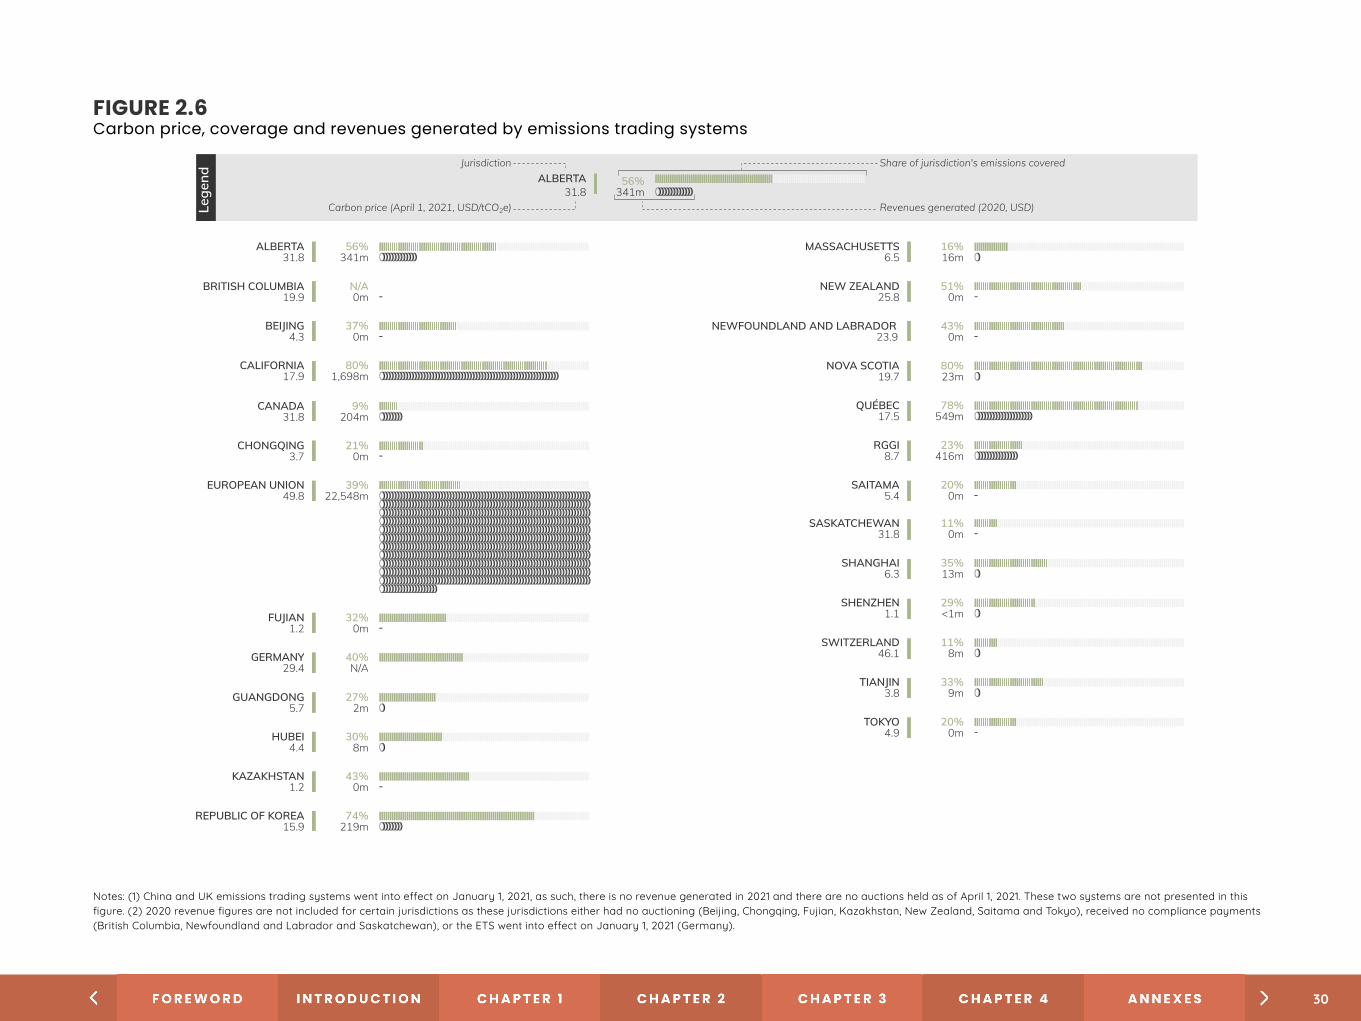
FIGURE 2.6Carbon price, coverage and revenues generated by emissions trading systems
MASSACHUSETTS6.5
16%16m
NEW ZEALAND25.8
51%0m -
43%0m -
NEWFOUNDLAND AND LABRADOR23.9
NOVA SCOTIA19.7
80%23m
QUÉBEC17.5
78%549m
RGGI8.7
23%416m
20%0m
SAITAMA5.4 -
ALBERTA31.8
56%341m
BRITISH COLUMBIA19.9
N/A0m -
BE�ING4.3
37%0m -
CALIFORNIA17.9
80%1,698m
CANADA31.8
9%204m
CHONGQING3.7
21%0m -
EUROPEAN UNION49.8
39%22,548m
Lege
nd
Jurisdiction Share of jurisdiction's emissions covered
Revenues generated (2020, USD)
ALBERTA31.8
56%341m
Carbon price (April 1, 2021, USD/tCO2e)
SHANGHAI6.3
35%13m
SHENZHEN1.1
29%<1m
TIANJIN3.8
33%9m
FUJIAN1.2
32%0m -
40%N/A
GERMANY29.4
GUANGDONG5.7
27%2m
HUBEI4.4
30%8m
KAZAKHSTAN1.2
43%0m -
REPUBLIC OF KOREA15.9
74%219m
11%0m
SASKATCHEWAN31.8 -
SWITZERLAND46.1
11%8m
20%0m
TOKYO4.9 -
Notes: (1) China and UK emissions trading systems went into effect on January 1, 2021, as such, there is no revenue generated in 2021 and there are no auctions held as of April 1, 2021. These two systems are not presented in this figure. (2) 2020 revenue figures are not included for certain jurisdictions as these jurisdictions either had no auctioning (Be�ing, Chongqing, Fujian, Kazakhstan, New Zealand, Saitama and Tokyo), received no compliance payments (British Columbia, Newfoundland and Labrador and Saskatchewan), or the ETS went into effect on January 1, 2021 (Germany).
Notes: (1) China and UK emissions trading systems went into effect on January 1, 2021, as such, there is no revenue generated in 2021 and there are no auctions held as of April 1, 2021. These two systems are not presented in this figure. (2) 2020 revenue figures are not included for certain jurisdictions as these jurisdictions either had no auctioning (Beijing, Chongqing, Fujian, Kazakhstan, New Zealand, Saitama and Tokyo), received no compliance payments (British Columbia, Newfoundland and Labrador and Saskatchewan), or the ETS went into effect on January 1, 2021 (Germany).
30

In 2020, carbon pricing instruments generated USD 53 billion in revenue globally. This is an increase of around USD 8 billion compared to 2019, largely due to the increase in the EU allowan-ce price (see figures 2.5 and 2.6).
Almost all ETSs have PSAMs. These mechanisms help jurisdictions build predictable and effective carbon markets by providing a de-gree of certainty regarding emissions prices. While the architects of early ETSs tended to shy away from market intervention, significant volatility and sustained low prices in some systems have led juris-dictions to reconsider this approach. As of 2021, PSAMs have beco-me a standard element of ETS design, with almost all ETSs currently in operation having at least one such mechanism (see table 2.2). China is still considering what kind of PSAM — if any — to apply in its national ETS.
The most common mechanisms employed by jurisdictions are cost containment reserves (which seek to avoid excessive price incre-ases) and auction price reserves (which ensure minimum prices in primary markets), with many jurisdictions adopting both of these measures. Several jurisdictions have also adopted market stability reserves, which aim to avoid both major price spikes and significant depressions in the market (see box 2.2), while several Chinese pilot ETSs have adopted discretionary price floors, which provide regu-lators with the option of imposing minimum prices where they drop too low.
Linking between different ETSs continues to be limited to neig-hboring links with the EU ETS and linking among subnational jurisdictions in North America. A provisional link was established between the EU and Swiss ETSs in September 2020. RGGI also saw its carbon market expand with the inclusion of the state of Virginia this year. Pennsylvania is also considering joining RGGI. Given emis-sions from Pennsylvania’s power sector are equivalent to 40% of emissions currently covered by RGGI, its inclusion would significant-ly increase the size of the ETS.
BOX 2.2 The EU Market Stability Reserve
The EU’s MSR, which began operating in 2019, aims to support the effectiveness of the EU ETS by promoting market stability and increasing resistance to external economic shocks. The MSR was developed as a response to the large surplus of allowances that accumulated in the EU ETS mar-ket following the economic crisis of 2008–2012. It works by automatically moving allowances to the MSR whenever there are too many allowances in the market and releasing allowances from the MSR when there are too few. In both cases, decisions are based on predefined thresholds, with no discretion afforded to regulators.
The European Commission has credited the MSR with playing a key role in reducing the surplus in the market. The market participants factored in the expected future scarcity of allowances in their business plans, which resulted in increasing prices in the EU ETS from around EUR 5 (USD 5.87)/tCO2e in 2017 to over EUR 30 (USD 35.24)/tCO2e in 2021, and in the reduction of emissions by 9% year on year in 2019.30 Experts have also credited it with the quick bounce-back in prices following an initial drop at the beginning of the COVID-19 pandemic.31 At the same time, as reforms to the EU ETS are being considered, the European Commission is also assessing whether these reforms will require updating the MSR rules and design features.32 The most effective design of the MSR is likely to depend on factors such as the overall emissions pathways the EU will take to get to net zero and the role the ETS will play in achieving its emissions reductions targets.33
30 European Commission. (2020). Stepping up Europe’s 2030 Climate Ambition: Investing in a Climate-Neu-tral Future for the Benefit of our People. https://eur-lex.europa.eu/legal-content/EN/TXT/PDF/?uri=CE-LEX:52020DC0562&from=EN.
31 Marcu, Caneill, and Vangenechten. (2020). The EU ETS Market Stability Reserve Coping with COVID-19 and Preparing for the Review. https://z7r.689.myftpupload.com/wp-content/uploads/2020/04/20200616-ERCST-Background-note-MSR-meeting-June-16-v3-final.pdf.
32 European Commission. (2020). Inception Impact Assessment: Amendment of the EU Emissions Trading System. https://ec.europa.eu/info/law/better-regulation/have-your-say/initiatives/12660-Updating-the-EU-Emissi-ons-Trading-System.
33 Marcu, Caneill, and Vangenechten. (2020). The EU ETS Market Stability Reserve Coping with COVID-19 and Preparing for the Review. https://z7r.689.myftpupload.com/wp-content/uploads/2020/04/20200616-ERCST-Background-note-MSR-meeting-June-16-v3-final.pdf.
31
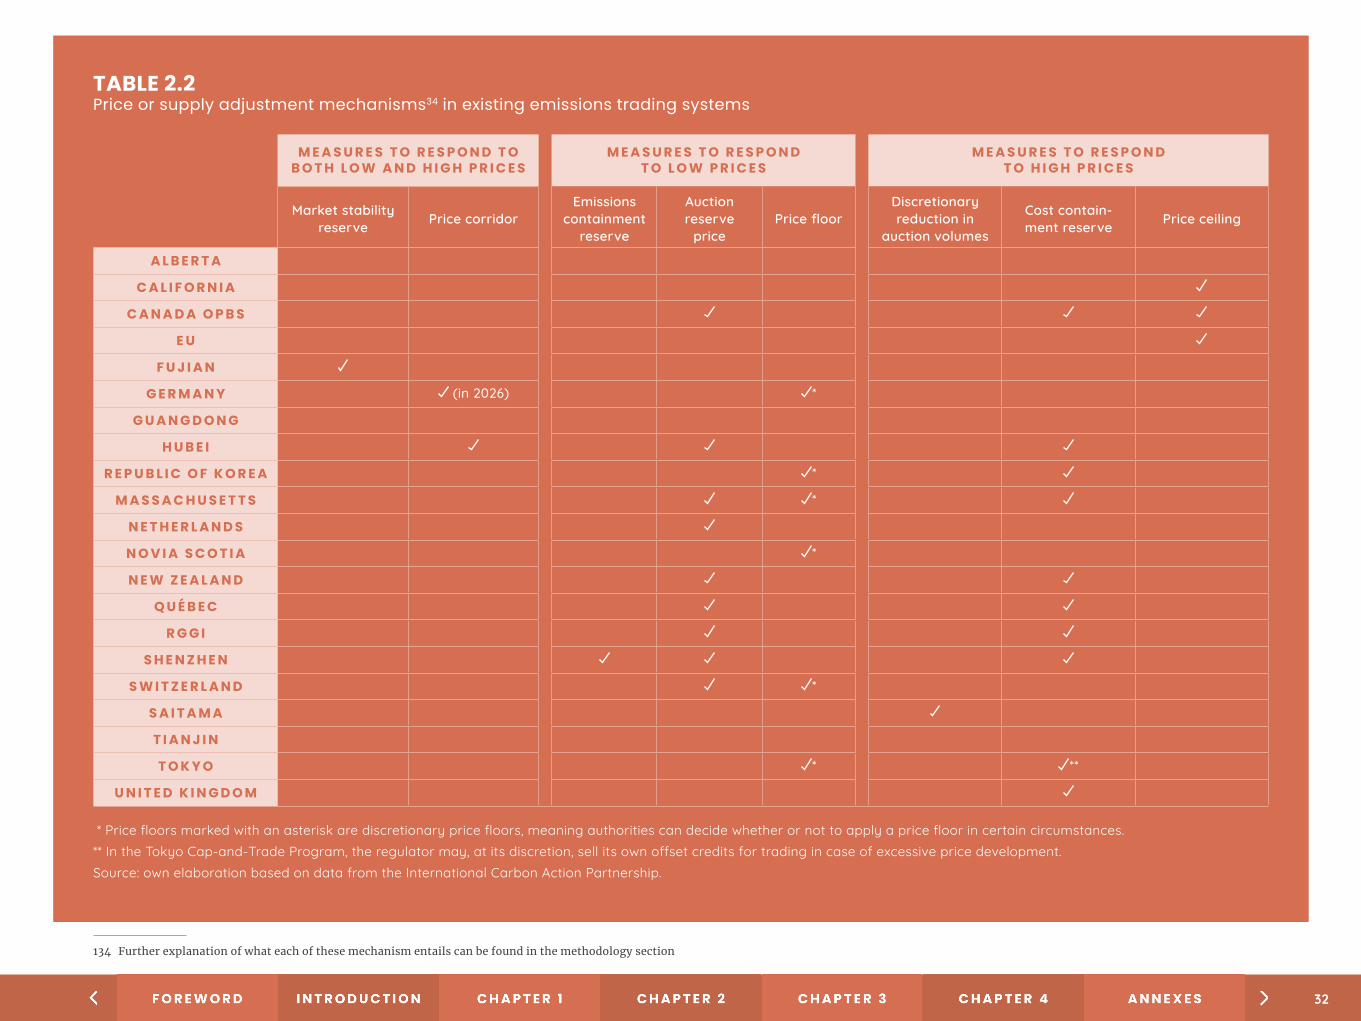
TABLE 2.2Price or supply adjustment mechanisms34 in existing emissions trading systems
M E A S U R E S T O R E S P O N D T O B O T H L O W A N D H I G H P R I C E S
M E A S U R E S T O R E S P O N D T O L O W P R I C E S
M E A S U R E S T O R E S P O N D T O H I G H P R I C E S
Market stability reserve Price corridor
Emissions containment
reserve
Auction reserve
pricePrice floor
Discretionary reduction in
auction volumes
Cost contain-ment reserve Price ceiling
A L B E R T A
C A L I F O R N I A
C A N A D A O P B S
E U
F U J I A N
G E R M A N Y (in 2026) *
G U A N G D O N G
H U B E I
R E P U B L I C O F K O R E A *
M A S S A C H U S E T T S *
N E T H E R L A N D S
N O V I A S C O T I A *
N E W Z E A L A N D
Q U É B E C
R G G I
S H E N Z H E N
S W I T Z E R L A N D *
S A I T A M A
T I A N J I N
T O K Y O * **
U N I T E D K I N G D O M
* Price floors marked with an asterisk are discretionary price floors, meaning authorities can decide whether or not to apply a price floor in certain circumstances. ** In the Tokyo Cap-and-Trade Program, the regulator may, at its discretion, sell its own offset credits for trading in case of excessive price development.Source: own elaboration based on data from the International Carbon Action Partnership.
134 Further explanation of what each of these mechanism entails can be found in the methodology section
32
E M E R G I N G D E V E L O P M E N T S
A wide range of countries and subnational governments continue to move toward carbon pricing, in particular ETSs. Some of these have already scheduled start dates, while others are beginning with pilots. Other jurisdictions are in early stages of considering their policy options.
Several new ETSs have been scheduled to begin in the coming years. Ukraine’s Minister of Environmental Protection and Natural Resources announced plans to launch a national ETS by 202535 to comply with the EU’s border carbon adjustment require-ments, as well as to support its 2030 mitigation goal and its NDC carbon neutrality target for 2070. Further details of the Ukraine ETS design are still pending but are likely to draw upon the design of the EU ETS. In March 2021 in the United States, the Trans-portation and Climate Initiative — a regional collaboration of 13 Northeast and Mid-At-lantic states and the District of Columbia — released a draft Model Rule for an ETS.36 Connecticut, Massachusetts, Rhode Island, and Washington D.C. have announced their participation in the program, which is scheduled to start in 2023 and cover suppliers and distributers of transport fuels. Finally, in March 2021, Indonesia launched a trial ETS until the end of August for 80 coal power plants,37 which cover three quarters of the power generation sector. While no date has been set for a national ETS, the upcoming presidential regulation will include general rules on developing and establishing carbon pricing instruments.
Pilot ETSs are being considered in a number of countries, including national and regional programs. The Colombian government aims to potentially launch an ETS pilot program by 2024. At the end of last year, Turkey finalized the draft legal and institu-tional framework for a pilot ETS for the power and industry sector. Similarly, Thailand
35 Ukrinform. (January 20, 2021). Ukraine Plans to Introduce Greenhouse Gas Emissions Trading Scheme. https://www.ukrinform.net/rubric-economy/3174264-ukraine-plans-to-introduce-green-house-gas-emissions-trading-scheme.html.
36 Transportation and Climate Initiative Program Draft Model Rule. (March 1, 2021). https://www.transportationandclimate.org/sites/default/files/TCI-P-Draft-Model-Rule-March-2021.pdf37 Ministry of Energy and Natural Resources, Indonesia. (March 22, 2021). Press Conference: 80 Generators Joining Carbon Trading Trial. https://www.esdm.go.id/en/media-center/news-archives/uji-coba-per-
dagangan-karbon-diikuti-80-pembangkit38 Ministry of Economic Development, Russian Federation. (December 28, 2020). Roadmap for the Implementation of an Experiment to Establish Special Regulation of Greenhouse Gas Emissions in the Sakhalin Re-
gion. https://economy.gov.ru/material/file/faf1abaae1e3f2be140971c9e934d0ab/dorozhnaya_karta.pdf 39 Republic of Vietnam National Assembly. (November 17, 2020). Revised Law on Environmental Protection. https://thuvienphapluat.vn/van-ban/tai-nguyen-moi-truong/Luat-so-72-2020-QH14-Bao-ve-moi-
truong-2020-431147.aspx
plans to pilot an ETS in the Eastern Economic Corridor, a special economic zone en-compassing three eastern provinces. However, a start date has not been confirmed for either of these pilots. The Government of the Russian Federation adopted a roadmap in December 202038 for the launch of the first regional system for the circulation of car-bon units, with Sakhalin — a significant oil and gas producing region — identified as the pilot region. Further details will be developed between 2021 and 2023.
A number of additional jurisdictions are exploring carbon pricing approaches. In November 2020, the Vietnam National Assembly passed the revised Law on Environ-mental Protection39 to organize and develop a carbon market, including details on cap setting and allocation. Pakistan is currently investigating the role carbon markets can play in achieving its NDC and working to improve MRV data. Brunei Darussalem aims to introduce carbon pricing by 2025 but no specific design has yet been identified. Finally, the U.S. State of Hawai'i is considering a USD 40 tax on fossil fuels, though with the Senate closed since March 2020 as a result of COVID-19, the future of the proposed legislation is unclear.
More detailed information on carbon tax and ETS developments can be found in Annex B.
U N D E R L Y I N G T R E N D S
THE ROLE OF CARBON PRICING ON THE PATH TO NET ZERO
While the momentum toward adopting net-zero targets continues to build, coun-tries’ medium-term targets and carbon pricing trajectories continue to fall far
33

short of what is needed to meet the goals of the Paris Agreement. Despite the global pandemic, the momentum toward adopting net-zero targets has not stopped but accelerated. As of April 2021, 29 countries40 have enshrined net-zero targets in laws or policy documents or have proposed legislation to do so. The majority of targets aim for achieving net zero by 2050, though China and Ukraine are aiming for 2060 and 2070, respectively, while a handful of European nati-ons are targeting earlier dates. Suriname and Bhutan have already achieved net zero, though Suriname has not formally adopted a net-zero target.41
Despite increased long-term ambition, medi-um-term ambition lags behind. An analysis of the 48 new and updated NDCs in February 2021 found that implementation of current commit-ments would only lead to a 0.5% reduction in
40 Energy and Climate Intelligence Unit. (2021). Net Zero Emissions Race: 2021 Scorecard. https://eciu.net/netzerotracker. This figure also includes the European Union as a separate country to its Member States since it is adopting an EU-level net-zero target, which is in addition to the various targets individual Member States have adopted.
41 Energy and Climate Intelligence Unit. (2021). Net Zero Emissions Race: 2021 Scorecard. https://eciu.net/netzerotracker.42 UNFCCC. (2021). Nationally Determined Contributions under the Paris Agreement: Synthesis Report by the Secretariat.
https://unfccc.int/process-and-meetings/the-paris-agreement/nationally-determined-contributions-ndcs/national-ly-determined-contributions-ndcs/ndc-synthesis-report.
43 Note: These numbers will likely be outdated following revised pledges from Biden’s Leader Summit on Climate in late April and other pledges leading up to COP26. Unfortunately, an analysis of these pledges is beyond the scope of the re-port as it falls outside of the April 1, 2021, cut-off date.
44 Calculated on April 2, 2021, based on information from https://unfccc.int/process-and-meetings/the-paris-agreement/the-paris-agreement/nationally-determined-contrinutions-ndcs/NDC-submissions and price data presented earlier in this chapter. This calculation counts the European Union as one country since its Member States submit one collective NDC.
45 Finland carbon tax, Norway carbon tax, Sweden carbon tax, and Switzerland carbon tax.46 European Union ETS, France carbon tax, Finland carbon tax, Liechtenstein carbon tax, Luxembourg carbon tax, Norway
carbon tax, Sweden carbon tax, Switzerland carbon tax, and Switzerland ETS.
global emissions by 2030 compared to 2010 levels, far short of the 45% reductions needed to limit global temperature increase to 1.5°C.42 The combined cuts of new pledges reflect emissi-ons reductions by 2030 only 3% lower than the previous round of NDCs submitted in 2015.43 A quarter of countries that have submitted new or updated NDCs have carbon prices in place, though most of these systems do not have pri-ces in the range needed to meet the goals of the Paris Agreement.44 The limited increase in NDC ambition is also reflected in the limited increases in ambition seen in carbon prices since 2015. In 2020, the number of carbon prices above USD 40/tCO2e — the lower end of the range needed to meet the Paris Agreement’s goals — incre-ased from four carbon pricing instruments45 covering 0.3% of global GHG emissions to nine instruments,46 covering 3.76% of global emissi-ons.
BOX 2.3 An illustrative role of carbon pricing in countries’ net-zero commitments: New Zealand
Alongside the EU and the EU Member States (see Green Deal discussion earlier in Chapter 2), New Zealand has also started to define the role of carbon pricing in achieving their net-zero target.
New Zealand New Zealand’s 2019 Climate Change Response (Zero Car-bon) Amendment Act has legislated a domestic 2050 net zero target for GHGs (except biogenic methane). The Act sets a framework for the country’s mitigation policies. The government has set a provisional economy-wide emissions budget for 2021–2025 that aligns with the 2050 target. This budget will guide the cap setting process for the ETS. Other changes were also made to the New Zealand ETS, including changes to allocation and sector coverage. First, the gover-nment is phasing out free allocation to the industrial sector from 2021. The government has also decided to price agri-cultural emissions, which accounted for almost half of the country’s emissions in 2018, beginning in 2025.
34
Carbon pricing can play an important role in achieving net zero, but current carbon prices and countries’ broader enabling climate poli-cy frameworks are insufficient to drive deep decarbonization. Of the 29 countries that have adopted net-zero targets, 22 already have car-bon prices in place. While some countries have already begun to articulate the role that carbon pricing will play in achieving their net-zero com-mitments, much more work is needed to clarify the nature and scope of these commitments and how they will be achieved (see box 2.3 for example). Only a small number of jurisdictions have set clear price or cap trajectories to 2030; none have set trajectories beyond that date.47
Clarity on the role of carbon pricing in a jurisdiction’s broader climate and fiscal mix can provide certainty and encourage timely, large-scale investments in low-carbon techno-logies.48 As outlined in Chapter 1, carbon pricing will not and cannot be the sole strategy to ad-dress climate change. Companion policies play a critical role in driving additional emissions re-ductions and improving the carbon price by, for example, making it easier for people and com-panies to act on the carbon price incentive.49
47 A recent report estimates that a carbon price of USD 160/tCO2e is needed to achieve a 1.5°C world, which the IPCC es-timates can be achieved by reaching net zero by midcentury. As indicated in Figure 2.4, current carbon prices fall far below this level. https://www.woodmac.com/press-releases/significant-increase-in-carbon-pricing-is-key-in-1.5-degree-world/.
48 ICAP. (2017). Emissions Trading and the Role of a Long-run Carbon Price Signal. https://icapcarbonaction.com/en/?op-tion=com_attach&task=download&id=491.
49 High-Level Commission on Carbon Prices. (2017). Report of the High-Level Commission on Carbon Prices. Washington, D.C.: World Bank.
50 Finance for Biodiversity Initiative. (2021). Global Covid-19 Stimulus Continues to Damage Environment – but US Could Catalyse Greener Recovery. https://www.f4b-initiative.net/post/global-covid-19-stimulus-continues-to-damage-en-vironment-but-us-could-catalyse-greener-recovery.
R E B U I L D I N G T H E E C O N O M Y A N D T H E R O L E O F C A R B O N P R I C I N G
As countries recover from the pandemic, fiscal packages aimed to stimulate economic recovery can lay the groundwork for a more climate-resilient pathway. However, a large share of stimulus expenditure is not directed toward a green recovery.
Only a fraction of economic recovery expendi-ture is being spent on low-carbon or environ-mental projects. The Greenness of Stimulus In-dex50 reports that only 12% of the almost USD 15 trillion stimulus spending of G20 countries is di-rectly channeled to low-carbon or environmen-tal projects — or have environmental conditions. In the aftermath of an economic recession with low oil prices, carbon pricing also represents an opportunity to support a sustainable recovery (see box 2.4).
BOX 2.4 Opportunities for carbon pricing to support a sustainable recovery
Alongside the severe health costs of COVID-19, the pandemic also poses substantial economic challenges from reduced growth, increased economic hardship (unemployment and poverty), as well as reduced government revenue. As the attention of governments turns to stimulating and stabilizing the economy, the design of these recovery packages will play a decisive role in our climate and economic future. Alongside other measures, a carbon price can play a role to support a sustainable recovery, primarily through three mechanisms: supporting green industries, investments, and revenue.
First, carbon pricing helps support sustainable industries and the competitiveness of low-carbon products, which can ge-nerate additional jobs. Global estimates indicate the employ-ment impacts of the energy efficiency and renewable energy sectors can be substantial, generating three times as many full-time jobs as equivalent government spending in fossil fuels.51 Secondly, a carbon price can encourage investments in and mobilize revenue toward low-carbon, net-zero, and net-negative technologies. Finally, carbon pricing can gene-rate much needed government revenue to support additional stimulus and investment programs.
51 Garrett-Peltier, H. (2017). Green versus brown: Comparing the employment impacts of energy efficiency, renewable energy, and fossil fuels using an input-output model. Economic Modelling, Elsevier, vol. 61(C), pages 439-447.
35
A few jurisdictions have explicitly linked carbon pricing to their COVID-19 recovery packages. The EU, for instance, announced the European Green Deal in December 2019, setting out a new growth strategy to tackle both the economic recession and the climate challenge. As discussed previously in this chapter, the EU is currently reassessing and, where necessary, re-vamping its climate policies. This includes the EU ETS and a revision of the Energy Tax Directive to focus on environmental issues. More details are expected in June 2021. Canada also commit-ted to raising the price of carbon as part of its Healthy Environment and Healthy Economy Plan (see box 2.5).
I N C R E A S E D A T T E N T I O N T O P O L I T I C A L E C O N O M Y A N D S T R A T E G I C C O M M U N I C A T I O N O F C A R B O N P R I C I N G
As jurisdictions move to adopt more ambitious carbon prices, the need to ensure that pricing policies are fair, that they bring tangible be-
53 United Nations Development Program. (2021). Peoples’ Climate Vote, Results. https://www.undp.org/content/undp/en/home/librarypage/climate-and-disaster-resilience-/The-Peoples-Climate-Vote-Results.html.
54 Ibid.55 Angel Gurria (OECD). (2020). Carbon Pricing Leadership Coalition High-Level Dialogue. https://www.oecd.org/environ-
ment/carbon-pricing-leadership-coalition-high-level-dialogue-june-2020.htm.
nefits, and that they are well communicated is coming increasingly to the fore.
Despite public demands for stronger clima-te action and growing business support for carbon pricing, limited public support conti-nues to hinder the introduction of (ambitious) carbon prices. In the largest ever global sur-vey on climate change, significant majorities of respondents acknowledged climate change is a global emergency and that world leaders should do “everything necessary and urgently in response.”53 However, public support for carbon pricing was lower than for other policies, despite relatively strong support in high-income coun-tries.54 The Secretary General of the Organisati-on for Economic Co-operation and Development (OECD) has gone. has gone so far as to say that the lack of public support for carbon taxes has been the biggest obstacle to their introduction and increase.55 While private companies have also actively opposed carbon pricing in many countries, business associations are increasingly singling out carbon pricing as their preferred policy as climate regulation becomes inevitable. In the United States, several of the country’s
BOX 2.5 Role of carbon pricing in Canada’s Healthy Environment and Healthy Economy Plan
In December 2020, the government proposed a CAD 15 billi-on (USD 11.94 billion) climate action investment plan as part of its economic recovery package. It outlines a number of measures from affordable, energy-efficient housing to clean public transport and zero-emission vehicle programs, as well as programs for nature conservation and to accelerate industry’s net-zero transformation.
The plan also proposes increasing the federal carbon price to CAD 170/tCO2e (USD 135.30) by 2030 at a rate of CAD 15 (USD 11.94) annually, with proceeds going back to provinces and territories. In addition, the revenue raised from the fe-deral ETS (the backstop Output-Based Pricing System52) will support projects in the industrial sector that reduce emissi-ons and use cleaner technologies and/or processes. The go-vernment also committed to explore the potential of carbon border adjustments with like-minded economies as part of a national climate strategy that also ensures a fair busi-ness environment. The government is currently reviewing the federal ETS and undergoing consultations on proposed changes post-2022.
52 More information on the ETS and how it functions can be found on the carbon pricing dashboard website.
36

most influential business groups56 and financial sector trade groups57 have recently come out in favor of carbon pricing — including several who previously opposed it. And a recent survey indicates that 77% of business leaders globally — and 90% of African business leaders — believe a well-designed global carbon taxation regime can accele-rate a net-zero transition.58
Public concerns over carbon pricing are leading to an emphasis on fairness, politi-cal economy, and strategic communications in designing carbon prices. Drawing on a growing body of research showing how to build support for carbon pricing, jurisdicti-ons are placing renewed emphasis on ensuring policies are fair (and visibly demonstra-ting these aspects), and using revenue in ways that provide tangible benefits, such as rebates or investments in clean technology.59 For instance, reforms to Ireland’s carbon tax in late 2020 saw additional revenues being directed toward social protection initiati-ves,60 while revenues from Germany’s new ETS will be dedicated to decarbonization, lo-wering electricity rates, and transport costs for commuters. In the United States, where environmental justice concerns have gained increasing prominence, the Transportation and Climate Initiative Program’s draft rules propose the creation of equity advisory bodies and annual reviews of the Program’s equity impacts, as well as dedicating a share of revenues to ensuring overburdened and underserved communities benefit from the Program.61 Other jurisdictions, such as Colombia and Mexico, have recently adopted comprehensive communication strategies that aim to increase public support for their carbon prices, while Pakistan is also taking steps to strategically communicate its carbon pricing processes.
56 The U.S. Chamber of Commerce, the Business Roundtable, and the American Petroleum Institute. See Reuters. (2021). Bracing for Biden Climate Rules, U.S. Chamber Asks Congress to Make Laws. https://www.reuters.com/article/us-usa-climate-business-idUSKBN29O2JN; Business Roundtable. (2020). Addressing Climate Change, Principles and Policies. https://s3.amazonaws.com/brt.org/Business-RoundtableAd-dressingClimateChangeReport.September2020.pdf; S&P Global Platts. (2021). API Supports Carbon Pricing, New Technologies to Address Climate Change Risks. https://www.spglobal.com/platts/en/market-in-sights/latest-news/oil/032521-api-supports-carbon-pricing-new-technologies-to-address-climate-change-risks.
57 Niskanen Center. (2021). Leading Trade Groups in the Financial Sector Support Carbon Pricing. https://www.niskanencenter.org/leading-trade-groups-in-the-financial-sector-support-carbon-pricing/.58 Standard Chartered. (2021). Zeronomics: Financing the Transition to Net-Zero. https://www.sc.com/en/insights/zeronomics/.59 For a summary of existing research, see https://iopscience.iop.org/article/10.1088/1748-9326/ab92c3.60 Government of Ireland. (2021). Budget 2021: The Use of Carbon Tax Funds. http://budget.gov.ie/Budgets/2021/Documents/Budget/Carbon%20tax%20document.pdf.61 Transportation and Climate Initiative Program: Draft Module Rule. (March 1, 2021). https://www.transportationandclimate.org/sites/default/files/TCI-P-Draft-Model-Rule-March-2021.pdf.62 The Carbon Border Adjustment Mechanism is expected to be designed as a “notional” ETS, where the importer of a product is required to buy an allowance that mirrors the price of the EU ETS, but which would
not be tradable on the ETS market. It remains to be seen whether the CBAM will apply to energy-intensive industries only, or if the EU will favor broader application mirroring all sectors of the EU ETS. EURAC-TIVE. (February 15, 2021). EU Carbon Border Levy Shaping Up as ‘notional ETS.’ https://www.euractiv.com/section/energy-environment/news/eu-carbon-border-levy-shaping-up-as-notional-ets/
63 Her Majesty the Queen in Right of Canada. (2020). Supporting Canadians and Fighting COVID-19, Fall Economic Statement 2020. https://budget.gc.ca/fes-eea/2020/report-rapport/FES-EEA-eng.pdf.64 Bloomberg. (February 4, 2021). U.K.’s Boris Johnson Considers G-7 Bid on Green Border Levies. https://www.bloomberg.com/news/articles/2021-02-04/u-k-s-boris-johnson-considers-g-7-bid-on-green-
border-levies65 The Biden Plan for a Clean Energy Revolution and Environmental Justice, 2020, https://joebiden.com/climate-plan/
C A R B O N B O R D E R A D J U S T M E N T S
Long debated in policy circles but considered too controversial to work in practice, this past year has seen some governments seriously consider the introduction of carbon border adjustments. Early indications are that they may even help drive increased ambition beyond the borders of those who adopt them.
Increased climate ambition from governments has sparked interest in carbon border adjustments across a number of jurisdictions. Until recently, carbon border adjustments were seen as too controversial for most jurisdictions to consider; howe-ver, the pressure to strengthen climate ambition while protecting competitiveness and leakage concerns have seen jurisdictions become increasingly willing to embrace them. The EU is expected to present the proposed design for its Carbon Border Adjustment Mechanism June 2021,62 while Canada recently announced it is studying the introduc-tion of its own border carbon adjustment mechanism.63 In the United States, President Biden is exploring the idea of a border adjustment tax on countries that fail to meet their climate obligations,64 making the United States the only country without a national carbon price to be openly considering border adjustments. It has also been reported that the United Kingdom is looking to use its G7 presidency to forge an alliance on car-bon border taxes, making the topic one of the key priorities for the G7 summit in June 2021 and strengthening momentum for their implementation.65
37
In addition to facilitating an increase in domestic carbon prices, carbon border adjustments may influence climate and carbon pricing policies in partner jurisdicti-ons. For instance, carbon border adjustments may incentivize carbon pricing in expor-ting jurisdictions if their products were eligible for rebates against the carbon border adjustment. The EU has indicated that a range of domestic policies with objectives aligned with the EU carbon price, such as net-zero targets and ambitious carbon prices, may suffice to avoid its carbon border charge.66 While it remains too early to predict how the EU’s mechanism will influence other countries, many stakeholders in key tra-ding partners have predicted that it could also speed-up or strengthen the introducti-on of carbon pricing and other climate policies in their countries in particular if other major players, such as the United States, move ahead with carbon border adjustments, too.67 Early examples of spill-over effects include an announcement by Ukraine that its forthcoming ETS will align with the EU’s Carbon Border Adjustment Mechanism requi-rements and interest from the Turkish Business and Industry Association in aligning policies there with the EU’s requirements. Meanwhile, several countries68 have initiated studies to get insight into how such a mechanism may affect their economies and what type of policies can help them to (partially) avoid paying the border fee.
T H E F I N A N C I A L S E C T O R G E T S I N V O L V E D I N C A R B O N P R I C I N G
While many carbon markets remain limited to participants, several key ETSs are in the process of opening up to financial players.The past year has seen increased interest in emissions trading by the financial sector, signaling renewed investor interest in ETS markets. There has been a recent
66 EURACTIVE. (February 15, 2021). EU Carbon Border Levy Shaping Up as ‘notional ETS.’ https://www.euractiv.com/section/energy-environment/news/eu-carbon-border-levy-shaping-up-as-notional-ets/67 Konrad Adenauer Stiftung. (2021). Perception of the Planned EU Carbon Border Adjustment Mechanism in Asia Pacific – An Expert Survey. Regional Project Energy Security and Climate Change Asia Pacific. htt-
ps://www.kas.de/en/web/recap/single-title/-/content/perception-of-the-planned-eu-carbon-border-adjustment-mechanism-in-asia-pacific-an-expert-survey68 Including studies in Russia, Thailand, Vietnam, India, South Africa, and Turkey.69 Economist. (February 27, 2021). Prices in the World’s Biggest Carbon Market Are Soaring. https://econ.st/3q96aOs.70 European Commission. (2020). EU Emissions Trading System. Auctions by the Common Auction Platform: Fourth Quarter 2019 and Second Quarter 2020. https://ec.europa.eu/clima/policies/ets/auctioning_en#tab-0-1.71 Carbon Pulse. (March 19, 2021). Latest Carbon Market ETF Sees Managed Assets More Than Triple Year-to-Date. https://bit.ly/2QE4xfF.72 Financial Times. (August 23, 2020). Carbon Trading: The ‘One Way’ Bet for Hedge Funds. https://on.ft.com/2P8hVZ1; Carbon Pulse. (March 19, 2021). Latest Carbon Market ETF Sees Managed Assets More Than
Triple Year-to-Date. https://bit.ly/2QE4xfF.73 ICAP. (2020). Korea Emissions Trading Scheme. https://bit.ly/3qfxcno; ICAP. (2021). China National ETS. https://bit.ly/3e7TvZy; Mayer Brown (2021). Implementation of China’s National Emissions Trading
Scheme – A Forward Look. https://bit.ly/3risFSk.74 For more on financial products and risk management instruments, see Partnership for Market Readiness; International Carbon Action Partnership. (2021). Emissions Trading in Practice. 2nd edition. A Handbook
on Design and Implementation. Washington, D.C.: World Bank. https://openknowledge.worldbank.org/handle/10986/35413. License: CC BY 3.0 IGO.
surge in demand from influential financial actors including Goldman Sachs, Morgan Stanley, and Lansdowne Partners for speculative participation or trading on behalf of third parties.69 In the EU ETS, the share of auctioned allowances purchased by invest-ment firms and credit institutions increased from 37.3% in 2018 to 43.7% in 2020.70 Other data indicates around 250 investment funds now report active engagement in the EU ETS market, compared to fewer than 100 three years ago.71 This renewed interest is likely linked to expectations that allowance prices will increase as governments adopt more ambitious climate targets.72 However, financial sector engagement also creates risks and necessitates additional oversight; speculation can, at times, lead to volatility; and jurisdictions need to ensure existing financial market regulations are robust en-ough to guard against misconduct in the ETS. Many jurisdictions continue to keep their ETS markets closed to noncovered entities.
ETSs are increasingly allowing participation by noncovered participants. As of 2021, the Republic of Korea’s ETS permits the participation of noncovered entities in its se-condary market, including banks, brokers, and trading houses. In March, it also revea-led plans to appoint three additional market makers — likely private sector financial institutions — in a bid to boost market liquidity. Similarly, China’s recently launched ETS seeks to encourage future trading by international financial players, though regulations for their involvement have yet to be released.73 Such financial sector engagement can be a valuable tool for mobilizing capital flows, helping maintain market liquidity and al-lowing a long-term, stable price signal to develop. Financial players can also help play an important intermediary role in the market, bringing buyers and sellers together.74 In doing so, financial intermediaries can develop derivative products that covered entities use to manage price and volume risk.
38

Carbon credit markets continue to grow despite the economic downturn, with the numbers of both registered projects and issued credits increasing sub-stantially in 2020. While growth has been observed across all types of credi-ting mechanisms,75 the lion’s share is centered on independent standards.
The past year has seen significant growth in carbon credit markets. Despite the COVID-19 pandemic and the economic downturn, the number of registered projects76 increased by 11%, going from 16,854 in 2019 to 18,664 in 2020. The num-ber of credits issued77 also increased by 10% over the same period, bringing the total number of credits issued since 2002 to around 4.3 billion tCO2e (figure 3.1). This is equivalent to what 200 billion trees could absorb in one year78 or around 7.9% of annual global GHG emissions.79 However, these annual supply numbers are far below the levels seen at the height of market supply in 2012 before the end of the first compliance period of the Kyoto Protocol, with issuance and pro-ject registration numbers five times higher than today’s volume.80
75 The report divides up crediting mechanisms into three categories based on how credits are generated and the way the crediting mechanism is administered. These are international mechanisms (governed by international climate treaties and are usually administered by international institutions), domestic mechanisms (regional, national and subnational crediting mechanisms are governed by their respective jurisdictional legislature and are usually administered by regional, national or subnational governments) and independent mechanisms (administered by private and independent third-party organizations, which are often nongovernmental organizations). Data and insights on voluntary market trans-actions prices and volumes by project type and location, and buyers sector and location are drawn from Ecosystem Marketplace's 2020 Global Carbon Markets Survey.
76 This number also includes programs of activities. Where possible, CPAs under the same PoA are grouped and counted by their respective PoA. As some projects are registered un-der more than crediting mechanism (e.g. CDM projects also registered under independent standards such as VCS and Gold Standard and CDM pre-registration credits), the actual number of registered projects is in reality slightly lower.
77 Credits may be generated from projects as soon as the emissions removals or reductions take place; however, credits will only be officially issued once they have been reviewed and verified by the respective authorities.
78 Under the assumption that a mature tree will absorb more 48 pounds of CO2 per year. J. Mounce. (2019). The Power of One Tree - The Very Air We Breathe. The U.S Department of Agriculture. https://www.usda.gov/media/blog/2015/03/17/power-one-tree-very-air-we-breathe
79 Calculated using 2015 GHG emissions data from EDGAR.80 For more, see World Bank Group. (2020). State and Trends of Carbon Pricing Report.
Washington, D.C.: World Bank Group.
C R E D I T I N G S U P P L Y
CARBON CREDITING MECHANISMSC H A P T E R 3
39
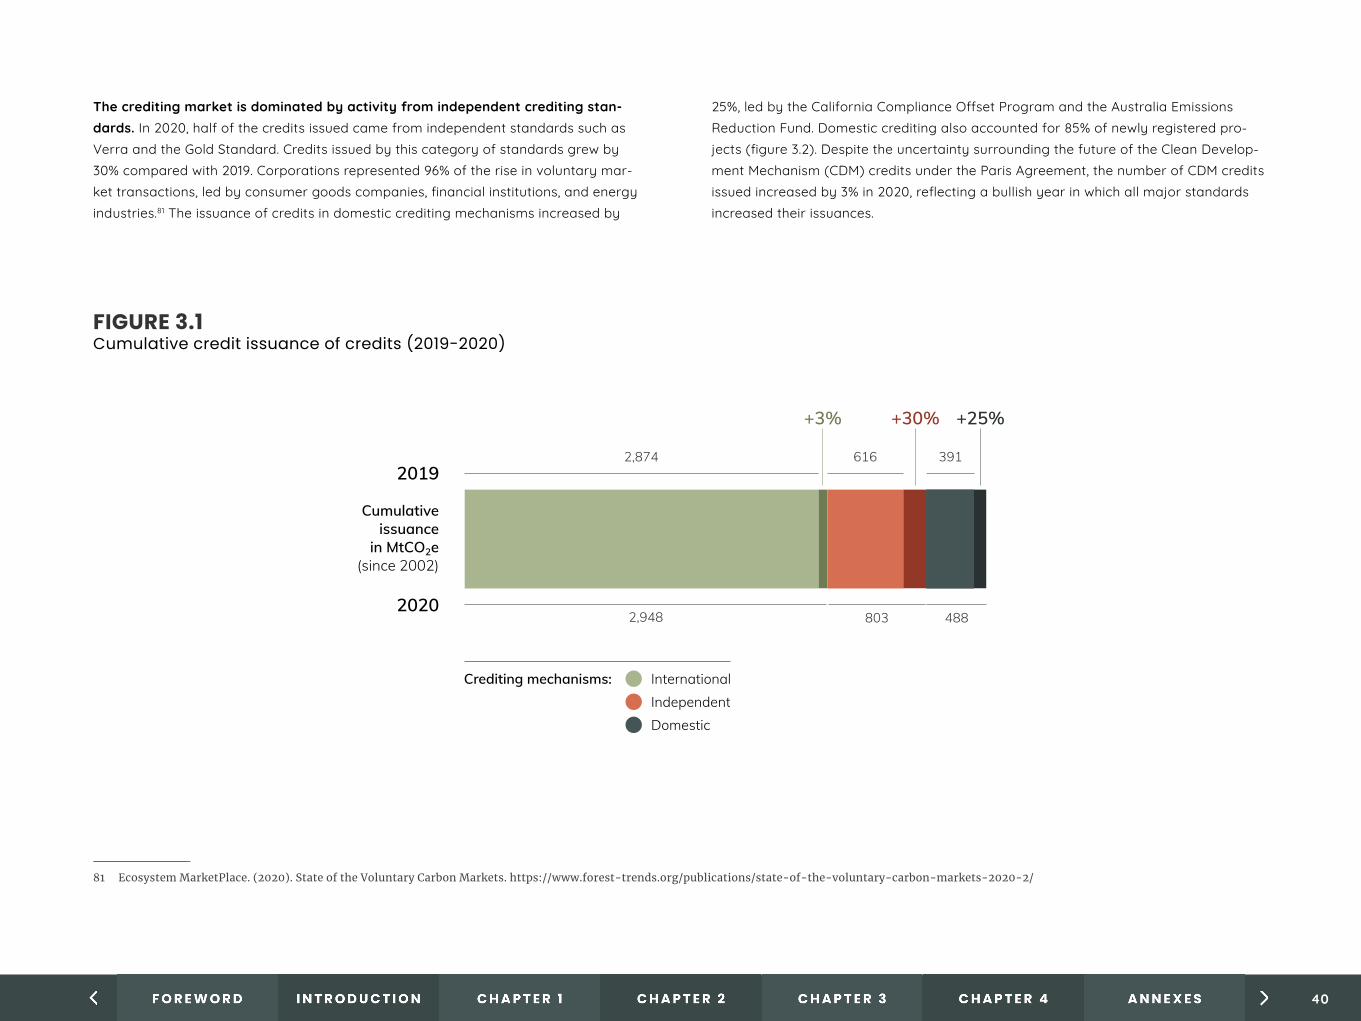
The crediting market is dominated by activity from independent crediting stan-dards. In 2020, half of the credits issued came from independent standards such as Verra and the Gold Standard. Credits issued by this category of standards grew by 30% compared with 2019. Corporations represented 96% of the rise in voluntary mar-ket transactions, led by consumer goods companies, financial institutions, and energy industries.81 The issuance of credits in domestic crediting mechanisms increased by
81 Ecosystem MarketPlace. (2020). State of the Voluntary Carbon Markets. https://www.forest-trends.org/publications/state-of-the-voluntary-carbon-markets-2020-2/
25%, led by the California Compliance Offset Program and the Australia Emissions Reduction Fund. Domestic crediting also accounted for 85% of newly registered pro-jects (figure 3.2). Despite the uncertainty surrounding the future of the Clean Develop-ment Mechanism (CDM) credits under the Paris Agreement, the number of CDM credits issued increased by 3% in 2020, reflecting a bullish year in which all major standards increased their issuances.
FIGURE 3.1 Cumulative credit issuance of credits (2019-2020)
2,874
2,948
616
803
Cumulativeissuance
in MtCO2e(since 2002)
+3% +30% +25%
2019
2020
391
488
Crediting mechanisms: InternationalIndependentDomestic
40
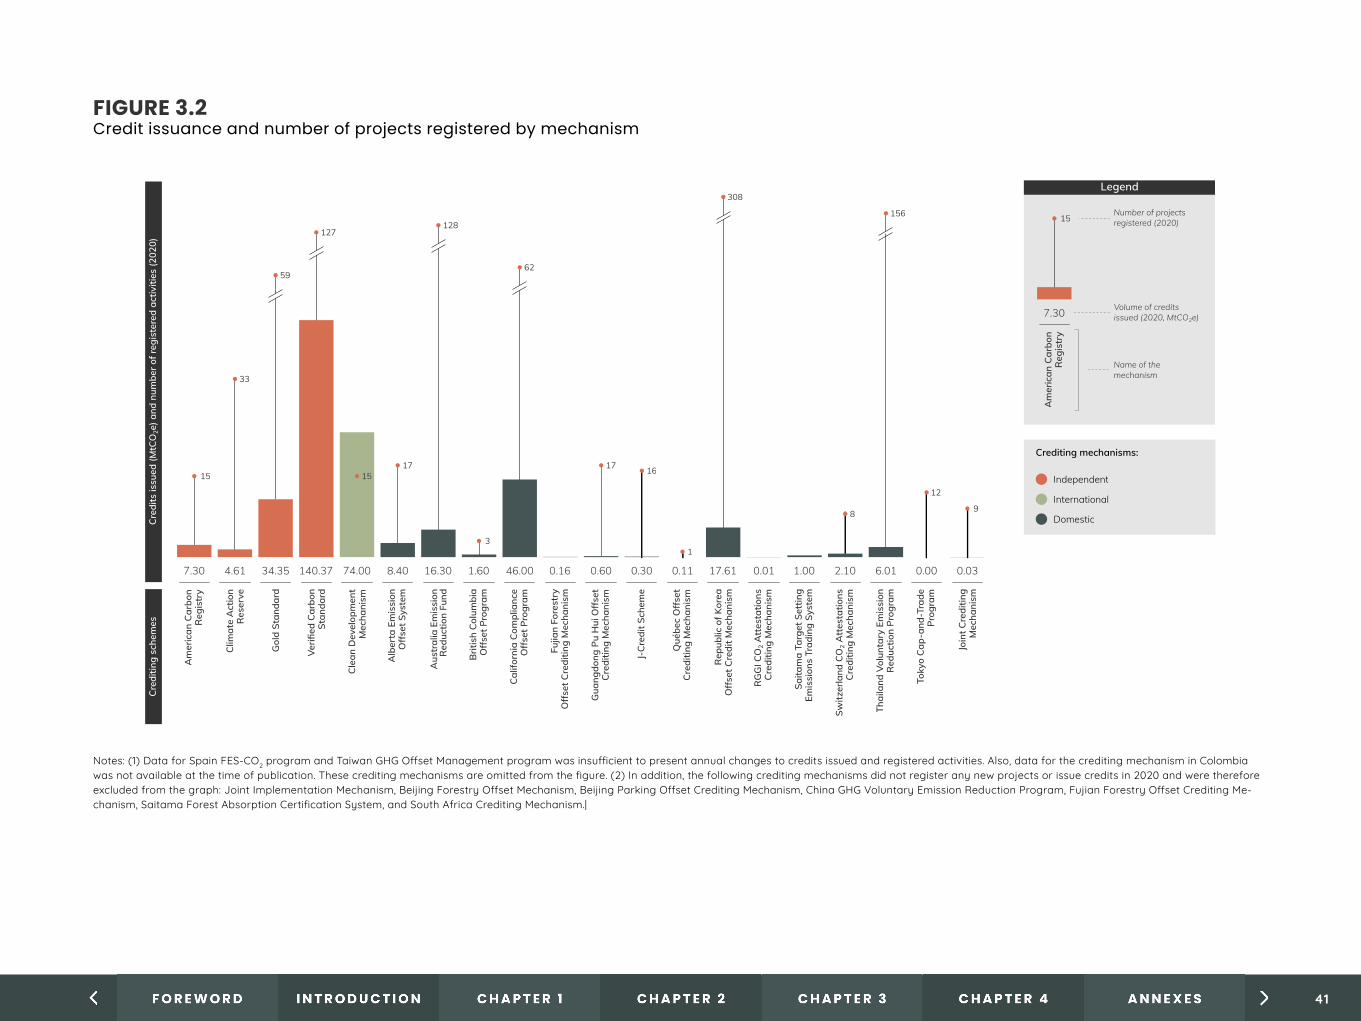
FIGURE 3.2 Credit issuance and number of projects registered by mechanism
Am
eric
an C
arbo
nR
egis
try
Clim
ate
Act
ion
Res
erve
Gol
d St
anda
rd
Verifi
ed C
arbo
nSt
anda
rd
Cle
an D
evel
opm
ent
Mec
hani
sm
Alb
erta
Em
issi
onO
ffse
t Sys
tem
4.617.30
15
33
34.35 140.37 74.00 8.40 16.30 1.60 46.00 0.60 0.30 0.11 17.61 0.01 1.00 2.10 6.01 0.00 0.03
Aus
tral
ia E
mis
sion
Red
uctio
n Fu
nd
Brit
ish
Colu
mbi
aO
ffse
t Pro
gram
Calif
orni
a Co
mpl
ianc
eO
ffse
t Pro
gram
Gua
ngdo
ng P
u H
ui O
ffse
tC
redi
ting
Mec
hani
sm
J-C
redi
t Sch
eme
Qué
bec
Off
set
Cre
ditin
g M
echa
nism
Rep
ublic
of K
orea
Off
set C
redi
t Mec
hani
sm
RG
GI C
O2 A
ttes
tatio
nsC
redi
ting
Mec
hani
sm
Saita
ma
Targ
et S
ettin
gEm
issi
ons
Trad
ing
Syst
em
Switz
erla
nd C
O2 A
ttes
tatio
nsC
redi
ting
Mec
hani
sm
Thai
land
Vol
unta
ry E
mis
sion
Red
uctio
n Pr
ogra
m
Toky
o Ca
p-an
d-Tr
ade
Prog
ram
Join
t Cre
ditin
gM
echa
nism
59
127
1517
128
3
62
17 16
1
308
8
12
9
156
Cre
dits
issu
ed (M
tCO
2e) a
nd n
umbe
r of r
egis
tere
d ac
tiviti
es (2
020)
Cre
ditin
g sc
hem
es
Crediting mechanisms:
International
Independent
Domestic
Notes: (1) Data for Spain FES-CO2 program and Taiwan GHG Offset Management program was insufficient to present annual changes to credits issued and registered activities. Also, data for the crediting mechanism in Colombia was not available at the time of publication. These crediting mechanisms are omitted from the figure. (2) In addition, the following crediting mechanisms did not register any new projects or issue credits in 2020 and were therefore excluded from the graph: Joint Implementation Mechanism, Be�ing Forestry Offset Mechanism, Be�ing Parking Offset Crediting Mechanism, China GHG Voluntary Emission Reduction Program, Fujian Forestry Offset Crediting Mechanism, Saitama Forest Absorption Certification System, and South Africa Crediting Mechanism.|
0.16Fu
jian
Fore
stry
Off
set C
redi
ting
Mec
hani
sm
Legend
Number of projectsregistered (2020)
Name of themechanism
Volume of creditsissued (2020, MtCO2e)
Am
eric
an C
arbo
nR
egis
try
7.30
15
Notes: (1) Data for Spain FES-CO2 program and Taiwan GHG Offset Management program was insufficient to present annual changes to credits issued and registered activities. Also, data for the crediting mechanism in Colombia was not available at the time of publication. These crediting mechanisms are omitted from the figure. (2) In addition, the following crediting mechanisms did not register any new projects or issue credits in 2020 and were therefore excluded from the graph: Joint Implementation Mechanism, Beijing Forestry Offset Mechanism, Beijing Parking Offset Crediting Mechanism, China GHG Voluntary Emission Reduction Program, Fujian Forestry Offset Crediting Me-chanism, Saitama Forest Absorption Certification System, and South Africa Crediting Mechanism.|
41
Overall issuance growth masks diverging developments across sectors. Continuing trends seen in 2019, there was an 87% growth in issuance from renewable energy projects and — despite increase in afforestation and reforestation projects — and an overall decline of 20% issuance from foresty and land-use projects.82 The former may be explained by several factors. First, the price of renewable energy credits — already among the cheapest available in the market (see figure 10 on volume and prices) — has decreased in recent years.83 Secondly, the decision from the two independent mechanisms (Verified Carbon Standard [VCS] and Gold Standard) to no longer accept registrations of new large-scale renewable energy projects (unless located in Least De-veloped Countries) from January 2020 onward84 may have created an expectation of reduced interest in these credits from buyers in future years and thereby driven project developers to issue credits while they can still convert them into revenues. More analy-sis is needed to explain the decrease in issuances from foresty and land-use credits.
More information on domestic and independent crediting mechanisms can be found in Annex C.
C R E D I T I N G D E M A N D
Demand for carbon credits is increasing rapidly and may continue to grow in the coming years in response to corporate net-zero commitments. Demand from do-mestic carbon pricing instruments remains small by comparison to independent mechanisms but may grow as new carbon pricing instruments come online.
Demand for carbon credits has increased in the past years. In 2019 (the most re-cent year for which data is available),85 the demand for carbon credits from voluntary buyers surpassed 104 MtCO2e, representing an increase of 6% based on 2018 figures.86
82 Overall information for 2020 is not yet available.83 Prices of renewable energy credits decreased from USD 1.90 in 2017 to USD 1.40 in 2019. Prices for 2020 are not yet available. Ecosystem Marketplace. (2020). Forest Trends.84 Ecosystem MarketPlace. (2020). Forest Trends.85 Data on voluntary market transactions and prices is drawn from Ecosystem Marketplace’s Global Carbon Markets Survey, which is considered the most complete source of data on transactions in the voluntary
carbon market. While anecdotal information regarding recent market prices and trends is available, this could not be verified and is therefore not included in the present report. Data for 2020 will be released by Ecosystem Marketplace later this year.
86 Ecosystem Marketplace. 2020.87 Ecosystem Marketplace. 2020.
The increased demand — mostly for credits from VCS and the CDM projects — is pro-viding certainty and consistent revenues for project developers. Almost three quarters of developers of projects registered under independent crediting standards report having buyers lined up for the purchase of yet-to-be-issued credits.87 The continued dominance of the voluntary market represents a shift from the first decade of the carbon market, which was overwhelmingly dominated by compliance markets. In 2019, renewable energy and foresty and land-use projects accounted for most of the credit transactions in the market, though transactions of foresty and land-use credits reduced reduced significantly compared to 2018. Meanwhile, sustainable agriculture and range-land management emerged as opportunities for carbon storage and drew the highest prices in the market (see figure 3.3).
Demand for credits as part of carbon tax and ETS compliance obligations is also growing but remains small compared with voluntary demand. While a number of carbon pricing instruments allow entities to use carbon credits to meet their obligati-ons — particularly those in East Asia and North America — these only accounted for 18 MtCO2e in 2020, though this does represent a 13% increase on 2019 demand (see figure 3.4). South Africa moved a step closer to crediting, as the Carbon Offset Administration System went live in 2020, becoming the first official registry for carbon credits genera-ted under independent standards such as the VCS. The share of credits surrendered for domestic compliance may grow with upcoming sources of demand like Canada’s fede-ral offset system and the use of credits in China’s national ETS. Chile’s crediting mecha-nism is also set to start in 2023. This demand source is likely to remain limited given the quantitative and qualitative restrictions on offset usage in its jurisdictions.
42

FIGURE 3.3Volumes transacted and prices per sector (2019)
3.79
1.432.21 2.16
3.54
1.71
0.55
4.50 4.35
5.75
8.68
12.5211.80
12.90
7.69
4.27
8.03
RED
D -
Com
bine
d
Win
d
Sola
r
23.3Volu
me
tran
sact
ed (M
tCO
2e) a
nd a
vera
ge p
rice
(USD
)Se
ctor
s
12.6 6.2
Land
fill m
etha
ne
Cle
an c
ooks
tove
Run
-of-
river
hyd
ro
Larg
e hy
dro
5.4 4.5 4.0 1.9W
ater
pur
ifica
tion
Bio
gas
Blu
e ca
rbon
Live
stoc
k m
etha
ne
1.8 1.7 0.3 0.1
Sust
aina
ble
agric
ultu
re
Ran
gela
nd m
anag
emen
t
Live
stoc
k m
etha
ne
0.1 0.1 0.02
Aff
ores
tatio
n/R
efor
esta
tion
Ener
gy e
ffici
ency
Impr
oved
fore
st m
anag
emen
t
3.0 2.1 2.1
Note: The graphic does not present a comprehensive view of all sectors, only those in terms of highest overall volume transacted and price (or a combination of both) from 2019 are shown. Data is sourced from Ecosystem Marketplace and reflects the sector categories they use in their reporting.
Legend
Average price per credit(2020, USD)
Sector
Volume of credits transacted(2020, MtCO2e)
2.21
Sola
r
6.2
Top sectors in:
Price transacted
Volume transacted
Volume & price transacted
Note: The graphic does not present a comprehensive view of all sectors, only those in terms of highest overall volume transacted and price (or a combination of both) from 2019 are shown. Data is sourced from Ecosystem Market-place and reflects the sector categories they use in their reporting.
43
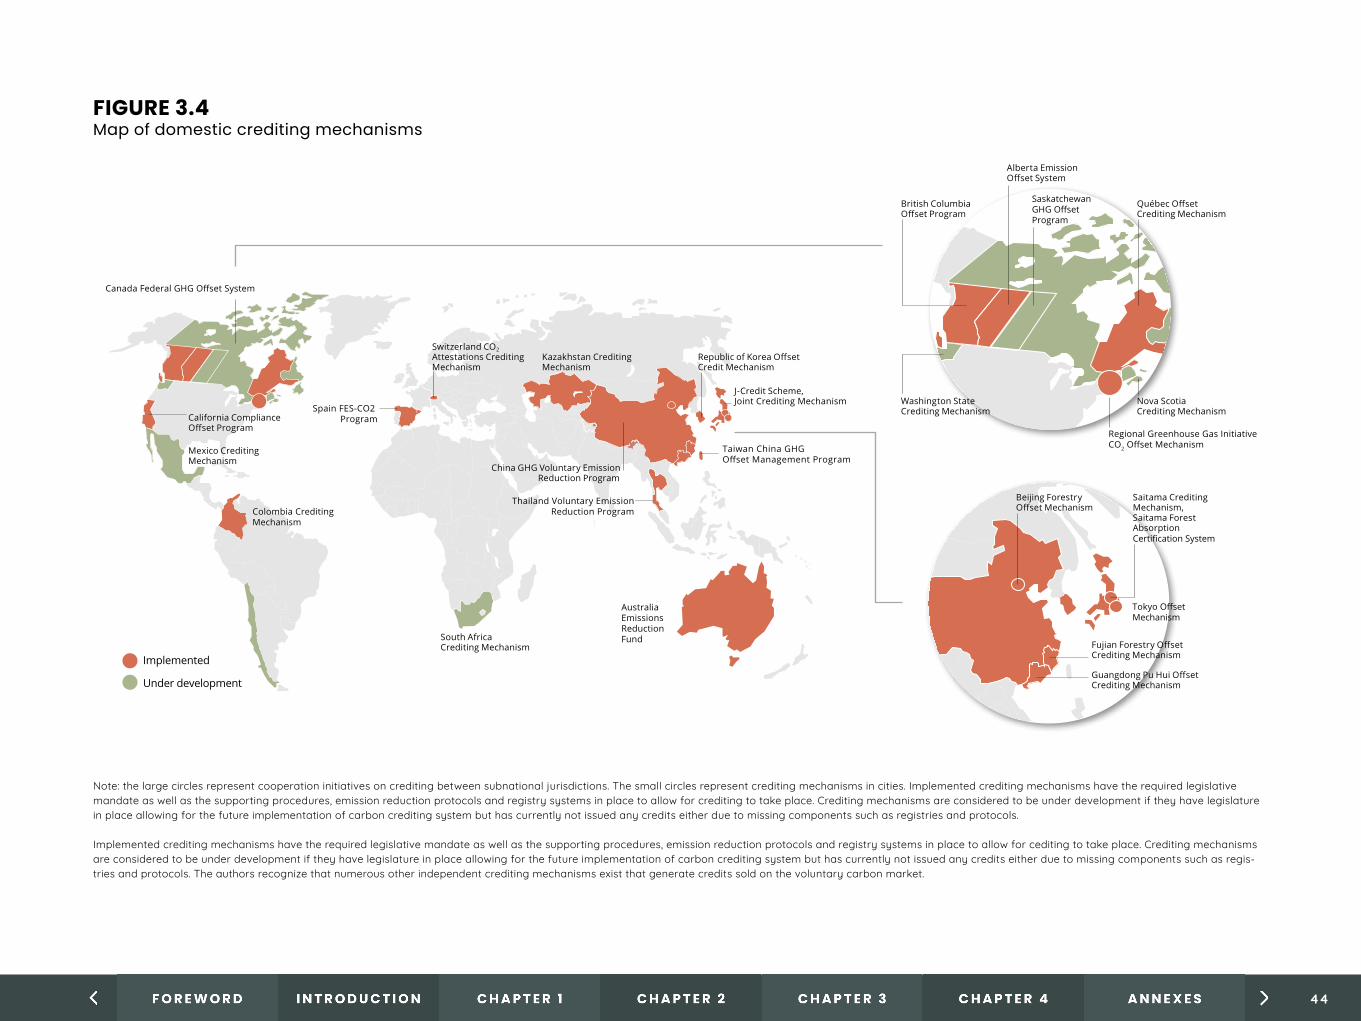
FIGURE 3.4 Map of domestic crediting mechanisms
Mexico Crediting Mechanism
South Africa Crediting Mechanism
Colombia Crediting Mechanism
Switzerland CO2 Attestations Crediting Mechanism
Kazakhstan Crediting Mechanism Credit Mechanism
China GHG Voluntary Emission Reduction Program
California Compliance Spain FES-CO2
Program
J-Credit Scheme,
Taiwan China GHG Offset Management Program
Joint Crediting Mechanism
Canada Federal GHG Offset System
Implemented
Under development
Australia Emissions Reduction Fund
Thailand Voluntary EmissionReduction Program
Washington State Crediting Mechanism
Alberta Emission
Crediting Mechanism
Regional Greenhouse Gas Initiative CO2 Offset Mechanism
British Columbia
Nova Scotia Crediting Mechanism
Saskatchewan GHG Offset Program
Beijing Forestry
Crediting Mechanism
Crediting Mechanism
Saitama Crediting Mechanism,Saitama Forest Absorption Certification System
Tokyo OffsetMechanism
Note: the large circles represent cooperation initiatives on crediting between subnational jurisdictions. The small circles represent crediting mechanisms in cities. Implemented crediting mechanisms have the required legislative mandate as well as the supporting procedures, emission reduction protocols and registry systems in place to allow for crediting to take place. Crediting mechanisms are considered to be under development if they have legislature in place allowing for the future implementation of carbon crediting system but has currently not issued any credits either due to missing components such as registries and protocols.
Implemented crediting mechanisms have the required legislative mandate as well as the supporting procedures, emission reduction protocols and registry systems in place to allow for cediting to take place. Crediting mechanisms are considered to be under development if they have legislature in place allowing for the future implementation of carbon crediting system but has currently not issued any credits either due to missing components such as regis-tries and protocols. The authors recognize that numerous other independent crediting mechanisms exist that generate credits sold on the voluntary carbon market.
44
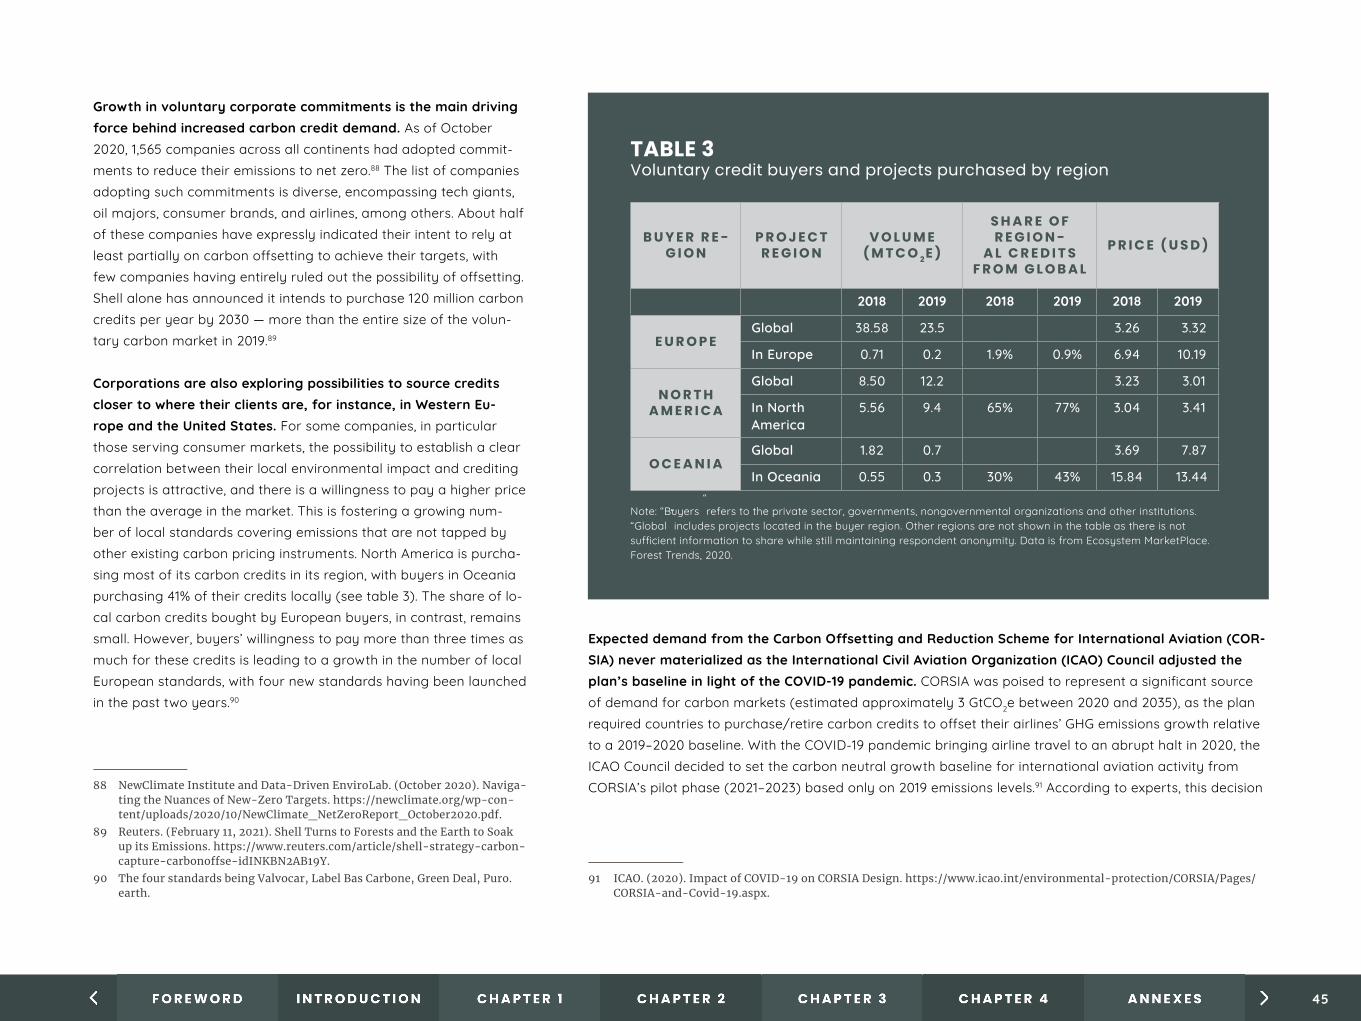
Growth in voluntary corporate commitments is the main driving force behind increased carbon credit demand. As of October 2020, 1,565 companies across all continents had adopted commit-ments to reduce their emissions to net zero.88 The list of companies adopting such commitments is diverse, encompassing tech giants, oil majors, consumer brands, and airlines, among others. About half of these companies have expressly indicated their intent to rely at least partially on carbon offsetting to achieve their targets, with few companies having entirely ruled out the possibility of offsetting. Shell alone has announced it intends to purchase 120 million carbon credits per year by 2030 — more than the entire size of the volun-tary carbon market in 2019.89
Corporations are also exploring possibilities to source credits closer to where their clients are, for instance, in Western Eu-rope and the United States. For some companies, in particular those serving consumer markets, the possibility to establish a clear correlation between their local environmental impact and crediting projects is attractive, and there is a willingness to pay a higher price than the average in the market. This is fostering a growing num-ber of local standards covering emissions that are not tapped by other existing carbon pricing instruments. North America is purcha-sing most of its carbon credits in its region, with buyers in Oceania purchasing 41% of their credits locally (see table 3). The share of lo-cal carbon credits bought by European buyers, in contrast, remains small. However, buyers’ willingness to pay more than three times as much for these credits is leading to a growth in the number of local European standards, with four new standards having been launched in the past two years.90
88 NewClimate Institute and Data-Driven EnviroLab. (October 2020). Naviga-ting the Nuances of New-Zero Targets. https://newclimate.org/wp-con-tent/uploads/2020/10/NewClimate_NetZeroReport_October2020.pdf.
89 Reuters. (February 11, 2021). Shell Turns to Forests and the Earth to Soak up its Emissions. https://www.reuters.com/article/shell-strategy-carbon-capture-carbonoffse-idINKBN2AB19Y.
90 The four standards being Valvocar, Label Bas Carbone, Green Deal, Puro.earth.
TABLE 3 Voluntary credit buyers and projects purchased by region
B U Y E R R E -G I O N
P R O J E C T R E G I O N
V O L U M E ( M T C O 2 E )
S H A R E O F R E G I O N -
A L C R E D I T S F R O M G L O B A L
P R I C E ( U S D )
2018 2019 2018 2019 2018 2019
E U R O P EGlobal 38.58 23.5 3.26 3.32
In Europe 0.71 0.2 1.9% 0.9% 6.94 10.19
N O R T H A M E R I C A
Global 8.50 12.2 3.23 3.01
In North America
5.56 9.4 65% 77% 3.04 3.41
O C E A N I A Global 1.82 0.7 3.69 7.87
In Oceania 0.55 0.3 30% 43% 15.84 13.44
Note: “Buyers” refers to the private sector, governments, nongovernmental organizations and other institutions. “Global” includes projects located in the buyer region. Other regions are not shown in the table as there is not sufficient information to share while still maintaining respondent anonymity. Data is from Ecosystem MarketPlace. Forest Trends, 2020.
Expected demand from the Carbon Offsetting and Reduction Scheme for International Aviation (COR-SIA) never materialized as the International Civil Aviation Organization (ICAO) Council adjusted the plan’s baseline in light of the COVID-19 pandemic. CORSIA was poised to represent a significant source of demand for carbon markets (estimated approximately 3 GtCO2e between 2020 and 2035), as the plan required countries to purchase/retire carbon credits to offset their airlines’ GHG emissions growth relative to a 2019–2020 baseline. With the COVID-19 pandemic bringing airline travel to an abrupt halt in 2020, the ICAO Council decided to set the carbon neutral growth baseline for international aviation activity from CORSIA’s pilot phase (2021–2023) based only on 2019 emissions levels.91 According to experts, this decision
91 ICAO. (2020). Impact of COVID-19 on CORSIA Design. https://www.icao.int/environmental-protection/CORSIA/Pages/CORSIA-and-Covid-19.aspx.
45
potentially nullifies airlines’ obligations for the pilot phase, even in the most optimistic recovery scenarios.92 Furthermore, the Council is considering making the 2019 baseline permanent through 2035 (though this decision will not be taken until ICAO’s General As-sembly meeting in 2022). Such a decision, together with the reduction in air travel due to the health crisis and ensuring recession, would reduce the possibility of CORSIA-dri-ven demand for offsets emerging even where air travel does recover.
T H E R O L E O F C A R B O N O F F S E T T I N G O N T H E P A T H T O N E T Z E R O
As the world sets its sights on achieving net zero emissions, there is increasing debate on the role of carbon offsetting in this transition. While collaborative initi-atives are beginning to forge consensus on some aspects of this debate, it is likely that voluntary markets will continue to see diverging standards and approaches.
The move toward net zero has triggered fresh discussions on the role of carbon offsetting in achieving long-term decarbonization. To meet the goals of the Paris Agreement, global emissions must be reduced to an absolute minimum by 2050, with residual emissions addressed through removals. The sheer scale of this effort requires drastic emissions cuts across all sectors and regions. While offsetting can contribute by mobilizing finance and lowering overall mitigation costs, there is increasing debate about how great its role should be. Since offsetting by its nature involves redistributing responsibility for emissions reductions across sectors or borders, its role is necessarily limited where deep decarbonization is required across the board. But it remains im-
92 Refinitiv. (2020). Carbon Market Year in Review 2020. https://www.refinitiv.com/content/dam/marketing/en_us/documents/reports/carbon-market-year-in-review-2020.pdf.93 Taskforce of Scaling Voluntary Carbon Markets. (January 2021). https://www.iif.com/Portals/1/Files/TSVCM_Report.pdf.94 Science-Based Targets. (September 2020). Foundations for Science-Based Net-Zero Target Setting in the Corporate Sector. https://sciencebasedtargets.org/resources/legacy/2020/09/foundations-for-net-ze-
ro-full-paper.pdf.95 M. Allen, K. Axelsson, B. Caldecott, T. Hale, C. Hepburn, C. Hickey, E. Mitchell-Larson, Y. Malhi, F. Otto, N. Seddon, and S. Smith. (2020). The Oxford Principles for Net Zero Aligned Carbon Offsetting. https://
www.smithschool.ox.ac.uk/publications/reports/Oxford-Offsetting-Principles-2020.pdf.96 Transition Pathway Initiative. (2020). TPI State of Transition Report 2020. https://www.transitionpathwayinitiative.org/publications/50.pdf?type=Publication.97 Institutional Investors Group on Climate Change. (2021). Net Zero Investment Framework: Implementation Guide. https://www.parisalignedinvestment.org/media/2021/03/PAII-Net-Zero-Investment-Frame-
work_Implementation-Guide.pdf.98 Blackrock. (February 2021). Climate Risk and the Transition to a Low-carbon Economy. Investment Stewardship. https://www.blackrock.com/corporate/literature/publication/blk-commentary-clima-
te-risk-and-energy-transition.pdf.99 University of Oxford. (September 2020). The Oxford Principles for Net-Zero Aligned Carbon Offsetting. https://www.smithschool.ox.ac.uk/publications/reports/Oxford-Offsetting-Principles-2020.pdf.
portant to answer questions such as how great a role offsets should play, how this role should evolve over time, and what kind of offsets should be prioritized.
There is increasing consensus that offsetting should be supplementary to compa-nies’ own emissions reduction as part of their corporate net-zero strategies. Over the past year, the Task Force on Scaling the Voluntary Markets (TSVCM),93 the Scien-ce-based Targets Initiative (SBTi),94 and the Oxford Principles for Net Zero Aligned Car-bon Offsetting95 have all published or proposed guidance that suggests corporations should prioritize reducing their own operational and value chain emissions first, with offsets playing a supplementary role. The Transition Pathway Initiative has also high-lighted that net-zero strategies relying heavily on offsets might come with unanticipa-ted risks.96 Statements from investors, like the Institutional Investors Group on Climate Change97 and Blackrock,98 have also encouraged the use of offsets as a supplementary and interim complement to corporate decarbonization strategies. Conversely, some companies are establishing net-zero targets without relying on offsets, like Walmart, Ikea, and Polestar.
The net-zero conversation is also forcing a reexamination of the role that different kinds of offsets can play in achieving deep decarbonization. With net zero implying global emissions are reduced to as close to zero as possible, offsetting may be largely limited to removals. Both the SBTi — which is emerging as the benchmark for ambi-tious corporate commitments — and the Net Zero Investment Framework only allow removals to be claimed toward net-zero commitments. Similarly, the Oxford Principles for Net-Zero Aligned Carbon Offsetting, adopted in September 2020, called for a shift over time to carbon removal projects with long-term storage.99 There do, however, re-
46
main diverging views as to the relative roles of nature-based removals such as forest regeneration and technological removals such as direct air capture and geological storage.100 At the same time, as governments ramp up their mitigation efforts and the costs of low-carbon technologies decrease, there will be less and less space for cer-tain project types. Verra has discontinued the registration of new renewable energy projects not located in Least Developed Countries — currently the main project types in terms of credit traded — on the basis that they no longer need carbon finance to be viable. Gold Standard’s project activity requirements do not allow for renewable energy projects in Upper Middle- or High-Income countries.
Ensuring the environmental integrity of offsets is crucial to the legitimacy of their role in the transition to net zero. Carbon credits should represent real, additional, verifiable, and permanent emission reductions or removals. Just as the integrity of a given credit rests on meeting these criteria, the legitimacy of offsetting as a tool relies on having sufficient trust and safeguards such that offsets on the whole live up to these standards. Poorly designed credits — whether they are used voluntarily by corporati-ons or are linked to ETSs/carbon taxes by governments — threaten to undermine the rest of a company’s or government’s climate strategy. This is one of the reasons why qualitative and quantitative restrictions exist for the use of carbon credits in all carbon taxes and ETSs.
The past year has seen moves toward adopting minimum standards aimed at en-suring the integrity of carbon credits. The TSVCM has proposed the adoption of a set of Core Carbon Principles that would include threshold quality standards for all offsets, which are currently being developed by a working group. The Oxford Principles for Net Zero Aligned Carbon Offsetting also include quality standards, while the SBTi has pro-posed quality criteria for removals as part of its draft Net-Zero Criteria. There is less consensus, however, on whether projects with cobenefits — environmental and social benefits beyond emissions abatement — should be prioritized by companies. The SBTi strongly recommends that companies prioritize interventions with strong cobenefits, as
100 The Oxford Principles for Net-Zero Aligned Carbon Offsetting, for instance, suggest that technological removals should be given priority in the long term due to removals being permanent. Other authors argue that nature-based removals should play an equal or greater role, due to the benefits they bring to developing countries, communities, and local environmental protection. https://www.ecosystemmarketplace.com/articles/shades-of-redd-risk-of-diverting-carbon-finance-from-nature-to-technological-carbon-removals/.
101 See, e.g., https://carbonmarketwatch.org/wp-content/uploads/2020/12/Carbon-Market-Watch-response-to-the-Consultation-of-the-Taskforce-on-Scaling-Voluntary-Carbon-Markets.pdf.102 Taskforce on Scaling Voluntary Carbon Markets. (January 2021). https://www.iif.com/Portals/1/Files/TSVCM_Report.pdf.103 Carbon Pulse. (March 23, 2021). Discredited, Ageing Kyoto Offsets Re-emerge to Taint Voluntary Carbon Market. https://carbon-pulse.com/124340/.104 Science-Based Targets. (January 26, 2021). Net-Zero Criteria Draft for Public Consultation. https://sciencebasedtargets.org/resources/files/Net-Zero-Criteria-Draft-for-Public-Consultation-v1-0.pdf.
do several civil society organizations.101 he TSVCM, for its part, does not consider cobe-nefits essential ingredients of carbon credits but has proposed that they be considered “additional attributes” that projects could claim in addition to meeting its Core Carbon Principles.102
Despite broader moves toward prioritizing certain kinds of offsets, the voluntary market is likely to remain heterogenous. As a market driven by commitments deve-loped independently by a diverse range of actors, the voluntary market is by its nature heterogenous. While there are increasing moves toward agreeing common standards that ensure the environmental integrity of corporate commitments, demand for credits that do not follow these standards is likely to continue. For instance, while the largest standards will no longer register renewable energy projects, a new Qatar-based stan-dard known as the Global Carbon Council has been established that specializes in these projects. The standard has an estimated pipeline of 10 MtCO2e for 2021 (roughly equi-valent to 10% of reported transactions in 2019) and a number of high-visibility clients such as the 2022 FIFA Qatar World Cup. Similarly, some voluntary buyers continue to purchase decade-old credits from the Kyoto Protocol’s Joint Implementation mecha-nism, despite most market actors suggesting that these credits do not offer real emissi-ons reductions.103
Compared with net-zero strategies, there may be room for more — and more di-verse — offsets in meeting short-term carbon neutral strategies. Net-zero targets are typically set for several decades ahead and require companies to find ways to decrease their own emissions over time and compensate the remainder with removals. However, the SBTi allows companies to undertake compensation actions emissions that are still being released into the atmosphere while they transition toward a state of net-zero emissions. These offsets could come either from removals or from avoided emissions and support actions that generate positive impact outside a company’s va-lue chain.104 Such strategies could see carbon credits being used to increase companies’ ambition rather than only as a cost reduction strategy.
47
S T A N D A R D I Z E D T R A N S A C T I O N S A N D D I G I T A L T E C H N O L O G I E S
Digital technologies and new services being of-fered by financial actors are at once helping to increase transparency on some elements of the market while threatening to obscure others.
Financial players are introducing standardized transaction services for the voluntary market. While CORSIA may not provide the demand it was previously anticipated to provide, it has driven brokers and exchanges to create a series of stan-dardized contracts and derivatives, including CBL’s Global Emission Offset (GEO), S&P Global Platts’ CORSIA-eligible credit, and AirCarbon’s CORSIA-Eli-gible Tokens. Together with the emergence of an increasingly diverse set of buyers, intermediaries, and brokers entering the voluntary market, these standardized products can enable the generation of real-time data and a liquid market — in turn hel-ping to scale the voluntary market. The drawback of blending such heterogenous products is that it obscures details about credits that have to-date been crucial to voluntary market buyers, such as project type, geographic location, and co-bene-fits, and could lead to large-scale carbon activities being prioritized over smaller community pro-jects. Some efforts have been made to distinguish these details, for instance, with AirCarbon’s tokens differentiating between standard and “premium” credits, the latter reflecting additional sustainable development benefits of projects. They also assure additional transparency through digital technolo-gies, which are beginning to play an increased role in carbon credit markets (see box 3.1).
BOX 3.1 Example of digital technologies in nature-based solution creditsDigital technology innovations can be used when generating and marketing carbon credits to create efficiencies, improve access to better quality data and analytics and help create well-functioning, liquid markets.
At the project level, innovative technologies are emerging that help to address challenges in ensuring accurately and efficiently measuring, reporting, and verifying emissions from foresty and land-use projects. Data from sa-tellites and aerial sensors from drones and low flying aircraft can be triangulated to provide more data at scale, while machine learning can train this data to improve the way projects are monitored and verified. These models are being used by companies such as Global Mangrove Trust, Pachama, or Regen Network to address monitoring challenges in large nature-based projects. Meanwhile, in Chile, the OpenSurface pilot project uses similar technolo-gies to help the government prioritize where to place resources.
When it comes to trading and retiring credits, blockchain technology can be one way to provide the traceability and immutability needed to verify that credits are not double counted and can facilitate linkages between national registry systems consistent with the bottom-up ethos of the Paris Agreement.105 Existing and developing block-chain-based solutions include tradable carbon credit tokens and token standardization, such as the Microsoft-bac-ked Interwork Alliance initiative or the CBL Nature-based Global Emissions Offset contract for agriculture, forestry, and other land-use projects. There are also climate marketplaces like the ones offered by AirCarbon and Clima-teTrade, and meta-registries such as the one to be launched soon by IHS Markit.106 Another example is the World Bank’s Climate Warehouse prototype,107 which seeks to offer a transparent public data layer that can provide real-time data to connected registry systems.
Artificial intelligence (AI) is also being used to help bring transparency to crediting markets. S&P Global Platts is developing a series of AI-driven carbon indices to enhance transparency into the cobenefits that carbon credits deliver, providing market participants with a greater understanding of their market value.108
105 World Bank, Summary Report: Simulation on Connecting Climate Market Systems. Washington, D.C.: World Bank. http://do-cuments1.worldbank.org/curated/en/128121575306092470/pdf/Summary-Report-Simulation-on-Connecting-Climate-Mar-ket-Systems.pdf.
106 IHS Markit. (March 9, 2021). IHS Markit to Launch Meta-Registry for Global Carbon Credit. https://ihsmarkit.com/research-ana-lysis/ihs-markit-to-launch-onestop-registry-for-global-carbon-credit.html.
107 The Climate Warehouse will soon go through a second simulation phase with partners to test out how a transparent public data layer can provide real-time data to connected registry systems, providing the data needed to prevent double counting and ease reporting requirements.
110 S&P Global Platts. (February 24, 2021). S&P Global Platts to Launch AI-Driven Carbon Credit Indices. https://www.spglobal.com/platts/en/market-insights/latest-news/coal/022421-sampp-global-platts-to-launch-ai-driven-carbon-credit-indices.
48
R O A D B L O C K S T O P U T T I N G A R T I C L E 6 I N T O A C T I O N P E R S I S T
As parties struggle to finalize Article 6 negotiations, countries continue to deve-lop pilot programs aimed at building capacities and infrastructure. However, few pilots focus on transactions, and future demand for such transactions continues to be uncertain.
Parties have yet to finalize negotiations on the modalities and rules to put Article 6 of the Paris Agreement into action. Various contentious issues remain, and the postponement of COP26 in 2020 hampered efforts to move toward a conclusion. Outstanding items are the same as those flagged in last year’s report: the rules go-verning how to avoid double-counting through corresponding adjustments, the appli-cation of a share of proceeds, the fate of pre-2021 Kyoto credits,109 and how to put the ambition of achieving an overall mitigation in global emissions into action.110 Negotiati-ons are now scheduled for finalization at COP26 in Glasgow in November 2021.
Article 6 pilots continue to emerge, albeit at a slower pace than in previous years, due to the pandemic and absence of international agreement on Article 6 rules. A number of countries and multilateral development banks are developing cooperative approaches with the aim of translating the Article 6 rulebook to real life contexts and, in turn, informing the further development of the Article 6 rules.111 While technical dia-logues on Article 6 rules continues to be held extensively by various parties to set up common building blocks for operationalizing Article 6, the uncertainty created by the COVID-19 pandemic and the absence of agreed-upon Article 6 rules did slow down the number of new piloting initiatives emerging over the past year.112 Even though pilots have generally been designed to allow for their implementation even if the Article 6 rules are not finalized in Glasgow (COP26), a prolonged failure to reach an agreement on the rules could prevent existing piloting efforts from being scaled up and repli-
109 For more information, see for instance, T. Ishikawa, S. Yamasaki, H. Fearnehough, L. Schneider, C. Warnecke, T. Hemmi, and K. Yamaguchi. (2020). CDM Supply Potential for Emission Reductions up to the End of 2020. https://www.iges.or.jp/jp/pub/cer-supply-potential/en.
110 World Bank. (2020). State and Trends of Carbon Pricing 2020. Washington, D.C.: World Bank. Doi: 10.1596/978-1-4648-1586-7.111 World Bank Blogs. (November 5, 2020). Unlocking Ambition through a Climate Market Club. https://blogs.worldbank.org/climatechange/unlocking-ambition-through-climate-market-club.112 Climate Focus, Perspectives Climate Group. (December 2020). Article 6 Piloting: State of Play and Stakeholder Experiences. https://www.climatefinanceinnovators.com/wp-content/uploads/2020/12/Climate-Fi-
nance-Innovators_Article-6-piloting_State-of-play-and-stakeholder-experiences_December-2020.pdf
cated, as well as inhibiting the generation of Internationally Transferred Mitigation Outcomes (ITMOs).
Of the 21 Article 6 pilot initiatives identified in this report, the most common type focuses on capacity building, establishing the necessary infrastructure, and ena-bling environment to engage in Article 6 transfers. Early exploration of Article 6 cooperation has identified a strong need for capacity-building, in particular in host countries, to enable a strategic engagement with the international compliance market and ensure the environmental integrity of cooperation (see figure 3.5).
49

FIGURE 3.5 Article 6 pilots by stage of development and sector
Stat
e of
dev
elop
men
t
Enabing environment
8Preparatory phase
11Piloting phase
1Implementation
1
Sect
ors
Not defined yet
8Mixed *
7Renewable energy
2Energy efficiency
2Waste
2
* Note: The 'Mixed' category mostly includes energy efficiency, waste, and renewable energy projects, and to a lesser extent, transport, manufacturing, fugitive emissions, forestry, industrial gases, and agriculture activities.* Note: The 'Mixed' category mostly includes energy efficiency, waste, and renewable energy projects, and to a lesser extent, transport, manufacturing, fugitive emissions, forestry, industrial gases, and agriculture activities.
50
Some pilots are aimed at implementing crediting activities that would eventually generate ITMOs when Article 6 is put into action. Most of these piloting activities are initiated by countries looking to acquire ITMOs and currently are in very early stages of development. Only a few of them have progressed into the implementation phase, signing a bilateral agreement — Switzerland signed the first Article 6-specific bilateral agreements with Peru and Ghana on October and November 2020, respectively — and advancing in establishing mitigation outcome purchase agreements.113 The Japanese Joint Crediting Mechanism is at the forefront of developing ITMO agreements. Under the mechanism, a number of bilateral and commercial agreements with countries and project developers have been signed, and activities are generating carbon credits that could be eligible as ITMOs once Article 6 becomes operational. The World Bank’s Climate Warehouse simulation would provide further insights on how carbon assets including the use case of ITMOs are transferred among connected registries to avoid double counting and track corresponding adjustment. The agreements signed by Switzerland with Peru and Ghana may provide a possible blueprint after which other actors can model their own modalities for cooperation.
Future demand for ITMOs continues to be uncertain. As of February 2021, 69% of parties that had already communicated a new or updated NDC indicated their inten-tion to (possibly) use cooperative approaches under Article 6.2 of the Paris Agree-ment.114 Although this figure suggests widespread interest in Article 6, it still does not give full insight into the future demand for ITMOs. Most developed countries — who are more likely to be buyers in ITMO transactions — have indicated they do not in-tend to use ITMOs to meet their NDCs. Only four “Annex I” parties to the UNFCCC have expressed the intention to use international market mechanisms,115 while four others will consider using them.116 It is still too early to say what impact this may have on the crediting market and prices, however. As the number of credits used will likely be quite
113 Climate Cent Foundation. (February 2, 2021). Pilot Activities under the Paris Agreement. https://www.klimarappen.ch/en/Pilot-activities-under-the-Paris-Agreement-.34.html.114 This analysis includes 48 new or updated NDCs, relating to 75 Parties. UNFCCC. (February 2021). Nationally Determined Contributions under the Paris Agreement: Synthesis Report by the Secretariat. https://unf-
ccc.int/process-and-meetings/the-paris-agreement/nationally-determined-contributions-ndcs/nationally-determined-contributions-ndcs/ndc-synthesis-report. 115 Japan, Switzerland, Turkey, Ukraine.116 Monaco, Norway, Russian Federation, United Kingdom.
small, it is unlikely to have a noticeable impact unless Article 6 projects and interest escalates further.
More information on the Article 6 pilots can be found in Annex C.
51

T Y P E A N D U S E O F I N T E R N A L C A R B O N P R I C I N G B Y C O M P A N I E S INTERNAL
CARBON PRICINGC H A P T E R 4
Nearly half of the largest 500 companies in the world by market cap re-port the use of an internal carbon price or the intention to use one within the next two years.117 This comes paired with a rising level of sophisticati-on in the way internal carbon pricing is being set and applied, with com-panies differentiating its valuation and application across geographies and business units.
However, drawing firm conclusions and more insights on the level and impact of internal carbon prices remains challenging given the lack of transparency in divulging methodologies, existence of clear guidelines, and publication of price levels used by different companies. Firms may announce, for instance, the use of an internal carbon price without accompa-nying information on how it is used. As such, insights drawn from this section of the report are limited. The report largely draws on data from CDP but is confined to corporate data that was disclosed publicly (47.5% of companies that responded to CDP’s climate change questionnaire).
The past year has seen a considerable increase in the number of compa-nies reporting the usage of internal carbon pricing. In 2020, 853 companies disclosed use of an internal carbon price, with an additional 1,159 noting an intention to adopt one over the next two years.118 This represents a 20% in-crease above 2019 and shows a fourfold increase in the market capitalization that these companies jointly represent: increasing from USD 7 trillion in 2017 to over USD 27 trillion in 2020.119 Many of the world’s largest corporations are part of this leading cohort — data shows that as of 2020, nearly half (226) of the 500 biggest companies by market cap now fall into this category. This trend indicates that the private sector is increasingly integrating climate risks and opportunities into long-term strategies and sees an internal carbon price as an effective instrument to help guide investment decision-making proces-ses.
117 CDP Disclosure 2020.118 CDP Disclosure 2020.119 CDP Disclosure 2020.
52
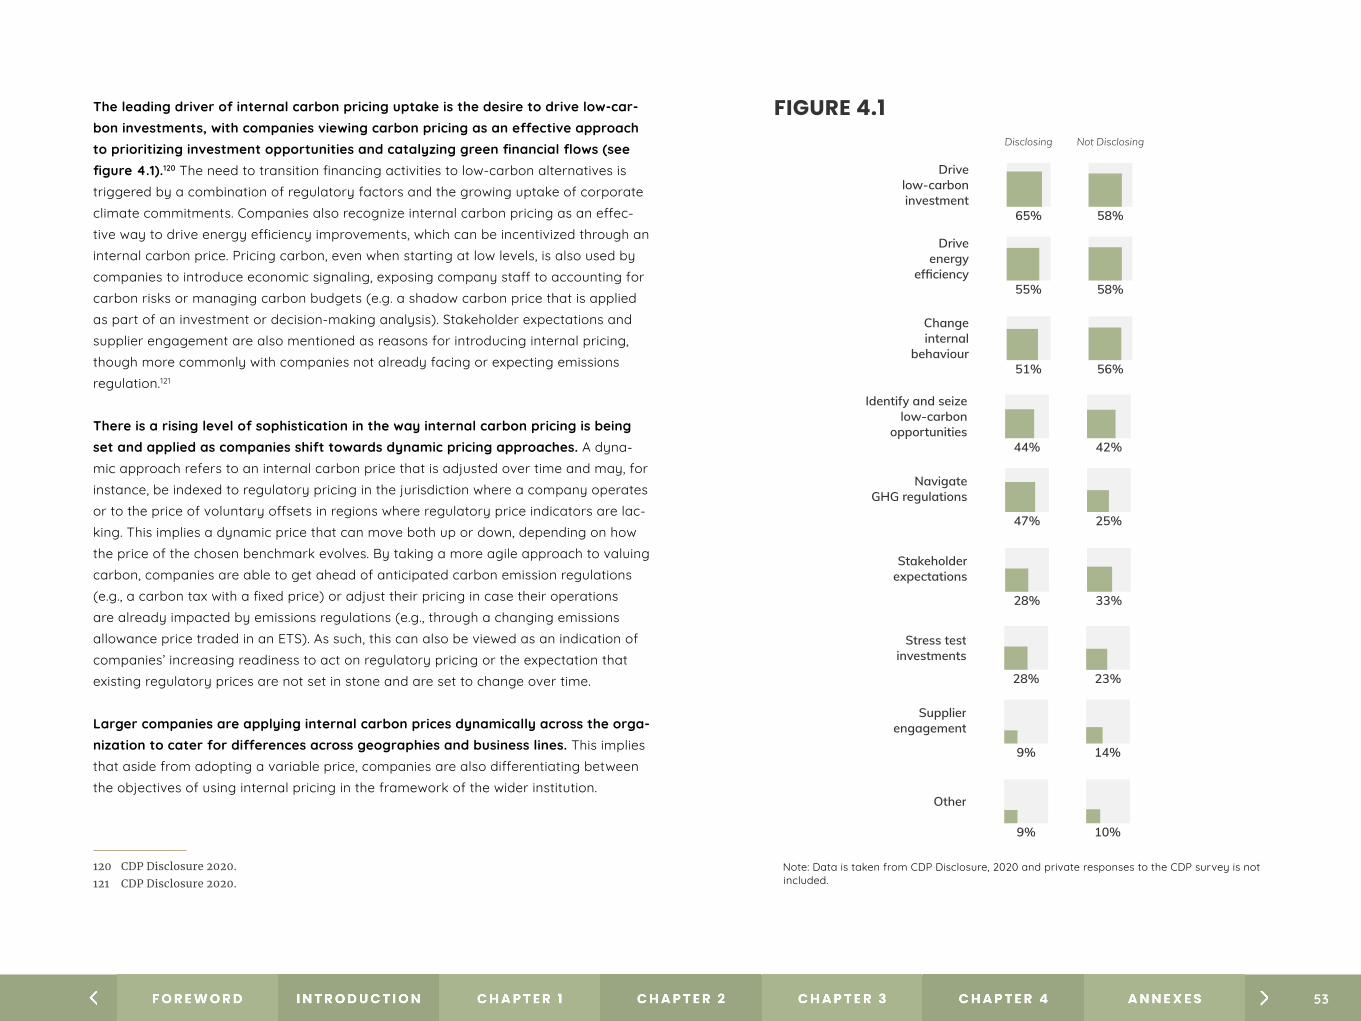
The leading driver of internal carbon pricing uptake is the desire to drive low-car-bon investments, with companies viewing carbon pricing as an effective approach to prioritizing investment opportunities and catalyzing green financial flows (see figure 4.1).120 The need to transition financing activities to low-carbon alternatives is triggered by a combination of regulatory factors and the growing uptake of corporate climate commitments. Companies also recognize internal carbon pricing as an effec-tive way to drive energy efficiency improvements, which can be incentivized through an internal carbon price. Pricing carbon, even when starting at low levels, is also used by companies to introduce economic signaling, exposing company staff to accounting for carbon risks or managing carbon budgets (e.g. a shadow carbon price that is applied as part of an investment or decision-making analysis). Stakeholder expectations and supplier engagement are also mentioned as reasons for introducing internal pricing, though more commonly with companies not already facing or expecting emissions regulation.121
There is a rising level of sophistication in the way internal carbon pricing is being set and applied as companies shift towards dynamic pricing approaches. A dyna-mic approach refers to an internal carbon price that is adjusted over time and may, for instance, be indexed to regulatory pricing in the jurisdiction where a company operates or to the price of voluntary offsets in regions where regulatory price indicators are lac-king. This implies a dynamic price that can move both up or down, depending on how the price of the chosen benchmark evolves. By taking a more agile approach to valuing carbon, companies are able to get ahead of anticipated carbon emission regulations (e.g., a carbon tax with a fixed price) or adjust their pricing in case their operations are already impacted by emissions regulations (e.g., through a changing emissions allowance price traded in an ETS). As such, this can also be viewed as an indication of companies’ increasing readiness to act on regulatory pricing or the expectation that existing regulatory prices are not set in stone and are set to change over time.
Larger companies are applying internal carbon prices dynamically across the orga-nization to cater for differences across geographies and business lines. This implies that aside from adopting a variable price, companies are also differentiating between the objectives of using internal pricing in the framework of the wider institution.
120 CDP Disclosure 2020.121 CDP Disclosure 2020.
FIGURE 4.1 Motivations for internal carbon pricing
Note: Data is taken from CDP Disclosure, 2020 and private responses to the CDP survey is not included.
Identify and seizelow-carbon
opportunities
Disclosing Not Disclosing
44% 42%
NavigateGHG regulations
47% 25%
Stakeholderexpectations
28% 33%
Drivelow-carboninvestment
Disclosing Not Disclosing
65% 58%
Driveenergy
efficiency55% 58%
Changeinternal
behaviour51% 56%
Stress testinvestments
Disclosing Not Disclosing
28% 23%
Supplierengagement
9% 14%
Other
9% 10%
Note: Private responses to the CDP survey are not included.Identify and seizelow-carbon
opportunities
Disclosing Not Disclosing
44% 42%
NavigateGHG regulations
47% 25%
Stakeholderexpectations
28% 33%
Drivelow-carboninvestment
Disclosing Not Disclosing
65% 58%
Driveenergy
efficiency55% 58%
Changeinternal
behaviour51% 56%
Stress testinvestments
Disclosing Not Disclosing
28% 23%
Supplierengagement
9% 14%
Other
9% 10%
Note: Private responses to the CDP survey are not included.included.
53
For example, conglomerates active across numerous jurisdictions may value the internal carbon price in accordance with regulatory price signals that are anticipated in the geographies of operation. For organizations that are subject to more than one regulatory plan, settling for one flat, company-wide price might be ineffective, trigge-ring companies to look for ways to tailor their price setting approach to local contexts. Companies are also adopting different price levels depending on the impact a given business unit is likely to play within the broader institutional structure, in terms of its business condition, degree of environmental impact, or readiness for uptake by ma-nagement.
There is a growing correlation between companies adopting internal carbon pricing and corporations adopting science-based targets. A quarter of the companies using an internal carbon price already have adopted an approved target under the SBTi.122 Furthermore, 86% of companies ranked on CDP’s climate “A List” — companies leading in terms of environmental transparency and action — are using or planning to imple-ment pricing in the next two years. This evidence pointing to a correlation between corporate climate action and the uptake of internal pricing is encouraging. It indicates that application of an internal carbon price is perceived to be an important lever that corporations can pull to trigger decarbonization. At the same time, companies are not transparent about the role internal carbon pricing plays in corporate climate strategies, and more guidance on approaches through which internal carbon pricing can support the realization of science-based targets is needed.
Internal carbon pricing is also being triggered by corporate climate governance ini-tiatives. Most notably, the Task Force on Climate-related Financial Disclosures (TCFD) — an initiative that offers a framework for companies to develop more effectivecli-
122 Approved Science-based initiative targets include 1.5˚C compatible, well below 2˚C compatible, and 2˚C compatible targets.123 TCFD. (2020). 2020 Status Report. https://www.fsb.org/wp-content/uploads/P291020-1.pdf.124 New Zealand, for instance, became the first country to mandate TCFD reporting in September 2020. Meanwhile, a consultation launched by the U.K. government in March 2021 seeks views on proposals to require
mandatory TCFD-aligned, climate-related financial disclosures from publicly quoted companies, large private companies, and Limited Liability Partnerships.
mate-related financial disclosures and that has already been endorsed by over 1,900 organizations — encourages companies to use internal carbon pricing to measure ex-posure to climate-related issues and progress in managing or adapting to those issues. Among the companies that are following the TCFD recommendations to improve their climate-related financial disclosures, internal carbon pricing is regarded as one of the most useful metrics for assessing corporate climate-related risks and opportunities.123 Looking ahead, it will be interesting to observe to what extent nonfinancial disclosure requirements mandated by governments will encourage companies to take on internal carbon pricing as an instrument to manage climate change exposure.124
CASE STUDYRole of internal carbon pricing in LafargeHolcim’s net-zero strategy
LafargeHolcim is the first global building materials company to sign the United Nations Global Compact’s “Business Ambition for 1.5°C” initiative with interme-diate targets approved by the SBTi in alignment with the net-zero pathway. The company is pursuing a number of climate mitigation and adaptation stra-tegies, like the use of green bonds and tying sustainability objectives to exe-cutive compensation. As the company operates across nine jurisdictions with carbon pricing regulations, LafargeHolcim also uses a shadow price on carbon at USD 34/tCO2 to prioritize low-carbon investments, change internal behavior, identify energy efficiency, and seize low-carbon opportunities.
54
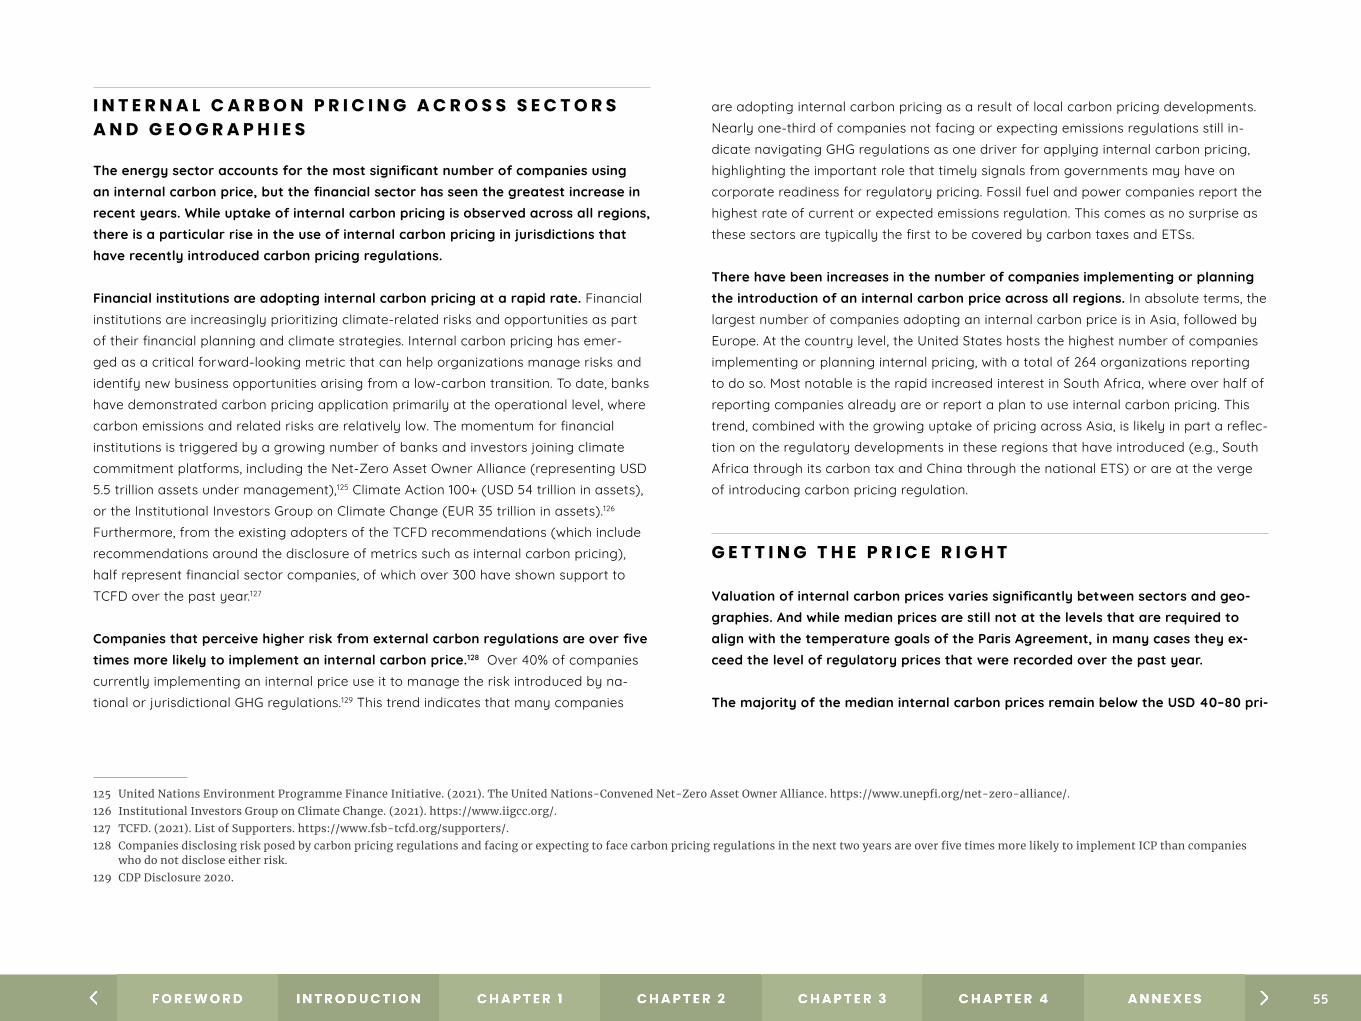
I N T E R N A L C A R B O N P R I C I N G A C R O S S S E C T O R S A N D G E O G R A P H I E S
The energy sector accounts for the most significant number of companies using an internal carbon price, but the financial sector has seen the greatest increase in recent years. While uptake of internal carbon pricing is observed across all regions, there is a particular rise in the use of internal carbon pricing in jurisdictions that have recently introduced carbon pricing regulations.
Financial institutions are adopting internal carbon pricing at a rapid rate. Financial institutions are increasingly prioritizing climate-related risks and opportunities as part of their financial planning and climate strategies. Internal carbon pricing has emer-ged as a critical forward-looking metric that can help organizations manage risks and identify new business opportunities arising from a low-carbon transition. To date, banks have demonstrated carbon pricing application primarily at the operational level, where carbon emissions and related risks are relatively low. The momentum for financial institutions is triggered by a growing number of banks and investors joining climate commitment platforms, including the Net-Zero Asset Owner Alliance (representing USD 5.5 trillion assets under management),125 Climate Action 100+ (USD 54 trillion in assets), or the Institutional Investors Group on Climate Change (EUR 35 trillion in assets).126 Furthermore, from the existing adopters of the TCFD recommendations (which include recommendations around the disclosure of metrics such as internal carbon pricing), half represent financial sector companies, of which over 300 have shown support to TCFD over the past year.127
Companies that perceive higher risk from external carbon regulations are over five times more likely to implement an internal carbon price.128 Over 40% of companies currently implementing an internal price use it to manage the risk introduced by na-tional or jurisdictional GHG regulations.129 This trend indicates that many companies
125 United Nations Environment Programme Finance Initiative. (2021). The United Nations-Convened Net-Zero Asset Owner Alliance. https://www.unepfi.org/net-zero-alliance/.126 Institutional Investors Group on Climate Change. (2021). https://www.iigcc.org/.127 TCFD. (2021). List of Supporters. https://www.fsb-tcfd.org/supporters/.128 Companies disclosing risk posed by carbon pricing regulations and facing or expecting to face carbon pricing regulations in the next two years are over five times more likely to implement ICP than companies
who do not disclose either risk.129 CDP Disclosure 2020.
are adopting internal carbon pricing as a result of local carbon pricing developments. Nearly one-third of companies not facing or expecting emissions regulations still in-dicate navigating GHG regulations as one driver for applying internal carbon pricing, highlighting the important role that timely signals from governments may have on corporate readiness for regulatory pricing. Fossil fuel and power companies report the highest rate of current or expected emissions regulation. This comes as no surprise as these sectors are typically the first to be covered by carbon taxes and ETSs.
There have been increases in the number of companies implementing or planning the introduction of an internal carbon price across all regions. In absolute terms, the largest number of companies adopting an internal carbon price is in Asia, followed by Europe. At the country level, the United States hosts the highest number of companies implementing or planning internal pricing, with a total of 264 organizations reporting to do so. Most notable is the rapid increased interest in South Africa, where over half of reporting companies already are or report a plan to use internal carbon pricing. This trend, combined with the growing uptake of pricing across Asia, is likely in part a reflec-tion on the regulatory developments in these regions that have introduced (e.g., South Africa through its carbon tax and China through the national ETS) or are at the verge of introducing carbon pricing regulation.
G E T T I N G T H E P R I C E R I G H T
Valuation of internal carbon prices varies significantly between sectors and geo-graphies. And while median prices are still not at the levels that are required to align with the temperature goals of the Paris Agreement, in many cases they ex-ceed the level of regulatory prices that were recorded over the past year.
The majority of the median internal carbon prices remain below the USD 40–80 pri-
55

ce per ton range that is required to meet the temperature goals of the Paris Agree-ment.130 However, 16.1% of the companies publicly reporting to CDP use prices that fall within this range, and 9.8% use higher prices. Reported internal carbon price valuation ranges from USD 6 to USD 918, showing a high rate of variability depending on the sector within which a company operates. Reported internal carbon price valuation ran-ges from USD 6 to USD 918, showing a high rate of variability depending on the sector within which a company operates (see figure 4.2). Companies may also use more than one internal carbon price or sliding scale of carbon prices to reflect different and/or increasing carbon prices, as well as regulatory environments. In terms of geographic trends, the lowest median pricing is observed with companies operating in Africa. One explanation for this may be the low prevalence of regulatory pricing, reducing the ur-gency of companies to apply internal pricing as a strategy to anticipate carbon pricing. The highest median pricing can be observed in Europe and Asia, with existing or upco-ming regulation being one explanation for the uptake of higher internal carbon prices. While median prices are still not at the levels that are required to align with the tempe-rature goals of the Paris Agreement, in many cases they exceed the level of regulatory prices that were recorded over the past year.
Shadow carbon pricing remains the most common form of internal carbon pricing, at a median price of USD 28. A shadow price sets a hypothetical carbon cost to each ton of emissions to identify climate risks and opportunities, and prioritize future invest-ments' strategic decision-making. It is typically used as a metric to value capital invest-ments and to understand how pricing emissions impacts business cases. For example, an investment board may approve investments within their company based on re-venues adjusted for the carbon cost in the context of a carbon intensive investment. Financial institutions, on the other hand, may use it to guide capital allocation decisions under a credit line, triggering a shift to low-carbon alternatives.
Another commonly applied form of internal pricing is through an implicit price, with a median price of USD 27. An implicit price quantifies the capital investments needed to achieve certain climate- or energy-energy targets ex-post and uses this value as a benchmark to guide future investment decisions. Some companies estimate this implicit price based on the carbon offsets required to reduce their emissions or achieve carbon
130 World Bank. (2017). Report of the High-Level Commission on Carbon Prices. https://www.carbonpricingleadership.org/report-of-the-highlevel-commission-on-carbon-prices.
neutrality targets. Internal carbon fees are also commonly applied, with a median price of USD 18. Companies apply this fee to existing emissions across different divisions, raising funding that is reinvested into low-carbon investments. Some companies take this approach further and establish internal trading, allowing different departments to trade allowances in a similar fashion to an ETS.
56

FIGURE 4.2 Internal carbon pricing across industries
2020
car
bon
pric
e co
rrid
or *
86
49
29 31
16
2529 29
24 2317
20
0
20
40
60
80
100
120
140
200
600
1000
1400
1800
Bio
tech
, hea
lth c
are
& p
harm
a
App
arel
Food
, bev
erag
e&
agr
icul
ture
Foss
il fu
els
Hos
pita
lity
Infr
astr
uctu
re
Man
ufac
turin
g
Mat
eria
ls
Pow
er g
ener
atio
n
Ret
ail
Serv
ices
Tran
spor
tatio
n se
rvic
es
Note: Private responses to the CDP survey are not included. * The 2020 carbon price corridor is the recommendation of the World Bank’s 2017 High-Level Commission on Carbon Prices Report.
Inte
rnal
car
bon
pric
es a
pplie
d (U
SD/tC
O₂e
)
Note: In the above graphic, the grey dots represent individual internal carbon prices applied by companies responding to the CDP survey (private responses are not included). Responses are organized by trade category, and median price points per category indicated in red.
* The 2020 carbon price corridor is the recommendation of the World Bank’s 2017 High-Level Commission
57
58
A N N E X A
METHODOLOGIES AND SOURCES

G E N E R A L N O T E S
1. The State and Trends of Carbon Pricing 2021 report draws on a range of sources, including official reporting (i.e., government budget documents), related legislati-on that underpins the carbon pricing initiative, statements from governments and public authorities and information provided by jurisdictions. Data and updates in the report represents the current situation as of April 1, 2021, unless stated otherwise.
2. Carbon pricing mechanisms: The authors recognize that other classifications are possible. The carbon pricing initiatives have been classified in ETSs and carbon taxes according to how they operate technically. ETS not only refers to cap-and-tra-de systems but also baseline-and-credit systems.
3. Emissions: Information on GHG emissions is based on 2015 EDGAR v5.0 GHG emissi-ons data, where available, or 2015 emissions data from official sources to be consis-tent across jurisdictions. a. GHG emissions values for Canadian states is total emissions in Canada’s submis-
sion to the UNFCCC.b. GHG emissions values for U.S. states is from official subnational GHG inventory
reports of each of the respective states. 4. Coverage: In previous years, the State and Trends report calculated the coverage
of GHG emissions of carbon pricing initiatives in operation and scheduled. However, going forward, starting with this year’s report, this figure is calculated only based on carbon pricing initiatives in operation. The calculation of emissions coverage by carbon pricing instruments is based on official government sources but does not ne-cessarily factor in exemptions and/or emissions thresholds. For example, there was not enough information available on the overlap between Mexico federal and local carbon pricing instruments; hence, the overlap could not be calculated.
5. Status of carbon pricing instruments: Carbon pricing initiatives are considered “scheduled for implementation” once they have been formally adopted through legislation and have an official, planned start date. Carbon pricing initiatives are “under consideration” if the government has announced its intention to work toward the implementation of a carbon pricing initiative, and this has been formally con-firmed by official government sources. In previous years, Australia was marked as having an ETS in operation in the carbon pricing ETS and carbon tax map. However, reviewing the Australian system, the Safeguard Mechanism functions more like a baseline-and-offsets program and would fall outside the scope of the definition of ETS. Therefore, the decision was made to remove the system from the world map.
Additionally, Rio de Janeiro and Sao Paolo were also marked as considering the implementation of an ETS based on scoping work done in 2011 and 2012, respective-ly. Given there have been no updates since, the decision was also made to remove these two jurisdictions from the map.
6. Price: Additional price information is further clarified here: • As Mexico is currently operating its pilot ETS with no economic effects and 100%
free allocation, there is no price information currently available. Massachusetts ETS price data is equal to the March 10, 2021, auction clearing price.
• California and Québec cap-and-trade price data is the California Carbon Allo-wance Vintage 2021 Futures Front April on April 1, 2021.
• RGGI price data is the weighted average of the allowance transfer transaction prices on March 29, 2021, for 01/01/2021–12/31/2023 allowance control period converted from USD/short tons CO2e to USD/metric tons CO2e.
7. Revenue: For jurisdictions with fiscal year starting on April 1, the revenue between January 1, 2020, and December 31, 2020, is estimated by the addition of one quarter of the April 1, 2019–April 1, 2020, revenue and three quarters of the April 1, 2020–April 1, 2021 revenue estimate. Although subnational carbon taxes in Zacatecas and Baja California have been implemented, official information is not available as to whether these taxes have been collected yet, and thus, total revenue levels are unclear.
8. 2020 ETS price developments: Price development data is taken from the Interna-tional Carbon Action Partnership’s Allowance Price Explorer, which has up-to-date information on allowance prices in ETSs. The following sources were also drawn upon: California (the California Air Resources Board website), EU ETS (spot price data is provided by the European Energy Exchange group), Québec (the Ministry for the Fight Against Climate Change website), RGGI (RGGI website), Switzerland (Inter-continental Exchange and the Swiss Emissions Registry).
9. Price and Supply Adjustment Mechanisms: The following describes the different categories of PSAMs included in Table 2.1.
Measures to respond to both low and high pricesMarket stability reserve: A rule-based, quantity-triggered intervention designed to adjust the annual number of allowances auctioned in the market in certain years, based on predefined rules surrounding the level of the allowance surplus.Price corridor: A mechanism that combines a price floor and a price ceiling.
59
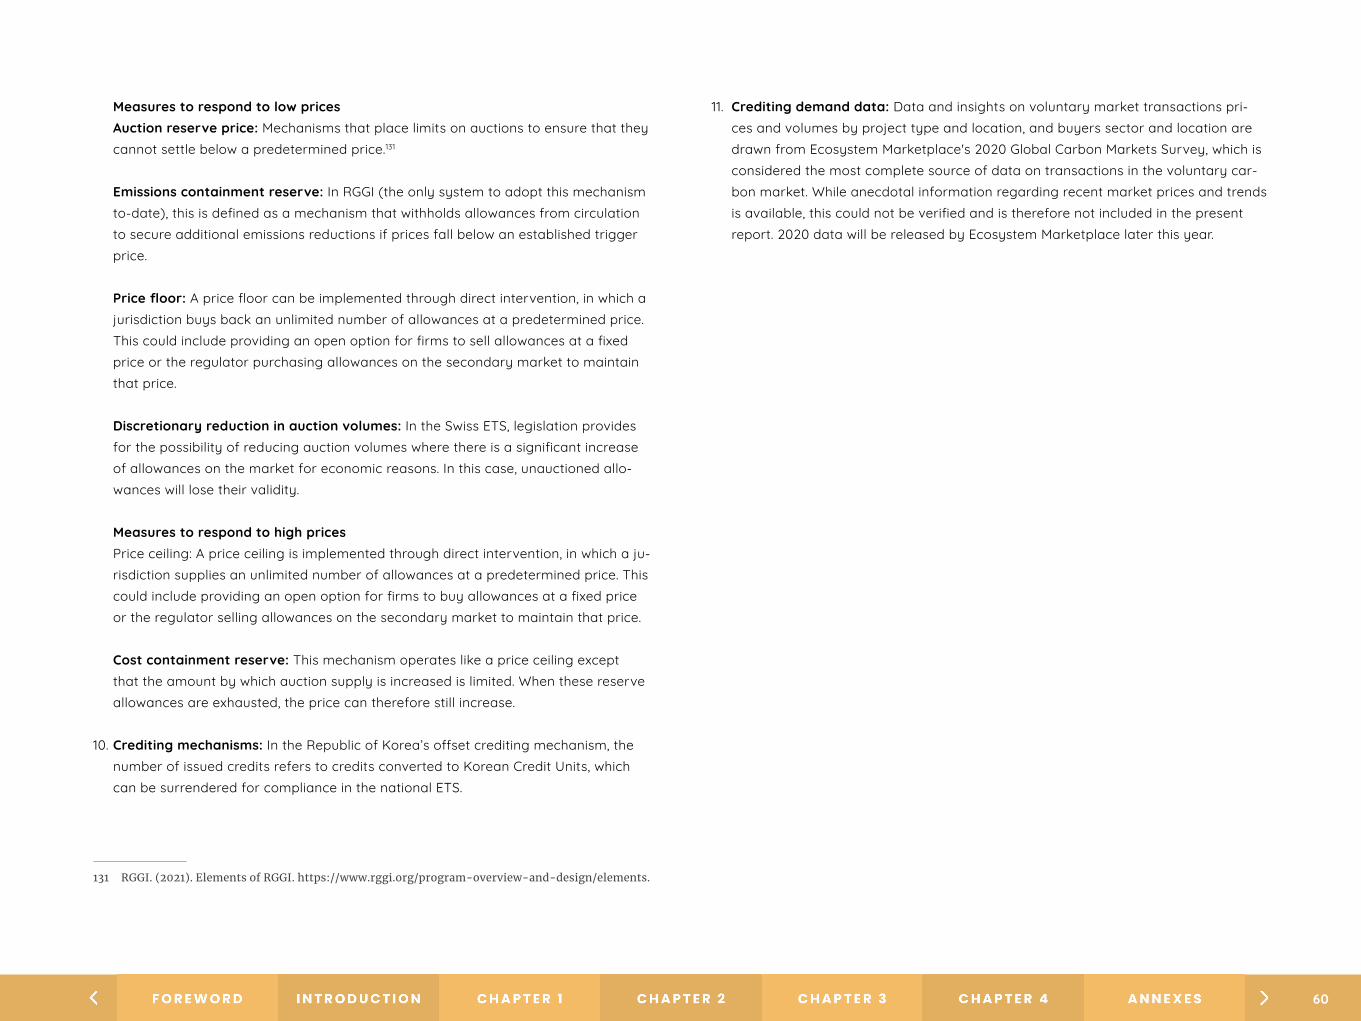
Measures to respond to low prices Auction reserve price: Mechanisms that place limits on auctions to ensure that they cannot settle below a predetermined price.131
Emissions containment reserve: In RGGI (the only system to adopt this mechanism to-date), this is defined as a mechanism that withholds allowances from circulation to secure additional emissions reductions if prices fall below an established trigger price.
Price floor: A price floor can be implemented through direct intervention, in which a jurisdiction buys back an unlimited number of allowances at a predetermined price. This could include providing an open option for firms to sell allowances at a fixed price or the regulator purchasing allowances on the secondary market to maintain that price.
Discretionary reduction in auction volumes: In the Swiss ETS, legislation provides for the possibility of reducing auction volumes where there is a significant increase of allowances on the market for economic reasons. In this case, unauctioned allo-wances will lose their validity.
Measures to respond to high pricesPrice ceiling: A price ceiling is implemented through direct intervention, in which a ju-risdiction supplies an unlimited number of allowances at a predetermined price. This could include providing an open option for firms to buy allowances at a fixed price or the regulator selling allowances on the secondary market to maintain that price.
Cost containment reserve: This mechanism operates like a price ceiling except that the amount by which auction supply is increased is limited. When these reserve allowances are exhausted, the price can therefore still increase.
10. Crediting mechanisms: In the Republic of Korea’s offset crediting mechanism, the number of issued credits refers to credits converted to Korean Credit Units, which can be surrendered for compliance in the national ETS.
131 RGGI. (2021). Elements of RGGI. https://www.rggi.org/program-overview-and-design/elements.
11. Crediting demand data: Data and insights on voluntary market transactions pri-ces and volumes by project type and location, and buyers sector and location are drawn from Ecosystem Marketplace's 2020 Global Carbon Markets Survey, which is considered the most complete source of data on transactions in the voluntary car-bon market. While anecdotal information regarding recent market prices and trends is available, this could not be verified and is therefore not included in the present report. 2020 data will be released by Ecosystem Marketplace later this year.
60

A N N E X B
CARBON TAX AND ETS UPDATES
61
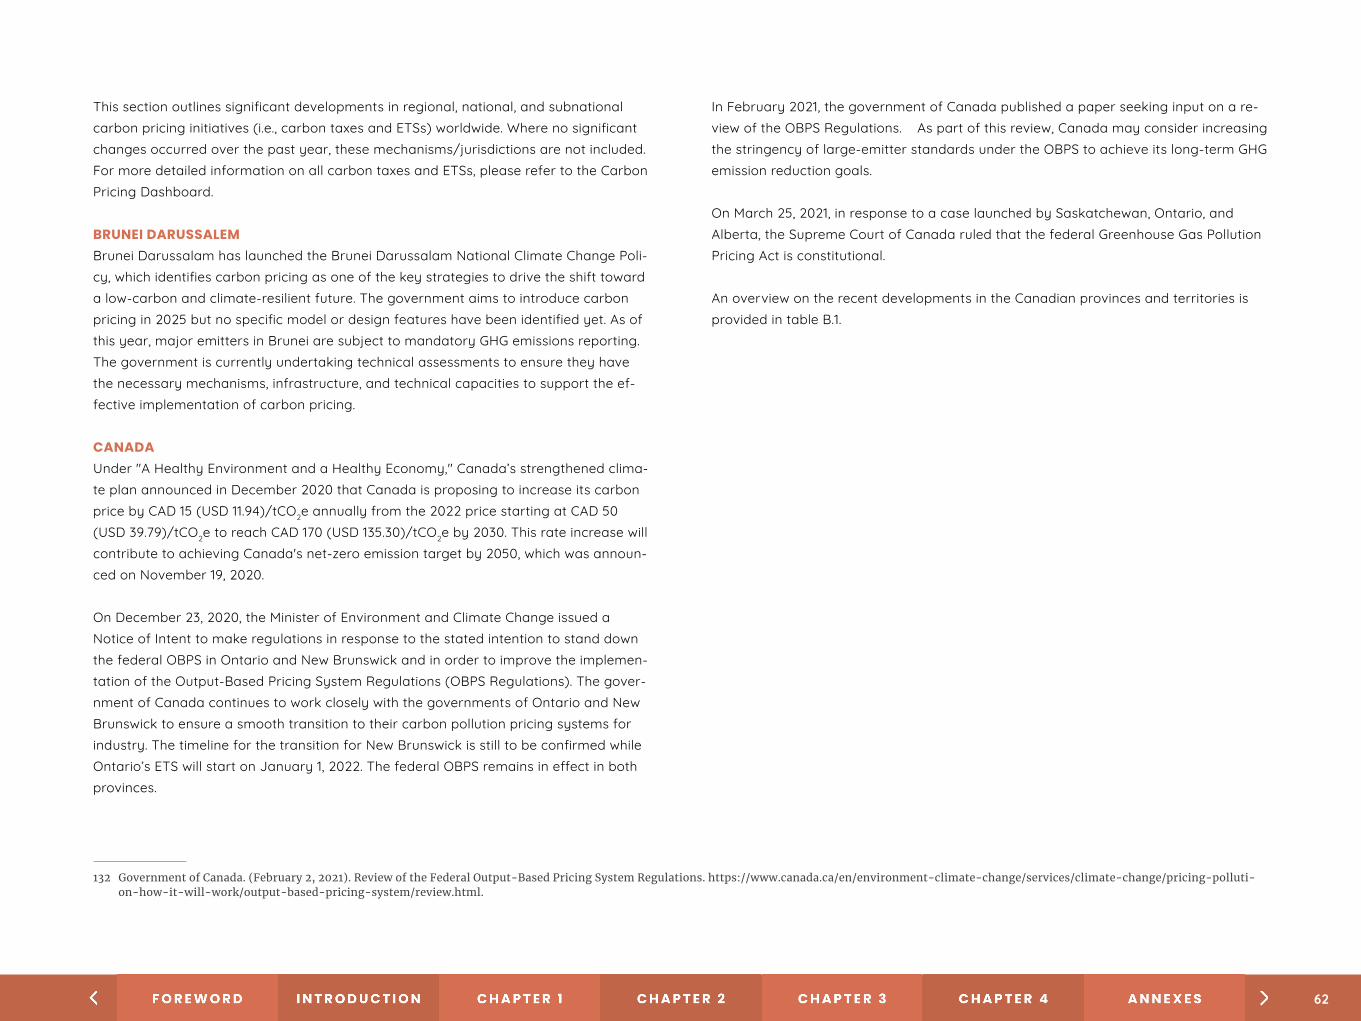
This section outlines significant developments in regional, national, and subnational carbon pricing initiatives (i.e., carbon taxes and ETSs) worldwide. Where no significant changes occurred over the past year, these mechanisms/jurisdictions are not included. For more detailed information on all carbon taxes and ETSs, please refer to the Carbon Pricing Dashboard.
BRUNEI DARUSSALEMBrunei Darussalam has launched the Brunei Darussalam National Climate Change Poli-cy, which identifies carbon pricing as one of the key strategies to drive the shift toward a low-carbon and climate-resilient future. The government aims to introduce carbon pricing in 2025 but no specific model or design features have been identified yet. As of this year, major emitters in Brunei are subject to mandatory GHG emissions reporting. The government is currently undertaking technical assessments to ensure they have the necessary mechanisms, infrastructure, and technical capacities to support the ef-fective implementation of carbon pricing.
CANADA Under "A Healthy Environment and a Healthy Economy," Canada’s strengthened clima-te plan announced in December 2020 that Canada is proposing to increase its carbon price by CAD 15 (USD 11.94)/tCO2e annually from the 2022 price starting at CAD 50 (USD 39.79)/tCO2e to reach CAD 170 (USD 135.30)/tCO2e by 2030. This rate increase will contribute to achieving Canada's net-zero emission target by 2050, which was announ-ced on November 19, 2020.
On December 23, 2020, the Minister of Environment and Climate Change issued a Notice of Intent to make regulations in response to the stated intention to stand down the federal OBPS in Ontario and New Brunswick and in order to improve the implemen-tation of the Output-Based Pricing System Regulations (OBPS Regulations). The gover-nment of Canada continues to work closely with the governments of Ontario and New Brunswick to ensure a smooth transition to their carbon pollution pricing systems for industry. The timeline for the transition for New Brunswick is still to be confirmed while Ontario’s ETS will start on January 1, 2022. The federal OBPS remains in effect in both provinces.
132 Government of Canada. (February 2, 2021). Review of the Federal Output-Based Pricing System Regulations. https://www.canada.ca/en/environment-climate-change/services/climate-change/pricing-polluti-on-how-it-will-work/output-based-pricing-system/review.html.
In February 2021, the government of Canada published a paper seeking input on a re-view of the OBPS Regulations.132 As part of this review, Canada may consider increasing the stringency of large-emitter standards under the OBPS to achieve its long-term GHG emission reduction goals.
On March 25, 2021, in response to a case launched by Saskatchewan, Ontario, and Alberta, the Supreme Court of Canada ruled that the federal Greenhouse Gas Pollution Pricing Act is constitutional.
An overview on the recent developments in the Canadian provinces and territories is provided in table B.1.
62
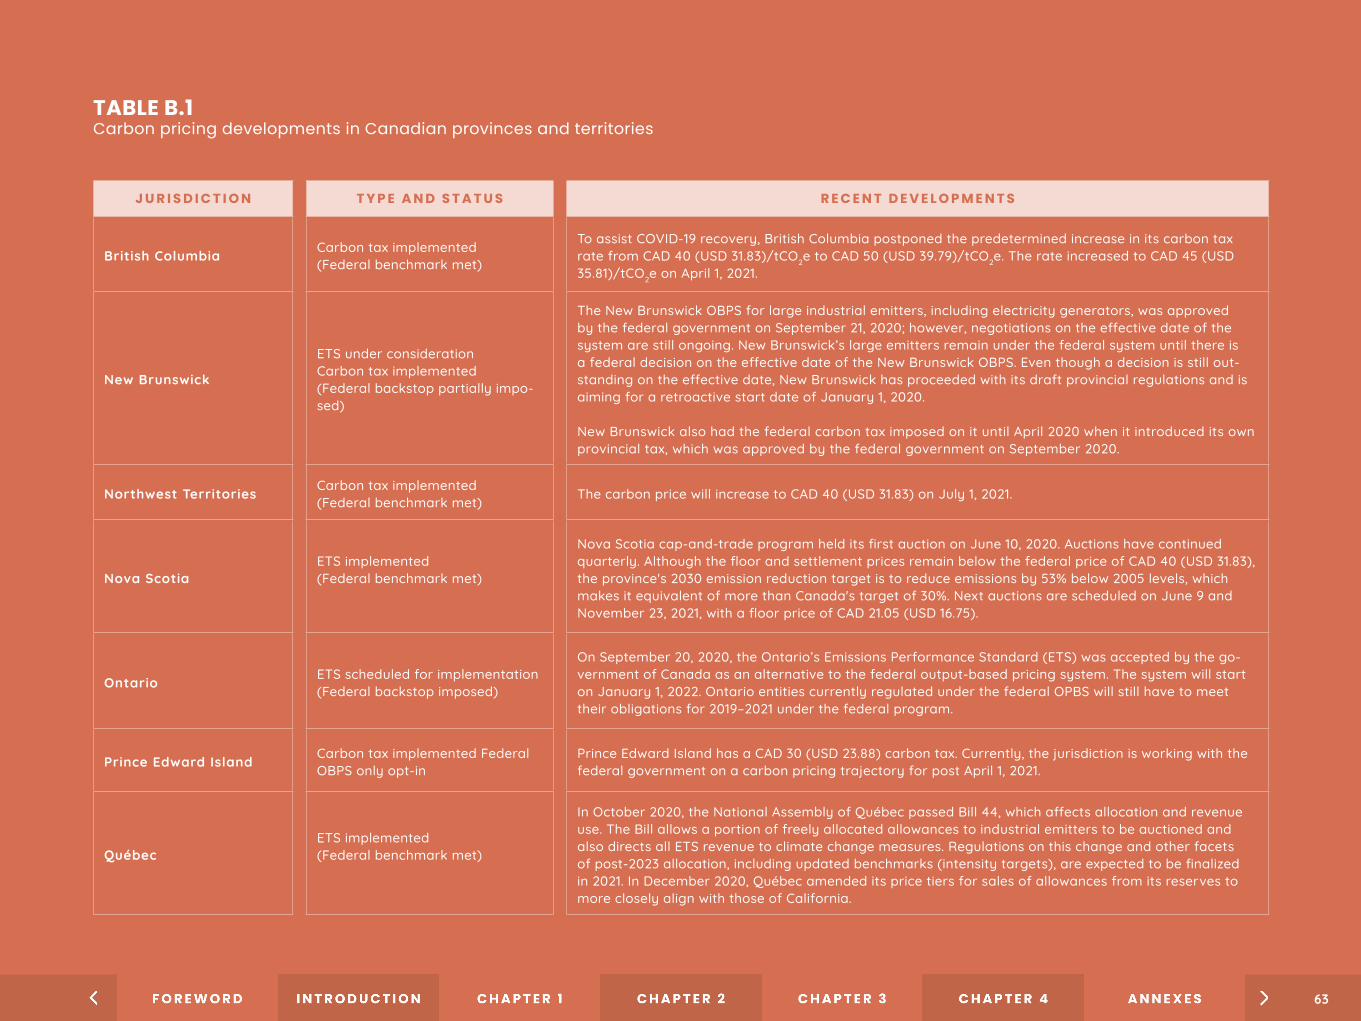
TABLE B.1Carbon pricing developments in Canadian provinces and territories
J U R I S D I C T I O N T Y P E A N D S T A T U S R E C E N T D E V E L O P M E N T S
British Columbia Carbon tax implemented(Federal benchmark met)
To assist COVID-19 recovery, British Columbia postponed the predetermined increase in its carbon tax rate from CAD 40 (USD 31.83)/tCO2e to CAD 50 (USD 39.79)/tCO2e. The rate increased to CAD 45 (USD 35.81)/tCO2e on April 1, 2021.
New Brunswick
ETS under considerationCarbon tax implemented(Federal backstop partially impo-sed)
The New Brunswick OBPS for large industrial emitters, including electricity generators, was approved by the federal government on September 21, 2020; however, negotiations on the effective date of the system are still ongoing. New Brunswick’s large emitters remain under the federal system until there is a federal decision on the effective date of the New Brunswick OBPS. Even though a decision is still out-standing on the effective date, New Brunswick has proceeded with its draft provincial regulations and is aiming for a retroactive start date of January 1, 2020.
New Brunswick also had the federal carbon tax imposed on it until April 2020 when it introduced its own provincial tax, which was approved by the federal government on September 2020.
Northwest Territories Carbon tax implemented(Federal benchmark met) The carbon price will increase to CAD 40 (USD 31.83) on July 1, 2021.
Nova ScotiaETS implemented(Federal benchmark met)
Nova Scotia cap-and-trade program held its first auction on June 10, 2020. Auctions have continued quarterly. Although the floor and settlement prices remain below the federal price of CAD 40 (USD 31.83), the province's 2030 emission reduction target is to reduce emissions by 53% below 2005 levels, which makes it equivalent of more than Canada's target of 30%. Next auctions are scheduled on June 9 and November 23, 2021, with a floor price of CAD 21.05 (USD 16.75).
Ontario ETS scheduled for implementation(Federal backstop imposed)
On September 20, 2020, the Ontario’s Emissions Performance Standard (ETS) was accepted by the go-vernment of Canada as an alternative to the federal output-based pricing system. The system will start on January 1, 2022. Ontario entities currently regulated under the federal OPBS will still have to meet their obligations for 2019–2021 under the federal program.
Prince Edward Island Carbon tax implemented Federal OBPS only opt-in
Prince Edward Island has a CAD 30 (USD 23.88) carbon tax. Currently, the jurisdiction is working with the federal government on a carbon pricing trajectory for post April 1, 2021.
QuébecETS implemented (Federal benchmark met)
In October 2020, the National Assembly of Québec passed Bill 44, which affects allocation and revenue use. The Bill allows a portion of freely allocated allowances to industrial emitters to be auctioned and also directs all ETS revenue to climate change measures. Regulations on this change and other facets of post-2023 allocation, including updated benchmarks (intensity targets), are expected to be finalized in 2021. In December 2020, Québec amended its price tiers for sales of allowances from its reserves to more closely align with those of California.
63
CHINAChina's national ETS came into effect on February 1, 2021, with compliance obligations for entities in the power sector emitting over 26,000 tCO2 annually from the 2013–2019 period. The compliance cycle started on January 1, 2021, and covers an estimated 2,225 entities, making it the world's largest ETS. The national market covers around 30% of national emissions or around 4,000 MtCO2.133 Entities regulated under the natio-nal system do not face compliance obligations under the pilot ETSs. More rules around the national ETS can be found in the National Measures for the Administration of Car-bon Emission Trading.
Allowances are allocated through four different types of carbon-intensity benchmarks, depending on power generation type and the benchmark value as outlined in the 2019–2020 National Carbon Emission Trading Cap Setting and Allowance Allocation Imple-mentation Plan (Power Generation Industry), though the legislation allows for a share of auctioning in the future. The four benchmarks for electricity production (tCO2/MWh) are set for conventional coal power plants (0.877 for entities above 300 MW and 0.979 for those below 300 MW), unconventional coal (1.146), and natural gas (0.392). The sum of the total allocated allowances of covered entities makes up the cap. Allowances will be distributed based on 70% of the entities' 2018 generation. The remainder will be allocated after entities have submitted verified 2019 and 2020 emissions data. Gas-fired plants will not initially face compliance obligations, while other plants are obligated to surrender allowances covering up to 20% of verified emissions above the level of free allocation they receive. An additional load correction factor can allocate more allowan-ces for plants running at 85% output or less. Up to 5% of entities' allowance obligations can be met with offsets from the China CCER mechanism. Work on the national ETS trading platform and the CO2 allowance registry is ongoing.
From 2013 to 2016, China launched eight subnational ETS pilots (see table B.2), which have continued to operate as the national ETS was implemented. These systems ope-rate in parallel with the national ETS. ETS pilots that already issued 2020 allowances (Beijing, Fujian, Guangdong, and Tianjin) would regulate entities from the power sector in their system for 2020 emissions, but for the other pilots, power sector entities would be covered by the national ETS. For 2021, China’s power sector will be regulated by the national ETS and not the pilot ETSs.
133 Note: the coverage of the national ETS only includes CO2, which is only a share of the GHG emissions in CO2-equivalence (i.e., how national emissions are measured).
For an update on China’s subnational pilot ETSs, see table B.2.
64

TABLE B.2 Developments in China’s subnational pilots
J U R I S D I C T I O N T Y P E A N D S T A T U S R E C E N T D E V E L O P M E N T S
Beijing Pilot ETS implemented
As Beijing allocated allowances for the power sector for 2019–2020 before the national ETS started, the power sector in Beijing will be covered by the pilot, not national, ETS. As Beijing allocated allowances for the power sector for 2019–2020 before the national ETS started, 2020 emissions in the power sector in Beijing will be covered by the pilot, not national, ETS.
Fujian Pilot ETS implementedThe 2020 allocation plan was released at the end of 2020 by the Fujian Provincial Department of Ecology and Environment. As Fujian allocated allowances for the power sector for 2019–2020 before the national ETS started, 2020 emissions in the power sector in Fujian will be covered by the pilot, not national, ETS.
Guangdong Pilot ETS implemented
Guangdong's 2020 allocation plan, released in December 2020, will distribute 438 million allowances and will hold 27 million units in reserves. This is the same number allocated in 2019, but since then, 23 addi-tional facilities have joined the pilot ETS. The power sector will receive 95% of their allowances for free, other sectors will get 97% for free, and the domestic aviation sector will get 100% free allocation. The share of allowances to be auctioned is capped at five million. Additionally, 2020 emissions from power sector entities will be covered by the pilot ETS as they had already issued allowances for 2020 before the national ETS had been launched.
Shanghai Pilot ETS implemented
On February 4, 2021, Shanghai released its 2020 allocation plan with a total of 105 million allowances (including reserves) for 314 entities. This is a cap reduction by more than a third as 20 coal-fired po-wer plants previously regulated by the pilot ETS will exit the market to be covered by the national ETS. Twenty-three entities from the shipping and industrial sectors will also now be covered by the pilot ETS. Entities with allocation based on historical emissions will get all their allowances at once, whereas tho-se receiving them based on benchmarks will get 80% now and the remainder after they submit verified emissions and production data for 2020 emissions.
Shenyang ETS under consideration
Shenyang is developing regulations for a pilot carbon market for around 500 participants that would start in 2022. Sector coverage is not yet defined, but it would target sectors not covered by the national ETS. Emissions targets would be set in line with carbon targets the Chinese national government sets on Liaoning province (of which Shenyang is the capital). Regulated entities can use China CCERs to meet their obligation, though the total limit has not been set. Guidelines are also being developed for local offset projects. The system is expected to launch in the second half of 2021.
Tianjin Pilot ETS implemented
At the end of 2020, Tianjin published the 2020 allocation plan for its pilot ETS, which will allocate allo-wances for free based on carbon intensity levels to the power sector at up to 98%–99.5% of their needs. Entities from steel, chemicals, petrochemicals, oil and gas, and the domestic aviation sector will get allowances up to 2% below their 2019 emissions. China CCERs can be used to meet 10% of entities' com-pliance obligations, though half must come from projects in the Beijing-Tianjin-Hebei region. Also, 2020 emissions from power sector entities will be covered by the pilot ETS as they had already issued allowan-ces for 2020 before the national ETS had been launched. The following year, those power sector entities will fall under the national ETS.
65
COLOMBIAThe Colombian government is assessing ETS design options and aims to complete a draft regulation for a national ETS, though no firm timeline has been set. An ETS pilot program may be launched by 2024.
DENMARKIn December 2019, the Danish government adopted national legislation (the Climate Act) to reduce GHG emissions by 70% by 2030 (compared to 1990 levels) and to move toward net-zero emissions by 2050. In December 2020, related to the Climate Act, the Danish government announced a Green Tax Reform to achieve Denmark's emissions reduction goal. The Reform did not include any provisions on the Danish carbon tax.
EUROPEAN UNIONIn 2021, the revised EU ETS Directive entered into force, outlining the policy framework for the fourth trading phase (2021–2030). Compared to the third phase, revisions in the fourth phase include: (i) strengthening the annual rate of the cap reduction from 1.74% to 2.2%; (ii) implementing the MSR (in operation since 2019); (iii) better targeting leakage and allocation rules; and (iv) establishing the Innovation Fund for innovative and breakthrough technologies and the Modernisation Fund to help Member States modernize their power sector. The 2021 cap for the EU ETS is set at 1572 MtCO2e for stationary installations, while the cap for emissions from the domestic aviation sector is 38 MtCO2e.
In 2020, the European Green Deal was also announced, including a proposal for the Eu-ropean Climate Law legislating a 2050 climate neutrality objective and a 2030 Climate Target Plan to reduce emissions by at least 55% by 2030. As part of the broader pack-age of legislation under the European Green Deal, there will be a revision of the EU ETS, with a proposal expected in June 2021 to align it with the more ambitious 2030 target. Possible options include extending sector coverage, for instance, to the maritime sector and possibly to the road transport and buildings, and mechanisms to address carbon leakage, such as through a carbon border adjustment mechanism. Concerning aviati-on, appropriate amendments will be proposed to the EU ETS to implement CORSIA in a way that is consistent with the EU’s 2030 climate objectives, and to increase the share of allowances auctioned under the system for aircraft operators to further contribute to reducing GHG emissions.
In September 2020, a provisional link was established between the EU ETS and Swiss ETS registries to allow for allowance transfers in line with the linking of the two systems on January 1, 2020. The previous year also marked the last year the United Kingdom participated in the EU ETS following its formal withdrawal from the EU. However, a link between the EU and U.K. ETS may be considered in the future.
GERMANYGermany successfully launched its national fuel ETS on January 1, 2021 at a fixed price of EUR 25, covering all fuel emissions not regulated under the EU ETS (mainly heating and road transport). These emissions stem from a variety of sources such as heating oil, natural gas, petrol, and diesel. Some fuels (e.g., coal, waste) will be phased in subse-quently in 2023.
In the next years, the fixed price will continuously rise to EUR 30 (USD 35.24) in 2022, EUR 35 (USD 41.11) in 2023, EUR 45 (USD 52.86) in 2024, and EUR 55 (USD 64.60) in 2025. In 2026, allowances will be auctioned within a price corridor that ranges between EUR 55 and EUR 65 (USD 64.60 and USD 76.35). From 2027 onward, allowance prices will be set by the market unless the government proposes a new price corridor in 2025. The cap is set based on Germany's mitigation targets for sectors not covered by the EU ETS as outlined in the EU Effort Sharing Regulation. Revenues are used for a variety of measures, in particular to support decarbonization, to lower electricity rates for con-sumers, and to deduct transport costs from income taxes for commuters.
ICELANDFollowing a 10% price increase in 2020, Iceland's carbon tax rates increased in tandem with the consumer price index in 2021 and reached ISK 4400 (USD 34.83)/tCO2e. The tax on imported fluorinated gases (F-gases; HFCs, PFCs, SF6, and NF3) that was enacted in 2020 was applied in full as of January 1, 2021. The rate on F-gases stands at ISK 2500 (USD 19.79)/tCO2e.
INDONESIAIn March 2021, Indonesia launched a trial ETS covering 80 coal power plants, which represent more than 75% of emissions from the power generation sector. The trial is scheduled to run until the end of August. Under the pilot, facilities will receive allowan-ces based on capacity benchmarks. Plants with a capacity of more than 400 MW face a 0.918 tCO2/MWh benchmark, while those with a capacity of 100–400MW are subject to a 1.013 tCO2/MWh benchmark. The trial builds on the mandatory GHG energy sector
66
reporting regulation from the Ministry of Energy and Mineral Resources passed in 2019 (22/2019) and regulation 46/2017, which mandated the development of an emissions/waste permit trading system before 2025. Detailed rules of the trial will be announced in the second quarter of 2021. A presidential regulation on general rules for carbon pricing is in development, which outlines general rules for carbon pricing and an obli-gation to develop a GHG emissions cap for main emitting sectors. This will support the development of a national ETS before 2025.
INTERNATIONAL MARITIME ORGANIZATIONAt the global level, the June 2021 meeting of the International Maritime Organization (IMO) is likely to see the first official negotiations — after their temporary suspension in 2011 — on the prospects of a market-based measure applied to international shipping. These negotiations will discuss, among others, a proposal for a USD 0.624/tCO2e fuel levy to raise funds for low-carbon research and development in international ship-ping134 and a proposal for a mandatory, universal GHG levy starting at USD 100/tCO2e that will be ratcheted up over time with revenue largely used to help climate-vulnera-ble countries.135 Other stakeholders, such as the major charterer Trafigura, advocate for a feebate plan based on a carbon levy of USD 250–300/tCO2e to make zero- and low-carbon bunker fuels economically viable.136 By now, some industry leaders have also for the first time embraced the concept of regional carbon pricing, such as fore-seen by the inclusion of shipping in the EU ETS if a global approach may not be possi-ble.137
IRELAND The Irish carbon tax rate for petrol and diesel increased from EUR 26 (USD 30.54)/tCO2 to EUR 33.50 (USD 39.35)/tCO2 in October 2020.138 The increase will be extended to all other fuels on which the tax is applied in May 2021. The new Irish government also
134 ICS et al. (2021). Proposed Draft Amendments to MARPOL Annex VI (Establishment of the International Maritime Research and Development Board and the IMO Maritime Research Fund). MEPC 76/7/7/.135 Marshall Islands and Solomon Islands. (2021). Proposal for IMO to Establish a Universal Mandatory Greenhouse Gas Levy.136 Trafigura. (2020). A Proposal for an IMO-led Global Shipping Industry Decarbonisation Programme. https://www.trafigura.com/brochure/a-proposal-for-an-imo-led-global-shipping-industry-decarbonisati-
on-programme137 Global Maritime Forum. (2020). Closing Plenary: A New Way Forward. https://www.globalmaritimeforum.org/virtual-high-level-meeting-2020/livestreams.138 Government of Ireland. (2021). The Use of Carbon Tax Funds 2021. http://www.budget.gov.ie/Budgets/2021/Documents/Budget/Carbon%20tax%20document.pdf.139 Programme for Government: Our Shared Future. https://www.gov.ie/en/publication/7e05d-programme-for-government-our-shared-future/.140 Ministry of the Environment. Subcommittee on the Use of Carbon Pricing. https://www.env.go.jp/council/06earth/yoshi06-19.html.141 Study available at https://www.meti.go.jp/shingikai/energy_environment/carbon_neutral_jitsugen/index.html.
agreed on a steeper trajectory for the carbon tax, increasing the target rate for 2030 from EUR 80 (USD 93.97)/tCO2 to EUR 100 (USD 117.46)/tCO2.139
JAPANJapan’s prime minister has asked two different ministries to develop and propose a carbon pricing mechanism that can contribute to growth. The Ministry of the Environ-ment resumed discussions at the Subcommittee on Utilization of Carbon Pricing on February 1, 2021, while the Ministry of Economy, Trade, and Industry started a carbon pricing study group in mid-February 2021.140,141
SaitamaIn April 2020, the Saitama ETS entered its third compliance period (FY2020–FY2024), which requires facilities to reduce emissions by 20% or 22% below baseline emissi-ons, depending on their category.
TokyoBased on the Tokyo Metropolitan Government's emission data from FY2018, during the second compliance period (FY2015–FY2019), the covered entities overachieved their emission reduction targets by 15%–17%. The third compliance period (FY2020–FY2024) commenced in April 2020. Covered facilities need to reduce emissions by 25% or 27% below base-year emissions, depending on their category. The third compliance period also encourages facilities to switch to cleaner electricity through incentives for low-carbon and renewable energy.
67
KAZAKHSTANAccording to the National Allocation Plan for 2021, Kazakhstan ETS entered Phase 4, setting a cap of 169.2 MtCO2 for the year 2021. In addition, allowances will now be distri-buted based on benchmarking instead of free allocation.
KOREA, REPUBLIC OFPhase 3 of the Korean ETS commenced in 2021 with an increase in the cap and inclu-sion of new sectors. The scope has been expanded to include construction companies and (large) transport companies, increasing covered entities from around 610 to 685. In turn, this equates to a 3.2% increase in the average annual cap, amounting to 609 mil-lion tCO2e during 2021–2025. With the inclusion of these new sectors, the system's co-verage of total emissions increased to 73.5%. In addition, the share of auctioning incre-ased from 3% in Phase 2 to 10% in Phase 3. In April 2020, the Emissions Trading Act was amended, allowing third parties such as financial firms and institutions to participate in the secondary market and trade allowances or converted carbon offset units on the Korean Exchange from Phase 3 onward. In March 2021, the government announced changes to ETS rules, including removing distinctions to domestic and internationally generated offsets. Previously, emitters could use up to 2.5% for international offsets, of the total 5% offsets for compliance. The new rules will allow emitters to use internatio-nal credits for the full 5% of eligible offset use to cover emissions from 2021 onward.
Finally, in line with the country’s 2050 net-zero announcement at the end of 2020, the government is developing a 2050 carbon neutral scenario that will be presented in June. Among others, this will also include changes to the ETS, for instance, adjusting the share of auctioning and increasing the use of benchmarking.
LATVIALatvia increased its carbon tax rate to EUR 12 (USD 14.1)/tCO2e in line with the reforms undertaken in 2019 in the Natural Resources Tax Law.
LUXEMBOURGOn January 1, 2021, Luxembourg started implementing its carbon tax at EUR 31.56 (USD 37.07)/tCO2 for petrol, EUR 34.16 (USD 40.12)/tCO2 for diesel, and EUR 20 (USD 23.49)/tCO2 for all other energy products except electricity. The rate is scheduled to increase according to the National Integrated Energy and Climate Plan 2021–2030 to EUR 25 (USD 29.37)/tCO2 in 2022 and EUR 30 (USD 35.24)/tCO2 in 2023 to keep Luxembourg on track with its climate targets. Luxembourg's carbon tax policy will complement the
EU ETS, which does not cover emissions from transportation, buildings, and shipping. The government expects revenue exceeding EUR 140 (USD 164.44) million in 2021 and EUR 180 (USD 211.43) million in 2022.
MEXICOMexico is implementing the pilot phase of the ETS. During this phase, allocation is 100% free and the regulation mentions the ETS to not impose “economic effects” on regula-ted entities, so there are no penalties or price for allowances. The first phase consists of a three-year period where the pilot ETS will test system design in 2020 and 2021, follo-wed by one year of transition in 2022 to the fully operational phase in 2023. The purpo-se of the pilot phase is to enhance the quality of emissions data and build capacity in emissions trading for covered entities. The input from this phase will be used to impro-ve the design of the ETS before it becomes fully operational. The operational phase is planned to commence in 2023. In 2020, Mexico developed its ETS Registry (Sistema de Seguimiento de Derechos de Emisión). As of early 2021, the first allowance allocation into accounts in the Registry is underway, after a small delay to the original deadline due to the impact of the COVID-19 pandemic. The 2021 cap is set to 273.1 MtCO2. Mexico also has a number of subnational carbon tax initiatives.
Baja CaliforniaThe Baja California carbon tax entered into force on May 1, 2020, replacing the tax on the first sale of gasoline and other derivatives of crude oil that was implemented earlier in the year. The Baja California carbon tax applies to the sale of gasoline, diesel, natural gas, and liquefied petroleum gas. Municipalities receive 20% of the re-venue, and the remainder goes to the state government, both levels of government should preferentially allocate the revenue to programs favoring the environment. On August 17, 2020, the federal government filed a Constitutional Controversy for its annulment before the Supreme Court of Justice of the Nation, based on the grounds that the tax invades the powers of the Congress of the Union on hydrocarbon taxa-tion.
JaliscoIn June 2020, the Mexican state of Jalisco announced its plan to implement a car-bon tax by 2021. The price rate and coverage are yet to be determined. Factoring in the economic impact of COVID-19 on each sector, most affected sectors (such as tourism, glass industry, and others that presented an important employment rate decrease) were excluded from the initial phase of the carbon tax that is current-
68
ly under consideration. Revenues would be used for climate change adaptation, mitigation, and promoting economic and industrial sustainability. The Ministry of the Environment and Territorial Development and the Ministry of Public Finance are working toward an emissions registry, which would be effective as of 2022. The car-bon tax initiative is currently evaluated by Jalisco´s congress.
TamaulipasIn July 2020, the Mexican state of Tamaulipas passed legislation enacting a car-bon tax as of 2021, equivalent to about MXN 260 (USD 12.72)/tCO2e. The carbon tax applies to fixed sources and facilities that emit more than 25 tCO2e of GHG monthly. Revenues will be used for mitigation and adaptation programs and activities.
ZacatecasIn January 2017, the Mexican state of Zacatecas enacted a carbon tax on emissions from production processes and industries as part of a broader fiscal reform, which included the introduction of various ecological taxes. The carbon tax rate was set at MXN 250 (USD 12.23)/tCO2e. The carbon tax applies to fixed sources and facilities. If regulated entities can prove an emissions reduction of at least 20% compared to the previous fiscal year, the tax level payable in the following fiscal year will be reduced by 20%. Revenues are used for different purposes, including social programs and the creation of climate change funds.
MONTENEGRO Montenegro adopted legislation on activities and installations for which a GHG permit should be issued (published in "Official Gazette of Montenegro," No. 08/20). According to the proposed framework, the Montenegro ETS will cover emissions from installation that would fall under the EU ETS. The allowance prices will equal the average price EU allowance price from the previous year. The decision is based on the need to gradually harmonize the national ETS with the EU ETS. In case of significant price changes within the EU ETS, a minimum price will be determined.
NETHERLANDSNetherlands Industry Carbon Tax Act (Wet CO₂-heffing industrie) entered into force on January 1, 2021, with a carbon tax rate of EUR 30 (USD 35.24)/tCO2e (including ETS price). The policy is one of the two initiatives related to national-level carbon pricing proposed under the National Climate Agreement presented by the Dutch government in June 2019.
The policy aims at safeguarding a reduction of industrial GHG emissions of 14.3 MCO2ein 2030. It is targeted at industrial installations subject to the EU ETS, such as waste incinerators and facilities emitting large amounts of nitrous oxide, that are not covered under the EU ETS. The measure will be applicable to 235 companies with 284 installations. This carbon tax comes on top of their compliance obligations in the EU ETS.
Industrial installations will have to pay the carbon tax if their emissions exceed their ba-seline based on EU ETS benchmarks and a national reduction factor needed to reach the emission target. Emissions below this baseline are exempted and are allocated dis-pensation rights. Installations can exchange dispensation rights over the past calendar year. Covered installations can also use a surplus of dispensation rights to compensate for a shortage of dispensation rights in the past and thus get a refund of previously paid tax (up to five years earlier).
NEW ZEALANDIn June 2020, the Climate Change Response (Emissions Trading Reform) Amendment Act was passed, putting in place a wide range of reforms to the NZ ETS. The legislati-on imposes a cap of 160 MtCO2e on the NZ ETS for 2021–2025, though a limit is not set on allowances from emissions removals, including from forestry. The Act also outlines a provisional emissions budget for New Zealand of 354 MtCO2e for that same period. Both the budget and cap are in line with New Zealand's 2050 target. The cap for the ETS is set five years in advance and is annually updated on a rolling basis. It also de-termines the share of allowances to be auctioned each year.
The total auctioning volume is 90 million MtCO2e, with quarterly auctions scheduled for 2021. Twenty-six million NZUs are available for auction this year (including the 7 million NZUs held in the cost containment reserve). An auction minimum price of NZD 20 (USD 13.96) is set for 2021 and increases by 2% annually. New Zealand has also established a cost containment reserve, which has a trigger price of NZD 50 (USD 34.91) and rises by 2% annually. The Climate Change Response (Auction Price) Amendment Act 2021 establishes a confidential reserve price at auction. A new price will be calculated ahead of each auction based on a methodology established by the Climate Change Minister. If the auction's clearing price falls below the confidential reserve price, the auction would fail, resulting in the sale of no allowances. The purpose of the confidential reserve price is to prevent auction sales at prices significantly below the secondary market. More information on auctioning can be found in the Climate Change (Auctions, Limits, and
69
Price Controls for Units) Regulations 2020. No decision has been made on whether the proceeds generated through NZ ETS auctions will be earmarked for a particular pur-pose. The government is looking at options for how the proceeds could be used and is expected to report back to the cabinet in 2021.
The government is considering the use of international offset credits but a limit of zero has currently been set for their use during 2021–2025. The rate of free industrial alloca-tion is also set to reduce by 1% each year from 2021, 2% from 2031, and 3% from 2041. This applies to both moderately and highly emissions-intensive activities. Finally, an au-tomatic surrender and repayment penalty will apply if entities have not surrendered or repaid units by the due date, except for small foresters, who are exempt until 2023. The penalty is set at three times the current market price. A number of low-level infringe-ment offences have also been introduced to improve compliance. New Zealand is also working on imposing a carbon price on biogenic emissions from agriculture at the farm level from 2025. A multistakeholder initiative to move this forward will be reviewed by the Climate Change Commission in 2022. If there is no progress, the Act outlines pro-visions to include agricultural emissions under the NZ ETS at the processor level. New Zealand is also working on revising its NDC following advice from the Climate Change Commission to increase ambition.
NORWAYFrom January 1, 2021, the CO2 tax on mineral products and the tax on HFCs and PFCs was increased by 5% in real terms, and the CO2 tax on emissions in the petroleum acti-vities was increased by 7% in real terms.
PAKISTANPakistan is considering market-based carbon pricing instruments, including an emissi-on trading plan. In December 2019, Pakistan launched the National Committee on the Establishment of Carbon Markets, which is tasked with assessing the role and scope of carbon markets in delivering Pakistan’s NDC and identifying opportunities for and chal-lenges to improving emissions data. Currently, provisions are being drafted for domes-tic carbon pricing instruments under Article 6, and work is underway on preparing MRV regulations for an ETS.
142 For more, see https://www.propisi.net/zakon-o-klimatskim-promenama/.
SAKHALINA draft federal law for implementing an ETS in Sakhalin Oblast was approved by the Ministry of Economic Development of Russia in January 2021. The draft roadmap still requires approval from the lower house of Parliament (the Duma), likely in June–July 2021. Sakhalin is working on an emissions inventory (by August 2021), as well as a registry and trading platform (by April 2022). Sector coverage for the pilot is still unknown. The draft roadmap states that trading could begin as early as July 2022. However, it is unclear whether this is in reference to the pilot ETS or units from climate projects, which will also be developed between September 2021 and February 2023.
SERBIASerbia adopted the Law on Climate Change142 on March 18, 2021, and its system of MRV for GHG emissions entered into force. The government will have one year to establish the appropriate MRV by-laws. The MRV requirements, which are based on the EU ETS, are a prerequisite for Serbia’s EU accession. However, no further decisions on carbon pricing have been taken by the government.
SWITZERLANDThe revised Ordinance on the Reduction of CO2 Emissions (CO2 Ordinance), the imple-menting legislation of Switzerland’s key climate instruments, was adopted in Novem-ber 2020. The partially revised CO2 Act — the core framework of Switzerland’s climate legislation — entered into force in January 2021. In September 2020, the Swiss Parlia-ment adopted the legal framework for Swiss Climate Policy 2030, which sets out a 50% emissions reduction target and has reinforced measures for the transport, building, and industry sectors. The updates will be a part of the fully revised CO2 Act, which is plan-ned to enter into force by 2022, following a referendum in Q3 2021.
The revised CO2 Act that entered into force in January 2021 provides a new legal basis for the Swiss ETS. In addition, the revised Ordinance on the Reduction of CO2 Emissions brought new provisions that aligned the Swiss ETS with the Phase 4 changes of the EU ETS. In September 2020, a provisional link was established between the EU ETS and Swiss ETS registries to allow for allowance transfers in line with the linking of the two systems on January 1, 2020.
70

THAILANDIn 2020, MRV and sector-specific guidelines were developed for the following sectors: beverage and sugar, textiles, and flat glass. In 2021, the Thailand Greenhouse Gas Or-ganization — in collaboration with its partner, the Eastern Economic Corridor Initiative (Department of Industrial Promotion, Industrial Estate Authority of Thailand) — is deve-loping a strategic plan for ETS implementation in Thailand’s Eastern Economic Corridor region. Under this plan, a pilot ETS will be implemented, including key ETS features and a trading platform.
TURKEYIn December 2020, Turkey published the final draft legal and institutional framework for a pilot ETS. In addition, technical workshops held throughout 2020 helped the government identify an emissions cap and develop a national allocation plan and a transaction registry for a pilot ETS and an ETS simulation (Turk-SIM). On February 17, 2021, the Minister for Environment and Urbanization announced the implementation of a national ETS but a possible start date, including for a pilot ETS, is unclear.
UNITED KINGDOMThe U.K. ETS started operating on January 1, 2021, as the United Kingdom officially departed from the EU and the EU ETS in December 31, 2020. The design features of the U.K. ETS are very similar to those of the EU ETS Phase 4. However, the U.K. ETS has a tighter emissions cap (5% lower than the EU ETS cap), which will be annually reduced by 4.2Mt. The United Kingdom plans to revise its cap no later than 2024, in line with a net zero-consistent target trajectory. The U.K. ETS design also has a Cost Containment Mechanism, which aims to mitigate against sustained extreme price spikes. The mecha-nism comes into effect based on set time and allowance price triggers. For the first two years, these are set at lower levels than in the EU ETS. There will be further public en-gagement on a Supply Adjustment Mechanisms, which could offer another mechanism to address volatility. A minimum auction reserve price of GBP 22 (USD 30.31)/tCO2e is also in effect. The ETS will be reviewed in 2023 and the U.K. government has also indi-cated its openness to linking to other plans internationally in the future.
In addition to the U.K.'s new ETS following Brexit, the United Kingdom's power sector will continue to participate in the Carbon Price Support with the minimum carbon price of GBP 18 (USD 24.80)/tCO2e in 2021. The price has remained at this level since 2018.
The tax will stay in place at least until unabated coal-fired power generation is phased out. The U.K. government has committed to end the use of unabated coal by 2024.
UNITED STATESMost carbon pricing developments in the United States are taking place on the subna-tional level. These include California, Hawaii, Massachusetts, Oregon, Pennsylvania, the RGGI, the Transportation and Climate Initiative Program, and Washington.
CaliforniaIn California, changes to California's Cap-and-Trade Program that were required by Assembly Bill 398 (Chapter 135, Statutes of 2017) took effect on January 1, 2021. The major changes to the program are (i) establishment of a price ceiling, (ii) changing from a three-tier allowance price containment reserve to a two-tier reserve below the price ceiling, and (iii) reductions in the use of offset credits, especially for those generated from projects that do not provide "direct environmental benefits in the state."
Under the upcoming 2022 Scoping Plan update, the CARB will be assessing suite of climate policies to chart the course to achieving carbon neutrality by 2045. As part of this update, CARB may identify additional opportunities to further strengthen the Cap-and-Trade Program to ensure it continues its role to help the state meet its GHG reduction targets.
In 2019, the U.S. Department of Justice challenged the constitutionality of Cali-fornia's market linkage with Québec based on alleged violations of constitutional precepts, the most important being the Foreign Affairs Doctrine. In a July 17, 2020, decision, the U.S. District Court for the Central District of California ruled in favor of California, which affirmed the constitutionality of the program's linkage with Qué-bec.
HawaiiClimate change policies for Hawaii are being coordinated under the state’s Clima-te Change Mitigation and Adaptation Commission as mandated by Act 32, Session Laws of Hawaii 2017. One option, among others, that is being considered is carbon pricing. Carbon tax bills have been introduced in the 2020 and 2021 sessions; ho-
71

wever, they have not passed to date. The State Energy Office, a member of the Commission, released a carbon tax study143 in February 2021. The report modeled different policy packages to assess impact on emissions and considered revenue recycling options to address the distributional impacts of a carbon price.
MassachusettsIn 2020, Massachusetts Limits on Emissions from Electricity Generators system reduced the share of allowances distributed through free allocation from 75% to 50%. The remainder, after an adjustment to account for banked allowances, were distributed via auctions. The system will increase to full auctioning by 2021. In 2021, Massachusetts finalized a new climate program establishing climate targets for 2030. The Massachusetts ETS may be revised to align with these targets.
OregonIn line with the Executive Order on Climate Action (Executive Order 20-04), the De-partment of Environmental Quality of Oregon submitted a report in June 2020, both of which focused on program options to cap and reduce emissions. However, the details of the program have not yet been determined, and it is not clear whether the program will be a baseline-and-credit or a cap-and-trade system.
PennsylvaniaPennsylvania's Department of Environmental Protection released an update of its earlier proposal in April 2020 for a power sector ETS covering CO2 emissions. The proposed regulation is largely consistent with the system design features of the RGGI Model Rule. A final proposal is expected in 2021, with 2022 as the earliest start date for Pennsylvania's ETS to join RGGI. It is estimated that Pennsylvania's power sector will emit approximately 40% of emissions covered under RGGI when the state becomes a part of the program. Pennsylvania’s inclusion would significantly incre-ase the size of RGGI’s carbon market.
Regional Greenhouse Gas Initiative Virginia began participating in RGGI as of January 1, 2021 after the final legislation for establishing an ETS and participating in RGGI was adopted in February 2020. On February 2, 2021, RGGI states144 also announced a plan for a third program review.
143 Hawaii State Energy Office. (2021). Hawaii Carbon Pricing Study. https://energy.hawaii.gov/carbon-pricing-study.144 Jurisdictions covered under RGGI: Connecticut, Delaware, Maine, Maryland, Massachusetts, New Hampshire, New Jersey, New York, Rhode Island, Vermont, and Virginia.
Transportation and Climate Initiative ProgramThe final Memorandum of Understanding (MoU) for the TCI-P was released in December 2020 by the participating jurisdictions. As of February 2021, Connecticut, Massachusetts, Rhode Island, and Washington, D.C. signed the MoU and announced their participation in the program, which aims to start its first compliance period in 2023. Eight additional jurisdictions are helping to develop a model rule that could eventually be implemented within their jurisdiction if they join the program at a later date. The program is based on the successful RGGI program, except that transpor-tation fuel suppliers are regulated instead of electric power plants.
On March 1, 2021, the Draft Model Rule was released, which outlines a common framework for participating jurisdictions to use in developing their own TCI-P re-gulations. The Program puts a cap on CO2 emissions from gasoline and on-road diesel fuel that gradually decreases over time to achieve a projected 26% reduction in TCI-P's 2022 CO2 emissions by 2032. Each jurisdiction has an annual allowance budget from 2023 to 2032 specified in the MoU. Allowances will be auctioned quar-terly, and the equity investment commitment of the program requires participating jurisdictions to invest no less than 35% of the proceeds to ensure overburdened and underserved communities benefit equitably from clean transportation projects and programs. The Commitment will be reviewed annually by an equity advisory board.
The emissions and fuel shipment data reporting under TCI-P will start on January 1, 2022, with surrender requirements applicable to emissions that occur starting on January 1, 2023. This will also be the beginning of the first control period, which will continue until December 31, 2025. The fuel suppliers in each jurisdiction will surren-der their allowances after each 3-year compliance period. In terms of the interim compliance provisions, each year fuel suppliers must hold allowances equal to at least 50% of their annual emissions. Banking is also allowed, without any quanti-tative restrictions, and allowances do not expire. The Draft Model Rule is currently open for inputs from organizations and individuals as part of the public engage-ment process of the Program. Once completed, the Model Rule will be adapted for use by each TCI-P jurisdiction in their own rulemaking processes.
72

Details for three stability mechanisms are also outlined: Cost Containment Reserve (CCR), Emissions Containment Reserve (ECR) and reserve price. CCR allowances, which might be equal up to 10% of the annual allowance budget, will be offered in auctions by the regulatory agency to contain the cost of CO2 allowances if allowance prices reach the CCR trigger price. The trigger price starts at USD 12 in 2023 and increases up to USD 30.16 in 2032. The ECR may withhold up to 10% of the annual allowance budget from auctions in case the allowance price at auction falls below the ECR trigger price (USD 6.50 in 2023, increasing to USD 12.30 in 2032). Finally, a reserve price at auctions is set at USD 2.50 in 2023, increasing by 1.025 times the minimum reserve price of the previous year.
The Program gives jurisdictions the option of allowing carbon credits for three project types, targeting landfill methane capture, carbon sequestration through forestry, and avoided methane emissions from agriculture, making all of them eligible for CO2 offset allowances. Offset projects must be located in TCI-P jurisdictions or any U.S. jurisdiction that has a MoU with the TCI-P participating jurisdictions.
WASHINGTONThe implementation of Washington's baseline-and-credit system (the Clean Air Rule) was suspended a year after it began due to legal challenges. In January 2020, the Washington Supreme Court ruled that the Department of Ecology could regulate direct sources of emissions (in this case, stationary sources of emissions) but not indirect sources (petroleum producers, exporters, and natural gas distributors). In December 2020, Governor Inslee introduced the Climate Commitment Act for the 2021 legislative session. This proposes an economy-wide ETS for the state's largest emitters based on the Western Climate Initiative's design.
UKRAINEThe Minister of Environmental Protection and Natural Resources in January 2021 con-firmed plans for Ukraine to introduce its own ETS from 2025 to comply with the EU's Carbon Border Adjustment Mechanism measures and work toward emissions reduction objective for 2030 and a timeframe to reach carbon neutrality as part of its second NDC. The country developed the main elements of a national MRV system to provide a
145 Law of Ukraine. On the Principles of Monitoring, Reporting and Verification of Greenhouse Gas Emissions. https://zakon.rada.gov.ua/laws/show/377-20.
basis for the planned ETS. The related MRV law145 was adopted in 2019, which entered into force in 2020 and applies to installations as of January 1, 2021. By March 31, 2022, covered entities are required to submit the first monitoring reports for 2021.
VIETNAMIn November 2020, the Vietnam National Assembly passed the revised Law on En-vironmental Protection, which establishes a legal basis for the Ministry of Finance and Ministry of Natural Resources and the Environment, to organize and develop a carbon market. This includes cap setting and allocation. The legislation also makes referen-ce to domestic and international credits. Specific design details are to be developed during 2021–2025 with a pilot system starting by 2025 and becoming fully operation by 2027.
73
A N N E X C
CREDITING MECHANISMS AND ARTICLE 6 PILOT ACTIVITIES
74
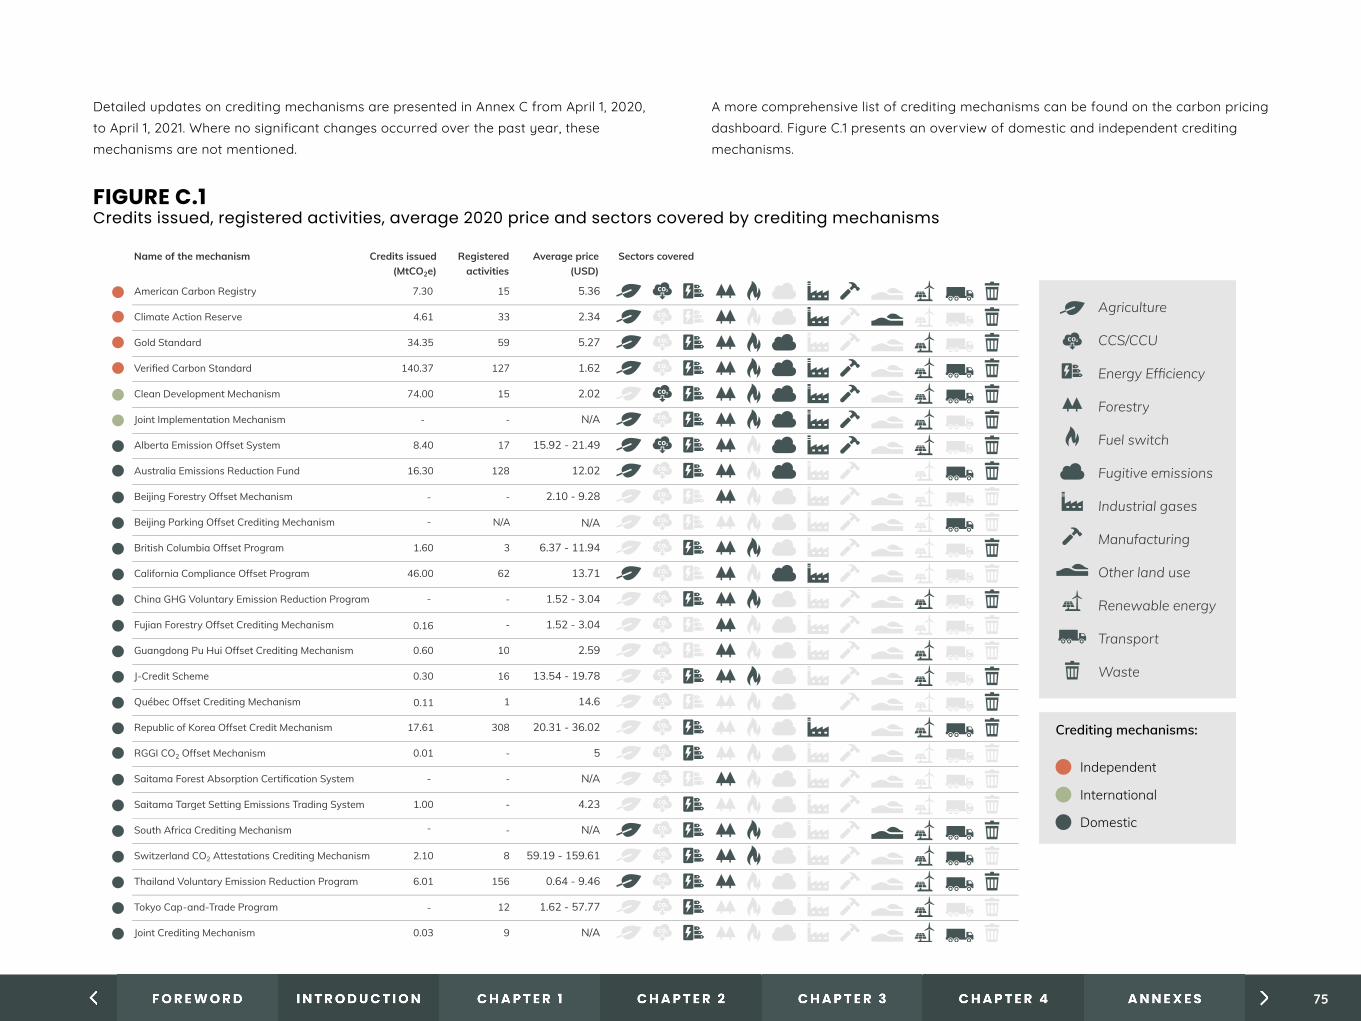
Detailed updates on crediting mechanisms are presented in Annex C from April 1, 2020, to April 1, 2021. Where no significant changes occurred over the past year, these mechanisms are not mentioned.
A more comprehensive list of crediting mechanisms can be found on the carbon pricing dashboard. Figure C.1 presents an overview of domestic and independent crediting mechanisms.
FIGURE C.1Credits issued, registered activities, average 2020 price and sectors covered by crediting mechanisms
Name of the mechanism Credits issued(MtCO2e)
Registered activities
Average price(USD)
Sectors covered
American Carbon Registry 7.30 15 5.36
Climate Action Reserve 33 2.34
Gold Standard 59 5.27
Verified Carbon Standard 127 1.62
Clean Development Mechanism 15 2.02
Joint Implementation Mechanism - N/A
Alberta Emission Offset System 17 15.92 - 21.49
Australia Emissions Reduction Fund 128 12.02
Be�ing Forestry Offset Mechanism -
Be�ing Parking Offset Crediting Mechanism N/A N/A
British Columbia Offset Program 3 6.37 - 11.94
California Compliance Offset Program 62 13.71
China GHG Voluntary Emission Reduction Program - 1.52 - 3.04
Fujian Forestry Offset Crediting Mechanism - 1.52 - 3.04
Guangdong Pu Hui Offset Crediting Mechanism 10 2.59
J-Credit Scheme 16 13.54 - 19.78
Québec Offset Crediting Mechanism 1 14.6
Republic of Korea Offset Credit Mechanism 308 20.31 - 36.02
RGGI CO2 Offset Mechanism - 5
Saitama Forest Absorption Certification System - N/A
Saitama Target Setting Emissions Trading System - 4.23
South Africa Crediting Mechanism - N/A
Switzerland CO2 Attestations Crediting Mechanism 8 59.19 - 159.61
Thailand Voluntary Emission Reduction Program 156 0.64 - 9.46
Tokyo Cap-and-Trade Program 12 1.62 - 57.77
Joint Crediting Mechanism 9 N/A
Agriculture
CCS/CCU
Energy Efficiency
Forestry
Fuel switch
Fugitive emissions
Industrial gases
Manufacturing
Other land use
Renewable energy
Transport
Waste
4.61
34.35
140.37
74.00
-
-
-
-
-
-
-
8.40
16.30
1.60
46.00
0.60
0.30
17.61
0.01
1.00
2.10
6.01
0.03
0.16
0.11
2.10 - 9.28
Crediting mechanisms:
International
Independent
Domestic
75

C . 1 M E C H A N I S M S C R E A T E D B Y R E G I O N A L , N A T I O N A L , O R S U B N A T I O N A L G O V E R N M E N T S
For more comprehensive information on domestic crediting mechanisms, see the Car-bon Pricing Dashboard.
ALBERTA EMISSION OFFSET SYSTEMThe Canadian Federal Government recognized the Alberta and British Columbia's offset programs as source of credits for the federal OBPS program in August 2020.
BRITISH COLUMBIA OFFSET PROGRAMThe Canadian Federal Government recognized British Columbia's offset programs as sources of credits for the federal OBPS program in August 2020.
CALIFORNIA COMPLIANCE OFFSET PROGRAMAB 398 required CARB to appoint an independent Compliance Offsets Protocol Task Force to provide guidance to CARB in establishing new offset protocols for the Cap-and-Trade Program with direct environmental benefits in the state while prioritizing disadvantaged communities, Native American or tribal lands, and rural and agricultural regions. The Task Force met throughout 2020 and transmitted its final recommendations to CARB on March 2, 2021.146
CANADA FEDERAL GHG OFFSET SYSTEMProposed regulations for the Federal GHG Offset System were published on March 6, 2021, in Canada Gazette Part 1, for public comment.147 The Canadian federal gover-nment is developing offset protocols for advanced refrigeration systems, improved forest management, landfill methane management and enhanced soil organic carbon.
CHINA GHG VOLUNTARY EMISSION REDUCTION PROGRAMOn March 24, 2021, the Beijing Municipal Government officially announced the construc-tion of China GHG Voluntary Emission Reduction Program management and trading center.
146 More information on the Task Force, including its Final Recommendations Report, is available at Compliance Offset Protocol Task Force | California Air Resources Board. 147 Government of Canada. (March 6, 2021). Canada Gazette, Part I, Volume 155, Number 10: Greenhouse Gas Offset Credit System Regulations. https://canadagazette.gc.ca/rp-pr/p1/2021/2021-03-06/html/reg1-
eng.html.148 Saskatchewan. Offset Program Discussion Paper – Engagement Summary Report. https://publications.saskatchewan.ca/#/products/102402.
CHONGQING CREDITING MECHANISMChongqing already has a local offset mechanism, but the specific rules for linking with the carbon market have not yet been issued.
KAZAKHSTAN CREDITING MECHANISM Kazakhstan has a domestic crediting mechanism in place that allows emitters to offset a share of their emissions through domestic projects. Quota units are credited to ac-counts in the registry for further trading in the ETS. Most projects are in the renewable energy and energy efficiency sector. Additional supporting policies and regulations on processes such as stronger crediting methodologies of forest absorption projects are still in development.
MEXICO CREDITING MECHANISMThe Mexican government is working on the design and development of a registry for mitigation projects, which will cover offsets for ETS compliance.
QUÉBEC OFFSET CREDIT COMPONENT OF THE CAP-AND-TRADEA public consultation is taking place, from March 3 to April 17, 2021, to reform the offset regulatory format, including the revision of two current offset protocols. A protocol for afforestation and reforestation projects is expected to be completed in 2021. The Québec government is also assessing other project types for new protocols, including biomethanation or composting organic waste, fuel substitution in the marine transport sector, conversion of refrigeration systems, and improving agricultural fertilization ap-plication practices.
RGGI CO2 OFFSET MECHANISMAs part of the RGGI third program review, which is scheduled for late summer 2021, the RGGI CO2 Offset Mechanism will also be reviewed.
SASKATCHEWAN GHG OFFSET PROGRAMThe Saskatchewan GHG Offset Program was expected to be implemented in 2020 according to the government of Saskatchewan’s “Engagement Summary Report.”148 On
76
August 28, 2020, the government of Saskatchewan announced that there will be a de-lay in the implementation of the program to 2022 due to the extraordinary circumstan-ces caused by the COVID-19 pandemic. The program is currently undertaking stakehol-der engagement in the process of preparing standards and guidance documents that are scheduled to be published in Fall 2021.
SOUTH AFRICA CREDITING MECHANISMSouth Africa established a crediting registry (the Carbon Offset Administration System), launched in July 2020, that is a platform for entities under the carbon tax to surrender credits to comply with part of their tax obligations.
SPAIN FES-CO2 PROGRAMAt the end of 2020, the Law 2/2011 governing the FES-CO2 was amended to broaden the objective and scope of the Fund, with the aim of promoting adaptation and sinks removal activities, as well as adding some new mitigation activities to the existing typo-logies to support industrial and energy innovation projects in Spain. Finally, acquisition of credits coming from activities carried out within the framework of the UNFCCC and its Paris Agreement will be fully operational from 2022 onward.
TAIWAN, CHINA GHG OFFSET MANAGEMENT PROGRAMThe plan aims to encourage voluntary emission reduction for entities through imple-menting GHG offset projects that use methodologies developed either by the CDM Executive Board or the Taiwan Environmental Protection Agency, depending on the type of project. Registration and crediting processes are similar to CDM. The committee will work with Taiwan’s EPA to coordinate project registration, methodology application, and credit issuance.
THAILAND VOLUNTARY EMISSION REDUCTION PROGRAMSince 2013, the Thailand Greenhouse Gas Management Organization has developed a voluntary domestic GHG crediting mechanism called the Thailand Voluntary Emission
149 PRESS RELEASE: Gold Standard seeks input on plans to align voluntary carbon market with Paris Agreement and ensure integrity as market seeks to scale. February 2021. https://www.goldstandard.org/blog-item/press-release-gold-standard-seeks-input-plans-align-voluntary-carbon-market-paris
150 For example, projects in least developed countries issuing credits will be eligible for offset claims, whereas developed countries will only be eligible for financing claims if a corresponding adjustment takes place. Find more at Integrity for Scale: Aligning Gold Standard-Certified Projects with the Paris Agreement. (2021). https://www.goldstandard.org/sites/default/files/documents/integrity_for_scale_aligning_gs_cer-tified_projects_with_the_paris_agreement.pdf.
Reduction Program (T-VER). T-VER aims to encourage the public and private sector to reduce GHG emissions while enhancing sustainable development. Currently, the credits from T-VER are applied domestically. However, the Thailand Greenhouse Gas Management Organization continues to consider potential and possible international transactions with the intention to assess and explore potential areas of improvement to ensure comparability with the guidance and rules, modalities and procedures of Article 6, eligibility criteria under CORSIA, and other relevant mechanisms.
C . 2 M E C H A N I S M S C R E A T E D B Y I N D E P E N D E N T S T A N D A R D S
GOLD STANDARDGold Standard has published two consultation processes that seek to inform its position on how the integrity, continuity, and credibility of voluntary carbon credits in the post-2020 period for the Paris Agreement can be ensured. Both documents describe specific rule changes, including procedures for corresponding adjustments to avoid “double claiming,” and suggest alternative roads for financing emission reductions through broader private sector financial flows.149 The main proposals discussed are as follows: 1. Corresponding adjustments will be in place when credits are issued to be eligible for
voluntary offsetting claims, starting with developed countries where more capacity exists.
2. Promotion of credible corporate claims and mechanisms for financing emission reductions and removals will be enacted.
3. The registry will allow identification between the different eligibility claims.150
4. It envisions other changes to be implemented under the adoption of Article 6 rules, as baseline setting and other requirements for project developers.
The consultation process closed in April 2021. Further rules and new requirements will
77
follow, in part informed by the feedback received from this process.
VERIFIED CARBON STANDARD Verra is proposing a new “Article 6” label to its Verified Carbon Units used for com-pliance markets that require corresponding adjustments. Under this proposal, buyers could be able to choose Article 6- compliant units (or other labels as CORSIA) or Verified Carbon Units that don't require corresponding adjustments, depending on the claim they want to make. 151
C . 3 M E C H A N I S M S C R E A T E D U N D E R I N T E R N A T I O N A L L A W
CLEAN DEVELOPMENT MECHANISM Given the postponement of COP26 as a result of COVID-19, no guidance was received from the Parties of the Paris Agreement as to whether — and under what conditions — the CDM can transition beyond 2020. As the Kyoto Protocol’s send period ended on De-cember 31, 2020, the CDM Executive Board met in December 2020 and agreed on tem-porary measures to maintain the CDM into 2021. As part of these provisional measures, the CDM decided that project registration and crediting period renewal starting on or after January 1, 2021, will continue to be processed by the existing rules. The issuance of post-2020 credits will remain provisional until Parties make a final decision on the CDM post-2020 future. As this represents a risk to project developers and coordinating entities, the Board will not charge upfront fees.152
151 Verra. (August 2020). Public Consultation – Proposal for Scaling Voluntary Carbon Markets and Avoiding Double Counting Post-2020. https://verra.org/project/vcs-program/public-consultation-propo-sal-for-scaling-voluntary-carbon-markets-and-avoiding-double-counting-post-2020/.
152 UNFCCC. (2020). The CDM Executive Board Agrees on Temporary Measures to Address COP26 Postponement. Announcement on December 16, 2020. https://unfccc.int/news/the-cdm-executive-board-agrees-on-temporary-measures-to-address-cop26-postponement.
153 Refinitiv. (August 2020). CORSIA’s Baseline Change and Implications for Offset Demand. https://www.greenaironline.com/photos/Refinitiv_CORSIA_new_baseline_report_Aug_2020.pdf154 ICAO. (February 2021). CORSIA Newsletter. https://www.icao.int/environmental-protection/CORSIA/Pages/corsia-newsletter-feb21.aspx155 Air Transport Action Group. (2019). Facts and Figures. September 2020. https://www.atag.org/facts-figures.html.156 International Civil Aviation Organization. (November 2020). CORSIA Eligible Emission Units. https://www.icao.int/environmental-protection/CORSIA/Documents/TAB/TAB%202020/ICAO_Doc_CORSIA_Eligi-
ble_Emissions_Units_November_2020.pdf.
CORSIA In June 2020, the ICAO Council set 2019 as CORSIA’s baseline for the mechanism’s pilot phase (2021–2023) — previously the plan required emissions to be offset above a 2019–2020 baseline. ICAO's 36-member Council is also considering making the change permanent through 2035, which could slash offset demand under CORSIA from 3 Gt-CO2e to 500 MtCO2e.153 This will be decided at the ICAO 2022 general assembly meeting. As of February 2021, 88 states representing 537 MtCO2
154 (approximately 60% of global air travel155) have signed up for CORSIA’s pilot phase. China, India, Russia, and Brazil are key exceptions. At the end of last year, the architecture of REDD+ transactions was added as the seventh eligible standard.156 This approval of standards has stimulated the creation of standardized contracts for CORSIA-eligible credits, like CBL’s Global Emission Offset, S&P Global Platts’ CORSIA-eligible credit, and AirCarbon CORSIA-Eligi-ble Tokens.
C . 3 . 1 A R T I C L E 6 C R E D I T I N G P I L O T A C T I V I T I E S
This section provides updates of initiatives aimed at generating ITMOs under Article 6. An overview of all initiatives covered are in table C.1 (next page), followed by key deve-lopments over the past year presented in alphabetical order.
78
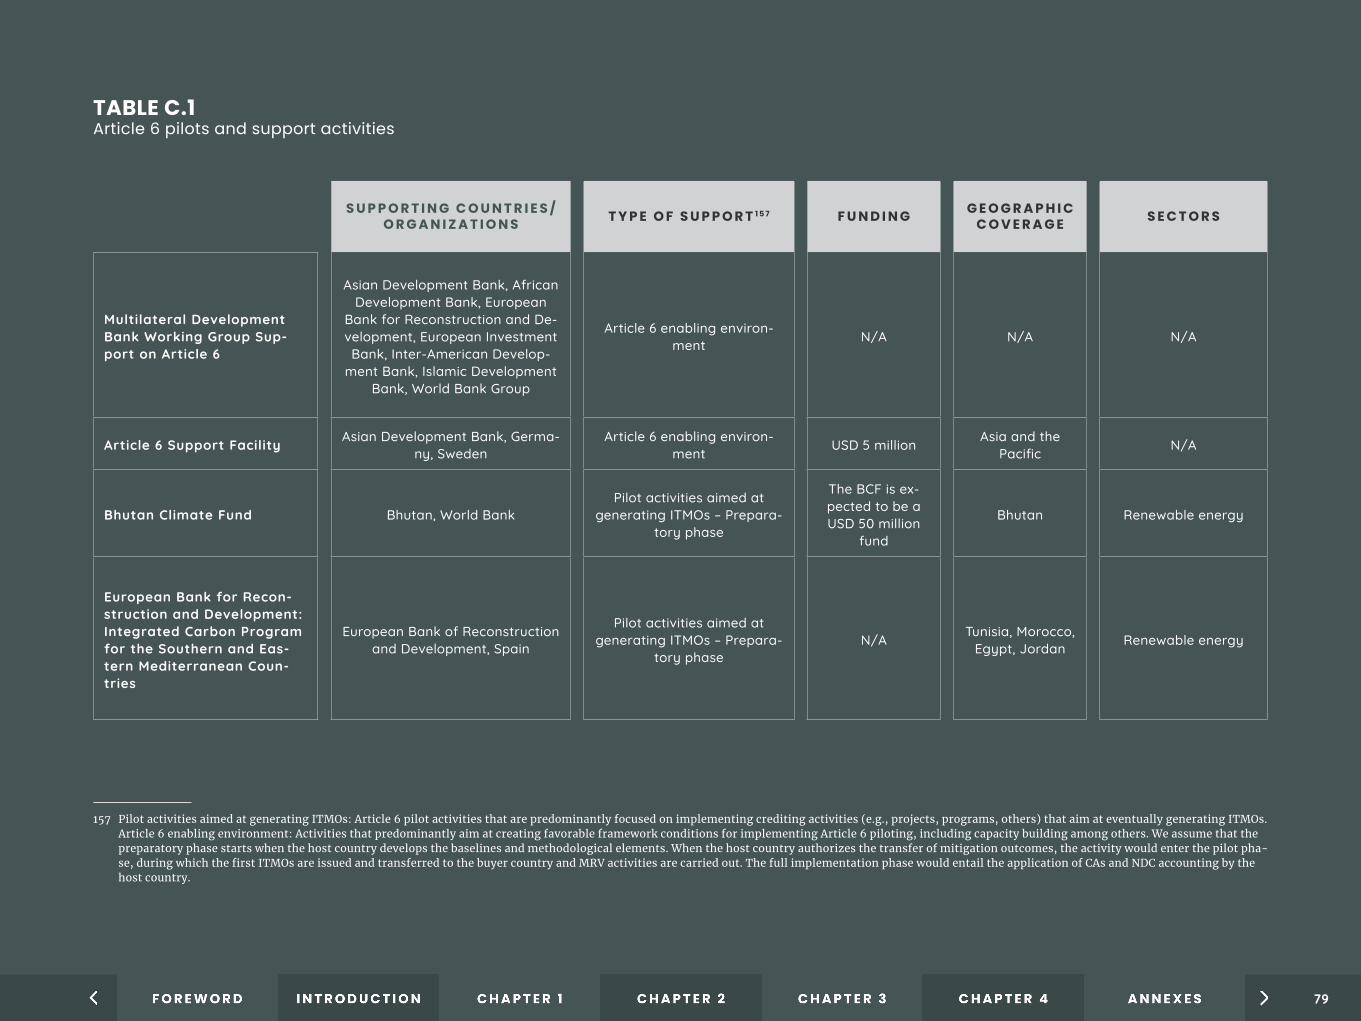
TABLE C.1 Article 6 pilots and support activities
S U P P O R T I N G C O U N T R I E S /O R G A N I Z A T I O N S T Y P E O F S U P P O R T 1 5 7 F U N D I N G G E O G R A P H I C
C O V E R A G E S E C T O R S
Multilateral Development Bank Working Group Sup-port on Article 6
Asian Development Bank, African Development Bank, European
Bank for Reconstruction and De-velopment, European Investment Bank, Inter-American Develop-
ment Bank, Islamic Development Bank, World Bank Group
Article 6 enabling environ-ment N/A N/A N/A
Article 6 Support Facility Asian Development Bank, Germa-ny, Sweden
Article 6 enabling environ-ment USD 5 million Asia and the
Pacific N/A
Bhutan Climate Fund Bhutan, World BankPilot activities aimed at
generating ITMOs – Prepara-tory phase
The BCF is ex-pected to be a USD 50 million
fund
Bhutan Renewable energy
European Bank for Recon-struction and Development: Integrated Carbon Program for the Southern and Eas-tern Mediterranean Coun-tries
European Bank of Reconstruction and Development, Spain
Pilot activities aimed at generating ITMOs – Prepara-
tory phaseN/A Tunisia, Morocco,
Egypt, Jordan Renewable energy
157 Pilot activities aimed at generating ITMOs: Article 6 pilot activities that are predominantly focused on implementing crediting activities (e.g., projects, programs, others) that aim at eventually generating ITMOs. Article 6 enabling environment: Activities that predominantly aim at creating favorable framework conditions for implementing Article 6 piloting, including capacity building among others. We assume that the preparatory phase starts when the host country develops the baselines and methodological elements. When the host country authorizes the transfer of mitigation outcomes, the activity would enter the pilot pha-se, during which the first ITMOs are issued and transferred to the buyer country and MRV activities are carried out. The full implementation phase would entail the application of CAs and NDC accounting by the host country.
79
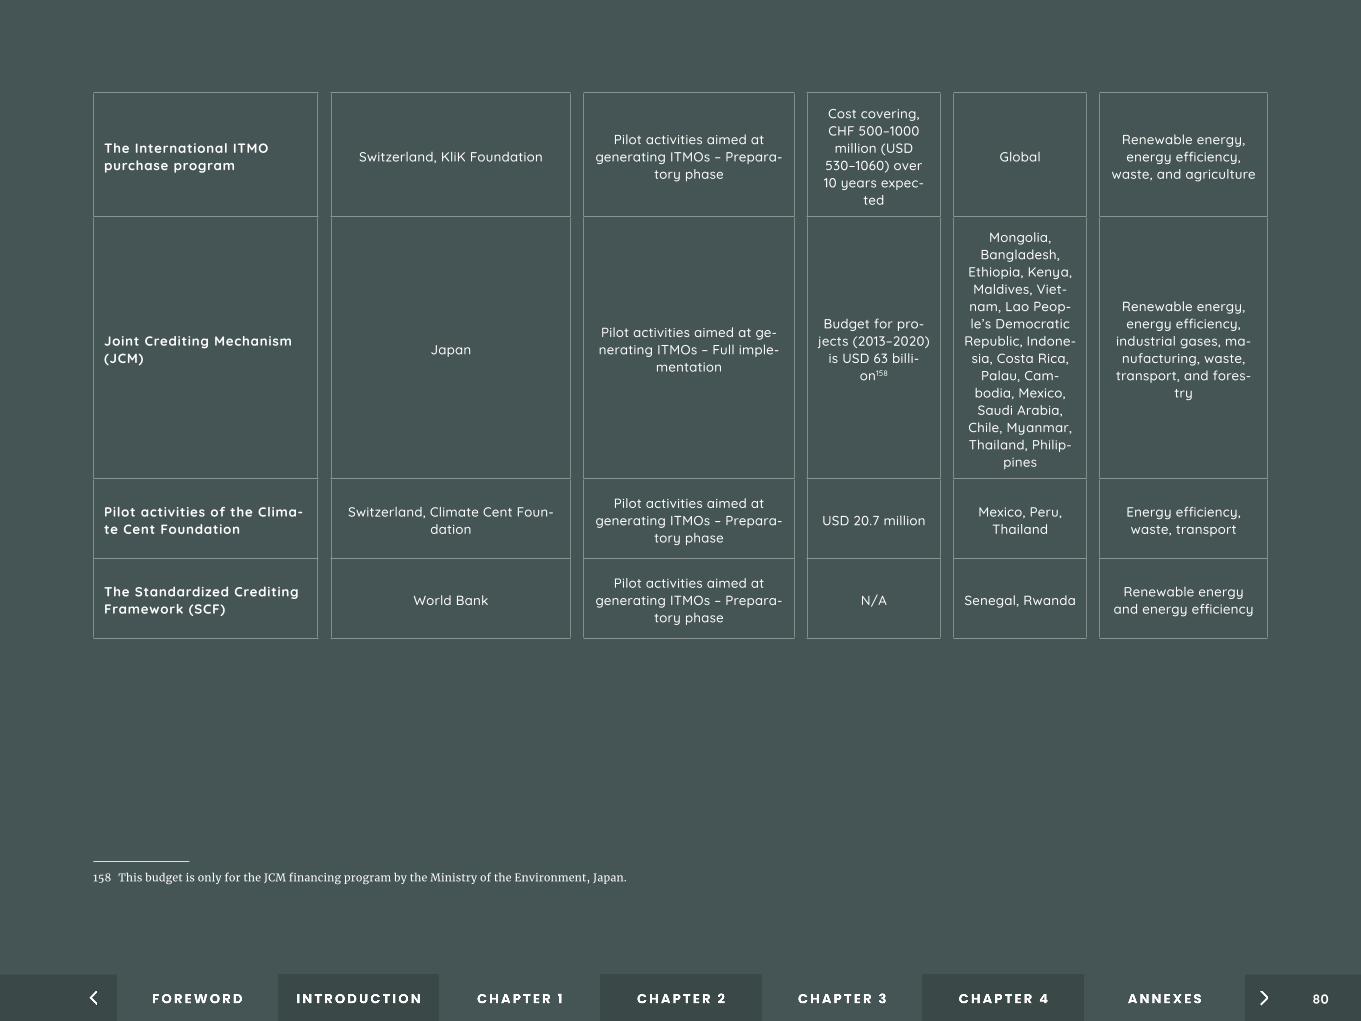
The International ITMO purchase program Switzerland, KliK Foundation
Pilot activities aimed at generating ITMOs – Prepara-
tory phase
Cost covering, CHF 500–1000 million (USD
530–1060) over 10 years expec-
ted
GlobalRenewable energy, energy efficiency,
waste, and agriculture
Joint Crediting Mechanism (JCM) Japan
Pilot activities aimed at ge-nerating ITMOs – Full imple-
mentation
Budget for pro-jects (2013–2020)
is USD 63 billi-on158
Mongolia, Bangladesh,
Ethiopia, Kenya, Maldives, Viet-
nam, Lao Peop-le’s Democratic
Republic, Indone-sia, Costa Rica,
Palau, Cam-bodia, Mexico, Saudi Arabia,
Chile, Myanmar, Thailand, Philip-
pines
Renewable energy, energy efficiency,
industrial gases, ma-nufacturing, waste,
transport, and fores-try
Pilot activities of the Clima-te Cent Foundation
Switzerland, Climate Cent Foun-dation
Pilot activities aimed at generating ITMOs – Prepara-
tory phaseUSD 20.7 million Mexico, Peru,
ThailandEnergy efficiency, waste, transport
The Standardized Crediting Framework (SCF) World Bank
Pilot activities aimed at generating ITMOs – Prepara-
tory phaseN/A Senegal, Rwanda Renewable energy
and energy efficiency
158 This budget is only for the JCM financing program by the Ministry of the Environment, Japan.
80

Carbon Partnership Facility
In 2020, the Carbon Partnership Facility Carbon Fund had 3 Buyer Participants159 and 10 Seller Par-
ticipants.160 Donors to the Carbon Asset Development Fund inclu-
ded Spain, Norway, and Italy, and the European Commission.
Article 6 enabling environ-ment
Buyer Parti-cipants had
pledged EUR 98.8 million (USD
116.05) to the Carbon Fund,
and the Carbon Asset Develop-ment Fund had received USD 35 million in exter-
nal funding.
Morocco, Bra-zil, Vietnam,
Thailand, China, Tanzania, Egypt
Philippines
Renewable energy waste, energy effici-ency, fugitive emissi-
ons
Transformative Carbon As-set Facility (TCAF)
UK, Norway, Sweden, Switzer-land, Germany, Canada
Pilot activities aimed at generating ITMOs – Prepara-
tory phaseUSD 212 million N/A N/A
Climate Warehouse World BankPilot activities aimed at
generating ITMOs – Prepara-tory phase
N/A Bangladesh, Chi-le, India, Kenya N/A
Nordic Initiative for Coope-rative Approaches
Finland, Norway, Sweden, and Nordic Environment Finance Cor-
poration
Pilot activities aimed at ge-nerating ITMOs – Pilot phase N/A Peru Waste
“Reciclo Orgánicos” Initia-tive Canada, Chile
Pilot activities aimed at generating ITMOs – Prepara-
tory phase
CAD 7 million (USD 5.57 milli-
on)Chile Waste
159 The governments of Spain, Norway, and Sweden.160 Fonds D’equipement Communal of Morocco, Caixa Econômica Federal of Brazil, the Ministry of Industry and Trade of Vietnam, the Provincial Electricity Authority of Thailand, the Hebei Green Agriculture Com-
pany, the Rural Energy Agency of Tanzania, the Ministry of Finance of the Arab Republic of Egypt, and the Land Bank of the Philippines.
81

Pilot Activities of the BMU – “TD Losses” Germany
Pilot activities aimed at generating ITMOs – Prepara-
tory phase
USD 5.9 million (carbon pay-
ment) combined with a low inte-rest loan com-
ponent (interest payment reducti-ons approx. USD
41.23 million
Zambia, Uganda, Mozambique,
ZimbabweEnergy efficiency
Activities of the Swedish Energy Agency Sweden
Pilot activities aimed at generating ITMOs, Article 6 enabling environment (Swedish Energy Agency
Chilean pilot – Preparatory phase)
N/A
Colombia, Chile, Nigeria, Kenya,
Mongolia, Philip-pines, Indonesia
Renewable energy, waste, energy effici-
ency
AfDB: Energy Efficiency ITMO Projects in West Africa
AfDB, African Climate Technology and Finance Center Network
Article 6 enabling environ-ment N/A West African
countries Energy efficiency
Global Green Growth Insti-tute – Mobilizing Article 6 Trading Structures
Global Green Growth Institute, Sweden
Pilot activities aimed at generating ITMOs – Prepara-
tory phaseN/A Ethiopia, Nepal,
CambodiaEnergy efficiency,
waste, manufacturing
Global Green Growth In-stitute – Designing Policy Approaches Under A6
Global Green Growth Institute, Norway
Article 6 enabling environ-ment N/A
Colombia, Mexi-co, Peru, Viet-
nam, Indonesia, Morocco, Thai-land, Senegal
N/A
82

West Africa Alliance on Car-bon Markets
Benin, Cape Verde, Cote d’I-voire, Gambia, Ghana, Guinea,
Guinea-Bissau, Mali, Mauritania, Niger, Nigeria, Liberia, Burkina
Faso, Sierra Leone, Senegal, Togo, Germany
Article 6 enabling environ-ment
EUR 2.8 million (USD 3.29 milli-
on)
Benin, Cape Verde, Cote
d’Ivoire, Gambia, Ghana, Guinea, Guinea-Bissau,
Mali, Mauritania, Niger, Nigeria, Liberia, Burki-na Faso, Sierra Leone, Senegal,
Togo
N/A
East Africa Alliance on Car-bon Markets
Burundi, Ethiopia, Kenya, Ugan-da, Rwanda, Tanzania, Sudan,
Germany
Article 6 enabling environ-ment N/A
Burundi, Ethi-opia, Kenya,
Uganda, Rwan-da, Tanzania,
Sudan
N/A
Climate Market Club
World Bank, MDB Working Group on A6. The Club comprises ele-
ven country members, including Bangladesh, Bhutan, Chile, Gha-na, Japan, Peru, Rwanda, Sene-gal, Singapore, Sweden, Switzer-
land, Ukraine, Kazakhstan
Article 6 enabling environ-ment N/A
Bangladesh, Bhutan, Chile, Ghana, Japan, Peru, Rwanda, Senegal, Sin-
gapore, Sweden, Switzerland,
Ukraine, Kazakh-stan
N/A
83
AFRICAN DEVELOPMENT BANK ENERGY EFFICIENCY ITMO PROJECTS IN WEST AFRICA As of October 2020,161 the African Development Bank is supporting energy efficient ITMO projects in West Africa with the aim to support both the development, as well as the implementation of activities under Article 6. The project is in the first phase, preparing scoping reports to identify obstacles and issues that may arise in the development of mitigation projects in West Africa, as well as the preparation of four project concept no-tes. The four project concept notes will be developed in a minimum of two West African countries, with the goal to further develop and implement two of them in two different countries. This effort is part of a larger initiative led by the African Climate Technology and Finance Center and Network.
CARBON PARTNERSHIP FACILITY As of December 2020, there were seven Programs of Activities included in the Carbon Partnership Facility portfolio, ranging from solid waste management in Brazil to renewa-ble energy in Tanzania. The Sri Lanka renewable energy crediting program, which was intended to be the first pilot of a new carbon market instrument under Article 6, is no lon-ger in development by mutual agreement as of December 2020. Additionally, the Facility is engaged with the government of Vietnam to provide technical assistance to support the country in preparing a sectoral crediting program for its industrial energy efficiency sector.
CLIMATE CENT FOUNDATION The bilateral implementation agreement signed between Switzerland and Peru clears the way for the conclusion of a commercial agreement on the purchase of mitigation outco-mes in Peru as a result of the Climate Cent Foundation program.162
161 AfDB. Climat : la Banque africaine de développement apporte une aide aux pays d’Afrique de l’Ouest pour la réduction des émissions de carbone et le respect des engagements de l’Accord de Paris. https://www.afdb.org/fr/news-and-events/press-releases/climat-la-banque-africaine-de-developpement-apporte-une-aide-aux-pays-dafrique-de-louest-pour-la-reduction-des-emissions-de-carbone-et-le-respect--des-engagements-de-laccord-de-paris-42105 (February 9, 2021)
162 Climate Cent Foundation. Pilot Activities under the Paris Agreement. https://www.klimarappen.ch/en/Pilot-activities-under-the-Paris-Agreement-.34.html (February 2, 2021)163 UNFCCC. (March 24, 2021). Standardized Baselines. Grid Emission Factor for West African Power Pool (version 01.0). https://cdm.unfccc.int/methodologies/standard_base/2015/sb166.html164 The Joint Crediting Mechanism. Launch of the JCM Global Partnership. http://gec.jp/jcm/news/launch-of-the-jcm-global-partnership/ (July 16, 2020)
CLIMATE WAREHOUSEA second phase of the World Bank Climate Warehouse simulation will be run soon, and the World Bank together with RCC Lomé worked with the West African Power Pool for updating the standardized baseline for the grid emission factor for West African Power Pool.163 Additionally, a report related to potential for regional collaboration on carbon markets in the framework of the Southern African Power Pool will be soon published.
GERMAN FEDERAL MINISTRY FOR THE ENVIRONMENT, NATURE CONSERVATION, AND NUCLEAR SAFETY (BMU) PILOT ACTIVITIESThe Article 6 pilot projects currently underway include the program for reducing tech-nical losses in the power grid (TD-Losses) in industrial facilities in Zambia, Uganda, Mozambique, and Zimbabwe, as well as a project focusing on the cooling sector. In this regard, the first draft of a transfer agreement for ITMOs has been elaborated. However, Germany intends to cancel the generated ITMOS and not to use them for compliance purposes. The BMU has also set up a new International Climate initiative project, the “Strategic use of cooperative approaches of the Paris Agreement to raise ambition.” The objective is to build capacity in middle-income countries to use international carbon market mechanisms (i) to achieve effective NDC implementation, (ii) to develop strate-gies to broaden the unconditional goals of the NDC, and (iii) to develop up to three Arti-cle 6 pilots per country. The program will target three to four countries and has a budget of EUR 20 million.
JOINT CREDITING MECHANISM The Ministry of the Environment of Japan launched the JCM Global Partnership in July 2020 with the aim of facilitating multilateral partnerships among the JCM partner coun-tries and relevant stakeholders that are involved in the JCM implementation or interested in market mechanisms under the Paris Agreement.164 The Ministry of the Environment of Japan also implemented virtual activities to promote awareness of Article 6 and transparency, such as transparency mutual learning program and Asian Transparency
84

Workshop. Twenty-six projects165 have been selected in countries such as Thailand (8), Vietnam (7), or Indonesia (4). Most of them are renewable energy projects, including solar, hydro, geothermal, and biomass, although there also some others that are linked to the energy efficiency and waste management sectors.166
KLIK FOUNDATION INTERNATIONAL ITMO PURCHASE PROGRAM On January 10, 2021, the KliK Foundation closed its third call for proposals for the pro-curement of ITMOs. This current call for proposals puts to the fore activ¬ities that ge-nerate a product and thus come with a primary revenue source.167 On October 20 and November 23, 2020, Switzerland signed bilateral implementation agreements with Peru and Ghana, respectively, regarding the cooperative implementation of climate protection activities within the framework of the Paris Agreement. These agreements govern the recognition and crediting of transferred emission reductions under Article 6 of the Paris Agreement. Once the specific national processes have been enacted, the processes of the KliK Foundation will be harmonized accordingly. As a first activity under bilateral agreement between Switzerland and Ghana, the KliK Foundation is supporting the Natio-nal Clean Energy Program, which has been devised by Ghana's Ministry of Environment, Science, Technology, and Innovation in collaboration with its Environmental Protection Agency. The development of the National Clean Energy Program is now being tendered by the KliK Foundation.168
INTEGRATED CARBON PROGRAMS The Protocol for Digitalized MRV (D-MRV) v1.0169 was finalized and released in Decem-ber 2020 under the European Bank for Reconstruction and Development Integrated Carbon Programs. The Protocol aims to define — in a technology-neutral way — key requirements for an automated digital MRV system to ensure integrity, accuracy, and
165 The Joint Crediting Mechanis. Preliminary Selection Result for Financing Programme for JCM Model Projects in FY2020 (5th Selection). http://gec.jp/jcm/kobo/mp210201/ (February 1, 2021)166 The Joint Crediting Mechanism. Projects. http://gec.jp/jcm/?p_year%5B%5D=2020&s=&operator=in#label_result (February 3, 2021)167 The KliK Foundation. Third Call for Proposals for the Procurement of ITMOs. https://www.international.klik.ch/news/publications/third-call-for-proposals-for-the-procurement-of-itmos (October 6, 2020)168 The KliK Foundation. Request for Proposals to Develop a Mitigation Activity Design Document National Clean Energy Access Program (“NCEP”), Ghana, November 23, 2020, https://www.international.klik.ch/
news/publications/request-for-proposals-to-develop-a-mitigation-activity-design-document169 https://www.ebrd.com/digitised-mrv-protocol.html170 NEFCO. Nordic Initiative for Cooperative Approaches (NICA). https://www.nefco.org/fund-mobilisation/funds-managed-by-nefco/nordic-initiative-for-cooperative-approaches/ (February 3, 2021)171 Due to the pandemic, the Project was extended until the end of 2022.172 Ethiopia, Kenya, Lao PDR, Madagascar, Mali, Uganda, Senegal, Rwanda. and Burkina Faso.173 Climate Focus (CF), Perspectives Climate Group (PCG). Article 6 Piloting: State of Play and Stakeholder Experiences. https://www.climatefinanceinnovators.com/wp-content/uploads/2020/12/Climate-Finan-
ce-Innovators_Article-6-piloting_State-of-play-and-stakeholder-experiences_December-2020.pdf (December 2020)
traceability of mitigation outcome data, thereby increasing the efficiency and speed of MRV processes and enhancing transparency and environmental integrity of carbon markets. Functional requirements for a pilot D-MRV software solution have also been defined, building on the provisions of the D-MRV Protocol. D-MRV system piloting will initially start with renewable energy in 2021, and a project in Jordan has been identified.
NORDIC INITIATIVE FOR COOPERATIVE APPROACHESSupported activities under the Article 6 implementation work will be procured and put into action by autumn 2021. Financing will initially be grants with cofunding components likely to be required going forward.170
“RECICLO ORGÁNICOS” INITIATIVE: CHILE–CANADA AGREEMENT ON ENVIRON-MENT COOPERATIONThe Canada–Chile “Reciclo Orgánicos” initiative has been extended until the end of 2022.171 It supports the deployment of technologies and the piloting of innovative ap-proaches under Article 6, enabling the reduction of emissions in the waste sector. Both governments are working on NDC-level accounting that seeks to find the needs and arrangements to enable potential bilateral transfers under Article 6.2.
STANDARDIZED CREDITING FRAMEWORKAfter the finalization of two pilot projects in Senegal and Rwanda, the Carbon Initiative for Development is now planning to fully roll out the Standardized Crediting Framework in the other countries and regions where the Carbon Initiative for Development portfolio is active172 over the next two years and is currently engaged in consultations with donors and host country governments.173
85
SWEDISH ENERGY AGENCY PILOTSThe Swedish Energy Agency has selected an Article 6 pilot on promoting electricity generation from nonconventional renewable energy sources in Chile for development toward potential implementation. Discussions are ongoing. In addition to this, the Agency launched a call for proposals for mitigation activities that could be developed through Article 6 cooperation. More than 60 proposals were submitted and six were moved into the Mitigation Activity Description Document development phase. Finally, the Swed-ish Energy Agency has also established a cooperation program with the Global Green Growth Institute’s Mobilizing Article 6 Trading Structures Program, which allows for the establishment of contacts with host countries by relying on existing in-country structures and networks, and by supporting the build-up of institutional capacity and governance frameworks in the identified potential host countries. At present, four mitigation activities from three countries that could generate emission reduction units have been selected for further development.174
TRANSFORMATIVE CARBON ASSET FACILITY The Transformative Carbon Asset Facility, a results-based facility, is engaged with sever-al potential host countries to develop crediting programs within the solid waste, renewa-ble energy, agricultural, and financial sectors. With approximately $220 million in capital, TCAF’s goal is to support between four and six programs, helping developing countries with NDC implementation and increasing climate change mitigation ambitions. TCAF has developed detailed crediting blueprints for the following sectors: Climate Smart Agricul-ture,175 Urban Crediting Framework,176 Greening Financial Sector,177 Transport Sector,178 Price Based Mitigation Policies,179 and Energy Efficiency. A Synthesis Report180 summari-zing the findings of each crediting blueprint has also been developed.
174 Two activities will be focused on the energy sector in Ethiopia: one will target the waste sector in Nepal, and one will target the manufacturing sector in Cambodia.175 TCAF. Unlocking Crediting Opportunities in Climate-Smart Agriculture. https://tcafwb.org/sites/tcaf/files/2021-03/TCAF%20Crediting%20Blueprint%20Synthesis%20Report_Final_February%202021%20
%281%29_0.pdf176 TCAF. Urban Crediting Framework. https://tcafwb.org/sites/tcaf/files/2021-03/Urban%20Crediting%20framework_Final.pdf (2020)177 TCAF. Supporting Decarbonization through the Financial Sector in Developing Countries Using Results-Based Payments for Verified Emissions Reductions. https://tcafwb.org/sites/tcaf/files/2021-03/TCAF%20
blueprint_greening%20financial%20sector_FINAL_01142001.pdf (January 2021)178 TCAF. Feasibility Assessment and Conceptualization Note for the Transport Sector, https://tcafwb.org/sites/tcaf/files/2021-03/TCAF%20Assessment%20Note%20for%20the%20Transport%20Sector.pdf179 TCAF. Supporting Price-Based Mitigation Policies in Developing Countries through Results-Based Payments for Verified Emissions Reductions. https://tcafwb.org/sites/tcaf/files/2021-03/TCAF_PBMP_blue-
print_FINAL_November%202020.pdf (November 2020)180 Transformative Carbon Asset Facility (TCAF). (February 2021). Crediting Blueprint Synthesis Report. https://tcafwb.org/sites/tcaf/files/2021-03/TCAF%20Crediting%20Blueprint%20Synthesis%20Report_Fi-
nal_February%202021%20%281%29_0.pdf
WEST AFRICAN AND EASTERN AFRICA ALLIANCESThe two Alliances collaborated to successfully hold the first of its kind ITMO roundta-ble on July 8, 2020. It brought together several cooperative approach developers and stakeholders from Eastern and West Africa to dialogue on the practicalities of piloting activities.
In its second phase (2020–2024), the West Africa Alliance plans to carry out a number of activities that will help member countries prepare for the implementation of Article 6 at the nation level. These include, among others, creating national readiness platforms that will assist selected member countries in preparing for Article 6 implementation; or de-veloping a database that will provide members with up-to-date information on relevant stakeholders for mitigation project development and implementation. Several capacity building workshops on Article 6 have been organized to better prepare the members for technical discussions during the Conference Of the Party and Subsidiary Body sessions.
86
