state budget outlook “the breach” mike shealy sc senate finance committee
TRANSCRIPT

State Budget OutlookState Budget Outlook
““The Breach” The Breach”
Mike ShealySC Senate Finance Committee

BBreachreach Pronunciation: \Pronunciation: \ ˈbrēch\ brēch\ Function: Function: nounnoun Etymology: Middle English Etymology: Middle English breche,breche, from Old English from Old English bræcbræc act of breaking; akin to Old English act of breaking; akin to Old English brecanbrecan to to break break Date: before 12th centuryDate: before 12th century
11 :: infraction or violation of a law, obligation, tie, or infraction or violation of a law, obligation, tie, or standardstandard
2 :2 : a broken, ruptured, or torn condition or area a broken, ruptured, or torn condition or area bb :: a gap (as in a wall) made by batteringa gap (as in a wall) made by battering
3 :3 : a break in accustomed friendly relations a break in accustomed friendly relations bb :: a a temporary gap in continuity temporary gap in continuity

Unusual Circumstances Unusual Circumstances Over the Past 12 MonthsOver the Past 12 Months
General Assembly returns October General Assembly returns October 20-24, 2008 to pass Recission Bill in 20-24, 2008 to pass Recission Bill in 5 days 5 days (-$488M)(-$488M)
HR1 American Recovery & HR1 American Recovery & Reinvestment Act, Budget Reinvestment Act, Budget Stabilization Fund Stabilization Fund (Supreme Court Order of 6/4/09)(Supreme Court Order of 6/4/09)
Senate Concurrence to House Senate Concurrence to House Amendment on H3560, the General Amendment on H3560, the General Appropriation Bill on 5/13/09 Appropriation Bill on 5/13/09 (no Budget (no Budget Conference Committee)Conference Committee)

$0
$1,000,000,000
$2,000,000,000
$3,000,000,000
$4,000,000,000
$5,000,000,000
$6,000,000,000
$7,000,000,000
1979
1980
1981
1982
1983
1984
1985
1986
1987
1988
1989
1990
1991
1992
1993
1994
1995
1996
1997
1998
1999
2000
2001
2002
2003
2004
2005
2006
2007
2008
2009
2010
General Fund Collections


What were we thinking?What were we thinking?
Assumption: Revenue growth Assumption: Revenue growth from FY04-05 through FY06-from FY04-05 through FY06-07 was recovery from “9/11” 07 was recovery from “9/11”
recession.recession.
Correction: The revenue Correction: The revenue growth was a bubble growth was a bubble
mirroring the economic mirroring the economic bubble caused partially by bubble caused partially by
mortgage financing.mortgage financing.

Assumptions of BubblesAssumptions of Bubbles
Economic: Housing prices will Economic: Housing prices will always increase.always increase.
General Fund: Revenues will General Fund: Revenues will always increase.always increase.
George Gershwin: “It Ain’t George Gershwin: “It Ain’t Necessarily So” from the Necessarily So” from the
opera Porgy & Bessopera Porgy & Bess

Summary of Revenue Shortfalls FY 2008-09 and FY 2009-10
FY 2008-09 Appropriation Act Revenue Estimate (Net of Tax Relief Trust Fund) 6,718,657,837
BEA Forecast Reduction July 21, 2008 (140,000,000)
BEA Forecast Reduction October 8, 2008 (414,000,000)
BEA Forecast Reduction November 7, 2008 (135,100,507)
BEA Forecast Reduction December 10, 2008 (230,000,000)
BEA Forecast Reduction March 11, 2009 (64,000,000)
BEA Forecast Reduction June 11, 2009 (92,000,000)
Total BEA Revenue Forecast Reductions (1,075,100,507)
Additional Revenue Shortfall (FM13) (129,784,560)
Open-Ended Appropriations
Homestead Exemption Fund Shortfall (52,995,831)
DOC & DJJ Deficits (Recognized by B&C Board) (51,795,768)
Other Open-Ended Accounts (4,512,014)
Total Open-Ended Appropriations (109,303,613)
Total Year End General Fund Shortfall (1,314,188,680)
FY 2008-09 General Assembly and Budget & Control Board Actions
B&CB Action 8/08/08--Reduce Capital Reserve Fund 133,170,058
FY 08-09 Appropriation Rescission Act- Targeted Agency Reductions-Oct 2008 487,906,416
B&CB Action 12/11/08--7% Across the Board Agency Reductions 383,475,665
B&CB Action March 18--2% Across the Board Agency Reductions 101,894,963
Total General Assembly and B&C Board Actions 1,106,447,102
Agency Lapsed Funds and Sustained Vetoes 1,428,054
Remaining Year End General Fund Shortfall (206,313,524)
General Reserve Fund Balance Applied to Shortfall 108,096,907
FY 2008-09 Year End Deficit Remaining After Reserve Funds Applied (98,216,617)

Summary of Revenue Shortfalls FY 2008-09 and FY 2009-10 (Continued)
FY 2009-10 Appropriation Act Revenue Estimate (Net of Tax Relief Trust Fund)
5,529,491,371
BEA Forecast Reduction June 11, 2009 (120,000,000)
BEA Forecast Reduction July 16, 2009 (208,300,000)
Total BEA Reductions to Date (328,300,000)
FY 2009-10 General Assembly and Budget Control Board Actions
B&CB Action 6/29/09--Reduce Capital Reserve Fund (CRF) effective 7/1/09
120,000,000
B&CB Action 9/3/09--Apply Remaining Balance of CRF ($7.8m) and 4.04% Across the Board Agency Reductions ($200.4m)
208,300,000
Total General Assembly and B&C Board Actions 328,300,000
FY 2009-10 Estimated Year End Deficit Remaining To Date 0

How Did We Get Here?How Did We Get Here?
•The National RecessionThe National Recession
•The Structure of Our State The Structure of Our State Revenue SystemRevenue System
•Taxation and Spending Taxation and Spending PoliciesPolicies


FY 1999 FY 2008
Gross Sales Amount 94,435,505,424 146,328,024,474
Net Taxable Sales Amount 45,199,250,866 59,660,508,895
Percentage of Net Taxable Sales
47.9% 40.8%
Source: Department of Revenue, Annual Report.
Comparison of Gross and Net Taxable Comparison of Gross and Net Taxable SalesSales
FY 1999 – FY 2008 FY 1999 – FY 2008

Consumer Expenditure Survey 1984 & 2007Percent Distribution of Total Annual Expenditures
By Major Category
Category 1984 2007 Difference
Housing 30.4% 34.1% 3.7%
Transportation 19.6% 17.6% - 2.0%
Food 15.0% 12.4% - 2.6%
Personal insurance and pensions 8.6% 10.8% 2.2%
Healthcare 4.8% 5.7% 0.9%
Entertainment 4.8% 5.4% 0.6%
Apparel and services 6.0% 3.8% - 2.2%
Cash Contributions 3.2% 3.7% 0.5%
Education 1.4% 1.9% 0.5%
Miscellaneous 2.0% 1.6% - 0.4%
Personal care products and services
1.3% 1.2% - 0.1%
Alcoholic beverages 1.3% 0.9% - 0.4%
Tobacco products and smoking supplies
1.0% 0.7% - 0.3%
Reading 0.6% 0.2% - 0.4%
Total 100.0%
100.0%
Source: Bureau of Labor Statistics

SpendingSpending (and Tax) Cuts(and Tax) CutsHistoric and Recent (over $500M in last 3 years) Tax Relief Historic and Recent (over $500M in last 3 years) Tax Relief
in South Carolina:in South Carolina:
According to historic BEA data updated by SFC staff, SC individuals and According to historic BEA data updated by SFC staff, SC individuals and businesses had “businesses had “tax savingstax savings” totaling almost ” totaling almost $1.3 Billion$1.3 Billion in FY2007- in FY2007-08 alone.08 alone. Including the state’s dozens of sales tax exemptions Including the state’s dozens of sales tax exemptions (including items like motor fuel, prescription drugs, etc.), that figure (including items like motor fuel, prescription drugs, etc.), that figure jumps to an estimated jumps to an estimated $3.7 Billion$3.7 Billion in taxpayers savings each year. in taxpayers savings each year.
More recent tax relief packages passed by the General More recent tax relief packages passed by the General AssemblyAssembly
since 2005 include:since 2005 include:
Property tax relief for homeowners – “The Swap”Property tax relief for homeowners – “The Swap”
Total eliminationTotal elimination of the state’s “grocery tax”. of the state’s “grocery tax”.
Total elimination of the state’s bottom income tax bracket.Total elimination of the state’s bottom income tax bracket.
Reduction of the tax on small business from a top marginal rate Reduction of the tax on small business from a top marginal rate of 7% to a flat rate of 5%.of 7% to a flat rate of 5%.
Fiscal Year
ESTIMATED Homestead
Exemption Fund Revenue
ACTUAL Homestead
Exemption Fund Revenue
ESTIMATED Homestead
Exemption Fund School District
Reimbursements
ACTUAL Homestead
Exemption Fund School District
Reimbursements 1GENERAL FUND OBLIGATION 2
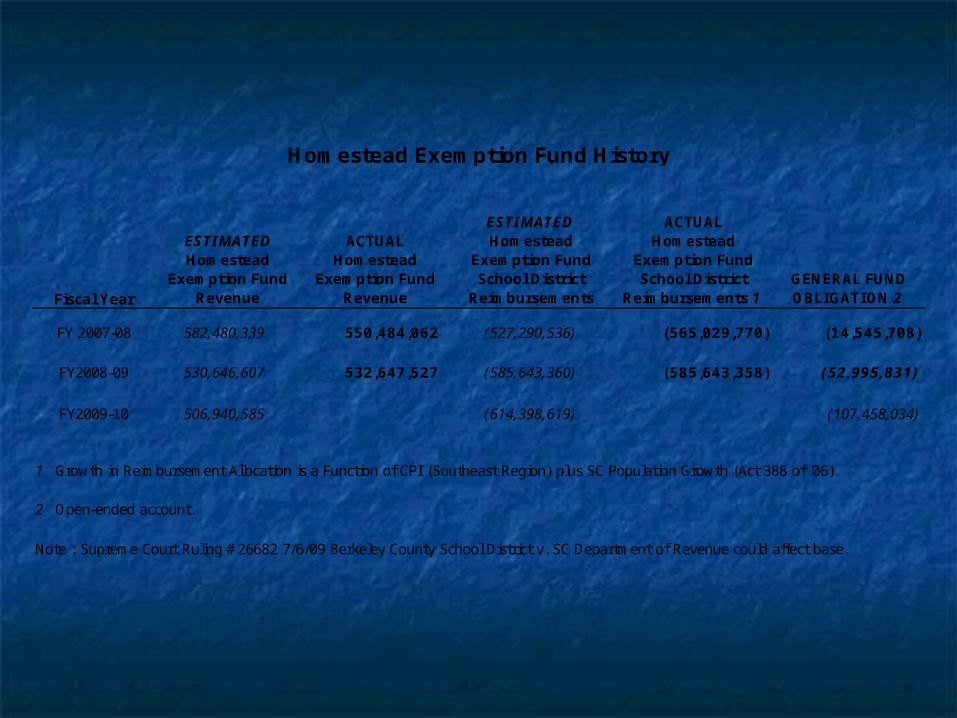
FY 2007-08 582,480,339 550,484,062 (527,290,536) (565,029,770) (14,545,708)
FY2008-09 530,646,607 532,647,527 (585,643,360) (585,643,358) (52,995,831)
FY2009-10 506,940,585 (614,398,619) (107,458,034)
1 Growth in Reimbursement Allocation is a Function of CPI (Southeast Region) plus SC Population Growth (Act 388 of '06).
2 Open-ended account.
Note : Supreme Court Ruling #26682 7/6/09 Berkeley County School District v. SC Department of Revenue could affect base.
Homestead Exemption Fund History

The Temporary Plug in the The Temporary Plug in the BreachBreach

H.R.1 of 2009H.R.1 of 2009American Recovery and Reinvestment Act of American Recovery and Reinvestment Act of
20092009 $787.242 Billion or about $2600 per capita$787.242 Billion or about $2600 per capita
South Carolina's Portion of Stimulus FundsSouth Carolina's Portion of Stimulus Funds
Total Total $7.86 Billion$7.86 Billion
Tax CutsTax Cuts $2.86 Billion$2.86 Billion
Total Spending in SCTotal Spending in SC $5 Billion*$5 Billion**(includes Federal spending on Federal *(includes Federal spending on Federal
installations)installations)
Of the $5 Billion spent in SC:Of the $5 Billion spent in SC:$3.4 Billion will be received by cognizant State agencies through the $3.4 Billion will be received by cognizant State agencies through the state budget. (The $3.4 billion includes allocations received by state state budget. (The $3.4 billion includes allocations received by state agencies and subsequently distributed to local governments, non-agencies and subsequently distributed to local governments, non-profits, etc)profits, etc)

H.R.1 of 2009H.R.1 of 2009American Recovery and Reinvestment Act of American Recovery and Reinvestment Act of
2009 2009
ESTIMATED ALLOCATIONS BY MAJOR CATEGORY:ESTIMATED ALLOCATIONS BY MAJOR CATEGORY:
BUDGET STABILIZATION FUNDBUDGET STABILIZATION FUND $ 694,060,272$ 694,060,272MEDICAID *MEDICAID * $ 876,040,898$ 876,040,898TRANSPORTATIONTRANSPORTATION $ $ 504,200,000504,200,000WATER AND SEWERWATER AND SEWER $ 59,755,697$ 59,755,697ENERGYENERGY $ 111,700,000$ 111,700,000HEALTH AND HUMAN SERVICESHEALTH AND HUMAN SERVICES $ 441,842,913$ 441,842,913HOUSINGHOUSING $ $ 77,600,00077,600,000EDUCATIONEDUCATION $ 406,064,498$ 406,064,498STATE AND LOCAL LAW ENFORCEMENTSTATE AND LOCAL LAW ENFORCEMENT $ $ 42,484,71642,484,716WORKFORCE/EMPLOYMENT SERVICESWORKFORCE/EMPLOYMENT SERVICES $ $ 168,620,882168,620,882
TOTAL ESTIMATED SC ALLOCATIONSTOTAL ESTIMATED SC ALLOCATIONS$3,382,369,876$3,382,369,876
PercentagPercentagee
21%21%26%26%15%15% 2%2% 3%3%13%13% 2%2%12%12% 1%1% 5%5%
100%100%
* ARRA Medicaid is a temporary increase in the Federal Medical Assistance Percentage (FMAP). Approximately 9% increase in Federal share of Medicaid reimbursements from 70% to 79%. Increased FMAP in effect for 9 quarters from July 2008 through December 2010.

H.R.1 of 2009H.R.1 of 2009American Recovery and Reinvestment Act of American Recovery and Reinvestment Act of
20092009 BUDGET STABILIZATION FUNDBUDGET STABILIZATION FUND
Distribution Requirements:Distribution Requirements:
82% must be allocated to K-12 Higher Education and 18% 82% must be allocated to K-12 Higher Education and 18% may be may be allocated for other government purposes.allocated for other government purposes.
FY 2009-10 AllocationsFY 2009-10 Allocations FundingFunding PercentagePercentage
State Department of State Department of EducationEducation
$184,992,339$184,992,339 53%53%
Colleges and UniversitiesColleges and Universities $ 99,922,339$ 99,922,339 29%29%
Public SafetyPublic Safety $ 46,120,000$ 46,120,000 13%13%
Other Government Other Government ServicesServices
$ 16,969,485$ 16,969,485 5%5%
TOTAL FY 2009-10TOTAL FY 2009-10 $348,004,16$348,004,1633
100%100%

The Outlook for the Next The Outlook for the Next Several Years and BeyondSeveral Years and Beyond
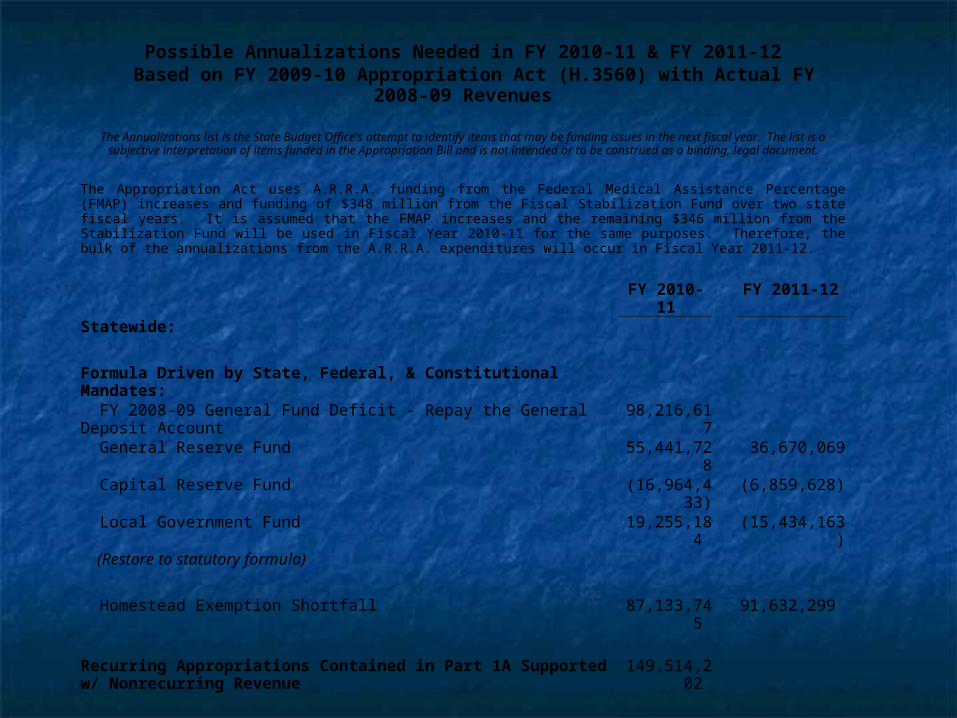
Possible Annualizations Needed in FY 2010-11 & FY 2011-12 Based on FY 2009-10 Appropriation Act (H.3560) with Actual FY 2008-09 Revenues
The Annualizations list is the State Budget Office's attempt to identify items that may be funding issues in the next fiscal year. The list is a subjective interpretation of items funded in the Appropriation Bill and is not intended or to be construed as a binding, legal document.
The Appropriation Act uses A.R.R.A. funding from the Federal Medical Assistance Percentage (FMAP) increases and funding of $348 million from the Fiscal Stabilization Fund over two state fiscal years. It is assumed that the FMAP increases and the remaining $346 million from the Stabilization Fund will be used in Fiscal Year 2010-11 for the same purposes. Therefore, the bulk of the annualizations from the A.R.R.A. expenditures will occur in Fiscal Year 2011-12.
FY 2010-11 FY 2011-12
Statewide:
Formula Driven by State, Federal, & Constitutional Mandates:
FY 2008-09 General Fund Deficit - Repay the General Deposit Account 98,216,617
General Reserve Fund 55,441,728 36,670,069
Capital Reserve Fund (16,964,433) (6,859,628)
Local Government Fund 19,255,184 (15,434,163)
(Restore to statutory formula)
Homestead Exemption Shortfall 87,133,745 91,632,299
Recurring Appropriations Contained in Part 1A Supported w/ Nonrecurring Revenue
149,514,202
Subtotal - Statewide Items 392,597,043 106,008,577
Subtotal - State Agencies 18,135,560 578,221,604
ANNUALIZATION OF FY 2009-10 410,732,603 684,230,181

Education Finance ActEducation Finance ActFormula Funding RequirementFormula Funding Requirement
$1,178
$1,587
$1,656
$1,677
$1,175
$1,250
$1,325
$1,400
$1,475
$1,550
$1,625
$1,700
FY 2009-10 Base After 4%
Reduction
Restore toFY 2008-09
Base
FY 2009-10 Formula
Requirement
FY 2010-11 Formula
Requirement
Mill
ions
$499 million appropriation
needed to meet formula in FY 2011

Policy QuestionsPolicy Questions
Will Policy Makers put EFA Restoration at Will Policy Makers put EFA Restoration at the Front of the Line?the Front of the Line?
How Much More Funding Will Be Required How Much More Funding Will Be Required to Underwrite Federal Health Insurance to Underwrite Federal Health Insurance Changes?Changes?
Have We Reached a Bottom Threshold on Have We Reached a Bottom Threshold on Funding for Corrections? DJJ?Funding for Corrections? DJJ?
How Much More Will Policy Makers How Much More Will Policy Makers Tolerate Fee Increases Tolerate Fee Increases (Tuition, License Fees, (Tuition, License Fees,
Ticket Surcharges) Ticket Surcharges) ??

The BreachThe Breach
11 :: infraction or violation of a law, obligation, tie, or standard infraction or violation of a law, obligation, tie, or standard State Government will be forced to change or ignore State Government will be forced to change or ignore funding statutes.funding statutes.
2 :2 : a broken, ruptured, or torn condition or area a broken, ruptured, or torn condition or area bb :: a gap (as in a a gap (as in a wall) made by battering wall) made by battering The state budget’s structural deficit will become more The state budget’s structural deficit will become more pronounced over time. Changes to address the structural pronounced over time. Changes to address the structural deficit will be incremental and very difficult to attain.deficit will be incremental and very difficult to attain.
3 :3 : a break in accustomed friendly relations a break in accustomed friendly relations bb :: a temporary gap in a temporary gap in continuity continuity State government will not be able to afford continuing State government will not be able to afford continuing business as usual so benefits currently provided to citizens business as usual so benefits currently provided to citizens will diminish. Citizens will become even more angry.will diminish. Citizens will become even more angry.