state economic snapshots economic snapshots —page 2 june, in large part because workers entered...
TRANSCRIPT

STATE ECONOMIC SNAPSHOTS
JULY 25, 2016

This page intentionally left blank

July 25, 2016
State Economic Snapshots
This monthly report provides a snapshot of the status of the economic recovery in each of the 50 states and
the District of Columbia. This month’s snapshots include state-level data on jobs, unemployment and
earnings through June 2016.1
Highlights
Private-sector employment increased in 40 states in June.
The unemployment rate fell in 11 states and the District of Columbia.
Average hourly earnings, adjusted for inflation, increased in 36 states over the past year.
Private-Sector Job Gains
Private-sector employment increased in 40 states in June. The largest private-sector gains were seen in
California (31,300), New York (23,900), New Jersey (22,200), Pennsylvania (18,400) and Michigan
(18,000). On a percentage basis, the largest gains were in the Delaware, Maine, Hawaii, West Virginia,
New Jersey, New Hampshire, Arizona, Nevada and Massachusetts.
Over the past 12 months, 44 states and the District of Columbia gained private-sector jobs, with California
(399,000), Florida (226,900), Texas (123,000), Georgia (116,300) and New York (96,700) recording the
largest increases. The largest percentage gains in private-sector employment during this period were in
Arizona, Delaware (3.7 percent each), Utah (3.5 percent), Oregon (3.4 percent), Georgia and Florida (3.2
percent each). Nationally, 2.3 million private-sector jobs were added in the past year, a 1.9 percent
increase.
Unemployment
The unemployment rate declined in 11 states and the District of Columbia in June. North Carolina (-0.2
percentage point) was the only state to record a statistically significant decrease during June. Six states had
statistically significant increases in the unemployment rate from the prior month.
Over the past 12 months, 33 states and the District of Columbia reported declines in the unemployment
rate. Sixteen states and the District of Columbia had declines that were statistically significant, with the
largest of these declines in Tennessee (-1.6 percentage points), Arkansas (-1.5 percentage points), West
Virginia (-1.1 percentage points) and Oregon (-1.0 percentage point). Two states had increases that were
statistically significant.
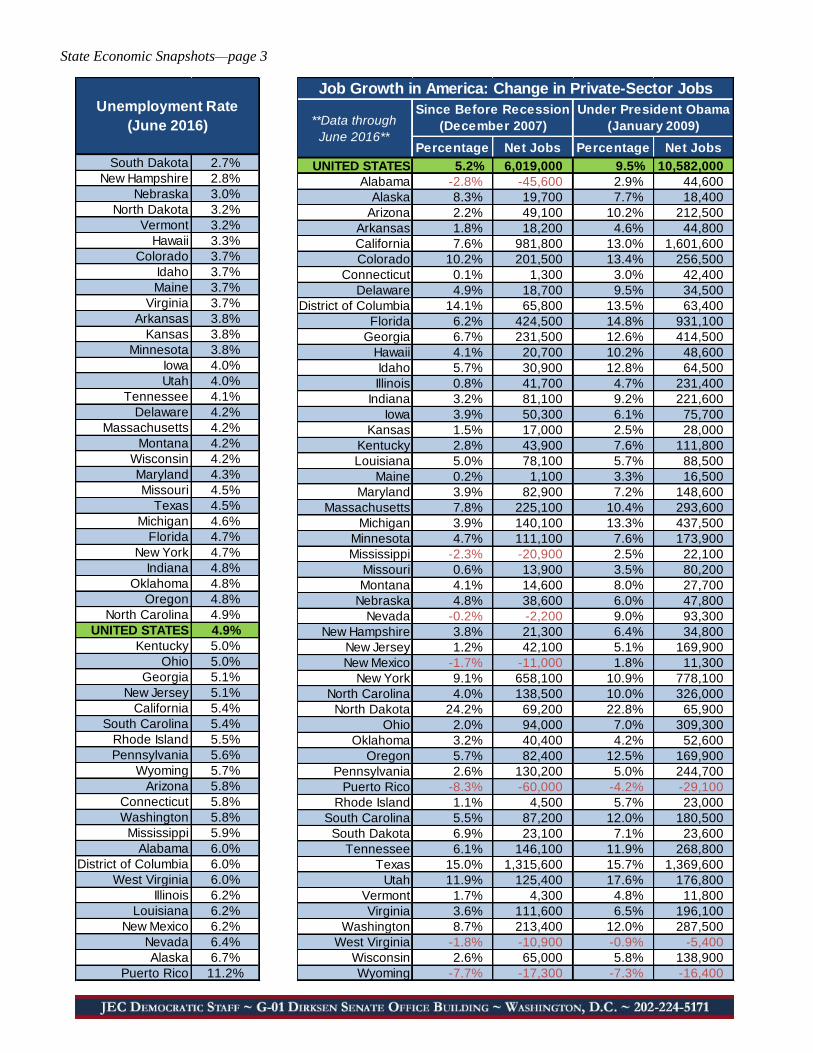
South Dakota (2.7 percent) had the lowest unemployment rate in June, followed by New Hampshire
(2.8 percent), Nebraska (3.0 percent), North Dakota and Vermont (3.2 percent each). Alaska (6.7 percent)
had the highest unemployment rate, followed by Nevada (6.4 percent), Illinois, New Mexico and Louisiana
(6.2 percent each). The national unemployment rate increased from 4.7 percent in May to 4.9 percent in
1 Individual monthly readings should be interpreted with caution and in the context of longer-term trends and other data that
become available. State-level data changes on a monthly basis may not be statistically significant due to sampling variation,
which occurs because a sample rather than the entire population is surveyed.

State Economic Snapshots—page 2
June, in large part because workers entered the labor force in response to better employment prospects. The
national unemployment rate was 5.3 percent in June 2015.
Earnings Average hourly earnings, adjusted for inflation, increased in 36 states over the past year. The largest
earnings gains were posted in Delaware (6.8 percent), Rhode Island, Iowa (5.1 percent each), North
Carolina (4.7 percent) and Nebraska (4.0 percent). Earnings declined in 14 states and the District of
Columbia. Nationally, real average hourly earnings increased by 1.6 percent (not seasonally adjusted) in
the past year. The District of Columbia ($37.86) had the highest average hourly earnings in June, followed
by Massachusetts ($30.75), Washington ($29.98), Connecticut ($29.93) and New York ($28.68).
Key Employment Sectors
Manufacturing
Manufacturing employment expanded in 27 states during June. The largest increases were in North
Carolina (4,200), California (3,600), New York (3,000), Ohio (2,600) and Wisconsin (2,300). On a
percentage basis, the largest gains were in Mississippi, South Dakota, Nevada, North Carolina, Utah and
New Jersey.
Over the past 12 months, 22 states added manufacturing positions. On a percentage basis, the biggest gains
were in Tennessee (3.4 percent), Florida (3.3 percent), Montana (3.2 percent), Maryland (2.8 percent) and
Utah (2.7 percent). Across the country, 29,000 manufacturing positions have been lost in the last 12
months, a 0.2 percent decrease.
Construction
Construction employment increased in 23 states and the District of Columbia during June. The largest
gains were reported in Pennsylvania (3,400), Arizona (3,100), Colorado (2,700), Indiana (2,600), Iowa and
Wisconsin (2,100 each). The largest percentage gains during the month were in Delaware, New
Hampshire, Iowa, Arizona and Indiana.
In the past 12 months, 39 states added construction jobs. The greatest percentage gains over the past year
were in Hawaii (15.9 percent), Iowa (15.8 percent), Oklahoma, Colorado (8.9 percent each), Arizona and
Nevada (8.7 percent each). Nationally, over this period, construction employment increased by 217,000
positions, a 3.4 percent increase.
Professional and Business Services
Professional and business services employment increased in 35 states during June. The largest increases
were posted in California (11,300), Ohio (6,900), Virginia (5,100), Georgia (4,900) and Michigan (4,200).
The largest percentage gains were in Hawaii, New Hampshire, Maine, North Dakota and Delaware.
In the past year, 40 states and the District of Columbia added jobs in professional and business services.
The largest percentage gains were in Delaware (8.1 percent), Oregon (6.8 percent), South Carolina (5.5
percent), Georgia and Idaho (5.3 percent each). The U.S. economy overall has added 497,000 professional
and business services jobs during this time, a 2.5 percent increase.
State Economic Snapshots—page 3
South Dakota 2.7%
New Hampshire 2.8%
Nebraska 3.0%
North Dakota 3.2%
Vermont 3.2%
Hawaii 3.3%
Colorado 3.7%
Idaho 3.7%
Maine 3.7%
Virginia 3.7%
Arkansas 3.8%
Kansas 3.8%
Minnesota 3.8%
Iowa 4.0%
Utah 4.0%
Tennessee 4.1%
Delaware 4.2%
Massachusetts 4.2%
Montana 4.2%
Wisconsin 4.2%
Maryland 4.3%
Missouri 4.5%
Texas 4.5%
Michigan 4.6%
Florida 4.7%
New York 4.7%
Indiana 4.8%
Oklahoma 4.8%
Oregon 4.8%
North Carolina 4.9%
UNITED STATES 4.9%
Kentucky 5.0%
Ohio 5.0%
Georgia 5.1%
New Jersey 5.1%
California 5.4%
South Carolina 5.4%
Rhode Island 5.5%
Pennsylvania 5.6%
Wyoming 5.7%
Arizona 5.8%
Connecticut 5.8%
Washington 5.8%
Mississippi 5.9%
Alabama 6.0%
District of Columbia 6.0%
West Virginia 6.0%
Illinois 6.2%
Louisiana 6.2%
New Mexico 6.2%
Nevada 6.4%
Alaska 6.7%
Puerto Rico 11.2%
Unemployment Rate
(June 2016)
Percentage Net Jobs Percentage Net Jobs
UNITED STATES 5.2% 6,019,000 9.5% 10,582,000
Alabama -2.8% -45,600 2.9% 44,600
Alaska 8.3% 19,700 7.7% 18,400
Arizona 2.2% 49,100 10.2% 212,500
Arkansas 1.8% 18,200 4.6% 44,800
California 7.6% 981,800 13.0% 1,601,600
Colorado 10.2% 201,500 13.4% 256,500
Connecticut 0.1% 1,300 3.0% 42,400
Delaware 4.9% 18,700 9.5% 34,500
District of Columbia 14.1% 65,800 13.5% 63,400
Florida 6.2% 424,500 14.8% 931,100
Georgia 6.7% 231,500 12.6% 414,500
Hawaii 4.1% 20,700 10.2% 48,600
Idaho 5.7% 30,900 12.8% 64,500
Illinois 0.8% 41,700 4.7% 231,400
Indiana 3.2% 81,100 9.2% 221,600
Iowa 3.9% 50,300 6.1% 75,700
Kansas 1.5% 17,000 2.5% 28,000
Kentucky 2.8% 43,900 7.6% 111,800
Louisiana 5.0% 78,100 5.7% 88,500
Maine 0.2% 1,100 3.3% 16,500
Maryland 3.9% 82,900 7.2% 148,600
Massachusetts 7.8% 225,100 10.4% 293,600
Michigan 3.9% 140,100 13.3% 437,500
Minnesota 4.7% 111,100 7.6% 173,900
Mississippi -2.3% -20,900 2.5% 22,100
Missouri 0.6% 13,900 3.5% 80,200
Montana 4.1% 14,600 8.0% 27,700
Nebraska 4.8% 38,600 6.0% 47,800
Nevada -0.2% -2,200 9.0% 93,300
New Hampshire 3.8% 21,300 6.4% 34,800
New Jersey 1.2% 42,100 5.1% 169,900
New Mexico -1.7% -11,000 1.8% 11,300
New York 9.1% 658,100 10.9% 778,100
North Carolina 4.0% 138,500 10.0% 326,000
North Dakota 24.2% 69,200 22.8% 65,900
Ohio 2.0% 94,000 7.0% 309,300
Oklahoma 3.2% 40,400 4.2% 52,600
Oregon 5.7% 82,400 12.5% 169,900
Pennsylvania 2.6% 130,200 5.0% 244,700
Puerto Rico -8.3% -60,000 -4.2% -29,100
Rhode Island 1.1% 4,500 5.7% 23,000
South Carolina 5.5% 87,200 12.0% 180,500
South Dakota 6.9% 23,100 7.1% 23,600
Tennessee 6.1% 146,100 11.9% 268,800
Texas 15.0% 1,315,600 15.7% 1,369,600
Utah 11.9% 125,400 17.6% 176,800
Vermont 1.7% 4,300 4.8% 11,800
Virginia 3.6% 111,600 6.5% 196,100
Washington 8.7% 213,400 12.0% 287,500
West Virginia -1.8% -10,900 -0.9% -5,400
Wisconsin 2.6% 65,000 5.8% 138,900
Wyoming -7.7% -17,300 -7.3% -16,400
Job Growth in America: Change in Private-Sector Jobs
**Data through
June 2016**
Since Before Recession
(December 2007)
Under President Obama
(January 2009)

State Economic Snapshots—page 4

U.S. Congress Joint Economic Committee
◙
◙
◙
◙
◙
◙
◙
◙
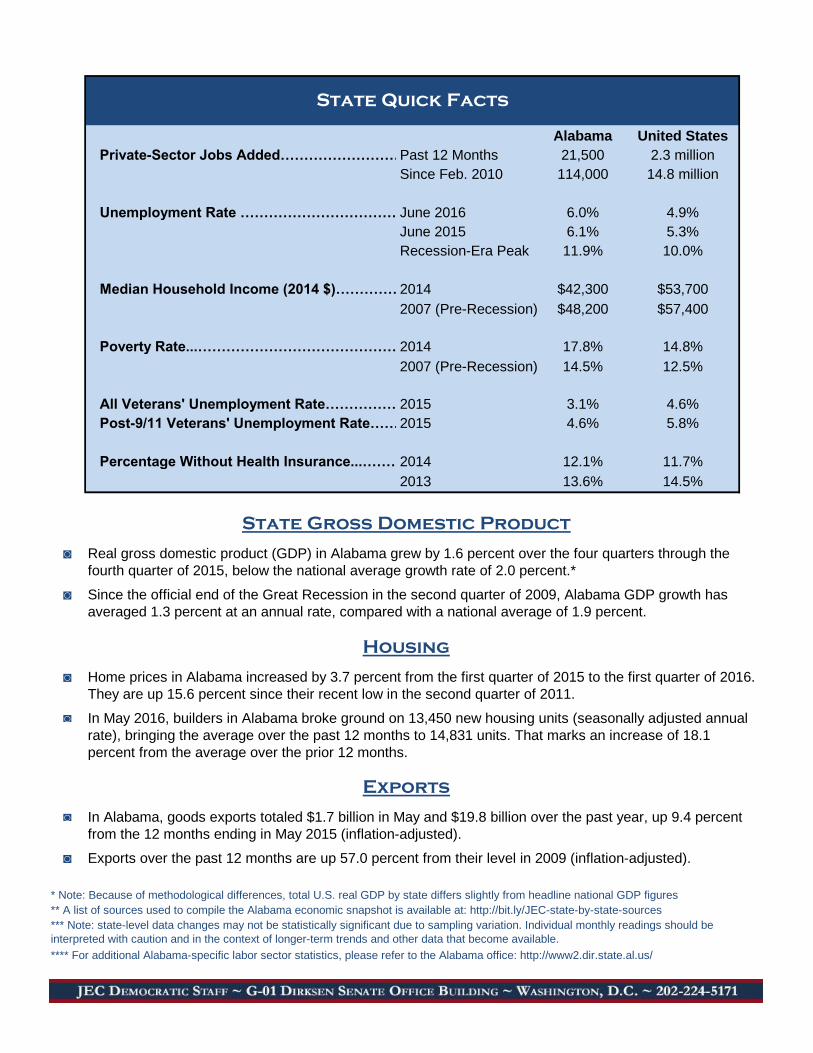
In June 2016, average hourly earnings of private-sector workers in Alabama were $21.76. The average
workweek was 35.7 hours, and average weekly earnings were $776.83.
Unemployment
Earnings
Economic Snapshot: Alabama
**Includes Bureau of Labor Statistics jobs, unemployment and earnings data through June 2016**
**Last updated on July 22nd; July data will be released on August 19th**
Since February 2010, the national low point for private-sector employment, Alabama businesses have
added 114,000 jobs (an increase of 7.7 percent). Nationally, private payrolls have increased by 13.8
percent over this time.
The state sectors with the greatest job gains in percentage terms since February 2010 are: leisure and
hospitality at 14.9 percent (24,800 jobs), professional and business services at 14.0 percent (28,500 jobs)
and education and health services at 8.0 percent (17,100 jobs).
Jobs
In June, private-sector employment in Alabama grew by 1,200 jobs. Over the past year, Alabama
businesses have added 21,500 jobs. This compares with an increase of 25,600 jobs over the 12 months
through June 2015.
Unemployment is down 0.1 percentage point from one year earlier and is 5.9 percentage points below its
recent peak of 11.9 percent in November 2009.
There were 130,300 Alabama residents unemployed in June 2016.
The unemployment rate in Alabama was 6.0 percent in June 2016, holding constant from May. The rate
was 1.1 percentage points above the national rate of 4.9 percent.
Adjusting for inflation, state average hourly earnings have risen by 3.9 percent over the past year.
Nationally, real average hourly earnings have increased by 1.6 percent (not seasonally adjusted).
-25
-20
-15
-10
-5
0
5
10
Source: JEC Democratic staff calculations based on seasonally adjusted data from the Bureau of Labor Statistics
Private-Sector Job Growth in AlabamaMonthly, Jan. 2008 - Jun. 2016, thousands
2008 2009 2010 2011 2012 2013 2014
Bush administration
Obama administration
2015 2016
JULY 2016
Alabama United States
Private-Sector Jobs Added……………………………….Past 12 Months 21,500 2.3 million
Since Feb. 2010 114,000 14.8 million
Unemployment Rate …………………………………………………..June 2016 6.0% 4.9%
June 2015 6.1% 5.3%
Recession-Era Peak 11.9% 10.0%
Median Household Income (2014 $)…………………………………………………………….2014 $42,300 $53,700
2007 (Pre-Recession) $48,200 $57,400
Poverty Rate...………………………………………………………………..2014 17.8% 14.8%
2007 (Pre-Recession) 14.5% 12.5%
All Veterans' Unemployment Rate………………………….'2015 3.1% 4.6%
Post-9/11 Veterans' Unemployment Rate…………………………2015 4.6% 5.8%
Percentage Without Health Insurance...………………………………………………………….2014 12.1% 11.7%
2013 13.6% 14.5%
◙
◙
◙
◙
◙
◙
* Note: Because of methodological differences, total U.S. real GDP by state differs slightly from headline national GDP figures
Exports over the past 12 months are up 57.0 percent from their level in 2009 (inflation-adjusted).
In Alabama, goods exports totaled $1.7 billion in May and $19.8 billion over the past year, up 9.4 percent
from the 12 months ending in May 2015 (inflation-adjusted).
Exports
In May 2016, builders in Alabama broke ground on 13,450 new housing units (seasonally adjusted annual
rate), bringing the average over the past 12 months to 14,831 units. That marks an increase of 18.1
percent from the average over the prior 12 months.
Home prices in Alabama increased by 3.7 percent from the first quarter of 2015 to the first quarter of 2016.
They are up 15.6 percent since their recent low in the second quarter of 2011.
Housing
Real gross domestic product (GDP) in Alabama grew by 1.6 percent over the four quarters through the
fourth quarter of 2015, below the national average growth rate of 2.0 percent.*
State Gross Domestic Product
Since the official end of the Great Recession in the second quarter of 2009, Alabama GDP growth has
averaged 1.3 percent at an annual rate, compared with a national average of 1.9 percent.
*** Note: state-level data changes may not be statistically significant due to sampling variation. Individual monthly readings should be
interpreted with caution and in the context of longer-term trends and other data that become available.
** A list of sources used to compile the Alabama economic snapshot is available at: http://bit.ly/JEC-state-by-state-sources
**** For additional Alabama-specific labor sector statistics, please refer to the Alabama office: http://www2.dir.state.al.us/
State Quick Facts

U.S. Congress Joint Economic Committee
◙
◙
◙
◙
◙
◙
◙
◙
In June 2016, average hourly earnings of private-sector workers in Alaska were $28.00. The average
workweek was 34.5 hours, and average weekly earnings were $966.00.
Unemployment
Earnings
Economic Snapshot: Alaska
**Includes Bureau of Labor Statistics jobs, unemployment and earnings data through June 2016**
**Last updated on July 22nd; July data will be released on August 19th**
Since February 2010, the national low point for private-sector employment, Alaska businesses have added
20,800 jobs (an increase of 8.8 percent). Nationally, private payrolls have increased by 13.8 percent over
this time.
The state sectors with the greatest job gains in percentage terms since February 2010 are: education and
health services at 19.9 percent (8,200 jobs), leisure and hospitality at 16.3 percent (5,100 jobs) and
manufacturing at 7.9 percent (1,000 jobs).
Jobs
In June, private-sector employment in Alaska grew by 500 jobs. Over the past year, Alaska businesses
have shed 1,000 jobs. This compares with an increase of 2,100 jobs over the 12 months through June
2015.
Unemployment is up 0.2 percentage point from one year earlier but remains 1.3 percentage points below
its recent peak of 8.0 percent in April 2010.
There were 24,200 Alaska residents unemployed in June 2016.
The unemployment rate in Alaska was 6.7 percent in June 2016, holding constant from May. The rate was
1.8 percentage points above the national rate of 4.9 percent.
Adjusting for inflation, state average hourly earnings have fallen by 0.1 percent over the past year.
Nationally, real average hourly earnings have increased by 1.6 percent (not seasonally adjusted).
-4
-3
-2
-1
0
1
2
3
4
5
6
Source: JEC Democratic staff calculations based on seasonally adjusted data from the Bureau of Labor Statistics
Private-Sector Job Growth in AlaskaMonthly, Jan. 2008 - Jun. 2016, thousands
2008 2009 2010 2011 2012 2013 2014
Bush administration
Obama administration
2015 2016
JULY 2016

Alaska United States
Private-Sector Jobs Added……………………………….Past 12 Months -1,000 2.3 million
Since Feb. 2010 20,800 14.8 million
Unemployment Rate …………………………………………………..June 2016 6.7% 4.9%
June 2015 6.5% 5.3%
Recession-Era Peak 8.0% 10.0%
Median Household Income (2014 $)…………………………………………………………….2014 $67,600 $53,700
2007 (Pre-Recession) $71,900 $57,400
Poverty Rate...………………………………………………………………..2014 11.9% 14.8%
2007 (Pre-Recession) 7.6% 12.5%
All Veterans' Unemployment Rate………………………….'2015 4.3% 4.6%
Post-9/11 Veterans' Unemployment Rate…………………………2015 3.9% 5.8%
Percentage Without Health Insurance...………………………………………………………….2014 17.2% 11.7%
2013 18.5% 14.5%
◙
◙
◙
◙
◙
◙
* Note: Because of methodological differences, total U.S. real GDP by state differs slightly from headline national GDP figures
Exports over the past 12 months are up 30.5 percent from their level in 2009 (inflation-adjusted).
In Alaska, goods exports totaled $207 million in May and $4.3 billion over the past year, down 9.3 percent
from the 12 months ending in May 2015 (inflation-adjusted).
Exports
In May 2016, builders in Alaska broke ground on 1,600 new housing units (seasonally adjusted annual
rate), bringing the average over the past 12 months to 1,365 units. That marks an increase of 17.6 percent
from the average over the prior 12 months.
Home prices in Alaska increased by 1.4 percent from the first quarter of 2015 to the first quarter of 2016.
They are up 16.0 percent since their recent low in the third quarter of 2009.
Housing
Real gross domestic product (GDP) in Alaska fell by 1.7 percent over the four quarters through the fourth
quarter of 2015, below the national average growth rate of 2.0 percent.*
State Gross Domestic Product
Since the official end of the Great Recession in the second quarter of 2009, Alaska GDP growth has
averaged -0.6 percent at an annual rate, compared with a national average of 1.9 percent.
*** Note: state-level data changes may not be statistically significant due to sampling variation. Individual monthly readings should be
interpreted with caution and in the context of longer-term trends and other data that become available.
** A list of sources used to compile the Alaska economic snapshot is available at: http://bit.ly/JEC-state-by-state-sources
**** For additional Alaska-specific labor sector statistics, please refer to the Alaska office: http://almis.labor.state.ak.us/
State Quick Facts

U.S. Congress Joint Economic Committee
◙
◙
◙
◙
◙
◙
◙
◙
In June 2016, average hourly earnings of private-sector workers in Arizona were $23.82. The average
workweek was 34.4 hours, and average weekly earnings were $819.41.
Unemployment
Earnings
Economic Snapshot: Arizona
**Includes Bureau of Labor Statistics jobs, unemployment and earnings data through June 2016**
**Last updated on July 22nd; July data will be released on August 19th**
Since February 2010, the national low point for private-sector employment, Arizona businesses have added
334,800 jobs (an increase of 17.0 percent). Nationally, private payrolls have increased by 13.8 percent over
this time.
The state sectors with the greatest job gains in percentage terms since February 2010 are: information
services at 31.1 percent (11,400 jobs), financial activities at 23.2 percent (38,900 jobs) and education and
health services at 22.3 percent (75,900 jobs).
Jobs
In June, private-sector employment in Arizona grew by 13,800 jobs. Over the past year, Arizona
businesses have added 82,700 jobs. This compares with an increase of 60,700 jobs over the 12 months
through June 2015.
Unemployment is down 0.2 percentage point from one year earlier and is 5.4 percentage points below its
recent peak of 11.2 percent in December 2009.
There were 187,300 Arizona residents unemployed in June 2016.
The unemployment rate in Arizona was 5.8 percent in June 2016, up 0.2 percentage point from May. The
rate was 0.9 percentage point above the national rate of 4.9 percent.
Adjusting for inflation, state average hourly earnings have risen by 2.8 percent over the past year.
Nationally, real average hourly earnings have increased by 1.6 percent (not seasonally adjusted).
-30
-25
-20
-15
-10
-5
0
5
10
15
20
Source: JEC Democratic staff calculations based on seasonally adjusted data from the Bureau of Labor Statistics
Private-Sector Job Growth in ArizonaMonthly, Jan. 2008 - Jun. 2016, thousands
2008 2009 2010 2011 2012 2013 2014
Bush administration
Obama administration
2015 2016
JULY 2016

Arizona United States
Private-Sector Jobs Added……………………………….Past 12 Months 82,700 2.3 million
Since Feb. 2010 334,800 14.8 million
Unemployment Rate …………………………………………………..June 2016 5.8% 4.9%
June 2015 6.0% 5.3%
Recession-Era Peak 11.2% 10.0%
Median Household Income (2014 $)…………………………………………………………….2014 $49,300 $53,700
2007 (Pre-Recession) $53,900 $57,400
Poverty Rate...………………………………………………………………..2014 21.2% 14.8%
2007 (Pre-Recession) 14.3% 12.5%
All Veterans' Unemployment Rate………………………….'2015 3.7% 4.6%
Post-9/11 Veterans' Unemployment Rate…………………………2015 4.0% 5.8%
Percentage Without Health Insurance...………………………………………………………….2014 13.6% 11.7%
2013 17.1% 14.5%
◙
◙
◙
◙
◙
◙
* Note: Because of methodological differences, total U.S. real GDP by state differs slightly from headline national GDP figures
Exports over the past 12 months are up 50.2 percent from their level in 2009 (inflation-adjusted).
In Arizona, goods exports totaled $2.0 billion in May and $21.5 billion over the past year, up 3.0 percent
from the 12 months ending in May 2015 (inflation-adjusted).
Exports
In May 2016, builders in Arizona broke ground on 31,650 new housing units (seasonally adjusted annual
rate), bringing the average over the past 12 months to 30,678 units. That marks an increase of 10.5
percent from the average over the prior 12 months.
Home prices in Arizona increased by 7.4 percent from the first quarter of 2015 to the first quarter of 2016.
They are up 62.1 percent since their recent low in the second quarter of 2011.
Housing
Real gross domestic product (GDP) in Arizona grew by 1.2 percent over the four quarters through the
fourth quarter of 2015, below the national average growth rate of 2.0 percent.*
State Gross Domestic Product
Since the official end of the Great Recession in the second quarter of 2009, Arizona GDP growth has
averaged 1.3 percent at an annual rate, compared with a national average of 1.9 percent.
*** Note: state-level data changes may not be statistically significant due to sampling variation. Individual monthly readings should be
interpreted with caution and in the context of longer-term trends and other data that become available.
** A list of sources used to compile the Arizona economic snapshot is available at: http://bit.ly/JEC-state-by-state-sources
**** For additional Arizona-specific labor sector statistics, please refer to the Arizona office: http://www.workforce.az.gov/
State Quick Facts
U.S. Congress Joint Economic Committee
◙
◙
◙
◙
◙
◙
◙
◙
In June 2016, average hourly earnings of private-sector workers in Arkansas were $19.98. The average
workweek was 34.3 hours, and average weekly earnings were $685.31.
Unemployment
Earnings
Economic Snapshot: Arkansas
**Includes Bureau of Labor Statistics jobs, unemployment and earnings data through June 2016**
**Last updated on July 22nd; July data will be released on August 19th**
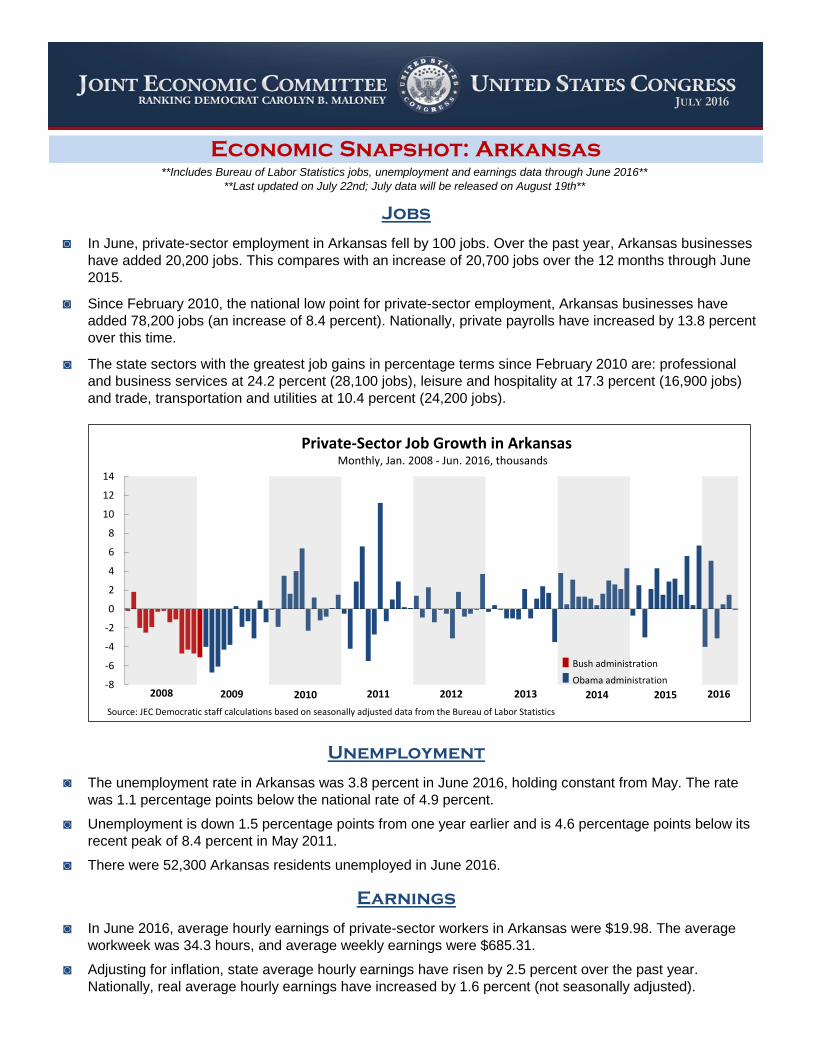
Since February 2010, the national low point for private-sector employment, Arkansas businesses have
added 78,200 jobs (an increase of 8.4 percent). Nationally, private payrolls have increased by 13.8 percent
over this time.
The state sectors with the greatest job gains in percentage terms since February 2010 are: professional
and business services at 24.2 percent (28,100 jobs), leisure and hospitality at 17.3 percent (16,900 jobs)
and trade, transportation and utilities at 10.4 percent (24,200 jobs).
Jobs
In June, private-sector employment in Arkansas fell by 100 jobs. Over the past year, Arkansas businesses
have added 20,200 jobs. This compares with an increase of 20,700 jobs over the 12 months through June
2015.
Unemployment is down 1.5 percentage points from one year earlier and is 4.6 percentage points below its
recent peak of 8.4 percent in May 2011.
There were 52,300 Arkansas residents unemployed in June 2016.
The unemployment rate in Arkansas was 3.8 percent in June 2016, holding constant from May. The rate
was 1.1 percentage points below the national rate of 4.9 percent.
Adjusting for inflation, state average hourly earnings have risen by 2.5 percent over the past year.
Nationally, real average hourly earnings have increased by 1.6 percent (not seasonally adjusted).
-8
-6
-4
-2
0
2
4
6
8
10
12
14
Source: JEC Democratic staff calculations based on seasonally adjusted data from the Bureau of Labor Statistics
Private-Sector Job Growth in ArkansasMonthly, Jan. 2008 - Jun. 2016, thousands
2008 2009 2010 2011 2012 2013 2014
Bush administration
Obama administration
2015 2016
JULY 2016

Arkansas United States
Private-Sector Jobs Added……………………………….Past 12 Months 20,200 2.3 million
Since Feb. 2010 78,200 14.8 million
Unemployment Rate …………………………………………………..June 2016 3.8% 4.9%
June 2015 5.3% 5.3%
Recession-Era Peak 8.4% 10.0%
Median Household Income (2014 $)…………………………………………………………….2014 $44,900 $53,700
2007 (Pre-Recession) $46,600 $57,400
Poverty Rate...………………………………………………………………..2014 18.4% 14.8%
2007 (Pre-Recession) 13.8% 12.5%
All Veterans' Unemployment Rate………………………….'2015 4.7% 4.6%
Post-9/11 Veterans' Unemployment Rate…………………………2015 6.4% 5.8%
Percentage Without Health Insurance...………………………………………………………….2014 11.8% 11.7%
2013 16.0% 14.5%
◙
◙
◙
◙
◙
◙
* Note: Because of methodological differences, total U.S. real GDP by state differs slightly from headline national GDP figures
Exports over the past 12 months are up 5.8 percent from their level in 2009 (inflation-adjusted).
In Arkansas, goods exports totaled $425 million in May and $5.7 billion over the past year, down 6.5
percent from the 12 months ending in May 2015 (inflation-adjusted).
Exports
In May 2016, builders in Arkansas broke ground on 11,680 new housing units (seasonally adjusted annual
rate), bringing the average over the past 12 months to 9,345 units. That marks an increase of 29.4 percent
from the average over the prior 12 months.
Home prices in Arkansas increased by 5.2 percent from the first quarter of 2015 to the first quarter of 2016.
They are up 15.0 percent since their recent low in the second quarter of 2011.
Housing
Real gross domestic product (GDP) in Arkansas grew by 1.4 percent over the four quarters through the
fourth quarter of 2015, below the national average growth rate of 2.0 percent.*
State Gross Domestic Product
Since the official end of the Great Recession in the second quarter of 2009, Arkansas GDP growth has
averaged 2.2 percent at an annual rate, compared with a national average of 1.9 percent.
*** Note: state-level data changes may not be statistically significant due to sampling variation. Individual monthly readings should be
interpreted with caution and in the context of longer-term trends and other data that become available.
** A list of sources used to compile the Arkansas economic snapshot is available at: http://bit.ly/JEC-state-by-state-sources
**** For additional Arkansas-specific labor sector statistics, please refer to the Arkansas office: http://www.discoverarkansas.net/
State Quick Facts

U.S. Congress Joint Economic Committee
◙
◙
◙
◙
◙
◙
◙
◙
In June 2016, average hourly earnings of private-sector workers in California were $28.58. The average
workweek was 34.3 hours, and average weekly earnings were $980.29.
Unemployment
Earnings
Economic Snapshot: California
**Includes Bureau of Labor Statistics jobs, unemployment and earnings data through June 2016**
**Last updated on July 22nd; July data will be released on August 19th**
Since February 2010, the national low point for private-sector employment, California businesses have
added 2,194,200 jobs (an increase of 18.7 percent). Nationally, private payrolls have increased by 13.8
percent over this time.
The state sectors with the greatest job gains in percentage terms since February 2010 are: construction at
34.4 percent (193,900 jobs), leisure and hospitality at 28.2 percent (418,000 jobs) and professional and
business services at 25.8 percent (528,200 jobs).
Jobs
In June, private-sector employment in California grew by 31,300 jobs. Over the past year, California
businesses have added 399,000 jobs. This compares with an increase of 394,300 jobs over the 12 months
through June 2015.
Unemployment is down 0.8 percentage point from one year earlier and is 6.8 percentage points below its
recent peak of 12.2 percent in October 2010.
There were 1,022,400 California residents unemployed in June 2016.
The unemployment rate in California was 5.4 percent in June 2016, up 0.2 percentage point from May. The
rate was 0.5 percentage point above the national rate of 4.9 percent.
Adjusting for inflation, state average hourly earnings have risen by 1.5 percent over the past year.
Nationally, real average hourly earnings have increased by 1.6 percent (not seasonally adjusted).
-150
-100
-50
0
50
100
150
Source: JEC Democratic staff calculations based on seasonally adjusted data from the Bureau of Labor Statistics
Private-Sector Job Growth in CaliforniaMonthly, Jan. 2008 - Jun. 2016, thousands
2008 2009 2010 2011 2012 2013 2014
Bush administration
Obama administration
2015 2016
JULY 2016

California United States
Private-Sector Jobs Added……………………………….Past 12 Months 399,000 2.3 million
Since Feb. 2010 2,194,200 14.8 million
Unemployment Rate …………………………………………………..June 2016 5.4% 4.9%
June 2015 6.2% 5.3%
Recession-Era Peak 12.2% 10.0%
Median Household Income (2014 $)…………………………………………………………….2014 $60,500 $53,700
2007 (Pre-Recession) $63,600 $57,400
Poverty Rate...………………………………………………………………..2014 15.8% 14.8%
2007 (Pre-Recession) 12.7% 12.5%
All Veterans' Unemployment Rate………………………….'2015 6.8% 4.6%
Post-9/11 Veterans' Unemployment Rate…………………………2015 10.6% 5.8%
Percentage Without Health Insurance...………………………………………………………….2014 12.4% 11.7%
2013 17.2% 14.5%
◙
◙
◙
◙
◙
◙
* Note: Because of methodological differences, total U.S. real GDP by state differs slightly from headline national GDP figures
Exports over the past 12 months are up 29.8 percent from their level in 2009 (inflation-adjusted).
In California, goods exports totaled $13.3 billion in May and $159.3 billion over the past year, down 0.7
percent from the 12 months ending in May 2015 (inflation-adjusted).
Exports
In May 2016, builders in California broke ground on 92,520 new housing units (seasonally adjusted annual
rate), bringing the average over the past 12 months to 92,011 units. That marks an increase of 1.5 percent
from the average over the prior 12 months.
Home prices in California increased by 7.3 percent from the first quarter of 2015 to the first quarter of 2016.
They are up 57.3 percent since their recent low in the third quarter of 2011.
Housing
Real gross domestic product (GDP) in California grew by 4.2 percent over the four quarters through the
fourth quarter of 2015, above the national average growth rate of 2.0 percent.*
State Gross Domestic Product
Since the official end of the Great Recession in the second quarter of 2009, California GDP growth has
averaged 2.4 percent at an annual rate, compared with a national average of 1.9 percent.
*** Note: state-level data changes may not be statistically significant due to sampling variation. Individual monthly readings should be
interpreted with caution and in the context of longer-term trends and other data that become available.
** A list of sources used to compile the California economic snapshot is available at: http://bit.ly/JEC-state-by-state-sources
**** For additional California-specific labor sector statistics, please refer to the California office: http://www.labormarketinfo.edd.ca.gov/
State Quick Facts

U.S. Congress Joint Economic Committee
◙
◙
◙
◙
◙
◙
◙
◙
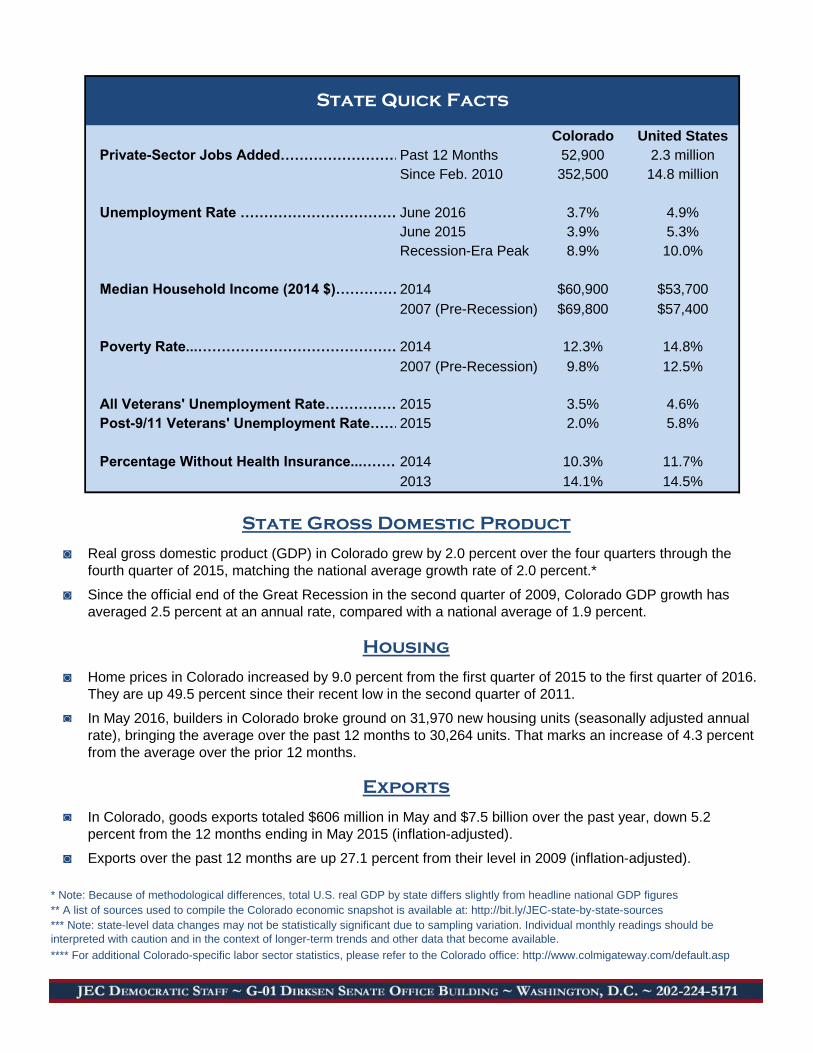
In June 2016, average hourly earnings of private-sector workers in Colorado were $26.84. The average
workweek was 33.7 hours, and average weekly earnings were $904.51.
Unemployment
Earnings
Economic Snapshot: Colorado
**Includes Bureau of Labor Statistics jobs, unemployment and earnings data through June 2016**
**Last updated on July 22nd; July data will be released on August 19th**
Since February 2010, the national low point for private-sector employment, Colorado businesses have
added 352,500 jobs (an increase of 19.4 percent). Nationally, private payrolls have increased by 13.8
percent over this time.
The state sectors with the greatest job gains in percentage terms since February 2010 are: construction at
36.5 percent (43,100 jobs), leisure and hospitality at 24.2 percent (63,100 jobs) and professional and
business services at 24.2 percent (79,400 jobs).
Jobs
In June, private-sector employment in Colorado grew by 5,100 jobs. Over the past year, Colorado
businesses have added 52,900 jobs. This compares with an increase of 67,800 jobs over the 12 months
through June 2015.
Unemployment is down 0.2 percentage point from one year earlier and is 5.2 percentage points below its
recent peak of 8.9 percent in October 2010.
There were 106,100 Colorado residents unemployed in June 2016.
The unemployment rate in Colorado was 3.7 percent in June 2016, up 0.4 percentage point from May. The
rate was 1.2 percentage points below the national rate of 4.9 percent.
Adjusting for inflation, state average hourly earnings have risen by 0.6 percent over the past year.
Nationally, real average hourly earnings have increased by 1.6 percent (not seasonally adjusted).
-25
-20
-15
-10
-5
0
5
10
15
Source: JEC Democratic staff calculations based on seasonally adjusted data from the Bureau of Labor Statistics
Private-Sector Job Growth in ColoradoMonthly, Jan. 2008 - Jun. 2016, thousands
2008 2009 2010 2011 2012 2013 2014
Bush administration
Obama administration
2015 2016
JULY 2016
Colorado United States
Private-Sector Jobs Added……………………………….Past 12 Months 52,900 2.3 million
Since Feb. 2010 352,500 14.8 million
Unemployment Rate …………………………………………………..June 2016 3.7% 4.9%
June 2015 3.9% 5.3%
Recession-Era Peak 8.9% 10.0%
Median Household Income (2014 $)…………………………………………………………….2014 $60,900 $53,700
2007 (Pre-Recession) $69,800 $57,400
Poverty Rate...………………………………………………………………..2014 12.3% 14.8%
2007 (Pre-Recession) 9.8% 12.5%
All Veterans' Unemployment Rate………………………….'2015 3.5% 4.6%
Post-9/11 Veterans' Unemployment Rate…………………………2015 2.0% 5.8%
Percentage Without Health Insurance...………………………………………………………….2014 10.3% 11.7%
2013 14.1% 14.5%
◙
◙
◙
◙
◙
◙
* Note: Because of methodological differences, total U.S. real GDP by state differs slightly from headline national GDP figures
Exports over the past 12 months are up 27.1 percent from their level in 2009 (inflation-adjusted).
In Colorado, goods exports totaled $606 million in May and $7.5 billion over the past year, down 5.2
percent from the 12 months ending in May 2015 (inflation-adjusted).
Exports
In May 2016, builders in Colorado broke ground on 31,970 new housing units (seasonally adjusted annual
rate), bringing the average over the past 12 months to 30,264 units. That marks an increase of 4.3 percent
from the average over the prior 12 months.
Home prices in Colorado increased by 9.0 percent from the first quarter of 2015 to the first quarter of 2016.
They are up 49.5 percent since their recent low in the second quarter of 2011.
Housing
Real gross domestic product (GDP) in Colorado grew by 2.0 percent over the four quarters through the
fourth quarter of 2015, matching the national average growth rate of 2.0 percent.*
State Gross Domestic Product
Since the official end of the Great Recession in the second quarter of 2009, Colorado GDP growth has
averaged 2.5 percent at an annual rate, compared with a national average of 1.9 percent.
*** Note: state-level data changes may not be statistically significant due to sampling variation. Individual monthly readings should be
interpreted with caution and in the context of longer-term trends and other data that become available.
** A list of sources used to compile the Colorado economic snapshot is available at: http://bit.ly/JEC-state-by-state-sources
**** For additional Colorado-specific labor sector statistics, please refer to the Colorado office: http://www.colmigateway.com/default.asp
State Quick Facts

U.S. Congress Joint Economic Committee
◙
◙
◙
◙
◙
◙
◙
◙
In June 2016, average hourly earnings of private-sector workers in Connecticut were $29.93. The average
workweek was 33.6 hours, and average weekly earnings were $1,005.65.
Unemployment
Earnings
Economic Snapshot: Connecticut
**Includes Bureau of Labor Statistics jobs, unemployment and earnings data through June 2016**
**Last updated on July 22nd; July data will be released on August 19th**
Since February 2010, the national low point for private-sector employment, Connecticut businesses have
added 106,200 jobs (an increase of 7.9 percent). Nationally, private payrolls have increased by 13.8
percent over this time.
The state sectors with the greatest job gains in percentage terms since February 2010 are: construction at
19.6 percent (9,600 jobs), leisure and hospitality at 17.3 percent (22,500 jobs) and professional and
business services at 15.5 percent (29,300 jobs).
Jobs
In June, private-sector employment in Connecticut grew by 6,000 jobs. Over the past year, Connecticut
businesses have added 16,400 jobs. This compares with an increase of 17,000 jobs over the 12 months
through June 2015.
Unemployment is up 0.3 percentage point from one year earlier but remains 3.4 percentage points below
its recent peak of 9.2 percent in February 2011.
There were 110,600 Connecticut residents unemployed in June 2016.
The unemployment rate in Connecticut was 5.8 percent in June 2016, up 0.1 percentage point from May.
The rate was 0.9 percentage point above the national rate of 4.9 percent.
Adjusting for inflation, state average hourly earnings have risen by 3.1 percent over the past year.
Nationally, real average hourly earnings have increased by 1.6 percent (not seasonally adjusted).
-20
-15
-10
-5
0
5
10
Source: JEC Democratic staff calculations based on seasonally adjusted data from the Bureau of Labor Statistics
Private-Sector Job Growth in ConnecticutMonthly, Jan. 2008 - Jun. 2016, thousands
2008 2009 2010 2011 2012 2013 2014
Bush administration
Obama administration
2015 2016
JULY 2016

Connecticut United States
Private-Sector Jobs Added……………………………….Past 12 Months 16,400 2.3 million
Since Feb. 2010 106,200 14.8 million
Unemployment Rate …………………………………………………..June 2016 5.8% 4.9%
June 2015 5.5% 5.3%
Recession-Era Peak 9.2% 10.0%
Median Household Income (2014 $)…………………………………………………………….2014 $70,200 $53,700
2007 (Pre-Recession) $73,200 $57,400
Poverty Rate...………………………………………………………………..2014 8.6% 14.8%
2007 (Pre-Recession) 8.9% 12.5%
All Veterans' Unemployment Rate………………………….'2015 4.6% 4.6%
Post-9/11 Veterans' Unemployment Rate…………………………2015 1.4% 5.8%
Percentage Without Health Insurance...………………………………………………………….2014 6.9% 11.7%
2013 9.4% 14.5%
◙
◙
◙
◙
◙
◙
* Note: Because of methodological differences, total U.S. real GDP by state differs slightly from headline national GDP figures
Exports over the past 12 months are up 2.4 percent from their level in 2009 (inflation-adjusted).
In Connecticut, goods exports totaled $1.2 billion in May and $14.7 billion over the past year, down 0.9
percent from the 12 months ending in May 2015 (inflation-adjusted).
Exports
In May 2016, builders in Connecticut broke ground on 3,320 new housing units (seasonally adjusted annual
rate), bringing the average over the past 12 months to 6,118 units. That marks an increase of 29.1 percent
from the average over the prior 12 months.
Home prices in Connecticut increased by 0.8 percent from the first quarter of 2015 to the first quarter of
2016. They are up 4.6 percent since their recent low in the second quarter of 2012.
Housing
Real gross domestic product (GDP) in Connecticut grew by 0.4 percent over the four quarters through the
fourth quarter of 2015, below the national average growth rate of 2.0 percent.*
State Gross Domestic Product
Since the official end of the Great Recession in the second quarter of 2009, Connecticut GDP growth has
averaged 0.3 percent at an annual rate, compared with a national average of 1.9 percent.
*** Note: state-level data changes may not be statistically significant due to sampling variation. Individual monthly readings should be
interpreted with caution and in the context of longer-term trends and other data that become available.
** A list of sources used to compile the Connecticut economic snapshot is available at: http://bit.ly/JEC-state-by-state-sources
**** For additional Connecticut-specific labor sector statistics, please refer to the Connecticut office: http://www1.ctdol.state.ct.us/lmi/
State Quick Facts
U.S. Congress Joint Economic Committee
◙
◙
◙
◙
◙
◙
◙
◙
In June 2016, average hourly earnings of private-sector workers in Delaware were $23.82. The average
workweek was 33.5 hours, and average weekly earnings were $797.97.
Unemployment
Earnings
Economic Snapshot: Delaware
**Includes Bureau of Labor Statistics jobs, unemployment and earnings data through June 2016**
**Last updated on July 22nd; July data will be released on August 19th**
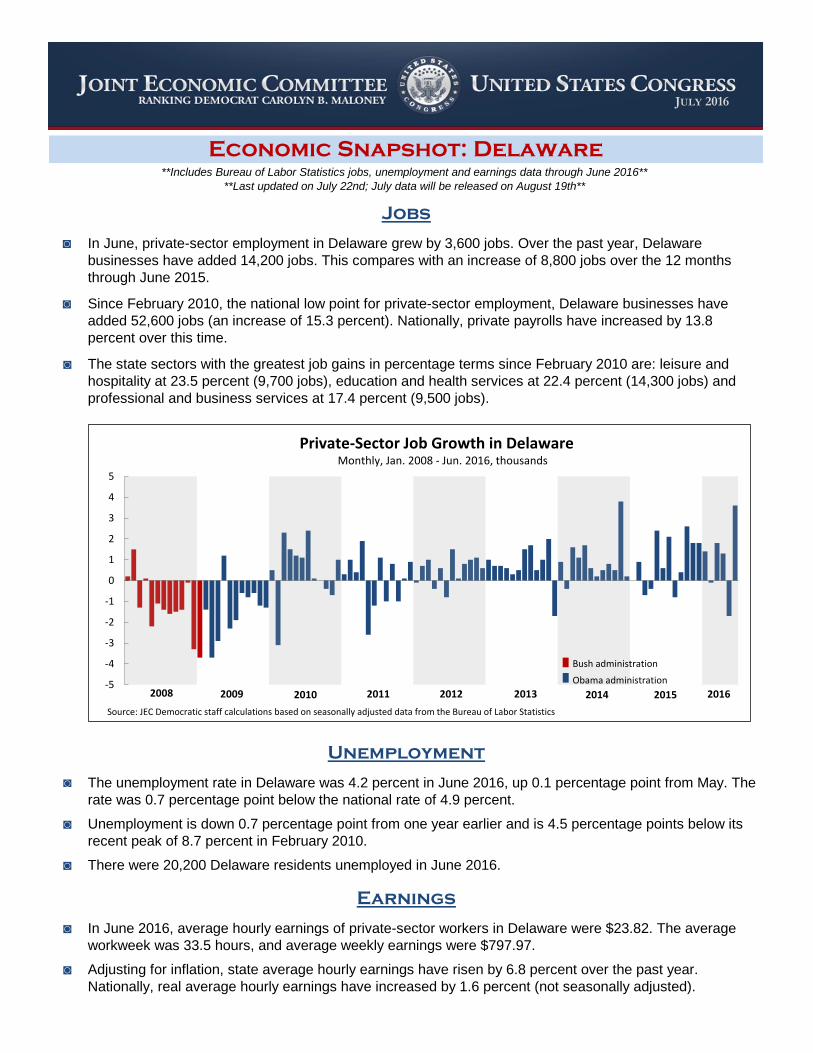
Since February 2010, the national low point for private-sector employment, Delaware businesses have
added 52,600 jobs (an increase of 15.3 percent). Nationally, private payrolls have increased by 13.8
percent over this time.
The state sectors with the greatest job gains in percentage terms since February 2010 are: leisure and
hospitality at 23.5 percent (9,700 jobs), education and health services at 22.4 percent (14,300 jobs) and
professional and business services at 17.4 percent (9,500 jobs).
Jobs
In June, private-sector employment in Delaware grew by 3,600 jobs. Over the past year, Delaware
businesses have added 14,200 jobs. This compares with an increase of 8,800 jobs over the 12 months
through June 2015.
Unemployment is down 0.7 percentage point from one year earlier and is 4.5 percentage points below its
recent peak of 8.7 percent in February 2010.
There were 20,200 Delaware residents unemployed in June 2016.
The unemployment rate in Delaware was 4.2 percent in June 2016, up 0.1 percentage point from May. The
rate was 0.7 percentage point below the national rate of 4.9 percent.
Adjusting for inflation, state average hourly earnings have risen by 6.8 percent over the past year.
Nationally, real average hourly earnings have increased by 1.6 percent (not seasonally adjusted).
-5
-4
-3
-2
-1
0
1
2
3
4
5
Source: JEC Democratic staff calculations based on seasonally adjusted data from the Bureau of Labor Statistics
Private-Sector Job Growth in DelawareMonthly, Jan. 2008 - Jun. 2016, thousands
2008 2009 2010 2011 2012 2013 2014
Bush administration
Obama administration
2015 2016
JULY 2016
Delaware United States
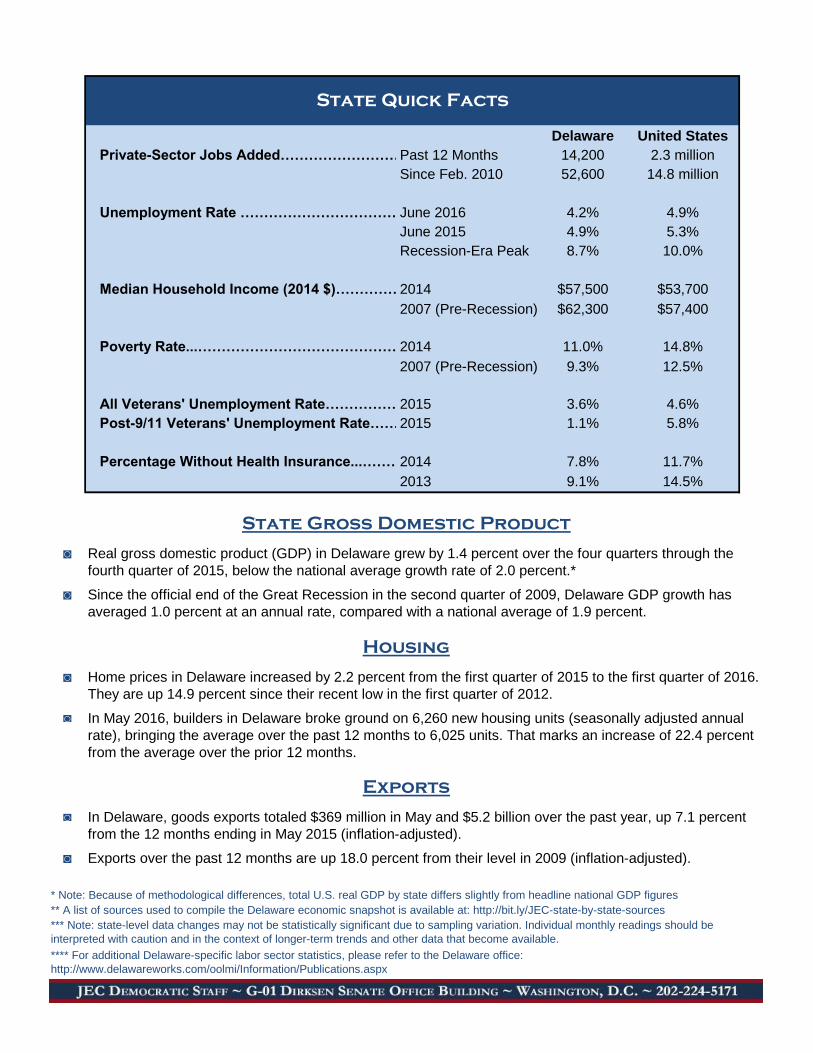
Private-Sector Jobs Added……………………………….Past 12 Months 14,200 2.3 million
Since Feb. 2010 52,600 14.8 million
Unemployment Rate …………………………………………………..June 2016 4.2% 4.9%
June 2015 4.9% 5.3%
Recession-Era Peak 8.7% 10.0%
Median Household Income (2014 $)…………………………………………………………….2014 $57,500 $53,700
2007 (Pre-Recession) $62,300 $57,400
Poverty Rate...………………………………………………………………..2014 11.0% 14.8%
2007 (Pre-Recession) 9.3% 12.5%
All Veterans' Unemployment Rate………………………….'2015 3.6% 4.6%
Post-9/11 Veterans' Unemployment Rate…………………………2015 1.1% 5.8%
Percentage Without Health Insurance...………………………………………………………….2014 7.8% 11.7%
2013 9.1% 14.5%
◙
◙
◙
◙
◙
◙
* Note: Because of methodological differences, total U.S. real GDP by state differs slightly from headline national GDP figures
Exports over the past 12 months are up 18.0 percent from their level in 2009 (inflation-adjusted).
In Delaware, goods exports totaled $369 million in May and $5.2 billion over the past year, up 7.1 percent
from the 12 months ending in May 2015 (inflation-adjusted).
Exports
In May 2016, builders in Delaware broke ground on 6,260 new housing units (seasonally adjusted annual
rate), bringing the average over the past 12 months to 6,025 units. That marks an increase of 22.4 percent
from the average over the prior 12 months.
Home prices in Delaware increased by 2.2 percent from the first quarter of 2015 to the first quarter of 2016.
They are up 14.9 percent since their recent low in the first quarter of 2012.
Housing
Real gross domestic product (GDP) in Delaware grew by 1.4 percent over the four quarters through the
fourth quarter of 2015, below the national average growth rate of 2.0 percent.*
State Gross Domestic Product
Since the official end of the Great Recession in the second quarter of 2009, Delaware GDP growth has
averaged 1.0 percent at an annual rate, compared with a national average of 1.9 percent.
*** Note: state-level data changes may not be statistically significant due to sampling variation. Individual monthly readings should be
interpreted with caution and in the context of longer-term trends and other data that become available.
** A list of sources used to compile the Delaware economic snapshot is available at: http://bit.ly/JEC-state-by-state-sources
**** For additional Delaware-specific labor sector statistics, please refer to the Delaware office:
http://www.delawareworks.com/oolmi/Information/Publications.aspx
State Quick Facts

U.S. Congress Joint Economic Committee
◙
◙
◙
◙
◙
◙
◙
◙
In June 2016, average hourly earnings of private-sector workers in the District of Columbia were $37.86.
The average workweek was 35.5 hours, and average weekly earnings were $1,344.03.
Unemployment
Earnings
Economic Snapshot: The District Of Columbia
**Includes Bureau of Labor Statistics jobs, unemployment and earnings data through June 2016**
**Last updated on July 22nd; July data will be released on August 19th**
Since February 2010, the national low point for private-sector employment, District of Columbia businesses
have added 74,300 jobs (an increase of 16.2 percent). Nationally, private payrolls have increased by 13.8
percent over this time.
The DC sectors with the greatest job gains in percentage terms since February 2010 are: logging, mining
and construction at 50.5 percent (4,800 jobs), leisure and hospitality at 27.1 percent (15,800 jobs) and
trade, transportation and utilities at 26.0 percent (6,900 jobs).
Jobs
In June, private-sector employment in the District of Columbia fell by 6,300 jobs. Over the past year,
District of Columbia businesses have added 3,000 jobs. This compares with an increase of 11,400 jobs
over the 12 months through June 2015.
Unemployment is down 0.9 percentage point from one year earlier and is 4.5 percentage points below its
recent peak of 10.5 percent in June 2011.
There were 23,700 District of Columbia residents unemployed in June 2016.
The unemployment rate in the District of Columbia was 6.0 percent in June 2016, down 0.1 percentage
point from May. The rate was 1.1 percentage points above the national rate of 4.9 percent.
Adjusting for inflation, DC average hourly earnings have fallen by 2.1 percent over the past year.
Nationally, real average hourly earnings have increased by 1.6 percent (not seasonally adjusted).
-8
-6
-4
-2
0
2
4
6
8
Source: JEC Democratic staff calculations based on seasonally adjusted data from the Bureau of Labor Statistics
Private-Sector Job Growth in the District of ColumbiaMonthly, Jan. 2008 - Jun. 2016, thousands
2008 2009 2010 2011 2012 2013 2014
Bush administration
Obama administration
2015 2016
JULY 2016

District United States
Private-Sector Jobs Added……………………………….Past 12 Months 3,000 2.3 million
Since Feb. 2010 74,300 14.8 million
Unemployment Rate …………………………………………………..June 2016 6.0% 4.9%
June 2015 6.9% 5.3%
Recession-Era Peak 10.5% 10.0%
Median Household Income (2014 $)…………………………………………………………….2014 $68,300 $53,700
2007 (Pre-Recession) $58,000 $57,400
Poverty Rate...………………………………………………………………..2014 19.0% 14.8%
2007 (Pre-Recession) 18.0% 12.5%
All Veterans' Unemployment Rate………………………….'2015 7.7% 4.6%
Post-9/11 Veterans' Unemployment Rate…………………………2015 3.1% 5.8%
Percentage Without Health Insurance...………………………………………………………….2014 5.3% 11.7%
2013 6.7% 14.5%
◙
◙
◙
◙
◙
◙
* Note: Because of methodological differences, total U.S. real GDP by state differs slightly from headline national GDP figures
Exports over the past 12 months are up 4.7 percent from their level in 2009 (inflation-adjusted).
In the District of Columbia, goods exports totaled $61 million in May and $1.2 billion over the past year, up
106.8 percent from the 12 months ending in May 2015 (inflation-adjusted).
Exports
In May 2016, builders in the District of Columbia broke ground on 4,380 new housing units (seasonally
adjusted annual rate), bringing the average over the past 12 months to 4,304 units. That marks an increase
of 0.8 percent from the average over the prior 12 months.
Home prices in the District of Columbia increased by 0.7 percent from the first quarter of 2015 to the first
quarter of 2016. They are up 46.4 percent since their recent low in the second quarter of 2010.
Housing
Real gross domestic product (GDP) in the District of Columbia grew by 3.1 percent over the four quarters
through the fourth quarter of 2015, above the national average growth rate of 2.0 percent.*
State Gross Domestic Product
Since the official end of the Great Recession in the second quarter of 2009, District of Columbia GDP
growth has averaged 1.3 percent at an annual rate, compared with a national average of 1.9 percent.
*** Note: state-level data changes may not be statistically significant due to sampling variation. Individual monthly readings should be
interpreted with caution and in the context of longer-term trends and other data that become available.
** A list of sources used to compile the District of Columbia economic snapshot is available at: http://bit.ly/JEC-state-by-state-sources
**** For additional District of Columbia-specific labor sector statistics, please refer to the District of Columbia office:
http://does.dc.gov/node/184512
District of Columbia

U.S. Congress Joint Economic Committee
◙
◙
◙
◙
◙
◙
◙
◙
In June 2016, average hourly earnings of private-sector workers in Florida were $23.24. The average
workweek was 33.9 hours, and average weekly earnings were $787.84.
Unemployment
Earnings
Economic Snapshot: Florida
**Includes Bureau of Labor Statistics jobs, unemployment and earnings data through June 2016**
**Last updated on July 22nd; July data will be released on August 19th**
Since February 2010, the national low point for private-sector employment, Florida businesses have added
1,205,400 jobs (an increase of 20.0 percent). Nationally, private payrolls have increased by 13.8 percent
over this time.
The state sectors with the greatest job gains in percentage terms since February 2010 are: professional
and business services at 27.9 percent (276,100 jobs), construction at 27.6 percent (98,100 jobs) and
leisure and hospitality at 27.1 percent (249,500 jobs).
Jobs
In June, private-sector employment in Florida grew by 6,600 jobs. Over the past year, Florida businesses
have added 226,900 jobs. This compares with an increase of 266,600 jobs over the 12 months through
June 2015.
Unemployment is down 0.6 percentage point from one year earlier and is 6.5 percentage points below its
recent peak of 11.2 percent in January 2010.
There were 453,100 Florida residents unemployed in June 2016.
The unemployment rate in Florida was 4.7 percent in June 2016, holding constant from May. The rate was
0.2 percentage point below the national rate of 4.9 percent.
Adjusting for inflation, state average hourly earnings have risen by 2.7 percent over the past year.
Nationally, real average hourly earnings have increased by 1.6 percent (not seasonally adjusted).
-80
-60
-40
-20
0
20
40
Source: JEC Democratic staff calculations based on seasonally adjusted data from the Bureau of Labor Statistics
Private-Sector Job Growth in FloridaMonthly, Jan. 2008 - Jun. 2016, thousands
2008 2009 2010 2011 2012 2013 2014
Bush administration
Obama administration
2015 2016
JULY 2016

Florida United States
Private-Sector Jobs Added……………………………….Past 12 Months 226,900 2.3 million
Since Feb. 2010 1,205,400 14.8 million
Unemployment Rate …………………………………………………..June 2016 4.7% 4.9%
June 2015 5.3% 5.3%
Recession-Era Peak 11.2% 10.0%
Median Household Income (2014 $)…………………………………………………………….2014 $46,100 $53,700
2007 (Pre-Recession) $52,300 $57,400
Poverty Rate...………………………………………………………………..2014 16.7% 14.8%
2007 (Pre-Recession) 12.5% 12.5%
All Veterans' Unemployment Rate………………………….'2015 5.4% 4.6%
Post-9/11 Veterans' Unemployment Rate…………………………2015 6.7% 5.8%
Percentage Without Health Insurance...………………………………………………………….2014 16.6% 11.7%
2013 20.0% 14.5%
◙
◙
◙
◙
◙
◙
* Note: Because of methodological differences, total U.S. real GDP by state differs slightly from headline national GDP figures
Exports over the past 12 months are up 7.1 percent from their level in 2009 (inflation-adjusted).
In Florida, goods exports totaled $4.6 billion in May and $51.4 billion over the past year, down 4.9 percent
from the 12 months ending in May 2015 (inflation-adjusted).
Exports
In May 2016, builders in Florida broke ground on 103,670 new housing units (seasonally adjusted annual
rate), bringing the average over the past 12 months to 110,990 units. That marks an increase of 25.4
percent from the average over the prior 12 months.
Home prices in Florida increased by 11.2 percent from the first quarter of 2015 to the first quarter of 2016.
They are up 53.6 percent since their recent low in the second quarter of 2011.
Housing
Real gross domestic product (GDP) in Florida grew by 3.4 percent over the four quarters through the fourth
quarter of 2015, above the national average growth rate of 2.0 percent.*
State Gross Domestic Product
Since the official end of the Great Recession in the second quarter of 2009, Florida GDP growth has
averaged 1.7 percent at an annual rate, compared with a national average of 1.9 percent.
*** Note: state-level data changes may not be statistically significant due to sampling variation. Individual monthly readings should be
interpreted with caution and in the context of longer-term trends and other data that become available.
** A list of sources used to compile the Florida economic snapshot is available at: http://bit.ly/JEC-state-by-state-sources
**** For additional Florida-specific labor sector statistics, please refer to the Florida office: http://www.floridajobs.org/labor-market-
information/labor-market-information-press-releases/monthly-press-releases
State Quick Facts

U.S. Congress Joint Economic Committee
◙
◙
◙
◙
◙
◙
◙
◙
In June 2016, average hourly earnings of private-sector workers in Georgia were $24.16. The average
workweek was 34.9 hours, and average weekly earnings were $843.18.
Unemployment
Earnings
Economic Snapshot: Georgia
**Includes Bureau of Labor Statistics jobs, unemployment and earnings data through June 2016**
**Last updated on July 22nd; July data will be released on August 19th**
Since February 2010, the national low point for private-sector employment, Georgia businesses have
added 563,100 jobs (an increase of 17.9 percent). Nationally, private payrolls have increased by 13.8
percent over this time.
The state sectors with the greatest job gains in percentage terms since February 2010 are: professional
and business services at 30.7 percent (158,600 jobs), leisure and hospitality at 27.1 percent (100,600 jobs)
and construction at 17.6 percent (26,700 jobs).
Jobs
In June, private-sector employment in Georgia grew by 10,100 jobs. Over the past year, Georgia
businesses have added 116,300 jobs. This compares with an increase of 127,200 jobs over the 12 months
through June 2015.
Unemployment is down 0.7 percentage point from one year earlier and is 5.4 percentage points below its
recent peak of 10.5 percent in December 2010.
There were 249,700 Georgia residents unemployed in June 2016.
The unemployment rate in Georgia was 5.1 percent in June 2016, down 0.2 percentage point from May.
The rate was 0.2 percentage point above the national rate of 4.9 percent.
Adjusting for inflation, state average hourly earnings have risen by 2.3 percent over the past year.
Nationally, real average hourly earnings have increased by 1.6 percent (not seasonally adjusted).
-40
-30
-20
-10
0
10
20
30
40
50
Source: JEC Democratic staff calculations based on seasonally adjusted data from the Bureau of Labor Statistics
Private-Sector Job Growth in GeorgiaMonthly, Jan. 2008 - Jun. 2016, thousands
2008 2009 2010 2011 2012 2013 2014
Bush administration
Obama administration
2015 2016
JULY 2016

Georgia United States
Private-Sector Jobs Added……………………………….Past 12 Months 116,300 2.3 million
Since Feb. 2010 563,100 14.8 million
Unemployment Rate …………………………………………………..June 2016 5.1% 4.9%
June 2015 5.8% 5.3%
Recession-Era Peak 10.5% 10.0%
Median Household Income (2014 $)…………………………………………………………….2014 $49,600 $53,700
2007 (Pre-Recession) $55,500 $57,400
Poverty Rate...………………………………………………………………..2014 16.8% 14.8%
2007 (Pre-Recession) 13.6% 12.5%
All Veterans' Unemployment Rate………………………….'2015 4.9% 4.6%
Post-9/11 Veterans' Unemployment Rate…………………………2015 7.8% 5.8%
Percentage Without Health Insurance...………………………………………………………….2014 15.8% 11.7%
2013 18.8% 14.5%
◙
◙
◙
◙
◙
◙
* Note: Because of methodological differences, total U.S. real GDP by state differs slightly from headline national GDP figures
Exports over the past 12 months are up 52.0 percent from their level in 2009 (inflation-adjusted).
In Georgia, goods exports totaled $2.9 billion in May and $37.1 billion over the past year, up 1.7 percent
from the 12 months ending in May 2015 (inflation-adjusted).
Exports
In May 2016, builders in Georgia broke ground on 49,200 new housing units (seasonally adjusted annual
rate), bringing the average over the past 12 months to 47,985 units. That marks an increase of 29.5
percent from the average over the prior 12 months.
Home prices in Georgia increased by 6.4 percent from the first quarter of 2015 to the first quarter of 2016.
They are up 38.3 percent since their recent low in the second quarter of 2011.
Housing
Real gross domestic product (GDP) in Georgia grew by 2.7 percent over the four quarters through the
fourth quarter of 2015, above the national average growth rate of 2.0 percent.*
State Gross Domestic Product
Since the official end of the Great Recession in the second quarter of 2009, Georgia GDP growth has
averaged 1.6 percent at an annual rate, compared with a national average of 1.9 percent.
*** Note: state-level data changes may not be statistically significant due to sampling variation. Individual monthly readings should be
interpreted with caution and in the context of longer-term trends and other data that become available.
** A list of sources used to compile the Georgia economic snapshot is available at: http://bit.ly/JEC-state-by-state-sources
**** For additional Georgia-specific labor sector statistics, please refer to the Georgia office: http://explorer.dol.state.ga.us/
State Quick Facts

U.S. Congress Joint Economic Committee
◙
◙
◙
◙
◙
◙
◙
◙
In June 2016, average hourly earnings of private-sector workers in Hawaii were $25.48. The average
workweek was 32.3 hours, and average weekly earnings were $823.00.
Unemployment
Earnings
Economic Snapshot: Hawaii
**Includes Bureau of Labor Statistics jobs, unemployment and earnings data through June 2016**
**Last updated on July 22nd; July data will be released on August 19th**
Since February 2010, the national low point for private-sector employment, Hawaii businesses have added
64,500 jobs (an increase of 14.0 percent). Nationally, private payrolls have increased by 13.8 percent over
this time.
The state sectors with the greatest job gains in percentage terms since February 2010 are: logging, mining
and construction at 36.5 percent (10,700 jobs), professional and business services at 19.8 percent (14,000
jobs) and leisure and hospitality at 18.3 percent (18,300 jobs).
Jobs
In June, private-sector employment in Hawaii grew by 3,500 jobs. Over the past year, Hawaii businesses
have added 14,800 jobs. This compares with an increase of 10,400 jobs over the 12 months through June
2015.
Unemployment is down 0.3 percentage point from one year earlier and is 4.0 percentage points below its
recent peak of 7.3 percent in October 2009.
There were 22,900 Hawaii residents unemployed in June 2016.
The unemployment rate in Hawaii was 3.3 percent in June 2016, up 0.1 percentage point from May. The
rate was 1.6 percentage points below the national rate of 4.9 percent.
Adjusting for inflation, state average hourly earnings have risen by 3.2 percent over the past year.
Nationally, real average hourly earnings have increased by 1.6 percent (not seasonally adjusted).
-6
-4
-2
0
2
4
6
Source: JEC Democratic staff calculations based on seasonally adjusted data from the Bureau of Labor Statistics
Private-Sector Job Growth in HawaiiMonthly, Jan. 2008 - Jun. 2016, thousands
2008 2009 2010 2011 2012 2013 2014
Bush administration
Obama administration
2015 2016
JULY 2016

Hawaii United States
Private-Sector Jobs Added……………………………….Past 12 Months 14,800 2.3 million
Since Feb. 2010 64,500 14.8 million
Unemployment Rate …………………………………………………..June 2016 3.3% 4.9%
June 2015 3.6% 5.3%
Recession-Era Peak 7.3% 10.0%
Median Household Income (2014 $)…………………………………………………………….2014 $71,200 $53,700
2007 (Pre-Recession) $73,100 $57,400
Poverty Rate...………………………………………………………………..2014 10.8% 14.8%
2007 (Pre-Recession) 7.5% 12.5%
All Veterans' Unemployment Rate………………………….'2015 2.5% 4.6%
Post-9/11 Veterans' Unemployment Rate…………………………2015 2.5% 5.8%
Percentage Without Health Insurance...………………………………………………………….2014 5.3% 11.7%
2013 6.7% 14.5%
◙
◙
◙
◙
◙
◙
* Note: Because of methodological differences, total U.S. real GDP by state differs slightly from headline national GDP figures
Exports over the past 12 months are up 200.9 percent from their level in 2009 (inflation-adjusted).
In Hawaii, goods exports totaled $64 million in May and $1.7 billion over the past year, up 14.0 percent
from the 12 months ending in May 2015 (inflation-adjusted).
Exports
In May 2016, builders in Hawaii broke ground on 2,100 new housing units (seasonally adjusted annual
rate), bringing the average over the past 12 months to 3,958 units. That marks a decrease of 18.8 percent
from the average over the prior 12 months.
Home prices in Hawaii increased by 6.3 percent from the first quarter of 2015 to the first quarter of 2016.
They are up 43.6 percent since their recent low in the first quarter of 2011.
Housing
Real gross domestic product (GDP) in Hawaii grew by 2.0 percent over the four quarters through the fourth
quarter of 2015, matching the national average growth rate of 2.0 percent.*
State Gross Domestic Product
Since the official end of the Great Recession in the second quarter of 2009, Hawaii GDP growth has
averaged 1.4 percent at an annual rate, compared with a national average of 1.9 percent.
*** Note: state-level data changes may not be statistically significant due to sampling variation. Individual monthly readings should be
interpreted with caution and in the context of longer-term trends and other data that become available.
** A list of sources used to compile the Hawaii economic snapshot is available at: http://bit.ly/JEC-state-by-state-sources
**** For additional Hawaii-specific labor sector statistics, please refer to the Hawaii office: http://hawaii.gov/labor/
State Quick Facts

U.S. Congress Joint Economic Committee
◙
◙
◙
◙
◙
◙
◙
◙
In June 2016, average hourly earnings of private-sector workers in Idaho were $22.14. The average
workweek was 33.1 hours, and average weekly earnings were $732.83.
Unemployment
Earnings
Economic Snapshot: Idaho
**Includes Bureau of Labor Statistics jobs, unemployment and earnings data through June 2016**
**Last updated on July 22nd; July data will be released on August 19th**
Since February 2010, the national low point for private-sector employment, Idaho businesses have added
87,200 jobs (an increase of 18.1 percent). Nationally, private payrolls have increased by 13.8 percent over
this time.
The state sectors with the greatest job gains in percentage terms since February 2010 are: construction at
26.8 percent (8,600 jobs), leisure and hospitality at 22.8 percent (13,100 jobs) and education and health
services at 20.9 percent (17,300 jobs).
Jobs
In June, private-sector employment in Idaho grew by 900 jobs. Over the past year, Idaho businesses have
added 16,700 jobs. This compares with an increase of 16,900 jobs over the 12 months through June 2015.
Unemployment is down 0.5 percentage point from one year earlier and is 6.0 percentage points below its
recent peak of 9.7 percent in July 2009.
There were 30,400 Idaho residents unemployed in June 2016.
The unemployment rate in Idaho was 3.7 percent in June 2016, holding constant from May. The rate was
1.2 percentage points below the national rate of 4.9 percent.
Adjusting for inflation, state average hourly earnings have risen by 0.1 percent over the past year.
Nationally, real average hourly earnings have increased by 1.6 percent (not seasonally adjusted).
-8
-6
-4
-2
0
2
4
6
8
Source: JEC Democratic staff calculations based on seasonally adjusted data from the Bureau of Labor Statistics
Private-Sector Job Growth in IdahoMonthly, Jan. 2008 - Jun. 2016, thousands
2008 2009 2010 2011 2012 2013 2014
Bush administration
Obama administration
2015 2016
JULY 2016

Idaho United States
Private-Sector Jobs Added……………………………….Past 12 Months 16,700 2.3 million
Since Feb. 2010 87,200 14.8 million
Unemployment Rate …………………………………………………..June 2016 3.7% 4.9%
June 2015 4.2% 5.3%
Recession-Era Peak 9.7% 10.0%
Median Household Income (2014 $)…………………………………………………………….2014 $53,400 $53,700
2007 (Pre-Recession) $56,200 $57,400
Poverty Rate...………………………………………………………………..2014 12.4% 14.8%
2007 (Pre-Recession) 9.9% 12.5%
All Veterans' Unemployment Rate………………………….'2015 4.0% 4.6%
Post-9/11 Veterans' Unemployment Rate…………………………2015 9.2% 5.8%
Percentage Without Health Insurance...………………………………………………………….2014 13.6% 11.7%
2013 16.2% 14.5%
◙
◙
◙
◙
◙
◙
* Note: Because of methodological differences, total U.S. real GDP by state differs slightly from headline national GDP figures
Exports over the past 12 months are up 9.9 percent from their level in 2009 (inflation-adjusted).
In Idaho, goods exports totaled $380 million in May and $4.4 billion over the past year, up 2.8 percent from
the 12 months ending in May 2015 (inflation-adjusted).
Exports
In May 2016, builders in Idaho broke ground on 12,410 new housing units (seasonally adjusted annual
rate), bringing the average over the past 12 months to 9,538 units. That marks an increase of 5.6 percent
from the average over the prior 12 months.
Home prices in Idaho increased by 7.9 percent from the first quarter of 2015 to the first quarter of 2016.
They are up 42.5 percent since their recent low in the second quarter of 2011.
Housing
Real gross domestic product (GDP) in Idaho grew by 1.3 percent over the four quarters through the fourth
quarter of 2015, below the national average growth rate of 2.0 percent.*
State Gross Domestic Product
Since the official end of the Great Recession in the second quarter of 2009, Idaho GDP growth has
averaged 1.6 percent at an annual rate, compared with a national average of 1.9 percent.
*** Note: state-level data changes may not be statistically significant due to sampling variation. Individual monthly readings should be
interpreted with caution and in the context of longer-term trends and other data that become available.
** A list of sources used to compile the Idaho economic snapshot is available at: http://bit.ly/JEC-state-by-state-sources
**** For additional Idaho-specific labor sector statistics, please refer to the Idaho office:
http://labor.idaho.gov/dnn/Default.aspx?tabid=696&AspxAutoDetectCookieSupport=1
State Quick Facts

U.S. Congress Joint Economic Committee
◙
◙
◙
◙
◙
◙
◙
◙
In June 2016, average hourly earnings of private-sector workers in Illinois were $26.16. The average
workweek was 34.2 hours, and average weekly earnings were $894.67.
Unemployment
Earnings
Economic Snapshot: Illinois
**Includes Bureau of Labor Statistics jobs, unemployment and earnings data through June 2016**
**Last updated on July 22nd; July data will be released on August 19th**
Since February 2010, the national low point for private-sector employment, Illinois businesses have added
446,100 jobs (an increase of 9.4 percent). Nationally, private payrolls have increased by 13.8 percent over
this time.
The state sectors with the greatest job gains in percentage terms since February 2010 are: professional
and business services at 20.0 percent (156,000 jobs), leisure and hospitality at 15.9 percent (81,500 jobs)
and education and health services at 9.7 percent (80,100 jobs).
Jobs
In June, private-sector employment in Illinois fell by 2,300 jobs. Over the past year, Illinois businesses have
added 42,700 jobs. This compares with an increase of 82,600 jobs over the 12 months through June 2015.
Unemployment is up 0.4 percentage point from one year earlier but remains 5.0 percentage points below
its recent peak of 11.2 percent in January 2010.
There were 409,300 Illinois residents unemployed in June 2016.
The unemployment rate in Illinois was 6.2 percent in June 2016, down 0.2 percentage point from May. The
rate was 1.3 percentage points above the national rate of 4.9 percent.
Adjusting for inflation, state average hourly earnings have risen by 1.1 percent over the past year.
Nationally, real average hourly earnings have increased by 1.6 percent (not seasonally adjusted).
-60
-50
-40
-30
-20
-10
0
10
20
30
Source: JEC Democratic staff calculations based on seasonally adjusted data from the Bureau of Labor Statistics
Private-Sector Job Growth in IllinoisMonthly, Jan. 2008 - Jun. 2016, thousands
2008 2009 2010 2011 2012 2013 2014
Bush administration
Obama administration
2015 2016
JULY 2016

Illinois United States
Private-Sector Jobs Added……………………………….Past 12 Months 42,700 2.3 million
Since Feb. 2010 446,100 14.8 million
Unemployment Rate …………………………………………………..June 2016 6.2% 4.9%
June 2015 5.8% 5.3%
Recession-Era Peak 11.2% 10.0%
Median Household Income (2014 $)…………………………………………………………….2014 $54,900 $53,700
2007 (Pre-Recession) $60,000 $57,400
Poverty Rate...………………………………………………………………..2014 13.7% 14.8%
2007 (Pre-Recession) 10.0% 12.5%
All Veterans' Unemployment Rate………………………….'2015 5.0% 4.6%
Post-9/11 Veterans' Unemployment Rate…………………………2015 5.8% 5.8%
Percentage Without Health Insurance...………………………………………………………….2014 9.7% 11.7%
2013 12.7% 14.5%
◙
◙
◙
◙
◙
◙
* Note: Because of methodological differences, total U.S. real GDP by state differs slightly from headline national GDP figures
Exports over the past 12 months are up 43.1 percent from their level in 2009 (inflation-adjusted).
In Illinois, goods exports totaled $4.8 billion in May and $60.7 billion over the past year, down 1.5 percent
from the 12 months ending in May 2015 (inflation-adjusted).
Exports
In May 2016, builders in Illinois broke ground on 21,910 new housing units (seasonally adjusted annual
rate), bringing the average over the past 12 months to 20,407 units. That marks an increase of 6.7 percent
from the average over the prior 12 months.
Home prices in Illinois increased by 3.4 percent from the first quarter of 2015 to the first quarter of 2016.
They are up 14.8 percent since their recent low in the fourth quarter of 2011.
Housing
Real gross domestic product (GDP) in Illinois grew by 2.5 percent over the four quarters through the fourth
quarter of 2015, above the national average growth rate of 2.0 percent.*
State Gross Domestic Product
Since the official end of the Great Recession in the second quarter of 2009, Illinois GDP growth has
averaged 1.2 percent at an annual rate, compared with a national average of 1.9 percent.
*** Note: state-level data changes may not be statistically significant due to sampling variation. Individual monthly readings should be
interpreted with caution and in the context of longer-term trends and other data that become available.
** A list of sources used to compile the Illinois economic snapshot is available at: http://bit.ly/JEC-state-by-state-sources
**** For additional Illinois-specific labor sector statistics, please refer to the Illinois office: http://www.ides.illinois.gov/page.aspx?item=3528
State Quick Facts

U.S. Congress Joint Economic Committee
◙
◙
◙
◙
◙
◙
◙
◙
In June 2016, average hourly earnings of private-sector workers in Indiana were $23.22. The average
workweek was 34.7 hours, and average weekly earnings were $805.73.
Unemployment
Earnings
Economic Snapshot: Indiana
**Includes Bureau of Labor Statistics jobs, unemployment and earnings data through June 2016**
**Last updated on July 22nd; July data will be released on August 19th**
Since February 2010, the national low point for private-sector employment, Indiana businesses have added
302,800 jobs (an increase of 13.0 percent). Nationally, private payrolls have increased by 13.8 percent over
this time.
The state sectors with the greatest job gains in percentage terms since February 2010 are: professional
and business services at 18.7 percent (50,100 jobs), manufacturing at 17.7 percent (77,800 jobs) and
construction at 17.4 percent (19,700 jobs).
Jobs
In June, private-sector employment in Indiana grew by 3,600 jobs. Over the past year, Indiana businesses
have added 36,300 jobs. This compares with an increase of 49,000 jobs over the 12 months through June
2015.
Unemployment is up 0.1 percentage point from one year earlier but remains 6.1 percentage points below
its recent peak of 10.9 percent in February 2010.
There were 163,100 Indiana residents unemployed in June 2016.
The unemployment rate in Indiana was 4.8 percent in June 2016, down 0.2 percentage point from May.
The rate was 0.1 percentage point below the national rate of 4.9 percent.
Adjusting for inflation, state average hourly earnings have risen by 1.5 percent over the past year.
Nationally, real average hourly earnings have increased by 1.6 percent (not seasonally adjusted).
-50
-40
-30
-20
-10
0
10
20
Source: JEC Democratic staff calculations based on seasonally adjusted data from the Bureau of Labor Statistics
Private-Sector Job Growth in IndianaMonthly, Jan. 2008 - Jun. 2016, thousands
2008 2009 2010 2011 2012 2013 2014
Bush administration
Obama administration
2015 2016
JULY 2016

Indiana United States
Private-Sector Jobs Added……………………………….Past 12 Months 36,300 2.3 million
Since Feb. 2010 302,800 14.8 million
Unemployment Rate …………………………………………………..June 2016 4.8% 4.9%
June 2015 4.7% 5.3%
Recession-Era Peak 10.9% 10.0%
Median Household Income (2014 $)…………………………………………………………….2014 $48,100 $53,700
2007 (Pre-Recession) $54,200 $57,400
Poverty Rate...………………………………………………………………..2014 14.6% 14.8%
2007 (Pre-Recession) 11.8% 12.5%
All Veterans' Unemployment Rate………………………….'2015 2.4% 4.6%
Post-9/11 Veterans' Unemployment Rate…………………………2015 1.4% 5.8%
Percentage Without Health Insurance...………………………………………………………….2014 11.9% 11.7%
2013 14.0% 14.5%
◙
◙
◙
◙
◙
◙
* Note: Because of methodological differences, total U.S. real GDP by state differs slightly from headline national GDP figures
Exports over the past 12 months are up 44.9 percent from their level in 2009 (inflation-adjusted).
In Indiana, goods exports totaled $3.0 billion in May and $33.9 billion over the past year, up 3.2 percent
from the 12 months ending in May 2015 (inflation-adjusted).
Exports
In May 2016, builders in Indiana broke ground on 19,280 new housing units (seasonally adjusted annual
rate), bringing the average over the past 12 months to 18,000 units. That marks an increase of 3.6 percent
from the average over the prior 12 months.
Home prices in Indiana increased by 3.8 percent from the first quarter of 2015 to the first quarter of 2016.
They are up 17.1 percent since their recent low in the first quarter of 2011.
Housing
Real gross domestic product (GDP) in Indiana grew by 1.4 percent over the four quarters through the
fourth quarter of 2015, below the national average growth rate of 2.0 percent.*
State Gross Domestic Product
Since the official end of the Great Recession in the second quarter of 2009, Indiana GDP growth has
averaged 2.3 percent at an annual rate, compared with a national average of 1.9 percent.
*** Note: state-level data changes may not be statistically significant due to sampling variation. Individual monthly readings should be
interpreted with caution and in the context of longer-term trends and other data that become available.
** A list of sources used to compile the Indiana economic snapshot is available at: http://bit.ly/JEC-state-by-state-sources
**** For additional Indiana-specific labor sector statistics, please refer to the Indiana office: http://www.hoosierdata.in.gov/
State Quick Facts

U.S. Congress Joint Economic Committee
◙
◙
◙
◙
◙
◙
◙
◙
In June 2016, average hourly earnings of private-sector workers in Iowa were $23.67. The average
workweek was 35.2 hours, and average weekly earnings were $833.18.
Unemployment
Earnings
Economic Snapshot: Iowa
**Includes Bureau of Labor Statistics jobs, unemployment and earnings data through June 2016**
**Last updated on July 22nd; July data will be released on August 19th**
Since February 2010, the national low point for private-sector employment, Iowa businesses have added
112,600 jobs (an increase of 9.3 percent). Nationally, private payrolls have increased by 13.8 percent over
this time.
The state sectors with the greatest job gains in percentage terms since February 2010 are: construction at
45.5 percent (28,000 jobs), professional and business services at 14.2 percent (17,000 jobs) and leisure
and hospitality at 11.2 percent (14,500 jobs).
Jobs
In June, private-sector employment in Iowa grew by 5,000 jobs. Over the past year, Iowa businesses have
added 17,400 jobs. This compares with an increase of 13,700 jobs over the 12 months through June 2015.
Unemployment is up 0.4 percentage point from one year earlier but remains 2.6 percentage points below
its recent peak of 6.6 percent in August 2009.
There were 68,100 Iowa residents unemployed in June 2016.
The unemployment rate in Iowa was 4.0 percent in June 2016, up 0.1 percentage point from May. The rate
was 0.9 percentage point below the national rate of 4.9 percent.
Adjusting for inflation, state average hourly earnings have risen by 5.1 percent over the past year.
Nationally, real average hourly earnings have increased by 1.6 percent (not seasonally adjusted).
-12
-10
-8
-6
-4
-2
0
2
4
6
8
Source: JEC Democratic staff calculations based on seasonally adjusted data from the Bureau of Labor Statistics
Private-Sector Job Growth in IowaMonthly, Jan. 2008 - Jun. 2016, thousands
2008 2009 2010 2011 2012 2013 2014
Bush administration
Obama administration
2015 2016
JULY 2016

Iowa United States
Private-Sector Jobs Added……………………………….Past 12 Months 17,400 2.3 million
Since Feb. 2010 112,600 14.8 million
Unemployment Rate …………………………………………………..June 2016 4.0% 4.9%
June 2015 3.6% 5.3%
Recession-Era Peak 6.6% 10.0%
Median Household Income (2014 $)…………………………………………………………….2014 $57,800 $53,700
2007 (Pre-Recession) $55,800 $57,400
Poverty Rate...………………………………………………………………..2014 10.3% 14.8%
2007 (Pre-Recession) 8.9% 12.5%
All Veterans' Unemployment Rate………………………….'2015 1.9% 4.6%
Post-9/11 Veterans' Unemployment Rate…………………………2015 1.1% 5.8%
Percentage Without Health Insurance...………………………………………………………….2014 6.2% 11.7%
2013 8.1% 14.5%
◙
◙
◙
◙
◙
◙
* Note: Because of methodological differences, total U.S. real GDP by state differs slightly from headline national GDP figures
Exports over the past 12 months are up 33.4 percent from their level in 2009 (inflation-adjusted).
In Iowa, goods exports totaled $1.1 billion in May and $12.3 billion over the past year, down 6.5 percent
from the 12 months ending in May 2015 (inflation-adjusted).
Exports
In May 2016, builders in Iowa broke ground on 10,710 new housing units (seasonally adjusted annual rate),
bringing the average over the past 12 months to 10,316 units. That marks an increase of 2.4 percent from
the average over the prior 12 months.
Home prices in Iowa increased by 4.1 percent from the first quarter of 2015 to the first quarter of 2016.
They are up 17.4 percent since their recent low in the first quarter of 2011.
Housing
Real gross domestic product (GDP) in Iowa fell by 1.5 percent over the four quarters through the fourth
quarter of 2015, below the national average growth rate of 2.0 percent.*
State Gross Domestic Product
Since the official end of the Great Recession in the second quarter of 2009, Iowa GDP growth has
averaged 2.1 percent at an annual rate, compared with a national average of 1.9 percent.
*** Note: state-level data changes may not be statistically significant due to sampling variation. Individual monthly readings should be
interpreted with caution and in the context of longer-term trends and other data that become available.
** A list of sources used to compile the Iowa economic snapshot is available at: http://bit.ly/JEC-state-by-state-sources
**** For additional Iowa-specific labor sector statistics, please refer to the Iowa office: http://www.iowaworkforce.org/
State Quick Facts

U.S. Congress Joint Economic Committee
◙
◙
◙
◙
◙
◙
◙
◙
In June 2016, average hourly earnings of private-sector workers in Kansas were $22.43. The average
workweek was 34.0 hours, and average weekly earnings were $762.62.
Unemployment
Earnings
Economic Snapshot: Kansas
**Includes Bureau of Labor Statistics jobs, unemployment and earnings data through June 2016**
**Last updated on July 22nd; July data will be released on August 19th**
Since February 2010, the national low point for private-sector employment, Kansas businesses have added
84,200 jobs (an increase of 7.9 percent). Nationally, private payrolls have increased by 13.8 percent over
this time.
The state sectors with the greatest job gains in percentage terms since February 2010 are: professional
and business services at 22.9 percent (34,000 jobs), leisure and hospitality at 12.9 percent (14,600 jobs)
and financial activities at 11.7 percent (8,400 jobs).
Jobs
In June, private-sector employment in Kansas grew by 2,700 jobs. Over the past year, Kansas businesses
have added 2,100 jobs. This compares with an increase of 9,200 jobs over the 12 months through June
2015.
Unemployment is down 0.4 percentage point from one year earlier and is 3.5 percentage points below its
recent peak of 7.3 percent in September 2009.
There were 56,800 Kansas residents unemployed in June 2016.
The unemployment rate in Kansas was 3.8 percent in June 2016, up 0.1 percentage point from May. The
rate was 1.1 percentage points below the national rate of 4.9 percent.
Adjusting for inflation, state average hourly earnings have risen by 0.2 percent over the past year.
Nationally, real average hourly earnings have increased by 1.6 percent (not seasonally adjusted).
-15
-10
-5
0
5
10
Source: JEC Democratic staff calculations based on seasonally adjusted data from the Bureau of Labor Statistics
Private-Sector Job Growth in KansasMonthly, Jan. 2008 - Jun. 2016, thousands
2008 2009 2010 2011 2012 2013 2014
Bush administration
Obama administration
2015 2016
JULY 2016

Kansas United States
Private-Sector Jobs Added……………………………….Past 12 Months 2,100 2.3 million
Since Feb. 2010 84,200 14.8 million
Unemployment Rate …………………………………………………..June 2016 3.8% 4.9%
June 2015 4.2% 5.3%
Recession-Era Peak 7.3% 10.0%
Median Household Income (2014 $)…………………………………………………………….2014 $53,400 $53,700
2007 (Pre-Recession) $55,400 $57,400
Poverty Rate...………………………………………………………………..2014 12.1% 14.8%
2007 (Pre-Recession) 11.7% 12.5%
All Veterans' Unemployment Rate………………………….'2015 6.1% 4.6%
Post-9/11 Veterans' Unemployment Rate…………………………2015 14.0% 5.8%
Percentage Without Health Insurance...………………………………………………………….2014 10.2% 11.7%
2013 12.3% 14.5%
◙
◙
◙
◙
◙
◙
* Note: Because of methodological differences, total U.S. real GDP by state differs slightly from headline national GDP figures
Exports over the past 12 months are up 9.1 percent from their level in 2009 (inflation-adjusted).
In Kansas, goods exports totaled $913 million in May and $9.9 billion over the past year, down 8.8 percent
from the 12 months ending in May 2015 (inflation-adjusted).
Exports
In May 2016, builders in Kansas broke ground on 5,660 new housing units (seasonally adjusted annual
rate), bringing the average over the past 12 months to 7,493 units. That marks a decrease of 10.8 percent
from the average over the prior 12 months.
Home prices in Kansas increased by 3.4 percent from the first quarter of 2015 to the first quarter of 2016.
They are up 16.7 percent since their recent low in the first quarter of 2011.
Housing
Real gross domestic product (GDP) in Kansas fell by 0.8 percent over the four quarters through the fourth
quarter of 2015, below the national average growth rate of 2.0 percent.*
State Gross Domestic Product
Since the official end of the Great Recession in the second quarter of 2009, Kansas GDP growth has
averaged 1.3 percent at an annual rate, compared with a national average of 1.9 percent.
*** Note: state-level data changes may not be statistically significant due to sampling variation. Individual monthly readings should be
interpreted with caution and in the context of longer-term trends and other data that become available.
** A list of sources used to compile the Kansas economic snapshot is available at: http://bit.ly/JEC-state-by-state-sources
**** For additional Kansas-specific labor sector statistics, please refer to the Kansas office: http://www.dol.ks.gov/lmis/Default.aspx
State Quick Facts

U.S. Congress Joint Economic Committee
◙
◙
◙
◙
◙
◙
◙
◙
In June 2016, average hourly earnings of private-sector workers in Kentucky were $21.09. The average
workweek was 35.5 hours, and average weekly earnings were $748.70.
Unemployment
Earnings
Economic Snapshot: Kentucky
**Includes Bureau of Labor Statistics jobs, unemployment and earnings data through June 2016**
**Last updated on July 22nd; July data will be released on August 19th**
Since February 2010, the national low point for private-sector employment, Kentucky businesses have
added 165,800 jobs (an increase of 11.6 percent). Nationally, private payrolls have increased by 13.8
percent over this time.
The state sectors with the greatest job gains in percentage terms since February 2010 are: professional
and business services at 25.4 percent (44,400 jobs), manufacturing at 19.6 percent (39,800 jobs) and
leisure and hospitality at 14.5 percent (24,000 jobs).
Jobs
In June, private-sector employment in Kentucky grew by 1,600 jobs. Over the past year, Kentucky
businesses have added 25,600 jobs. This compares with an increase of 34,300 jobs over the 12 months
through June 2015.
Unemployment is down 0.3 percentage point from one year earlier and is 5.9 percentage points below its
recent peak of 10.9 percent in June 2009.
There were 99,300 Kentucky residents unemployed in June 2016.
The unemployment rate in Kentucky was 5.0 percent in June 2016, down 0.1 percentage point from May.
The rate was 0.1 percentage point above the national rate of 4.9 percent.
Adjusting for inflation, state average hourly earnings have fallen by 0.4 percent over the past year.
Nationally, real average hourly earnings have increased by 1.6 percent (not seasonally adjusted).
-20
-15
-10
-5
0
5
10
15
Source: JEC Democratic staff calculations based on seasonally adjusted data from the Bureau of Labor Statistics
Private-Sector Job Growth in KentuckyMonthly, Jan. 2008 - Jun. 2016, thousands
2008 2009 2010 2011 2012 2013 2014
Bush administration
Obama administration
2015 2016
JULY 2016

Kentucky United States
Private-Sector Jobs Added……………………………….Past 12 Months 25,600 2.3 million
Since Feb. 2010 165,800 14.8 million
Unemployment Rate …………………………………………………..June 2016 5.0% 4.9%
June 2015 5.3% 5.3%
Recession-Era Peak 10.9% 10.0%
Median Household Income (2014 $)…………………………………………………………….2014 $42,800 $53,700
2007 (Pre-Recession) $45,000 $57,400
Poverty Rate...………………………………………………………………..2014 20.0% 14.8%
2007 (Pre-Recession) 15.5% 12.5%
All Veterans' Unemployment Rate………………………….'2015 5.6% 4.6%
Post-9/11 Veterans' Unemployment Rate…………………………2015 5.9% 5.8%
Percentage Without Health Insurance...………………………………………………………….2014 8.5% 11.7%
2013 14.3% 14.5%
◙
◙
◙
◙
◙
◙
* Note: Because of methodological differences, total U.S. real GDP by state differs slightly from headline national GDP figures
Exports over the past 12 months are up 55.0 percent from their level in 2009 (inflation-adjusted).
In Kentucky, goods exports totaled $2.5 billion in May and $27.9 billion over the past year, up 4.5 percent
from the 12 months ending in May 2015 (inflation-adjusted).
Exports
In May 2016, builders in Kentucky broke ground on 13,150 new housing units (seasonally adjusted annual
rate), bringing the average over the past 12 months to 11,395 units. That marks an increase of 35.7
percent from the average over the prior 12 months.
Home prices in Kentucky increased by 3.4 percent from the first quarter of 2015 to the first quarter of 2016.
They are up 15.4 percent since their recent low in the second quarter of 2011.
Housing
Real gross domestic product (GDP) in Kentucky grew by 1.3 percent over the four quarters through the
fourth quarter of 2015, below the national average growth rate of 2.0 percent.*
State Gross Domestic Product
Since the official end of the Great Recession in the second quarter of 2009, Kentucky GDP growth has
averaged 2.0 percent at an annual rate, compared with a national average of 1.9 percent.
*** Note: state-level data changes may not be statistically significant due to sampling variation. Individual monthly readings should be
interpreted with caution and in the context of longer-term trends and other data that become available.
** A list of sources used to compile the Kentucky economic snapshot is available at: http://bit.ly/JEC-state-by-state-sources
**** For additional Kentucky-specific labor sector statistics, please refer to the Kentucky office: http://www.workforcekentucky.ky.gov/
State Quick Facts

U.S. Congress Joint Economic Committee
◙
◙
◙
◙
◙
◙
◙
◙
In June 2016, average hourly earnings of private-sector workers in Louisiana were $22.50. The average
workweek was 35.2 hours, and average weekly earnings were $792.00.
Unemployment
Earnings
Economic Snapshot: Louisiana
**Includes Bureau of Labor Statistics jobs, unemployment and earnings data through June 2016**
**Last updated on July 22nd; July data will be released on August 19th**
Since February 2010, the national low point for private-sector employment, Louisiana businesses have
added 147,000 jobs (an increase of 9.8 percent). Nationally, private payrolls have increased by 13.8
percent over this time.
The state sectors with the greatest job gains in percentage terms since February 2010 are: leisure and
hospitality at 19.1 percent (36,900 jobs), construction at 17.7 percent (21,400 jobs) and education and
health services at 16.4 percent (44,000 jobs).
Jobs
In June, private-sector employment in Louisiana grew by 900 jobs. Over the past year, Louisiana
businesses have shed 12,900 jobs. This compares with an increase of 12,500 jobs over the 12 months
through June 2015.
Unemployment held constant from one year earlier and is 2.1 percentage points below its recent peak of
8.3 percent in December 2010.
There were 134,700 Louisiana residents unemployed in June 2016.
The unemployment rate in Louisiana was 6.2 percent in June 2016, down 0.1 percentage point from May.
The rate was 1.3 percentage points above the national rate of 4.9 percent.
Adjusting for inflation, state average hourly earnings have risen by 1.5 percent over the past year.
Nationally, real average hourly earnings have increased by 1.6 percent (not seasonally adjusted).
-20
-15
-10
-5
0
5
10
15
20
Source: JEC Democratic staff calculations based on seasonally adjusted data from the Bureau of Labor Statistics
Private-Sector Job Growth in LouisianaMonthly, Jan. 2008 - Jun. 2016, thousands
2008 2009 2010 2011 2012 2013 2014
Bush administration
Obama administration
2015 2016
JULY 2016
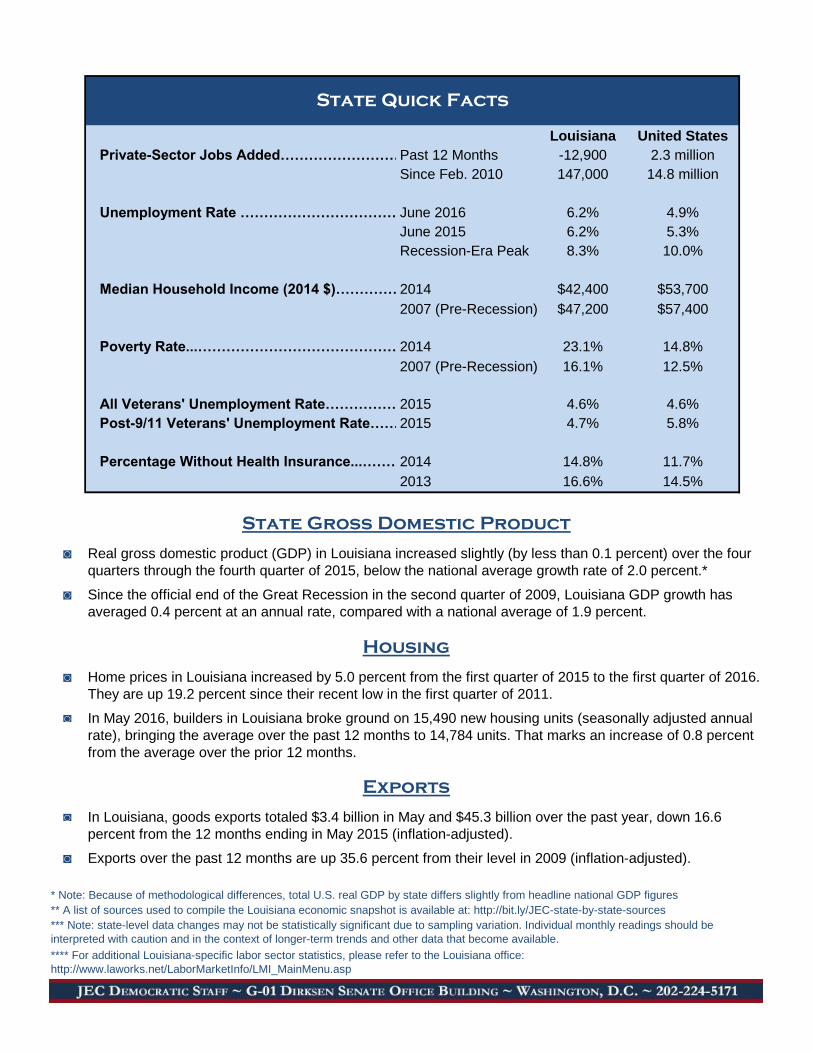
Louisiana United States
Private-Sector Jobs Added……………………………….Past 12 Months -12,900 2.3 million
Since Feb. 2010 147,000 14.8 million
Unemployment Rate …………………………………………………..June 2016 6.2% 4.9%
June 2015 6.2% 5.3%
Recession-Era Peak 8.3% 10.0%
Median Household Income (2014 $)…………………………………………………………….2014 $42,400 $53,700
2007 (Pre-Recession) $47,200 $57,400
Poverty Rate...………………………………………………………………..2014 23.1% 14.8%
2007 (Pre-Recession) 16.1% 12.5%
All Veterans' Unemployment Rate………………………….'2015 4.6% 4.6%
Post-9/11 Veterans' Unemployment Rate…………………………2015 4.7% 5.8%
Percentage Without Health Insurance...………………………………………………………….2014 14.8% 11.7%
2013 16.6% 14.5%
◙
◙
◙
◙
◙
◙
* Note: Because of methodological differences, total U.S. real GDP by state differs slightly from headline national GDP figures
Exports over the past 12 months are up 35.6 percent from their level in 2009 (inflation-adjusted).
In Louisiana, goods exports totaled $3.4 billion in May and $45.3 billion over the past year, down 16.6
percent from the 12 months ending in May 2015 (inflation-adjusted).
Exports
In May 2016, builders in Louisiana broke ground on 15,490 new housing units (seasonally adjusted annual
rate), bringing the average over the past 12 months to 14,784 units. That marks an increase of 0.8 percent
from the average over the prior 12 months.
Home prices in Louisiana increased by 5.0 percent from the first quarter of 2015 to the first quarter of 2016.
They are up 19.2 percent since their recent low in the first quarter of 2011.
Housing
Real gross domestic product (GDP) in Louisiana increased slightly (by less than 0.1 percent) over the four
quarters through the fourth quarter of 2015, below the national average growth rate of 2.0 percent.*
State Gross Domestic Product
Since the official end of the Great Recession in the second quarter of 2009, Louisiana GDP growth has
averaged 0.4 percent at an annual rate, compared with a national average of 1.9 percent.
*** Note: state-level data changes may not be statistically significant due to sampling variation. Individual monthly readings should be
interpreted with caution and in the context of longer-term trends and other data that become available.
** A list of sources used to compile the Louisiana economic snapshot is available at: http://bit.ly/JEC-state-by-state-sources
**** For additional Louisiana-specific labor sector statistics, please refer to the Louisiana office:
http://www.laworks.net/LaborMarketInfo/LMI_MainMenu.asp
State Quick Facts

U.S. Congress Joint Economic Committee
◙
◙
◙
◙
◙
◙
◙
◙
In June 2016, average hourly earnings of private-sector workers in Maine were $21.84. The average
workweek was 34.0 hours, and average weekly earnings were $742.56.
Unemployment
Earnings
Economic Snapshot: Maine
**Includes Bureau of Labor Statistics jobs, unemployment and earnings data through June 2016**
**Last updated on July 22nd; July data will be released on August 19th**
Since February 2010, the national low point for private-sector employment, Maine businesses have added
28,900 jobs (an increase of 5.9 percent). Nationally, private payrolls have increased by 13.8 percent over
this time.
The state sectors with the greatest job gains in percentage terms since February 2010 are: professional
and business services at 16.8 percent (9,500 jobs), leisure and hospitality at 10.1 percent (6,000 jobs) and
other services at 8.1 percent (1,600 jobs).
Jobs
In June, private-sector employment in Maine grew by 3,800 jobs. Over the past year, Maine businesses
have added 6,000 jobs. This compares with an increase of 5,500 jobs over the 12 months through June
2015.
Unemployment is down 0.7 percentage point from one year earlier and is 4.6 percentage points below its
recent peak of 8.3 percent in July 2009.
There were 25,100 Maine residents unemployed in June 2016.
The unemployment rate in Maine was 3.7 percent in June 2016, up 0.2 percentage point from May. The
rate was 1.2 percentage points below the national rate of 4.9 percent.
Adjusting for inflation, state average hourly earnings have risen by 0.8 percent over the past year.
Nationally, real average hourly earnings have increased by 1.6 percent (not seasonally adjusted).
-5
-4
-3
-2
-1
0
1
2
3
4
5
Source: JEC Democratic staff calculations based on seasonally adjusted data from the Bureau of Labor Statistics
Private-Sector Job Growth in MaineMonthly, Jan. 2008 - Jun. 2016, thousands
2008 2009 2010 2011 2012 2013 2014
Bush administration
Obama administration
2015 2016
JULY 2016

Maine United States
Private-Sector Jobs Added……………………………….Past 12 Months 6,000 2.3 million
Since Feb. 2010 28,900 14.8 million
Unemployment Rate …………………………………………………..June 2016 3.7% 4.9%
June 2015 4.4% 5.3%
Recession-Era Peak 8.3% 10.0%
Median Household Income (2014 $)…………………………………………………………….2014 $51,700 $53,700
2007 (Pre-Recession) $54,700 $57,400
Poverty Rate...………………………………………………………………..2014 14.6% 14.8%
2007 (Pre-Recession) 10.9% 12.5%
All Veterans' Unemployment Rate………………………….'2015 4.5% 4.6%
Post-9/11 Veterans' Unemployment Rate…………………………2015 3.0% 5.8%
Percentage Without Health Insurance...………………………………………………………….2014 10.1% 11.7%
2013 11.2% 14.5%
◙
◙
◙
◙
◙
◙
* Note: Because of methodological differences, total U.S. real GDP by state differs slightly from headline national GDP figures
Exports over the past 12 months are up 16.0 percent from their level in 2009 (inflation-adjusted).
In Maine, goods exports totaled $191 million in May and $2.7 billion over the past year, up 4.4 percent from
the 12 months ending in May 2015 (inflation-adjusted).
Exports
In May 2016, builders in Maine broke ground on 3,990 new housing units (seasonally adjusted annual rate),
bringing the average over the past 12 months to 4,283 units. That marks an increase of 47.3 percent from
the average over the prior 12 months.
Home prices in Maine increased by 4.8 percent from the first quarter of 2015 to the first quarter of 2016.
They are up 13.4 percent since their recent low in the third quarter of 2012.
Housing
Real gross domestic product (GDP) in Maine increased slightly (by less than 0.1 percent) over the four
quarters through the fourth quarter of 2015, below the national average growth rate of 2.0 percent.*
State Gross Domestic Product
Since the official end of the Great Recession in the second quarter of 2009, Maine GDP growth has
averaged 0.3 percent at an annual rate, compared with a national average of 1.9 percent.
*** Note: state-level data changes may not be statistically significant due to sampling variation. Individual monthly readings should be
interpreted with caution and in the context of longer-term trends and other data that become available.
** A list of sources used to compile the Maine economic snapshot is available at: http://bit.ly/JEC-state-by-state-sources
**** For additional Maine-specific labor sector statistics, please refer to the Maine office: http://www.state.me.us/labor/cwri/index.html
State Quick Facts

U.S. Congress Joint Economic Committee
◙
◙
◙
◙
◙
◙
◙
◙
In June 2016, average hourly earnings of private-sector workers in Maryland were $26.94. The average
workweek was 34.3 hours, and average weekly earnings were $924.04.
Unemployment
Earnings
Economic Snapshot: Maryland
**Includes Bureau of Labor Statistics jobs, unemployment and earnings data through June 2016**
**Last updated on July 22nd; July data will be released on August 19th**
Since February 2010, the national low point for private-sector employment, Maryland businesses have
added 239,000 jobs (an increase of 12.1 percent). Nationally, private payrolls have increased by 13.8
percent over this time.
The state sectors with the greatest job gains in percentage terms since February 2010 are: leisure and
hospitality at 27.2 percent (60,500 jobs), logging, mining and construction at 17.7 percent (24,500 jobs) and
professional and business services at 16.6 percent (62,700 jobs).
Jobs
In June, private-sector employment in Maryland grew by 11,700 jobs. Over the past year, Maryland
businesses have added 59,600 jobs. This compares with an increase of 36,700 jobs over the 12 months
through June 2015.
Unemployment is down 0.8 percentage point from one year earlier and is 3.5 percentage points below its
recent peak of 7.8 percent in February 2010.
There were 137,200 Maryland residents unemployed in June 2016.
The unemployment rate in Maryland was 4.3 percent in June 2016, down 0.2 percentage point from May.
The rate was 0.6 percentage point below the national rate of 4.9 percent.
Adjusting for inflation, state average hourly earnings have fallen by 0.5 percent over the past year.
Nationally, real average hourly earnings have increased by 1.6 percent (not seasonally adjusted).
-40
-30
-20
-10
0
10
20
30
40
Source: JEC Democratic staff calculations based on seasonally adjusted data from the Bureau of Labor Statistics
Private-Sector Job Growth in MarylandMonthly, Jan. 2008 - Jun. 2016, thousands
2008 2009 2010 2011 2012 2013 2014
Bush administration
Obama administration
2015 2016
JULY 2016

Maryland United States
Private-Sector Jobs Added……………………………….Past 12 Months 59,600 2.3 million
Since Feb. 2010 239,000 14.8 million
Unemployment Rate …………………………………………………..June 2016 4.3% 4.9%
June 2015 5.1% 5.3%
Recession-Era Peak 7.8% 10.0%
Median Household Income (2014 $)…………………………………………………………….2014 $76,200 $53,700
2007 (Pre-Recession) $74,900 $57,400
Poverty Rate...………………………………………………………………..2014 9.9% 14.8%
2007 (Pre-Recession) 8.8% 12.5%
All Veterans' Unemployment Rate………………………….'2015 7.2% 4.6%
Post-9/11 Veterans' Unemployment Rate…………………………2015 9.7% 5.8%
Percentage Without Health Insurance...………………………………………………………….2014 7.9% 11.7%
2013 10.2% 14.5%
◙
◙
◙
◙
◙
◙
* Note: Because of methodological differences, total U.S. real GDP by state differs slightly from headline national GDP figures
Exports over the past 12 months are up 3.2 percent from their level in 2009 (inflation-adjusted).
In Maryland, goods exports totaled $853 million in May and $9.7 billion over the past year, down 7.0
percent from the 12 months ending in May 2015 (inflation-adjusted).
Exports
In May 2016, builders in Maryland broke ground on 31,990 new housing units (seasonally adjusted annual
rate), bringing the average over the past 12 months to 17,660 units. That marks an increase of 10.8
percent from the average over the prior 12 months.
Home prices in Maryland increased by 3.8 percent from the first quarter of 2015 to the first quarter of 2016.
They are up 16.9 percent since their recent low in the first quarter of 2012.
Housing
Real gross domestic product (GDP) in Maryland grew by 1.5 percent over the four quarters through the
fourth quarter of 2015, below the national average growth rate of 2.0 percent.*
State Gross Domestic Product
Since the official end of the Great Recession in the second quarter of 2009, Maryland GDP growth has
averaged 1.2 percent at an annual rate, compared with a national average of 1.9 percent.
*** Note: state-level data changes may not be statistically significant due to sampling variation. Individual monthly readings should be
interpreted with caution and in the context of longer-term trends and other data that become available.
** A list of sources used to compile the Maryland economic snapshot is available at: http://bit.ly/JEC-state-by-state-sources
**** For additional Maryland-specific labor sector statistics, please refer to the Maryland office: http://www.dllr.maryland.gov/lmi/
State Quick Facts

U.S. Congress Joint Economic Committee
◙
◙
◙
◙
◙
◙
◙
◙
In June 2016, average hourly earnings of private-sector workers in Massachusetts were $30.75. The
average workweek was 33.5 hours, and average weekly earnings were $1,030.13.
Unemployment
Earnings
Economic Snapshot: Massachusetts
**Includes Bureau of Labor Statistics jobs, unemployment and earnings data through June 2016**
**Last updated on July 22nd; July data will be released on August 19th**
Since February 2010, the national low point for private-sector employment, Massachusetts businesses
have added 338,500 jobs (an increase of 12.2 percent). Nationally, private payrolls have increased by 13.8
percent over this time.
The state sectors with the greatest job gains in percentage terms since February 2010 are: construction at
40.1 percent (42,700 jobs), professional and business services at 19.2 percent (88,200 jobs) and leisure
and hospitality at 16.5 percent (50,300 jobs).
Jobs
In June, private-sector employment in Massachusetts grew by 17,100 jobs. Over the past year,
Massachusetts businesses have added 65,500 jobs. This compares with an increase of 64,600 jobs over
the 12 months through June 2015.
Unemployment is down 0.7 percentage point from one year earlier and is 4.6 percentage points below its
recent peak of 8.8 percent in January 2010.
There were 149,600 Massachusetts residents unemployed in June 2016.
The unemployment rate in Massachusetts was 4.2 percent in June 2016, holding constant from May. The
rate was 0.7 percentage point below the national rate of 4.9 percent.
Adjusting for inflation, state average hourly earnings have risen by 1.7 percent over the past year.
Nationally, real average hourly earnings have increased by 1.6 percent (not seasonally adjusted).
-40
-30
-20
-10
0
10
20
30
Source: JEC Democratic staff calculations based on seasonally adjusted data from the Bureau of Labor Statistics
Private-Sector Job Growth in MassachusettsMonthly, Jan. 2008 - Jun. 2016, thousands
2008 2009 2010 2011 2012 2013 2014
Bush administration
Obama administration
2015 2016
JULY 2016
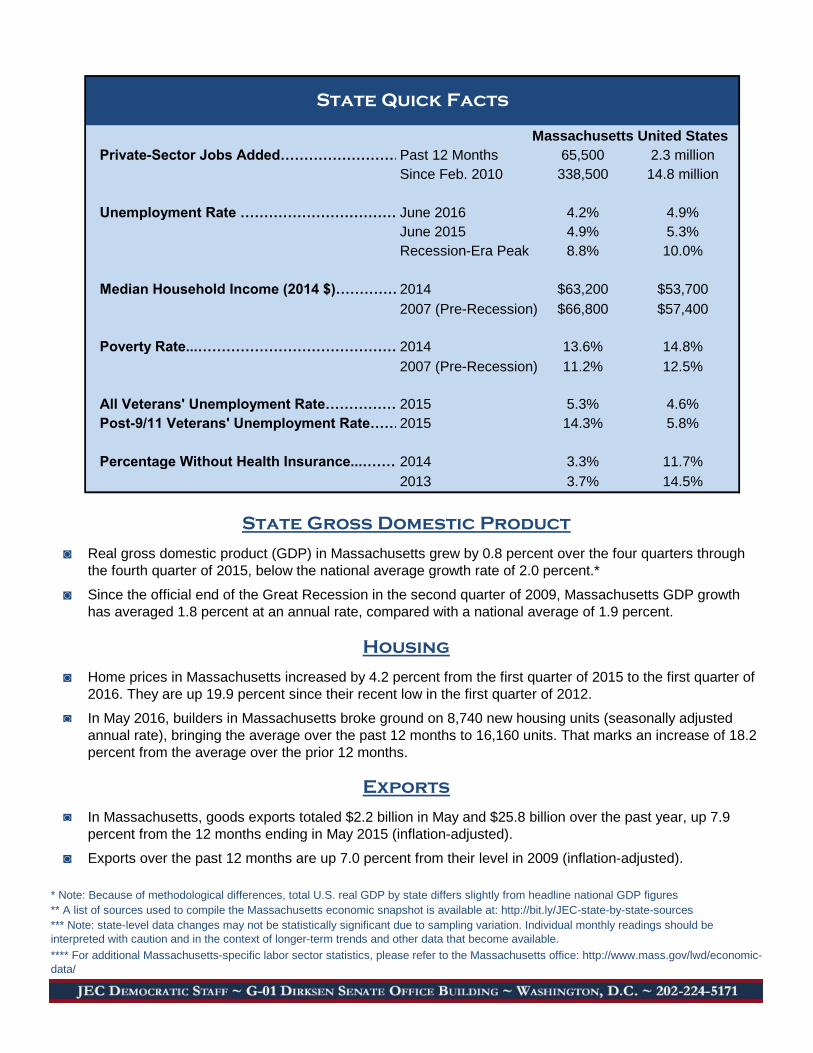
Massachusetts United States
Private-Sector Jobs Added……………………………….Past 12 Months 65,500 2.3 million
Since Feb. 2010 338,500 14.8 million
Unemployment Rate …………………………………………………..June 2016 4.2% 4.9%
June 2015 4.9% 5.3%
Recession-Era Peak 8.8% 10.0%
Median Household Income (2014 $)…………………………………………………………….2014 $63,200 $53,700
2007 (Pre-Recession) $66,800 $57,400
Poverty Rate...………………………………………………………………..2014 13.6% 14.8%
2007 (Pre-Recession) 11.2% 12.5%
All Veterans' Unemployment Rate………………………….'2015 5.3% 4.6%
Post-9/11 Veterans' Unemployment Rate…………………………2015 14.3% 5.8%
Percentage Without Health Insurance...………………………………………………………….2014 3.3% 11.7%
2013 3.7% 14.5%
◙
◙
◙
◙
◙
◙
* Note: Because of methodological differences, total U.S. real GDP by state differs slightly from headline national GDP figures
Exports over the past 12 months are up 7.0 percent from their level in 2009 (inflation-adjusted).
In Massachusetts, goods exports totaled $2.2 billion in May and $25.8 billion over the past year, up 7.9
percent from the 12 months ending in May 2015 (inflation-adjusted).
Exports
In May 2016, builders in Massachusetts broke ground on 8,740 new housing units (seasonally adjusted
annual rate), bringing the average over the past 12 months to 16,160 units. That marks an increase of 18.2
percent from the average over the prior 12 months.
Home prices in Massachusetts increased by 4.2 percent from the first quarter of 2015 to the first quarter of
2016. They are up 19.9 percent since their recent low in the first quarter of 2012.
Housing
Real gross domestic product (GDP) in Massachusetts grew by 0.8 percent over the four quarters through
the fourth quarter of 2015, below the national average growth rate of 2.0 percent.*
State Gross Domestic Product
Since the official end of the Great Recession in the second quarter of 2009, Massachusetts GDP growth
has averaged 1.8 percent at an annual rate, compared with a national average of 1.9 percent.
*** Note: state-level data changes may not be statistically significant due to sampling variation. Individual monthly readings should be
interpreted with caution and in the context of longer-term trends and other data that become available.
** A list of sources used to compile the Massachusetts economic snapshot is available at: http://bit.ly/JEC-state-by-state-sources
**** For additional Massachusetts-specific labor sector statistics, please refer to the Massachusetts office: http://www.mass.gov/lwd/economic-
data/
State Quick Facts
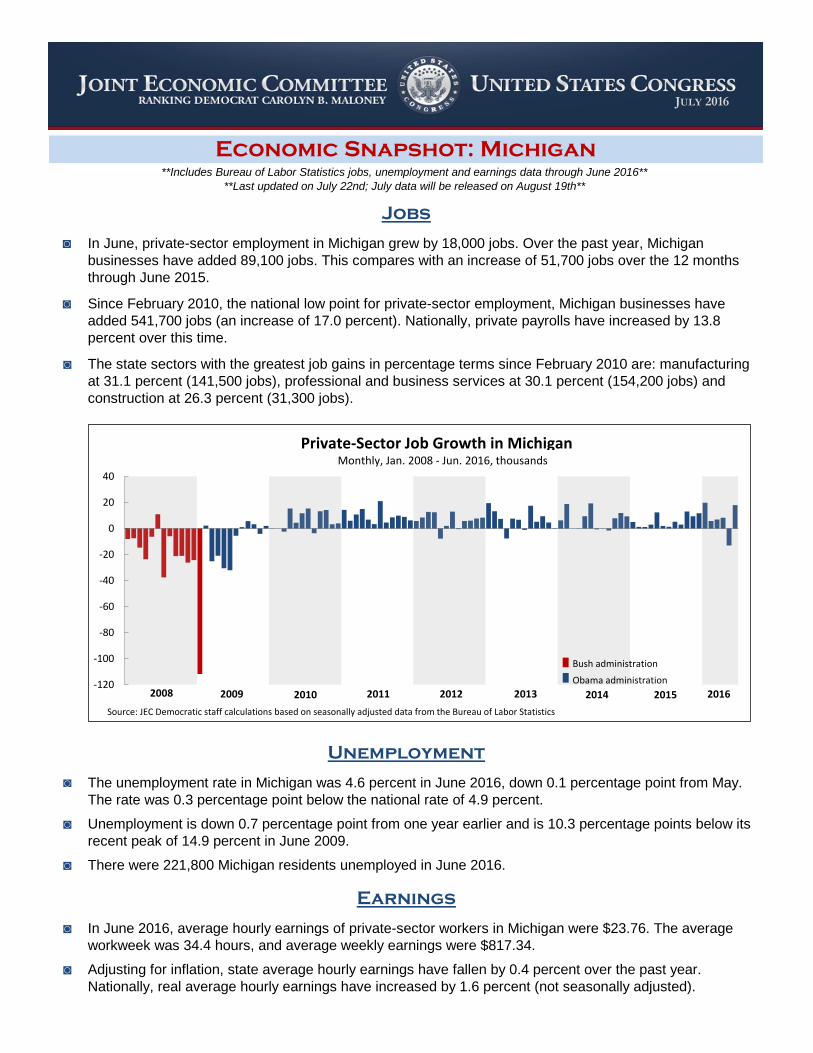
U.S. Congress Joint Economic Committee
◙
◙
◙
◙
◙
◙
◙
◙
In June 2016, average hourly earnings of private-sector workers in Michigan were $23.76. The average
workweek was 34.4 hours, and average weekly earnings were $817.34.
Unemployment
Earnings
Economic Snapshot: Michigan
**Includes Bureau of Labor Statistics jobs, unemployment and earnings data through June 2016**
**Last updated on July 22nd; July data will be released on August 19th**
Since February 2010, the national low point for private-sector employment, Michigan businesses have
added 541,700 jobs (an increase of 17.0 percent). Nationally, private payrolls have increased by 13.8
percent over this time.
The state sectors with the greatest job gains in percentage terms since February 2010 are: manufacturing
at 31.1 percent (141,500 jobs), professional and business services at 30.1 percent (154,200 jobs) and
construction at 26.3 percent (31,300 jobs).
Jobs
In June, private-sector employment in Michigan grew by 18,000 jobs. Over the past year, Michigan
businesses have added 89,100 jobs. This compares with an increase of 51,700 jobs over the 12 months
through June 2015.
Unemployment is down 0.7 percentage point from one year earlier and is 10.3 percentage points below its
recent peak of 14.9 percent in June 2009.
There were 221,800 Michigan residents unemployed in June 2016.
The unemployment rate in Michigan was 4.6 percent in June 2016, down 0.1 percentage point from May.
The rate was 0.3 percentage point below the national rate of 4.9 percent.
Adjusting for inflation, state average hourly earnings have fallen by 0.4 percent over the past year.
Nationally, real average hourly earnings have increased by 1.6 percent (not seasonally adjusted).
-120
-100
-80
-60
-40
-20
0
20
40
Source: JEC Democratic staff calculations based on seasonally adjusted data from the Bureau of Labor Statistics
Private-Sector Job Growth in MichiganMonthly, Jan. 2008 - Jun. 2016, thousands
2008 2009 2010 2011 2012 2013 2014
Bush administration
Obama administration
2015 2016
JULY 2016
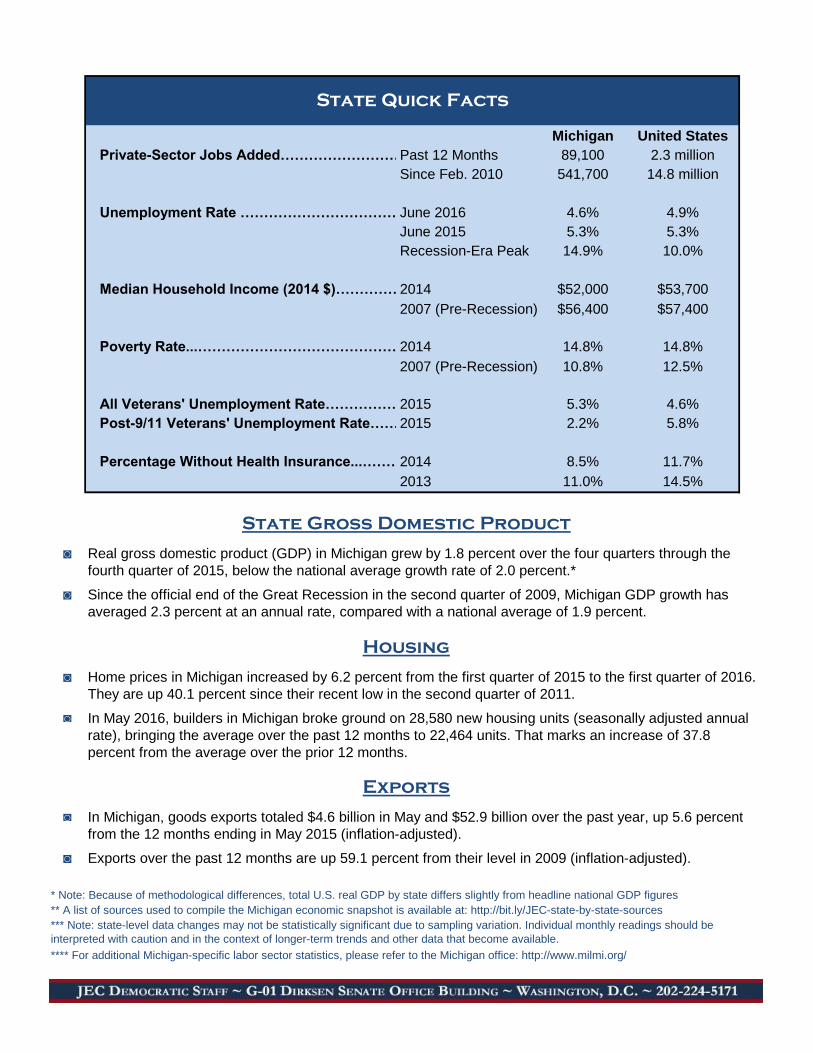
Michigan United States
Private-Sector Jobs Added……………………………….Past 12 Months 89,100 2.3 million
Since Feb. 2010 541,700 14.8 million
Unemployment Rate …………………………………………………..June 2016 4.6% 4.9%
June 2015 5.3% 5.3%
Recession-Era Peak 14.9% 10.0%
Median Household Income (2014 $)…………………………………………………………….2014 $52,000 $53,700
2007 (Pre-Recession) $56,400 $57,400
Poverty Rate...………………………………………………………………..2014 14.8% 14.8%
2007 (Pre-Recession) 10.8% 12.5%
All Veterans' Unemployment Rate………………………….'2015 5.3% 4.6%
Post-9/11 Veterans' Unemployment Rate…………………………2015 2.2% 5.8%
Percentage Without Health Insurance...………………………………………………………….2014 8.5% 11.7%
2013 11.0% 14.5%
◙
◙
◙
◙
◙
◙
* Note: Because of methodological differences, total U.S. real GDP by state differs slightly from headline national GDP figures
Exports over the past 12 months are up 59.1 percent from their level in 2009 (inflation-adjusted).
In Michigan, goods exports totaled $4.6 billion in May and $52.9 billion over the past year, up 5.6 percent
from the 12 months ending in May 2015 (inflation-adjusted).
Exports
In May 2016, builders in Michigan broke ground on 28,580 new housing units (seasonally adjusted annual
rate), bringing the average over the past 12 months to 22,464 units. That marks an increase of 37.8
percent from the average over the prior 12 months.
Home prices in Michigan increased by 6.2 percent from the first quarter of 2015 to the first quarter of 2016.
They are up 40.1 percent since their recent low in the second quarter of 2011.
Housing
Real gross domestic product (GDP) in Michigan grew by 1.8 percent over the four quarters through the
fourth quarter of 2015, below the national average growth rate of 2.0 percent.*
State Gross Domestic Product
Since the official end of the Great Recession in the second quarter of 2009, Michigan GDP growth has
averaged 2.3 percent at an annual rate, compared with a national average of 1.9 percent.
*** Note: state-level data changes may not be statistically significant due to sampling variation. Individual monthly readings should be
interpreted with caution and in the context of longer-term trends and other data that become available.
** A list of sources used to compile the Michigan economic snapshot is available at: http://bit.ly/JEC-state-by-state-sources
**** For additional Michigan-specific labor sector statistics, please refer to the Michigan office: http://www.milmi.org/
State Quick Facts

U.S. Congress Joint Economic Committee
◙
◙
◙
◙
◙
◙
◙
◙
In June 2016, average hourly earnings of private-sector workers in Minnesota were $26.64. The average
workweek was 34.2 hours, and average weekly earnings were $911.09.
Unemployment
Earnings
Economic Snapshot: Minnesota
**Includes Bureau of Labor Statistics jobs, unemployment and earnings data through June 2016**
**Last updated on July 22nd; July data will be released on August 19th**
Since February 2010, the national low point for private-sector employment, Minnesota businesses have
added 258,200 jobs (an increase of 11.7 percent). Nationally, private payrolls have increased by 13.8
percent over this time.
The state sectors with the greatest job gains in percentage terms since February 2010 are: construction at
37.8 percent (33,000 jobs), education and health services at 16.1 percent (73,500 jobs) and professional
and business services at 14.6 percent (45,500 jobs).
Jobs
In June, private-sector employment in Minnesota grew by 5,800 jobs. Over the past year, Minnesota
businesses have added 29,300 jobs. This compares with an increase of 41,500 jobs over the 12 months
through June 2015.
Unemployment is up 0.2 percentage point from one year earlier but remains 4.3 percentage points below
its recent peak of 8.1 percent in June 2009.
There were 116,600 Minnesota residents unemployed in June 2016.
The unemployment rate in Minnesota was 3.8 percent in June 2016, holding constant from May. The rate
was 1.1 percentage points below the national rate of 4.9 percent.
Adjusting for inflation, state average hourly earnings have risen by 2.6 percent over the past year.
Nationally, real average hourly earnings have increased by 1.6 percent (not seasonally adjusted).
-20
-15
-10
-5
0
5
10
15
20
Source: JEC Democratic staff calculations based on seasonally adjusted data from the Bureau of Labor Statistics
Private-Sector Job Growth in MinnesotaMonthly, Jan. 2008 - Jun. 2016, thousands
2008 2009 2010 2011 2012 2013 2014
Bush administration
Obama administration
2015 2016
JULY 2016

Minnesota United States
Private-Sector Jobs Added……………………………….Past 12 Months 29,300 2.3 million
Since Feb. 2010 258,200 14.8 million
Unemployment Rate …………………………………………………..June 2016 3.8% 4.9%
June 2015 3.6% 5.3%
Recession-Era Peak 8.1% 10.0%
Median Household Income (2014 $)…………………………………………………………….2014 $67,200 $53,700
2007 (Pre-Recession) $66,300 $57,400
Poverty Rate...………………………………………………………………..2014 8.3% 14.8%
2007 (Pre-Recession) 9.3% 12.5%
All Veterans' Unemployment Rate………………………….'2015 5.5% 4.6%
Post-9/11 Veterans' Unemployment Rate…………………………2015 10.5% 5.8%
Percentage Without Health Insurance...………………………………………………………….2014 5.9% 11.7%
2013 8.2% 14.5%
◙
◙
◙
◙
◙
◙
* Note: Because of methodological differences, total U.S. real GDP by state differs slightly from headline national GDP figures
Exports over the past 12 months are up 21.8 percent from their level in 2009 (inflation-adjusted).
In Minnesota, goods exports totaled $1.6 billion in May and $19.3 billion over the past year, down 1.7
percent from the 12 months ending in May 2015 (inflation-adjusted).
Exports
In May 2016, builders in Minnesota broke ground on 23,040 new housing units (seasonally adjusted annual
rate), bringing the average over the past 12 months to 18,621 units. That marks an increase of 3.6 percent
from the average over the prior 12 months.
Home prices in Minnesota increased by 6.7 percent from the first quarter of 2015 to the first quarter of
2016. They are up 28.2 percent since their recent low in the second quarter of 2011.
Housing
Real gross domestic product (GDP) in Minnesota grew by 1.3 percent over the four quarters through the
fourth quarter of 2015, below the national average growth rate of 2.0 percent.*
State Gross Domestic Product
Since the official end of the Great Recession in the second quarter of 2009, Minnesota GDP growth has
averaged 2.4 percent at an annual rate, compared with a national average of 1.9 percent.
*** Note: state-level data changes may not be statistically significant due to sampling variation. Individual monthly readings should be
interpreted with caution and in the context of longer-term trends and other data that become available.
** A list of sources used to compile the Minnesota economic snapshot is available at: http://bit.ly/JEC-state-by-state-sources
**** For additional Minnesota-specific labor sector statistics, please refer to the Minnesota office: http://www.mn.gov/deed/data/
State Quick Facts

U.S. Congress Joint Economic Committee
◙
◙
◙
◙
◙
◙
◙
◙
In June 2016, average hourly earnings of private-sector workers in Mississippi were $20.14. The average
workweek was 34.6 hours, and average weekly earnings were $696.84.
Unemployment
Earnings
Economic Snapshot: Mississippi
**Includes Bureau of Labor Statistics jobs, unemployment and earnings data through June 2016**
**Last updated on July 22nd; July data will be released on August 19th**
Since February 2010, the national low point for private-sector employment, Mississippi businesses have
added 58,200 jobs (an increase of 7.0 percent). Nationally, private payrolls have increased by 13.8 percent
over this time.
The state sectors with the greatest job gains in percentage terms since February 2010 are: professional
and business services at 15.3 percent (13,400 jobs), leisure and hospitality at 10.4 percent (12,300 jobs)
and information services at 9.0 percent (1,100 jobs).
Jobs
In June, private-sector employment in Mississippi fell by 2,600 jobs. Over the past year, Mississippi
businesses have added 5,200 jobs. This compares with an increase of 13,300 jobs over the 12 months
through June 2015.
Unemployment is down 0.5 percentage point from one year earlier and is 4.9 percentage points below its
recent peak of 10.8 percent in March 2010.
There were 75,400 Mississippi residents unemployed in June 2016.
The unemployment rate in Mississippi was 5.9 percent in June 2016, holding constant from May. The rate
was 1.0 percentage point above the national rate of 4.9 percent.
Adjusting for inflation, state average hourly earnings have risen by 2.0 percent over the past year.
Nationally, real average hourly earnings have increased by 1.6 percent (not seasonally adjusted).
-10
-8
-6
-4
-2
0
2
4
6
8
Source: JEC Democratic staff calculations based on seasonally adjusted data from the Bureau of Labor Statistics
Private-Sector Job Growth in MississippiMonthly, Jan. 2008 - Jun. 2016, thousands
2008 2009 2010 2011 2012 2013 2014
Bush administration
Obama administration
2015 2016
JULY 2016

Mississippi United States
Private-Sector Jobs Added……………………………….Past 12 Months 5,200 2.3 million
Since Feb. 2010 58,200 14.8 million
Unemployment Rate …………………………………………………..June 2016 5.9% 4.9%
June 2015 6.4% 5.3%
Recession-Era Peak 10.8% 10.0%
Median Household Income (2014 $)…………………………………………………………….2014 $35,500 $53,700
2007 (Pre-Recession) $42,600 $57,400
Poverty Rate...………………………………………………………………..2014 22.1% 14.8%
2007 (Pre-Recession) 22.6% 12.5%
All Veterans' Unemployment Rate………………………….'2015 6.2% 4.6%
Post-9/11 Veterans' Unemployment Rate…………………………2015 4.7% 5.8%
Percentage Without Health Insurance...………………………………………………………….2014 14.5% 11.7%
2013 17.1% 14.5%
◙
◙
◙
◙
◙
◙
* Note: Because of methodological differences, total U.S. real GDP by state differs slightly from headline national GDP figures
Exports over the past 12 months are up 64.4 percent from their level in 2009 (inflation-adjusted).
In Mississippi, goods exports totaled $872 million in May and $10.6 billion over the past year, up 2.1
percent from the 12 months ending in May 2015 (inflation-adjusted).
Exports
In May 2016, builders in Mississippi broke ground on 8,670 new housing units (seasonally adjusted annual
rate), bringing the average over the past 12 months to 7,381 units. That marks an increase of 24.3 percent
from the average over the prior 12 months.
Home prices in Mississippi increased by 5.2 percent from the first quarter of 2015 to the first quarter of
2016. They are up 14.5 percent since their recent low in the first quarter of 2011.
Housing
Real gross domestic product (GDP) in Mississippi grew by 1.2 percent over the four quarters through the
fourth quarter of 2015, below the national average growth rate of 2.0 percent.*
State Gross Domestic Product
Since the official end of the Great Recession in the second quarter of 2009, Mississippi GDP growth has
averaged 0.7 percent at an annual rate, compared with a national average of 1.9 percent.
*** Note: state-level data changes may not be statistically significant due to sampling variation. Individual monthly readings should be
interpreted with caution and in the context of longer-term trends and other data that become available.
** A list of sources used to compile the Mississippi economic snapshot is available at: http://bit.ly/JEC-state-by-state-sources
**** For additional Mississippi-specific labor sector statistics, please refer to the Mississippi office: http://mdes.ms.gov/information-center/labor-
market-information/
State Quick Facts

U.S. Congress Joint Economic Committee
◙
◙
◙
◙
◙
◙
◙
◙
In June 2016, average hourly earnings of private-sector workers in Missouri were $22.15. The average
workweek was 33.2 hours, and average weekly earnings were $735.38.
Unemployment
Earnings
Economic Snapshot: Missouri
**Includes Bureau of Labor Statistics jobs, unemployment and earnings data through June 2016**
**Last updated on July 22nd; July data will be released on August 19th**
Since February 2010, the national low point for private-sector employment, Missouri businesses have
added 171,400 jobs (an increase of 7.8 percent). Nationally, private payrolls have increased by 13.8
percent over this time.
The state sectors with the greatest job gains in percentage terms since February 2010 are: professional
and business services at 20.9 percent (65,800 jobs), leisure and hospitality at 10.0 percent (27,100 jobs)
and education and health services at 9.2 percent (37,800 jobs).
Jobs
In June, private-sector employment in Missouri fell by 2,500 jobs. Over the past year, Missouri businesses
have added 22,200 jobs. This compares with an increase of 47,600 jobs over the 12 months through June
2015.
Unemployment is down 0.5 percentage point from one year earlier and is 5.3 percentage points below its
recent peak of 9.8 percent in February 2010.
There were 140,200 Missouri residents unemployed in June 2016.
The unemployment rate in Missouri was 4.5 percent in June 2016, up 0.2 percentage point from May. The
rate was 0.4 percentage point below the national rate of 4.9 percent.
Adjusting for inflation, state average hourly earnings have fallen by 0.3 percent over the past year.
Nationally, real average hourly earnings have increased by 1.6 percent (not seasonally adjusted).
-25
-20
-15
-10
-5
0
5
10
15
20
Source: JEC Democratic staff calculations based on seasonally adjusted data from the Bureau of Labor Statistics
Private-Sector Job Growth in MissouriMonthly, Jan. 2008 - Jun. 2016, thousands
2008 2009 2010 2011 2012 2013 2014
Bush administration
Obama administration
2015 2016
JULY 2016

Missouri United States
Private-Sector Jobs Added……………………………….Past 12 Months 22,200 2.3 million
Since Feb. 2010 171,400 14.8 million
Unemployment Rate …………………………………………………..June 2016 4.5% 4.9%
June 2015 5.0% 5.3%
Recession-Era Peak 9.8% 10.0%
Median Household Income (2014 $)…………………………………………………………….2014 $56,600 $53,700
2007 (Pre-Recession) $52,500 $57,400
Poverty Rate...………………………………………………………………..2014 10.4% 14.8%
2007 (Pre-Recession) 12.8% 12.5%
All Veterans' Unemployment Rate………………………….'2015 4.8% 4.6%
Post-9/11 Veterans' Unemployment Rate…………………………2015 7.3% 5.8%
Percentage Without Health Insurance...………………………………………………………….2014 11.7% 11.7%
2013 13.0% 14.5%
◙
◙
◙
◙
◙
◙
* Note: Because of methodological differences, total U.S. real GDP by state differs slightly from headline national GDP figures
Exports over the past 12 months are up 42.7 percent from their level in 2009 (inflation-adjusted).
In Missouri, goods exports totaled $1.2 billion in May and $13.9 billion over the past year, up 4.0 percent
from the 12 months ending in May 2015 (inflation-adjusted).
Exports
In May 2016, builders in Missouri broke ground on 22,810 new housing units (seasonally adjusted annual
rate), bringing the average over the past 12 months to 18,448 units. That marks an increase of 24.0
percent from the average over the prior 12 months.
Home prices in Missouri increased by 6.5 percent from the first quarter of 2015 to the first quarter of 2016.
They are up 20.7 percent since their recent low in the second quarter of 2011.
Housing
Real gross domestic product (GDP) in Missouri grew by 1.2 percent over the four quarters through the
fourth quarter of 2015, below the national average growth rate of 2.0 percent.*
State Gross Domestic Product
Since the official end of the Great Recession in the second quarter of 2009, Missouri GDP growth has
averaged 0.9 percent at an annual rate, compared with a national average of 1.9 percent.
*** Note: state-level data changes may not be statistically significant due to sampling variation. Individual monthly readings should be
interpreted with caution and in the context of longer-term trends and other data that become available.
** A list of sources used to compile the Missouri economic snapshot is available at: http://bit.ly/JEC-state-by-state-sources
**** For additional Missouri-specific labor sector statistics, please refer to the Missouri office: http://www.labor.mo.gov/data/
State Quick Facts

U.S. Congress Joint Economic Committee
◙
◙
◙
◙
◙
◙
◙
◙
In June 2016, average hourly earnings of private-sector workers in Montana were $22.16. The average
workweek was 33.0 hours, and average weekly earnings were $731.28.
Unemployment
Earnings
Economic Snapshot: Montana
**Includes Bureau of Labor Statistics jobs, unemployment and earnings data through June 2016**
**Last updated on July 22nd; July data will be released on August 19th**
Since February 2010, the national low point for private-sector employment, Montana businesses have
added 38,900 jobs (an increase of 11.6 percent). Nationally, private payrolls have increased by 13.8
percent over this time.
The state sectors with the greatest job gains in percentage terms since February 2010 are: education and
health services at 18.9 percent (11,900 jobs), manufacturing at 17.4 percent (2,900 jobs) and financial
activities at 14.1 percent (3,000 jobs).
Jobs
In June, private-sector employment in Montana grew by 600 jobs. Over the past year, Montana businesses
have added 2,900 jobs. This compares with an increase of 7,400 jobs over the 12 months through June
2015.
Unemployment is up 0.1 percentage point from one year earlier but remains 3.2 percentage points below
its recent peak of 7.4 percent in April 2010.
There were 21,800 Montana residents unemployed in June 2016.
The unemployment rate in Montana was 4.2 percent in June 2016, holding constant from May. The rate
was 0.7 percentage point below the national rate of 4.9 percent.
Adjusting for inflation, state average hourly earnings have risen by 0.6 percent over the past year.
Nationally, real average hourly earnings have increased by 1.6 percent (not seasonally adjusted).
-5
-4
-3
-2
-1
0
1
2
3
4
5
Source: JEC Democratic staff calculations based on seasonally adjusted data from the Bureau of Labor Statistics
Private-Sector Job Growth in MontanaMonthly, Jan. 2008 - Jun. 2016, thousands
2008 2009 2010 2011 2012 2013 2014
Bush administration
Obama administration
2015 2016
JULY 2016
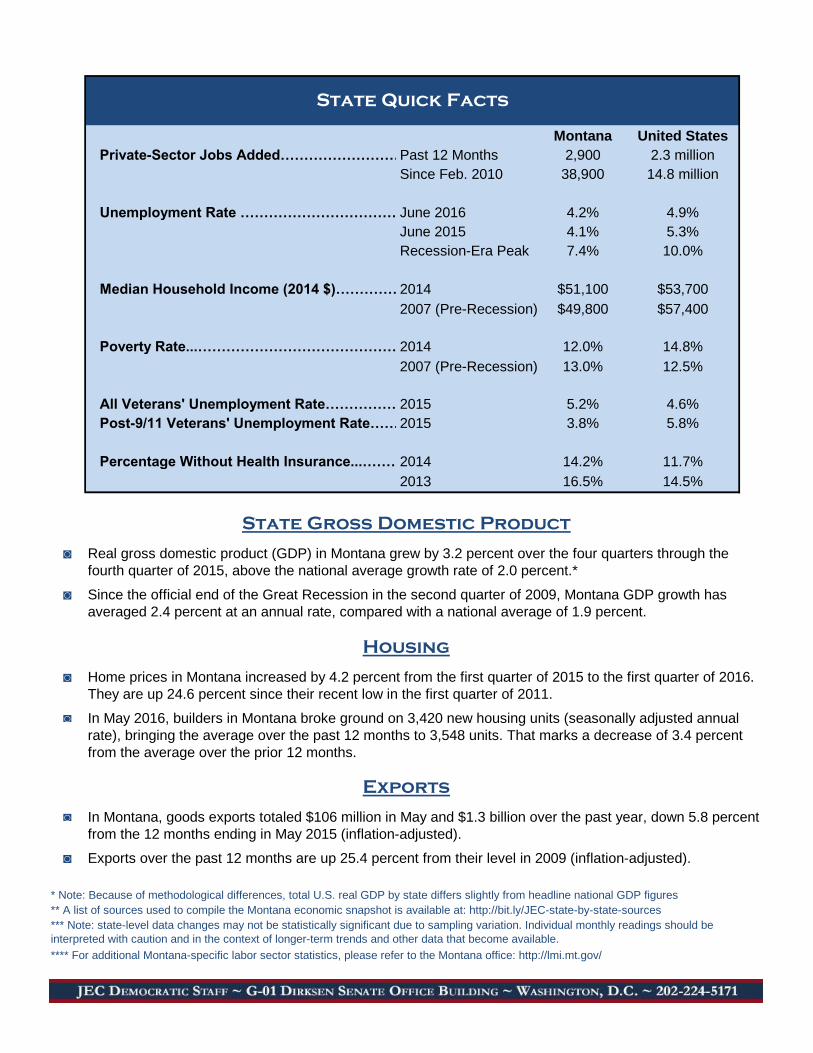
Montana United States
Private-Sector Jobs Added……………………………….Past 12 Months 2,900 2.3 million
Since Feb. 2010 38,900 14.8 million
Unemployment Rate …………………………………………………..June 2016 4.2% 4.9%
June 2015 4.1% 5.3%
Recession-Era Peak 7.4% 10.0%
Median Household Income (2014 $)…………………………………………………………….2014 $51,100 $53,700
2007 (Pre-Recession) $49,800 $57,400
Poverty Rate...………………………………………………………………..2014 12.0% 14.8%
2007 (Pre-Recession) 13.0% 12.5%
All Veterans' Unemployment Rate………………………….'2015 5.2% 4.6%
Post-9/11 Veterans' Unemployment Rate…………………………2015 3.8% 5.8%
Percentage Without Health Insurance...………………………………………………………….2014 14.2% 11.7%
2013 16.5% 14.5%
◙
◙
◙
◙
◙
◙
* Note: Because of methodological differences, total U.S. real GDP by state differs slightly from headline national GDP figures
Exports over the past 12 months are up 25.4 percent from their level in 2009 (inflation-adjusted).
In Montana, goods exports totaled $106 million in May and $1.3 billion over the past year, down 5.8 percent
from the 12 months ending in May 2015 (inflation-adjusted).
Exports
In May 2016, builders in Montana broke ground on 3,420 new housing units (seasonally adjusted annual
rate), bringing the average over the past 12 months to 3,548 units. That marks a decrease of 3.4 percent
from the average over the prior 12 months.
Home prices in Montana increased by 4.2 percent from the first quarter of 2015 to the first quarter of 2016.
They are up 24.6 percent since their recent low in the first quarter of 2011.
Housing
Real gross domestic product (GDP) in Montana grew by 3.2 percent over the four quarters through the
fourth quarter of 2015, above the national average growth rate of 2.0 percent.*
State Gross Domestic Product
Since the official end of the Great Recession in the second quarter of 2009, Montana GDP growth has
averaged 2.4 percent at an annual rate, compared with a national average of 1.9 percent.
*** Note: state-level data changes may not be statistically significant due to sampling variation. Individual monthly readings should be
interpreted with caution and in the context of longer-term trends and other data that become available.
** A list of sources used to compile the Montana economic snapshot is available at: http://bit.ly/JEC-state-by-state-sources
**** For additional Montana-specific labor sector statistics, please refer to the Montana office: http://lmi.mt.gov/
State Quick Facts

U.S. Congress Joint Economic Committee
◙
◙
◙
◙
◙
◙
◙
◙
In June 2016, average hourly earnings of private-sector workers in Nebraska were $22.81. The average
workweek was 34.2 hours, and average weekly earnings were $780.10.
Unemployment
Earnings
Economic Snapshot: Nebraska
**Includes Bureau of Labor Statistics jobs, unemployment and earnings data through June 2016**
**Last updated on July 22nd; July data will be released on August 19th**
Since February 2010, the national low point for private-sector employment, Nebraska businesses have
added 71,600 jobs (an increase of 9.3 percent). Nationally, private payrolls have increased by 13.8 percent
over this time.
The state sectors with the greatest job gains in percentage terms since February 2010 are: professional
and business services at 19.4 percent (19,300 jobs), leisure and hospitality at 16.4 percent (13,100 jobs)
and logging, mining and construction at 14.5 percent (6,300 jobs).
Jobs
In June, private-sector employment in Nebraska fell by 300 jobs. Over the past year, Nebraska businesses
have added 9,600 jobs. This compares with an increase of 11,100 jobs over the 12 months through June
2015.
Unemployment held constant from one year earlier and is 1.8 percentage points below its recent peak of
4.8 percent in March 2010.
There were 30,800 Nebraska residents unemployed in June 2016.
The unemployment rate in Nebraska was 3.0 percent in June 2016, holding constant from May. The rate
was 1.9 percentage points below the national rate of 4.9 percent.
Adjusting for inflation, state average hourly earnings have risen by 4.0 percent over the past year.
Nationally, real average hourly earnings have increased by 1.6 percent (not seasonally adjusted).
-8
-6
-4
-2
0
2
4
6
Source: JEC Democratic staff calculations based on seasonally adjusted data from the Bureau of Labor Statistics
Private-Sector Job Growth in NebraskaMonthly, Jan. 2008 - Jun. 2016, thousands
2008 2009 2010 2011 2012 2013 2014
Bush administration
Obama administration
2015 2016
JULY 2016

Nebraska United States
Private-Sector Jobs Added……………………………….Past 12 Months 9,600 2.3 million
Since Feb. 2010 71,600 14.8 million
Unemployment Rate …………………………………………………..June 2016 3.0% 4.9%
June 2015 3.0% 5.3%
Recession-Era Peak 4.8% 10.0%
Median Household Income (2014 $)…………………………………………………………….2014 $56,900 $53,700
2007 (Pre-Recession) $56,100 $57,400
Poverty Rate...………………………………………………………………..2014 11.8% 14.8%
2007 (Pre-Recession) 9.9% 12.5%
All Veterans' Unemployment Rate………………………….'2015 3.4% 4.6%
Post-9/11 Veterans' Unemployment Rate…………………………2015 3.8% 5.8%
Percentage Without Health Insurance...………………………………………………………….2014 9.7% 11.7%
2013 11.3% 14.5%
◙
◙
◙
◙
◙
◙
* Note: Because of methodological differences, total U.S. real GDP by state differs slightly from headline national GDP figures
Exports over the past 12 months are up 22.1 percent from their level in 2009 (inflation-adjusted).
In Nebraska, goods exports totaled $526 million in May and $6.1 billion over the past year, down 10.6
percent from the 12 months ending in May 2015 (inflation-adjusted).
Exports
In May 2016, builders in Nebraska broke ground on 10,130 new housing units (seasonally adjusted annual
rate), bringing the average over the past 12 months to 8,112 units. That marks an increase of 13.2 percent
from the average over the prior 12 months.
Home prices in Nebraska increased by 3.7 percent from the first quarter of 2015 to the first quarter of 2016.
They are up 21.0 percent since their recent low in the fourth quarter of 2010.
Housing
Real gross domestic product (GDP) in Nebraska grew by 0.8 percent over the four quarters through the
fourth quarter of 2015, below the national average growth rate of 2.0 percent.*
State Gross Domestic Product
Since the official end of the Great Recession in the second quarter of 2009, Nebraska GDP growth has
averaged 2.6 percent at an annual rate, compared with a national average of 1.9 percent.
*** Note: state-level data changes may not be statistically significant due to sampling variation. Individual monthly readings should be
interpreted with caution and in the context of longer-term trends and other data that become available.
** A list of sources used to compile the Nebraska economic snapshot is available at: http://bit.ly/JEC-state-by-state-sources
**** For additional Nebraska-specific labor sector statistics, please refer to the Nebraska office: http://www.dol.nebraska.gov/
State Quick Facts

U.S. Congress Joint Economic Committee
◙
◙
◙
◙
◙
◙
◙
◙
In June 2016, average hourly earnings of private-sector workers in Nevada were $22.01. The average
workweek was 34.0 hours, and average weekly earnings were $748.34.
Unemployment
Earnings
Economic Snapshot: Nevada
**Includes Bureau of Labor Statistics jobs, unemployment and earnings data through June 2016**
**Last updated on July 22nd; July data will be released on August 19th**
Since February 2010, the national low point for private-sector employment, Nevada businesses have
added 167,900 jobs (an increase of 17.4 percent). Nationally, private payrolls have increased by 13.8
percent over this time.
The state sectors with the greatest job gains in percentage terms since February 2010 are: education and
health services at 26.6 percent (26,700 jobs), professional and business services at 25.9 percent (34,600
jobs) and construction at 22.1 percent (13,600 jobs).
Jobs
In June, private-sector employment in Nevada grew by 6,300 jobs. Over the past year, Nevada businesses
have added 31,500 jobs. This compares with an increase of 36,900 jobs over the 12 months through June
2015.
Unemployment is down 0.4 percentage point from one year earlier and is 7.3 percentage points below its
recent peak of 13.7 percent in November 2010.
There were 91,400 Nevada residents unemployed in June 2016.
The unemployment rate in Nevada was 6.4 percent in June 2016, up 0.3 percentage point from May. The
rate was 1.5 percentage points above the national rate of 4.9 percent.
Adjusting for inflation, state average hourly earnings have risen by 0.3 percent over the past year.
Nationally, real average hourly earnings have increased by 1.6 percent (not seasonally adjusted).
-20
-15
-10
-5
0
5
10
Source: JEC Democratic staff calculations based on seasonally adjusted data from the Bureau of Labor Statistics
Private-Sector Job Growth in NevadaMonthly, Jan. 2008 - Jun. 2016, thousands
2008 2009 2010 2011 2012 2013 2014
Bush administration
Obama administration
2015 2016
JULY 2016

Nevada United States
Private-Sector Jobs Added……………………………….Past 12 Months 31,500 2.3 million
Since Feb. 2010 167,900 14.8 million
Unemployment Rate …………………………………………………..June 2016 6.4% 4.9%
June 2015 6.8% 5.3%
Recession-Era Peak 13.7% 10.0%
Median Household Income (2014 $)…………………………………………………………….2014 $49,900 $53,700
2007 (Pre-Recession) $61,700 $57,400
Poverty Rate...………………………………………………………………..2014 17.0% 14.8%
2007 (Pre-Recession) 9.7% 12.5%
All Veterans' Unemployment Rate………………………….'2015 5.8% 4.6%
Post-9/11 Veterans' Unemployment Rate…………………………2015 7.7% 5.8%
Percentage Without Health Insurance...………………………………………………………….2014 15.2% 11.7%
2013 20.7% 14.5%
◙
◙
◙
◙
◙
◙
* Note: Because of methodological differences, total U.S. real GDP by state differs slightly from headline national GDP figures
Exports over the past 12 months are up 52.1 percent from their level in 2009 (inflation-adjusted).
In Nevada, goods exports totaled $663 million in May and $8.8 billion over the past year, up 22.5 percent
from the 12 months ending in May 2015 (inflation-adjusted).
Exports
In May 2016, builders in Nevada broke ground on 18,600 new housing units (seasonally adjusted annual
rate), bringing the average over the past 12 months to 15,035 units. That marks an increase of 8.4 percent
from the average over the prior 12 months.
Home prices in Nevada increased by 9.4 percent from the first quarter of 2015 to the first quarter of 2016.
They are up 79.2 percent since their recent low in the fourth quarter of 2011.
Housing
Real gross domestic product (GDP) in Nevada grew by 2.3 percent over the four quarters through the
fourth quarter of 2015, above the national average growth rate of 2.0 percent.*
State Gross Domestic Product
Since the official end of the Great Recession in the second quarter of 2009, Nevada GDP growth has
averaged 1.0 percent at an annual rate, compared with a national average of 1.9 percent.
*** Note: state-level data changes may not be statistically significant due to sampling variation. Individual monthly readings should be
interpreted with caution and in the context of longer-term trends and other data that become available.
** A list of sources used to compile the Nevada economic snapshot is available at: http://bit.ly/JEC-state-by-state-sources
**** For additional Nevada-specific labor sector statistics, please refer to the Nevada office: http://www.nevadaworkforce.com/
State Quick Facts

U.S. Congress Joint Economic Committee
◙
◙
◙
◙
◙
◙
◙
◙
Unemployment is down 0.7 percentage point from one year earlier and is 3.8 percentage points below its
recent peak of 6.6 percent in July 2009.
There were 21,000 New Hampshire residents unemployed in June 2016.
The unemployment rate in New Hampshire was 2.8 percent in June 2016, up 0.1 percentage point from
May. The rate was 2.1 percentage points below the national rate of 4.9 percent.
Adjusting for inflation, state average hourly earnings have risen by 0.8 percent over the past year.
Nationally, real average hourly earnings have increased by 1.6 percent (not seasonally adjusted).
Economic Snapshot: New Hampshire
**Includes Bureau of Labor Statistics jobs, unemployment and earnings data through June 2016**
**Last updated on July 22nd; July data will be released on August 19th**
Since February 2010, the national low point for private-sector employment, New Hampshire businesses
have added 52,500 jobs (an increase of 10.0 percent). Nationally, private payrolls have increased by 13.8
percent over this time.
The state sectors with the greatest job gains in percentage terms since February 2010 are: professional
and business services at 24.3 percent (15,300 jobs), other services at 19.9 percent (4,400 jobs) and
construction at 19.3 percent (4,100 jobs).
Jobs
In June, private-sector employment in New Hampshire grew by 3,600 jobs. Over the past year, New
Hampshire businesses have added 12,000 jobs. This compares with an increase of 9,900 jobs over the 12
months through June 2015.
In June 2016, average hourly earnings of private-sector workers in New Hampshire were $25.08. The
average workweek was 33.6 hours, and average weekly earnings were $842.69.
Unemployment
Earnings
-8
-6
-4
-2
0
2
4
6
8
Source: JEC Democratic staff calculations based on seasonally adjusted data from the Bureau of Labor Statistics
Private-Sector Job Growth in New HampshireMonthly, Jan. 2008 - Jun. 2016, thousands
2008 2009 2010 2011 2012 2013 2014
Bush administration
Obama administration
2015 2016
JULY 2016

New HampshireUnited States
Private-Sector Jobs Added……………………………….Past 12 Months 12,000 2.3 million
Since Feb. 2010 52,500 14.8 million
Unemployment Rate …………………………………………………..June 2016 2.8% 4.9%
June 2015 3.5% 5.3%
Recession-Era Peak 6.6% 10.0%
Median Household Income (2014 $)…………………………………………………………….2014 $73,400 $53,700
2007 (Pre-Recession) $77,200 $57,400
Poverty Rate...………………………………………………………………..2014 7.2% 14.8%
2007 (Pre-Recession) 5.8% 12.5%
All Veterans' Unemployment Rate………………………….'2015 3.7% 4.6%
Post-9/11 Veterans' Unemployment Rate…………………………2015 4.1% 5.8%
Percentage Without Health Insurance...………………………………………………………….2014 9.2% 11.7%
2013 10.7% 14.5%
◙
◙
◙
◙
◙
◙
**** For additional New Hampshire-specific labor sector statistics, please refer to the New Hampshire office: http://www.nh.gov/nhes/elmi/
State Quick Facts
*** Note: state-level data changes may not be statistically significant due to sampling variation. Individual monthly readings should be
interpreted with caution and in the context of longer-term trends and other data that become available.
** A list of sources used to compile the New Hampshire economic snapshot is available at: http://bit.ly/JEC-state-by-state-sources
Home prices in New Hampshire increased by 3.4 percent from the first quarter of 2015 to the first quarter
of 2016. They are up 16.7 percent since their recent low in the first quarter of 2012.
Housing
Real gross domestic product (GDP) in New Hampshire grew by 0.9 percent over the four quarters through
the fourth quarter of 2015, below the national average growth rate of 2.0 percent.*
State Gross Domestic Product
Since the official end of the Great Recession in the second quarter of 2009, New Hampshire GDP growth
has averaged 1.8 percent at an annual rate, compared with a national average of 1.9 percent.
* Note: Because of methodological differences, total U.S. real GDP by state differs slightly from headline national GDP figures
Exports over the past 12 months are up 27.0 percent from their level in 2009 (inflation-adjusted).
In New Hampshire, goods exports totaled $384 million in May and $4.0 billion over the past year, up 1.8
percent from the 12 months ending in May 2015 (inflation-adjusted).
Exports
In May 2016, builders in New Hampshire broke ground on 3,330 new housing units (seasonally adjusted
annual rate), bringing the average over the past 12 months to 3,578 units. That marks an increase of 13.7
percent from the average over the prior 12 months.
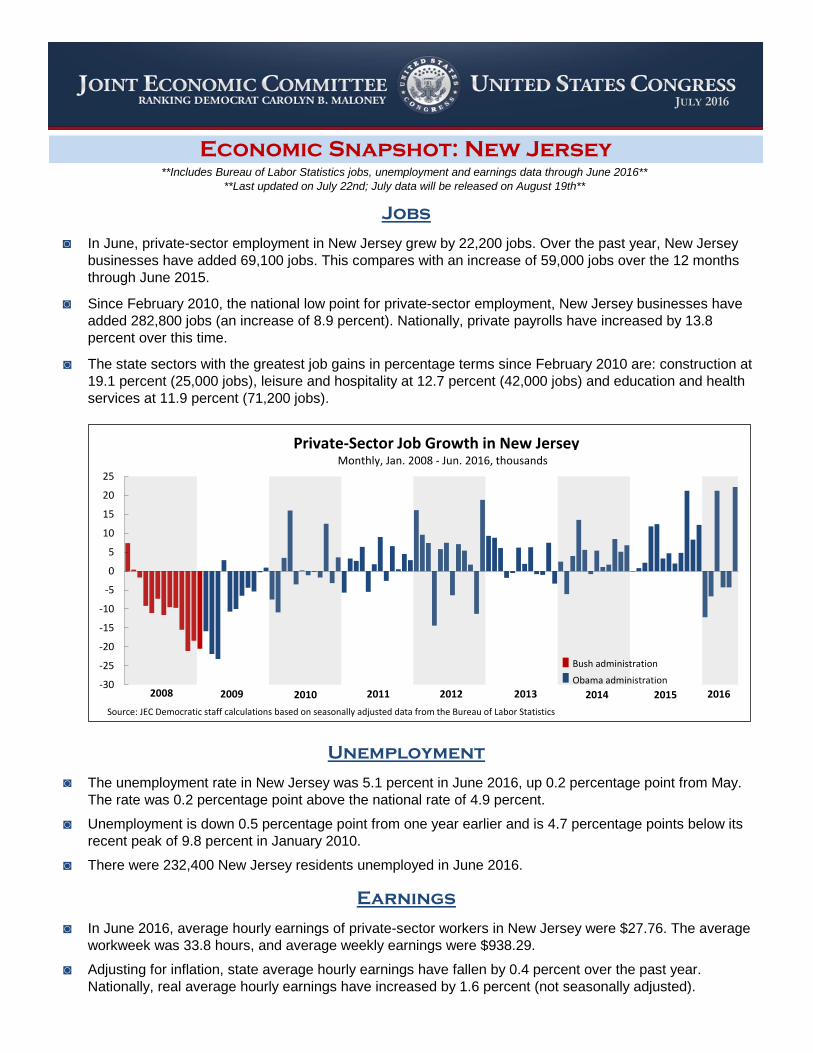
U.S. Congress Joint Economic Committee
◙
◙
◙
◙
◙
◙
◙
◙
In June 2016, average hourly earnings of private-sector workers in New Jersey were $27.76. The average
workweek was 33.8 hours, and average weekly earnings were $938.29.
Unemployment
Earnings
Economic Snapshot: New Jersey
**Includes Bureau of Labor Statistics jobs, unemployment and earnings data through June 2016**
**Last updated on July 22nd; July data will be released on August 19th**
Since February 2010, the national low point for private-sector employment, New Jersey businesses have
added 282,800 jobs (an increase of 8.9 percent). Nationally, private payrolls have increased by 13.8
percent over this time.
The state sectors with the greatest job gains in percentage terms since February 2010 are: construction at
19.1 percent (25,000 jobs), leisure and hospitality at 12.7 percent (42,000 jobs) and education and health
services at 11.9 percent (71,200 jobs).
Jobs
In June, private-sector employment in New Jersey grew by 22,200 jobs. Over the past year, New Jersey
businesses have added 69,100 jobs. This compares with an increase of 59,000 jobs over the 12 months
through June 2015.
Unemployment is down 0.5 percentage point from one year earlier and is 4.7 percentage points below its
recent peak of 9.8 percent in January 2010.
There were 232,400 New Jersey residents unemployed in June 2016.
The unemployment rate in New Jersey was 5.1 percent in June 2016, up 0.2 percentage point from May.
The rate was 0.2 percentage point above the national rate of 4.9 percent.
Adjusting for inflation, state average hourly earnings have fallen by 0.4 percent over the past year.
Nationally, real average hourly earnings have increased by 1.6 percent (not seasonally adjusted).
-30
-25
-20
-15
-10
-5
0
5
10
15
20
25
Source: JEC Democratic staff calculations based on seasonally adjusted data from the Bureau of Labor Statistics
Private-Sector Job Growth in New JerseyMonthly, Jan. 2008 - Jun. 2016, thousands
2008 2009 2010 2011 2012 2013 2014
Bush administration
Obama administration
2015 2016
JULY 2016

New Jersey United States
Private-Sector Jobs Added……………………………….Past 12 Months 69,100 2.3 million
Since Feb. 2010 282,800 14.8 million
Unemployment Rate …………………………………………………..June 2016 5.1% 4.9%
June 2015 5.6% 5.3%
Recession-Era Peak 9.8% 10.0%
Median Household Income (2014 $)…………………………………………………………….2014 $65,200 $53,700
2007 (Pre-Recession) $69,100 $57,400
Poverty Rate...………………………………………………………………..2014 11.3% 14.8%
2007 (Pre-Recession) 8.7% 12.5%
All Veterans' Unemployment Rate………………………….'2015 5.4% 4.6%
Post-9/11 Veterans' Unemployment Rate…………………………2015 1.4% 5.8%
Percentage Without Health Insurance...………………………………………………………….2014 10.9% 11.7%
2013 13.2% 14.5%
◙
◙
◙
◙
◙
◙
* Note: Because of methodological differences, total U.S. real GDP by state differs slightly from headline national GDP figures
Exports over the past 12 months are up 12.0 percent from their level in 2009 (inflation-adjusted).
In New Jersey, goods exports totaled $2.7 billion in May and $31.2 billion over the past year, down 5.3
percent from the 12 months ending in May 2015 (inflation-adjusted).
Exports
In May 2016, builders in New Jersey broke ground on 17,460 new housing units (seasonally adjusted
annual rate), bringing the average over the past 12 months to 30,740 units. That marks an increase of 24.6
percent from the average over the prior 12 months.
Home prices in New Jersey increased by 1.0 percent from the first quarter of 2015 to the first quarter of
2016. They are up 8.6 percent since their recent low in the first quarter of 2012.
Housing
Real gross domestic product (GDP) in New Jersey grew by 2.1 percent over the four quarters through the
fourth quarter of 2015, above the national average growth rate of 2.0 percent.*
State Gross Domestic Product
Since the official end of the Great Recession in the second quarter of 2009, New Jersey GDP growth has
averaged 1.0 percent at an annual rate, compared with a national average of 1.9 percent.
*** Note: state-level data changes may not be statistically significant due to sampling variation. Individual monthly readings should be
interpreted with caution and in the context of longer-term trends and other data that become available.
** A list of sources used to compile the New Jersey economic snapshot is available at: http://bit.ly/JEC-state-by-state-sources
**** For additional New Jersey-specific labor sector statistics, please refer to the New Jersey office:
http://lwd.dol.state.nj.us/labor/lpa/LMI_index.html
State Quick Facts

U.S. Congress Joint Economic Committee
◙
◙
◙
◙
◙
◙
◙
◙
In June 2016, average hourly earnings of private-sector workers in New Mexico were $20.32. The average
workweek was 33.4 hours, and average weekly earnings were $678.69.
Unemployment
Earnings
Economic Snapshot: New Mexico
**Includes Bureau of Labor Statistics jobs, unemployment and earnings data through June 2016**
**Last updated on July 22nd; July data will be released on August 19th**
Since February 2010, the national low point for private-sector employment, New Mexico businesses have
added 38,600 jobs (an increase of 6.4 percent). Nationally, private payrolls have increased by 13.8 percent
over this time.
The state sectors with the greatest job gains in percentage terms since February 2010 are: education and
health services at 17.6 percent (21,000 jobs), leisure and hospitality at 16.7 percent (13,900 jobs) and
mining and logging at 9.0 percent (1,600 jobs).
Jobs
In June, private-sector employment in New Mexico grew by 1,900 jobs. Over the past year, New Mexico
businesses have added 6,500 jobs. This compares with an increase of 7,300 jobs over the 12 months
through June 2015.
Unemployment is down 0.4 percentage point from one year earlier and is 2.1 percentage points below its
recent peak of 8.3 percent in July 2010.
There were 57,500 New Mexico residents unemployed in June 2016.
The unemployment rate in New Mexico was 6.2 percent in June 2016, holding constant from May. The rate
was 1.3 percentage points above the national rate of 4.9 percent.
Adjusting for inflation, state average hourly earnings have fallen by 0.5 percent over the past year.
Nationally, real average hourly earnings have increased by 1.6 percent (not seasonally adjusted).
-10
-8
-6
-4
-2
0
2
4
6
8
Source: JEC Democratic staff calculations based on seasonally adjusted data from the Bureau of Labor Statistics
Private-Sector Job Growth in New MexicoMonthly, Jan. 2008 - Jun. 2016, thousands
2008 2009 2010 2011 2012 2013 2014
Bush administration
Obama administration
2015 2016
JULY 2016
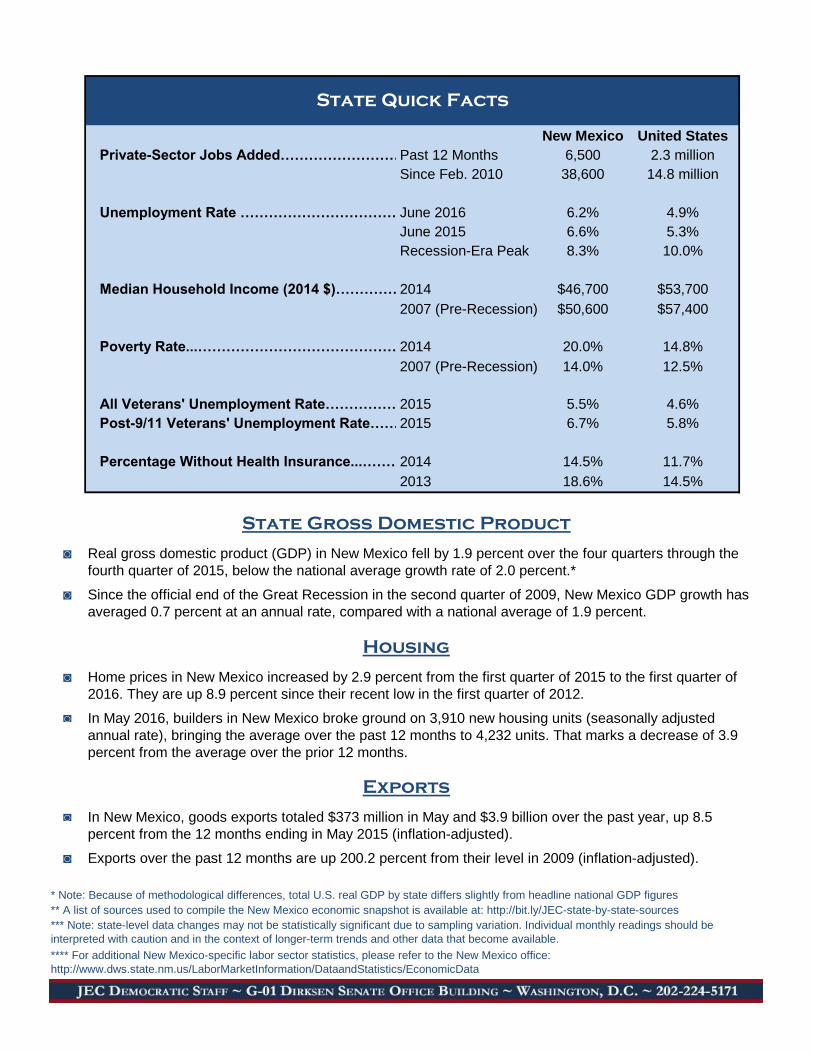
New Mexico United States
Private-Sector Jobs Added……………………………….Past 12 Months 6,500 2.3 million
Since Feb. 2010 38,600 14.8 million
Unemployment Rate …………………………………………………..June 2016 6.2% 4.9%
June 2015 6.6% 5.3%
Recession-Era Peak 8.3% 10.0%
Median Household Income (2014 $)…………………………………………………………….2014 $46,700 $53,700
2007 (Pre-Recession) $50,600 $57,400
Poverty Rate...………………………………………………………………..2014 20.0% 14.8%
2007 (Pre-Recession) 14.0% 12.5%
All Veterans' Unemployment Rate………………………….'2015 5.5% 4.6%
Post-9/11 Veterans' Unemployment Rate…………………………2015 6.7% 5.8%
Percentage Without Health Insurance...………………………………………………………….2014 14.5% 11.7%
2013 18.6% 14.5%
◙
◙
◙
◙
◙
◙
* Note: Because of methodological differences, total U.S. real GDP by state differs slightly from headline national GDP figures
Exports over the past 12 months are up 200.2 percent from their level in 2009 (inflation-adjusted).
In New Mexico, goods exports totaled $373 million in May and $3.9 billion over the past year, up 8.5
percent from the 12 months ending in May 2015 (inflation-adjusted).
Exports
In May 2016, builders in New Mexico broke ground on 3,910 new housing units (seasonally adjusted
annual rate), bringing the average over the past 12 months to 4,232 units. That marks a decrease of 3.9
percent from the average over the prior 12 months.
Home prices in New Mexico increased by 2.9 percent from the first quarter of 2015 to the first quarter of
2016. They are up 8.9 percent since their recent low in the first quarter of 2012.
Housing
Real gross domestic product (GDP) in New Mexico fell by 1.9 percent over the four quarters through the
fourth quarter of 2015, below the national average growth rate of 2.0 percent.*
State Gross Domestic Product
Since the official end of the Great Recession in the second quarter of 2009, New Mexico GDP growth has
averaged 0.7 percent at an annual rate, compared with a national average of 1.9 percent.
*** Note: state-level data changes may not be statistically significant due to sampling variation. Individual monthly readings should be
interpreted with caution and in the context of longer-term trends and other data that become available.
** A list of sources used to compile the New Mexico economic snapshot is available at: http://bit.ly/JEC-state-by-state-sources
**** For additional New Mexico-specific labor sector statistics, please refer to the New Mexico office:
http://www.dws.state.nm.us/LaborMarketInformation/DataandStatistics/EconomicData
State Quick Facts

U.S. Congress Joint Economic Committee
◙
◙
◙
◙
◙
◙
◙
◙
In June 2016, average hourly earnings of private-sector workers in New York were $28.68. The average
workweek was 33.5 hours, and average weekly earnings were $960.78.
Unemployment
Earnings
Economic Snapshot: New York
**Includes Bureau of Labor Statistics jobs, unemployment and earnings data through June 2016**
**Last updated on July 22nd; July data will be released on August 19th**
Since February 2010, the national low point for private-sector employment, New York businesses have
added 949,300 jobs (an increase of 13.6 percent). Nationally, private payrolls have increased by 13.8
percent over this time.
The state sectors with the greatest job gains in percentage terms since February 2010 are: leisure and
hospitality at 27.0 percent (195,100 jobs), construction at 21.3 percent (65,000 jobs) and professional and
business services at 17.0 percent (184,700 jobs).
Jobs
In June, private-sector employment in New York grew by 23,900 jobs. Over the past year, New York
businesses have added 96,700 jobs. This compares with an increase of 161,300 jobs over the 12 months
through June 2015.
Unemployment is down 0.5 percentage point from one year earlier and is 4.2 percentage points below its
recent peak of 8.9 percent in December 2009.
There were 451,600 New York residents unemployed in June 2016.
The unemployment rate in New York was 4.7 percent in June 2016, holding constant from May. The rate
was 0.2 percentage point below the national rate of 4.9 percent.
Adjusting for inflation, state average hourly earnings have fallen by 0.2 percent over the past year.
Nationally, real average hourly earnings have increased by 1.6 percent (not seasonally adjusted).
-80
-60
-40
-20
0
20
40
60
Source: JEC Democratic staff calculations based on seasonally adjusted data from the Bureau of Labor Statistics
Private-Sector Job Growth in New YorkMonthly, Jan. 2008 - Jun. 2016, thousands
2008 2009 2010 2011 2012 2013 2014
Bush administration
Obama administration
2015 2016
JULY 2016

New York United States
Private-Sector Jobs Added……………………………….Past 12 Months 96,700 2.3 million
Since Feb. 2010 949,300 14.8 million
Unemployment Rate …………………………………………………..June 2016 4.7% 4.9%
June 2015 5.2% 5.3%
Recession-Era Peak 8.9% 10.0%
Median Household Income (2014 $)…………………………………………………………….2014 $54,300 $53,700
2007 (Pre-Recession) $55,900 $57,400
Poverty Rate...………………………………………………………………..2014 14.0% 14.8%
2007 (Pre-Recession) 14.5% 12.5%
All Veterans' Unemployment Rate………………………….'2015 3.7% 4.6%
Post-9/11 Veterans' Unemployment Rate…………………………2015 5.2% 5.8%
Percentage Without Health Insurance...………………………………………………………….2014 8.7% 11.7%
2013 10.7% 14.5%
◙
◙
◙
◙
◙
◙
* Note: Because of methodological differences, total U.S. real GDP by state differs slightly from headline national GDP figures
Exports over the past 12 months are up 28.5 percent from their level in 2009 (inflation-adjusted).
In New York, goods exports totaled $6.1 billion in May and $75.3 billion over the past year, down 4.4
percent from the 12 months ending in May 2015 (inflation-adjusted).
Exports
In May 2016, builders in New York broke ground on 24,470 new housing units (seasonally adjusted annual
rate), bringing the average over the past 12 months to 47,728 units. That marks an increase of 12.1
percent from the average over the prior 12 months.
Home prices in New York increased by 2.2 percent from the first quarter of 2015 to the first quarter of
2016. They are up 9.8 percent since their recent low in the fourth quarter of 2011.
Housing
Real gross domestic product (GDP) in New York grew by 1.5 percent over the four quarters through the
fourth quarter of 2015, below the national average growth rate of 2.0 percent.*
State Gross Domestic Product
Since the official end of the Great Recession in the second quarter of 2009, New York GDP growth has
averaged 1.7 percent at an annual rate, compared with a national average of 1.9 percent.
*** Note: state-level data changes may not be statistically significant due to sampling variation. Individual monthly readings should be
interpreted with caution and in the context of longer-term trends and other data that become available.
** A list of sources used to compile the New York economic snapshot is available at: http://bit.ly/JEC-state-by-state-sources
**** For additional New York-specific labor sector statistics, please refer to the New York office: http://www.labor.state.ny.us/stats/index.shtm
State Quick Facts

U.S. Congress Joint Economic Committee
◙
◙
◙
◙
◙
◙
◙
◙
In June 2016, average hourly earnings of private-sector workers in North Carolina were $23.30. The
average workweek was 34.5 hours, and average weekly earnings were $803.85.
Unemployment
Earnings
Economic Snapshot: North Carolina
**Includes Bureau of Labor Statistics jobs, unemployment and earnings data through June 2016**
**Last updated on July 22nd; July data will be released on August 19th**
Since February 2010, the national low point for private-sector employment, North Carolina businesses have
added 473,400 jobs (an increase of 15.2 percent). Nationally, private payrolls have increased by 13.8
percent over this time.
The state sectors with the greatest job gains in percentage terms since February 2010 are: professional
and business services at 30.0 percent (141,500 jobs), leisure and hospitality at 21.5 percent (83,400 jobs)
and trade, transportation and utilities at 15.6 percent (111,000 jobs).
Jobs
In June, private-sector employment in North Carolina grew by 10,400 jobs. Over the past year, North
Carolina businesses have added 79,300 jobs. This compares with an increase of 96,800 jobs over the 12
months through June 2015.
Unemployment is down 0.9 percentage point from one year earlier and is 6.4 percentage points below its
recent peak of 11.3 percent in March 2010.
There were 239,400 North Carolina residents unemployed in June 2016.
The unemployment rate in North Carolina was 4.9 percent in June 2016, down 0.2 percentage point from
May. The rate was the same as the national rate of 4.9 percent.
Adjusting for inflation, state average hourly earnings have risen by 4.7 percent over the past year.
Nationally, real average hourly earnings have increased by 1.6 percent (not seasonally adjusted).
-60
-50
-40
-30
-20
-10
0
10
20
30
Source: JEC Democratic staff calculations based on seasonally adjusted data from the Bureau of Labor Statistics
Private-Sector Job Growth in North CarolinaMonthly, Jan. 2008 - Jun. 2016, thousands
2008 2009 2010 2011 2012 2013 2014
Bush administration
Obama administration
2015 2016
JULY 2016

North Carolina United States
Private-Sector Jobs Added……………………………….Past 12 Months 79,300 2.3 million
Since Feb. 2010 473,400 14.8 million
Unemployment Rate …………………………………………………..June 2016 4.9% 4.9%
June 2015 5.8% 5.3%
Recession-Era Peak 11.3% 10.0%
Median Household Income (2014 $)…………………………………………………………….2014 $46,800 $53,700
2007 (Pre-Recession) $49,700 $57,400
Poverty Rate...………………………………………………………………..2014 17.1% 14.8%
2007 (Pre-Recession) 15.5% 12.5%
All Veterans' Unemployment Rate………………………….'2015 3.2% 4.6%
Post-9/11 Veterans' Unemployment Rate…………………………2015 8.0% 5.8%
Percentage Without Health Insurance...………………………………………………………….2014 13.1% 11.7%
2013 15.6% 14.5%
◙
◙
◙
◙
◙
◙
* Note: Because of methodological differences, total U.S. real GDP by state differs slightly from headline national GDP figures
Exports over the past 12 months are up 31.9 percent from their level in 2009 (inflation-adjusted).
In North Carolina, goods exports totaled $2.4 billion in May and $29.4 billion over the past year, up 0.6
percent from the 12 months ending in May 2015 (inflation-adjusted).
Exports
In May 2016, builders in North Carolina broke ground on 58,670 new housing units (seasonally adjusted
annual rate), bringing the average over the past 12 months to 52,406 units. That marks an increase of 4.6
percent from the average over the prior 12 months.
Home prices in North Carolina increased by 5.5 percent from the first quarter of 2015 to the first quarter of
2016. They are up 20.9 percent since their recent low in the second quarter of 2011.
Housing
Real gross domestic product (GDP) in North Carolina grew by 2.8 percent over the four quarters through
the fourth quarter of 2015, above the national average growth rate of 2.0 percent.*
State Gross Domestic Product
Since the official end of the Great Recession in the second quarter of 2009, North Carolina GDP growth
has averaged 1.4 percent at an annual rate, compared with a national average of 1.9 percent.
*** Note: state-level data changes may not be statistically significant due to sampling variation. Individual monthly readings should be
interpreted with caution and in the context of longer-term trends and other data that become available.
** A list of sources used to compile the North Carolina economic snapshot is available at: http://bit.ly/JEC-state-by-state-sources
**** For additional North Carolina-specific labor sector statistics, please refer to the North Carolina office: https://www.nccommerce.com/lead
State Quick Facts

U.S. Congress Joint Economic Committee
◙
◙
◙
◙
◙
◙
◙
◙
In June 2016, average hourly earnings of private-sector workers in North Dakota were $25.61. The average
workweek was 34.3 hours, and average weekly earnings were $878.42.
Unemployment
Earnings
Economic Snapshot: North Dakota
**Includes Bureau of Labor Statistics jobs, unemployment and earnings data through June 2016**
**Last updated on July 22nd; July data will be released on August 19th**
Since February 2010, the national low point for private-sector employment, North Dakota businesses have
added 65,100 jobs (an increase of 22.4 percent). Nationally, private payrolls have increased by 13.8
percent over this time.
The state sectors with the greatest job gains in percentage terms since February 2010 are: mining and
logging at 94.1 percent (8,000 jobs), construction at 42.7 percent (9,100 jobs) and professional and
business services at 26.7 percent (7,600 jobs).
Jobs
In June, private-sector employment in North Dakota fell by 200 jobs. Over the past year, North Dakota
businesses have shed 16,800 jobs. This compares with a decrease of 9,100 jobs over the 12 months
through June 2015.
Unemployment is up 0.4 percentage point from one year earlier but remains 1.1 percentage points below
its recent peak of 4.3 percent in May 2009.
There were 13,400 North Dakota residents unemployed in June 2016.
The unemployment rate in North Dakota was 3.2 percent in June 2016, holding constant from May. The
rate was 1.7 percentage points below the national rate of 4.9 percent.
Adjusting for inflation, state average hourly earnings have risen by 2.0 percent over the past year.
Nationally, real average hourly earnings have increased by 1.6 percent (not seasonally adjusted).
-6
-4
-2
0
2
4
6
Source: JEC Democratic staff calculations based on seasonally adjusted data from the Bureau of Labor Statistics
Private-Sector Job Growth in North DakotaMonthly, Jan. 2008 - Jun. 2016, thousands
2008 2009 2010 2011 2012 2013 2014
Bush administration
Obama administration
2015 2016
JULY 2016

North Dakota United States
Private-Sector Jobs Added……………………………….Past 12 Months -16,800 2.3 million
Since Feb. 2010 65,100 14.8 million
Unemployment Rate …………………………………………………..June 2016 3.2% 4.9%
June 2015 2.8% 5.3%
Recession-Era Peak 4.3% 10.0%
Median Household Income (2014 $)…………………………………………………………….2014 $60,700 $53,700
2007 (Pre-Recession) $53,900 $57,400
Poverty Rate...………………………………………………………………..2014 9.7% 14.8%
2007 (Pre-Recession) 9.3% 12.5%
All Veterans' Unemployment Rate………………………….'2015 2.8% 4.6%
Post-9/11 Veterans' Unemployment Rate…………………………2015 4.7% 5.8%
Percentage Without Health Insurance...………………………………………………………….2014 7.9% 11.7%
2013 10.4% 14.5%
◙
◙
◙
◙
◙
◙
* Note: Because of methodological differences, total U.S. real GDP by state differs slightly from headline national GDP figures
Exports over the past 12 months are up 68.9 percent from their level in 2009 (inflation-adjusted).
In North Dakota, goods exports totaled $399 million in May and $3.8 billion over the past year, down 20.9
percent from the 12 months ending in May 2015 (inflation-adjusted).
Exports
In May 2016, builders in North Dakota broke ground on 5,710 new housing units (seasonally adjusted
annual rate), bringing the average over the past 12 months to 5,491 units. That marks a decrease of 43.7
percent from the average over the prior 12 months.
Home prices in North Dakota increased by 4.3 percent from the first quarter of 2015 to the first quarter of
2016. They are now 48.8 percent above their level in the fourth quarter of 2007.
Housing
Real gross domestic product (GDP) in North Dakota fell by 6.7 percent over the four quarters through the
fourth quarter of 2015, below the national average growth rate of 2.0 percent.*
State Gross Domestic Product
Since the official end of the Great Recession in the second quarter of 2009, North Dakota GDP growth has
averaged 7.1 percent at an annual rate, compared with a national average of 1.9 percent.
*** Note: state-level data changes may not be statistically significant due to sampling variation. Individual monthly readings should be
interpreted with caution and in the context of longer-term trends and other data that become available.
** A list of sources used to compile the North Dakota economic snapshot is available at: http://bit.ly/JEC-state-by-state-sources
**** For additional North Dakota-specific labor sector statistics, please refer to the North Dakota office:
https://www.ndworkforceintelligence.com/analyzer/default.asp
State Quick Facts

U.S. Congress Joint Economic Committee
◙
◙
◙
◙
◙
◙
◙
◙
In June 2016, average hourly earnings of private-sector workers in Ohio were $23.15. The average
workweek was 34.2 hours, and average weekly earnings were $791.73.
Unemployment
Earnings
Economic Snapshot: Ohio
**Includes Bureau of Labor Statistics jobs, unemployment and earnings data through June 2016**
**Last updated on July 22nd; July data will be released on August 19th**
Since February 2010, the national low point for private-sector employment, Ohio businesses have added
500,800 jobs (an increase of 11.9 percent). Nationally, private payrolls have increased by 13.8 percent over
this time.
The state sectors with the greatest job gains in percentage terms since February 2010 are: construction at
24.4 percent (41,100 jobs), leisure and hospitality at 17.9 percent (84,500 jobs) and professional and
business services at 17.4 percent (106,700 jobs).
Jobs
In June, private-sector employment in Ohio grew by 2,800 jobs. Over the past year, Ohio businesses have
added 71,700 jobs. This compares with an increase of 73,100 jobs over the 12 months through June 2015.
Unemployment is up 0.2 percentage point from one year earlier but remains 6.0 percentage points below
its recent peak of 11.0 percent in January 2010.
There were 291,100 Ohio residents unemployed in June 2016.
The unemployment rate in Ohio was 5.0 percent in June 2016, down 0.1 percentage point from May. The
rate was 0.1 percentage point above the national rate of 4.9 percent.
Adjusting for inflation, state average hourly earnings have risen by 2.5 percent over the past year.
Nationally, real average hourly earnings have increased by 1.6 percent (not seasonally adjusted).
-60
-50
-40
-30
-20
-10
0
10
20
30
Source: JEC Democratic staff calculations based on seasonally adjusted data from the Bureau of Labor Statistics
Private-Sector Job Growth in OhioMonthly, Jan. 2008 - Jun. 2016, thousands
2008 2009 2010 2011 2012 2013 2014
Bush administration
Obama administration
2015 2016
JULY 2016

Ohio United States
Private-Sector Jobs Added……………………………….Past 12 Months 71,700 2.3 million
Since Feb. 2010 500,800 14.8 million
Unemployment Rate …………………………………………………..June 2016 5.0% 4.9%
June 2015 4.8% 5.3%
Recession-Era Peak 11.0% 10.0%
Median Household Income (2014 $)…………………………………………………………….2014 $49,600 $53,700
2007 (Pre-Recession) $56,100 $57,400
Poverty Rate...………………………………………………………………..2014 15.6% 14.8%
2007 (Pre-Recession) 12.8% 12.5%
All Veterans' Unemployment Rate………………………….'2015 3.3% 4.6%
Post-9/11 Veterans' Unemployment Rate…………………………2015 4.0% 5.8%
Percentage Without Health Insurance...………………………………………………………….2014 8.4% 11.7%
2013 11.0% 14.5%
◙
◙
◙
◙
◙
◙
* Note: Because of methodological differences, total U.S. real GDP by state differs slightly from headline national GDP figures
Exports over the past 12 months are up 42.7 percent from their level in 2009 (inflation-adjusted).
In Ohio, goods exports totaled $3.9 billion in May and $49.7 billion over the past year, up 2.7 percent from
the 12 months ending in May 2015 (inflation-adjusted).
Exports
In May 2016, builders in Ohio broke ground on 21,320 new housing units (seasonally adjusted annual rate),
bringing the average over the past 12 months to 19,873 units. That marks an increase of 0.9 percent from
the average over the prior 12 months.
Home prices in Ohio increased by 4.9 percent from the first quarter of 2015 to the first quarter of 2016.
They are up 20.2 percent since their recent low in the first quarter of 2011.
Housing
Real gross domestic product (GDP) in Ohio grew by 1.1 percent over the four quarters through the fourth
quarter of 2015, below the national average growth rate of 2.0 percent.*
State Gross Domestic Product
Since the official end of the Great Recession in the second quarter of 2009, Ohio GDP growth has
averaged 2.3 percent at an annual rate, compared with a national average of 1.9 percent.
*** Note: state-level data changes may not be statistically significant due to sampling variation. Individual monthly readings should be
interpreted with caution and in the context of longer-term trends and other data that become available.
** A list of sources used to compile the Ohio economic snapshot is available at: http://bit.ly/JEC-state-by-state-sources
**** For additional Ohio-specific labor sector statistics, please refer to the Ohio office: http://lmi.state.oh.us/data.htm
State Quick Facts

U.S. Congress Joint Economic Committee
◙
◙
◙
◙
◙
◙
◙
◙
In June 2016, average hourly earnings of private-sector workers in Oklahoma were $21.80. The average
workweek was 34.9 hours, and average weekly earnings were $760.82.
Unemployment
Earnings
Economic Snapshot: Oklahoma
**Includes Bureau of Labor Statistics jobs, unemployment and earnings data through June 2016**
**Last updated on July 22nd; July data will be released on August 19th**
Since February 2010, the national low point for private-sector employment, Oklahoma businesses have
added 118,600 jobs (an increase of 9.9 percent). Nationally, private payrolls have increased by 13.8
percent over this time.
The state sectors with the greatest job gains in percentage terms since February 2010 are: construction at
29.7 percent (19,300 jobs), leisure and hospitality at 23.7 percent (32,700 jobs) and trade, transportation
and utilities at 11.3 percent (31,100 jobs).
Jobs
In June, private-sector employment in Oklahoma grew by 1,700 jobs. Over the past year, Oklahoma
businesses have shed 3,500 jobs. This compares with an increase of 10,200 jobs over the 12 months
through June 2015.
Unemployment is up 0.4 percentage point from one year earlier but remains 2.3 percentage points below
its recent peak of 7.1 percent in March 2010.
There were 89,700 Oklahoma residents unemployed in June 2016.
The unemployment rate in Oklahoma was 4.8 percent in June 2016, up 0.1 percentage point from May.
The rate was 0.1 percentage point below the national rate of 4.9 percent.
Adjusting for inflation, state average hourly earnings have fallen by 0.1 percent over the past year.
Nationally, real average hourly earnings have increased by 1.6 percent (not seasonally adjusted).
-20
-15
-10
-5
0
5
10
15
Source: JEC Democratic staff calculations based on seasonally adjusted data from the Bureau of Labor Statistics
Private-Sector Job Growth in OklahomaMonthly, Jan. 2008 - Jun. 2016, thousands
2008 2009 2010 2011 2012 2013 2014
Bush administration
Obama administration
2015 2016
JULY 2016

Oklahoma United States
Private-Sector Jobs Added……………………………….Past 12 Months -3,500 2.3 million
Since Feb. 2010 118,600 14.8 million
Unemployment Rate …………………………………………………..June 2016 4.8% 4.9%
June 2015 4.4% 5.3%
Recession-Era Peak 7.1% 10.0%
Median Household Income (2014 $)…………………………………………………………….2014 $47,200 $53,700
2007 (Pre-Recession) $49,300 $57,400
Poverty Rate...………………………………………………………………..2014 17.3% 14.8%
2007 (Pre-Recession) 13.4% 12.5%
All Veterans' Unemployment Rate………………………….'2015 3.2% 4.6%
Post-9/11 Veterans' Unemployment Rate…………………………2015 3.0% 5.8%
Percentage Without Health Insurance...………………………………………………………….2014 15.4% 11.7%
2013 17.7% 14.5%
◙
◙
◙
◙
◙
◙
* Note: Because of methodological differences, total U.S. real GDP by state differs slightly from headline national GDP figures
Exports over the past 12 months are up 9.7 percent from their level in 2009 (inflation-adjusted).
In Oklahoma, goods exports totaled $394 million in May and $5.0 billion over the past year, down 11.0
percent from the 12 months ending in May 2015 (inflation-adjusted).
Exports
In May 2016, builders in Oklahoma broke ground on 14,010 new housing units (seasonally adjusted annual
rate), bringing the average over the past 12 months to 13,163 units. That marks an increase of 7.1 percent
from the average over the prior 12 months.
Home prices in Oklahoma increased by 1.3 percent from the first quarter of 2015 to the first quarter of
2016. They are up 20.0 percent since their recent low in the first quarter of 2011.
Housing
Real gross domestic product (GDP) in Oklahoma fell by 1.2 percent over the four quarters through the
fourth quarter of 2015, below the national average growth rate of 2.0 percent.*
State Gross Domestic Product
Since the official end of the Great Recession in the second quarter of 2009, Oklahoma GDP growth has
averaged 2.6 percent at an annual rate, compared with a national average of 1.9 percent.
*** Note: state-level data changes may not be statistically significant due to sampling variation. Individual monthly readings should be
interpreted with caution and in the context of longer-term trends and other data that become available.
** A list of sources used to compile the Oklahoma economic snapshot is available at: http://bit.ly/JEC-state-by-state-sources
**** For additional Oklahoma-specific labor sector statistics, please refer to the Oklahoma office:
http://www.ok.gov/oesc_web/Services/Find_Labor_Market_Statistics/
State Quick Facts
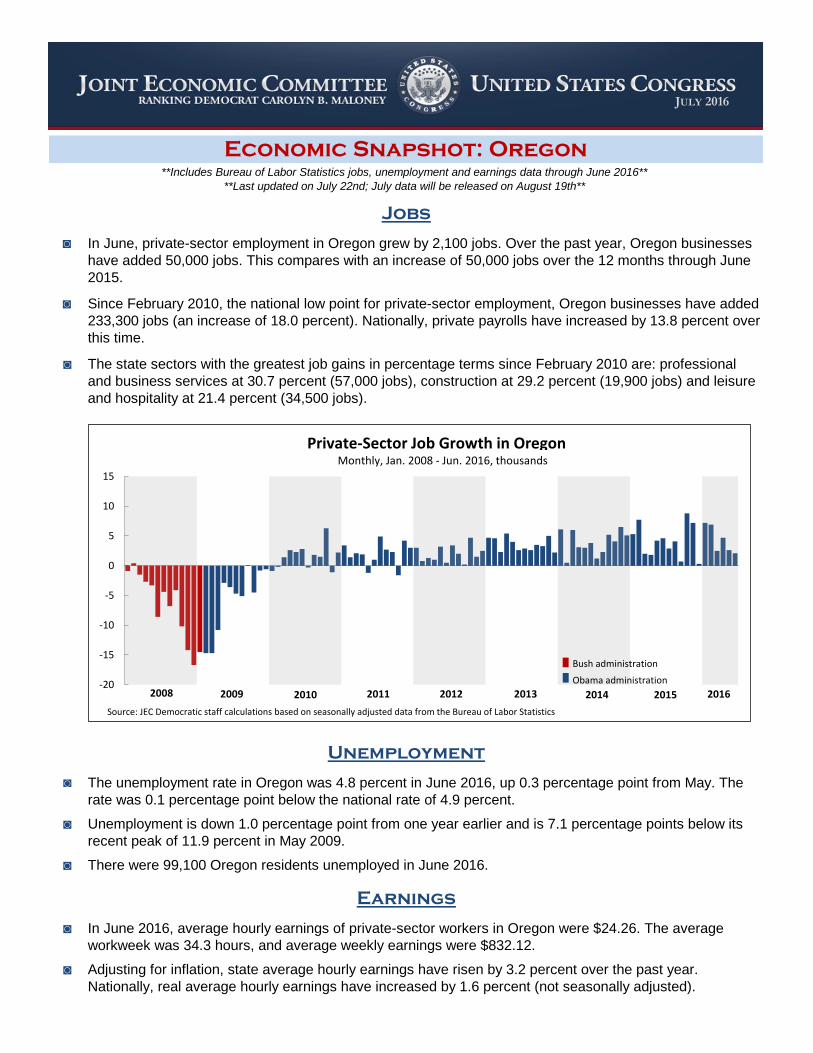
U.S. Congress Joint Economic Committee
◙
◙
◙
◙
◙
◙
◙
◙
In June 2016, average hourly earnings of private-sector workers in Oregon were $24.26. The average
workweek was 34.3 hours, and average weekly earnings were $832.12.
Unemployment
Earnings
Economic Snapshot: Oregon
**Includes Bureau of Labor Statistics jobs, unemployment and earnings data through June 2016**
**Last updated on July 22nd; July data will be released on August 19th**
Since February 2010, the national low point for private-sector employment, Oregon businesses have added
233,300 jobs (an increase of 18.0 percent). Nationally, private payrolls have increased by 13.8 percent over
this time.
The state sectors with the greatest job gains in percentage terms since February 2010 are: professional
and business services at 30.7 percent (57,000 jobs), construction at 29.2 percent (19,900 jobs) and leisure
and hospitality at 21.4 percent (34,500 jobs).
Jobs
In June, private-sector employment in Oregon grew by 2,100 jobs. Over the past year, Oregon businesses
have added 50,000 jobs. This compares with an increase of 50,000 jobs over the 12 months through June
2015.
Unemployment is down 1.0 percentage point from one year earlier and is 7.1 percentage points below its
recent peak of 11.9 percent in May 2009.
There were 99,100 Oregon residents unemployed in June 2016.
The unemployment rate in Oregon was 4.8 percent in June 2016, up 0.3 percentage point from May. The
rate was 0.1 percentage point below the national rate of 4.9 percent.
Adjusting for inflation, state average hourly earnings have risen by 3.2 percent over the past year.
Nationally, real average hourly earnings have increased by 1.6 percent (not seasonally adjusted).
-20
-15
-10
-5
0
5
10
15
Source: JEC Democratic staff calculations based on seasonally adjusted data from the Bureau of Labor Statistics
Private-Sector Job Growth in OregonMonthly, Jan. 2008 - Jun. 2016, thousands
2008 2009 2010 2011 2012 2013 2014
Bush administration
Obama administration
2015 2016
JULY 2016

Oregon United States
Private-Sector Jobs Added……………………………….Past 12 Months 50,000 2.3 million
Since Feb. 2010 233,300 14.8 million
Unemployment Rate …………………………………………………..June 2016 4.8% 4.9%
June 2015 5.8% 5.3%
Recession-Era Peak 11.9% 10.0%
Median Household Income (2014 $)…………………………………………………………….2014 $58,900 $53,700
2007 (Pre-Recession) $57,400 $57,400
Poverty Rate...………………………………………………………………..2014 14.4% 14.8%
2007 (Pre-Recession) 12.8% 12.5%
All Veterans' Unemployment Rate………………………….'2015 5.6% 4.6%
Post-9/11 Veterans' Unemployment Rate…………………………2015 6.8% 5.8%
Percentage Without Health Insurance...………………………………………………………….2014 9.7% 11.7%
2013 14.7% 14.5%
◙
◙
◙
◙
◙
◙
* Note: Because of methodological differences, total U.S. real GDP by state differs slightly from headline national GDP figures
Exports over the past 12 months are up 29.2 percent from their level in 2009 (inflation-adjusted).
In Oregon, goods exports totaled $1.9 billion in May and $19.7 billion over the past year, up 0.6 percent
from the 12 months ending in May 2015 (inflation-adjusted).
Exports
In May 2016, builders in Oregon broke ground on 16,530 new housing units (seasonally adjusted annual
rate), bringing the average over the past 12 months to 17,261 units. That marks an increase of 20.2
percent from the average over the prior 12 months.
Home prices in Oregon increased by 11.8 percent from the first quarter of 2015 to the first quarter of 2016.
They are up 47.2 percent since their recent low in the second quarter of 2011.
Housing
Real gross domestic product (GDP) in Oregon grew by 4.1 percent over the four quarters through the
fourth quarter of 2015, above the national average growth rate of 2.0 percent.*
State Gross Domestic Product
Since the official end of the Great Recession in the second quarter of 2009, Oregon GDP growth has
averaged 1.8 percent at an annual rate, compared with a national average of 1.9 percent.
*** Note: state-level data changes may not be statistically significant due to sampling variation. Individual monthly readings should be
interpreted with caution and in the context of longer-term trends and other data that become available.
** A list of sources used to compile the Oregon economic snapshot is available at: http://bit.ly/JEC-state-by-state-sources
**** For additional Oregon-specific labor sector statistics, please refer to the Oregon office: http://www.qualityinfo.org/olmisj/OlmisZine
State Quick Facts

U.S. Congress Joint Economic Committee
◙
◙
◙
◙
◙
◙
◙
◙
In June 2016, average hourly earnings of private-sector workers in Pennsylvania were $24.39. The
average workweek was 33.8 hours, and average weekly earnings were $824.38.
Unemployment
Earnings
Economic Snapshot: Pennsylvania
**Includes Bureau of Labor Statistics jobs, unemployment and earnings data through June 2016**
**Last updated on July 22nd; July data will be released on August 19th**
Since February 2010, the national low point for private-sector employment, Pennsylvania businesses have
added 389,200 jobs (an increase of 8.1 percent). Nationally, private payrolls have increased by 13.8
percent over this time.
The state sectors with the greatest job gains in percentage terms since February 2010 are: professional
and business services at 16.0 percent (108,900 jobs), leisure and hospitality at 13.5 percent (66,300 jobs)
and construction at 12.1 percent (25,500 jobs).
Jobs
In June, private-sector employment in Pennsylvania grew by 18,400 jobs. Over the past year, Pennsylvania
businesses have added 58,500 jobs. This compares with an increase of 52,400 jobs over the 12 months
through June 2015.
Unemployment is up 0.5 percentage point from one year earlier but remains 3.1 percentage points below
its recent peak of 8.7 percent in April 2010.
There were 364,200 Pennsylvania residents unemployed in June 2016.
The unemployment rate in Pennsylvania was 5.6 percent in June 2016, up 0.1 percentage point from May.
The rate was 0.7 percentage point above the national rate of 4.9 percent.
Adjusting for inflation, state average hourly earnings have risen by 0.3 percent over the past year.
Nationally, real average hourly earnings have increased by 1.6 percent (not seasonally adjusted).
-40
-30
-20
-10
0
10
20
30
Source: JEC Democratic staff calculations based on seasonally adjusted data from the Bureau of Labor Statistics
Private-Sector Job Growth in PennsylvaniaMonthly, Jan. 2008 - Jun. 2016, thousands
2008 2009 2010 2011 2012 2013 2014
Bush administration
Obama administration
2015 2016
JULY 2016

Pennsylvania United States
Private-Sector Jobs Added……………………………….Past 12 Months 58,500 2.3 million
Since Feb. 2010 389,200 14.8 million
Unemployment Rate …………………………………………………..June 2016 5.6% 4.9%
June 2015 5.1% 5.3%
Recession-Era Peak 8.7% 10.0%
Median Household Income (2014 $)…………………………………………………………….2014 $55,200 $53,700
2007 (Pre-Recession) $55,300 $57,400
Poverty Rate...………………………………………………………………..2014 12.5% 14.8%
2007 (Pre-Recession) 10.4% 12.5%
All Veterans' Unemployment Rate………………………….'2015 4.7% 4.6%
Post-9/11 Veterans' Unemployment Rate…………………………2015 2.9% 5.8%
Percentage Without Health Insurance...………………………………………………………….2014 8.5% 11.7%
2013 9.7% 14.5%
◙
◙
◙
◙
◙
◙
* Note: Because of methodological differences, total U.S. real GDP by state differs slightly from headline national GDP figures
Exports over the past 12 months are up 28.4 percent from their level in 2009 (inflation-adjusted).
In Pennsylvania, goods exports totaled $3.0 billion in May and $37.1 billion over the past year, down 2.4
percent from the 12 months ending in May 2015 (inflation-adjusted).
Exports
In May 2016, builders in Pennsylvania broke ground on 17,360 new housing units (seasonally adjusted
annual rate), bringing the average over the past 12 months to 23,966 units. That marks an increase of 23.3
percent from the average over the prior 12 months.
Home prices in Pennsylvania increased by 3.7 percent from the first quarter of 2015 to the first quarter of
2016. They are up 12.7 percent since their recent low in the fourth quarter of 2011.
Housing
Real gross domestic product (GDP) in Pennsylvania grew by 1.1 percent over the four quarters through the
fourth quarter of 2015, below the national average growth rate of 2.0 percent.*
State Gross Domestic Product
Since the official end of the Great Recession in the second quarter of 2009, Pennsylvania GDP growth has
averaged 1.7 percent at an annual rate, compared with a national average of 1.9 percent.
*** Note: state-level data changes may not be statistically significant due to sampling variation. Individual monthly readings should be
interpreted with caution and in the context of longer-term trends and other data that become available.
** A list of sources used to compile the Pennsylvania economic snapshot is available at: http://bit.ly/JEC-state-by-state-sources
**** For additional Pennsylvania-specific labor sector statistics, please refer to the Pennsylvania office:
http://www.portal.state.pa.us/portal/server.pt?open=514&objID=1216762&mode=2
State Quick Facts
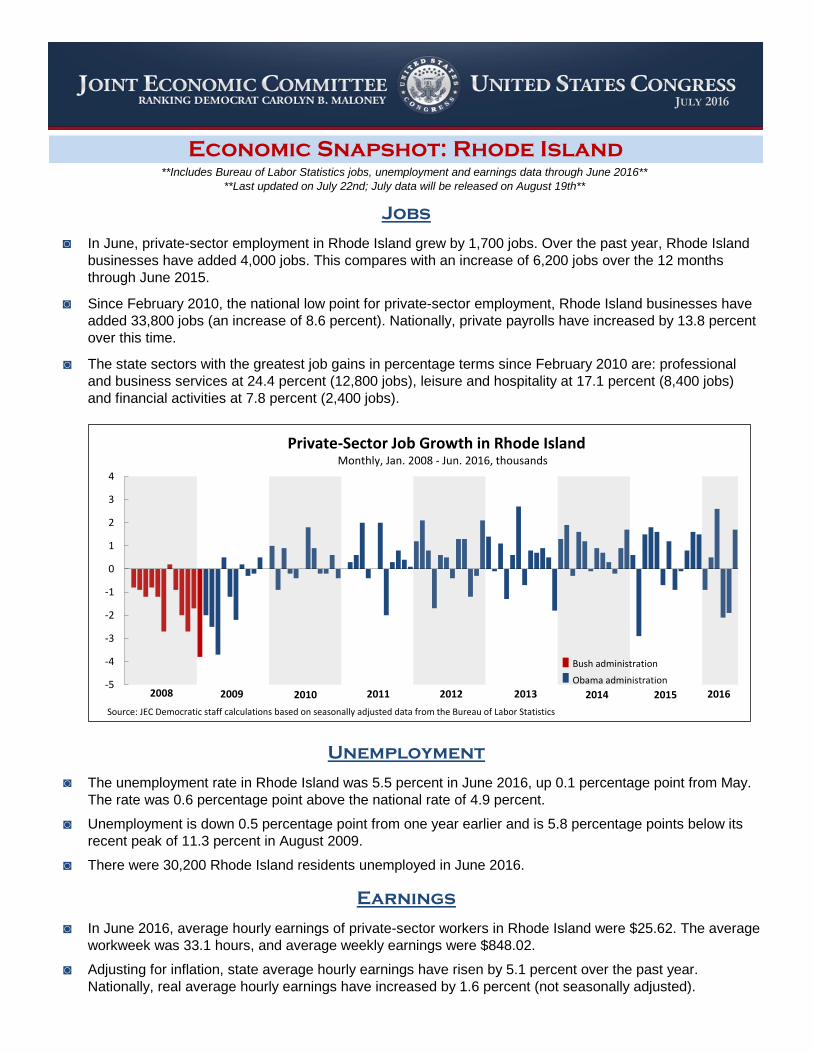
U.S. Congress Joint Economic Committee
◙
◙
◙
◙
◙
◙
◙
◙
In June 2016, average hourly earnings of private-sector workers in Rhode Island were $25.62. The average
workweek was 33.1 hours, and average weekly earnings were $848.02.
Unemployment
Earnings
Economic Snapshot: Rhode Island
**Includes Bureau of Labor Statistics jobs, unemployment and earnings data through June 2016**
**Last updated on July 22nd; July data will be released on August 19th**
Since February 2010, the national low point for private-sector employment, Rhode Island businesses have
added 33,800 jobs (an increase of 8.6 percent). Nationally, private payrolls have increased by 13.8 percent
over this time.
The state sectors with the greatest job gains in percentage terms since February 2010 are: professional
and business services at 24.4 percent (12,800 jobs), leisure and hospitality at 17.1 percent (8,400 jobs)
and financial activities at 7.8 percent (2,400 jobs).
Jobs
In June, private-sector employment in Rhode Island grew by 1,700 jobs. Over the past year, Rhode Island
businesses have added 4,000 jobs. This compares with an increase of 6,200 jobs over the 12 months
through June 2015.
Unemployment is down 0.5 percentage point from one year earlier and is 5.8 percentage points below its
recent peak of 11.3 percent in August 2009.
There were 30,200 Rhode Island residents unemployed in June 2016.
The unemployment rate in Rhode Island was 5.5 percent in June 2016, up 0.1 percentage point from May.
The rate was 0.6 percentage point above the national rate of 4.9 percent.
Adjusting for inflation, state average hourly earnings have risen by 5.1 percent over the past year.
Nationally, real average hourly earnings have increased by 1.6 percent (not seasonally adjusted).
-5
-4
-3
-2
-1
0
1
2
3
4
Source: JEC Democratic staff calculations based on seasonally adjusted data from the Bureau of Labor Statistics
Private-Sector Job Growth in Rhode IslandMonthly, Jan. 2008 - Jun. 2016, thousands
2008 2009 2010 2011 2012 2013 2014
Bush administration
Obama administration
2015 2016
JULY 2016

Rhode Island United States
Private-Sector Jobs Added……………………………….Past 12 Months 4,000 2.3 million
Since Feb. 2010 33,800 14.8 million
Unemployment Rate …………………………………………………..June 2016 5.5% 4.9%
June 2015 6.0% 5.3%
Recession-Era Peak 11.3% 10.0%
Median Household Income (2014 $)…………………………………………………………….2014 $58,600 $53,700
2007 (Pre-Recession) $61,900 $57,400
Poverty Rate...………………………………………………………………..2014 11.3% 14.8%
2007 (Pre-Recession) 9.5% 12.5%
All Veterans' Unemployment Rate………………………….'2015 5.8% 4.6%
Post-9/11 Veterans' Unemployment Rate…………………………2015 9.5% 5.8%
Percentage Without Health Insurance...………………………………………………………….2014 7.4% 11.7%
2013 11.6% 14.5%
◙
◙
◙
◙
◙
◙
* Note: Because of methodological differences, total U.S. real GDP by state differs slightly from headline national GDP figures
Exports over the past 12 months are up 34.6 percent from their level in 2009 (inflation-adjusted).
In Rhode Island, goods exports totaled $181 million in May and $2.1 billion over the past year, down 8.0
percent from the 12 months ending in May 2015 (inflation-adjusted).
Exports
In May 2016, builders in Rhode Island broke ground on 1,020 new housing units (seasonally adjusted
annual rate), bringing the average over the past 12 months to 1,103 units. That marks an increase of 36.5
percent from the average over the prior 12 months.
Home prices in Rhode Island increased by 3.1 percent from the first quarter of 2015 to the first quarter of
2016. They are up 14.4 percent since their recent low in the third quarter of 2012.
Housing
Real gross domestic product (GDP) in Rhode Island grew by 0.4 percent over the four quarters through the
fourth quarter of 2015, below the national average growth rate of 2.0 percent.*
State Gross Domestic Product
Since the official end of the Great Recession in the second quarter of 2009, Rhode Island GDP growth has
averaged 1.2 percent at an annual rate, compared with a national average of 1.9 percent.
*** Note: state-level data changes may not be statistically significant due to sampling variation. Individual monthly readings should be
interpreted with caution and in the context of longer-term trends and other data that become available.
** A list of sources used to compile the Rhode Island economic snapshot is available at: http://bit.ly/JEC-state-by-state-sources
**** For additional Rhode Island-specific labor sector statistics, please refer to the Rhode Island office:
http://www.dlt.ri.gov/lmi/news/lfrelease.htm
State Quick Facts

U.S. Congress Joint Economic Committee
◙
◙
◙
◙
◙
◙
◙
◙
In June 2016, average hourly earnings of private-sector workers in South Carolina were $21.64. The
average workweek was 34.6 hours, and average weekly earnings were $748.74.
Unemployment
Earnings
Economic Snapshot: South Carolina
**Includes Bureau of Labor Statistics jobs, unemployment and earnings data through June 2016**
**Last updated on July 22nd; July data will be released on August 19th**
Since February 2010, the national low point for private-sector employment, South Carolina businesses
have added 245,300 jobs (an increase of 17.0 percent). Nationally, private payrolls have increased by 13.8
percent over this time.
The state sectors with the greatest job gains in percentage terms since February 2010 are: professional
and business services at 33.1 percent (68,400 jobs), construction at 18.1 percent (14,300 jobs) and leisure
and hospitality at 17.3 percent (35,500 jobs).
Jobs
In June, private-sector employment in South Carolina grew by 2,600 jobs. Over the past year, South
Carolina businesses have added 46,200 jobs. This compares with an increase of 45,300 jobs over the 12
months through June 2015.
Unemployment is down 0.5 percentage point from one year earlier and is 6.3 percentage points below its
recent peak of 11.7 percent in January 2010.
There were 125,600 South Carolina residents unemployed in June 2016.
The unemployment rate in South Carolina was 5.4 percent in June 2016, down 0.2 percentage point from
May. The rate was 0.5 percentage point above the national rate of 4.9 percent.
Adjusting for inflation, state average hourly earnings have risen by 2.1 percent over the past year.
Nationally, real average hourly earnings have increased by 1.6 percent (not seasonally adjusted).
-20
-15
-10
-5
0
5
10
15
Source: JEC Democratic staff calculations based on seasonally adjusted data from the Bureau of Labor Statistics
Private-Sector Job Growth in South CarolinaMonthly, Jan. 2008 - Jun. 2016, thousands
2008 2009 2010 2011 2012 2013 2014
Bush administration
Obama administration
2015 2016
JULY 2016

South Carolina United States
Private-Sector Jobs Added……………………………….Past 12 Months 46,200 2.3 million
Since Feb. 2010 245,300 14.8 million
Unemployment Rate …………………………………………………..June 2016 5.4% 4.9%
June 2015 5.9% 5.3%
Recession-Era Peak 11.7% 10.0%
Median Household Income (2014 $)…………………………………………………………….2014 $44,900 $53,700
2007 (Pre-Recession) $50,500 $57,400
Poverty Rate...………………………………………………………………..2014 16.5% 14.8%
2007 (Pre-Recession) 14.1% 12.5%
All Veterans' Unemployment Rate………………………….'2015 4.4% 4.6%
Post-9/11 Veterans' Unemployment Rate…………………………2015 8.7% 5.8%
Percentage Without Health Insurance...………………………………………………………….2014 13.6% 11.7%
2013 15.8% 14.5%
◙
◙
◙
◙
◙
◙
* Note: Because of methodological differences, total U.S. real GDP by state differs slightly from headline national GDP figures
Exports over the past 12 months are up 81.0 percent from their level in 2009 (inflation-adjusted).
In South Carolina, goods exports totaled $2.7 billion in May and $30.5 billion over the past year, up 9.4
percent from the 12 months ending in May 2015 (inflation-adjusted).
Exports
In May 2016, builders in South Carolina broke ground on 35,650 new housing units (seasonally adjusted
annual rate), bringing the average over the past 12 months to 30,370 units. That marks an increase of 9.6
percent from the average over the prior 12 months.
Home prices in South Carolina increased by 7.9 percent from the first quarter of 2015 to the first quarter of
2016. They are up 27.5 percent since their recent low in the second quarter of 2011.
Housing
Real gross domestic product (GDP) in South Carolina grew by 1.8 percent over the four quarters through
the fourth quarter of 2015, below the national average growth rate of 2.0 percent.*
State Gross Domestic Product
Since the official end of the Great Recession in the second quarter of 2009, South Carolina GDP growth
has averaged 1.8 percent at an annual rate, compared with a national average of 1.9 percent.
*** Note: state-level data changes may not be statistically significant due to sampling variation. Individual monthly readings should be
interpreted with caution and in the context of longer-term trends and other data that become available.
** A list of sources used to compile the South Carolina economic snapshot is available at: http://bit.ly/JEC-state-by-state-sources
**** For additional South Carolina-specific labor sector statistics, please refer to the South Carolina office: http://dew.sc.gov/about-lmi.asp
State Quick Facts
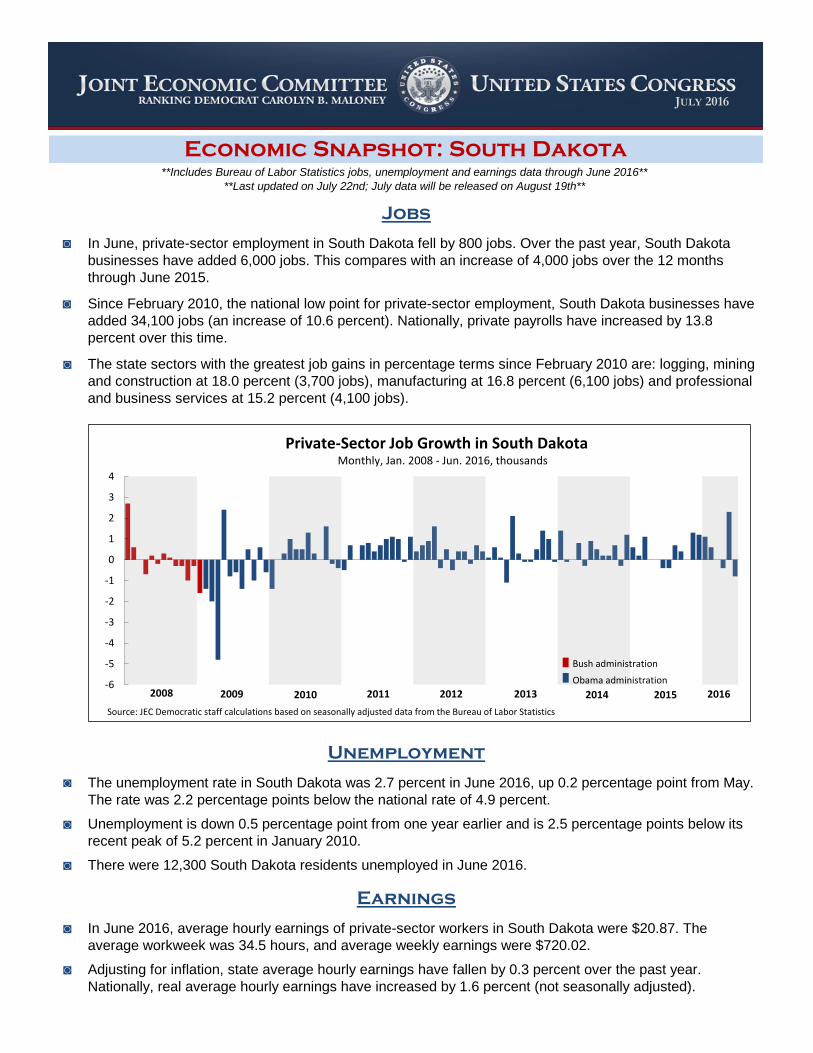
U.S. Congress Joint Economic Committee
◙
◙
◙
◙
◙
◙
◙
◙
In June 2016, average hourly earnings of private-sector workers in South Dakota were $20.87. The
average workweek was 34.5 hours, and average weekly earnings were $720.02.
Unemployment
Earnings
Economic Snapshot: South Dakota
**Includes Bureau of Labor Statistics jobs, unemployment and earnings data through June 2016**
**Last updated on July 22nd; July data will be released on August 19th**
Since February 2010, the national low point for private-sector employment, South Dakota businesses have
added 34,100 jobs (an increase of 10.6 percent). Nationally, private payrolls have increased by 13.8
percent over this time.
The state sectors with the greatest job gains in percentage terms since February 2010 are: logging, mining
and construction at 18.0 percent (3,700 jobs), manufacturing at 16.8 percent (6,100 jobs) and professional
and business services at 15.2 percent (4,100 jobs).
Jobs
In June, private-sector employment in South Dakota fell by 800 jobs. Over the past year, South Dakota
businesses have added 6,000 jobs. This compares with an increase of 4,000 jobs over the 12 months
through June 2015.
Unemployment is down 0.5 percentage point from one year earlier and is 2.5 percentage points below its
recent peak of 5.2 percent in January 2010.
There were 12,300 South Dakota residents unemployed in June 2016.
The unemployment rate in South Dakota was 2.7 percent in June 2016, up 0.2 percentage point from May.
The rate was 2.2 percentage points below the national rate of 4.9 percent.
Adjusting for inflation, state average hourly earnings have fallen by 0.3 percent over the past year.
Nationally, real average hourly earnings have increased by 1.6 percent (not seasonally adjusted).
-6
-5
-4
-3
-2
-1
0
1
2
3
4
Source: JEC Democratic staff calculations based on seasonally adjusted data from the Bureau of Labor Statistics
Private-Sector Job Growth in South DakotaMonthly, Jan. 2008 - Jun. 2016, thousands
2008 2009 2010 2011 2012 2013 2014
Bush administration
Obama administration
2015 2016
JULY 2016

South Dakota United States
Private-Sector Jobs Added……………………………….Past 12 Months 6,000 2.3 million
Since Feb. 2010 34,100 14.8 million
Unemployment Rate …………………………………………………..June 2016 2.7% 4.9%
June 2015 3.2% 5.3%
Recession-Era Peak 5.2% 10.0%
Median Household Income (2014 $)…………………………………………………………….2014 $53,100 $53,700
2007 (Pre-Recession) $53,000 $57,400
Poverty Rate...………………………………………………………………..2014 12.8% 14.8%
2007 (Pre-Recession) 9.4% 12.5%
All Veterans' Unemployment Rate………………………….'2015 2.5% 4.6%
Post-9/11 Veterans' Unemployment Rate…………………………2015 1.4% 5.8%
Percentage Without Health Insurance...………………………………………………………….2014 9.8% 11.7%
2013 11.3% 14.5%
◙
◙
◙
◙
◙
◙
* Note: Because of methodological differences, total U.S. real GDP by state differs slightly from headline national GDP figures
Exports over the past 12 months are up 27.4 percent from their level in 2009 (inflation-adjusted).
In South Dakota, goods exports totaled $106 million in May and $1.3 billion over the past year, down 7.7
percent from the 12 months ending in May 2015 (inflation-adjusted).
Exports
In May 2016, builders in South Dakota broke ground on 8,680 new housing units (seasonally adjusted
annual rate), bringing the average over the past 12 months to 4,967 units. That marks an increase of 15.0
percent from the average over the prior 12 months.
Home prices in South Dakota increased by 5.5 percent from the first quarter of 2015 to the first quarter of
2016. They are now 18.9 percent above their level in the fourth quarter of 2007.
Housing
Real gross domestic product (GDP) in South Dakota grew by 1.9 percent over the four quarters through the
fourth quarter of 2015, below the national average growth rate of 2.0 percent.*
State Gross Domestic Product
Since the official end of the Great Recession in the second quarter of 2009, South Dakota GDP growth has
averaged 2.1 percent at an annual rate, compared with a national average of 1.9 percent.
*** Note: state-level data changes may not be statistically significant due to sampling variation. Individual monthly readings should be
interpreted with caution and in the context of longer-term trends and other data that become available.
** A list of sources used to compile the South Dakota economic snapshot is available at: http://bit.ly/JEC-state-by-state-sources
**** For additional South Dakota-specific labor sector statistics, please refer to the South Dakota office:
http://dol.sd.gov/lmic/menu_labor_force.aspx
State Quick Facts
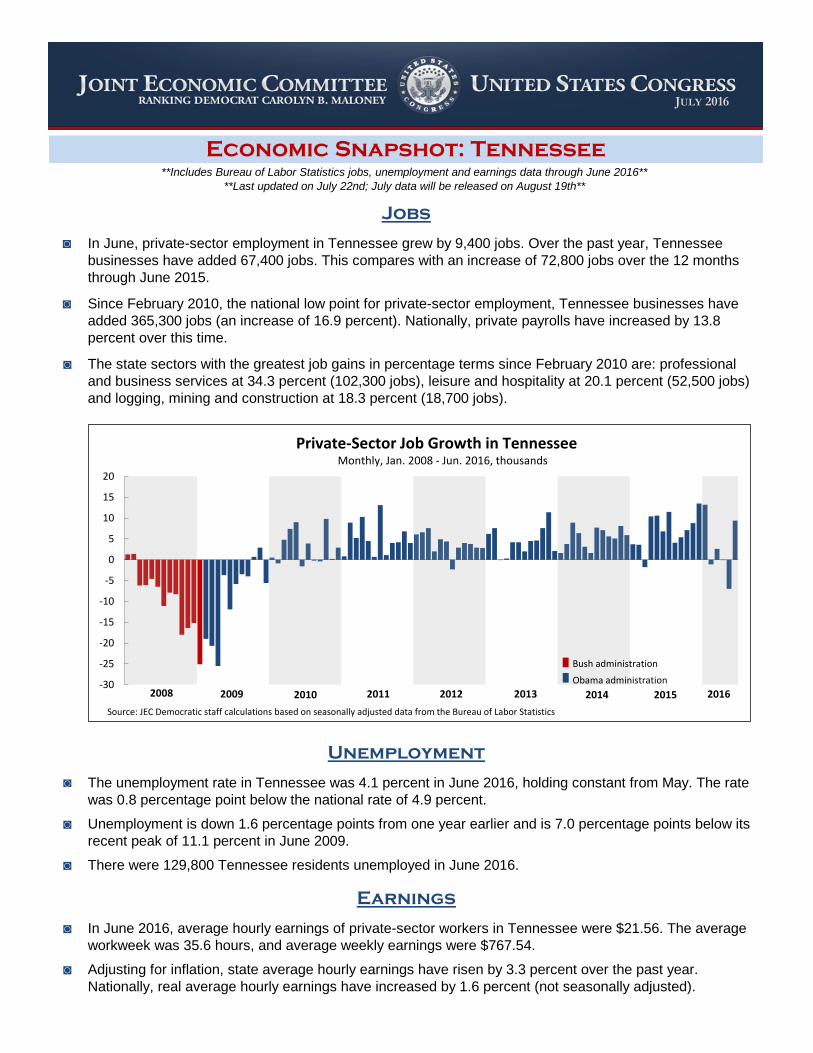
U.S. Congress Joint Economic Committee
◙
◙
◙
◙
◙
◙
◙
◙
In June 2016, average hourly earnings of private-sector workers in Tennessee were $21.56. The average
workweek was 35.6 hours, and average weekly earnings were $767.54.
Unemployment
Earnings
Economic Snapshot: Tennessee
**Includes Bureau of Labor Statistics jobs, unemployment and earnings data through June 2016**
**Last updated on July 22nd; July data will be released on August 19th**
Since February 2010, the national low point for private-sector employment, Tennessee businesses have
added 365,300 jobs (an increase of 16.9 percent). Nationally, private payrolls have increased by 13.8
percent over this time.
The state sectors with the greatest job gains in percentage terms since February 2010 are: professional
and business services at 34.3 percent (102,300 jobs), leisure and hospitality at 20.1 percent (52,500 jobs)
and logging, mining and construction at 18.3 percent (18,700 jobs).
Jobs
In June, private-sector employment in Tennessee grew by 9,400 jobs. Over the past year, Tennessee
businesses have added 67,400 jobs. This compares with an increase of 72,800 jobs over the 12 months
through June 2015.
Unemployment is down 1.6 percentage points from one year earlier and is 7.0 percentage points below its
recent peak of 11.1 percent in June 2009.
There were 129,800 Tennessee residents unemployed in June 2016.
The unemployment rate in Tennessee was 4.1 percent in June 2016, holding constant from May. The rate
was 0.8 percentage point below the national rate of 4.9 percent.
Adjusting for inflation, state average hourly earnings have risen by 3.3 percent over the past year.
Nationally, real average hourly earnings have increased by 1.6 percent (not seasonally adjusted).
-30
-25
-20
-15
-10
-5
0
5
10
15
20
Source: JEC Democratic staff calculations based on seasonally adjusted data from the Bureau of Labor Statistics
Private-Sector Job Growth in TennesseeMonthly, Jan. 2008 - Jun. 2016, thousands
2008 2009 2010 2011 2012 2013 2014
Bush administration
Obama administration
2015 2016
JULY 2016

Tennessee United States
Private-Sector Jobs Added……………………………….Past 12 Months 67,400 2.3 million
Since Feb. 2010 365,300 14.8 million
Unemployment Rate …………………………………………………..June 2016 4.1% 4.9%
June 2015 5.7% 5.3%
Recession-Era Peak 11.1% 10.0%
Median Household Income (2014 $)…………………………………………………………….2014 $43,700 $53,700
2007 (Pre-Recession) $47,000 $57,400
Poverty Rate...………………………………………………………………..2014 17.3% 14.8%
2007 (Pre-Recession) 14.8% 12.5%
All Veterans' Unemployment Rate………………………….'2015 4.2% 4.6%
Post-9/11 Veterans' Unemployment Rate…………………………2015 3.8% 5.8%
Percentage Without Health Insurance...………………………………………………………….2014 12.0% 11.7%
2013 13.9% 14.5%
◙
◙
◙
◙
◙
◙
* Note: Because of methodological differences, total U.S. real GDP by state differs slightly from headline national GDP figures
Exports over the past 12 months are up 52.3 percent from their level in 2009 (inflation-adjusted).
In Tennessee, goods exports totaled $2.6 billion in May and $31.8 billion over the past year, up 4.3 percent
from the 12 months ending in May 2015 (inflation-adjusted).
Exports
In May 2016, builders in Tennessee broke ground on 35,070 new housing units (seasonally adjusted
annual rate), bringing the average over the past 12 months to 37,647 units. That marks an increase of 39.7
percent from the average over the prior 12 months.
Home prices in Tennessee increased by 4.5 percent from the first quarter of 2015 to the first quarter of
2016. They are up 25.6 percent since their recent low in the second quarter of 2011.
Housing
Real gross domestic product (GDP) in Tennessee grew by 2.5 percent over the four quarters through the
fourth quarter of 2015, above the national average growth rate of 2.0 percent.*
State Gross Domestic Product
Since the official end of the Great Recession in the second quarter of 2009, Tennessee GDP growth has
averaged 2.2 percent at an annual rate, compared with a national average of 1.9 percent.
*** Note: state-level data changes may not be statistically significant due to sampling variation. Individual monthly readings should be
interpreted with caution and in the context of longer-term trends and other data that become available.
** A list of sources used to compile the Tennessee economic snapshot is available at: http://bit.ly/JEC-state-by-state-sources
**** For additional Tennessee-specific labor sector statistics, please refer to the Tennessee office: http://www.tn.gov/labor-wfd/lmr/
State Quick Facts

U.S. Congress Joint Economic Committee
◙
◙
◙
◙
◙
◙
◙
◙
In June 2016, average hourly earnings of private-sector workers in Texas were $24.36. The average
workweek was 35.8 hours, and average weekly earnings were $872.09.
Unemployment
Earnings
Economic Snapshot: Texas
**Includes Bureau of Labor Statistics jobs, unemployment and earnings data through June 2016**
**Last updated on July 22nd; July data will be released on August 19th**
Since February 2010, the national low point for private-sector employment, Texas businesses have added
1,689,500 jobs (an increase of 20.1 percent). Nationally, private payrolls have increased by 13.8 percent
over this time.
The state sectors with the greatest job gains in percentage terms since February 2010 are: leisure and
hospitality at 29.3 percent (292,200 jobs), professional and business services at 27.3 percent (343,100
jobs) and construction at 21.7 percent (122,100 jobs).
Jobs
In June, private-sector employment in Texas fell by 1,200 jobs. Over the past year, Texas businesses have
added 123,000 jobs. This compares with an increase of 252,100 jobs over the 12 months through June
2015.
Unemployment is up 0.1 percentage point from one year earlier but remains 3.9 percentage points below
its recent peak of 8.4 percent in October 2009.
There were 593,300 Texas residents unemployed in June 2016.
The unemployment rate in Texas was 4.5 percent in June 2016, up 0.1 percentage point from May. The
rate was 0.4 percentage point below the national rate of 4.9 percent.
Adjusting for inflation, state average hourly earnings have fallen by 0.5 percent over the past year.
Nationally, real average hourly earnings have increased by 1.6 percent (not seasonally adjusted).
-100
-80
-60
-40
-20
0
20
40
60
Source: JEC Democratic staff calculations based on seasonally adjusted data from the Bureau of Labor Statistics
Private-Sector Job Growth in TexasMonthly, Jan. 2008 - Jun. 2016, thousands
2008 2009 2010 2011 2012 2013 2014
Bush administration
Obama administration
2015 2016
JULY 2016

Texas United States
Private-Sector Jobs Added……………………………….Past 12 Months 123,000 2.3 million
Since Feb. 2010 1,689,500 14.8 million
Unemployment Rate …………………………………………………..June 2016 4.5% 4.9%
June 2015 4.4% 5.3%
Recession-Era Peak 8.4% 10.0%
Median Household Income (2014 $)…………………………………………………………….2014 $53,900 $53,700
2007 (Pre-Recession) $52,600 $57,400
Poverty Rate...………………………………………………………………..2014 16.4% 14.8%
2007 (Pre-Recession) 16.5% 12.5%
All Veterans' Unemployment Rate………………………….'2015 4.3% 4.6%
Post-9/11 Veterans' Unemployment Rate…………………………2015 5.0% 5.8%
Percentage Without Health Insurance...………………………………………………………….2014 19.1% 11.7%
2013 22.1% 14.5%
◙
◙
◙
◙
◙
◙
* Note: Because of methodological differences, total U.S. real GDP by state differs slightly from headline national GDP figures
Exports over the past 12 months are up 43.5 percent from their level in 2009 (inflation-adjusted).
In Texas, goods exports totaled $19.4 billion in May and $239.0 billion over the past year, down 6.5 percent
from the 12 months ending in May 2015 (inflation-adjusted).
Exports
In May 2016, builders in Texas broke ground on 176,490 new housing units (seasonally adjusted annual
rate), bringing the average over the past 12 months to 172,318 units. That marks an increase of 9.6
percent from the average over the prior 12 months.
Home prices in Texas increased by 7.1 percent from the first quarter of 2015 to the first quarter of 2016.
They are up 34.9 percent since their recent low in the first quarter of 2011.
Housing
Real gross domestic product (GDP) in Texas grew by 1.8 percent over the four quarters through the fourth
quarter of 2015, below the national average growth rate of 2.0 percent.*
State Gross Domestic Product
Since the official end of the Great Recession in the second quarter of 2009, Texas GDP growth has
averaged 3.8 percent at an annual rate, compared with a national average of 1.9 percent.
*** Note: state-level data changes may not be statistically significant due to sampling variation. Individual monthly readings should be
interpreted with caution and in the context of longer-term trends and other data that become available.
** A list of sources used to compile the Texas economic snapshot is available at: http://bit.ly/JEC-state-by-state-sources
**** For additional Texas-specific labor sector statistics, please refer to the Texas office: http://www.tracer2.com/?PAGEID=133
State Quick Facts

U.S. Congress Joint Economic Committee
◙
◙
◙
◙
◙
◙
◙
◙
In June 2016, average hourly earnings of private-sector workers in Utah were $24.26. The average
workweek was 34.7 hours, and average weekly earnings were $841.82.
Unemployment
Earnings
Economic Snapshot: Utah
**Includes Bureau of Labor Statistics jobs, unemployment and earnings data through June 2016**
**Last updated on July 22nd; July data will be released on August 19th**
Since February 2010, the national low point for private-sector employment, Utah businesses have added
224,600 jobs (an increase of 23.5 percent). Nationally, private payrolls have increased by 13.8 percent over
this time.
The state sectors with the greatest job gains in percentage terms since February 2010 are: construction at
38.3 percent (24,800 jobs), professional and business services at 31.8 percent (47,300 jobs) and leisure
and hospitality at 28.6 percent (31,400 jobs).
Jobs
In June, private-sector employment in Utah grew by 4,700 jobs. Over the past year, Utah businesses have
added 39,800 jobs. This compares with an increase of 50,000 jobs over the 12 months through June 2015.
Unemployment is up 0.4 percentage point from one year earlier but remains 4.0 percentage points below
its recent peak of 8.0 percent in May 2010.
There were 59,200 Utah residents unemployed in June 2016.
The unemployment rate in Utah was 4.0 percent in June 2016, up 0.2 percentage point from May. The rate
was 0.9 percentage point below the national rate of 4.9 percent.
Adjusting for inflation, state average hourly earnings have risen by 0.9 percent over the past year.
Nationally, real average hourly earnings have increased by 1.6 percent (not seasonally adjusted).
-15
-10
-5
0
5
10
Source: JEC Democratic staff calculations based on seasonally adjusted data from the Bureau of Labor Statistics
Private-Sector Job Growth in UtahMonthly, Jan. 2008 - Jun. 2016, thousands
2008 2009 2010 2011 2012 2013 2014
Bush administration
Obama administration
2015 2016
JULY 2016

Utah United States
Private-Sector Jobs Added……………………………….Past 12 Months 39,800 2.3 million
Since Feb. 2010 224,600 14.8 million
Unemployment Rate …………………………………………………..June 2016 4.0% 4.9%
June 2015 3.6% 5.3%
Recession-Era Peak 8.0% 10.0%
Median Household Income (2014 $)…………………………………………………………….2014 $63,400 $53,700
2007 (Pre-Recession) $61,100 $57,400
Poverty Rate...………………………………………………………………..2014 10.2% 14.8%
2007 (Pre-Recession) 9.6% 12.5%
All Veterans' Unemployment Rate………………………….'2015 2.6% 4.6%
Post-9/11 Veterans' Unemployment Rate…………………………2015 2.2% 5.8%
Percentage Without Health Insurance...………………………………………………………….2014 12.5% 11.7%
2013 14.0% 14.5%
◙
◙
◙
◙
◙
◙
* Note: Because of methodological differences, total U.S. real GDP by state differs slightly from headline national GDP figures
Exports over the past 12 months are up 21.8 percent from their level in 2009 (inflation-adjusted).
In Utah, goods exports totaled $871 million in May and $12.9 billion over the past year, up 9.3 percent from
the 12 months ending in May 2015 (inflation-adjusted).
Exports
In May 2016, builders in Utah broke ground on 18,570 new housing units (seasonally adjusted annual rate),
bringing the average over the past 12 months to 19,629 units. That marks an increase of 19.5 percent from
the average over the prior 12 months.
Home prices in Utah increased by 7.0 percent from the first quarter of 2015 to the first quarter of 2016.
They are up 39.8 percent since their recent low in the second quarter of 2011.
Housing
Real gross domestic product (GDP) in Utah grew by 3.4 percent over the four quarters through the fourth
quarter of 2015, above the national average growth rate of 2.0 percent.*
State Gross Domestic Product
Since the official end of the Great Recession in the second quarter of 2009, Utah GDP growth has
averaged 2.4 percent at an annual rate, compared with a national average of 1.9 percent.
*** Note: state-level data changes may not be statistically significant due to sampling variation. Individual monthly readings should be
interpreted with caution and in the context of longer-term trends and other data that become available.
** A list of sources used to compile the Utah economic snapshot is available at: http://bit.ly/JEC-state-by-state-sources
**** For additional Utah-specific labor sector statistics, please refer to the Utah office: http://jobs.utah.gov/opencms/wi/pubs/une/
State Quick Facts

U.S. Congress Joint Economic Committee
◙
◙
◙
◙
◙
◙
◙
◙
In June 2016, average hourly earnings of private-sector workers in Vermont were $24.01. The average
workweek was 33.6 hours, and average weekly earnings were $806.74.
Unemployment
Earnings
Economic Snapshot: Vermont
**Includes Bureau of Labor Statistics jobs, unemployment and earnings data through June 2016**
**Last updated on July 22nd; July data will be released on August 19th**
Since February 2010, the national low point for private-sector employment, Vermont businesses have
added 17,900 jobs (an increase of 7.4 percent). Nationally, private payrolls have increased by 13.8 percent
over this time.
The state sectors with the greatest job gains in percentage terms since February 2010 are: professional
and business services at 19.3 percent (4,400 jobs), construction at 19.1 percent (2,500 jobs) and leisure
and hospitality at 14.6 percent (4,700 jobs).
Jobs
In June, private-sector employment in Vermont fell by 1,700 jobs. Over the past year, Vermont businesses
have added 2,900 jobs. This compares with an increase of 1,600 jobs over the 12 months through June
2015.
Unemployment is down 0.5 percentage point from one year earlier and is 3.8 percentage points below its
recent peak of 7.0 percent in May 2009.
There were 11,000 Vermont residents unemployed in June 2016.
The unemployment rate in Vermont was 3.2 percent in June 2016, up 0.1 percentage point from May. The
rate was 1.7 percentage points below the national rate of 4.9 percent.
Adjusting for inflation, state average hourly earnings have fallen by 0.8 percent over the past year.
Nationally, real average hourly earnings have increased by 1.6 percent (not seasonally adjusted).
-4
-3
-2
-1
0
1
2
3
Source: JEC Democratic staff calculations based on seasonally adjusted data from the Bureau of Labor Statistics
Private-Sector Job Growth in VermontMonthly, Jan. 2008 - Jun. 2016, thousands
2008 2009 2010 2011 2012 2013 2014
Bush administration
Obama administration
2015 2016
JULY 2016

Vermont United States
Private-Sector Jobs Added……………………………….Past 12 Months 2,900 2.3 million
Since Feb. 2010 17,900 14.8 million
Unemployment Rate …………………………………………………..June 2016 3.2% 4.9%
June 2015 3.7% 5.3%
Recession-Era Peak 7.0% 10.0%
Median Household Income (2014 $)…………………………………………………………….2014 $60,700 $53,700
2007 (Pre-Recession) $54,100 $57,400
Poverty Rate...………………………………………………………………..2014 9.3% 14.8%
2007 (Pre-Recession) 9.9% 12.5%
All Veterans' Unemployment Rate………………………….'2015 3.9% 4.6%
Post-9/11 Veterans' Unemployment Rate…………………………2015 8.8% 5.8%
Percentage Without Health Insurance...………………………………………………………….2014 5.0% 11.7%
2013 7.2% 14.5%
◙
◙
◙
◙
◙
◙
* Note: Because of methodological differences, total U.S. real GDP by state differs slightly from headline national GDP figures
Exports over the past 12 months are down 4.4 percent from their level in 2009 (inflation-adjusted).
In Vermont, goods exports totaled $245 million in May and $3.1 billion over the past year, down 7.5 percent
from the 12 months ending in May 2015 (inflation-adjusted).
Exports
In May 2016, builders in Vermont broke ground on 2,310 new housing units (seasonally adjusted annual
rate), bringing the average over the past 12 months to 1,910 units. That marks an increase of 40.0 percent
from the average over the prior 12 months.
Home prices in Vermont increased by 0.6 percent from the first quarter of 2015 to the first quarter of 2016.
They are up 7.3 percent since their recent low in the second quarter of 2011.
Housing
Real gross domestic product (GDP) in Vermont fell by 0.2 percent over the four quarters through the fourth
quarter of 2015, below the national average growth rate of 2.0 percent.*
State Gross Domestic Product
Since the official end of the Great Recession in the second quarter of 2009, Vermont GDP growth has
averaged 1.6 percent at an annual rate, compared with a national average of 1.9 percent.
*** Note: state-level data changes may not be statistically significant due to sampling variation. Individual monthly readings should be
interpreted with caution and in the context of longer-term trends and other data that become available.
** A list of sources used to compile the Vermont economic snapshot is available at: http://bit.ly/JEC-state-by-state-sources
**** For additional Vermont-specific labor sector statistics, please refer to the Vermont office: http://www.vtlmi.info/
State Quick Facts

U.S. Congress Joint Economic Committee
◙
◙
◙
◙
◙
◙
◙
◙
In June 2016, average hourly earnings of private-sector workers in Virginia were $26.70. The average
workweek was 34.9 hours, and average weekly earnings were $931.83.
Unemployment
Earnings
Economic Snapshot: Virginia
**Includes Bureau of Labor Statistics jobs, unemployment and earnings data through June 2016**
**Last updated on July 22nd; July data will be released on August 19th**
Since February 2010, the national low point for private-sector employment, Virginia businesses have added
307,100 jobs (an increase of 10.6 percent). Nationally, private payrolls have increased by 13.8 percent over
this time.
The state sectors with the greatest job gains in percentage terms since February 2010 are: education and
health services at 16.6 percent (75,500 jobs), leisure and hospitality at 16.4 percent (54,500 jobs) and
financial activities at 13.6 percent (24,100 jobs).
Jobs
In June, private-sector employment in Virginia grew by 12,900 jobs. Over the past year, Virginia businesses
have added 76,400 jobs. This compares with an increase of 49,700 jobs over the 12 months through June
2015.
Unemployment is down 0.7 percentage point from one year earlier and is 3.7 percentage points below its
recent peak of 7.4 percent in February 2010.
There were 154,700 Virginia residents unemployed in June 2016.
The unemployment rate in Virginia was 3.7 percent in June 2016, holding constant from May. The rate was
1.2 percentage points below the national rate of 4.9 percent.
Adjusting for inflation, state average hourly earnings have risen by 2.5 percent over the past year.
Nationally, real average hourly earnings have increased by 1.6 percent (not seasonally adjusted).
-30
-25
-20
-15
-10
-5
0
5
10
15
20
25
Source: JEC Democratic staff calculations based on seasonally adjusted data from the Bureau of Labor Statistics
Private-Sector Job Growth in VirginiaMonthly, Jan. 2008 - Jun. 2016, thousands
2008 2009 2010 2011 2012 2013 2014
Bush administration
Obama administration
2015 2016
JULY 2016

Virginia United States
Private-Sector Jobs Added……………………………….Past 12 Months 76,400 2.3 million
Since Feb. 2010 307,100 14.8 million
Unemployment Rate …………………………………………………..June 2016 3.7% 4.9%
June 2015 4.4% 5.3%
Recession-Era Peak 7.4% 10.0%
Median Household Income (2014 $)…………………………………………………………….2014 $66,200 $53,700
2007 (Pre-Recession) $67,600 $57,400
Poverty Rate...………………………………………………………………..2014 10.2% 14.8%
2007 (Pre-Recession) 8.6% 12.5%
All Veterans' Unemployment Rate………………………….'2015 3.8% 4.6%
Post-9/11 Veterans' Unemployment Rate…………………………2015 4.5% 5.8%
Percentage Without Health Insurance...………………………………………………………….2014 10.9% 11.7%
2013 12.3% 14.5%
◙
◙
◙
◙
◙
◙
* Note: Because of methodological differences, total U.S. real GDP by state differs slightly from headline national GDP figures
Exports over the past 12 months are up 11.6 percent from their level in 2009 (inflation-adjusted).
In Virginia, goods exports totaled $1.4 billion in May and $17.2 billion over the past year, down 2.0 percent
from the 12 months ending in May 2015 (inflation-adjusted).
Exports
In May 2016, builders in Virginia broke ground on 32,250 new housing units (seasonally adjusted annual
rate), bringing the average over the past 12 months to 31,837 units. That marks an increase of 13.7
percent from the average over the prior 12 months.
Home prices in Virginia increased by 2.8 percent from the first quarter of 2015 to the first quarter of 2016.
They are up 15.9 percent since their recent low in the first quarter of 2011.
Housing
Real gross domestic product (GDP) in Virginia grew by 2.3 percent over the four quarters through the
fourth quarter of 2015, above the national average growth rate of 2.0 percent.*
State Gross Domestic Product
Since the official end of the Great Recession in the second quarter of 2009, Virginia GDP growth has
averaged 1.0 percent at an annual rate, compared with a national average of 1.9 percent.
*** Note: state-level data changes may not be statistically significant due to sampling variation. Individual monthly readings should be
interpreted with caution and in the context of longer-term trends and other data that become available.
** A list of sources used to compile the Virginia economic snapshot is available at: http://bit.ly/JEC-state-by-state-sources
**** For additional Virginia-specific labor sector statistics, please refer to the Virginia office: http://www.vawc.virginia.gov/analyzer/default.asp
State Quick Facts
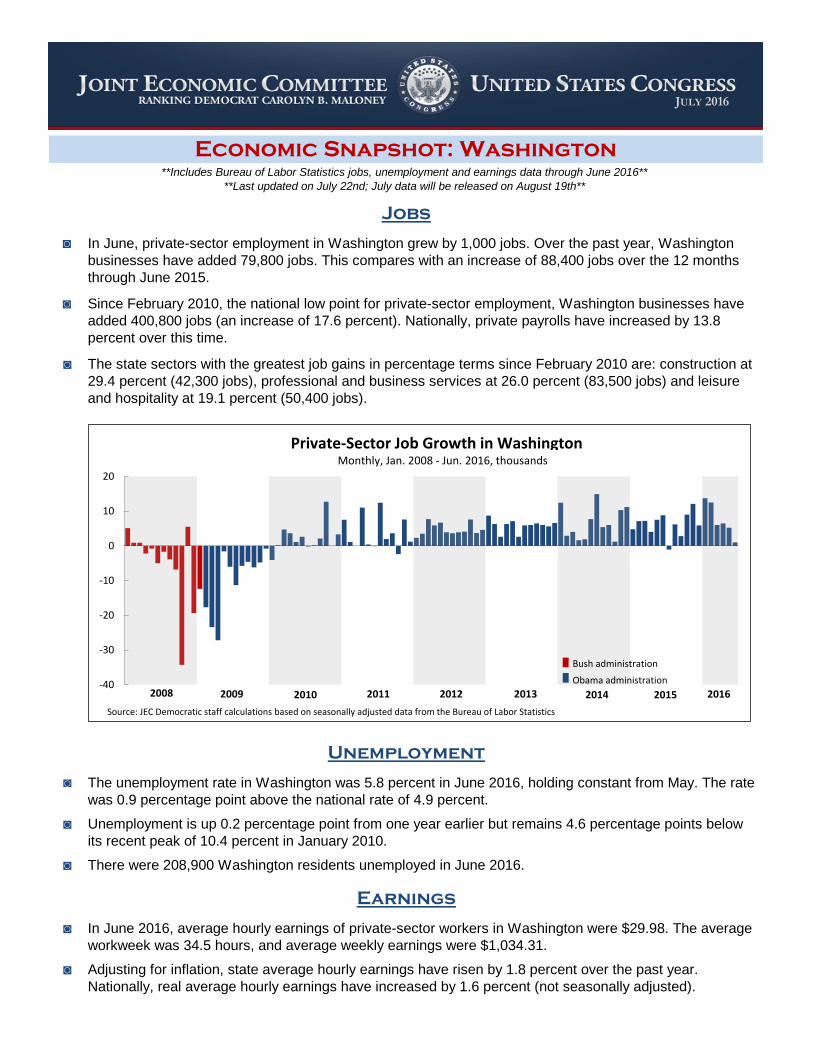
U.S. Congress Joint Economic Committee
◙
◙
◙
◙
◙
◙
◙
◙
In June 2016, average hourly earnings of private-sector workers in Washington were $29.98. The average
workweek was 34.5 hours, and average weekly earnings were $1,034.31.
Unemployment
Earnings
Economic Snapshot: Washington
**Includes Bureau of Labor Statistics jobs, unemployment and earnings data through June 2016**
**Last updated on July 22nd; July data will be released on August 19th**
Since February 2010, the national low point for private-sector employment, Washington businesses have
added 400,800 jobs (an increase of 17.6 percent). Nationally, private payrolls have increased by 13.8
percent over this time.
The state sectors with the greatest job gains in percentage terms since February 2010 are: construction at
29.4 percent (42,300 jobs), professional and business services at 26.0 percent (83,500 jobs) and leisure
and hospitality at 19.1 percent (50,400 jobs).
Jobs
In June, private-sector employment in Washington grew by 1,000 jobs. Over the past year, Washington
businesses have added 79,800 jobs. This compares with an increase of 88,400 jobs over the 12 months
through June 2015.
Unemployment is up 0.2 percentage point from one year earlier but remains 4.6 percentage points below
its recent peak of 10.4 percent in January 2010.
There were 208,900 Washington residents unemployed in June 2016.
The unemployment rate in Washington was 5.8 percent in June 2016, holding constant from May. The rate
was 0.9 percentage point above the national rate of 4.9 percent.
Adjusting for inflation, state average hourly earnings have risen by 1.8 percent over the past year.
Nationally, real average hourly earnings have increased by 1.6 percent (not seasonally adjusted).
-40
-30
-20
-10
0
10
20
Source: JEC Democratic staff calculations based on seasonally adjusted data from the Bureau of Labor Statistics
Private-Sector Job Growth in WashingtonMonthly, Jan. 2008 - Jun. 2016, thousands
2008 2009 2010 2011 2012 2013 2014
Bush administration
Obama administration
2015 2016
JULY 2016

Washington United States
Private-Sector Jobs Added……………………………….Past 12 Months 79,800 2.3 million
Since Feb. 2010 400,800 14.8 million
Unemployment Rate …………………………………………………..June 2016 5.8% 4.9%
June 2015 5.6% 5.3%
Recession-Era Peak 10.4% 10.0%
Median Household Income (2014 $)…………………………………………………………….2014 $59,100 $53,700
2007 (Pre-Recession) $66,300 $57,400
Poverty Rate...………………………………………………………………..2014 12.0% 14.8%
2007 (Pre-Recession) 10.2% 12.5%
All Veterans' Unemployment Rate………………………….'2015 3.8% 4.6%
Post-9/11 Veterans' Unemployment Rate…………………………2015 4.1% 5.8%
Percentage Without Health Insurance...………………………………………………………….2014 9.2% 11.7%
2013 14.0% 14.5%
◙
◙
◙
◙
◙
◙
* Note: Because of methodological differences, total U.S. real GDP by state differs slightly from headline national GDP figures
Exports over the past 12 months are up 52.8 percent from their level in 2009 (inflation-adjusted).
In Washington, goods exports totaled $6.4 billion in May and $80.8 billion over the past year, down 4.0
percent from the 12 months ending in May 2015 (inflation-adjusted).
Exports
In May 2016, builders in Washington broke ground on 34,610 new housing units (seasonally adjusted
annual rate), bringing the average over the past 12 months to 36,198 units. That marks a decrease of 3.7
percent from the average over the prior 12 months.
Home prices in Washington increased by 10.9 percent from the first quarter of 2015 to the first quarter of
2016. They are up 41.3 percent since their recent low in the fourth quarter of 2011.
Housing
Real gross domestic product (GDP) in Washington grew by 2.5 percent over the four quarters through the
fourth quarter of 2015, above the national average growth rate of 2.0 percent.*
State Gross Domestic Product
Since the official end of the Great Recession in the second quarter of 2009, Washington GDP growth has
averaged 2.0 percent at an annual rate, compared with a national average of 1.9 percent.
*** Note: state-level data changes may not be statistically significant due to sampling variation. Individual monthly readings should be
interpreted with caution and in the context of longer-term trends and other data that become available.
** A list of sources used to compile the Washington economic snapshot is available at: http://bit.ly/JEC-state-by-state-sources
**** For additional Washington-specific labor sector statistics, please refer to the Washington office: http://www.workforceexplorer.com/
State Quick Facts

U.S. Congress Joint Economic Committee
◙
◙
◙
◙
◙
◙
◙
◙
In June 2016, average hourly earnings of private-sector workers in West Virginia were $20.65. The
average workweek was 35.2 hours, and average weekly earnings were $726.88.
Unemployment
Earnings
Economic Snapshot: West Virginia
**Includes Bureau of Labor Statistics jobs, unemployment and earnings data through June 2016**
**Last updated on July 22nd; July data will be released on August 19th**
Since February 2010, the national low point for private-sector employment, West Virginia businesses have
added 14,900 jobs (an increase of 2.5 percent). Nationally, private payrolls have increased by 13.8 percent
over this time.
The state sectors with the greatest job gains in percentage terms since February 2010 are: education and
health services at 10.3 percent (12,300 jobs), professional and business services at 9.9 percent (6,000
jobs) and leisure and hospitality at 8.2 percent (5,800 jobs).
Jobs
In June, private-sector employment in West Virginia grew by 3,900 jobs. Over the past year, West Virginia
businesses have shed 2,500 jobs. This compares with a decrease of 5,000 jobs over the 12 months
through June 2015.
Unemployment is down 1.1 percentage points from one year earlier and is 2.8 percentage points below its
recent peak of 8.8 percent in November 2010.
There were 47,200 West Virginia residents unemployed in June 2016.
The unemployment rate in West Virginia was 6.0 percent in June 2016, down 0.2 percentage point from
May. The rate was 1.1 percentage points above the national rate of 4.9 percent.
Adjusting for inflation, state average hourly earnings have fallen by 0.4 percent over the past year.
Nationally, real average hourly earnings have increased by 1.6 percent (not seasonally adjusted).
-6
-5
-4
-3
-2
-1
0
1
2
3
4
5
Source: JEC Democratic staff calculations based on seasonally adjusted data from the Bureau of Labor Statistics
Private-Sector Job Growth in West VirginiaMonthly, Jan. 2008 - Jun. 2016, thousands
2008 2009 2010 2011 2012 2013 2014
Bush administration
Obama administration
2015 2016
JULY 2016

West Virginia United States
Private-Sector Jobs Added……………………………….Past 12 Months -2,500 2.3 million
Since Feb. 2010 14,900 14.8 million
Unemployment Rate …………………………………………………..June 2016 6.0% 4.9%
June 2015 7.1% 5.3%
Recession-Era Peak 8.8% 10.0%
Median Household Income (2014 $)…………………………………………………………….2014 $39,600 $53,700
2007 (Pre-Recession) $48,100 $57,400
Poverty Rate...………………………………………………………………..2014 20.6% 14.8%
2007 (Pre-Recession) 14.8% 12.5%
All Veterans' Unemployment Rate………………………….'2015 5.1% 4.6%
Post-9/11 Veterans' Unemployment Rate…………………………2015 5.7% 5.8%
Percentage Without Health Insurance...………………………………………………………….2014 8.6% 11.7%
2013 14.0% 14.5%
◙
◙
◙
◙
◙
◙
* Note: Because of methodological differences, total U.S. real GDP by state differs slightly from headline national GDP figures
Exports over the past 12 months are up 2.9 percent from their level in 2009 (inflation-adjusted).
In West Virginia, goods exports totaled $378 million in May and $5.1 billion over the past year, down 20.5
percent from the 12 months ending in May 2015 (inflation-adjusted).
Exports
In May 2016, builders in West Virginia broke ground on 2,930 new housing units (seasonally adjusted
annual rate), bringing the average over the past 12 months to 2,732 units. That marks an increase of 14.9
percent from the average over the prior 12 months.
Home prices in West Virginia increased by 3.3 percent from the first quarter of 2015 to the first quarter of
2016. They are up 14.1 percent since their recent low in the second quarter of 2011.
Housing
Real gross domestic product (GDP) in West Virginia fell by 1.1 percent over the four quarters through the
fourth quarter of 2015, below the national average growth rate of 2.0 percent.*
State Gross Domestic Product
Since the official end of the Great Recession in the second quarter of 2009, West Virginia GDP growth has
averaged 0.9 percent at an annual rate, compared with a national average of 1.9 percent.
*** Note: state-level data changes may not be statistically significant due to sampling variation. Individual monthly readings should be
interpreted with caution and in the context of longer-term trends and other data that become available.
** A list of sources used to compile the West Virginia economic snapshot is available at: http://bit.ly/JEC-state-by-state-sources
**** For additional West Virginia-specific labor sector statistics, please refer to the West Virginia office: http://www.workforcewv.org/lmi/
State Quick Facts

U.S. Congress Joint Economic Committee
◙
◙
◙
◙
◙
◙
◙
◙
In June 2016, average hourly earnings of private-sector workers in Wisconsin were $23.81. The average
workweek was 33.7 hours, and average weekly earnings were $802.40.
Unemployment
Earnings
Economic Snapshot: Wisconsin
**Includes Bureau of Labor Statistics jobs, unemployment and earnings data through June 2016**
**Last updated on July 22nd; July data will be released on August 19th**
Since February 2010, the national low point for private-sector employment, Wisconsin businesses have
added 232,300 jobs (an increase of 10.1 percent). Nationally, private payrolls have increased by 13.8
percent over this time.
The state sectors with the greatest job gains in percentage terms since February 2010 are: mining and
logging at 27.6 percent (800 jobs), construction at 21.5 percent (20,600 jobs) and professional and
business services at 17.7 percent (47,200 jobs).
Jobs
In June, private-sector employment in Wisconsin grew by 10,900 jobs. Over the past year, Wisconsin
businesses have added 49,900 jobs. This compares with an increase of 34,000 jobs over the 12 months
through June 2015.
Unemployment is down 0.4 percentage point from one year earlier and is 5.0 percentage points below its
recent peak of 9.2 percent in January 2010.
There were 131,100 Wisconsin residents unemployed in June 2016.
The unemployment rate in Wisconsin was 4.2 percent in June 2016, holding constant from May. The rate
was 0.7 percentage point below the national rate of 4.9 percent.
Adjusting for inflation, state average hourly earnings have risen by 2.1 percent over the past year.
Nationally, real average hourly earnings have increased by 1.6 percent (not seasonally adjusted).
-30
-25
-20
-15
-10
-5
0
5
10
15
20
Source: JEC Democratic staff calculations based on seasonally adjusted data from the Bureau of Labor Statistics
Private-Sector Job Growth in WisconsinMonthly, Jan. 2008 - Jun. 2016, thousands
2008 2009 2010 2011 2012 2013 2014
Bush administration
Obama administration
2015 2016
JULY 2016
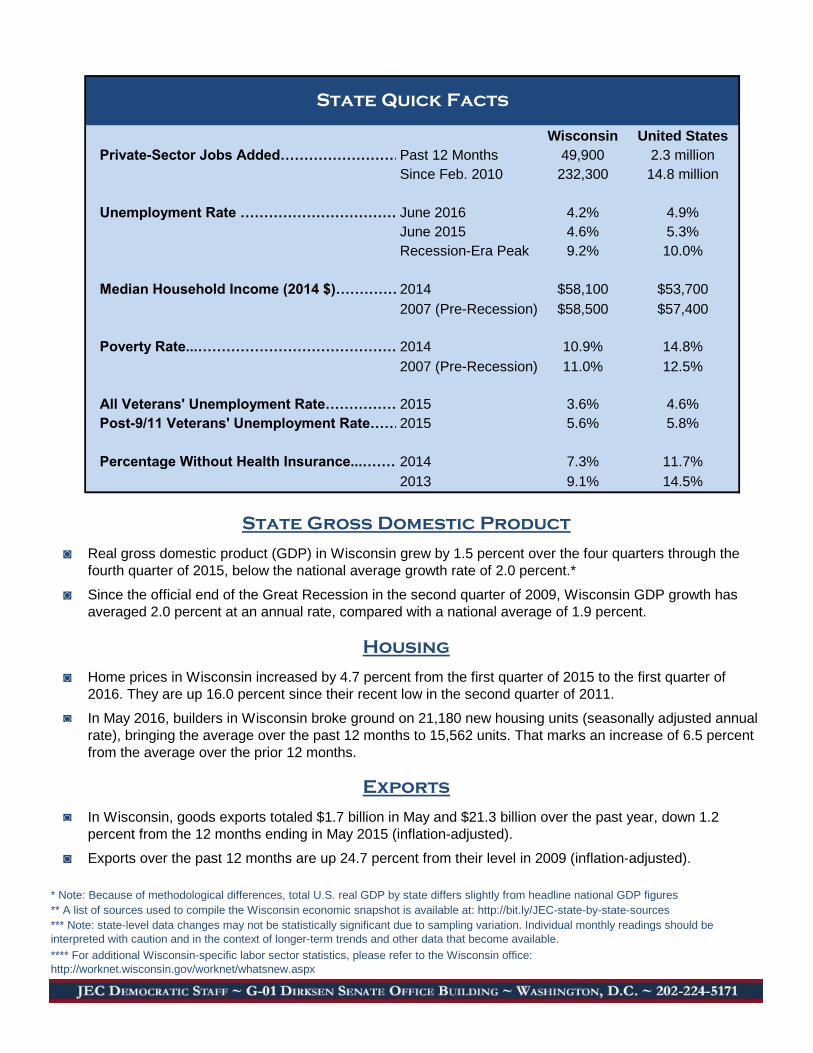
Wisconsin United States
Private-Sector Jobs Added……………………………….Past 12 Months 49,900 2.3 million
Since Feb. 2010 232,300 14.8 million
Unemployment Rate …………………………………………………..June 2016 4.2% 4.9%
June 2015 4.6% 5.3%
Recession-Era Peak 9.2% 10.0%
Median Household Income (2014 $)…………………………………………………………….2014 $58,100 $53,700
2007 (Pre-Recession) $58,500 $57,400
Poverty Rate...………………………………………………………………..2014 10.9% 14.8%
2007 (Pre-Recession) 11.0% 12.5%
All Veterans' Unemployment Rate………………………….'2015 3.6% 4.6%
Post-9/11 Veterans' Unemployment Rate…………………………2015 5.6% 5.8%
Percentage Without Health Insurance...………………………………………………………….2014 7.3% 11.7%
2013 9.1% 14.5%
◙
◙
◙
◙
◙
◙
* Note: Because of methodological differences, total U.S. real GDP by state differs slightly from headline national GDP figures
Exports over the past 12 months are up 24.7 percent from their level in 2009 (inflation-adjusted).
In Wisconsin, goods exports totaled $1.7 billion in May and $21.3 billion over the past year, down 1.2
percent from the 12 months ending in May 2015 (inflation-adjusted).
Exports
In May 2016, builders in Wisconsin broke ground on 21,180 new housing units (seasonally adjusted annual
rate), bringing the average over the past 12 months to 15,562 units. That marks an increase of 6.5 percent
from the average over the prior 12 months.
Home prices in Wisconsin increased by 4.7 percent from the first quarter of 2015 to the first quarter of
2016. They are up 16.0 percent since their recent low in the second quarter of 2011.
Housing
Real gross domestic product (GDP) in Wisconsin grew by 1.5 percent over the four quarters through the
fourth quarter of 2015, below the national average growth rate of 2.0 percent.*
State Gross Domestic Product
Since the official end of the Great Recession in the second quarter of 2009, Wisconsin GDP growth has
averaged 2.0 percent at an annual rate, compared with a national average of 1.9 percent.
*** Note: state-level data changes may not be statistically significant due to sampling variation. Individual monthly readings should be
interpreted with caution and in the context of longer-term trends and other data that become available.
** A list of sources used to compile the Wisconsin economic snapshot is available at: http://bit.ly/JEC-state-by-state-sources
**** For additional Wisconsin-specific labor sector statistics, please refer to the Wisconsin office:
http://worknet.wisconsin.gov/worknet/whatsnew.aspx
State Quick Facts

U.S. Congress Joint Economic Committee
◙
◙
◙
◙
◙
◙
◙
◙
Unemployment is up 1.5 percentage points from one year earlier but remains 1.5 percentage points below
its recent peak of 7.2 percent in January 2010.
There were 17,000 Wyoming residents unemployed in June 2016.
The unemployment rate in Wyoming was 5.7 percent in June 2016, up 0.1 percentage point from May. The
rate was 0.8 percentage point above the national rate of 4.9 percent.
Adjusting for inflation, state average hourly earnings have fallen by 0.5 percent over the past year.
Nationally, real average hourly earnings have increased by 1.6 percent (not seasonally adjusted).
Economic Snapshot: Wyoming
**Includes Bureau of Labor Statistics jobs, unemployment and earnings data through June 2016**
**Last updated on July 22nd; July data will be released on August 19th**
Since February 2010, the national low point for private-sector employment, Wyoming businesses have
added 100 jobs (holding roughly constant in percentage terms). Nationally, private payrolls have increased
by 13.8 percent over this time.
The state sectors with the greatest job gains in percentage terms since February 2010 are: manufacturing
at 11.6 percent (1,000 jobs), professional and business services at 8.9 percent (1,500 jobs) and leisure and
hospitality at 7.1 percent (2,300 jobs).
Jobs
In June, private-sector employment in Wyoming fell by 1,700 jobs. Over the past year, Wyoming
businesses have shed 9,300 jobs. This compares with a decrease of 5,300 jobs over the 12 months
through June 2015.
In June 2016, average hourly earnings of private-sector workers in Wyoming were $22.77. The average
workweek was 33.1 hours, and average weekly earnings were $753.69.
Unemployment
Earnings
-5
-4
-3
-2
-1
0
1
2
3
Source: JEC Democratic staff calculations based on seasonally adjusted data from the Bureau of Labor Statistics
Private-Sector Job Growth in WyomingMonthly, Jan. 2008 - Jun. 2016, thousands
2008 2009 2010 2011 2012 2013 2014
Bush administration
Obama administration
2015 2016
JULY 2016

Wyoming United States
Private-Sector Jobs Added……………………………….Past 12 Months -9,300 2.3 million
Since Feb. 2010 100 14.8 million
Unemployment Rate …………………………………………………..June 2016 5.7% 4.9%
June 2015 4.2% 5.3%
Recession-Era Peak 7.2% 10.0%
Median Household Income (2014 $)…………………………………………………………….2014 $55,700 $53,700
2007 (Pre-Recession) $55,700 $57,400
Poverty Rate...………………………………………………………………..2014 9.7% 14.8%
2007 (Pre-Recession) 10.9% 12.5%
All Veterans' Unemployment Rate………………………….'2015 3.3% 4.6%
Post-9/11 Veterans' Unemployment Rate…………………………2015 4.8% 5.8%
Percentage Without Health Insurance...………………………………………………………….2014 12.0% 11.7%
2013 13.4% 14.5%
◙
◙
◙
◙
◙
◙
**** For additional Wyoming-specific labor sector statistics, please refer to the Wyoming office: http://wydoe.state.wy.us/lmi/bls.htm
State Quick Facts
*** Note: state-level data changes may not be statistically significant due to sampling variation. Individual monthly readings should be
interpreted with caution and in the context of longer-term trends and other data that become available.
** A list of sources used to compile the Wyoming economic snapshot is available at: http://bit.ly/JEC-state-by-state-sources
Home prices in Wyoming increased by 1.7 percent from the first quarter of 2015 to the first quarter of 2016.
They are up 17.9 percent since their recent low in the third quarter of 2010.
Housing
Real gross domestic product (GDP) in Wyoming fell by 2.9 percent over the four quarters through the
fourth quarter of 2015, below the national average growth rate of 2.0 percent.*
State Gross Domestic Product
Since the official end of the Great Recession in the second quarter of 2009, Wyoming GDP growth has
averaged -1.0 percent at an annual rate, compared with a national average of 1.9 percent.
* Note: Because of methodological differences, total U.S. real GDP by state differs slightly from headline national GDP figures
Exports over the past 12 months are up 14.4 percent from their level in 2009 (inflation-adjusted).
In Wyoming, goods exports totaled $115 million in May and $1.1 billion over the past year, down 30.2
percent from the 12 months ending in May 2015 (inflation-adjusted).
Exports
In May 2016, builders in Wyoming broke ground on 2,100 new housing units (seasonally adjusted annual
rate), bringing the average over the past 12 months to 1,616 units. That marks a decrease of 1.5 percent
from the average over the prior 12 months.
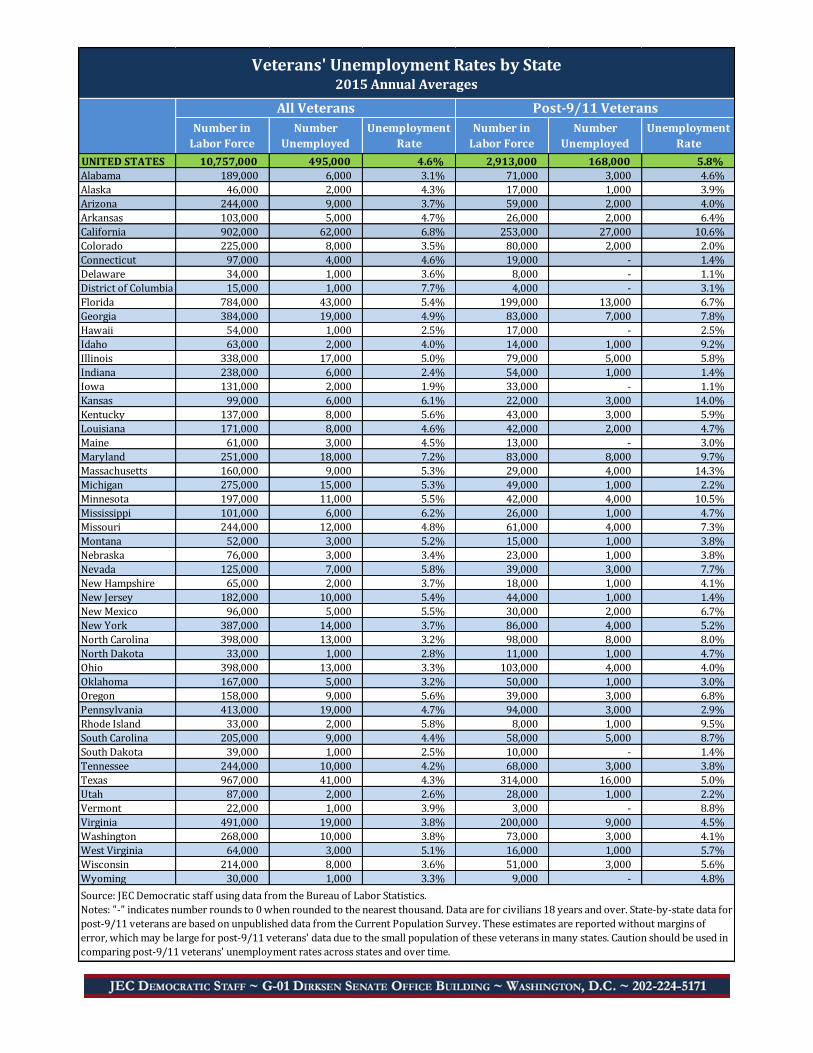
Number in
Labor Force
Number
Unemployed
Unemployment
Rate
Number in
Labor Force
Number
Unemployed
Unemployment
Rate
UNITED STATES 10,757,000 495,000 4.6% 2,913,000 168,000 5.8%
Alabama 189,000 6,000 3.1% 71,000 3,000 4.6%
Alaska 46,000 2,000 4.3% 17,000 1,000 3.9%
Arizona 244,000 9,000 3.7% 59,000 2,000 4.0%
Arkansas 103,000 5,000 4.7% 26,000 2,000 6.4%
California 902,000 62,000 6.8% 253,000 27,000 10.6%
Colorado 225,000 8,000 3.5% 80,000 2,000 2.0%
Connecticut 97,000 4,000 4.6% 19,000 - 1.4%
Delaware 34,000 1,000 3.6% 8,000 - 1.1%
District of Columbia 15,000 1,000 7.7% 4,000 - 3.1%
Florida 784,000 43,000 5.4% 199,000 13,000 6.7%
Georgia 384,000 19,000 4.9% 83,000 7,000 7.8%
Hawaii 54,000 1,000 2.5% 17,000 - 2.5%
Idaho 63,000 2,000 4.0% 14,000 1,000 9.2%
Illinois 338,000 17,000 5.0% 79,000 5,000 5.8%
Indiana 238,000 6,000 2.4% 54,000 1,000 1.4%
Iowa 131,000 2,000 1.9% 33,000 - 1.1%
Kansas 99,000 6,000 6.1% 22,000 3,000 14.0%
Kentucky 137,000 8,000 5.6% 43,000 3,000 5.9%
Louisiana 171,000 8,000 4.6% 42,000 2,000 4.7%
Maine 61,000 3,000 4.5% 13,000 - 3.0%
Maryland 251,000 18,000 7.2% 83,000 8,000 9.7%
Massachusetts 160,000 9,000 5.3% 29,000 4,000 14.3%
Michigan 275,000 15,000 5.3% 49,000 1,000 2.2%
Minnesota 197,000 11,000 5.5% 42,000 4,000 10.5%
Mississippi 101,000 6,000 6.2% 26,000 1,000 4.7%
Missouri 244,000 12,000 4.8% 61,000 4,000 7.3%
Montana 52,000 3,000 5.2% 15,000 1,000 3.8%
Nebraska 76,000 3,000 3.4% 23,000 1,000 3.8%
Nevada 125,000 7,000 5.8% 39,000 3,000 7.7%
New Hampshire 65,000 2,000 3.7% 18,000 1,000 4.1%
New Jersey 182,000 10,000 5.4% 44,000 1,000 1.4%
New Mexico 96,000 5,000 5.5% 30,000 2,000 6.7%
New York 387,000 14,000 3.7% 86,000 4,000 5.2%
North Carolina 398,000 13,000 3.2% 98,000 8,000 8.0%
North Dakota 33,000 1,000 2.8% 11,000 1,000 4.7%
Ohio 398,000 13,000 3.3% 103,000 4,000 4.0%
Oklahoma 167,000 5,000 3.2% 50,000 1,000 3.0%
Oregon 158,000 9,000 5.6% 39,000 3,000 6.8%
Pennsylvania 413,000 19,000 4.7% 94,000 3,000 2.9%
Rhode Island 33,000 2,000 5.8% 8,000 1,000 9.5%
South Carolina 205,000 9,000 4.4% 58,000 5,000 8.7%
South Dakota 39,000 1,000 2.5% 10,000 - 1.4%
Tennessee 244,000 10,000 4.2% 68,000 3,000 3.8%
Texas 967,000 41,000 4.3% 314,000 16,000 5.0%
Utah 87,000 2,000 2.6% 28,000 1,000 2.2%
Vermont 22,000 1,000 3.9% 3,000 - 8.8%
Virginia 491,000 19,000 3.8% 200,000 9,000 4.5%
Washington 268,000 10,000 3.8% 73,000 3,000 4.1%
West Virginia 64,000 3,000 5.1% 16,000 1,000 5.7%
Wisconsin 214,000 8,000 3.6% 51,000 3,000 5.6%
Wyoming 30,000 1,000 3.3% 9,000 - 4.8%
Source: JEC Democratic staff using data from the Bureau of Labor Statistics.
Notes: "-" indicates number rounds to 0 when rounded to the nearest thousand. Data are for civilians 18 years and over. State-by-state data for
post-9/11 veterans are based on unpublished data from the Current Population Survey. These estimates are reported without margins of
error, which may be large for post-9/11 veterans' data due to the small population of these veterans in many states. Caution should be used in
comparing post-9/11 veterans' unemployment rates across states and over time.
Veterans' Unemployment Rates by State2015 Annual Averages
Post-9/11 VeteransAll Veterans

Change in Number
Without Coverage
2007 2014 2007 2014 2013 2014 2013 to 2014
UNITED STATES $57,400 $53,700 12.5% 14.8% 14.5% 11.7% -8,510,000
Alabama $48,200 $42,300 14.5% 17.8% 13.6% 12.1% -66,000
Alaska $71,900 $67,600 7.6% 11.9% 18.5% 17.2% -10,000
Arizona $53,900 $49,300 14.3% 21.2% 17.1% 13.6% -215,000
Arkansas $46,600 $44,900 13.8% 18.4% 16.0% 11.8% -122,000
California $63,600 $60,500 12.7% 15.8% 17.2% 12.4% -1,733,000
Colorado $69,800 $60,900 9.8% 12.3% 14.1% 10.3% -187,000
Connecticut $73,200 $70,200 8.9% 8.6% 9.4% 6.9% -87,000
Delaware $62,300 $57,500 9.3% 11.0% 9.1% 7.8% -12,000
District of Columbia $58,000 $68,300 18.0% 19.0% 6.7% 5.3% -8,000
Florida $52,300 $46,100 12.5% 16.7% 20.0% 16.6% -608,000
Georgia $55,500 $49,600 13.6% 16.8% 18.8% 15.8% -278,000
Hawaii $73,100 $71,200 7.5% 10.8% 6.7% 5.3% -19,000
Idaho $56,200 $53,400 9.9% 12.4% 16.2% 13.6% -39,000
Illinois $60,000 $54,900 10.0% 13.7% 12.7% 9.7% -380,000
Indiana $54,200 $48,100 11.8% 14.6% 14.0% 11.9% -127,000
Iowa $55,800 $57,800 8.9% 10.3% 8.1% 6.2% -59,000
Kansas $55,400 $53,400 11.7% 12.1% 12.3% 10.2% -57,000
Kentucky $45,000 $42,800 15.5% 20.0% 14.3% 8.5% -250,000
Louisiana $47,200 $42,400 16.1% 23.1% 16.6% 14.8% -80,000
Maine $54,700 $51,700 10.9% 14.6% 11.2% 10.1% -13,000
Maryland $74,900 $76,200 8.8% 9.9% 10.2% 7.9% -130,000
Massachusetts $66,800 $63,200 11.2% 13.6% 3.7% 3.3% -28,000
Michigan $56,400 $52,000 10.8% 14.8% 11.0% 8.5% -235,000
Minnesota $66,300 $67,200 9.3% 8.3% 8.2% 5.9% -123,000
Mississippi $42,600 $35,500 22.6% 22.1% 17.1% 14.5% -76,000
Missouri $52,500 $56,600 12.8% 10.4% 13.0% 11.7% -79,000
Montana $49,800 $51,100 13.0% 12.0% 16.5% 14.2% -21,000
Nebraska $56,100 $56,900 9.9% 11.8% 11.3% 9.7% -29,000
Nevada $61,700 $49,900 9.7% 17.0% 20.7% 15.2% -143,000
New Hampshire $77,200 $73,400 5.8% 7.2% 10.7% 9.2% -20,000
New Jersey $69,100 $65,200 8.7% 11.3% 13.2% 10.9% -195,000
New Mexico $50,600 $46,700 14.0% 20.0% 18.6% 14.5% -85,000
New York $55,900 $54,300 14.5% 14.0% 10.7% 8.7% -373,000
North Carolina $49,700 $46,800 15.5% 17.1% 15.6% 13.1% -233,000
North Dakota $53,900 $60,700 9.3% 9.7% 10.4% 7.9% -16,000
Ohio $56,100 $49,600 12.8% 15.6% 11.0% 8.4% -302,000
Oklahoma $49,300 $47,200 13.4% 17.3% 17.7% 15.4% -82,000
Oregon $57,400 $58,900 12.8% 14.4% 14.7% 9.7% -188,000
Pennsylvania $55,300 $55,200 10.4% 12.5% 9.7% 8.5% -158,000
Rhode Island $61,900 $58,600 9.5% 11.3% 11.6% 7.4% -43,000
South Carolina $50,500 $44,900 14.1% 16.5% 15.8% 13.6% -97,000
South Dakota $53,000 $53,100 9.4% 12.8% 11.3% 9.8% -11,000
Tennessee $47,000 $43,700 14.8% 17.3% 13.9% 12.0% -110,000
Texas $52,600 $53,900 16.5% 16.4% 22.1% 19.1% -701,000
Utah $61,100 $63,400 9.6% 10.2% 14.0% 12.5% -37,000
Vermont $54,100 $60,700 9.9% 9.3% 7.2% 5.0% -14,000
Virginia $67,600 $66,200 8.6% 10.2% 12.3% 10.9% -107,000
Washington $66,300 $59,100 10.2% 12.0% 14.0% 9.2% -317,000
West Virginia $48,100 $39,600 14.8% 20.6% 14.0% 8.6% -99,000
Wisconsin $58,500 $58,100 11.0% 10.9% 9.1% 7.3% -100,000
Wyoming $55,700 $55,700 10.9% 9.7% 13.4% 12.0% -8,000
Sources: U.S. Census Bureau, Current Population Survey Annual Social and Economic Supplement (CPS ASEC) (for income and poverty
data) and American Community Survey (ACS) (for health insurance data).
Note: The CPS ASEC figures for the percentage of people without health insurance in the United States are 13.3 percent in 2013 and 10.4
percent in 2014, for a decline in the number without coverage of 8.8 million. CPS ASEC estimates are not available at the state level.
Income, Poverty and Health Insurance Coverage by State
Median Household
Income (2014 dollars)Poverty Rate
Percentage Without
Health Insurance

Prepared by the Democratic staff of the Joint Economic Committee
Sources: State Economic Snapshots
JobsBullet Points 1-3 and Figure
Bureau of Labor Statistics, Current Employment Statistics, State and Metro Area Employment, seasonally adjusted.
UnemploymentBullet Points 1-3 Bureau of Labor Statistics, Local Area Unemployment Statistics, seasonally adjusted.
Earnings
Bullet Point 1Bureau of Labor Statistics, Current Employment Statistics, State and Metro Area Employment, Hours & Earnings, Table D-6, not seasonally adjusted.
Bullet Point 2
Bureau of Labor Statistics, Current Employment Statistics, State and Metro Area Employment, Hours & Earnings, Table D-6, not seasonally adjusted. Data are inflation-adjusted using the Consumer Price Index for all urban consumers (CPI-U), not seasonally adjusted, published by the Bureau of Labor Statistics.
State Quick Facts
Private-Sector JobsBureau of Labor Statistics, Current Employment Statistics, State and Metro Area Employment, seasonally adjusted.
Unemployment Bureau of Labor Statistics, Local Area Unemployment Statistics, seasonally adjusted.Household Income U.S. Census Bureau, Current Population Survey, Annual Social and Economic Supplement.Poverty Rate U.S. Census Bureau, Current Population Survey, Annual Social and Economic Supplement.
Veterans DataBureau of Labor Statistics, Employment Situation of Veterans - 2015. Post-9/11 veterans' unemployment rates are from unpublished data tables.
Health Insurance U.S. Census Bureau, American Community Survey.
State Gross Domestic ProductBullet Points 1-2 Bureau of Economic Analysis, Real Gross Domestic Product by State.
HousingBullet Point 1 Federal Housing and Finance Agency, Purchase-Only House Price Index, seasonally adjusted.
Bullet Point 2U.S. Census Bureau and Bank of Tokyo-Mitsubishi UFJ, Housing Starts, seasonally adjusted at annual rates.
Exports
Bullet Points 1-2U.S. Census Bureau, Origin of Movement Exports, Total Exports. Data are inflation-adjusted using the Export Price Index: All exports, published by the Bureau of Labor Statistics.
Includes data available as of July 22, 2016 Most of the data used to create the state snapshots were accessed through Haver Analytics.