state of florida ernest mitts, director florida geological
TRANSCRIPT
STATE OF FLORIDA
STATE BOARD OF CONSERVATIONErnest Mitts, Director
FLORIDA GEOLOGICAL SURVEY
Robert O. Vernon, Director
INFORMATION CIRCULAR NO. 12
GROUND-WATER RESOURCES OF THE STUART AREA,
MARTIN COUNTY, FLORIDA
ByW. F. Lichtler
Prepared by
U. S. Geological Surveyin cooperation with the
Central and Southern Florida Flood Control District
and the Florida Geological Survey
Tallahassee, Florida1957

TABLE OF CONTENTS
Page
Abstract ......................... 1Introduction . . . . . . . . . . . . . . . . . . . . . .. 2
Purpose and scope of investigation . . . . . . . .. 2Previous investigations . . . . . . . . . . . . . . . 3Personnel and acknowledgments . . . . . . . . . . 3
Location and general features of the area . . . . . . . 4Geography and topography. . . . . . . . . . . . . . 4Clim ate . . . . . . . . . . . . . . . . . . . . . . . 4
Geologic formations and their water-bearingproperties . . . . . . . . . . . . . . . . . . . . . . 12Eocene series . . . . . . . . . . . . . . . .... ... 12
Lake City limestone . . . . . . . . . . . . . . . 12
Avon Park limestone . . . . . . . . . . . . . .. 12
Ocala group. ..................... . 13
Oligocene series. .................... 13Miocene series ................... 13
Hawthorn formation .... ... . ........ . 13
Tamiami formation................... 14
Post-Miocene deposits. . . . . . . . . . . . . ... . 14Ground water ...................... 14
Principles of occurrence .............. 14Hydrologic properties of the aquifers. . . . . . .. .15
Floridan aquifer . . . . . . . . . . . . . .... . 15
Nonartesian aquifer ............... 16
Thickness and areal extent .. .. . ..... 16
Lithology . .. . . .. ..... .. . .. .. 16Shape and slope of the water table . ..... . 18
Water-level fluctuations . . . . . . . .... . 18
Ground-water use . ... . .............. 19
Quantitative studies. . . . . . . . . . . . . . . . . ... 21
Principles . . . . . . . . . . . . . . . .... ... .. 21
Descriptions of pumping tests. . . . . . . . . . ... 23
Interpretation of'pumping-test data. . . . . . . ... 24
Salinity studies ..................... 26
Contamination from surface-water bodies ..... .27
Contamination from artesian aquifer . . . . . ... . 34
Summary and conclusions ............... 36References .......... . . ....... ... . 45
iii
ILLUSTRATIONS
Figure Page
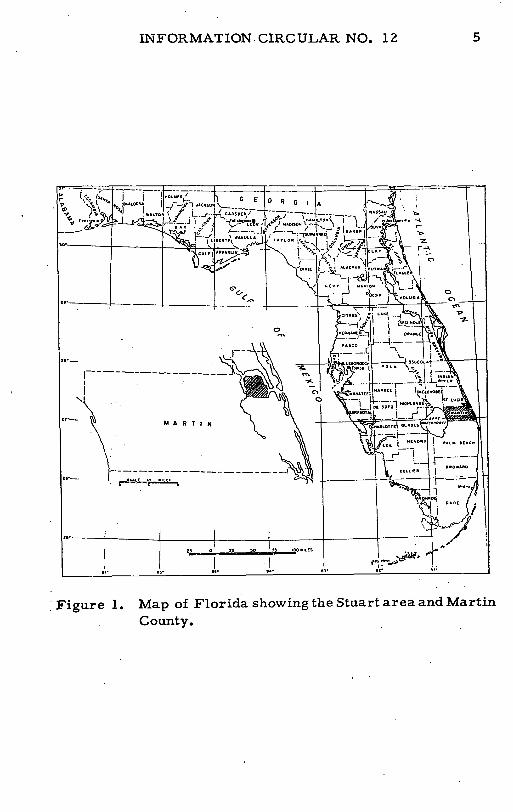
1 Map of Florida showing the Stuart area
and Martin County ................ 52 Map of the Stuart area showing the
locations of selected wells . . . . . . . . . . . 6
3 Contour map of the water table in the
Stuart area, July 6, 1955. . . . . . . . . . . . 7
4 Contour map of the water table in the
Stuart area, October 5, 1955. . . . . . . . . . 8
5 Contour map of the water table within the
Stuart city limits, April 1, 1955 . . . . . . . . 9
6 Contour map of the water table within the
Stuart city limits, May 3, 1955. . . . . . . ... 10
7 Hydrograph of well 147, in Stuart, and
daily rainfall at Stuart, 1954 . . . . . . . ... . 208 Drawdown observed in wells 658 and 658A
during pumping test in the new city well
field, May 27, 1955. ............... 25
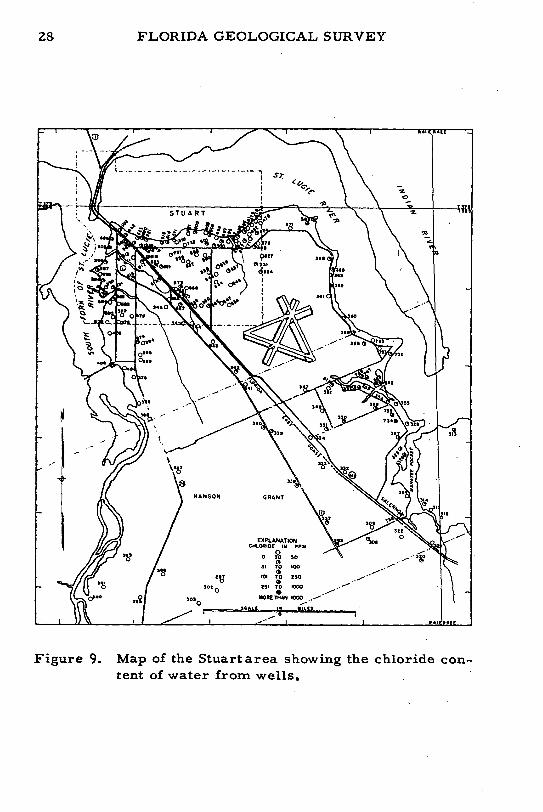
9 Map of the Stuart area showing the chloride
content of water from wells .......... 28
Table
1 Average temperature and rainfall at Stuart . 11
2 Pumpage from Stuart well field, in millionsof gallons per month .............. 22
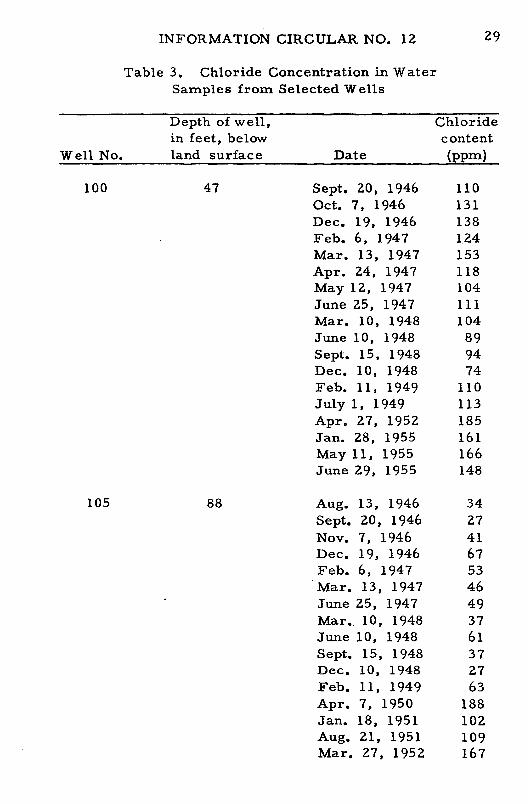
3 Chloride concentration in water samplesfrom selected wells.. .... ... .. . . .. 29
4 Records of selected wells ........... 38
iv
SGROUND-WATER RESOURCES OF THE STUART AREA,
MARTIN COUNTY, FLORIDA
ByW. F. Lichtler
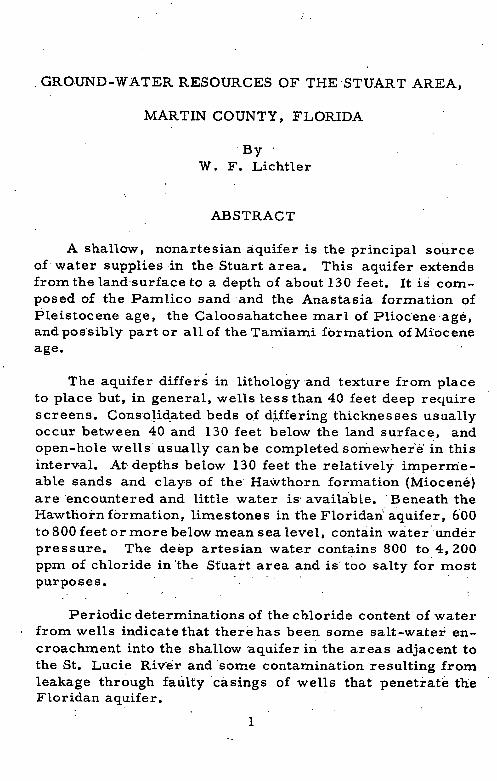
ABSTRACT
A shallow, nonartesian aquifer is the principal sourceof water supplies in the Stuart area. This aquifer extendsfrom the landsurface to a depth of about 130 feet. It is com-posed of the Pamlico sand and the Anastasia formation ofPleistocene age, the Caloosahatchee marl of Pliocene age,and possibly part or all of the Tamiami formation of Mioceneage.
The aquifer differs in lithology and texture from placeto place but, in general, wells less than 40 feet deep requirescreens. Consolidated beds of differing thicknesses usuallyoccur between 40 and 130 feet below the land surface, andopen-hole wells usually canbe completed somewhere in thisinterval. At' depths below 130 feet the relatively impermie-able sands and clays of the Hawthorn formation (Miocene)are encountered and little water is available. 'Beneath theHawthorn formation, limestones in the Floridan aquifer, 600to 800 feet or more below mean sea level, contain water underpressure. The deep artesian water contains 800 to 4, 200ppm of chloride in the Stuart area and is too salty for mostpurposes.
Periodic determinations of the chloride content' of waterfrom wells indicate that there has been some salt-water en-croachment into the shallow aquifer in the areas adjacent tothe St. Lucie River and some contamination resulting fromleakage through faulty 'casings of wells that penetrate theFloridan aquifer.
1
2 FLORIDA GEOLOGICAL SURVEY
The coefficient of transmissibility of the shallow aquiferas computed from pumping-test data by the Theis nonequi-librium method ranged from 18, 000 to 170, 000 gallons perday per foot (gpd/ft). The wide range in values is believedto indicate not an actual condition but that the aquifer is notsuitable for a normal Theis analysis. Further analyses ofthe data by the leaky-aquifer method developed by Hantushand Jacob (1955, p. 95-100) and by use of an unpublishedleaky-aquifer "type curve" developed by H. H. Cooper, Jr.,yielded a transmissibility value of about 20, 000 gpd/ft.
The average height above mean sea level of the watertable in the shallow aquifer is enough, at the present time,to prevent extensive salt-water encroachment into the aqui-fer. Unless the water table is lowered excessively by drain-age ditches or'heavy pumping, a permanent supply of freshwater is assured. Large quantities of fresh water are avail-able for future development in the central part of the Stuartpeninsula.
INTRODUCTION
Purpose and Scope of Investigation
Because the Stuart area is, at times, surrounded on threesides by saline water, the underlying fresh-water aquifer isvulnerable to salt-water encroachment. With progressivelylarger withdrawals of ground water for public and privatesupplies, the possibility of salt-water contamination of fresh-water supplies is increased.
The Central and Southern Florida Flood Control Districtrequested that the U. S. Geological Survey investigate theground-water resources of the area and determine the extentof salt-water encroachment. The investigation was made asa part of the general-studies in cooperation with the FloodControl District and the Florida Geological Survey. Pre-liminary work, including the inventorying of and collectionof water samples from a large number of wells in MartinCounty, was done during 1953 by E. W. Bishop, formerlywith the U. S. Geological Survey. Intensive field work by
INFORMATION CIRCULAR NO. 12 3
the writer began in January 1955 and continued through Au-gust 1955. Samples of water from wells in the area wereanalyzed to determine their chloride content. Wells suit-able for a program of periodic measurement of water levelswere selected. A special effort was made to include in thisprogram only wells that were not in use, so that all wellscould be measured in a single day to obtain an "instantaneous"picture of the water table. The altitudes of all measuringpoints in observation wells were determined by spirit leveland referred to U. S. Coast and Geodetic Survey mean-sea-leveldatum, and water-table contour maps were drawn fromthe data.
Previous Investigations
No detailed investigations of ground-water resources inMartin County had been made prior to the present investi-gation. Brief references to Martin County were made byMansfield (1939), Parker and Cooke (1944), Cooke (1945),Matson and Sanford (1913), Collins and Howard (1928),Stringfield(1936), and Parker, Ferguson, Love, and others(1955). In addition, references were made to water levelsin Water-Supply Papers 1166, 1192, 1222; and to quality-of-water data by Black and Brown (1951), and Black, Brown,and Pearce (1953).
Personnel and Acknowledgments
The writer wishes to express his appreciation for theassistance and cooperation of the residents of the Stuartarea, who supplied many valuable data and permitted thesampling and measuring of wells. Joseph Greenlees, CityManager; Frederick Walton, Water Commissioner; ErnestTyner, City Commissioner; and James Doyle, County Sani-tarian, were helpful during the investigation. Douglas Arnold,well driller of Stuart, and Charles A. Black of Black andAssociates, Gainesville, Florida, supplied much valuablegeologic and hydrologic information.
The investigation was under the general supervision of
A. N. Sayre, Chief, Ground Water Branch, and under theimmediate supervision of N. D. Hoy, Geologist, and M. I.Rorabaugh, District Engineer, all of the U. S. Geological
Survey.
4 FLORIDA GEOLOGICAL SURVEY
LOCATION AND GENERAL FEATURES OF THE AREA
Geography and Topography
The area covered by this report includes most of the
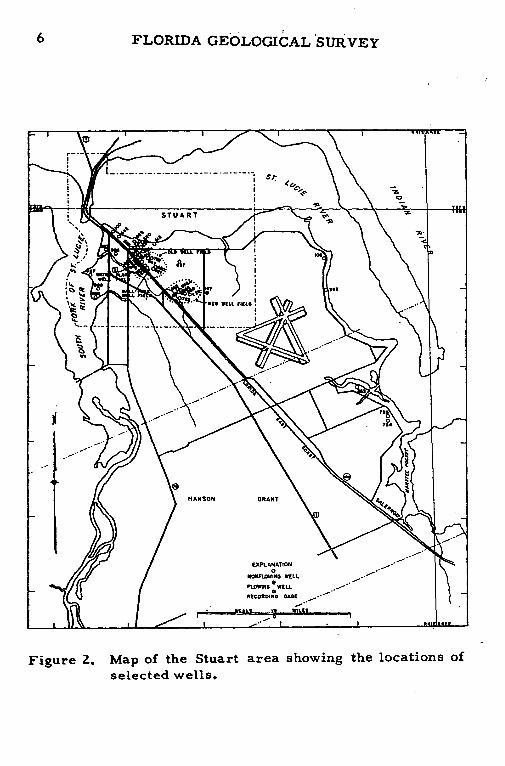
city of Stuart and adjacent parts of Martin County (fig. 1).Most of Stuart is on a peninsula formed by the South Fork of
the St. Lucie River on the west, the St. Lucie River on thenorth, and the St. Lucie River and Manatee Pocket on the
east (fig. 2). The peninsula is about four miles wide at itsbase, about three miles wide at its northern end, and about
four miles long,
The land surface generally ranges from 10 to 20 feet inaltitude in the central part of the peninsula. It slopes gentlyto the banks of the South Fork of the St. Lucie River on thewestern side and to relatively steep banks along the St. LucieRiver on the northern and eastern sides.
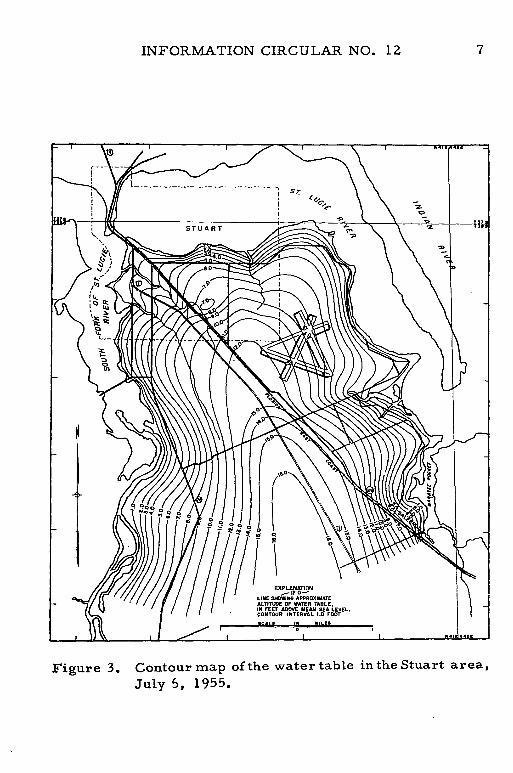
The entire peninsula is covered by permeable quartzsand, about 40 feet thick. Drainage is predominantly under-ground. Rainfall infiltrates rapidly through the permeablesurficial sand to the water table and flows approximately atright angles to the water-table contours (fig. 3-6) to pointsof discharge along the coast or into several small streams.The water table is near the surface inthe central part of thepeninsula during much of the year, and during high ground-water stages surface lakes exist in depressions scatteredthroughout the area.
Climate
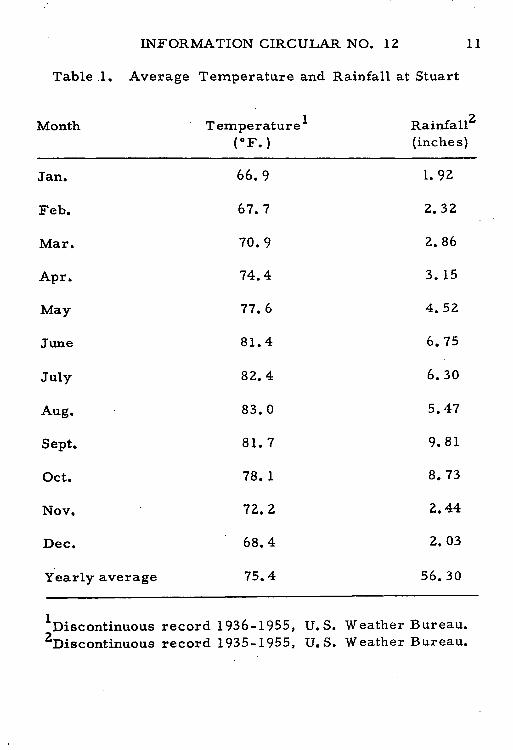
The climate at Stuart is subtropical, the average annualtemperature being 75.40 F. Because of the moderating in-fluence of the surrounding water, the temperature is usuallytwo to four degrees higher during winter cold spells than inareas farther inland, and somewhat lower in the summer.Rainfall averages 56. 3 inches per year. Table 1 shows thatrainfall is greatest in late summer and early fall and leastin the winter.
INFORMATION CIRCULAR NO. 12 5
... 0 _L I^" J G•• GE ..ORG Io .A MOLWESý- G G
'* iL " " {
30 - .M. t o
OWE A ._... .
isono 50 ,
LE- I I.T N.
a s,
CITRUS\1.' LAKE
- ----- I coast -nowAR
ts---
Figure 1. Map of Florida showing the Stuart area and Martin
County.
zeh--"~t--f~~r
Z5.-
County.
6 FLORIDA GEOLOGICAL SURVEY
"'S- ---------------------- '--.--
-I I I .a TauSTUART
L lN'
Y set
EXPLANATION0
NOISWWI NO WELL *fLOWINI WELLRECORDINO OE GAE
nH' I I « ) *'^rt«r
Figure 2. Map of the Stuart area showing the locations ofselected wells.
INFORMATION CIRCULAR NO. 12 7
STUART I R -- F
\ -Z D
EXPLANATION
LINE SHOWINS APPROXIMATEALTITUDE OF WATER TABLE,IN FEET ABOVE MEAN SEA LEVEL.
IICON INTERVAL .0 FO
Figure 3. Contour map of the water table in the Stuart area,
July 6. 1955.
8 FLORIDA GEOLOGICAL SURVEY
w /
cI I I INTtRVAL L0 F
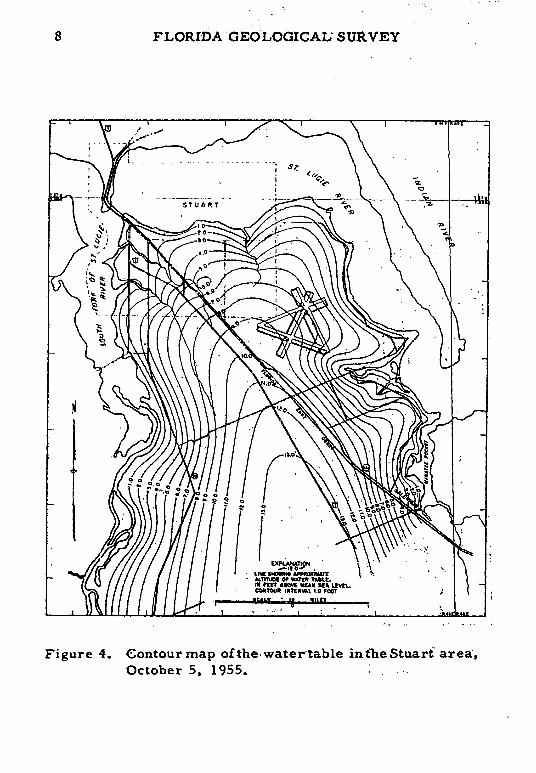
Figure 4. Contour map ofthe water table inthe Stuart area,October 5, 1955.
iure .Cnormpo hraeral nteSur ra
INFORMATION CIRCULAR NO. 12 9
ST. LUCIE RIVER
OLD WELL FIELDS
WATER PLANT BALL PARKFIEL FIELD 00.81.0 O e
UN SON APPROXIMATE ALTITUDE .
INTERVAL AT 0 FEE
'aUNI L WENE WELL
OF WATE F
XO low
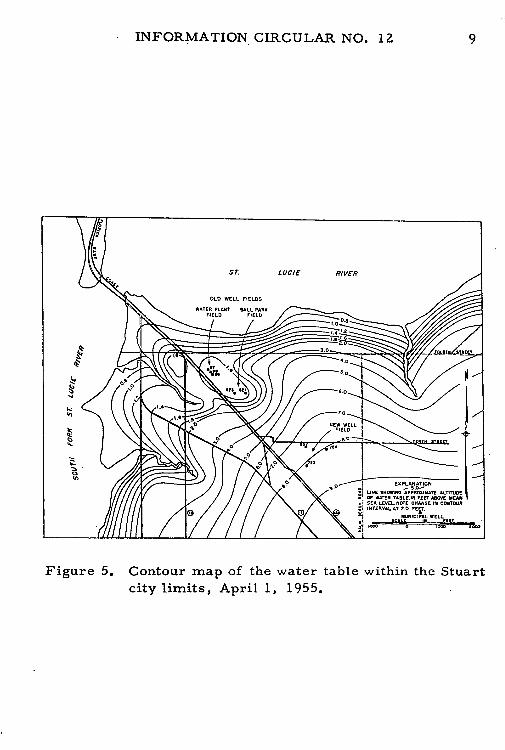
Figure 5. Contour map of the water table within the Stuartcity limits, April 1, 1955.
10 FLORIDA GEOLOGICAL SURVEY
ST. LUCIE RIVER
OLD WEu. riELDS
WA Pugu aLL cAIM
_ a SeaL mx em
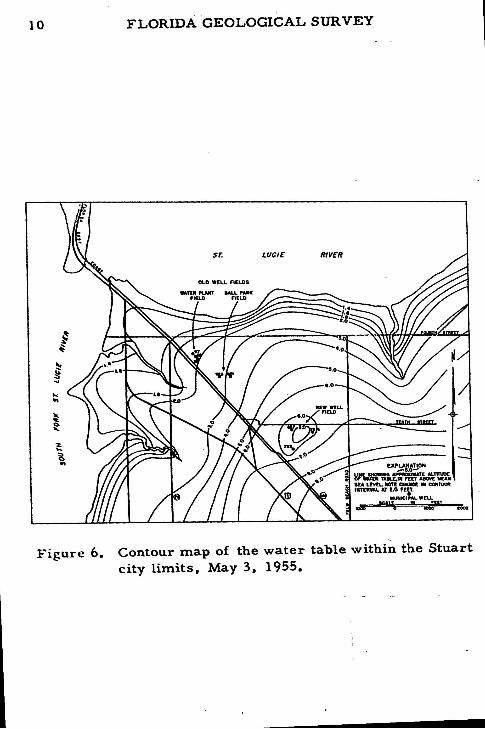
Figure 6. Contour map of the water table within the Stuart
city limits. May 3, 1955.
APPMUREUAI AASSRUMM" Ut"LI FRn ADWE %WM
1"TtiW aT LO m
Et.
Figure 6. Contour map of the water table within the Stuartcity limits, May 3, 1955.
INFORMATION CIRCULAR NO. 12 11
Table .1. Average Temperature and Rainfall at Stuart
Month Temperature 1 Rainfall 2
(OF.) (inches)
Jan. 66.9 1.92
Feb. 67.7 2.32
Mar. 70.9 2.86
Apr. 74.4 3.15
May 77.6 4.52
June 81.4 6.75
July 82.4 6.30
Aug. 83.0 5.47
Sept. 81.7 9.81
Oct. 78. 1 8.73
Nov. 72.2 2.44
Dec. 68.4 2.03
Yearly average 75.4 56.30
1Discontinuous record 1936-1955, U.S. Weather Bureau.2 Discontinuous record 1935-1955, U.S. Weather Bureau.
12 FLORIDA GEOLOGICAL SURVEY
GEOLOGIC FORMATIONS AND THEIRWATER-BEARING PROPERTIES
The strata underlying the Stuart area to a depth of about1, 000 feet range in age from Recent at the surface to middleEocene at the bottom. Water in the formations older thanMiocene is highly mineralized and is used very little in theStuart area. The formations of Miocene age yield only smallquantities of water. Most wells are developed in post-Miocenesediments.
Eocene Series
The oldest rocks penetratedby water wells in the Stuartarea are of middle Eocene age. The Eocene rocks includethe Lake City limestone and the Avon Park limestone ofClaiborne age and the Ocala group of Jackson age; these formthe lower and major part of the Floridan aquifer (p. 15).
Lake City Limestone
The Lake City limestone, as defined by Cooke (1945,p. 46-47), overlies the Oldsmar limestone of Wilcox age innorthern Florida and is overlain by the Tallahassee lime-stone. The Tallahassee limestone apparently is missing insouthern Florida. The Lake City limestone in northern andcentral Florida is described as alternating layers of darkbrown chalky limestone with some gypsum and chert. Itforms part of the Floridan aquifer, and in the central partof Martin County it is tapped for irrigation and stock-wateringsupplies.
Avon Park Limestone
The Avon Park limestone, also a part of the Floridanaquifer, overlies the Lake City limestone. It is a creamcolored to white, chalky to granular, porous limestone thatranges in thickness from about 100 to 150 feet in centralFlorida.
INFORMATION CIRCULAR NO. 12 13
Ocala Groupl
The Ocala group unconformably overlies the Avon Parklimestone and is another part of the Floridan aquifer. It isa cream colored, soft to hard, porous limestone, with bedsof coquina at some localities.
Oligocene Series
The Oligocene series in Martin County has not beenclearly defined. Sediments overlying the Ocala group andunderlying the Hawthorn formation have been tentativelyclassified as of Vicksburg (middle Oligocene) age in theStuart area and as of Suwannee (late Oligocene) age in south-eastern Martin County. A correlation of cuttings from wellsin the area indicates that there may have been some post-Oligocene faulting. The Vicksburg group in the Stuart areais composed of cream colored, softtohard, granular, porouslimestone and some sand and shells. It forms the upper partof the Floridan aquifer in this area.
Miocene Series
The Miocene series in the Stuart area includes 'theHawthorn formation of middle Miocene age and the Tamiami
formation of late Miocene age. The Tampa limestone ofearly Miocene age may be present below the Hawthorn for-mation, but this has not been clearly established.
Hawthorn Formation
The Hawthorn formation is composed of olive-drab,relatively impermeable clay and sand and some thin lenses
IThe stratigraphic nomenclature used in this reportconforms to the usage of the Florida Geological Survey. Italso conforms to the usage of the U.S. Geological-Survey
with the exception of the Ocala group and its subdivisions.'
The Florida Survey has adopted the Ocala group as described
by Puri (1953). The Federal Survey regards the Ocala as aformation, the Ocala limestone.
14 FLORIDA GEOLOGICAL SURVEY
of limestone. In the Stuart area it is about 350 feet thick.
A test well in the new city well field penetrated greenish
sand at a depth of about 150 feet that is believed to be partof the Hawthorn formation. The Hawthorn formation forms
the major part of the upper confining bed of the Floridan
aquifer.
Tamiami Formation
The Tamiami formation appears to be conformable withthe underlying Hawthorn formation. In the Stuart area it is
composed of about 60 feet of sand, shell fragments and lime-
stone. Part or all of the Tamiami formation may form an
extension of the shallow nonartesian aquifer in the post-
Miocene deposits, and part may be included in the confining
bed above the Floridan aquifer.
Post-Miocene Deposits
The post-Miocene deposits include the Caloosahatchee
marl of Pliocene age and the Anastasia formation and Pam-lico sand of Pleistocene age. The boundary between the
Pliocene and Pleistocene in this area could not be determined,owing to the fact that the Caloosahatchee marl and the Anas-tasia formation are lithologically similar in Martin County.This boundary can be determined definitely only by detailedexamination of the fossils of the formations.
A thin layer of quartz sand of the Pamlico sand coversthe area and grades into the underlying Anastasia formation.
GROUND WATER
Principles of Occurrence
Ground water is stored in the joints, solution cavities,pore spaces, and other openings of the earth's crust belowthe water table. Ground water is the subsurface water inthe zone, called the zone of saturation, in which all openingsare completely filled with water under pressure greater thanatmospheric. The water table is the top of this zone.
INFORMATION CIRCULAR NO. 12 15
Only part of the water that falls as rain reaches thezone of saturation. The remainder runs off the land surfaceto open bodies of water such as rivers, lakes and bays, oris returned to the atmosphere by evaporation and transpi-ration. The amount of rain that reaches the water tabledepends on many factors. These include the rate at whichthe rain occurs, the slope of the land on which it falls, theamount and type of vegetation cover, and the character ofthe surface materials throughwhich the water must infiltrateto reach the zone of saturation.
After the water reaches the zone of saturation it beginsto move more or less laterally, under the influence of gravity,toward a point of discharge such as a spring or well. Groundwater may occur under either artesian or nonartesian (water-table) conditions. Where the water is confined in a permeablebed that is overlain by a relatively impermeable bed, itssurface is not free to rise and fall. Water thus confined underpressure is said to be under artesian conditions. The term"artesian" is applied to ground water that is confined underpressure sufficient to cause the water to rise above the topof the permeable bed that contains it, though not necessarilyabove the land surface. Where the upper surface of the wateris free to rise and fall in a permeable formation, the wateris said to be under nonartesian conditions, and the uppersurface is called the water table. All gradations exist be-tween artesian and nonartesian conditions.
Hydrologic Properties of the Aquifers
Ground water in the Stuart area occurs in two majoraquifers, a deep artesian aquifer (Floridan aquifer), and ashallow nonartesian aquifer. The aquifers are separated bya thick section of relatively impervious clay and sand. Thewater inthe artesian aquifer is much more mineralized thanthat in the nonartesian aquifer.
Floridan Aquifer
Wells penetrating the Floridan aquifer in the Stuart arearange in depth from 800 tol, 200 feet. The pressure head inthese wells is about 40 feet above the land surface, or about
16 FLORIDA GEOLOGICAL SURVEY
50 feet above mean sea level. Large flows are obtained
from wells penetrating the aquifer, but the water is highlymineralized, ranging in chloride content from 800 to 4, 200ppm. Because of its high mineral content, little use is made
of the artesian water in the Stuart area. The availabilityand quality of the water from the Floridan aquifer in MartinCounty will be discussed more thoroughly in a later report.
Nonartesian Aquifer
Thickness and areal extent: The nonartesian aquifer iscomposed, from the surface down, of the Pamlico sand, theAnastasia formation, the Caloosahatchee marl, and possiblythe Tamiami formation. The aquifer extends from the landsurface to a depth of about 130 feet and is underlain by im-permeable sand and clay which is probably part of the Haw-thorn formation.
The bodies of salt water that bound the peninsula on theeast, north and west are the boundaries of the nonartesianaquifer. Excessive lowering of the water table near theseboundaries would cause salt water to move in laterally. Tothe south, however, the aquifer has a much greater arealextent.
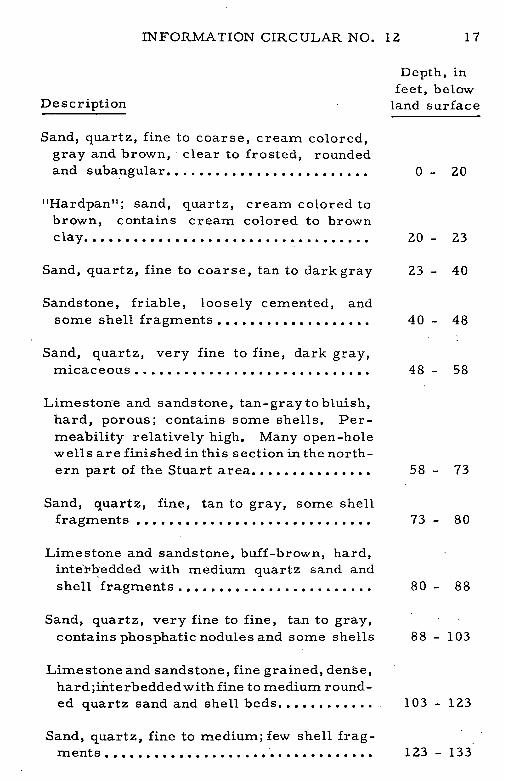
Lithology: Data obtained from the inventory of wells inthe area show a wide range in the depth of nonartesianwells,a fact which indicates that the lithology of the nonartesianaquifer differs from place to place. The heterogeneity ofthe aquifer is evident in well cuttings from a few wells drilledin the area during the course of this investigation. Permeablerock and shell are separated by less permeable fine sand ormarl. Beds found at a given depth'at one site may be foundat a different depth or maybe missing entirely at another siteclose by. Sufficient information is not yet available to defineaccurately the various permeable zones, but a generalizedgeologic section of the area is shown in the following log:
INFORMATION CIRCULAR NO. 12 17
Depth, infeet, below
Description land surface
Sand, quartz, fine to coarse, cream colored,gray and brown, clear to frosted, roundedand subangular. ................. ....... 0 - 20
"Hardpan"; sand, quartz, cream colored tobrown, contains cream colored to brownclay.................. .................. 20 - 23
Sand, quartz, fine to coarse, tan to dark gray 23 - 40
Sandstone, friable, loosely cemented, andsome shell fragments ................... 40 - 48
Sand, quartz, very fine to fine, dark gray,micaceous ................. ............ 48 - 58
Limestone and sandstone, tan-graytobluish,hard, porous; contains some shells. Per-meability relatively high. Many open-holewells are finished in this section in the north-ern part of the Stuart area............... 58 - 73
Sand, quartz, fine, tan to gray, some shellfragments ..... ........................ 73 - 80
Limestone and sandstone, buff-brown, hard,interbedded with medium quartz sand andshell fragments ........................ 80 - 88
Sand, quartz, very fine to fine, tan to gray,contains phosphatic nodules and some shells 88 - 103
Limestone and sandstone, fine grained, dense,hard;interbeddedwith fine to medium round-ed quartz sand and shell beds.............. 103 - 123
Sand, quartz, fine to medium; few shell frag-m ents .................................. 123 - 133
18 FLORIDA GEOLOGICAL SURVEY
Limestone and sandstone, interbedded withmedium quartz sand and shells ............ 133 - 144
Sand, very fine to fine, greenish-gray...... 144 - 151
The layers or lenses of fine sand retard the vertical
movement of water.
Shape and slope of the water table: The water levels inobservation wells were measured at various times to deter-
mine the altitude and shape of the water table in the areaand to determine changes in ground-water storage in the
aquifer.
The water table is highest in the south-central part ofthe peninsula and slopes east, north, and west toward pointsof ground-water discharge in the Manatee Pocket, the St.Lucie River, and the South Fork of the St. Lucie River (fig.3,4). Because ground water flows approximately at rightangles to the contour lines, it is apparent from figures 3and 4 that practically all the recharge to the nonartesianaquifer in the peninsula is derived from local rainfall. Muchof the rainfall is quickly absorbed by the permeable surfacesands and infiltrates to the water table. Evidence for thislies in the fact that the water level in a well 144 feet deeprose 1. 11 feet within 12 hours after a rainfall of 1.09 incheswas recorded at Stuart. Surface runoff is small, except lo-cally after exceptionally heavy rainfall.
Figures 5 and 6 show how the water table was loweredby pumping in the city well fields. Figure 5 shows the watertable on April 1, 1955, when the city wells at the old citywell field, at the water plant and the ball park, were pump-ing. Figure 6 shows the water table on May 3, 1955, whenwells were shut down in the old well field and wells werepumping in the new city well field, south of 10th Street andwest of Palm Beach Road.
Water-level fluctuations: Threewells in the eastern partof Martin County are equipped with automatic water-levelgages which provide a continuous record of the fluctuationsof the water table. Only one of these (well 147) is in the area
INFORMATION CIRCULAR NO. 12 19
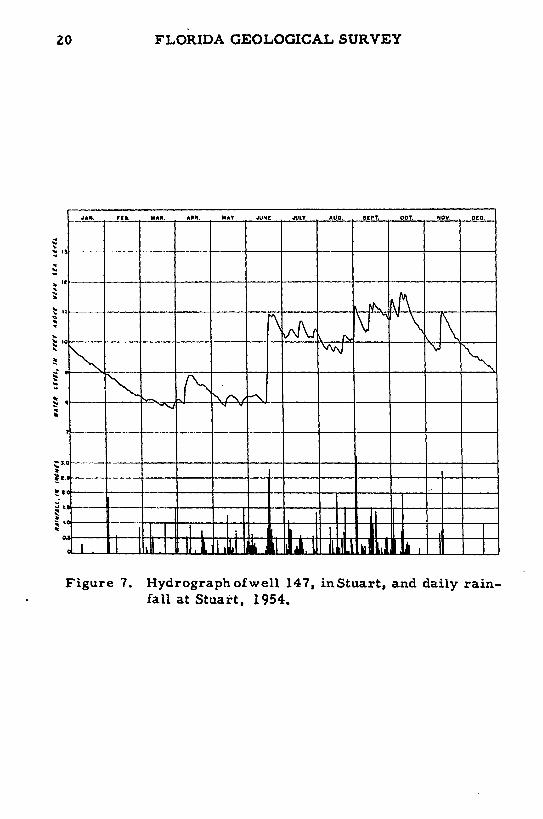
of this report (fig. 2). Figure 7 is a hydrograph showingfluctuations of the water level in well 147 during 1954.Well 147 is 74 feet deep and is about a quarter of a mileeast of the new city well field. The maximum yearly rangein water level in this well for the period 1952-1955 was 6. 3feet in 1953. This compares with a maximum yearly rangeof 4. 8 feet in well 140, which is 16 miles south of well 147,and 5.8 feet in well 125, which is 15 miles southeast ofwell 147, in Jonathan Dickinson State Park.
Figure 7 shows also the distribution of rainfall as re-corded at radio station WSTU, at Stuart, in 1954. As arule, the water level in well 147, which is about two milesfrom the rain gage, correlates fairly closely with rainfall,but a few exceptions are apparent. On February 2, 1954,for example, a 1. 85-inch rainfall produced only a very slightrise in the water level in well 147, but a 1.48-inch rainfallon March 29 produced a rise of about 0. 3 foot. Doubtlesssome of the rain falls in short, local showers that do notwet all parts of the Stuart area. This would account forsome of the lack of correlation shown in figure 7.
Figures 3 and4 show the configuration ofthewater tableat high and low ground-water stages, respectively, in 1955.Ground-water stages are usually highest during Septemberand October; however, rainfall in 1955 was exceptionally lowfrom August to November, and the usual high stages did notoccur. Thus, water levels on July 6, 1955 (fig. 3), werehigher than those on October 5 (fig. 4).
GROUND-WATER USE
Practically all the water for public, irrigation, do-mestic, and industrial use in the Stuart area is obtainedfrom ground-water sources. Since April 25, 1955, all thecity supply has been obtained from three 4-inch wells (657,723, 724), 125 feet deep, in the new city well field (fig. 2).The wells are spaced about 600 feet apart and each is equippedwith a turbine pump having a capacity of 100 gpm. Prior toApril 25, 1955, the city supply was obtained from one 4-inchand two 6-inch wells (97, 98, 99) about 65 feet deep, nearthe water-treatment plant, and two 4-inch wells (621, 623)56 feet deep, at the ball park. Operation of these wells was
20 FLORIDA GEOLOGICAL SURVEY
JAIL PiC. MAN. APR. MAY JUNE JULY AU0. SEPT. OT. NOV. DeO.
-3, •
go
.I--
II_ .l-- -- - -- -- --- -- - -- - - -
Figure 7. Hydrographofwell 147, inStuart, and daily rain-fall at Stuart, 1954.
INFORMATION CIRCULAR NO. 12 21
discontinued because of an increase in the salinity of thewater, but they are available for emergency use.
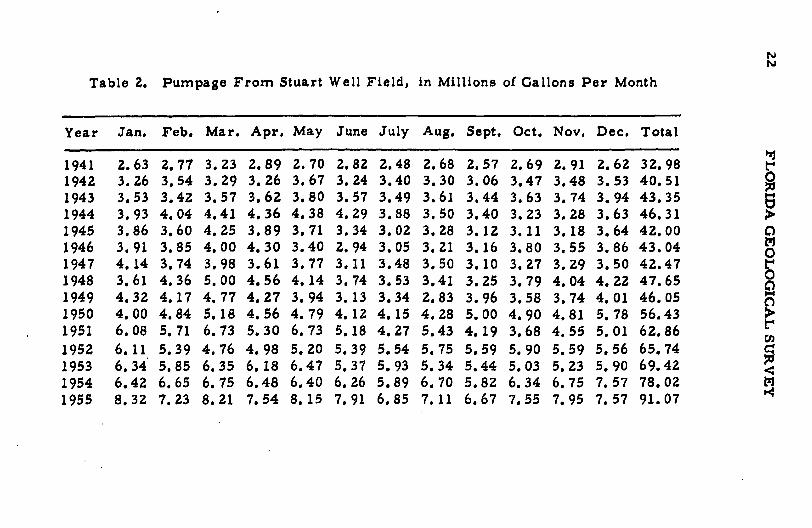
The pumpageby the city of Stuart has increased steadilyduring the last few years as new customers have been added(table 2). During 1955, 91 million gallons of water waspumped. Water usage is high during dry periods when lawnsare irrigated.
The numerous flower farms in the vicinity of Stuart havetheir own irrigation wells and use large quantities of groundwater during the growing season, from October to May. Someof this irrigationwater returns to the ground-water reservoirby infiltration through the surface sands.
In areas not serviced by city water mains, private wellsare used for both domestic supplies and irrigation. In ad-dition, several hundred wells are used for lawn irrigationwithin the area served by the city. Their total pumpage isdoubtless large, but no figures are available. Here, too,some of the water is returned to the ground-water reservoirby infiltration through the surface sands. The industrial useof ground water in the Stuart area is small.
QUANTITATIVE STUDIES
Principles
The ability of an aquifer to transmit water is expressedby the coefficient of transmissibility. In customary units,it is the quantity of water, in gallons per day, that will movethrough a vertical section of the aquifer one foot wide andextending the full saturated height, under a unit hydraulic
gradient (Theis, 1938, p. 892), at the prevailing temperatureof the water. The coefficient of storage is a measure of thecapacity of the aquifer to store water and is defined as thevolume of water released from or taken into storage per unitsurface area of the aquifer per unit change in the componentof head normal to that surface. These coefficients are gen-erally determined by means of pumping tests on wells.
NN
Table 2. Pumpage From Stuart Well Field, in Millions of Gallons Per Month
Year Jan. Feb. Mar. Apr. May June July Aug, Sept. Oct. Nov. Dec. Total
1941 2.63 2.77 3.23 2.89 2.70 2.82 2.48 2.68 2.57 2.69 2.91 2.62 32.981942 3.26 3.54 3.29 3.26 3.67 3.24 3.40 3.30 3.06 3.47 3.48 3.53 40.51 01943 3.53 3.42 3.57 3.62 3.80 3.57 3.49 3.61 3.44 3.63 3.74 3.94 43.351944 3.93 4.04 4.41 4.36 4.38 4.29 3.88 3.50 3.40 3.23 3.28 3.63 46.311945 3.86 3.60 4.25 3.89 3.71 3.34 3.02 3.28 3.12 3.11 3.18 3.64 42.00 01946 3.91 3.85 4.00 4.30 3.40 2.94 3.05 3.21 3.16 3.80 3.55 3.86 43.041947 4.14 3.74 3.98 3.61 3.77 3.11 3.48 3.50 3.10 3.27 3.29 3.50 42.47 I1948 3.61 4.36 5.00 4.56 4.14 3.74 3.53 3.41 3.25 3.79 4.04 4.22 47.651949 4.32 4.17 4.77 4.27 3.94 3.13 3.34 2.83 3.96 3.58 3.74 4.01 46.051950 4.00 4.84 5.18 4.56 4.79 4.12 4.15 4.28 5.00 4.90 4.81 5.78 56.431951 6.08 5.71 6.73 5.30 6.73 5.18 4.27 5.43 4.19 3.68 4.55 5.01 62.861952 6.11 5.39 4.76 4.98 5.20 5.39 5.54 5.75 5.59 5.90 5.59 5.56 65.74 C1953 6.34 5.85 6.35 6.18 6.47 5.37 5.93 5.34 5.44 5.03 5.23 5.90 69.421954 6.42 6.65 6.75 6.48 6.40 6.26 5.89 6.70 5.82 6.34 6.75 7.57 78.02 M1955 8.32 7.23 8.21 7.54 8.15 7.91 6.85 7.11 6.67 7.55 7.95 7.57 91.07
INFORMATION CIRCULAR NO. 12 23
Descriptions of Pumping Tests
Pumping tests were made at five places in the Stuartarea, four in the new city well field and one in the ball parkwell field.
The first test was made in the new city well field onMarch9, 1955, withwell 657 (city supply well No. 1) pumpingat the rate of 135 gpm for 11 hours. Water-level measure-ments were made during the test in wells 656, 658 and 659,located 11, 100 and 300 feet, respectively, from the pumpedwell. All wells are cased to 115 feet with 10 feet of openhole in the underlying limestone, except well 656, which iscased to 144 feet with one foot of open hole. The water fromwell 657 was discharged into a ditch about 75 feet from thepumping well, but because the ditchwas choked with vegetationand has onlya slight gradient, water remained inthe vicinityand recharged the aquifer during the test.
In the second test; made on March 23, 1955, also in thenew city well field, well 724 (city supply well No. 3), waspumped at a rate of 140 gpm for five hours, and water levelswere observed in wells 659, 658 and 657, located 300, 500and 600 feet, respectively, from the pumped well. The wellsare all cased to 115 feet, leaving 10 feet of open hole in theunderlying limestone. The water was discharged into a ditch200 feet from the pumpedwell and again remained in the areaand recharged the aquifer, but this recharge did not affectthe water levels as early as that in test No. 1.
The following day, March 24, 1955, the third testwas made at: the same location as tests 1 and 2. Well 723(city supply wellNo, 2)was pumped at a rate of 112 gpm forfive hours, and water levels were observed in wells 658 and724, located 500 and 750 feet, respectively, from the pumpingwell. All wells are cased to 115 feet, leaving 10 feet of openhole in the underlying limestone. The water was dischargedinto a depression near the wells and remained in the area,probably recharging the aquifer.
SThe fourth testwas made on May 27, 1955, also in the newwell field, when the new wells were in operation. Observation
24 FLORIDA GEOLOGICAL SURVEY
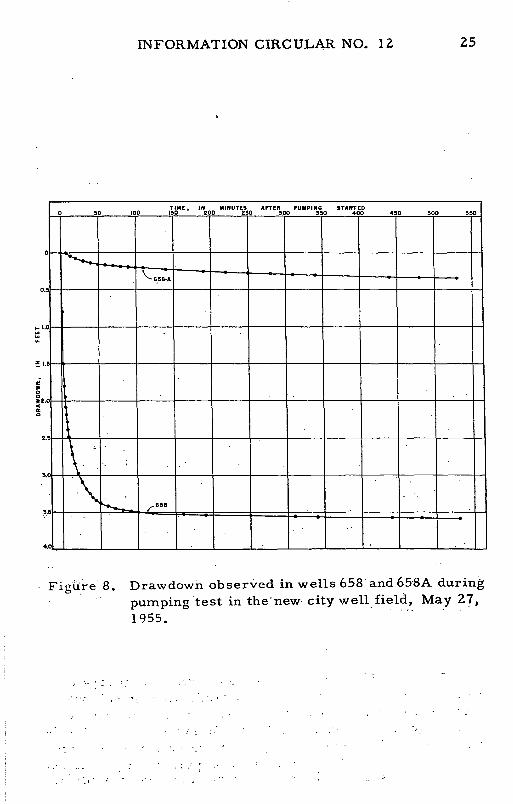
well 658A, 13 feet deep, was installed 100 feet from well657 (city supply well No. 1) and immediately adjacent toobservation well 658. Prior to the test the well field wasshut down overnight to allow recovery of the water levelsin the area. On the next morning the water levels in boththe deep and shallow observation wells were measured andwere 6.38 feet above mean sea level. Well 657 was pumped
at a rate of 105 gpm for nine hours, at the end of whichperiod the drawdowns in wells 658 and 658A were 3. 58 and0. 34 feet, respectively (fig. 8). The water level in well 658began to decline almost immediately after pumping started,and had fallen three feet after 21 minutes. The water levelin shallow well 658A began to decline eight minutes after thestart of pumping, and had fallen 0. 07 foot after 21 minutes.
Near the end of the test the water level in well 658 had neatlystabilized, whereas that in well 658A was still falling, butat a decreasing rate. The water was discharged into thecity mains and so did not return to the aquifer.
The fifth test was made in the well field at the ball parkon April 27, 1955. Well 621 (city well No. 2) was pumpedat a rate of 130 gpm for five hours. Observation wells 620and 623 were seven and 375 feet, respectively, from thepumped well. All wells are cased to 51 feet, leaving fivefeet of open hole in the underlying limestone. The waterwas discharged on the ground in the immediate vicinity ofthe pumped well and doubtless some returned to the aquiferduring the test.
Interpretation of Pumping -Test Data
Theis (1935, p. 519-524), using basic heat-transferformulas, developed a method to analyze the movement ofwater through an aquifer under the conditions that the aquiferis (1) homogeneous and isotropic, (2) of infinite areal extent,(3) of uniform thickness, (4) bounded above and below byimpervious beds, (5) receiving no discharge, (6) fully pene-trated by the discharging well, and (7) losing water onlythrough the discharging well. If an aquifer meets all theseconditions, the Theis nonequilibrium method, as describedby Wenzel (1942, p. 87-90), will give a true transmissibilityvalue for the aquifer regardless of the distance of the obser-vation well from the pumped well or the rate of pumping.
INFORMATION CIRCULAR NO. 12 25
TIME, IN MINUTES AFTER PUMPING STARTEDS 50 100110 I 2 300 30 400 450 500 550
0-
0.5-
4.0
1
Figuire 8. Drawdown observed in wells 658 and 658A during
pumping test in the'new city well field, May 27,1955.
26 FLORIDA GEOLOGICAL SURVEY
Whenthe data from the tests in the city well fields were
analyzed by the Theis method, the computed values of the
coefficient of transmissibility ranged from 18, 000 to 170, 000
gpd per foot for the same area, indicating that the aquifer
does not meet all the above conditions. The main producing
zone, which is between 103 and 140 feet (see well log) in the
new well field, is reasonably homogeneous, isotropic, and
uniform in thickness, judging from well logs and cuttings
and the performance of individual wells. For a test of short
duration the aquifer is, in effect, of infinite areal extent,
but it is not bounded above by an impermeable bed, as is
shown by the fact that the water level in shallow well 658A
(fig. 2) began to decline eight minutes after well 657 began
pumping (fig. 8). Also, the water was discharged on theground in the vicinity of the pumpedwells and, consequently,
the aquifer was receiving recharge. In addition, the aquifer
was not fully penetrated by the pumped wells. After correc-
tions were made for the effects of partial penetration and
also for the natural decline of the water table thatwas taking
place the data were further analyzed by means of the leaky-
aquifer method of Hantush and Jacob (1955, p. 95-100) and
a leaky-aquifer type curve developed by H.H. Cooper, Jr.,of the U. S. Geological Survey, Tallahassee, Florida, (per-
sonal communication). This analysis produced values for
the coefficient of transmissibility ranging from 15,000 to25, 000 gpd per foot, with a probable average near 20, 000
gpd per foot. This seems to be a reasonable coefficient of
transmissibilityfor the main producing zone of the aquifer.
When considering long-term pumping, vertical leakage from
the overlying beds is an important factor, and the coefficient
of transmissibility of the overlying beds should be added to
that of the main producing zone to obtain a realistic coefficientof transmissibility for the well field.
SALINITY STUDIES
The chloride content of ground water is generally areliable index of the extent of contamination by salt water
from the sea or other sources. Water samples were collected
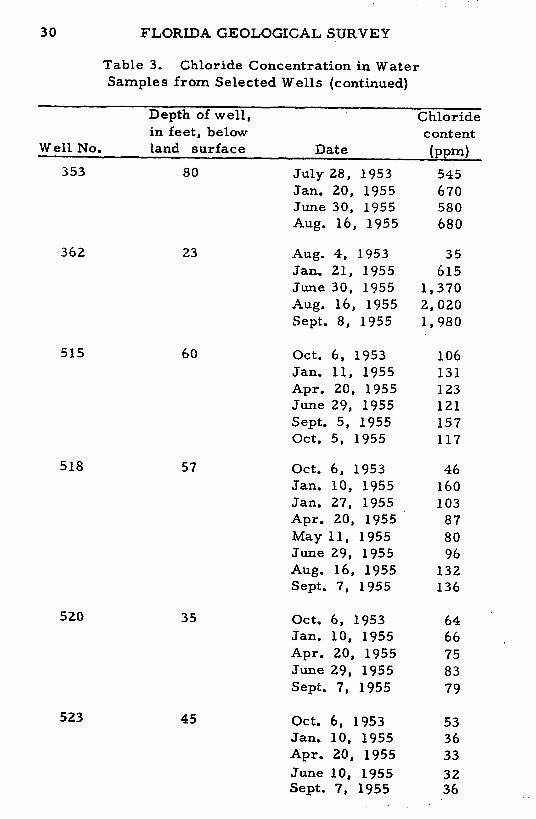
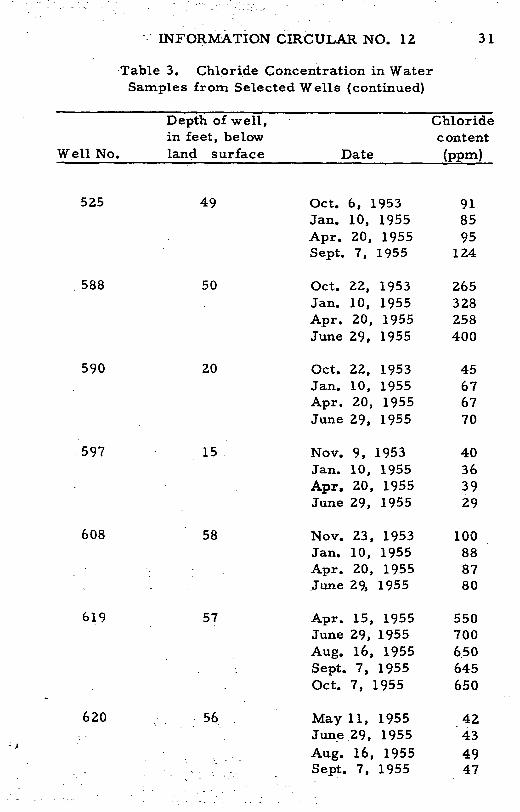
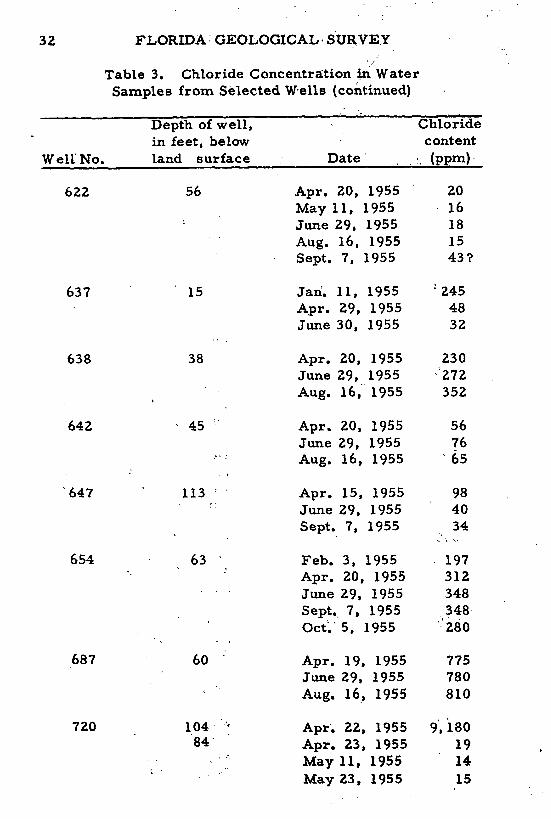
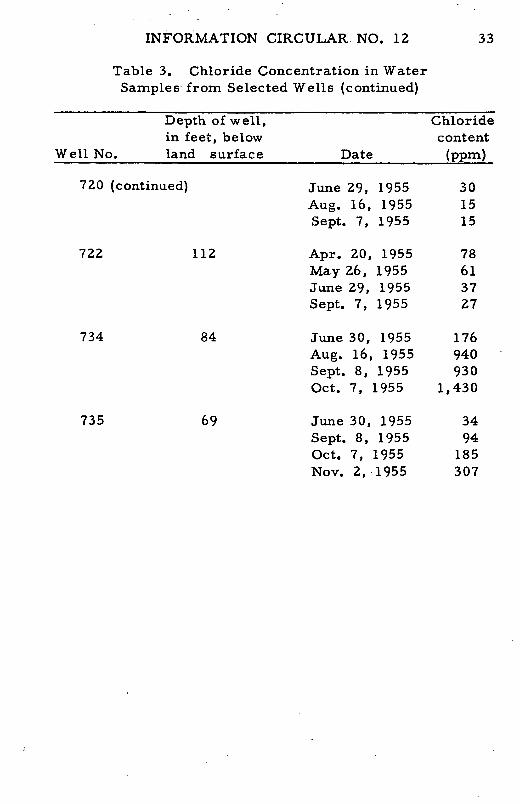
from severalhundred wells in the Stuart area for chlorideanalysis (fig. 9). Those wells yieldingwater having anappre-ciable chloride content were sampled periodically to detectany variations in the chloride content of the water (table 3).
INFORMATION CIRCULAR NO. 12 27
In most cases the fluctuations are caused by variations in
the amount of rainfall in the area or an increase or decreasein pumping. Usually it is a combination of the two, because
more water is needed for irrigation during dry periods, asin 1955, and less during wet periods, as in 1947-1948.
In a few cases, notably inwells 647 and 722, the chloride
content of the water dropped during a dry period, owing tothe cessation of pumping in the old city well field and the
plugging of a leaky artesian well, No. 128 (fig. 2). Wells 619and 654 showed an increase and then a decrease in the chlo-ride content of the water. The decrease was probably causedby the flushing of the salty artesian water from the aquifer.
Salt water may encroach into the Stuart area from eitherof two sources: (1) bodies of seawater, including the St. LucieRiver, the Manatee Pocket, and tidal creeks and canals, and(2) the artesian aquifer.
Contamination from Surface-Water Bodies
Encroachment from the St. Lucie River and the ManateePocket is not extensive at the present time. It has occurred
only in areas near the coast, and no proven encroachmenthas been found more than half a mile from the river. Thefresh-water head is high close to the shoreline, and in many
places fresh water canbe obtained from wells within 100 feetof salt-water bodies. It is reported that fresh water hasbeen obtainedfrom wells driven in the river bottom, but theauthor has not confirmed this.
Heavy pumping in the areas adjacent to the river maycause sufficient lowering of thewater table to allow saltwaterto invade the fresh-water zone. Water of high chloride contentwas detected in well 720, about 1,500 feet from the St. LucieRiver, about halfway between the river and the water plantwell field. When the wellwas drilled, water containing 9, 180ppm of chloride was encountered at a depth of 104 feet belowthe land surface. The well was immediately "pulled back"20 feet, to a depth of 84 feet, where the chloride content ofthe water was only 19 ppm. A layer of fine sand between 84and 104 feet apparently acts as a confining bed, because no
28 FLORIDA GEOLOGICAL SURVEY
STUART _-/-- T3 • -
team-
"; \ T "
S1 Io*is 3o 00 3
0 *
0y$ so 31
ii Iol To " -o{ so O 101I TO 1000
' 14OR IE THAN 1000 .
tent of water from wells.
, .9 3- 313 moo ..
tento o w r
tent of water -from wells.
INFORMATION CIRCULAR NO. 12 29
Table 3. Chloride Concentration in WaterSamples from Selected Wells
Depth of well, Chloridein feet, below content
Well No. land surface Date (ppm)
100 47 Sept. 20, 1946 110Oct. 7, 1946 131Dec. 19, 1946 138Feb. 6, 1947 124Mar. 13, 1947 153Apr. 24, 1947 118May 12, 1947 104June 25, 1947 111Mar. 10, 1948 104June 10, 1948 89Sept. 15, 1948 94Dec. 10, 1948 74Feb. 11, 1949 110July 1, 1949 113Apr. 27, 1952 185Jan. 28, 1955 161May 11, 1955 166June 29, 1955 148
105 88 Aug. 13, 1946 34
Sept. 20, 1946 27Nov. 7, 1946 41Dec. 19, 1946 67Feb. 6, 1947 53Mar. 13, 1947 46June 25, 1947 49Mar. 10, 1948 37June 10, 1948 61Sept. 15, 1948 37Dec. 10, 1948 27Feb. 11, 1949 63Apr. 7, 1950 188Jan. 18, 1951 102Aug. 21, 1951 109Mar. 27, 1952 167
30 FLORIDA GEOLOGICAL SURVEY
Table 3. Chloride Concentration in WaterSamples from Selected Wells (continued)
Depth of well, Chloridein feet, below content
Well No. land surface Date (ppm)
353 80 July 28, 1953 545Jan. 20, 1955 670June 30, 1955 580Aug. 16, 1955 680
362 23 Aug. 4, 1953 35Jan. 21, 1955 615June 30, 1955 1,370Aug. 16, 1955 2,020Sept. 8, 1955 1,980
515 60 Oct. 6, 1953 106Jan. 11, 1955 131Apr. 20, 1955 123June 29, 1955 121Sept. 5, 1955 157Oct. 5, 1955 117
518 57 Oct. 6, 1953 46Jan. 10, 1955 160Jan. 27, 1955 103Apr. 20, 1955 87May 11, 1955 80June 29, 1955 96Aug. 16, 1955 132Sept. 7, 1955 136
520 35 Oct. 6, 1953 64Jan. 10, 1955 66Apr. 20, 1955 75June 29, 1955 83Sept. 7, 1955 79
523 45 Oct. 6, 1953 53Jan. 10, 1955 36Apr. 20, 1955 33June 10, 1955 32Sept. 7, 1955 36
INFORMATION CIRCULAR NO. 12 31
Table 3. Chloride Concentration in WaterSamples from Selected Wells (continued)
Depth of well, Chloridein feet, below content
Well No. land surface Date (ppm)
525 49 Oct. 6, 1953 91Jan. 10, 1955 85Apr. 20, 1955 95Sept. 7, 1955 124
588 50 Oct. 22, 1953 265Jan. 10, 1955 328Apr. 20, 1955 258June 29, 1955 400
590 20 Oct. 22, 1953 45Jan. 10, 1955 67Apr. 20, 1955 67June 29, 1955 70
597 15 Nov. 9, 1953 40Jan. 10, 1955 36Apr. 20, 1955 39June 29, 1955 29
608 58 Nov. 23, 1953 100Jan. 10, 1955 88Apr. 20, 1955 87June 29, 1955 80
619 57 Apr. 15, 1955 550June 29, 1955 700Aug. 16, 1955 650Sept. 7, 1955 645Oct. 7, 1955 650
620 56 .May 11, 1955 42June 29, 1955 43Aug. 16, 1955 49Sept. 7, 1955 47
32 FLORIDA GEOLOGICAL* SURVEY
Table 3. Chloride Concentration in Water
Samples from Selected Wells (continued)
Depth of well, Chloridein feet, below content
Well No. land surface Date . (ppm)
622 56 Apr. 20, 1955 20May 11, 1955 16June 29, 1955 18Aug. 16, 1955 15Sept. 7, 1955 43?
637 15 Jan. 11, 1955 :245Apr. 29, 1955 48June 30, 1955 32
638 38 Apr. 20, 1955 230June 29, 1955 272Aug. 16, 1955 352
642 45 Apr. 20, 1955 56June 29, 1955 76Aug. 16, 1955 65
'647 113 Apr. 15, 1955 98June 29, 1955 40Sept. 7, 1955 34
654 63 Feb. 3, 1955 197Apr. 20, 1955 312June 29, 1955 348Sept.. 7, 1955 348Oct. 5, 1955 280
687 60 Apr. 19, 1955 775June 29, 1955 780Aug. 16, 1955 810
720 104 ' Apr. 22, 1955 9,18084 Apr. 23, 1955 19
May 11, 1955 14May 23, 1955 15
INFORMATION CIRCULAR NO. 12 33
Table 3. Chloride Concentration in WaterSamples from Selected Wells (continued)
Depth of well, Chloridein feet, below content
Well No. land surface Date (ppm)
720 (continued) June 29, 1955 30Aug. 16, 1955 15Sept. 7, 1955 15
722 112 Apr. 20, 1955 78May 26, 1955 61June 29, 1955 37Sept. 7, 1955 27
734 84 June 30, 1955 176Aug. 16, 1955 940Sept. 8, 1955 930Oct. 7, 1955 1,430
735 69 June 30, 1955 34Sept. 8, 1955 94Oct. 7, 1955 185Nov. 2, 1955 307
34 FLORIDA GEOLOGICAL SURVEY
appreciable increase in the chloride content occurred after
several months of intermittent pumping to irrigate a lawn.
It is believed that the salinity of the water in well 720 is the
result of direct encroachment from the St. Lucie River,
caused by the reduction of head induced by heavy pumping
in the water plant and ball park well fields. However, when
well 622, in the cityball park well field, was deepened from
56 feet to 115 feet the chloride content of the water decreased
slightly, from 36 ppm to 20 ppm, indicating that encroach-
ment had not reached the vicinity of the well field at the ball
park. The water in well 722, 600 feet east of the city water
plant and 600 feet from the river, contained 78 ppm of chlo-
ride at a depth of 112 feet below the land surface, indicating
that encroachment of water of high chloride content had not
reached the vicinity of the well field at the water plant. Thesalt front is probably now stationary or is being pushed back
toward the river because of the increase. of fresh-water head
following the c'essation of pumping of the city water plant and
ball park well fields. The position of the salt front cannotbe determined accurately because of the lack of deep obser-vation wells.
Some salt-water .encroachment is occurring along theeastern side of the peninsula in areas immediately adjacentto the St. Lucie River and the Manatee Pocket. A relativelyhigh, discontinuous ridge parallels the eastern shoreline.It is flanked on the west by low, swampy land. Streams andditches draining the lowland flow parallel to the ridge untilthey reach gaps in the ridge where they discharge into thesalt water of the river. They reduce the fresh-water headunder the ridge during the dry season, so that even moderatepumping in some areas results in movement of salt waterinto the aquifer. The chloride content of the water inwell 362,in this area(fig. 2), increased from 35 ppm in 1953 to morethan 2, 000 ppm in 1955 (table 3). This locality is especiallyvulnerable to contamination because of its proximity to adrainage canal.
Contamination from Artesian Aquifer
The beds of relatively impermeable clay and fine sandof the Hawthorn formation act as an effective barrier to the
INFORMATION CIRCULAR NO. 12 35
vertical migration of salt water from the. artesian aquifer,
except where wells have punctured them. In the Stuart area,
the artesian water contains between 800 and 4, 500 ppm of
chloride and is under a pressure head of about40 feet above
the land surface. If this water were allowed to flow freely
at the surface it could contaminate the fresh water in the
shallow aquifer. The artesian water is highly corrosive,
and, after a period of years, may corrodethe casings of the
wells and create perforations through which the salty water
could escape into the fresh-water aquifer eventhough thetop
of the well is tightly capped. An electric log made by the
Florida Geological Survey of well 128, an artesian wellwith-
in 300 feet of the city water plant well field, indicated that
there were probably many breaks in the casing at various
intervals below the land surface. Saltwater escaping through
holes in the casing of this well is believed to be the probable
source of chloride contamination in the old city well field.
This conclusionwas reached when it became evident that the
contamination could not be direct encroachment from the
river because wells of the same depth as the city wells and
situated a few hundred feet from the river bank, directly
between the well field and the river, yielded water whose
chloride content was lower than that in the city.wells.
Evidence to support this conclusion was noted after the
water plant and ball park well fields were shut down. The
water in certain wells in the area increased markedly in
chloride content. When the data were plotted on a map, the
wells in which an increase in chloride content had occurred
formed a fan-shaped pattern extending downgradient from
the artesian well, the axis of the pattern closely paralleling
the direction of ground-water flow. The water in well 619,
nearest the artesian well, had the greatest increase in chlo-
ride content, whereas that in wells farther away showed a
smaller increase. Water in wells outside the area did not
change appreciably. It is believed the observed changes in
chloride concentrationwere causedby leakage of salty waterfrom the artesian well. Prior to the shutting down of the
water plant well field, most of the salty artesian water was
being drawn into the city supply wells, where it was diluted
by fresh water from within the area affected by pumping.
Well 128 was filled with cement on April 25, 1955, the
day that pumping ceased in the water plant well field, and
36 FLORIDA GEOLOGICAL SURVEY
the salty water in the aquifer.after that time was artesian
water which had not been flushed away. The residual arte-
sian water, therefore, moved downgradient and was diluted
by fresh water as it progressed. As the salty water was
dispersed, the water from wells downgradient from the arte-
sian well became fresher.
SUMMARY AND CONCLUSIONS
All supplies of fresh ground water in the Stuart area are
obtained from the shallow nonartesian aquifer. The deep(Floridan) artesian aquifer will yield large quantities of water
to flowing wells, but the water is too highly mineralized formost purposes. The nonartesian aquifer, although it differs
from area to area, is composed generally of Pleistocene,
Pliocene andpossiblyMiocene deposits consisting of sand toa depth of about 40 feet and alternating layers of limestone
or shell and sand from 40 feet to about 130 feet. Below130 feet little or no water is available from the sands andclays that form the major part of the Hawthorn formation,the confining unit of the Floridan aquifer. The Floridan
aquifer is composed of limestones of the Vicksburg group,the Ocala group, the Avon Park limestone, and the LakeCity limestone.
Pumping tests reveal that the new city well field is farenough from the St. Lucie River that salt-water encroach-ment should not be a problem if hydrologic conditions remainsubstantially as they are at the present time.
So far, salt water has encroached in the Stuart areaonly in a relatively narrow area adjacent to the St. LucieRiver and in areas near leaking artesian wells. Water-table contour maps indicate that the fresh-water head issufficient to prevent extensive encroachment of salt waterinto the shallow aquifer. If drainage canals are dug to depthsbelow sea level in the vicinity of the well field, however,they could become avenues through which salt water mayencroach during periods of low ground-water levelsand hightides. Also, drainage canals may lower the water tablesufficiently to allow salt water to encroach at depth in theaquifer.
INFORMATION CIRCULAR NO. 12 37
The increase in the chloride content of the old city wells
was due largely to leaks in the casing of an artesian well in
the vicinity; however, water of high chloride content discov-
ered in a well about halfway between the old well field and
the St. Lucie River indicated that salt-water encroachment
from the direction of the river was occurring at depth inthe
aquifer. With a steady increase in pumping this encroach-
ment might eventually have reached the old well field, but
with the cessation of pumping in the old well field the salt
front should move back slowly toward the river. Moderate
pumping in the old well field could be resumed after the
aquifer around ithas been cleared of the salt-water contam-
ination.
Large additional water supplies can be developed in the
vicinity of the new well field, provided the wells are ade-
quately spaced and the pumping rates are not excessive.
Additionalwells a quarter of a mile or more south of the new
field would not seriously affect it. The wells would be in
areas where the altitude of the water table is relatively high
throughout the year, so there would be little danger of salt-
water encroachment due to pumping.
A continuous record of the fluctuation of the water level,
such as that obtained from the gage at well 147, provides a
recordof the changes inground-water storage inthe aquifer
throughout a given period. Determination of the chloride
content of samples collected periodically from selected ob-
servation wells will reveal any further movement of salt
water into the shallow aquifer.
W00
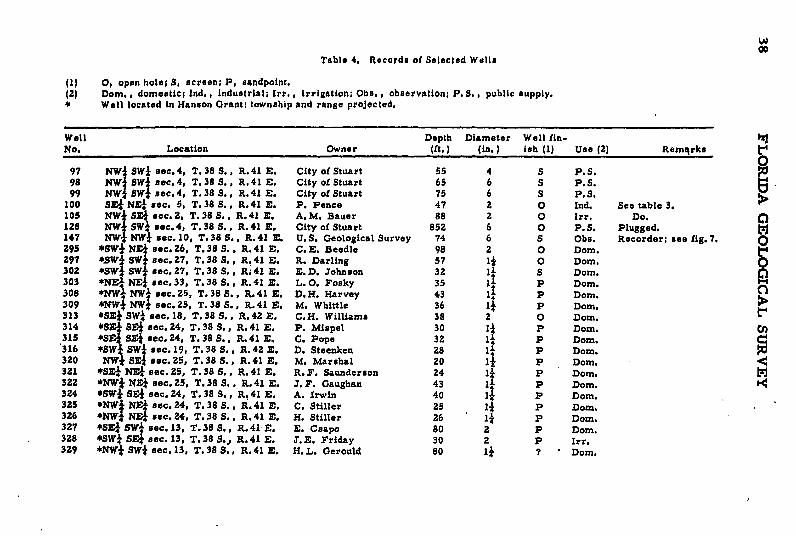
Table 4, Records of Selected Wells
(1) 0, open hole; So screen; P, sandpoint.(2) Dom., domestic; Ind., industrial; Irr., irrigation; Obs., observation; P.S., public supply.* Well located in Hanson Grant; township and range projected.
Well Depth Diameter Well fin. k]No. Location Owner (it.) (in.) ish (1) Use (2) Remqrks
097 NW SW, sec.4, T.38 S., R.41 E. City of Stuart 55 4 S P. S.98 NWf SWI sec. 4, T. 38 S., R. 41 E. City of Stuart 65 6 S P.S.99 NW4 SWI sec. 4, T. 38 S., R.41 E. City of Stuart 75 6 S P.S.
100 SE4 NE sec. 5, T. 38 S., R.41 E. P. Pence 47 2 O Ind. See table 3.105 NW SE* sec. 2, T. 38 S., R.41 E. A.M. Bauer 88 2 O Irr. Do.128 NWI SWI sec.4, T.38 S., R.41 E. City of Stuart 852 6 O P. S. Plugged.147 NW` NW} sec. 10, T. 38 S., R.41 E. U.S. Geological Survey 74 6 S Obs. Recorder; see fig. 7.295 *SW; NE sec. 26, T. 38 S., R.41 E. C.E. Beedle 98 2 O Dom.297 *SW" SW sec. 27, T. 38 S., R.41 E. R. Darling 57 1i O Dom. O302 *SWI SW, sec. 27, T.38 S., R.41 E. E. D. Johnson 32 i1 S Dom.303 *NEJ NEI sec. 33, T. 38S., R.41 E. L. O. Fosky 35 1i P Dom.308 *NWf NW+ sec. 25, T. 38 S., R.41 E. D.H. Harvey 43 1i P Dom.309 *NW I NW* sec. 25, T.38 S., R.41 E. M. Whittle 36 11 P Dom.313 *SEF SW4 sec. 18, T.38 S., R.42 E. C.H. WilUams 38 2 O Dom.314 *SE, SE sec. 24, T. 38 S., R. 41 E. P. Mispel 30 11 P Dom. Cl315 *SE2 SE- sec. 24, T. 38 S., R. 41 E. C. Pope 32 11 P Dom.316 *SWJ SWI sec. 19, T. 38 S., R. 42 E D. Steenken 28 11 P Dom.320 NW SEJ sec. 25, T. 38 S., R. 41 E. M. Marshal 20 a1 P Dom.321 *SE4 NEf sec. 25, T. 38 S., R.41 E. R.F. Saunderson 24 11 P Dom. M322 *NWJ NEa sec. 25, T. 38 S., R. 41 E. J. F. Gaughan 43 1 P Dom.324 *SWS SE• sec. 24, T.38 S., R.41 E. A. Irwin 40 11 P Dom.325 *NW4 NE4 sec. 24, T. 38 S., R.41 E. C. Stiller 25 11 P Dom.326 *NWr NE sec. 24, T. 38 S., R. 41 E. H. Stiller 26 11 P Dom.327 *SE4 SWW sec. 13, T.38 S., R.41 E. . Csapo 80 2 P Dom.328 *SW} SEF sec. 13, T. 38 S., R. 41 E. J. E. Friday 30 2 P Irr.329 *NW+ SW* sec. 13, T.38 S., R.41 E. H.L. Gerould 80 s1 ? ' Dom.
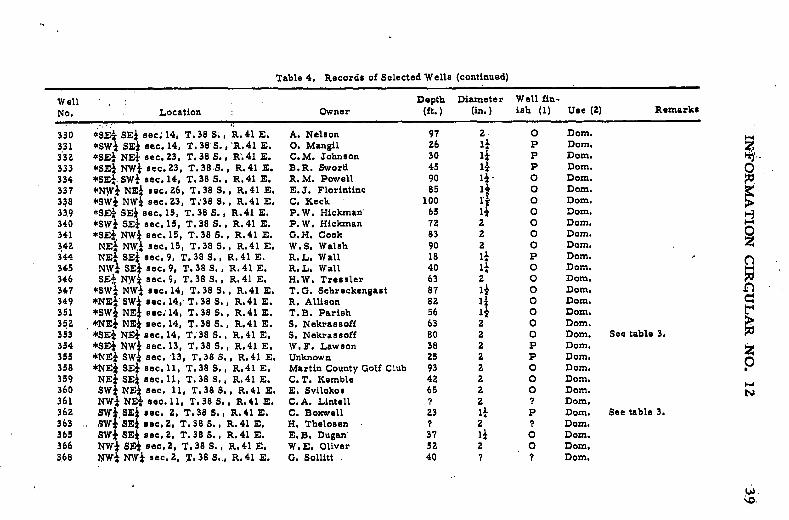
Table 4. Records of Selected Wells (continued)
Well Depth Diameter Well fin-No. Location Owner (ft.) (in.) ish (1) Use (2) Remarks
330 *SEj SEJ sec. 14, T.38 S., R.41 E. A. Nelson 97 2 O Dom.331 *SWI SEi sec. 14, T.38S.,' R.41 E. O. Mangil 26 11 P Dom.332 *SE1 NEI sec. 23, T. 38 S., R.41 E. C.M. Johnson 30 1 P Dom.333 *SE NW, sec. 23, T.38 S., R.41 E. B.R. Sword 45 11 P Dom.334 *SE' SW4 sec. 14, T. 38 S., R.41 E. R. M. Powell 90 1 - O Dom.337 *NW• NEI sec. 26, T.38 S., R.41 E. E.J. Florintine 85 1 O Dom.338 *SW1 NWi sec. 23, T.38 S., R.41 E. C. Keck 100 I1 O Dom.33,9 *SE SE* sec. 15, T.38 S., R.41 E. P.W. Hickman' 65 11 0 Dom. -340 *SW* SE* sec. 15, T. 38 S., R.41 E. P.W. Hickman 72 2 O Dom.341 *SE* NW* sec. 15, T. 38 S., R.41 E. G.H. Cook 83 2 O Dom. O342 NEI NWI sec. 15, T.38 S., R.41 E. W.S. Walsh 90 2 O Dom.344 NEI SEJ sec. 9, T. 38 S., R. 41 E. R. L. Wall 18 1I P Dom.345 NW* SE* sec. 9, T. 38 S. , R. 41 E. R. L. Wall 40 1* O Dom.346 SEl NW; sec.9, T.38 S., R.41 E. H.W. Tressler 63 2 O Dom.347 *SW4 NWi sec. 14, T.38 S., R.41 E. T.G. Schreckengast 87 1I O Dom.349 *NE SWW sec. 14, T.38 S., R.41 E R.R. Allison 82 1 0 Dom.351 *SWI NEi sec.14, T.38 S., R.41 E. T.B. Parish 56 Il O Dom.352 *NE 1 NEI sec. 14, T.38 S., R.41 E. S. Nekrassoff 63 2 O Dom.353 *SE* NE sec. 14, T.38 S. .R.41 E. S. Nekrassoff 80 2 O Dom. See table 3.354 *SEj NWk sec. 13, T. 38 S., R.41 E. W.F. Lawson 38 2 P Dom.355 *NE1 SW; sec. 13, T.38 S., R.41 E. Unknown 25 2 P Dom. 0358 *NEI SE* sec. 11, T.38 S., R.41 E. Martin County Golf Club 93 2 O Dom.359 NEi SEI sec. 11, T. 38 S., R.41 E. C. T. Kemble 42 2 O Dom.360 SW NE sec. 11, T.38 S., R.41 E. E. Svilokos 65 2 0 Dom.361 NW NE* sec. 11, T. 38 S., R.41 E. C.A. Lintell ? 2 ? Dom.362 SW* SEi sec. 2, T.38 S., R.41 E. C. Boxwell 23 11 P Dom, See table 3.363 . SW* SE* sec. 2, T. 38 S., R.41 E. H. Thelosen - ? 2 ? Dom.365 SW* SE* sec. 2, T. 38 S., R. 41 E. E. B. Dugan 37 1i O Dom.366 NW} SE sec.,2, T.38 S., R.41 E. W.E. Oliver 52 2 O Dom.368 NWj NWs sec. 2, T. 38 S., R.41 E. G. Sollitt 40 ? ? Dom.
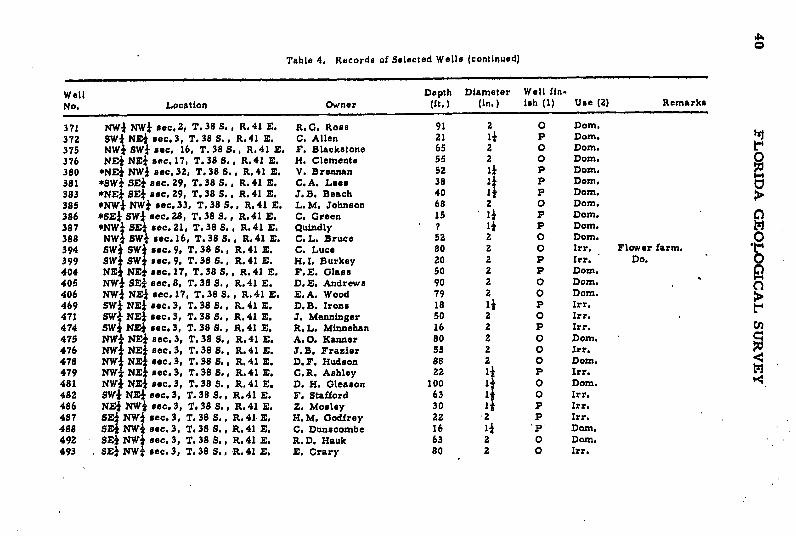
0Table 4, Records of Selected Wells (continued)
Well Depth Diameter Well fin-No. Location Owner (ft,) (in.) ish (1) Use (2) Remarks
371 NWI NW* sec. 2, T. 38 S,, R. 41 E. R. G. Ross 91 2 O Dom,372 SW; NEi sec. 3, T. 38 S., R. 41 E. C. Allen 21 1i P Dom. r375 NW4 SWI sec. 16, T.38 S., R.41 E. F. Blackstone 65 2 O Dom.376 NEI NEi sec. 17, T. 38 S., R,41 E. H. Clements 55 2 O Dom.380 *NE* NW* sec. 32, T. 38 S., R. 41 E. V. Brennan 52 1* P Dom.r381 *SWc SEf sec. 29, T.38 S., R.41 E. C.A. Lees 38 1 P Dom.383 *NEI SEJ sec, 29, T. 38 S. , R. 41 E. J. B. Beach 40 1 P Dom.385 *NW* NW* sec. 33, T. 38 S., R, 41 E. L.M. Johnson 68 2 O Dom.386 *SEf SWj sec, 28, T. 38 S.,, R.41 E. C. Green 15 1) P Dom. 0387 *NWI SEi sec. 21, T. 38 S., R. 41 E. Quindly ? 1I P Dom. M388 NW` SW) sec.16, T.38 S., R.41 E. C.L. Bruce 52 2 O Dom. 0394 SW SW 1 sec, 9, T. 38 S., R. 41 E. C. Luce 80 2 O Irr, Flower farm.399 SW SW sec. 9, T. 38 S., R. 41 E. H.I, Burkey 20 2 P Irr. Do.404 NE* NE sec. 17, T. 38 S,, R. 41 E. F. E. Glass 50 2 P Dom.405 NW* SE4 sec. 8, T. 38 S., R. 41 E. D.E. Andrews 90 2 O Dom.406 NW* NEI sec. 17, T.38 S., R.41 E. E. A. Wood 79 2 O Dom.469 SWS NE sec.3, T. 38 S., R. 41 E. D.B. Irons 18 1i P Irr.471 SWI NE; sec. 3, T. 38 S., R. 41 E. J. Menninger 50 2 O Irr.474 SWJ NE sec. 3, T. 38 S., R. 41 E. R. L. Minnehan 16 2 P Irr.475 NW NE aec. 3, T. 38 S., R. 41 E. A. O. Kanner 80 2 O Dom.476 NW NE; sec. 3, T. 38 S., R. 41 E. J.B. Frazier 55 2 O Irr.478 NW E NE sec. 3, T. 38 S., R. 41 E. D.F. Hudson 88 2 O Dom.479 NW* NEI sec. 3, T. 38 S., R. 41 E. C.R, Ashley 22 1* P Irr.481 NW; NE* sec. 3, T. 38 S., R.41 E. D. H. Gleason 100 1* 0 Dom. .482 SW NE, sec.3, T.38 S., R.41 E. F. Stafford 63 1 0 Irr.486 NE* NW sec. 3, T 38 S., R.41 E. Z. Mosley 30 1 P Irr.487 SEj NW sec. 3, T. 38 S., R.41 E. H.M. Godfrey 22 2 P Irr.488 SE) NW* sec. 3, T. 38 S., R.41 E. C. Dunscombe 16 1* P Dom.492 SE* NW* sec.3, T.38 S., R.41 E. R.D. Hauk 63 2 O Dom,493 . SEN NW* sec. 3, T.38 8., -R. 41 E. E. Crary 80 2 O Irr.
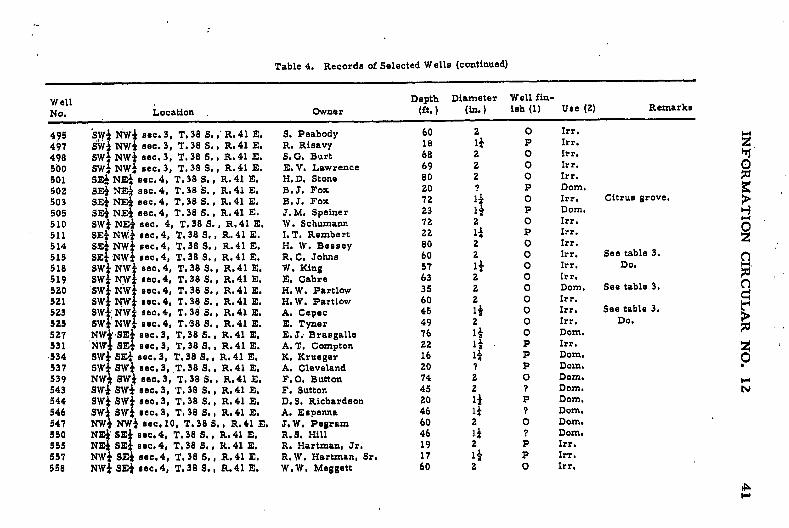
Table 4. Records of Selected Wells (continued)
Well Depth Diameter Well fin-
No. Location Owner (ft.) (in.) ish (1) Use (2) Remarks
495 SWi a NW sec. 3, T.38 S., R. 41 E. S. Peabody 60 2 0 Irr.
497 SWj NW sec. 3, T 38 S., R.41 E. R. Risavy 18 1* P Irr. Z498 SW NW sec. 3, T.38 S., R.41 E. S.G. Burt 68 2 0 Irr.
500 SW4 NW sec. 3, T, 38 S., R.41 E. E.V. Lawrence 69 2 0 Irr.501 SE NE4 sec. 4, T 38 S., R.41 E. H.D. Stone 80 2 O Irr.
502 SE NE sec.4, T.38 S., R.41 E. B.J. Fox 20 ? P Dom.
503 SEI NEI sec.4, T.38 S., R.41 E. B.J. Fox 72 11 0 Irr. Citrus grove.
505 SE NEI sec. 4, T. 38 S., R.41 E. J. M. Speiner 23 1 P Dom.510 SW NEsec. 4, T.38 S., R.41 E. W. Schumann 72 2 O Irr.511 SE NW sec.4, T.38 S., R.41 E. I. T. Rembert 22 1 P Irr.514 SEI NWi sec.4, T.38 S., R.41 E. H. W. Bessey 80 2 O Irr.515 SEi NW sec.4, T.38 S., R.41 E. R.C. Johns 60 2 O Irr. See table 3.
518 SWNW sec.4, T.38 S., R.41 E. W. King 57 1 0 Irr. Do. "519 SW NW*sec.4, T.38 S., R.41 E. E. Cabre 63 2 O Irr.520 SW NW* sec.4, T. 38 S., R.41 E. H. W. Partlow 35 2 0 Dom. See table 3.521 SW NW sec.4, T.38 S., R.41 E. H.W. Partlow 60 2 O Irr.523 SWNW sec.4, T. 38 S., R.41 E. A. Cepec 45 1i O Irr. See table 3.525 SW NWJ iec.4, T. 38 S., R.41 E. E. Tyner 49 2 0 Irr. Do.527 NW SE sec. 3, T.38 S., R.41 E. E.J., Brasgalle 76 1i 0 Dom.531 NW SE sec.3, T.38 S., R.41 E. A. T. Compton 22 1 P Irr.534 SW* SE sec. 3, T. 38 S., R.41 E. K. Krueger 16 1 P Dom.537 SWI SWt sec. 3, ,T. 38 S. R.41 E. A. Cleveland 20 ? P Dom.539 NW* SW sec. 3, T. 38 S., R.41 E. F. O. Button 74 2 O Dom. -543 SWj SW sec. 3, T. 38 S., R.41 E. F. Sutton 45 2 ? Dom. N544 SW SWS sec.3, T.38 S,, R.41 E. D.S. Richardson 20 li P Dom.546 SWj SWI sec. 3, T. 38 S., R.41 E. A. Espenna 46 1) ? Dom.547 NW* NW sec, 10, T.38 S,, R.41 E. J.W. Pegram 60 2 0 Dom.550 NE SE sec.4, T.38 S., R.41 E. R.S. Hill 46 1* ? Dom.555 NEI SE sec.4, T.38 S., R.41 E. R. Hartman, Jr. 19 2 P Irr.557 NW} SE sec.4, T.38 S., R.41 E. R.W. Hartman, Sr. 17 1i P Irr.558 NW* SE* sec.4, T.38 S,, R.41 E. W.W. Meggett 60 2 0 Irr.
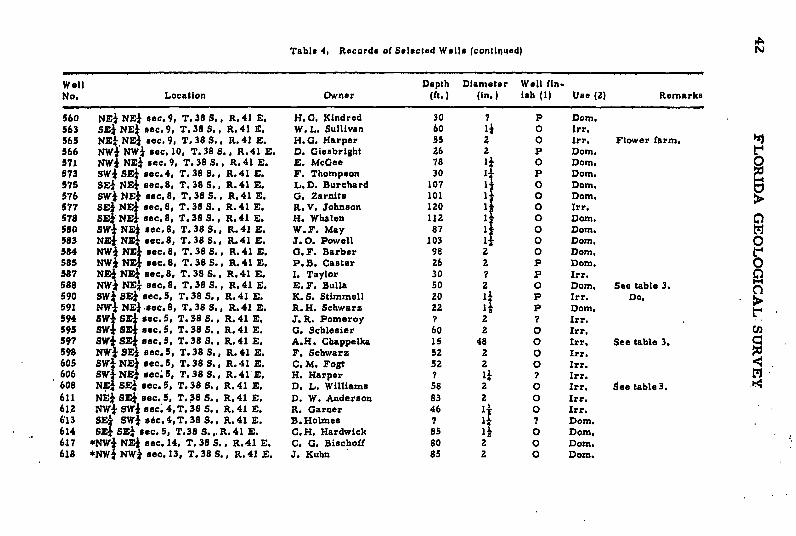
Table 4, Records of Selected Wells (continued) N
Well Depth Diameter Well fin-No, Location Owner (ft.) (in.) ish (1) Use (2) Remarks
560 NEI NE) sec. 9, T. 38 S., R, 41 E. H. G, Kindred 30 ? P Dom,563 SE) NEi sec. 9, T. 38 S., R. 41 E. W. L. Sullivan 60 1i O Irr,565 NEI NEI sec. 9, T. 38 S., R. 41 E. H. G. Harper 55 2 0 Irr. Flower farm.566 NW* NWI sec. 10, T. 38 S., R.41 E. D. Giesbright 26 2 P Dom.571 NWI NEI sec. 9, T. 38 S., R. 41 E. E. McGee 78 1i O Dom. 0573 SWI SE* sec. 4, T. 38 S., R.41 E. F. Thompson 30 11 P Dom.575 SEI NE* sec.8, T. 38 S., R.41 E. L. D. Burchard 107 1 O Dom.576 SW NEI sec.8, T.38 S., R.41 E. G. Zarnits 101 1 0 Dom.577 SE NE sec. 8, T.38 S., R.41 E. R. V. Johnson 120 O Irr.578 SENE sec. 8, T. 38 S., R.41 E. H. Whalen 112 1 0 Dom. 0580 SW NEf sec. 8, T.38 S., R.41 E. W.F. May 87 1 0 Dom. M583 NE*NEZN sec.8, T.38 S., R.41 E. J.O. Powell 103 1 0 Dom. O584 NW* NE sec. 8, T. 38 S., R. 41 E. G. F. Barber 98 2 O Dom.585 NW* NE sec. 8, T. 38 S., R.41 E. P.B. Caster 26 2 P Dom. O587 NE* NE* sec.8, T. 38 S., R.41 E. I. Taylor 30 ? P Irr.588 NW* NE sec,8, T. 38 S., R.41 E. E. F. Bulla 50 2 O Dom. See table 3.590 SW* SEI sec. 5, T.38 S., R.41 E. K. S. Stimmell 20 li P Irr. Do.591 NW NE-sec. 8, T.38 S., R.41 E. R.H. Schwarz 22 1- P Dom.594 SW S sec. 5, T. 38 S., R. 41 E. J. R. Pomeroy ? 2 ? Irr.595 SW' SE sec. 5, T. 38 S., R. 41 E. G. Schlesier 60 2 0 Irr. CEl597 SW* SEB sec. 5, T. 38 S., R. 41 E. A.H. Chappelka 15 48 0 Irr. See table 3.598 NW S sec. 5, T. 38 S., R. 41 E. F. Schwarz 52 2 O Irr.605 SW N ec. 5, T. 38 S., R. 41 E. C. M. Fogt 52 2 O Irr.606 SW NE* sec. 5, T.38 S., R.41 E. H. Harper ? 1) ? Irr.608 NE SE* sec. 5, T. 38 S., R. 41 E. D. L. Williams 58 2 O Irr. See table 3.611 NE) SE* sec. 5, T. 38 S., R. 41 E. D. W. Anderson 83 2 O Irr.612 NW* SWI sec. 4, T. 38 S., R. 41 E. R. Garner 46 11 O Irr.613 SE- SW sc. 4, T. 38 S., R.41 E. B. Holmes ? 1? ? Dom.614 SE* SEL sec.5, T.38 S., R.41 E. C.H. Hardwick 85 1 O Dom.617 *NWI NEJ sec. 14, T. 38 S., R.41 E. C. G. Bischoff 80 2 0 Dom.618 *NW* NW* sec. 13, T. 38 S., R. 41 E. J. Kuhn 85 2 O Dom.
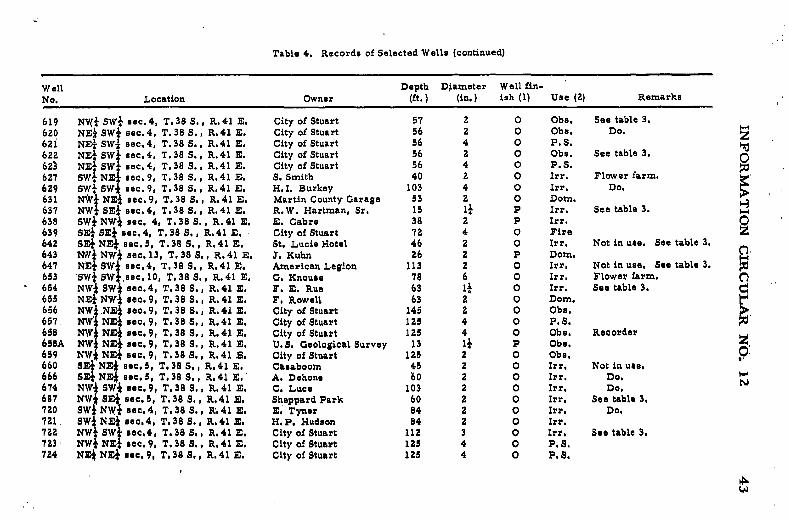
Table 4. Records of Selected Wells (continued)
Well Depth Diameter Well fin-No. Location Owner (ft.) (in.) ish (1) Use (2) Remarks
619 NWi SW* sec.4, T.38 S., R.41 E. City of Stuart 57 2 O Obs. See table 3.620 NEi SWj sec.4, T.38 S., R.41 E. City of Stuart 56 2 O Obs. Do.621 NEI SW sec.4, T.38 S., R.41 E. City of Stuart 56 4 O P.S.622 NE SW• sec.4, T.38 S., R.41 E. City of Stuart 56 2 O Obs. See table 3.623 NE* SW sec. 4, T. 38 S., R. 41 E. City of Stuart 56 4 O P.S.627 SW s NE sec. 9, T.38 S., R.41 E. S. Smith 40 2 O Irr. Flower farm.629 SW SW sec.9, T.38 S., R.41 E. H.I. Burkey 103 4 O Irr. Do.631 NWNE sec.9, T.38 S., R.41 E. Martin County Garage 53 2 O Dorm.637 NW SE* sec.4, T.38 S., R.41 E. R.W. Hartman, Sr. 15 1* P Irr. See table 3.638 SW NW e sec. 4, T.38 S., R.41 E. E. Cabre 38 2 P Irr. 0639 SE SE* sec.4, T.38 S., R.41 E. City of Stuart 72 4 O Fire642 S NEt sec. 5, T.38 S., R. 41 E. St. Lucie Hotel 46 2 O Irr. Not in use. See table 3.643 W NW* sec. 13, T. 38 S., R.41 E. J. Kuhn 26 2 P Dorm.647 NE SWJ sec.4, T.38 S., R.41 E. American Legion 113 2 O Irr. Not in use. See table 3.653 'SW SW. sec. 10, T.38 S., R.41 E. G. Knouse 78 6 O Irr. Flower farm. ,654 NW SW* sec.4, T.38 S., R.41 E. F. E. Rue 63 1) O Irr. See table 3.655 NE NWI sec. 9, T. 38 S., R. 41 E. F. Rowell 63 2 O Dorm.656 NW.NE sec. 9, T.38 S., R.41 E. City of Stuart 145 2 O Obs.657 NWVNE sec. 9, T.38 S., R.41 E. City of Stuart 125 4 O P.S.658 NW •NE sec. 9, T. 38 S., R. 41 E. City of Stuart 125 4 O Obe. Recorder658A NW NEt sec. 9, T. 38 S., R.41 E. U.S. Geological Survey 13 1* P Obe.659 NW NE sec. 9, T. 38 S., R.41 E. City of Stuart 125 2 O Obe.660 SE NE* sec.5, T.38 S., R.41 E. Casaboom 45 2 O Irr. Not in use.666 SEt NE* ee. 5, T.38 S., R.41 E. A. Dehone 60 2 O Irr. Do.674 NW SW* sec.9, T. 38 S., R.41 E. C. Luce 103 2 O Irr. Do. N687 NW' SE* sec.5, T.38 S., R.41 E. Sheppard Park 60 2 O Irr. See table 3.720 SW* NWJ sec.4, T. 38 S., R. 41 E. E. Tyner 84 2 O Irr, Do.721. SW NE sec.4, T.38 S., R.41 E. H.P. Hudson 84 2 O Irr,722 NW SW* eec.4, T.38 S., R.41 E. City of Stuart 112 3 O Irr. See table 3.723 NW* NE sec. 9, T.38 S., R.41 E. City of Stuart 125 4 O P.S.724 NEt NEt sec.9, T.38 S., R.41 E. City of Stuart 125 4 0 P.S.
OJ
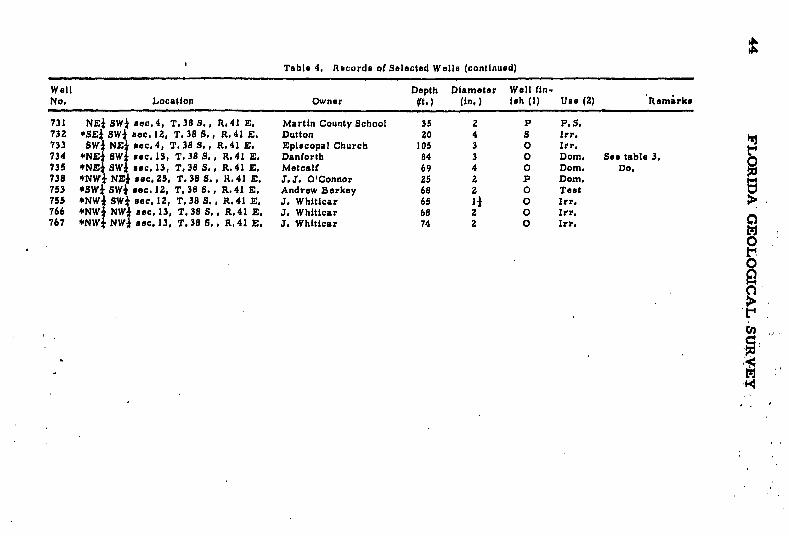
Table 4, Records of Selected Wells (continued)
Well Depth Diameter Well fin-No. Location Owner (ft.) (in,) ish (1) Use (2) Remirks
731 NEI SWk sec,4, T, 38 S., R.41 E. Martin County School 35 2 P P.S.732 *SEi SWI sec. 12, T. 38 S., R.41 E. Dutton 20 4 S Irr.733 SWt NE4 sec.4, T, 38 S., R, 41 E. Episcopal Church 105 3 O Irr.734 *NE SW sec. 13, T. 38 S., R.41 E. Danforth 84 3 O Dom. See table 3. o735 *NEI SW e sec. 13, T. 38 S., R. 41 E. Metcalf 69 4 O Dom. Do.738 *NW NE) sec. 25, T. 38 S. , R. 41 E. J.J. O'Connor 25 2 P Dom.753 *SWi SW eec.12, T. 38 S., R.41 E, Andrew Berkey 68 2 O Test755 *NW SW eec. 12, T.38 S., R.41 E. J. Whiticar 65 1i O Irr.766 *NW NW sec. 13, T. 38 S., R, 41 E. J. Whiticar 68 2 O Irr.767 *NW NW sec. 13, T. 38 S., R.41 E. J. Whiticar 74 2 O Irr.
0O
I:'.4
INFORMATION CIRCULAR NO. 12 45
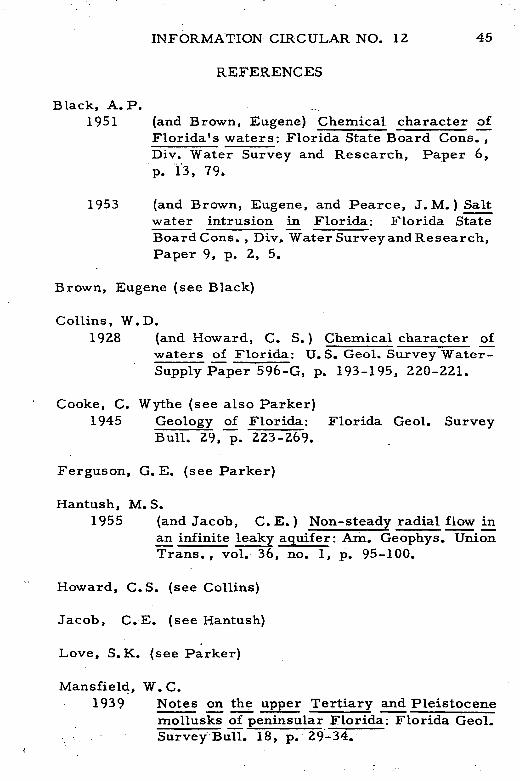
REFERENCES
Black, A. P.1951 (and Brown, Eugene) Chemical character of
Florida's waters: Florida State Board Cons. ,Div. Water Survey and Research, Paper 6,p. 13, 79.
1953 (and Brown, Eugene, and Pearce, J.M.) Saltwater intrusion in Florida: Florida StateBoard Cons. , Div. Water Survey and Research,Paper 9, p. 2, 5.
Brown, Eugene (see Black)
Collins, W.D.1928 (and Howard, C. S.) Chemical character of
waters of Florida: U.S. Geol. Survey Water-Supply Paper 596-G, p. 193-195, 220-221.
Cooke, C. Wythe (see also Parker)1945 Geology of Florida: Florida Geol. Survey
Bull. 29, p. 223-269.
Ferguson, G. E. (see Parker)
Hantush, M. S.1955 (and Jacob, C. E.) Non-steady radial flow in
an infinite leaky aquifer: Am. Geophys. UnionTrans., vol. 36, no. 1, p. 95-100.
Howard, C.S. (see Collins)
Jacob, C.E. (see Hantush)
Love, S.K. (see Parker)
Mansfield, W. C.1939 Notes on the upper Tertiary and Pleistocene
mollusks of peninsular Florida: Florida Geol.Survey Bull. 18, p. 29-34.
46 FLORIDA GEOLOGICAL SURVEY
Matson, G. C.1913 (and Sanford, Samuel) Geology and ground
waters of Florida: U.S. Geol. Survey Water-
Supply Paper 319, p. 381-384.
Parker, G.G.1944 (and Cooke, C. Wythe) Late Cenozoic geology
of southern Florida, with a discussion of theground water: Florida Geol. Survey Bull. 27,p. 41.
1955 (and Ferguson, G. E. , Love, S. K. , and others)Water resources of southeastern Florida, withspecial reference to the geology and groundwater of the Miami area: U.S. Geol. SurveyWater-Supply Paper 1255, p. 174-175, 814-815.
Pearce, J.M. (see Black, 1953)
Sanford, Samuel (see Matson)
Stringfield, V. T.1936 Artesian water in the Florida peninsula: U.S.
Geol. SurveyWater-SupplyPaper 773-C, p. 170,183, 193.
Theis, C.V.1935 The relation between the lowering of the piezo-
metric surface and the rate and duration ofdischarge of a well using ground-water storage:Am. Geophys. Union Trans., p. 519-524.
1938 The significance and nature of the cone of de-pression in ground water bodies: Econ. Geol-ogy, vol. 33, no. 8, p. 892, 894.
U. S. Geological SurveyWater levels and artesian pressures in obser-vation wells in the United States; 1950, 1951,1952, part 2, Southeastern States: Water -SupplyPapers 1166, p. 80-81, 1192, p. 65, and 1222,
p. 77, respectively.
INFORMATION CIRCULAR NO. 12 47
Wenzel, L.K.
1942 Methods for determining permeability of water-
bearing materials, with special reference to
discharging-well methods: U.S. Geol. Survey
Water-Supply Paper 887, p. 87-90.
-FLORIDA-GEOLOGICAL-SURVEY
COPYRIGHT NOTICE© [year of publication as printed] Florida Geological Survey [source text]
The Florida Geological Survey holds all rights to the source text ofthis electronic resource on behalf of the State of Florida. TheFlorida Geological Survey shall be considered the copyright holderfor the text of this publication.
Under the Statutes of the State of Florida (FS 257.05; 257.105, and377.075), the Florida Geologic Survey (Tallahassee, FL), publisher ofthe Florida Geologic Survey, as a division of state government,makes its documents public (i.e., published) and extends to thestate's official agencies and libraries, including the University ofFlorida's Smathers Libraries, rights of reproduction.
The Florida Geological Survey has made its publications available tothe University of Florida, on behalf of the State University System ofFlorida, for the purpose of digitization and Internet distribution.
The Florida Geological Survey reserves all rights to its publications.All uses, excluding those made under "fair use" provisions of U.S.copyright legislation (U.S. Code, Title 17, Section 107), arerestricted. Contact the Florida Geological Survey for additionalinformation and permissions.