state of new hampshire pwblic utilities commission … and... · introduction please state your...
TRANSCRIPT
STATE OF NEW HAMPSHIRE
PWBLIC UTILITIES COMMISSION
In the Matter of: KevS~an Enerw Deliverv New Enpland Indirect Gas Costs
June 22,2007
Direct Testimony
George R. McCluskey Utility Analyst

INTRODUCTION
PLEASE STATE YOUR NAME AND BUSINESS ADDRESS.
My name is George McCluskey, and my business address is the New
Hampshire Public Utilities Commission ("NHPUC"), 21 South Fruit Street,
Suite 10, Concord, NH 03301.
WHAT IS YOUR POSITION WITH THE NHPUC?
I am a Utility Analyst within the Electricity Division of the NHPUC. I also
assis: the staff of the Gas & Water Division on gas-related policy issues.
HAVE YOU PREVIOUSLY TESTIFIED BEFORE THE COMMISSION ON
GAS-RELATED ISSUES?
Yes, on several occasions.
PLEASE DESCRIBE YOUR EDUCATION AND YOUR BUSINESS
EXPERIENCE.
I am a utility ratemaking specialist with over 20 years experience in utility
economics. I rejoined the NHPUC in March 2005 after working as a consultant
for La Capra Associates, a Boston-based consulting firm that specializes in
electric industry restructuring, wholesale and retail power procurement, and
market price and risk analysis. Prior to joining La Capra Associates, I directed
the electric utility restructuring division of the Commission and before that was
manager of least cost planning, directing and supervising the review and
implementation of electric utility least cost plans and demand-side management
programs. I have participated in electric and gas restructuring-related activities
in New Hampshire, Arkansas, Pennsylvania, California and Ohio. A copy of
my resume is included as Exhibit GRM-I.
Q. WHAT IS THE PURPOSE OF YOUR TESTIMONY IN THIS
PROCEEDING?
A. My testimony addresses two issues. First, I describe the results of Staffs
investigation of the KeySpan Energy Delivery New England ("KeySpan" or
"Company") leadllag study that underlies the current allowance for supply-
related cash working capital. This study was filed September 2006 in DG 06-
12 1. Second, I address an issue related to the calculation of the bad debt
percentage which governs the amount of bad debt expense recovered through
the Cost of Gas ("COG") rate. The currently effective bad debt percentage was
also derived in Docket DG 06-1 21.
16
17 Q. PLEASE EXPLAIN WHY YOU ARE ADDRESSING THESE ISSUES NOW,
18 ALMOST A YEAR AFTER THEY WERE FIRST RAISED IN DG 06-121.
19 A. In Order No. 24,688 (October 27,2006), the Commission stated that a COG
20 proceeding is an expedited process that does not provide an adequate
2 1 opportunity to examine changes in Keyspan's indirect gas costs. As a result,
22 the Commission approved on an interim basis a bad debt percentage agreed to
23 by Staff and the parties but indicated its intent to revisit the issue following

1 further investigation. Regarding the leadllag study, Staff recommended in a
2 report filed with the Commission on March 29,2007 that a docket be opened to
3 address the reasonableness of the study.
4 For these reasons, the Order of Notice issued April 10,2007 in this proceeding
5 identifies among other things Keyspan's bad debt percentage and leadlag study
6 as issues for investigation.
7
8 Q. THE RELATIONSHIP BETWEEN KEYSPAN'S RECONCILATION
9 CALCULATION AND ALLOWANCE FOR CASH WORKING CAPITAL
10 WAS ALSO IDENTIFIED IN THE ORDER OF NOTICE AS A POTENTIAL
11 ISSUE FOR THIS PROCEEDING. WHY DOES YOUR TESTIMONY NOT
12 ADDRESS THIS ISSUE?
13 A. The issue in question is the possible over collection of carrying costs on supply-
14 related cash working capital due to the interplay of two adjustments to the COG
15 rate: one to recoverlrepay monthly underlover collection balances and a second
16 to recover the allowance for cash working capital. The allowance for cash
17 working capital recovers the cost to finance the Company's supply-related cash
18 working capital.' A Staff report addressing this issue for KeySpan was filed
19 March 29,2007. A similar report addressing the same issue for Northern
20 Utilities was filed with the Commission on March 14,2006. Because the issues
-
' The level of capital to serve utility customers is not limited to net plant in service. The non-plant capital items are referred to as working capital and include inventories, prepayments, and the cash needed to support the timing differences between receipt of revenues from customers and payment of costs to suppliers (i.e., cash working capital). Supply-related cash working capital is the portion of cash working capital that relates to gas supply service.

in the Northern report have already been addressed at hearing in DG 07-033 and
a Commission decision is imminent, KeySpan informed Staff that it did not
intend raising any new arguments in this docket and that it planned on accepting
whatever decision the Commission issues in DG 07-033. For this reason, Staff
has decided not to repeat in this testimony the arguments made in its March 29
report. Instead, Staff incorporates the analysis contained in its March 29,2007
report as its testimony on this issue. Further, Staff reserves the right to file
supplemental testimony that is responsive to any KeySpan rebuttal testimony on
this issue..
LEADLAG STUDY
Net Lag
AS NOTED ABOVE, KEYSPAN IS AUTHORIZED TO COLLECT
THROUGH ITS COG RATE AN ALLOWANCE FOR SUPPLY-RELATED
CASH WORKING CAPITAL. HOW DOES KEYSPAN CALCULATE THIS
ALLOWANCE?
The amount of the allowance included in Keyspan's COG rate is a function of
the net lag between the receipt of gas supply revenues and the payment of gas
supply costs. The net lag proposed by KeySpan in DG 06-121 is based on a
leadlag study that uses the year 2005 as a reference base (2005 study).
Leadlag studies are used to analyze the lag time in days between the date
customers receive service and the date that customers' payments are available to
the utility. The 2005 study produced a total revenue lag of 60.28 days. This lag

is offset by a lead in days during which the utility receives supplies, but pays for
them at a later date. The 2005 study produced a total expense lead of 39.99
days, resulting in net lag (i.e., revenue lag minus expense lead) of 20.2 days.
Q. DO YOU HAVE ANY CONCERNS WITH THE CONCLUSION OF THE
2005 STUDY?
A. Yes, I have two major concerns. The first is that the 20.2 net lag days is an
increase of almost 80% on the 11.3 net lag days used by KeySpan to calculate
cash working capital prior to filing the 2005 study. Because the 1 1.3 net lag
results from a leadllag study submitted by KeySpan's predecessor, ENGI, in
Docket No. DR 91 -212, I refer to that study as the ENGI study.
The second concern is that the 20.2 days compares with net lags of 1.52 days for
National Grid; 6.33 days for Northern ~ t i l i t i e s ;~ and 13 days for Unitil Energy
Services. Absent a showing that these differences are attributable to factors that
distinguish KeySpan's service area from the others, these data indicate that
eithcr the Company's revenue collection processes and/or expense payment
procedures are out of step with those of other New Hampshire utilities.
Q. HAS THE COMPANY EXPLAINED THE INCREASE IN ITS NET LAG?
A. Even though the 2005 study proposed to increase the net lag by about 80%, it
was submitted without any accompanying testimony justifying the increase.
Northern contends that its net lag has increased to 10.26 days based on a 2006 reference year. Response to Staff 1-5, DG 07-72.

Revenue Lag
TO WHAT DO YOU ATTRIBUTE THE INCREASE IN THE NET LAG TO
20.2 DAYS?
As noted above, the net lag is calculated by subtracting the expense lead from
the revenue lag. My analysis indicates that the increase is largely the result of a
substantial increase in the revenue lag, which I discuss first. The change in the
expense lead is discussed later.
The revenue lag typically consists of four components:
A. Service lag; B. Billing lag; C. Collections lag; and D. Payment processing lag (including bank float)
Keyspan's 2005 study includes lags of 15.21 days from gas service to meter
reading (i.e., service lag); 1.51 days for meter reading to billing (i.e., billing
lag); 43.56 days from billing to collection (i.e., collections lag); and zero days
from collection to receipt of funds (i.e., payment processing lag). Considered
toge:her, these four components total 60.28 days. This compares with a revenue
lag of 43.4 days in the ENGI study.
Based on the assumption that the service and billing lags have not
changed significantly from one study to the next, which is a reasonable
assumption, the collections lag in the ENGI study is estimated to be 26.88 days.
This compares with 43.56 days in the 2005 study, a difference of 16.88 days.

Q. BEFORE YOU ASSESS THE CHANGE IN COLLECTIONS LAG, PLEASE
EXPLAIN HOW THE COMPANY DEVELOPED THE NEW ESTIMATE.
A. The collections lag represents the average time in days from the date bills are
issued to the date payments are made by customers. To calculate this lag,
KeySpan used a version of the accounts receivable turnover method. Under the
standard accounts receivable turnover method, the average of the end-of-month
accounts receivable balances for a representative period, usually twelve months,
is ~alculated.~ This average is then divided by the average daily revenue for the
same period to arrive at the number of days per month that billings have been
outstanding assuming daily billings equal average daily revenue. Since the goal
in this proceeding is to determine the average supply-related collections lag, the
accounts receivable balances and average daily revenue must be net of delivery
revenues.
The accounts receivable method used by KeySpan to calculate
collections lag differs from the standard method in a number of respects
including dividing each month's supply-related accounts receivable balance not
by the average daily revenue but by the average daily gas cost for the twelve
months ending that month. The resulting monthly collections lags were then
averaged over a thirteen month period to produce the average collections lag for
that period. The Company stated that it used gas costs instead of supply-related
revenue in the divisor because it assumed gas costs are equal to gas revenue.
The inclusion of twelve months of gas costs in the divisor was justified by
' The end-of-month accounts receivable balances are net of write-offs and represent the amount owed by customers at that time.

KeySpan on the ground that accounts receivable turnover method understates
the collections lag in periods of escalating costs, and overstates collections lag
in periods of declining costs. By employing the rolling twelve months of gas
costt in its calculation, Keyspan argued that its method better reflects trends in
gas costs.
Q. DO YOU AGREE THAT THE COMPANY'S METHOD IS AN
IMPROVEMENT OVER THE STANDARD METHOD?
A. No, for several reasons. First, my analysis does not support the assumption that
gas costs are equal to gas revenue. Using data from the Company's
reconciliation filings, I was able to confirm the twelve-month-ending firm gas
costs reported by KeySpan on page 7, column (a) of the leadllag study. Using
the same data sources, I obtained the corresponding twelve-month-ending
supply-related revenue. Exhibit GRM-2 shows that in every month of the
analysis period, supply-related revenue exceeds gas costs, in some months by as
much as $5 million. Accordingly, .I recommend that the use of gas costs as a
proxy for gas revenues be rejected.
Second, I disagree with Keyspan's use of rolling twelve month gas costs
to calculate monthly collections lags. The inclusion in the divisor of gas costs
associated with the previous twelve months creates a mismatch with the end-of-
month accounts receivable monthly balance in the numerator. This is because a
great majority of the revenues that make up accounts receivable balances relate

to accounts that have been outstanding for less than 30 days.4 Thus, if the
average gas price over the previous twelve months is significantly lower
(higher) than the average for the current month, the ratio of the accounts
receivable balance to the average daily revenue will overstate (understate) the
collections lag. For these reasons, I recommend that the use of rolling twelve
months of gas costs be rejected.
Third, I disagree with the adjustment that KeySpan has made to the
accounts receivable monthly balances in its version of the accounts receivable
turnover method. KeySpan adjusts those monthly balances for net write-offs
(i.e., gross write-offs less amounts collected that were previously written off)
instead of gross write-offs. This is inappropriate because once an account is
written-off it is no longer considered a receivable and the amounts written off
are booked to the write-off account. When a payment is recovered on a written
off account, the amount received is credited to the write-off account and the
write-off balance is reduced.
See Exhibit GRM-4, page 1, which shows that on average 55% of Keyspan's monthly accounts receivables in 2006 were outstanding for less than 30 days.
9

IS IT COMMON PRACTICE TO ADJUST ACCOUNTS RECEIVABLES
FOR NET WRITE-OFFS, AS KEYSPAN DID?
No, it is not. Northern, Unitil and National Grid adjust their accounts
receivables for gross write-offs when implementing the accounts receivable
turnover method.
DID YOU QUANTIFY THE EFFECTS OF THESE METHODOLOGICAL
DIFFERENCES?
Yes. Exhibit GRM-3 shows that using the standard accounts receivable
turncver method reduces the collections lag to 37.68 days, a difference of 5.88
days.
LEAVING ASIDE METHODOLOGICAL DIFFERENCES, ARE THERE
OTHER REASONS FOR THE LARGE INCREASE IN COLLECTIONS LAG.
Yes, I believe the increase of 16.88 days is explained in part by a decline in
revenue collections performance since KeySpan acquired ENGI. A decline in
collections performance will generally increase the average number of days
accounts are outstanding and increase the accounts receivable balances,
resulting in a longer revenue lag and more write-offs. The decline for KeySpan
is clearly reflected in the substantial increase in the percentage of billings
written off over the five year period ending 2005. As can be seen in Table 1,
net write-offs as a percentage of revenues increased from 1.3% in 2001 to 2.4%
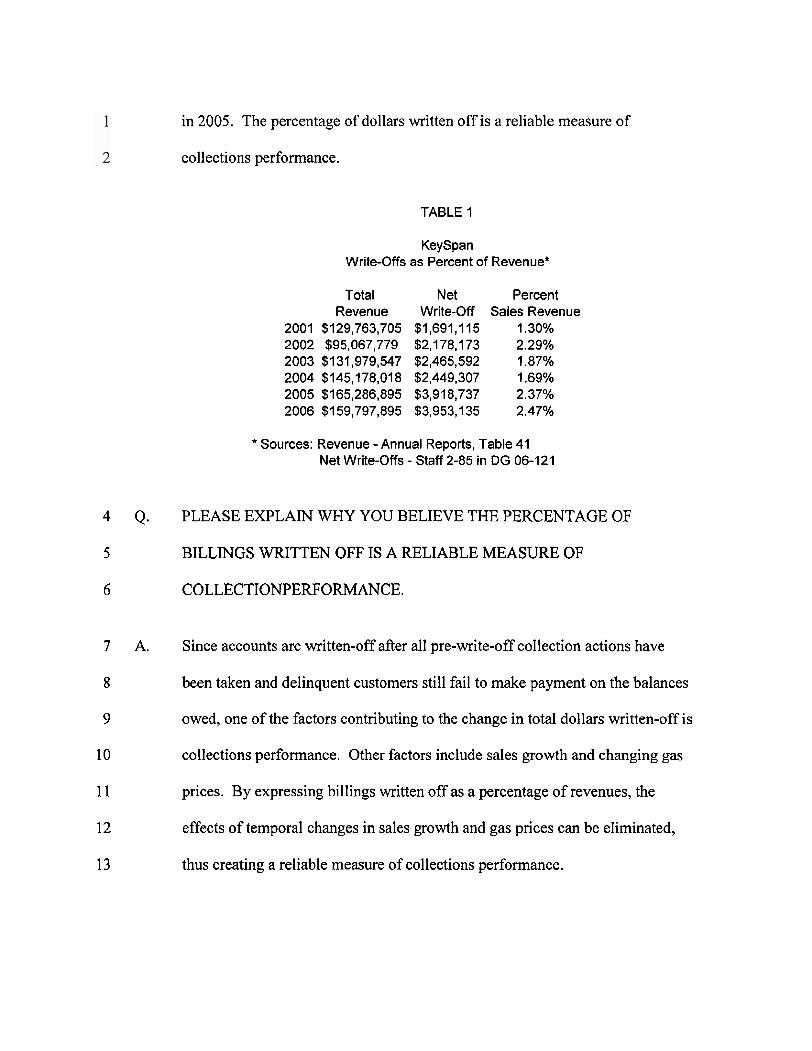
in 2005. The percentage of dollars written off is a reliable measure of
collections performance.
TABLE 1
KeySpan Write-offs as Percent of Revenue*
Total Revenue
2001 $129,763,705 2002 $95,067,779 2003 $131,979,547 2004 $145,178,018 2005 $165,286,895 2006 $1 59,797,895
Net Write-Off
$1,691,115 $2,178,173 $2,465,592 $2,449,307 $3,918,737 $3,953,135
Percent Sales Revenue
1.30% 2.29% 1.87% 1.69% 2.37% 2.47%
* Sources: Revenue - Annual Reports, Table 41 Net Write-offs - Staff 2-85 in DG 06-121
4 Q. PLEASE EXPLAIN WHY YOU BELIEVE THE PERCENTAGE OF
5 BILLINGS WRITTEN OFF IS A RELIABLE MEASURE OF
6 COLLECTIONPERFORMANCE.
7 A. Since accounts are written-off after all pre-write-off collection actions have
8 been taken and delinquent customers still fail to make payment on the balances
9 owed, one of the factors contributing to the change in total dollars written-off is
10 collections performance. Other factors include sales growth and changing gas
11 prices. By expressing billings written off as a percentage of revenues, the
12 effects o f temporal changes in sales growth and gas prices can be eliminated,
13 thus creating a reliable measure of collections performance.

HOW DOES KEYSPAN COMPARE TO OTHER NEW HAMPSHIRE
UTILITIES?
KeySpan has a higher percentage of write-offs to revenues than any other New
Harpshire utility. Table 2 shows that KeySpan wrote-off about 2.4% of total
revenue in 2005 and 2006 revenue. In comparison, Northern wrote-off about
0.9% of total revenue in 2005 and 2006. UES, National Grid and PSNH
performed even better, writing off only 0.2%, 0.5% and 0.3% respectively in
those years. These data indicate that while revenue collection tends to be a far
greater problem for gas companies than electric companies, the magnitude of
the problem for KeySpan is far greater than for Northern.
TABLE 2
New Hampshire Utilities Write-offs as Percent of Revenue
Net Net Write-Off Write-Off 2005 2006
KeySpan 2.37% 2.47% Northern 0.77% 0.98% Unitil 0.19% 0.18% National Grid 0.46% 0.50% PSNH 0.30% 0.34%
13 14 Q. ARE THERE OTHER INDICATORS OF POOR COLLECTIONS
15 PERFORMANCE?
16 A. Yes. An aging analysis of Keyspan's monthly accounts receivables shows that
17 17.6% of the average accounts receivable balance for 2006 relates to accounts
18 that were outstanding for more than 120 days. See Exhibit GRM-4, page 1.

This is far in excess of the corresponding percentages for Northern (2.6%),
PSNH (2.5%), National Grid (2.0%) and UES (1 .7%).5 See Exhibit GRM-4,
pages 2-5. Although these data indicate that KeySpan's 2006 collections
policies/processes were less effective than those of other utilities in improving
cash flow, and thereby reducing working capital requirements, additional data is
needed to determine whether the source of this sub-standard collections
performance is the collections processes or factors that distinguish Keyspan's
service area from others, such as unemployment or income 1evels;urban
population concentration, and meter accessibility issues. Service area
differences would tend to suggest that the problem is long standing and not
related to KeySpan's acquisition of ENGI. In order to answer this question,
Staff requested historical accounts receivable aging information covering the
period 2001 through 2006. Unfortunately, KeySpan was unable to provide the
requested data, claiming that such historical information was discarded because
of data storage limitations related to its customer information system.
WHAT IS THE EXPLANATION FOR KEYSPAN'S DECLINING
COLLECTION PERFORMANCE?
The reasons for the decline in collections performance are addressed in the
testimony of Staff witness Amanda Noonan filed in this docket.
Note that the PSNH percentage relates to accounts outstanding for more than 90 days instead of 120 days. This suggests that the percentage for accounts outstanding more than 120 days is less than 2.5%.

1 Q. PLEASE SUMMARIZE YOUR POSITION ON THE COLLECTIONS LAG.
2 A. I conclude that the collections lag of 43.56 days proposed by KeySpan is the
3 result of sub-standard leadllag methodology and ineffective collections
4 processes. Further, allowing KeySpan to base its cash working capital
5 requirement on a 43.56 days collections lag would send a message that it is
6 acceptable to have ineffective collections processes and that improvement in
7 this area is unnecessary. In my opinion, a reasonable collections lag for
8 KeySpan would be less than 37.68 days. In order to reflect the expected .
9 improvement in collections performance associated with Staffs
10 recommendation on Keyspan's bad debt percentage, which I address in the next
11 section of this testimony, I recommend a collections lag of 35.68 days. Adding
12 to this collections lag a 15.21 days service lag and a 1.5 1 days billing lag results
13 in a revenue lag of 52.40 days.
14 3. Expense Lead
15 Q. YOU STATED ABOVE THAT THE 2005 STUDY PRODUCED AN
16 EXPENSE LEAD OF 39.99 DAYS. HOW DOES THAT COMPARE TO THE
17 EXPENSE LEAD IN THE ENGI STUDY?
18 A. The ENGI Study produced a lead of 38.1 days for firm gas supply costs, a small
19 change of 1.9 days.
HOW DID THE COMPANY CALCULATE THE EXPENSE LEAD IN THE
2005 STUDY?
KeySpan purchases gas supplies from about a dozen gas suppliers under
contracts that contain different payment arrangements. In addition, KeySpan
operates a hedging program that generates profits or losses depending on
changes in market prices. These profits/losses are generally receivedpaid
within a few days following the end of a month. KeySpan also assigns the
rights to a portion of its capacity to non-grandfathered transportation customers,
who in return compensate the Company for the associated capacity costs. These
capacity payments are due 20 days following the end of each month. Using the
2005 costs and leads under each contract, the Company calculated a weighted
expense lead of 39.99 days.
DO YOU HAVE ANY CONCERNS WITH THE COMPANY'S
CALCULATION?
No, the calculation seems reasonable. Subtracting an expense lead of 39.99
days from a revenue lag of 52.40 days produces a net lag of 12.41 days.
BAD DEBT PERCENTAGE
WHAT IS THE TRADITIONAL RATEMAKING TREATMENT OF BAD DEBT EXPENSE?
An amount for bad debt (i.e. the net write-off of accounts receivables) has
traditionally been embedded in base rates, with no cost reconciliation between
rate cases. In KeySpan Docket No.DG 00-063, however, the gas supply portion

of this amount was unbundled from base rates and recovered through the COG
rate.
HOW WAS THE BAD DEBT COMPONENT OF THE CURRENTLY
EFFECTIVE COG RATE CALCULATED?
The amount of bad debt costs included in the COG rate each period is calculated
as the product of a fixed bad debt percentage and gas supply costs for the
period. Under this approach, KeySpan's opportunity to recover bad debt
expense rises and falls with total gas costs. In Docket DG 06-121, KeySpan's
original filing proposed a new bad debt percentage of 3.536% calculated by
dividing the 2005 supply-related bad debt cost of $4.192 million by direct gas
costs of $1 18.574 million for the same period. The 2005 bad debt cost in the
original filing included costs related to prior years, which when removed
resulted in a 2005 supply-related bad debt cost of $3.536 million. Based on this
adjusted bad debt cost, KeySpan filed a revised bad debt percentage of 2.98%.
Becbilse Staff and the parties could not reach agreement on an appropriate
percentage, a figure of 2.57% was recommended to the Commission pending
further investigation.
IS THE BAD DEBT COST INCLUDED IN THE COG RATE FULLY
RECONCILABLE?
Not quite. Because the amount included in the COG rate is based on a fixed bad
debt percentage, the amount collected at any time may underlover collect the

actual bad debt expense. The Company can, however, propose a change in the
bad debt percentage at any time.
DO fOU HAVE ANY CONCERNS REGARDING THE CALCULATION OF
THE BAD DEBT PERCENTAGE?
Yes, I have several. First, the $3.536 million cost that KeySpan used to
calculate its proposed percentage is not the supply-related portion of the actual
net write-off in 2005. That figure is much smaller at around $2.8 million. The
$3.536 million cost is in fact the supply-related portion of the uncollectible
accounts expense, which the Company developed for financial reporting
purposes and is an estimate of the amount that will be written-off during 2005
and after 2005 that relates to consumption in 2005. Accordingly, because the
uncollectible accounts expense was not recorded in 2005, it cannot be used to
develop a rate supposedly based on 2005 costs and expenses.
WHAT WOULD THE PERCENTAGE HAVE BEEN HAD TEST YEAR
EXPENSES BEEN USED?
Using the supply-related portion of the actual net write-off in 2005 would result
in a bad debt percentage of about 2.37%, which compares with the Company's
proposed 2.98% .
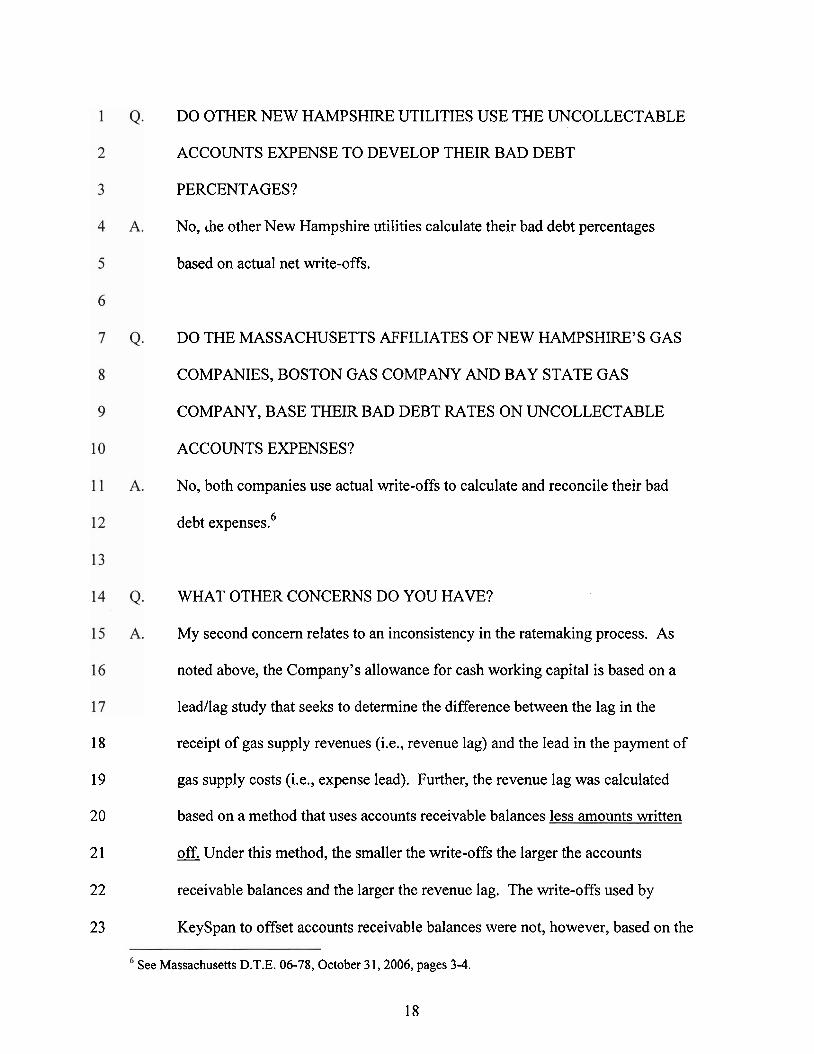
DO OTHER NEW HAMPSHIRE UTILITIES USE THE UNCOLLECTABLE
ACCOUNTS EXPENSE TO DEVELOP THEIR BAD DEBT
PERCENTAGES?
No, he other New Hampshire utilities calculate their bad debt percentages
based on actual net write-offs.
DO THE MASSACHUSETTS AFFILIATES OF NEW HAMPSHIRE'S GAS
COMPANIES, BOSTON GAS COMPANY AND BAY STATE GAS
COMPANY, BASE THEIR BAD DEBT RATES ON UNCOLLECTABLE
ACCOUNTS EXPENSES?
No, both companies use actual write-offs to calculate and reconcile their bad
debt expenses.6
WHAT OTHER CONCERNS DO YOU HAVE?
My second concern relates to an inconsistency in the ratemaking process. As
noted above, the Company's allowance for cash working capital is based on a
leadllag study that seeks to determine the difference between the lag in the
18 receipt of gas supply revenues (i.e., revenue lag) and the lead in the payment of
19 gas supply costs (i.e., expense lead). Further, the revenue lag was calculated
20 based on a method that uses accounts receivable balances less amounts written
2 1 - off. Under this method, the smaller the write-offs the larger the accounts
22 receivable balances and the larger the revenue lag. The write-offs used by
23 KeySpan to offset accounts receivable balances were not, however, based on the p~ --
See Massachusetts D.T.E. 06-78, October 3 I , 2006, pages 3-4.
18

1 uncollectible accounts expense estimate used to develop the bad debt
2 percentage. Instead, the accounts receivable balances were adjusted for actual
3 write-offs. The use of actual write-offs to develop the revenue lag and
4 uncoilectible accounts expense to develop the bad debt percentage is to the
5 Company's financial advantage because it improves cash flow.
6
7 Q. WHAT DO YOU RECOMMEND?
8 A. Generally, a utility's bad debt percentage should be based on actual net write-
9 offs rather than the uncollectible accounts expense. In Keyspan's case,
10 however, the use of actual net write-offs would not provide an incentive to
improve collection performance. Using net write-offs would simply flow the
costs of the Company's sub-standard collection practices through to paying
customers. Accordingly, I recommend that KeySpan be allowed to collect only
a percentage of the amount actually written off in 2005. Expressed as a
percentage of 2005 revenue, a reasonable percentage for KeySpan would be
1.54%. This is double Northern's 2005 percentage of 0.77% but less than
KeySpan's actual 2005 percentage of 2.37%. Assuming Keyspan responds
positively to this incentive, the impact on its bottom line could be substantially
mitigated.
Q. DOES THIS CONCLUDE YOUR TESTIMONY?
A. Yes.

EXHIBIT GRM- 1
GEORGE R. McCLUSKEY
NEW HAMPSHIRE PUBLIC UTILITIES COMMISSION
Utility Analyst
George McCluskey is a ratemaking specialist with over 20 years experience in utility economics.
Since rejoining the New Hampshire Public Utilities Commission ("NHPUC.") in 2005, he has
worked on default service and standby rate issues in the electric sector and cost allocation issues
in the gas sector. While at La Capra Associates, a Boston-based consulting firm specializing in
electric industry restructuring, wholesale and retail power procurement, market price and risk
analysis, and power systems models and planning methods, he provided strategic advice to
numerous clients on a variety of issues. Prior to joining La Capra Associates, Mr. McCluskey
directed the electric utility restructuring division of the NHPUC and before that was manager of
least cost planning, directing and supervising the review and implementation of electric and gas
utility least cost plans and demand-side management programs. He has testified as an expert
witness in numerous electric and gas cases before state and federal regulatory agencies.
ACCOMPLISHMENTS
Recent project experience includes:
Staff of the New Hampshire Public Utilities Commission - Expert testimony before NHPUC regarding integrated resource planning in proceedings involving KeySpan and Public Service Company of New Hampshire.
Staff of the New Hampshire Public Utilities Commission - Expert testimony before NHPUC regarding default service design and pricing issues in case involving Unitil Energy Systems.
Staff of the New Hampshire Public Utilities Commission - Expert testimony before Maine Public Utilities Commission regarding interstate allocation of natural gas capacity costs in case involving Northern Utilities.
Staff of the Arkansas Public Sewice Commission - Analysis and case support regarding Entergy Arkansas Inc.'s application to transfer ownership and control of its transmission assets to a Transco. Also analyzed Entergy Arkansas Inc.'s stranded generation cost claims.
Massachusetts Technology Collaborative - Evaluated proposals by renewable resource developers to sell Renewable Energy Credits to MTC in reponse to 2003 RFP.
Pennsylvania Office of the Consumer Advocate - Analysis and case support regarding horizontal and vertical market power related issues in the PECOAJnicom merger proceeding. Also advised on cost-of-service, cost allocation and rate design issues in FERC base rate case for interstate natural gas pipeline company.
Staff of the New Hampshire Public Utilities Commission - Expert testimony before the NHPUC regarding stranded cost issues in Restructuring Settlement Agreement submitted by Public Service Company of New Hampshire and various settling parties. Testimony presents an analysis of PSNH's stranded costs and makes recommendations regarding the recoverability of such costs.
Town of Waterford, CT - Advisory and expert witness services in litigation to determine property tax assessment of for nuclear power plant.
Washington Electric Cooperative, Vt - Prepared report on external obsolescence in rural distribution systems in property tax case.
New Hampshire Public Utilities Commission - Expert testimony on behalf of the NHPUC before the Federal Energy Regulatory Commission regarding the Order 888 calculation of wholesale stranded costs for utilities receiving partial requirements power supply service.
Ohio Consumer Council - Expert testimony regarding the transition cost recovery requests submitted by the AEP companies, including a critique of the DCF and lost revenues approaches to generation asset valuation.
EXPERIENCE
New Hampshire Public Utilities Commission (2005 to Present) Utility Analyst, Electricity Division
La Capra Associates (1999 to 2005) Senior Consultant

New Hampshire Public Utilities Commission (1987 - 1999) Director, Electric Utilities Restructuring Division Manager, Lease Cost Planning Utility Analyst, Economics Department
Electricity Council, London, England (1977-1984) Pricing Specialist, Commercial Department Information Officer, Secretary's Office
EDUCATION:
Ph.D. candidate in Theoretical Plasma Physics, University of Sussex Space Physics Laboratory. Withdrew in 1997 to accept position with the Electricity Council.
B.S., University of Sussex, England, 1975. Theoretical Physics

KeySpan Comparison of Gas Costs
and Revenues
EXHIBIT GRM-2
Actual Gas Deferred Gas Total Firm TME Actual Costs Costs Gas Costs Gas Costs
Jan-04 $1 9,862,340 $1 9,862,340 $1 9,862,340 Feb-04 $12,681,513 $12,681,513 $32,543,853 Mar-04 $10,025,527 $10,025,527 $42,569,380 Apr-04 $6,083,805 $6,083,805 $48,653,185 May-04 $3,069,817 $460,578 $3,530,395 $52,183,580 Jun-04 $2,723,646 $438,533 $3,162,179 $55,345,759
N Jul-04 $2,336,210 $504,734 $2,840,944 $58,186,703
o Aug-04 $2,178,077 $473,774 $2,651,851 $60,838,554 Sep-04 $2,172,127 $472,937 $2,645,064 $63,483,618 Oct-04 $5,080,922 $472,472 $5,553,394 $69,037,012 NOV-04 $8,674,360 $8,674,360 $77,711,372 Dec-04 $1 5,777,101 $1 5,777,101 $93,488,473 Jan-05 $17,938,217 $17,938,217 $91,564,350 Feb-05 $14,572,489 $14,572,489 $93,455,326 Mar-05 $1 3,100,373 $13,100,373 $96,530,172 Apr-05 $5,924,511 $5,924,511 $96,370,878 May-05 $4,501,473 $513,669 $5,015,142 $97,855,625 Jun-05 $2,899,510 $489,485 $3,388,995 $98,082,441 Jul-05 $2,734,362 $488,358 $3,222,720 $98,464,217
Aug-05 $2,171,422 $488,812 $2,660,234 $98,472,600 Sep-05 $3,281,445 $483,624 $3,765,069 $99,592,605 Oct-05 $7,124,375 $490,377 $7,614,752 $1 01,653,963 NOV-05 $1 3,097,244 $13,097,244 $1 06,076,847 Dec-05 $20,823,227 $20,823,227 $1 11,122,973
Collected Gas Collected Gas Costs with Costs wlo Total Collected TME Firm interest interest Gas Costs Collected Cost
$15,598,123 $989,202 $16,587,325 $18,661,235 $1,141,617 $19,802,852 $13,608,880 $815,475 $14,424,355 $9,540,558 $594,215 $10,134,773 $4,330,156 $281,078 $4,611,234 $2,533,638 $1 57,644 $2,691,282 $2,032,335 $111,811 $2,144,146 $2,007,510 $103,818 $2,111,328 $2,079,780 $106,921 $2,186,701 $2,809,760 $152,155 $2,961,915 $6,086,688 $338,530 $6,425,218
$1 0,942,088 $588,644 $1 1,530,732 $95,611,861 $1 6,902,486 $922,383 $17,824,869 $96,849,405 $17,655,061 $971,150 $18,626,211 $95,672,764 $1 5,392,850 $842,747 $16,235,597 $97,484,006 $1 1,078,288 $575,395 $1 1,653,683 $99,002,916 $6,693,766 $207,141 $6,900,907 $101,292,589 $4,265,445 $4,265,445 $1 02,866,752 $2,410,054 $2,410,054 $1 03,132,660 $2,072,653 $2,072,653 $1 03,093,985 $2,552,052 $2,552,052 $1 03,459,336 $3,576,679 $3,576,679 $104,074,100 $8,842,166 $8,842,166 $106,491,048
$1 8,353,237 $1 8,353,237 $1 13,313,553
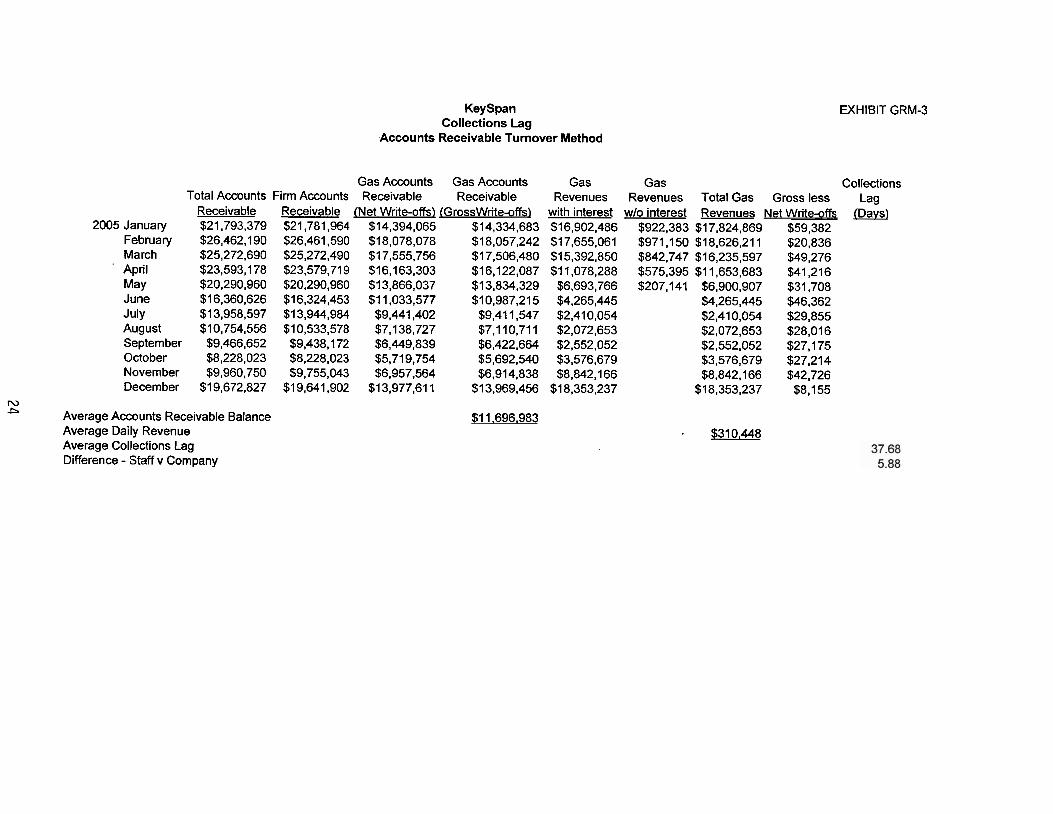
KeySpan Collections Lag
Accounts Receivable Turnover Method
EXHIBIT GRM-3
Gas Accounts Gas Accounts Gas Gas Collections Total Accounts Firm Accounts Receivable Receivable Revenues Revenues Total Gas Gross less Lag
Receivable Receivable (Net Write-offs) (Grosswrite-offs) with interest wlo interest Revenues Net Write-offs (Davs) 2005 January $21,793,379 $21,781,964 $14,394,065 $14,334,683 $1 6,902,486 $922,383 $1 7,824,869 $59,382
February $26,462,190 $26,461,590 $1 8,078,078 $1 8,057,242 $1 7,655,061 $971 ,I 50 $1 8,626,211 $20,836 March $25,272,690 $25,272,490 $1 7,555,756 $1 7,506,480 $1 5,392,850 $842,747 $1 6,235,597 $49,276 April $23,593,178 $23,579,719 $16,163,303 $1 6,122,087 $1 1,078,288 $575,395 $1 1,653,683 $41,216 May $20,290,960 $20,290,960 $13,866,037 $13,834,329 $6,693,766 $207,141 $6,900,907 $31,708 June $1 6,360,626 $16,324,453 $1 1,033,577 $10,987,215 $4,265,445 $4,265,445 $46,362 July $1 3,958,597 $1 3,944,984 $9,441,402 $9,411,547 $2,410,054 $2,410,054 $29,855 August $10,754,556 $1 0,533,578 $7,138,727 $7,110,711 $2,072,653 $2,072,653 $28,016 September $9,466,652 $9,438,172 $6,449,839 $6,422,664 $2,552,052 $2,552,052 $27,175 October $8,228,023 $8,228,023 $5,719,754 $5,692,540 $3,576,679 $3,576,679 $27,214 November $9,960,750 $9,755,043 $6,957,564 $6,914,838 $8,842,166 $8,842,166 $42,726 December $1 9,672,827 $1 9,641,902 $1 3,977,611 $1 3,969,456 $1 8,353.237 $1 8,353,237 $8,155
TU * Average Accounts Receivable Balance $1 1,696.983 Average Daily Revenue $31 0,448 Average Collections Lag Difference - Staff v Company

2006 January February March April May June July August September October November December Annual Avg Percent
KeySpan Accts Receivable Aging Analysis*
0-30 121+ Total
EXHIBIT GRM-4 Page 1 of 5
* Source: Docket DG 07-050, Response to Staff 1-1 1.

EXHIBIT GRM-4 Page 2 of 5
2006 January February March April May June July August September October November December Annual Avg . Percent
Northern Accts Receivable Aging Analysis*
0-30 121+ Total
* Source: Docket DG 07-033, Response to Staff 1-1 7.

PSNH Accts Receivable Aging Analysis*
EXHIBIT GRM-4 Page 3 of 5
0-30 90+ Total
2006 Annual Avg $97.1 36.1 53 $2.957.000 $1 17,245,006 Percent 82.85% 2.52%
* Source: Personal mCommunication, S Hall, 6/19/07.

EXHIBIT GRM-4 Page 4 of 5
2006 January February March April May June July August September October November December Annual Avg Percent
National Grid Accts Receivable Aging Analysis*
0-30 121+ Total
Source: Docket DG 07-012, Responses to Staff 1-4.

2006 January February March April May June July August September October November December Annual Avg Percent
UES Accts Receivable Aging Analysis*
0-30 121 + Total
EXHIBIT GRM-4 Page 5 of 5
Source: Docket DG 07-059, Responses to Staff 1-12.