state of new mexico state investment council
TRANSCRIPT

State of New Mexico
STATE INVESTMENT COUNCIL 41 Plaza La Prensa
Santa Fe, New Mexico 87507
Phone: (505) 476-9500
Fax: (505) 424-2510 \
August, 2021
FY 2022 Annual Investment Plan
Introduction
It is with pleasure that we present the fiscal year 2022 Annual Investment Plan. This year’s plan is the
tenth iteration of investment plans written since fiscal year 2013.
The investment plan uses a 7-10 year forward horizon in the development of the outlook for the economy,
financial markets, and for the development of longer term investment themes and strategies. It is written
with a ranging readership in mind. We focus discussion on the largest of economic and financial market variables -- economic growth, inflation, interest rates and the basic investment markets of stocks and
bonds -- with as little industry terminology and jargon as possible. Financial analysis is limited to the two
large permanent funds, the Land Grant Permanent Fund and the Severance Tax Permanent Fund, and data is simplified into easy-to-read tables. Investment plans for the individual asset classes are presented in a
structured format, to ease understanding of expected investment activity across the full portfolio for the
fiscal year.
This work is the organized accumulation of investment knowledge, thought and input across as many fund
fiduciaries as possible: the Council, the Council investment committee, the investment office management
group and investment staff, external investment consultants and external investment managers. It has the purpose of transparency of our investment process as a lead objective, and seeks to be informative, and
educational where possible.
Executive Summary
The pandemic-forced shutdown of economies worldwide in early 2020 led to one of the deepest, albeit
shortest, recessions ever. Massive economic stimulus and support from governments and central banks
worldwide halted the slide in both economic and financial markets and created a powerful snapback over
the last year. The massive money printing and run up in public debts required, however, have left new uncertainty in the forward 7-10 year outlook period. The Council continues to expect lower than average
economic growth and lower than average investment returns for the forward-looking period, and feels there
is increased uncertainty around inflation/deflation. Investment strategy remains roughly consistent with prior year thinking. Within this environment, the LGPF is expected to grow in value at about a 2.6% annual
rate over the outlook period, with distributions growing at a higher 4.6% annual rate. The STPF is expected
to grow at about a 1.4% annual rate with roughly similar growth in distributions. Modest changes are made
to implementation at the asset class level from last year’s report are detailed in Part III.
STEVEN K. MOISE STATE INVESTMENT OFFICER
ROBERT “VINCE” SMITH, CFA DEPUTY STATE INVESTMENT OFFICER
CHIEF INVESTMENT OFFICER
MICHELE LUJAN GRISHAM GOVERNOR

FY 2022 Annual Investment Plan
FY 2022 Annual Investment Plan Page 2
Part I: Expected Macroeconomic & Investment Environment and Broad
Investment Strategy
Macroeconomic and Investment Environment
A little more than eighteen months on from the initial news of a growing global pandemic, we find the
global economy continuing in recovery mode. Pandemic-related economic and social shutdowns plunged the global economy into one of the steepest declines in economic output we’ve experienced in modern times
during the spring of 2020. Mainly due to a massive financial response from governments and global central
banks, the plunge was short lived. Most economies are not yet back to their peak outputs and disruptions to global commerce and supporting supply chains continue to be repaired, but here in the summer of 2021
as economic and social restrictions continue to fade, vaccination rates steadily rising globally, and the
pandemic hopefully on the downhill slope, the global economy continues in recovery mode.
The enormous financial response by governments and the global central banks had predicable results in
primary economic metrics in addition to rebounding output. Public debt has exploded in size globally.
These debts were primarily financed by the central banks causing central bank balance sheets to balloon. The massive money printing required to get these resources into the economy in a usable way caused a
tremendous expansion of fiat-currency money supply relative to real goods, services and assets. This
expansion fed a great reflation in financial markets which have more than recovered and sit at very high levels of valuation. Inflation is spilling over into consumer prices and concerns mount as to how far up
prices for basic living goods and services will rise and over what time frame.
Clearly, all of this leaves us with more questions and concerns than answers and comforts in terms of the outlook for the investment environment over our 7-10 year forward outlook period. Pre-pandemic, financial
market valuations were high relative to long-term history; public debt loads were approaching levels that
historically have been hard for governments to manage; central bank balance sheets were already large relative to the size of the economies they support compared to longer history; demographics had been
weighing on output growth rates. With the exception of immutable demographics, the financial response
to the pandemic has exacerbated these difficult conditions and raise our level of concern regarding the outlook for the investment environment over the next decade.
Economic Implications
Growth--The Council continues to expect low rates of economic growth in the U.S. and globally, with
limited potential to surprise to the upside and worrisome potential to surprise to the downside.
While economies globally are presently moving along at “recovery” growth levels, the economic
forecasting services that we use expect that growth rates will fall back to low pre-pandemic levels in the nearer-term future. In the U.S., the current congress is debating another hugely-deficit-spend budget that
if passed in anywhere near the current form would extend above-average growth rates for a while longer,
but at some point – and certainly within our outlook period – real growth rates look likely to return to being
governed by growth in the workforce and productivity growth, pushed or hindered in shorter periods by changes in interest rates, tax policy, credit creation and other cyclical factors.

FY 2022 Annual Investment Plan
FY 2022 Annual Investment Plan Page 3
In the U.S., the National Bureau of Economic Research, responsible for marking the beginnings and ends
of expansions and contractions in the U.S. economy, called February 2020 the peak of U.S. economic activity (and the end of the expansion begun in June 2009) and April 2020 as the trough (ending the
contraction and beginning the next expansion). This was the shortest contraction on record since the first
contraction identified (June 1857 to December 1858). Post the Great Depression, contractions in the U.S. have averaged eleven months and ranged from six to eighteen months. This is important to note as
contractions, as painful as they are to people, typically do a great deal in correcting economic excesses in
credit creation, spending and output, asset values and other economic speculations that tend to exist near/at
the end of expansions, setting the economy up to advance again but from a more stable base. In this case, the contraction wasn’t driven by the usual economic forces that tip an economy into contraction, but indeed
by necessary reactions to the pandemic. The financial counterbalance to the lockdowns and other pandemic
responses have exacerbated problems that were building in the economy (paragraph two in the section above) and leave us with less-sure footing rather than the more-sure footing a typical contraction provides.
Hence our expectation of low rates of economic growth in the U.S. and globally on average over the outlook
period, with limited potential to surprise to the upside and worrisome potential to surprise to the downside.
Inflation—The Council continues to expect that the danger of deflation is at least as great as the potential
for excess inflation.
The topic of inflation is the “hottest” of economic discussions today. In the U.S., the federal reserve and
the Biden administration have been stressing that the recent pickup in consumer price inflation is
“transitory” and a function of the economy emerging from the pandemic shutdowns. They’ve generally been “reserved” in commentary regarding inflation of asset prices. Others maintain a viewpoint that the
massive increase in the money supply from the financial side of the pandemic response relative to the stock
and current production rate of goods and services will require inflation that is more than “transitory” to
resolve, and that inflated asset prices portend lower returns than average from those assets going forward.
In terms of inflation impacts historically, the economy and financial markets in the U.S. have been able to
withstand inflation up to about 4-5% annually for short periods. Above that level, a recession was sure to follow, typically as the Fed raised rates to counter and tipped the economy over into recession. There was
a longer period from late 1982 to early 1991 where CPI inflation ran 4-5% and the Fed was fairly stable on
rates. The economy went into recession in 1991 ostensibly due to an oil-price shock brough on by Iraq’s invasion of Kuwait, or the period might have been longer. Back then, however, longer term “real” interest
rates (the yield on the 10-year Treasury note minus the rate of inflation) were very positive – Treasury
yields were between 3.5% and 8.0% above the rate of inflation. Today, real yields are negative by about
2.50% (10-year Treasuries around 1.25% minus inflation around a 3.5-4.0% run rate). It is difficult to imagine the bond market remaining at 1.25% for very long if inflation stuck at 4-5%; and a jump in Treasury
rates would almost for sure trigger deflationary forces, bringing down the stock market and pushing the
economy into recession.
But that discussion is more shorter-term focused, and our outlook period is 7-10 years. Over the full period,
as we argued last year in the Annual Investment Plan, we’re at least as concerned about deflationary pressures as we are inflationary pressures. Very high debt loads, an extended credit cycle, demographic
headwinds creating low potential rates of economic growth, high valuations on assets, very low interest
rates and negative real interest rates is a mix that has been concerning for some time, has recently gotten
worse, and could turn deflationary in a hurry.

FY 2022 Annual Investment Plan
FY 2022 Annual Investment Plan Page 4
Interest Rates—Technically, interest rates are a “financial market” but we upgrade them to “economic
factor” due to their pervasive effects on many other financial markets and the economy as a whole.
As we did last year, we expect interest rates to rise modestly over the horizon, but with a very much back-
end loaded pattern. The Fed continues to expect low/zero short term rates for at least the next year, though the recent uptick in inflation (as discussed) has softened that expectation. As discussed above, very high
debt loads, an extended credit cycle, demographic headwinds holding back economic growth and high
valuations on assets is a mix that will be very sensitive to any sustained uptick in rates, and would likely
bring painful deflationary pressures to push rates back down if rates did make a meaningful rise.
Financial Market Implications
We follow several firms who routinely produce detailed, longer-term financial market return expectations
(Capital Market Assumptions, or CMAs), including our general investment consultant RVK. CMA
revisions, since about 2014, have mainly been in one direction—down. Increasingly, highly valued equity markets and low and falling bond yields force the financial models used to create CMAs to lower and lower
forecasts.
Our highest-probability scenario is that weak economic results and high market valuations will be the main deterrent to achieving historically normal or above-normal market return results over the forecast period.
Very low government bond yields will anchor cash yields from all investment types at below-average
levels, though we do expect some widening of credit spreads from present levels, which if realized, may ease the pain to a degree over the period. The lack of ability for interest rates to fall much further will likely
limit multiple expansion in the equity markets, which has been a primary driver of equity returns since
around 2014. Once interest rates do start to move up—forecasted toward the later part of the forecast
period, equity multiples are likely to run into trouble, along with equity prices and returns.
Institutional investors and other market participants and observers have talked of a “low return
environment” since around the time of the GFC. That had roughly played out with respect to the U.S. stock market since the equity market peak in 2007 through about 2016, but then, falling interest rates, Fed balance
sheet activity, fiscal deficit-spending and other liquidity-producing policies pushed stocks to huge
valuations and raising returns. But the economic headwinds as described, today’s near-zero interest rates across the yield curve, and historically stratospheric equity valuations undeniable paint the picture of a low
return environment for the coming forecast period.
Broad Investment Strategy
In last year’s plan (2021 Annual Investment Plan), our broad strategy for the forward-looking 7-10 years
was communicated as below:
Investment strategy, in light of our odd current situation and facing the fundamentals as detailed earlier
for the coming 7-10 year planning horizon should be a rough continuance of the present strategy:
1. Continue to be cautious of the U.S. stock market and risk assets generally. Valuations are clearly
very high and seemingly dependent on Fed liquidity and ultra-low interest rates to support earnings
multiples. A recessionary economy is not supportive of present valuations and the outlook for

FY 2022 Annual Investment Plan
FY 2022 Annual Investment Plan Page 5
growth over the next 7-10 year period is muted. The fundamentals that support sustainably higher
stock prices generally are: a. Strong economic growth/corporate profit growth
b. Stable inflation in the 2-4% range
c. Low and stable or falling interest rates d. Tax cuts, deregulation
e. Loose monetary conditions
Of this list we are expecting only low and (relatively) stable interest rates and loose monetary
conditions. Over the full 7-10 year horizon, the remainder we would suggest have a low probability of occurring.
2. Liquidity and flexibility remain important. Risk markets are priced for Late Cycle/strong
fundamentals, and could change to reflect fundamental reality at any time. 3. In a low (ultra-low at present) interest rate environment, income has increased value. Assets
which produce little to no income are at much higher risk of price volatility than are assets which
produce significant income as a percentage of their total rate of return. 4. Strategy shift: reduce “core” fixed income assets when appropriate. At present levels of interest
rates, core fixed income assets—generally government bonds and high-grade corporate bonds—
have little attractiveness relative to other income-producing assets. The magnitude of reduction
needs to be balanced against item #2 above, liquidity provision. “When appropriate” might
ideally mean in a risk market sell-off.
Our current situation argues for caution.
1. Continue to be cautious of the U.S. stock market and risk assets generally. Valuations are
clearly very high and seemingly dependent on Fed liquidity and ultra-low interest rates to support earnings multiples – this is as true today as it has been over the past five years.
2. Liquidity and flexibility remain important. We saw from the spring of last year just how
important liquidity and financial flexibility is in times like these.
3. In a low (ultra-low at present) interest rate environment, income has increased value. Assets which produce little to no income are at much higher risk of price volatility than are assets which
produce significant income as a percentage of their total rate of return.
4. Reduce “core” fixed income assets when appropriate. We continue to look for opportunities to
reduce expected poor-returning core fixed income assets in more productive ways.

FY 2022 Annual Investment Plan
FY 2022 Annual Investment Plan Page 6
Part II: Outlook for the Land Grant and Severance Tax Permanent Funds
The Land Grant Permanent Fund
Portfolio Value
The financial model developed by the Council and consultant RVK for the Land Grant Permanent Fund
(LGPF) projects the LGPF will grow by roughly $6.4 billion over the 7-10 year investment horizon, an annualized increase of 2.6%. This projection is based upon the long-term assumptions for investment
return, assumptions about New Mexico State Land Office contributions and the constitutional distribution
policy used in the 25-year Intergenerational Equity model for the LGPF. Given the increased uncertainty in the economy and the financial markets, these figures should only be used as a guide.
Distributions Using the same long-term (25-year Intergenerational Equity model) assumptions, annual distributions
from the LGPF are expected to rise to roughly $480 million dollars by the end of the 7-10 year investment
horizon. This equates to an annualized growth rate of about 4.6%. Again, the same cautions as above
apply.

FY 2022 Annual Investment Plan
FY 2022 Annual Investment Plan Page 7
The Severance Tax Permanent Fund
Portfolio Value
The Severance Tax Permanent Fund (STPF) is also modeled in this manner, but the results are less encouraging. The STPF is projected to grow by roughly $700 million over the investment horizon, an
annualized increase of 1.4%. This projection is based upon the long-term assumptions for investment
return, inflows from severance tax receipts, and the distribution policy used in the 25-year Intergenerational
Equity model for the STPF. Given the increased uncertainty in the economy and the financial markets, these figures should only be used a s a guide.
Distributions Using the same long-term (25-year Intergenerational Equity model) assumptions, distributions from the
STPF are expected to rise to $280 million by the end of the 7-10 year investment horizon. Again, the
same cautions as above apply.

FY 2022 Annual Investment Plan
FY 2022 Annual Investment Plan Page 8
Part III: Asset Class Plans
Public Markets: Equity
Asset Class Summary—The publicly traded equity portfolio is the cornerstone investment of the Permanent
Funds and the most liquid of the major allocations within the Funds. The role of this portfolio is to generate
meaningful real returns through long-term capital appreciation and dividend income.
Equity exposure is achieved through a combination of low-cost passive investment and targeted active
management. In more efficient markets, such as US large-cap stocks, the focus is increasingly on capturing market returns through the use of low-cost index strategies. In less efficient areas, such as emerging markets
and small-cap stocks, greater focus is given to identifying skilled active managers that we believe can
achieve superior risk-adjusted returns.
The public equity asset class has a target allocation of 40% of Land Grant Permanent Fund and Severance
Tax Permanent Fund total assets, with current US and ex-US target allocations of 20% each, or 50% of
public equity assets each. The Council’s 50% US target allocation is 5.9% lower than the global equity benchmark MSCI ACWI IM Index of 55.9% US and 44.1% ex-US. As of June 30th, 2021, the current public
equity allocation was 51.5% US and 48.5% ex-US, resulting in a 1.5% overweight to the US target
allocation and a 4.4% underweight to the global equity benchmark.
The table below shows the actual and target allocations of the public equity portfolio.
Portfolio strategy, markets, and recent performance— The publicly traded equity portfolio is primarily constructed to match the market sensitivity of the benchmark while focusing on the efficient deployment
of active risk. In-depth studies have been undertaken by staff with the assistance of the general consultant
to identify market segments in which managers can more reliably generate long-term excess returns, with
market-cap passive strategies receiving higher allocations in more informationally efficient segments.
Active risk strategies have been evaluated and selected in the context of their respective US or ex-US
composites, with the objective of maintaining idiosyncratic stock exposures, managing tracking error and managing factor risks. Individual active risk managers are expected to maintain portfolio exposures
consistent with their mandates and established risk budgets, while generating positive excess returns against
their respective benchmarks, both on the upside and downside. This should result in balanced exposures

FY 2022 Annual Investment Plan
FY 2022 Annual Investment Plan Page 9
across size, style and geographic categories, allowing the publicly traded equity composite to consistently
generate excess returns in all types of market environments.
As of this writing, portfolio volatility, tracking error, fees and relative performance are in line with peers
and largely consistent with expectations. The twelve months to June 30th, 2021 encompassed a strong and sustained equity market recovery from the lows reached on March 23rd, 2020, aided by massive monetary
easing and fiscal support not seen outside of wartime economies. US equities saw continued leadership by
large-tech firms, which then rotated toward more cyclically sensitive small-cap and value stocks in the
middle of the period, more recently rotating back to large-tech leadership. Ex-US markets followed a similar, if less extreme, trajectory, with the MSCI ACWI ex-US IMI returning 37.2%.
Performance for the US and ex-US composites was within expectations. Following the substantial restructuring in August 2020, the US portfolio produced positive excess returns outperforming the Russell
3000’s 44.16% return by 1.16% for the full year. The ex-US composite was also restructured in FY2021,
although market volatility necessitated that its rebalancing was delayed to May 2021. The ex-US portfolio lagged the MSCI ACWI ex-US IMI’s return of 37.2% by 1.17%, largely due to underperformance during
a sharp rebound of the most undervalued stocks in the fourth quarter of 2020.
The Council’s aforementioned overweight to ex-US equities against the global benchmark has been a headwind to relative performance for the global equity composite. This can be seen by comparing
performance for the benchmark Russell 3000 and MSCI ACWI ex-US IMI indexes over 1-, 3-, 5-, 7- and
10-year periods, with US equities outpacing ex-US over each period, and by 8.5 percentage points annualized over the trailing ten years to 6/30/2021.
Portfolio activity and forward-looking strategy— In early fiscal year 2021 public equity staff completed a
regular three-year study of the ex-US composite structure to accompany the US structure that was published in June 2020. The ex-US structure was approved unanimously by the Council in August 2020, although a
transition to new target weights was delayed until May 2021 due to market volatility. Although it entailed
less substantial changes to the composite than the US structure study, the updated ex-US structure also targets balanced exposures and the ability to add value against the benchmark in all market environments.
Through fee reductions from two active managers negotiated by SIC staff, a higher weight was allocated to
active managers while keeping fees unchanged at 35 basis points.
A successful transition was also completed for the US composite in August 2020, with $2.3 billion in assets
successfully allocated according to the asset allocation approved by the Council in June 2020. SIC staff are
pleased to report that costs came in within expectations and performance for the restructured composite has been strong.
The State Investment Council invests a significant amount of money for state and local tax-exempt entities alongside Permanent Fund assets. In December and January of FY21 a transition of $120 million was
performed on behalf of the New Mexico Retiree Health Care Authority in emerging markets and domestic
small cap equities. To take advantage of the economies of scale that are present in equity transitions, public equity staff also transitioned $60 million of Permanent Fund assets to move emerging markets managers
into alignment with the ex-US asset allocation approved by the Council in August. Staff are pleased to
report that costs for both the emerging markets and domestic small cap transitions came in below estimates.

FY 2022 Annual Investment Plan
FY 2022 Annual Investment Plan Page 10
Public equity staff maintain a list of three pre-approved external transition managers. In late CY21 SIC staff
and consultants plan to undertake a regular five-year review of these managers, with the goal of submitting a recommendation to the Council in early 2022.
In June 2020 the Council also approved a contract with BlackRock to implement its Aladdin risk platform. This followed an extensive due diligence period dating back to Fall 2019. Public equity staff had previously
contracted with FactSet Research Systems to meet its portfolio oversight and risk management needs. The
implementation process for the Aladdin risk platform began in the summer of 2020 and was completed in
early 2021.
Following the summer 2020 restructuring of both the US and ex-US composites, public equity staff were
able to devote more attention to researching the universe of public equity managers not currently part of the SIC’s public equity portfolio, with a focus on assessing qualitative aspects of firms, such as corporate
structure, governance and executive leadership. This project, along with most of the work of public equity
staff, was well suited to the current work-from-home environment. With no time spent in transit, staff had better access to senior management and were able to complete in excess of 100 video calls with public
equity managers ranging from $10 billion to trillions of dollars in assets under management. It is expected
that this advance research work will continue to be useful for years to come, as firm quality is expected to
gain a greater role in the due diligence process.
The public equity team expects to continue and expand on each of these projects into the next fiscal year.
While the composite structures for the public equity composites are established for multi-year periods and have performed well thus far, staff are committed to investing with superior investment managers and
strategies, so the potential does exist for new manager searches. Although the initial implementation of the
BlackRock Aladdin platform is complete, it is a very sophisticated risk management tool and staff expect
to continue building out its functionality for the next several quarters.

FY 2022 Annual Investment Plan
FY 2022 Annual Investment Plan Page 11
Public Markets: Fixed Income
Asset Class Summary— The principal role of a fixed income portfolio is to preserve capital, produce
income, protect against the volatility of equities and other risk assets, and provide diversification benefits
to the total portfolio. Fixed income portfolios seek to achieve these objectives by investing in a variety of government, corporate, and asset-backed securities.
The portfolio is divided into Core and Non-Core components. The Core allocation is a highly liquid, highly
rated portfolio with the primary objective of providing liquidity in the event of a severe market dislocation.
The Core allocation is further subdivided in to Core, Core Plus and Short Duration pools, each with a specific purpose. The Core allocation invests primarily in highly liquid treasury securities and is expected
to be the most robust source of liquidity in periods of market stress. The Core Plus allocation provides the
portfolio its next layer of liquidity. Investments in the Core Plus allocation resemble those in the Core allocation, but add highly rated, non-treasury, credit exposure to help preserve the real value of capital
invested. Finally, the Short Duration pool provides both liquidity and a mechanism for managing the
portfolio’s duration risk.
The Non-Core allocation’s primary objective is to produce yield and generate returns above those available
in publicly traded securities by capturing liquidity and complexity premiums. Investors earn liquidity
premia as compensation for making investments that cannot be readily traded in established markets. Similarly, complexity premia are earned by providing bespoke capital solutions to borrowers whose
financing needs require special structuring. Funds in the Non-Core portfolio typically hold private assets
that have a contractual yield component, are secured by an asset such as property or a company and are
infrequently traded.
The Core Fixed Income long-term target allocations are 10% for the LGPF and 12% for the STPF. The Non-Core Fixed Income long-term target allocation is 15% for the LGPF and 12% for the STPF. The table
below depicts the changes in allocations over the past fiscal year:
Sub-Sector Strategy Allocation 6.30.2020
Allocation 6.30.2021
Long-Term Target
Primary Purpose
Core Fixed Income Portfolio
Core Bonds Pool 51.80% 39.65% 20% - 40% Interest rate exposure
Core Bonds Plus Pool 40.60% 40.95% 25% - 65% Interest rate & credit
exposure
Short Duration Pool 7.60% 19.41% 10% - 30% Liquidity/Duration mgmt
Non-Core Fixed Income Portfolio
Lending Strategies 22.90% 23.43% 20% - 40% Credit exposure
Distressed & Other 22.70% 26.95% 20% - 40% Credit/Alpha exposure
Structured Credit 29.40% 24.08% 20% - 40% Credit exposure
Public Market Strategies
25.00% 25.54% 20% - 40% Duration mgmt/Alpha exposure

FY 2022 Annual Investment Plan
FY 2022 Annual Investment Plan Page 12
Recent performance, markets, and portfolio strategy— The unchecked global spread of COVID-19 in the
first quarter of 2020 caused the economy to freeze and financial markets to experience extreme strains. Subsequently, aggressive policy initiatives, both fiscal and monetary, completely reversed market
participants’ bleak outlooks. Over the fiscal year, ten-year inflation break-evens rallied more than 100 basis
points to 2.34%, and the 10-year U.S. Treasury, though still well below the 3.2% 2018 high, added 81 basis point to yield 1.47% on June 30. Simultaneously, credit spreads have materially tightened. For example,
the Moody’s US Corporate BAA ten-year spread ended the fiscal year at 189 basis points. The benchmark
for the Fixed Income portfolio is the Bloomberg U.S. Universal Bond Index which produced a 1.12% rate
of return for the year ended June 30. The Core portion of the portfolio returned 2.03%, buoyed by the strong performance of the more the credit sensitive Core Plus sub-strategy, and beat the Bloomberg US Aggregate
Bond Index by 2.44%. Despite a strong absolute performance, the Non-Core portfolio which rose 15.95%
underperformed its custom benchmark by 23 basis points.
The weight of each constituent pool of the Core Fixed Income portfolio is within its respective target range.
The portfolio continues to be conservatively positioned with Core Bonds, the portfolio’s primary source of diversification, liquidity, and capital preservation, near the high end of its range. The Short-Duration sub-
strategy, which lowers the portfolio’s interest rate exposure, is at a neutral position and the Core Plus
allocation is slightly below the midpoint of the long-term target range.
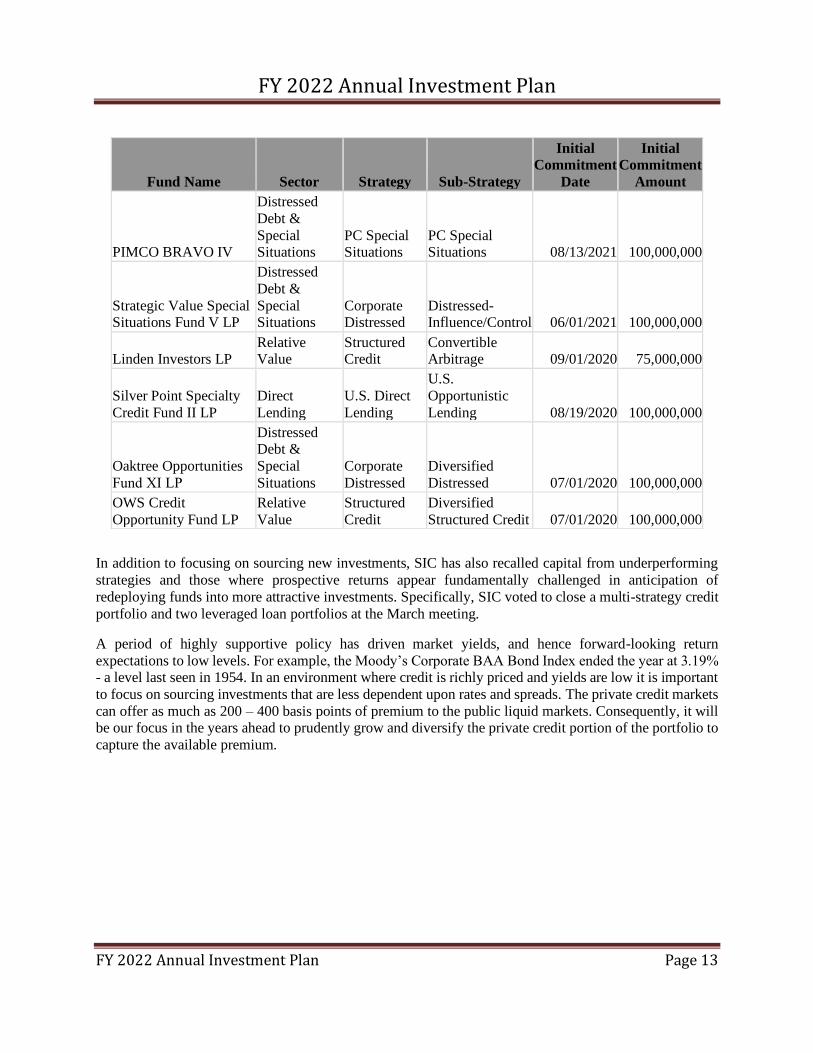
Forward-looking strategy and recent activity— The Fixed Income portfolio continues to be well positioned to benefit from the disruptions to the economy caused by COVID 19, and recent new allocations approved
by SIC ensure there is dry powder available to capitalize on any incremental stress caused by the Delta
variant’s surge. Though their strategies are different, the teams at Strategic Value Special Situations Fund V and PIMCO BRAVO IV have proven their ability to execute deals both domestically and in Europe. The
table below summarize new commitments approved this fiscal year:
FY 2022 Annual Investment Plan
FY 2022 Annual Investment Plan Page 13
In addition to focusing on sourcing new investments, SIC has also recalled capital from underperforming
strategies and those where prospective returns appear fundamentally challenged in anticipation of
redeploying funds into more attractive investments. Specifically, SIC voted to close a multi-strategy credit
portfolio and two leveraged loan portfolios at the March meeting.
A period of highly supportive policy has driven market yields, and hence forward-looking return
expectations to low levels. For example, the Moody’s Corporate BAA Bond Index ended the year at 3.19% - a level last seen in 1954. In an environment where credit is richly priced and yields are low it is important
to focus on sourcing investments that are less dependent upon rates and spreads. The private credit markets
can offer as much as 200 – 400 basis points of premium to the public liquid markets. Consequently, it will be our focus in the years ahead to prudently grow and diversify the private credit portion of the portfolio to
capture the available premium.
Fund Name Sector Strategy Sub-Strategy
Initial
Commitment
Date
Initial
Commitment
Amount
PIMCO BRAVO IV
Distressed
Debt &
Special Situations
PC Special Situations
PC Special Situations 08/13/2021 100,000,000
Strategic Value Special Situations Fund V LP
Distressed
Debt &
Special Situations
Corporate Distressed
Distressed-Influence/Control 06/01/2021 100,000,000
Linden Investors LP Relative Value
Structured Credit
Convertible Arbitrage 09/01/2020 75,000,000
Silver Point Specialty
Credit Fund II LP
Direct
Lending
U.S. Direct
Lending
U.S.
Opportunistic
Lending 08/19/2020 100,000,000
Oaktree Opportunities
Fund ΧΙ LP
Distressed Debt &
Special
Situations
Corporate
Distressed
Diversified
Distressed 07/01/2020 100,000,000
OWS Credit
Opportunity Fund LP
Relative
Value
Structured
Credit
Diversified
Structured Credit 07/01/2020 100,000,000

FY 2022 Annual Investment Plan
FY 2022 Annual Investment Plan Page 14
Private Markets: Real Estate
Asset Class Summary — The Council’s Real Estate portfolio has a
target allocation of 12% of the
Fund. As of CYE 2020 the Real Estate Portfolio represents
approximately 9.7% of the Fund on a
NAV basis. The Real Estate Portfolio
is well diversified by property type, risk characteristics and geography.
Relative to property type
diversification, the portfolio is guided by the diversification of the National
Council of Real Estate Investment
Fiduciaries (NCREIF) Fund Index for Open-ended, Diversified, Core Equity (NFI-ODCE), but with a 15% plus or minus allocation relative to
that index. In consultation with the Real Estate Consultant, staff tactically over- or under-weights by
property type. The property type composition of the Real Estate portfolio is summarized in the table above.
Recent performance, markets and portfolio strategy — The performance of the Real Estate portfolio was
adversely impacted by the onset of the Covid pandemic in March 2020. Net time weighted return for the
year was 0.4%, compared to 0.3% for the ODCE index. Legacy investments continue to weigh on performance numbers, but their negative impact is diminishing as the legacy portfolio now represents ca.
2.0% of the total Real Estate NAV.
U.S. real estate valuations through year end 2019 generally continued to achieve historical highs, however,
the COVID-19 economic crisis which struck the U.S. in March 2020 had wide-ranging impacts across the
various property types. Green Street estimated that there was an 11% aggregate decline in US private
commercial real estate values in the first half of 2020. However, between massive fiscal and monetary stimulus, as well as the approval and distribution of several Covid-19 vaccines, property values staged an
impressive recovery in value in the second half of 2020. Green Street estimates that overall US commercial
real estate values are now back to pre-Covid levels. However, there are wide discrepancies in the pace of recovery among the various real estate sectors.
In many instances, the Covid pandemic accelerated trends that were already underway, most notably the
ongoing transition from brick-and-mortar retail to on-line shopping. This phenomenon has driven strong returns in the industrial sector, mostly to the detriment of traditional malls. Values of grocery-anchored and
lifestyle retail have held up reasonably well.
In the office sector, the debate about the future of office demand will not be resolved for many quarters.
Green Street forecasts that US office demand will decrease by 15% as work from home transitions from a
pandemic necessity to a permanent reality as well as a valuable recruiting tool. If true, we can expect further erosion of office valuations.
Real Estate
Sectors
% of Real Estate Portfolio Value ($MM)
NFI-ODCE Actual NAV
Apartment 26.6% 21.8% $ 617
Office 32.9% 23.0% $ 651
Industrial 21.6% 32.3% $ 914
Retail 14.2% 13.2% $ 373
Other 4.7% 9.7% $ 274
Total Real Estate 100% 100% $ 2,828 Note: NMSIC Real Estate Sector Range is +/- 15% of the NFI-ODCE Index. By
example, the range for Office is 18.4% to 48.4%. If pending 2021 Investment Policy Statement is approved, "Other" sector range will be 0-30%.

FY 2022 Annual Investment Plan
FY 2022 Annual Investment Plan Page 15
The apartment sector has held up well through the pandemic, in part based on federal and state stimulus
placed into the hands of renters. Sunbelt rents have grown sharply and demographic trends continue to favor this asset class.
With investor interest focused on industrial and multi-family investments (to the general exclusion of retail and office), capitalization rates for these assets continue to compress. Accordingly, investors have
aggressively turned to alternative sectors to achieve capital deployment objectives. These alternative sectors
include single family for rent; manufactured home communities; senior housing; student housing; self-
storage; cold storage; data centers; life sciences facilities; and lodging.
In the year ended December 31, 2020, the NAV of the Real Estate portfolio increased by $49 MM. Seven
new commitments were made totaling $675MM:
1. $125MM Clarion Lion Property Fund (Core)
2. $100MM Exeter US Industrial Fund V (Non-Core) 3. $100MM Carlyle Property Investors Fund (Core)
4. $75MM Blackstone Real Estate Partners Europe VI (Non-Core)
5. $100MM Cortland Partners Growth and Income Fund (Core)
6. $100MM FPA Core Plus Fund V (Non-Core) 7. $75MM Bell Institutional Fund VII (Non-Core)
At year-end 2020, the core component of the NMSIC real estate portfolio represented 66% of the total portfolio against a target of 55%. This over-allocation to core has been beneficial as higher risk (non-core)
properties have been more negatively impacted by the COVID-19 crisis. However, it is expected that the
crisis will result in significant dislocation in commercial real estate markets globally. Hence, the focus for
new commitments in 2021 is in the Value Add and Opportunistic spaces. Balancing vintage risk with the expected scale of disruption, planned annual redemption activity out of core and into non-core may be
increased in order to make more capital available for non-core commitments.
Recent activity and forward-looking strategy — The focus of new commitments in the near term will be
towards Non-Core investments, as shown in the NMSIC staff pacing model below:

FY 2022 Annual Investment Plan
FY 2022 Annual Investment Plan Page 16
Note: Outstanding core redemptions as of 12/31/2020 equaled $205MM. Pacing model includes $50MM
of annual core redemptions to restore targeted core / non-core exposure.
Source: SIC Staff
In terms of targeted sectors, NMSIC expects to continue to be strategically under-weight to retail and office
and over-weight to industrial. In addition, NMSIC expects to increase exposure to the Alternatives sectors from 8.0% to a range of 15-20% over the next three years. Additionally, NMSIC expects to expand its
exposure to Europe from the current level of 10.3% to a target range of 10-20%. Relative to Asia/Pacific,
NMSIC intends to maintain exposure in the range of 5-15% against a current actual exposure of 7%.
0%
2%
4%
6%
8%
10%
12%
14%
$0
$100
$200
$300
$400
$500
$600
$700
% o
f S
IC A
ssets
$ i
n m
illi
on
s
Real Estate - Pacing and Allocation
New Core New Non-Core % RE NAV to Total Plan Assets
Actual Forecast

FY 2022 Annual Investment Plan
FY 2022 Annual Investment Plan Page 17
Private Markets: Real Return
Asset Class Summary—The Council’s Real Return portfolio is a multi-asset, multi-market portfolio
constructed to generate returns based on factors different than those that drive returns of publicly-traded
equity and traditional fixed income investments. NMSIC’s Real Return portfolio consists of equity investments in infrastructure, energy (conventional and renewable), agriculture, timberland and financial
assets (cash flow yielding investments under-pinned by real assets). Income generation is expected to be a
notable part of the total return. These assets are expected to be advantaged over equities and bonds in an
economic and financial market environment where growth is a little slower than average and inflation and interest rates are rising.
The Real Return asset class has an allocation of 10% within the broad LGPF and STPF portfolios. As of CYE 2020, the Portfolio represents approximately 8.5% of the Fund on a NAV basis. Within that 10% Real
Return allocation, 80% is targeted towards Real Assets and 20% to Financial Assets. Starting in 2011, the
Council began building investments in Real Assets of timberland, energy, farmland and infrastructure; and in financial assets via Master Limited Partnerships (MLPs). MLPs are companies that invest in oil and gas
pipelines and related energy infrastructure and are similar to REITs in structure. Real estate and real asset
debt strategies and liquid real assets may also be considered within the Financial Assets allocation. The
table below shows the current allocations of the Real Return portfolio:
Category Sector
% of Category Value ($MM)
Target Actual NAV
Financial Assets 10-30%* 15.9% $ 369
MLP's NA 77.2% $ 285
Real Estate Debt NA 22.8% $ 84
Real Assets 70-90%* 84.1% $ 1,958
Agriculture 0-15% 11.9% $ 233
Commodities 0-10% 0.0% $ -
Energy 0-50% 28.0% $ 548
Infrastructure 0-50% 46.0% $ 901
Timberland 0-20% 12.7% $ 248
Other 0-15% 1.4% $ 28
Total 100% $ 2,327 Note: Invested Value (NAV) is as of 12.31.2020
*Target Weights for Financial Assets & Real Assets are reflective of target %'s of the entire Real
Return Portfolio. Real Asset Sub-Sectors %'s reflect target and actual %'s of Real Assets only. These
targets are subject to change pending an upcoming Structure Study and Investment Policy Statement
Review.
Recent performance, markets and portfolio strategy— During 2020, the Real Return portfolio generated
a -6.4% net time weighted return (TWR) while the Real Asset component generated a -2.5% net TWR.
Investments in Energy and Agriculture were the main contributors to these negative returns. Within the
Real Asset portfolio, the infrastructure portfolio showed continued strong performance (8.1% one-year TWR).

FY 2022 Annual Investment Plan
FY 2022 Annual Investment Plan Page 18
Since year-end 2019, the NAV of the Real Return portfolio increased by $108MM to finish 2020 at $2,327
MM.
Six new Real Return 2020 commitments were approved totaling $430 MM: 1. $100MM Ares Energy Opportunities Fund (Real Assets / Energy);
2. $65MM Carlyle International Energy Partners II (Real Assets / Energy);
3. $40MM Carlyle International Energy Partners II Co-Invest (Real Assets / Energy);
4. $50MM Brookfield Infrastructure Fund IV Co-Invest (Real Assets / Infrastructure) 5. $75MM iCON Infrastructure Partners V (Real Assets / Infrastructure); and
6. $100MM IPI Partners Data Center Fund II (Real Assets / Infrastructure).
Recent activity and forward-looking strategy-- The Real Return pacing model incorporates just the Real
Assets component, which is targeted at 8.0% of the broad portfolio (10% x 80% = 8.0%). As shown below,
the pacing model shows approximately $275 MM of commitments going forward in order to continue to push the invested NAV of the Real Return portfolio toward the long-term target allocation. Note that there
will be some spikes in commitment levels relative to the pacing model based on the timing of new offerings.
Source: SIC Staff
Conventional energy was hit hardest by the Covid pandemic as demand for hydrocarbons plummeted while
supply continued unabated until supply cuts could be agreed on by OPEC Plus. Global hydrocarbon storage reached capacity and, with nowhere to store new production, the price of a barrel of oil turned negative.
Eventually, supply fell due to economics (in the case of US oil) and by agreement among the OPEC Plus
members. This has allowed oil and natural gas prices to recover. Although the span of this dislocation was less than one year, the damage to many upstream and midstream conventional energy investments was
significant. In addition to poor returns, concerns about global warming further tainted the conventional
0%
2%
4%
6%
8%
10%
12%
$0
$50
$100
$150
$200
$250
$300
$350
$400
$450
$500
% o
f S
IC A
ssets
$ i
n m
illi
on
s
Real Assets - Pacing and Allocation
Total New Real Asset Commitments % of SIC Assets
Actual Forecast

FY 2022 Annual Investment Plan
FY 2022 Annual Investment Plan Page 19
energy sector and effectively starved US up-streamers and mid-streamers of capital. It is expected that this
capital flight will result in some rewarding investment opportunities for those investors that will still consider the sector.
At the same time, investor interest in the renewables sector continues to grow as corporate and government mandates push for the development of clean energy sources. Accordingly, investment returns have been
squeezed in this sector even as re-contracting risks are ignored.
Infrastructure has been the strongest performing sector through the Covid pandemic. The communications sector (which includes towers, data centers and the like) held up well as demand for data continued
unabated. In the transportation sector, strategies targeting the movement of goods (shipping, ports, etc.)
held up well while strategies targeting the movement of people (airports, toll-roads and the like) experienced significant loss of traffic and revenue. In aggregate, capital values of global infrastructure
assets are about constant, but cash yields remain strong in the mid-single digits.
Returns in Agriculture have been low but stable as measured by the NCREIF Farmland Index. Over the prior five years, the gross return has been 5.5% annualized. Although viewed as a relatively safe asset class
with correspondingly low return expectations, agriculture investments can be exposed to risks from
currency movements, commodity pricing, regulatory changes, ESG concerns, weather related events,
unforeseen supply/demand shocks, consumer preference shifts and shifting geopolitics.
Timberland returns, measured by the NCREIF Timberland Property Index, have achieved a 2.6%
annualized gross return over the prior five years. The US South makes up the largest component of the index and this region has been hampered by oversupply, leading to stagnant log prices over the past decade.
Demand from residential construction, repair and remodeling has been rising as US housing starts continue
a steady increase post the GFC. This, in addition to Covid induced supply bottlenecks, has led to record lumber prices being achieved earlier this year. Unfortunately, the log oversupply has led to little upward
momentum on US log and timberland prices.
While returns in Timber and Agriculture have been disappointing, both sectors benefit from strong investor
interest due to historical inflation protection and environmental benefits such as carbon sequestration.
Financial asset returns have been highly sector dependent. Debt strategies underpinned by real estate or
infrastructure have held up quite well, while those with a high exposure to upstream and midstream energy have performed poorly. In the midstream sector, Master Limited Partnerships (common vehicles for the
ownership of midstream assets) have declined in value since NMSIC’s inception (May, 2015), however,
the onset of the Covid pandemic precipitated a further sharp 2/3 drop in values, about ½ of which has since been recovered. MLP’s have shifted their strategy from capital reinvestment and growth to paying down
debt and returning capital to investors. Barring further shocks to the demand for hydrocarbons, this shift in
focus should put a floor under valuations in the midstream sector.
Going forward, NMSIC’s investment focus will be on making new commitments to infrastructure, while
exposure to conventional energy, timberland and agriculture will decline as capital is returned.

FY 2022 Annual Investment Plan
FY 2022 Annual Investment Plan Page 20
Private Markets: Private Equity
Asset Class Summary--The Private Equity portfolio, which consists of four categories – Buyout, Growth,
Special Situations and Venture Capital, continues to serve an important role in enhancing overall portfolio
return generation and diversification. This asset class, although correlated to public equity markets, often benefits as private equity managers are afforded additional flexibility to pursue operational excellence and
improvement in their company investments without the harsh spotlight of public market scrutiny. Private
equity also adds exposure to the long-term growth potential of private companies, which will likely result
in an illiquidity premium in this asset class. This is particularly important as more companies are now inclined to stay private for longer time periods than historical averages.
Recent performance, markets and portfolio strategy--Private equity investments have one of the highest long-term return expectations of all the asset classes and for the 12 months through March 2021 (one quarter
lagged), the private equity portfolio gained over 20.7%. This performance was better than the median peer
fund private equity portfolio return of 19.0%, and slightly less than the 21.4% increase in the Cambridge US Private Equity (Legacy) Index. Private equity performance has been impacted by poor performance of
many funds in the pre-2011 vintage years, where poor manager/fund selection was likely impacted by pay-
to-play considerations. Since 2011, the private equity portfolio has targeted larger fund commitments of
$50 million-$100 million to “core managers”, compared to the previous $20 million-$50 million, so the performance drag from these older funds will continue to diminish. Also, since inception performance (net
IRR) of the five largest GP exposures as of December 31, 2020 is 18.2%, greatly exceeding the historical
net IRR of 12.0% for the program.
Portfolio strategy continues to focus on identifying a set of “core managers” to build longer term
relationships for our private equity program. Larger commitments to successful core managers will
eventually result in a decrease in the number of GP relationships/fund commitments and will be very beneficial for 1) portfolio monitoring and 2) reducing the administrative burden of a large number of
relationships. The number of private equity funds (currently 113), in the absence of a secondary sales
option, will continue to gradually decrease. But as the portfolio continues to grow and approach the 12% target, the overall effect of the non-core relationships has continued to recede.
Recent activity and forward-looking strategy--Private equity consultant Mercer utilizes a pacing model to help guide the target range of annual commitments for our private equity program. The pacing model serves
two main functions: 1) it ensures adequate vintage year diversification for the portfolio and 2) models a 3-
5 year time frame, given its assumptions, to maintain our long-term target of 12% of total assets. At this
time, the pacing model projects annual commitments of approximately $350 million would be adequate to reach our target in that time frame and the model is re-evaluated annually for potential enhancements.
Progress towards the 12% target has taken a number of years due to different factors. The continued strength of the public equity markets has resulted in total plan assets increasing at a faster rate than the
pacing model assumption. In addition, this market resilience has resulted in an accelerated pace of
investment realizations and cash distributions from the funds, which has most directly pressured net contributed capital. For perspective, the private equity program experienced about $700 million in net
distributions (distributions exceeding contributions) in the time period 2011 to 2015. Despite continued
strength in distributions, the last two years have seen a bit of a reversal, as net contributions turned positive
for the years 2018-2019. Although favorable exit markets have lengthened the original time frame to reach the 12% target, markets that make it easier for managers to successfully and profitably exit their private

FY 2022 Annual Investment Plan
FY 2022 Annual Investment Plan Page 21
company investments will always be welcome. It should be noted that distributions have recovered
following the onset of the COVID-19 pandemic, with strong distributions from the portfolio beginning in Q3 2020 and continuing through Q2 2021. The increased distributions received by the underlying funds
could support an increase in the commitment pacing target in the near future to maintain the target
allocation.
Source: Mercer.
Each year’s private equity commitments are based on a predetermined amount. Model assumes overall portfolio returns of 1.75%
(net of all contributions and distributions) and private equity returns of 13%. Different return assumptions may result in a different
pacing target. Pacing targets should be evaluated on a regular basis. Aggregate vintage year performance can differ by year and
increasing commitments during a lower performing vintage year could lead to lower portfolio performance.
Note that 2020 includes approximately $185 million of commitments that had been approved prior to 2020, but had first drawn
capital in 2020, in addition to those commitments approved in 2020.
Private equity allocation for 2020 and thereafter reflect end of fiscal year on June 30 of each year.
National Private Equity Commitments and Allocation Forecast
($ in millions)
Each year's private equity commitments are based on a predetermined amount. Model assumes overall portfolio returns of 1.75% (net of all contributions and distributions)
and private equity returns of 13%. Different return assumptions may result in a different pacing target. Pacing targets should be evaluated on a regular basis.
Aggregate vintage year performance can differ by year and increasing commitments during a lower performing vintage year could lead to lower portfolio performance.
$458
$350 $450
$550 $650 $650 $650
10.7%
12.5% 12.2% 11.6%11.2%
11.2% 11.3%
0.0%
2.0%
4.0%
6.0%
8.0%
10.0%
12.0%
14.0%
$-
$200
$400
$600
$800
$1,000
$1,200
$1,400
2020 2021 2022 2023 2024 2025 2026
Com
mitm
ent
Am
ount
Commitments Allocation Target