state-of-the-art methods for design of integral bridge
TRANSCRIPT

Retrospective Theses and Dissertations Iowa State University Capstones, Theses andDissertations
1981
State-of-the-art methods for design of integralbridge abutmentsBruce JohnsonIowa State University
Follow this and additional works at: https://lib.dr.iastate.edu/rtd
Part of the Civil Engineering Commons
This Thesis is brought to you for free and open access by the Iowa State University Capstones, Theses and Dissertations at Iowa State University DigitalRepository. It has been accepted for inclusion in Retrospective Theses and Dissertations by an authorized administrator of Iowa State University DigitalRepository. For more information, please contact [email protected].
Recommended CitationJohnson, Bruce, "State-of-the-art methods for design of integral bridge abutments" (1981). Retrospective Theses and Dissertations.17287.https://lib.dr.iastate.edu/rtd/17287

CE 690
STATE-OF-THE-ART METHODS FOR DESIGN OF INTEGRAL BRIDGE ABUTMENTS
Submitted To:
Amde M. Wolde-Tinsae, Associate Professor Department of Civil Engineering
Iowa State University
In partial fulfillment of requirements for the degree of Master of Science
Sponsored By:
Iowa Department of Transportation, Highway Division Through the Iowa Highway Reseach Board,
Project HR-227, and the Federal Highway Administration
By:
Bruce Johnson, Assistant Bridge Engineer Federal Highway Administration
Iowa Division
August 1981

TABLE OF CONTENTS
I. INTRODUCTION
1. Background
2. Purpose
3. Plan of Investigation
II. SURVEY OF CURRENT PRACTICE
1. Purpose
2. Questionnaire
3. Trends in Responses
4. Review of Details and Design of Selected States
a. Tennessee
b. Kansas
c. Missouri
d. North Dakota
e. California
f. Iowa
5. Sunmary
III. LITERATURE REVIEW
1. Analytic a 1 Approaches
2. Development of Load-displacement ( p-y) Curves
3. Example p-y Curves . . . . . . . 4. Development of Load-slip Curves
5. Example Load-slip Curves . . . .
.1
.10
.11
.13
.13
.14
• 21
.21
.22
.23
.23
.25
.25
.26
.29
.31
.38
.43
.49

6, Previous Research .54
a. California .54
b. Missouri .60
c. South Dakota .62
d. North Dakota .64
7. Sunmary .66
IV. CONCLUSIONS .69
v. REFERENCES • 71
VI. APPENDIX I • 75
VII. APPENDIX II .85
VIII. APPENDIX III .89
ACKNOWLEDGMENTS .97
LI ST OF FIGURES
1. Cross-section of Bridge with Integral Abutment
2. Cross-section of Bridge with Expansion Joints
3. Integral Abutment Details (Cont,)
4. Semi-integra 1 Abutment De tails
5. Integral Abutment Pile Loads
6. Simplified Pile Stress Analysis
7. Resistance - Displacement (p-y) Curve
8. Load-slip Curves
9. "A" Coefficient Chart
10. "B" Coefficient Chart
11. Approximate p-y Curve for a Fine Sand
12. Skin Friction Distribution
13. Approximate Load-slip Curves
14. Empirical Load-slip Curves
15. Initial Slope Estimate for Load-slip Curves
.2
.3
.5
.6
.7
.8
.8
.30
.32
.37
.37
.39
.4 7
.51
.52
.53
16. Sample Inspection Record of Structures Without Expansion Joints .56
17. Calculated Versus Experimentally Determined Pile Moments .59
18. Sketch of Moore Engineering Integral Abutment System .65
1.
2.
3.
4.
5.
6.
7.
8.
LIST OF TABLES
Integral Abutment Bridge Length Limitations (1981)
Constants Used in p-y Relationships
Recomnended nh Values
Ultimate Soil Shear Resistance
Load-slip Curve Initial Slope Recomnendations
Integral Abutment Bridge Length Limitations (1972)
Recomnended Load-slip Parameters
Recomnended p-y Relationships • •
.17
.35
.40
.48
.55
.61
.67
.67
LIST OF NOTATIONS
A = Empirical coefficient
a = Empirical constant
a0 = Horizontal angle of initial portion of a load-slip curve
B = Empirical coefficient
b = Pile width
C = Constant based on soil properties
c = Soil shear strength
d = Pile diameter
E = Elastic modulus
H = Depth below which the soil response is unaffected by the ground
surface boundary
I = Pile moment of inertia about the loaded axis
Ka = Rankine coefficient of minimum active earth pressure
Ko = Coefficient of earth pressure at rest
k = Modulus of horizontal subgrade reaction
L = Portion of the bridge length affecting thermal expansion at one abutment
le = Effective length of the pile
M = Applied moment in the pile
M(x) = Moment along ilie k~ili of ilie pile
M(le) = Moment at the point of fixity
m = Slope of the intermediate portion of a p-y curve for sandy soils
N = Standard penetration blowcount
Nc = Dimensionless bearing capacity factor
Nq = Dimensionless bearing capacity factor
n = Empirical constant
nh = Constant of horizontal subgrade reaction
p = Lateral load at the pile top
Pm = Lateral soil resistance at a la tera 1 deflection
Pu = Ultimate lateral soil resistance
p = Soil resistance
Pp = Pile perimeter
Q = Axia 1 pi le load
qf = Ultimate soil resistance
qo = Effective vertical stress at the pile tip
x = Depth measured from the ground surface
y = Lateral deflection of the pile
( y) of b/60
Yk = Maximum deflection of the elastic portion of a p-y curve in sand
Ym = Maximum deflection of the parabolic portion of a p-y curve in sand
Yu = Ultimate lateral deflection
0( = Coefficient of thermal expansion
{J = Rankine angle of passive earth pressure
Ll = La tera 1 deflection at the top of the pile
.f T = Allowable temperature drop of rise
ti.. = Soil strain in a standard triaxial test
~ = Average effective unit weight of a soil from the surface to depth (x)
¢ = Soil friction angle
,O = Vertical pile settlement
V- = Stress in the extreme fibers of the pile
Jmax = Ultimate soil shear resistance
~= Rotation at the pi le top
I. INTRODUCTION
1. Background
The routine use of integral abutments to tie bridge superstructures to
foundation piling began in this country about 30 years ago.19 Kansas,
Missouri, Ohio, North Dakota, and Tennessee were some of the early users.
This method of construction has steadily grown more popular. Today more
than half of the state highway agencies have developed design criteria for
bridges without expansion joint devices.
Most of the states using integral abutments began by building them on
bridges less than 100 feet long. Allowable lengths were increased based on
good performance of successful connection details. Full-scale field
testing and sophisticated rational design methods were not conrnonly used as
a basis for increasing allowable lengths. This led to wide variations in
criteria for the use of integral abutments from state to state. In 1974
the variation in maximum allowable length for concrete bridges using
integral abutments between Kansas and Missouri was 200 feet.19 A survey
conducted by the University of Missouri in 1973 indicated that allowable
lengths for integral abutment concrete bridges in some states were 500 feet
while only 100 feet in others.
The primary purpose for building integral abutments is to eliminate
bridge deck expansion joints, thus reducing construction and maintenance
costs. A sketch of a bridge with integral abutments is shown in FIGURE 1.
Conventional bridge bearing devices often become ineffective and are
susceptible to deterioration from roadway runoff through deck joints which
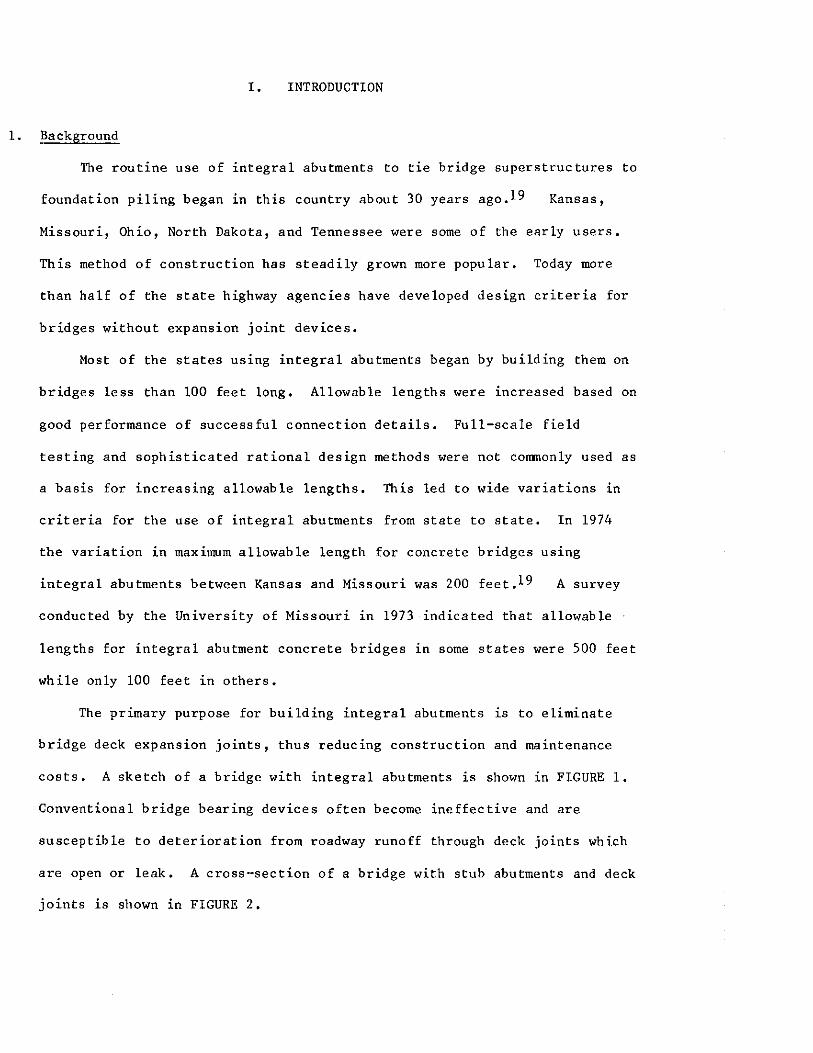
are open or leak. A cross-section of a bridge with stub abutments and deck
joints is shown in FIGURE 2.

CROSS-SECTION OF A BRIDGE WITH INTEGRAL ABUTMENTS
,__--.---,. ........ -....---B-r_id_g_e_d_e_c_k_--.... ________ R_e_in_ro_r_c_ed_c_o_nc_re_t_era-p~p~roTa_c_hrs-la_b_-1__..-----l I ' '----1 I I 1---1------------------------1--J Girder J
FIGURE I
Integral abutment -- t---1
Flexible piling-----
N

CROSS- SECTION OF A BRIDGE WITH EXPANSION JOINTS
t Expons\on joint ---.i===::;.::B=r=i=dg=e=d=e=c=k =~=========R=e1=·n=fo=r=ce=d=c=o=n=cr=e=te==iopproach slab 7 ~
Girder--' Stub abutment ~
Battered piling - P
FIGURE 2
4
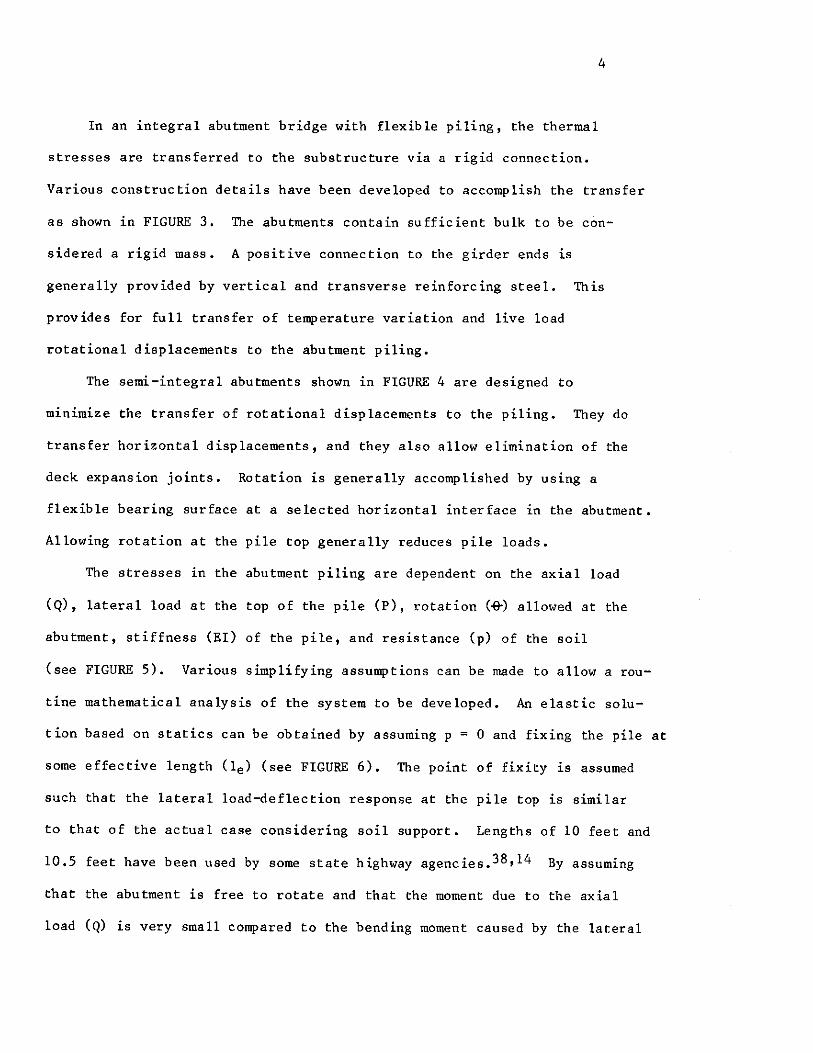
In an integral abutment bridge with flexible piling, the thermal
stresses are transferred to the substructure via a rigid connection.
Various construction details have been developed to accomplish the transfer
as shown in FIGURE 3. The abutments contain sufficient bulk to be con
sidered a rigid mass. A positive connection to the girder ends is
generally provided by vertical and transverse reinforcing steel. This
provides for full transfer of temperature variation and live load
rotational displacements to the abutment piling.
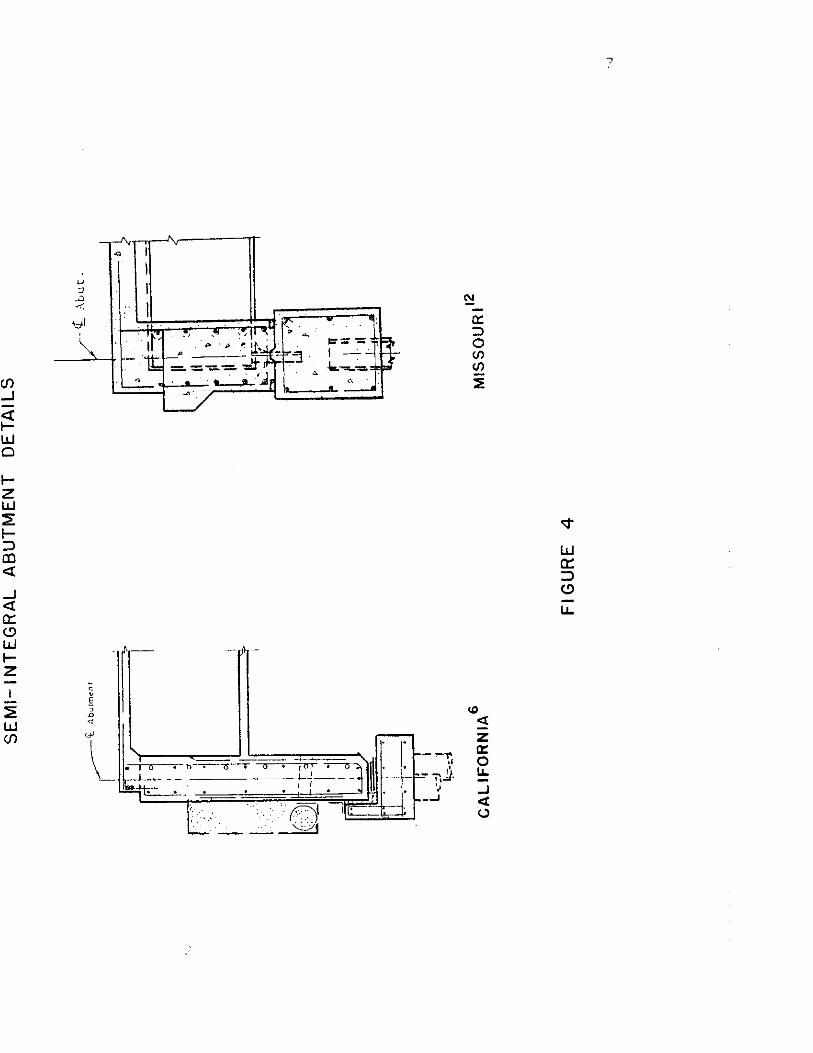
The semi-integral abutments shown in FIGURE 4 are designed to
minimize the transfer of rotational displacements to the piling. They do
transfer horizontal displacements, and they also allow elimination of the
deck expansion joints. Rotation is generally accomplished by using a
flexible bearing surface at a selected horizontal interface in the abutment.
Allowing rotation at the pile top generally reduces pile loads.
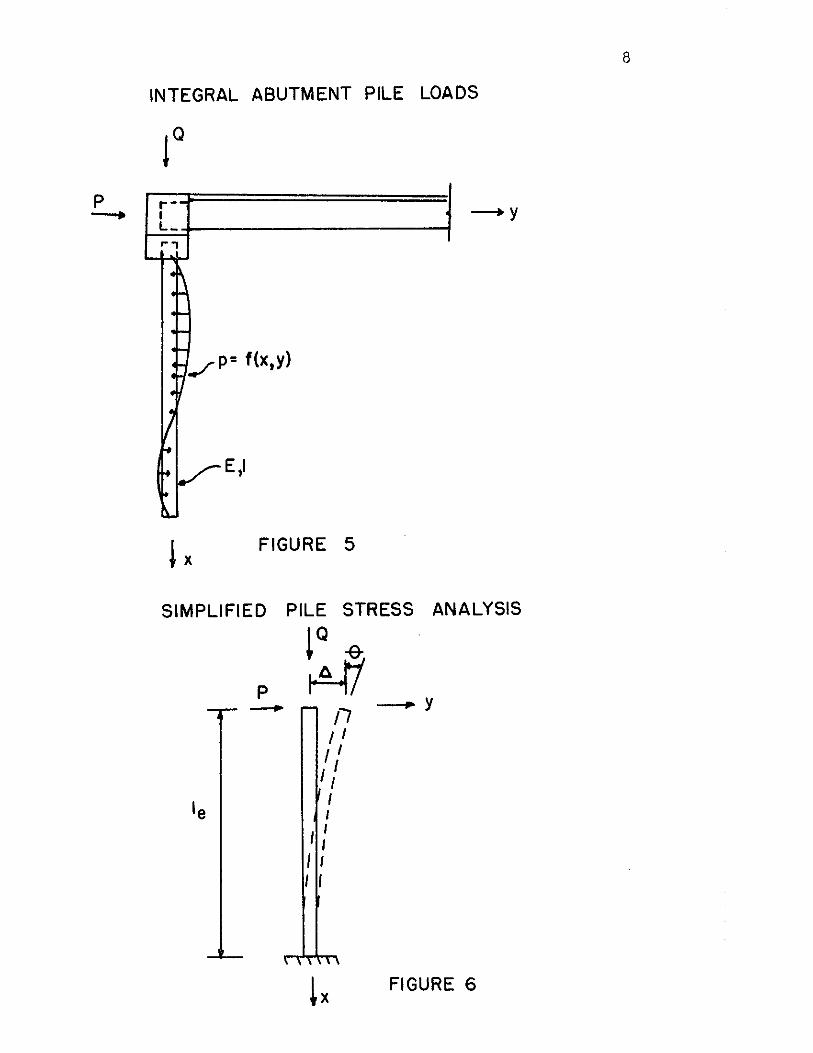
The stresses in the abutment piling are dependent on the axial load
(Q), lateral load at the top of the pile (P), rotation(-&) allowed at the
abutment, stiffness (EI) of the pile, and resistance (p) of the soil
(see FIGURE 5). Various simplifying assumptions can be made to allow a rou
tine mathematical analysis of the system to be developed. An elastic solu
tion based on statics can be obtained by assuming p = 0 and fixing the pile at
some effective length Cle) (see FIGURE 6). The point of fixity is assumed
such that the lateral load-deflection response at the pile top is similar
to that of the actual case considering soil support. Lengths of 10 feet and
10.5 feet have been used by some state highway agencies.38,14 By assuming
that the abutment is free to rotate and that the moment due to the axial
load (Q) is very small compared to the bending moment caused by the lateral

(/) _J
ct 1-UJ 0
1-z UJ ~ I::)
CD <t
_J
<l: a:: (.!)
w 1-z
)
-c .. e -~ j ··
~\ ~·-: r · . 't i'1 r;.--~:.r~;. ~.I 11 . ' I 1· '. . I . ·.
---.r-. -LIL .. _.lJJ I. · ·. '- --' - . . ( ' .. I . r_, .., ,• . • L--.:J
~;_ :,~~- ... o:.-·•r..., . ~ t. - .... s.. ---
- "
\ , l !!"" -, -o ·, ·- . ' ,-~-I ' "l;
-- ti-.:- - --.-------:-1 ~: =._-_J-1 ! -
!.i. . . <QJ. ··-·· - --·-· . ""-'

if> _J
~ UJ a 1-z UJ :;: I::> cc <(
_J <( 0:: C) UJ 1-z
? ' ' •i 'C
:~rr~-_ ... "----'-., ' ' :;f-----
;·-- __, --;-~----~- -~ ·t:T----=---~,-- -; ~. i:_' . L.:. -~-....:...- ~ O~-
·:·~.;~_:..~.__A-...,_.J __ •
,.,
a: ::::> 0 Cf) Cf)
::!:
~ Q
:I: I=> 0 <fl
,J
..... ~ z 0 0 ...... r<)
w ~ :::> C)
LL.
Cf) _J
;:! w a
1-z w ;:[ I:> co <(
_J <( a:: (.!) w 1-z
c • s , D
I
I
-
l l.~ .- ... ~ ·-Ti-=1 \\ : __ t:;s ~-- • • ' I I ...!,...__ ' • .,.
r --.-J r ©' ,. .. L- __ ._· -<0-1 i!::::=J:.;:!:.J
"' 0:: ::::> 0 (/) (/)
::E
<O <t z a::: 0 LL..
...J < <)
p -
INTEGRAL ABUTMENT PILE LOADS
.... -' L-,.,
-Y
~p= f(x,y)
E,1
FIGURE 5
SIMPLIFIED PILE STRESS ANALYSIS
p - ~ ,-, I I I I I I
I I I
I I I
I I I I
--Y
I FIGURE 6 +x
8

9
load (P), the following expressions result:
Where:
LI = Ple3/3EI
M(x) = Px + Q(.6 -y) • • • • • • • • • • • • • (1 )
M(x) = Moment along the length of the pile
M(le) = Moment at the point of fixity
x = Depth from the ground surface
y = Lateral deflection of the pile
A = Lateral deflection at the top of the pile
E = Elastic modulus of the pile
I = Pile moment of inertia about the loaded axis
In Iowa HP 10 x 42 steel piles are used predominantly in integral
abutments with a 6.0 ksi vertical design load on bridges over 200 feet
long. As an example, the stress in an HP 10 x 42 pile will be calculated
ignoring soil support for an embedment length of 10 feet and a lateral
deflection of 1 inch. The last two criteria are used by Tennessee to
establish maximum allowable bridge lengths using integral abutments.
M(le) = 36.1 Ft-Kips
V" =My/I+ Q/A = 3Ey/(le)2 + Q/A ••• (2)
V- = 30.4 + 6.0 = 36.4 ksi
As shown by EQUATION 2 the piling stress can be decreased by
minimizing the cross-sectional width of the pile. The stress for the next
size smaller pile, an HP 10 x 36 (with y = 4.079), is 30.S ksi. Changing

10
the fixity condition at the pile top from "free" to "fixed" substantially
increases the calculated stresses for a given lateral deflection at the top.
These simplified elastic equations indicate that the pile stresses are
in the elastic range for movements of about 1 inch. A recent study in
North Dakota included monitoring deflections in a 450-foot concrete box
beam bridge. The total maximum movement including contraction and
expansion was found to be about 2 inches at each abutment. When the soil
resistance is included in the analysis, the calculated stress is reduced
but still can be above yield.
The limit of allowable horizontal movement which will cause
objectionable pile stresses has not been well defined. This is one reason
why the wide variation in design criteria exists among the state highway
agencies. A related question which may be equally difficult to answer is
to define the level of objectionable stress in a pile. That is, can
embedded piles give acceptable service operating at or near their yield
strength? Experience in Tennessee and studies in North Dakota seem to
indicate that they can.
2. Purpose
If thermal stresses can be accurately predicted and appropriately
handled, the elimination of deck joints on as many bridges as possible
is desirable. The current length limitation in Iowa for the use of
integral abutments in concrete bridges is 265 feet. The first application
with steel I-beam bridges in Iowa is currently under construction. These
dual Interstate bridges are 263 feet in length.
The purpose of this study is to gain a better understanding of the
11
behavior of integral abutments and to present background information
for the Iowa Highway Research Project HR-227, "Piling Stresses in
Bridges with Integral Abutments." The objective of the research study
is to propose maximum bridge lengths for steel and concrete bridges for
which integral abutments can safely be used.
3. Plan of Investigation
A survey questionnaire was prepared in cooperation with the Office
of Bridge Design, Highway Division, Iowa Department of Transportation,
to obtain information concerning the use and design of integral bridge
abutments. Based on a review of the survey, several states were later
contacted to gain a better understanding of successful design details
and assess the performance of reletively long integral abutment bridges.
Summaries of these telephone conversations with bridge engineers in
Tennessee, Missouri, North Dakota, Kansas, and California are included
in section II-4 of this report.
Most of the states which use integral abutments, as shown in
APPENDIX I, have developed specific guidelines concerning allowable
bridge lengths, design of the backwall, type of piling, etc. The basis
of these guidelines is shown to be primarily empirical.
A brief review of available methods of mathematically representing
the pile-soil system is conducted to determine what types of soil
information are required. Methods of obtaining the soil data are discussed
and limits are presented for use in the analysis.
Previous experimental studies have been conducted by Rowe,34 Alizadeh
and Davison,l Paduana and Yee,36 South Dakota Department of Highways,19
and North Dakota State University.17 These projects were reviewed and

12
compared to the possible methods of soil parament representation. Results
are presented which may be significant to the current research project.
II. SURVEY OF CURRENT PRACTICE
1. Purpose
Surveys concerning the use of integral abutments have previously been
conducted.19,12 They have indicated that there are marked variations in
design limitations and criteria for their use. Many states have not felt
comfortable using a system which does not contain some "free space" for
temperature variation displacements to occur.
Some of the variations among the states occur because of different
temperature range criteria. Also, depending on the extent of de-icing salt
use, some states may experience greater problems with bridge deck expansion
joint devices than others. Naturally, it is difficult to justify altering
existing construction techniques by either beginning the use of integral
abutments or using them for much longer bridges, if the possibility of
decreased distress and maintenance are not readily apparent.
The current survey was conducted to determine:
1. Various design criteria and limitations being used;
2. Assumptions being made regarding selected design parameters
and appropriate level of analysis;
3. Specific construction details being used;
4. Changes in trends since previous surveys \Vere taken; and
5. Long-term performance of bridges with integral abutments.
2. Questionnaire
The questionnaire was sent to the 50 states and Puerto Rico. Since
the Direct Construction Office, Region 15, Federal Highway Administration
is involved in bridge construction on Federally owned property, a question
naire was also sent to the design department in Arlington, Virginia. A
copy of the questionnaire and responses from each of these agencies are
14
contained in APPENDIX I.
The survey questions were directed at limitations in bridge length,
type, and skew. The states were also asked what assumptions were made
in determining fixity conditions and loads for design of the piling and
superstructure. A detail drawing of the type of integral abutment used
in Iowa was included in the questionnaire.
It was hoped that some of the states using integral abutments had
performed an analysis regarding anticipated movements and pile stresses.
The questions regarding fixity and design loads were included to determine
what level of analysis was felt to be appropriate.
Much of the progress in the use of integral abutments has come about
by successive extention of limitations based on acceptable performance of
prototype installations. In order to learn more from the several states
who have pioneered the use of integral abutments, questions were asked
regarding costs and performance.
3. Trends in Responses
Of the 52 responses received, 29 indicated that they use integral-type
abutments. A few of these, such as New Mexico and Virginia, are just
beginning to use them. Their first integral abutment bridge was either
recently designed or currently under construction.
Of the 23 who did not use these abutments, there were 4 groups having
similar responses.
1. Fourteen states have no plans to consider using this type of
abutment.
2. Five states responded that they have not previously considered
the possibility of fixing the girder ends to the abutments.

15
3. Three states have built some integral abutments or semi-integral
endwalls, but currently do not use them in new bridge construction,
4, One state indicated that they were presently investigating the
possibility of using integral abutments.
The following are some of the reasons given for avoiding the use of
integral abutments:
1. The possibility of a gap forming between the backwall and the
roadway fill (2 states);
2. Increased substructure loads (1 state);
3. The possible attenuation of a bump at the ends of the bridge
( 1 state);
4. The lack of a rational method for predicting behavior (1 state);
5. The possible additional stress on approach pavement joints
(2 states); and
6. Cracking of the backwall due to superstructure end span rotation
and contraction (2 states).
One of the purposes of this study is to present methods of analysis
and design details which will reduce the potential ill-effects of these
concerns. Many of the states currently using integral abutments have
effectively solved most of these problems.
The following is a discussion of the responses received from states
using integral abutments keyed to the question numbers of the survey. A
sunmary of the responses is contained in APPENDIX I.
1. Most of the states using integral abutments do so because of
cost savings. Typical designs use less piling, have simpler
construction details, and eliminate expensive expansion joints.
16
Some states indicated that their primary concern was to
eliminate problems with the expansion joint. A few said that
simplicity of construction and lower maintenance costs were
their motivation.
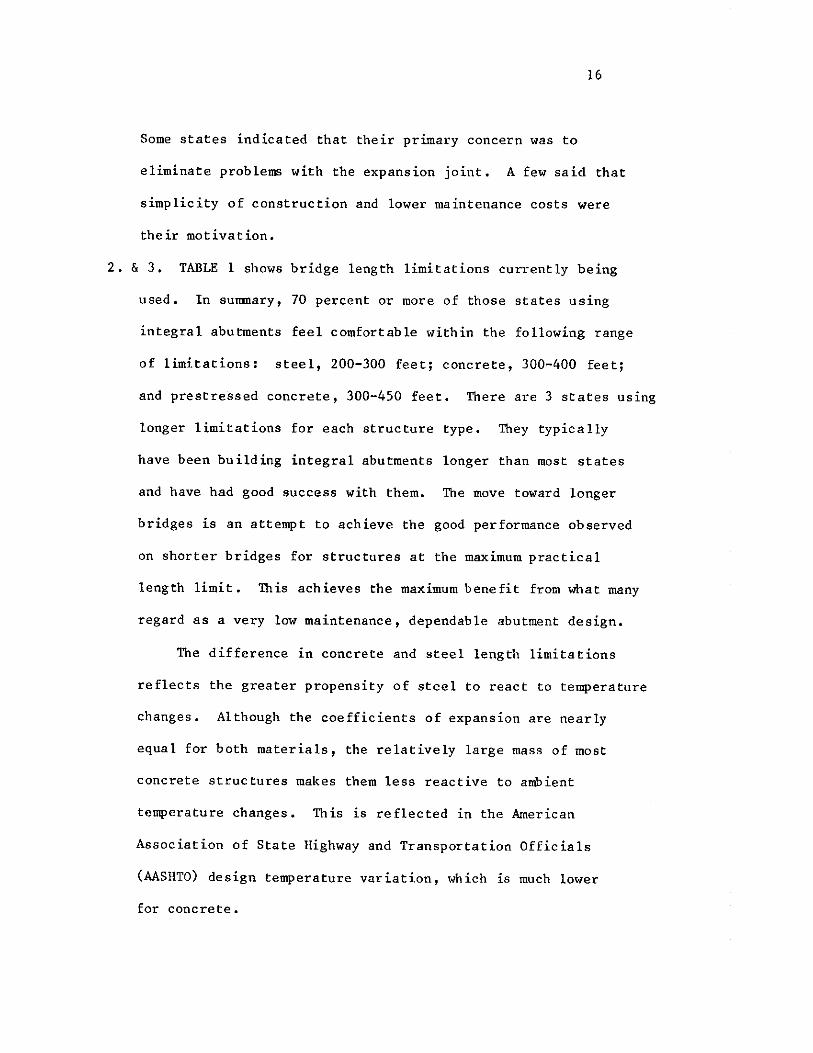
2. & 3. TABLE 1 shows bridge length limitations currently being
used. In suT11Dary, 70 percent or more of those states using
integral abutments feel comfortable within the following range
of limitations: steel, 200-300 feet; concrete, 300-400 feet;
and prestressed concrete, 300-450 feet. There are 3 states using
longer limitations for each structure type. They typically
have been building integral abutments longer than most states
and have had good success with them. The move toward longer
bridges is an attempt to achieve the good performance observed
on shorter bridges for structures at the maximum practical
length limit. This achieves the maximum benefit from what many
regard as a very low maintenance, dependable abutment design.
The difference in concrete and steel length limitations
reflects the greater propensity of steel to react to temperature
changes. Although the coefficients of expansion are nearly
equal for both materials, the relatively large mass of most
concrete structures makes them less reactive to ambient
temperature changes. This is reflected in the American
Association of State Highway and Transportation Officials
(AASHTO) design temperature variation, which is much lower
for concrete.
17
TABLE 1
Number of States Maximum Length Steel Concrete Pres tressed --
800 1 1
500 1 2
450 1 3
400 2 3 4
350 1 3 1
300 8 8 8
250 2 1
200 5 1 2
150 1
100 1
INTEGRAL ABUTMENT BRIDGE LENGTH LIMITATIONS (1981)
18
4, Only a few states responded to the question regarding limitations
on piling. Five states use only steel piling with integral
abutments. Three others allow concrete and steel but not
timber, No length limitations for timber piling were given by
states other than Iowa. Timber piling is allowed in Iowa for
bridges less than 200 feet in length. If the length is greater
than 150 feet, the top of the pile which is embedded in the
abutment is wrapped with 1/2 inch to 1 inch thick carpet padding
material. This allows some rotation of the abutment, reducing
the bending stress on the pile. Only 4 of the 29 agencies
indicated that the webs of steel piles were placed perpendicular
to the length of the bridge, In subsequent phone calls to a
few other states, it was learned that others also follow this
practice. At least 1 state began using integral abutments
with steel piling placed in the usual orientation (with the pile
web along the length of the bridge). This led to distress and
cracking at the beam-abutment interface, and the state eventually
began to rotate the piles by 90 degrees for greater flexibility.
The writer believes that many states accept this as common
practice and, therefore, did not mention it specifically.
5. & 6. Twenty-two states indicated that the superstructure was
assumed pinned at the abutments. Five assumed partial fixity,
and one assumed total fixity. Seventeen responses noted that at
the pile top a pinned assumption was made, 4 reported a partial
fixity assumption, and 5 states believe the pile top is
totally fixed, Six of the states which assume a pinned condition
19
actually use a detail which is designed to eliminate moment
constraint at the joint. In the absence of a detail which
allows rotation, the appropriate assumption depends largely on
the relative stiffnesses of the pile group and the end span
superstructure. For example, if a single row of steel piling
with their webs perpendicular to the length of the bridge was
used with a very stiff superstructure, the joint would probably
behave as if it were pinned in response to dead and live loads
and as if it were fixed in response to temperature movements.
If the stiffness of the pile group were increased, some degree of
partial fixity would result depending on the ratio of stiffnesses.
7. Only a few states consider thermal, shrinkage, and soil
pressure forces when calculating pile loads. Several states
noted on the questionnaire that only vertical loads are used in
design. Of those that do consider pile bending stresses, 8 use
thermal forces, 3 use shrinkage forces, and 10 consider soil
pressure.
8. Most states indicated that bending stresses in abutment piling
were neglected. There were 3 states, however, that assumed
a location for a point of zero moment and used combined bending
and axial stresses. Also, prebored holes were used by three
states to limit bending stresses by reducing the soil pressure.
9. Most states indicated that a free-draining backfill material is
used behind the abutment. Some responses, however, indicated
that problems were encountered such as undermining associated
with granular soils. One state said, "Have recently experienced

20
problems with non-cohesive material behind this type of
abutment. Backfill material should be cohesive and free from
cobbles and boulders." Six other states use common roadway
fill behind the abutment.
10. All except 4 states rest the approach pavement on the
integral abutment. One state indicated that a positive tie
connection was used to connect the slab. No comments regarding
the practice of resting the slab on a pavement notch were
noted. A few states indicated that they have experienced
problems when reinforced approach slabs were not used.
11. & 12. All except 3 states reported lower construction and
maintenance costs using integral abutments. One said costs
were the same and 2 did not respond to the question. The
following are some isolated comments that were made about
construction and maintenance problems using integral abutments:
a, Longer wingwalls may be necessary with cast-in-place,
post-tensioned bridges for backwall containment;
b, The proper compaction of backfill material is critical;
c. Careful consideration of drainage at the end of the
bridge is necessary;
d, Wingwall concrete should be placed after stressing of
cast-in-place, post-tensioned bridges;
e. The effects of elastic shortening after post-tensioning
should be carefully considered, especially on single
span bridges;
21
f. Proper placement of piles is more critical than for
conventional abutments;
g. Wingwalls may need to be designed for heavier loads to
prevent cracking;
h. Adequate pressure relief joints should be provided in
the approach pavement to avoid interference with the
functioning of the abutment;
i. Possible negative friction forces on the piles should
be accounted for in the design; and
j. Wide bridges on high skews require special consideration
including strengthening of diaphragms and wingwa 11-to
abu tment connections.
4. Review of Details and Design of Selected States
Telephone visits were conducted with 5 states to discuss in greater
depth the items covered on the questionnaire and to become more familiar
with their design rationale for integral abutments. They were Tennessee,
Missouri, North Dakota, Kansas, California, and Iowa. Some of the items
covered in the visits are discussed below.
a. Tennessee38
Tennessee has extensive experience with integral abutment
construction and performance. It is estimated that over 300 steel
and 700 concrete bridges have been built with integral abutments.
Mr. Ed Wasserman, Engineer of Structures, Tennessee Department of
Transportation, indicated that the state was very pleased with the
performance of these structures and has noted no undue stress on the
abutments.

22
The maximum length limits using integral abutments were arrived at
by setting a limit of expansion or contraction of 1 inch. This figure
was developed empirically over a period of several years. By using a
simplified column analysis with an unsupported length of 10 feet the
state calculated the piling stresses to be just slightly over yield
when deflected only 1 inch. Tennessee uses the average AASHTO
temperature change of 350 F for concrete structures and 600 F for steel.
The maximum bridge lengths (2L) for this allowable deflection (A) are
about 800 feet for steel and 400 feet for concrete .
L concrete = .1 = 1/12 = 396 feet o<c< 6 T)c ( .0000060 )( 35)
L steel = f:,. = 1/12 = 214 Feet. . (3) o<s( li T) s (.0000065)(60)
Where:
«c = Coefficient of thermal expansion for concrete (AASHTO)
(JT)c =Allowable temperature drop or rise for concrete (AASHTO)
o<s = Coefficient of thermal expansion for steel (AASHTO)
( li T)s = Allowable temperature drop or rise for steel (AASHTO)
Tennessee has not completed any research work to verify the
assumptions used to develop design criteria other than observing the
good performance of constructed bridges. Abutment details used by
Tennessee are very similar to Iowa's. Timber piles are not used.
b, Kansas39
Kansas has not participated in formal research activities to
formulate design criteria for integral abutments, The length
c.
23
limitations and details used have been developed empirically through
many years of experience. The following length limitations have been
established: steel, 300 feet; concrete, 350 feet; and prestressed,
300 feet. Mr. Earl Wilkinsen, Bridge Engineer, Kansas State Highway
Conmission, indicated that a few cast-in-place bridges up to 450 feet
long had been built in the past with integral abutments, but this is
not the general rule.
Point-bearing steel piles with 9000 psi allowable bearing are used
most often. Some concrete filled steel shell piling or prestressed
concrete piles are occasionally specified.
Missouri 2 5
Missouri had planned to instrument the piling of an integral
abutment several years ago but was unable to do so because of
construction timing. No other investigations of integral abutments
have since been planned.
Criteria for use of integral abutments have been developed
primarily from following the success of other states, notably Tennessee.
The maximum length limit for steel bridges has recently been increased
from 300 to 400 feet. Over 100 concrete bridges (mostly prestressed)
and over 40 steel bridges have been built with integral abutments over
a period of 12-15 years.
d. North Dakotall
North Dakota has built over 300 bridges with integral abutments.
Most of these have concrete superstructures. They have had good
performance except in two areas. First, the superstructure was
originally connected to the backwall with dowell bars which were placed
24
with insufficient cover, In some places the concrete over the dowell
bars on the inside face of the backwall cracked due to thermal forces
caused by contraction of the superstructure. Second, the piles were
originally placed with the webs parallel to the long axis of the bridge.
Using this orientation caused some distress in the backwall since the
piles offered relatively large resistance to lateral bridge movements,
The problem was eliminated when the piles were installed with the webs
perpendicular to the long axis of the bridge.
North Dakota was an early user of integral abutments, Their
design criteria is based mainly on their own experience. No formal
analysis methods are employed to calculate stresses in the piles.
Steel and concrete bridges are currently limited to 300 feet while
prestressed bridges are built up to 450 feet in length.
Last year the state built a 450-foot prestressed concrete box beam
bridge on a 0 degree skew near Fargo, North Dakota. The piling in the
integral abutments were instrumented with strain gauges and had
inclinometer tubes attached. Dr. Jim Jorganson, Civil Engineering
Department, North Dakota State University, was conrnissioned to monitor
the movements and strains in the bridge for one year. He will have a
preliminary report prepared late this summer, It appears that the
maximum total movement at each end is about 2 inches.17
equivalent to a temperature variation of about 117° F,
This is
The installation contains a unique feature which was designed by
Moore Engineering, West Fargo, North Dakota. A special expansion joint
material several inches thick is placed behind the abutment backwall.
Behind it is a sheet of corrugated metal. The mechanism is designed

e.
25
to reduce passive earth pressures on the abutment and to help reduce
the formation of a void space upon contraction of the superstructure.
The system is shown in FIGURE 18 and discussed further in Section III-6.
California7
California has engaged in several projects investigating the
performance of laterally loaded piles in bridge embankments. This
work has been done at California State University at Sacramento, and by
the California Department of Transportation, Bridge Department, and
will be described more fully in the literature review. The research
was able to suggest a correlation between the coefficient of subgrade
reaction used in an elastic design method to the standard penetration
blowcount. Maximum bending moments in steel H-piles were predicted
within 15 percent of measured values.
California does not analyze pile stresses due to bending at each
bridge site. Guidelines have been developed to aid designers in
determining the type of abutment to use. They are currently using
integral abutments with concrete bridges up to 320 feet long. Because
of the effects of elastic shortening on application of post-tensioning
forces, the length limitation for prestressed bridges is about 100 feet
less. Design of the endwall is based on specified horizontal loads
depending on the type of piling used (see APPENDIX II).
f. Iowal4
Iowa began building integral abutments on concrete bridges in 1965.
One of the first was on Stange Road over Squaw Creek in Ames. This
prestressed beam bridge is about 230 feet long with no skew. The writer
visited this bridge in August 1981 to determine if any apparent distress
26
was evident. Both approaches were generally in good shape with no
major cracking noted. The abutment walls, wingwalls, and beams showed
no thermal movement related cracking or distress.
Mr. Henry Gee, Structural Engineer, Office of Bridge, Iowa
Department of Transportation, inspected at least 20 integral
abutment bridges yearly for about 5 years after construction. They
varied in length from 138 to 245 feet with skews from 0 to 23 degrees.
The inspections were terminated since no distress or problems were
found which related to the lack of expansion joints in the superstructure.
Iowa's length limitation for integral abutments in concrete bridges
is 265 feet. This is based on an allowable bending stress of 55 percent
of yield plus a 30 percent overstress since the loading is due to
temperature affects. The moment in the pile was found by a rigid frame
analysis which considered the relative stiffness of the superstructure
and the piling. The piles were assumed to have an effective length of
10.5 feet, and the soil resistance was not considered. The analysis
showed that the allowable pile deflection was about 3/8 inch.
5. Summary
There is wide variation in design assumptions and limitations among
the various states 1n their approach to the use of integral abutments.
This is largely due to the empirical basis for development of current
design criteria. Some states, such as Tennessee and Iowa, have used
traditional statics analysis methods for a beam or beam-column to estimate
piling stresses. It is recognized, however, that assumptions concerning
end fixity and soil reaction may substantially affect the results. A

27
simple rational method of accurately predicting pile stresses would be a
valuable addition to the current state-of-the-art in integral abutment
design.
Those who use integral abutments are generally satisfied with
performance and believe they are economical. Some problems have been
reported, however, concerning secondary effects of inevitable lateral
displace!IJ3nts at the abutment. These include abutment, wingwall,
pavement, distress, and backfill erosion. Only a few states noted that any
difficulty had been encountered (see "Conments" section in APPENDIX I).
Other states reported that solutions have been developed for most of the
ill-effects of abutment movements. They include: (1) additional reinforcing
and concrete cover in the abutment, (2) more effective pavement joints
which allow thermal movements to occur, and (3) positive control of bridge
deck and roadway drainage. From the comments of most states, the writer
infers that the benefits from using integral abutments are sufficient to
justify the additional care in detailing to make them function properly.
Very little work has been done to monitor the actual behavior of
integral abutments except in checking for obvious signs of distress in
visible elements of the bridge. The research work being done in North
Dakota to monitor actual strains and pile displacements in an actual
integral abutment installation is one of very few full-scale projects, It
is reported on more fully in section III-6 of this report.
Several states have been progressively increasing length limitations
for the use of integral abutments over the last 30 years. Improvements in
details have also taken place which generally can eliminate the possibility
of serious distress occurring with abutment movements of up to 1 inch. These

28
progressive steps in state-of-the-art bridge engineering have occurred
over the past thirty years and are primarily the result of the observance
of satisfactory performance in actual installations.
III. LITERATURE REVIEW
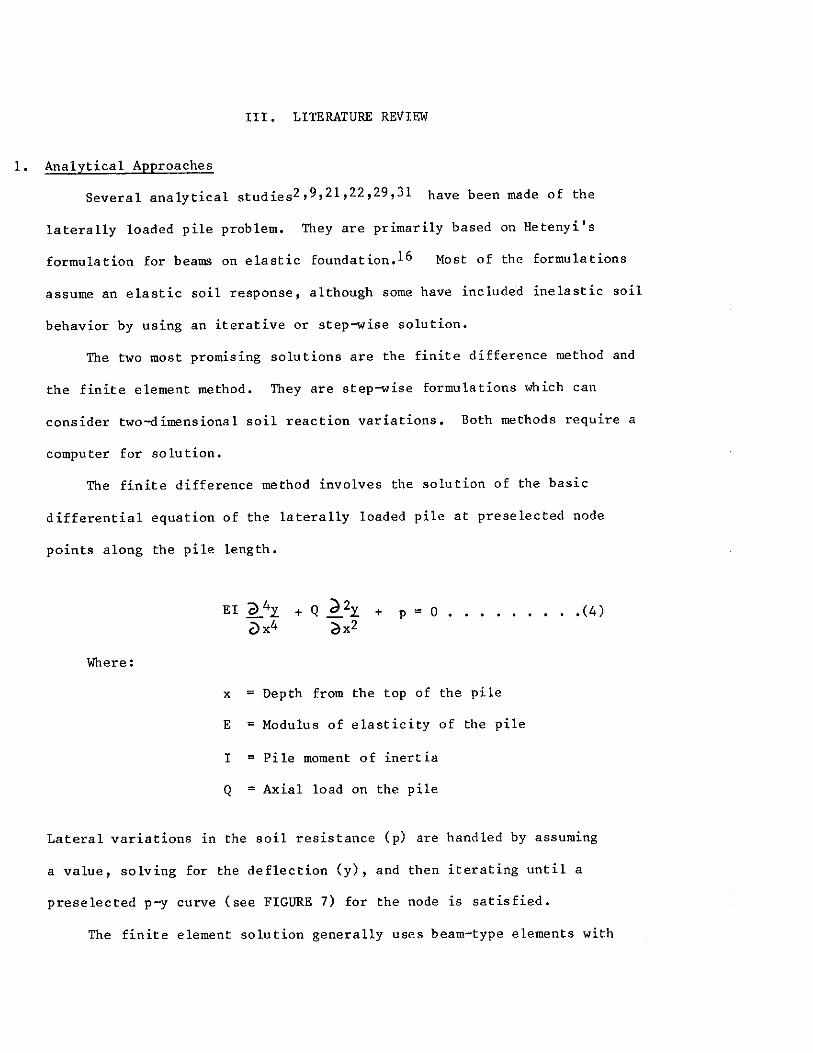
1. Analytical Approaches
Several analytical studies2,9,21,22,29,31 have been made of the
laterally loaded pile problem. They are primarily based on Hetenyi's
formulation for beams on elastic foundation.16 Most of the formulations
assume an elastic soil response, although some have included inelastic soil
behavior by using an iterative or step-wise solution.
The two most promising solutions are the finite difference method and
the finite element method. They are step-wise formulations which can
consider two-dimensional soil reaction variations. Both methods require a
computer for solution.
The finite difference method involves the solution of the basic
differential equation of the laterally loaded pile at preselected node
points along the pile length.
+ p = 0 ......... (4)
Where:
x = Depth from the top of the pile
E = Modulus of elasticity of the pile
I = Pile moment of inertia
Q = Axial load on the pile
Lateral variations in the soil resistance (p) are handled by assuming
a value, solving for the deflection (y), and then iterating until a
preselected p-y curve (see FIGURE 7) for the node is satisfied.
The finite element solution generally uses beam-type elements with
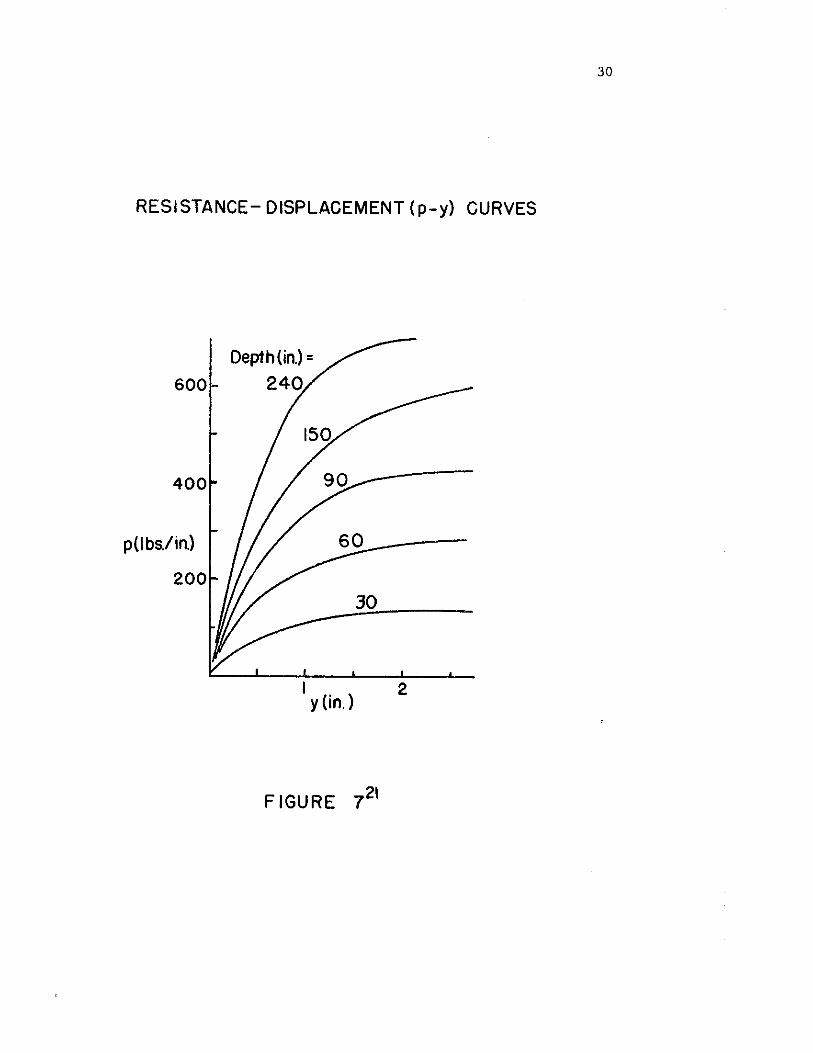
RESISTANCE- DISPLACEMENT (p-y) CURVES
Depth (in.) = 600 240
400
p(I bs./ in.)
200 30
I 2 y (in.)
FIGURE 7 21
30
31
three degrees of freedom (x and y translation and in-plane rotation).
Lateral soil springs are used to model the soil structure interaction
characteristics. The spring values are adjusted after iterative solutions
for pile deflections are compared with given p-y curves. After the soil
resistance values are determined to the desired precision, the final
structural stiffness matrix is formed, displacements are calculated, and
element forces and stresses can then be evaluated.
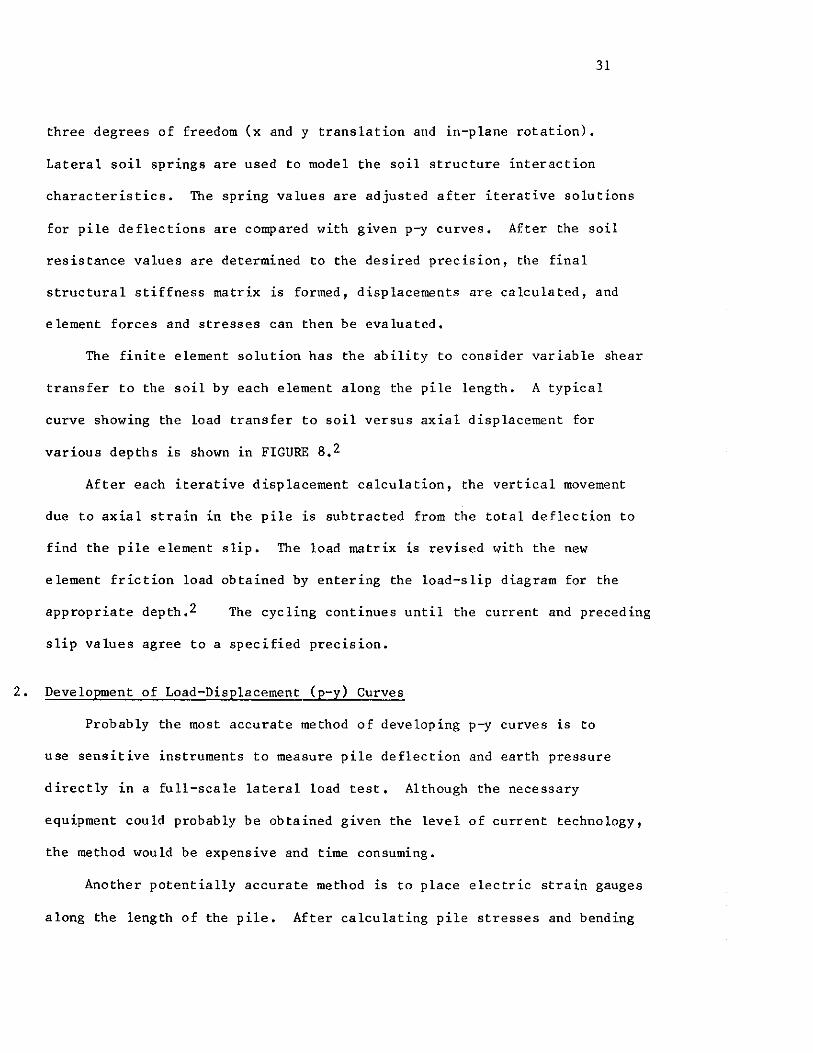
The finite element solution has the ability to consider variable shear
transfer to the soil by each element along the pile length. A typical
curve showing the load transfer to soil versus axial displacement for
various depths is shown in FIGURE 8.2
After each iterative displacement calculation, the vertical movement
due to axial strain in the pile is subtracted from the total deflection to
find the pile element slip. The load matrix is revised with the new
element friction load obtained by entering the load-slip diagram for the
appropriate depth.2 The cycling continues until the current and preceding
slip values agree to a specified precision.
2. Development of Load-Displacement (p-y) Curves
Probably the most accurate method of developing p-y curves is to
use sensitive instruments to measure pile deflection and earth pressure
directly in a full-scale lateral load test. Although the necessary
equipment could probably be obtained given the level of current technology,
the method would be expensive and time consuming.
Another potentially accurate method is to place electric strain gauges
along the length of the pile. After calculating pile stresses and bending
LOAD - SLIP CURVES
16
14
Load transfer 12
to soil (tst) 10
8
6
4
Depth (ft.)= 26.5
22.6
17.7
12.6
o.4 o.a 1.2 1.6 2.0 2.4 Vertical displacement(in.)
FIGURE 8 2
32

33
moments from the strain readings, the soil pressure (p) and lateral
displacement (y) can be found from EQUATIONS 5 and 6.
Where:
y = JfM/EI dx
p = d2M/dx2 •
M = Applied moment 1n the pile
(5)
(6)
This method is also quite expensive and requires extreme care in
taking measurements since the deflection is extremely sensitive
to variations in the bending moment.33
It is possible to obtain approximate values for p-y variations
along the pile by knowing the load, moment, deflection, and rotation at
the top of a test pile. This simple test requires only that a pile be
driven beyond the point below which the soil has no appreciable affect
on pile-top deflections and a lateral load be applied while measurements
are periodically recorded. The method is based on Reese and Matlock's
non-dimensional solutions31 which assume a linear variation of soil
modulus with depth. Relatively accurate information can be obtained,
but the method30 does require actual field measurements to be taken.
Several investigators20,32,33 have attempted to correlate a lateral
load-deflection response with laboratory soil tests. The form of the
equation normally used is shown in EQUATION 7.
p = cyl/n . . . . . . . . . . . . . . . . . . (7)
Where:
c = A constant which varies on soil properties
n = A constant which varies with the type of soil

34
Possible functional relations and values for C and n are shown in
TABLE 2, The following specific values for a soft clay have been suggested
by Mat lock20:
C = Pu/2(y5o)l/3 ••••••••..•••. (B)
Where:
Pu = {3cb+'tbx+cx/2 (Ba) 9cb (use smaller value)
(Bb)
Y50 = 2.5b£50 • (Be) . . . . . . . . . . . . . . . . Y50 = Displacement at 50 percent of the maximum
deviator stress
€50 = Strain at 50 percent of the maximum devia tor stress
The Iowa Department of Transportation's current soil investigation
procedure at bridge sites includes taking a split tube sample if
compressible layers are found in the area of the approach fill. Soil
strength, unit weight, and compressibility data are routinely obtained on
these samples by performing triaxial, density, and consolidation tests. If
three split tube samples were taken, sufficient information would be avail-
ble to predict the soil response with reasonable accuracy to a depth of
about 15 feet. Since soil conditions below about 15 feet have little affect
on bending stresses in laterally loaded piles,28,1 sample depths of 3, 7,
and 12 feet would seem to be convenient choices.
If stiff clay is encountered, the equations are modified slightly.
Generally, e50 will be somewhat lower and the exponent is changed from 1/3
to 1I4.
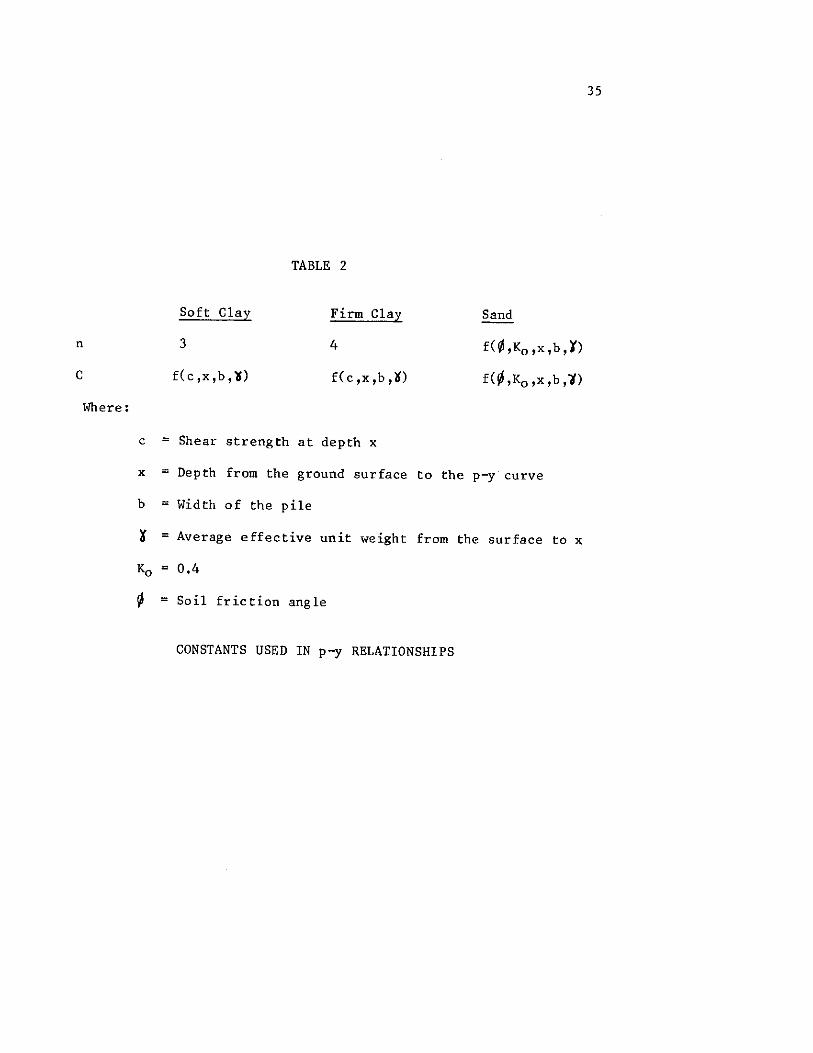
n
c
Where:
c =
x =
b =
~ =
Ko =
¢ =
Soft Clay
3
f(c,x,b,'6)
Shear strength
Depth from the
TABLE 2
Firm Clay
4
f(c,x,b,lO
at depth x
ground surface
Width of the pile
Average effective unit weight
0.4
Soil friction angle
Sand
f(~,K0 ,x,b,)')
f(~,K0 ,x,b,1)
to the p-y curve
from the surface to x
CONSTANTS USED IN p-y RELATIONSHIPS
35
36
Above a certain depth (H) the ultimate lateral soil resistance (Pu) is
given by:
Where:
Pu = A°(x [ .ISoxtan0s in6 + tan({J-~) cos"
(b + xtanptan")
~
¢
x
<>(
(J
Ko
Ka
b
A,B
H
H
+ K0 xtan{J(tar$sinp-tanl() - Kabl ••••••••• (9)
= Average effective unit weight from the surface to x
= Friction angle of the soil
= Depth from surface to point where p-y curve is desired
= ti/2
= 45 + t/J/2
= 0.4
= tan2(45-0/2)
= Pile width
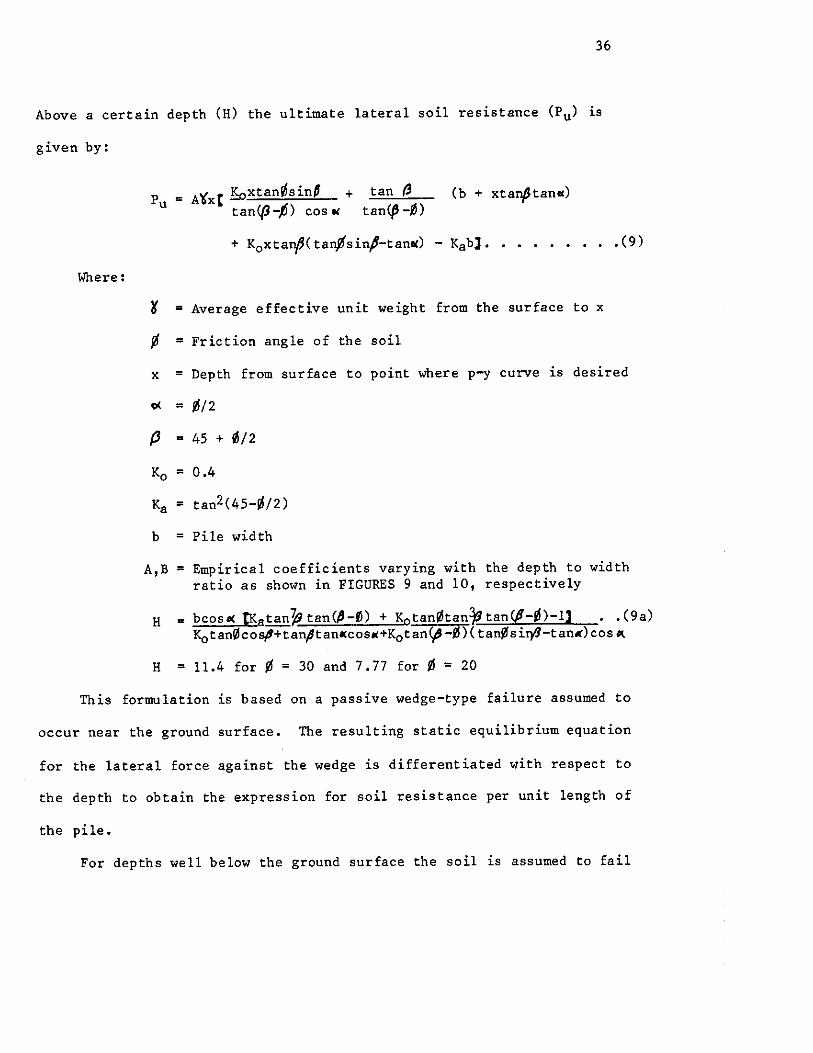
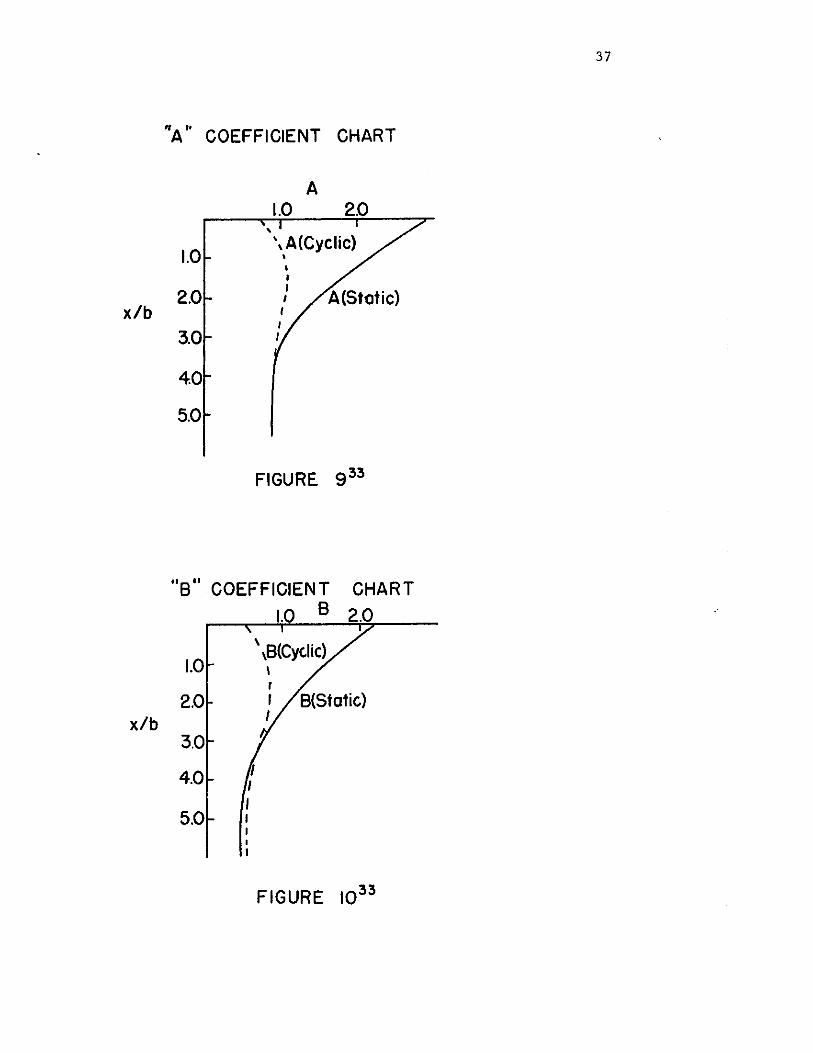
= Empirical coefficients varying with the depth to width ratio as shown in FIGURES 9 and 10, respectively
= bcoso< tKatan~tan(i'-1!) + K0 tant/Jtan~tan(P-t/J)-l] •• (9a) Kotan0cosp'+tanptan«cos«+K0tan(,8-~)(tan~sirtJ-tan«)cos~
= 11.4 for ti= 30 and 7.77 for ti= 20
This formulation is based on a passive wedge-type failure assumed to
occur near the ground surface. The resulting static equilibrium equation
for the lateral force against the wedge is differentiated with respect to
the depth to obtain the expression for soil resistance per unit length of
the pile.
For depths well below the ground surface the soil is assumed to fail
x/b
x/b
"A•· COEFFICIENT CHART
A 1.0 2.0
'
1.0 \A(Cyclic) ' ' I
2.0 I I
I I
3.0 I
4.0
5.0
FIGURE. 9 33
"9" COEFFICIENT CHART
1.0 B 2.0
1.0
2.0
3.0
4.0
5.0
1 I I I I
FIGURE 1033
37

38
by flowing horizontally in a rectangular section around the pile. Active
earth pressure is assumed to be the minimum pressure adjacent to the pile.
The total soil resistance at depths greater than H is calculated using
Mohr-Coulomb theory and is given by
Pu = AKab~x(tan~-1) + AKobixtanptan4/] ••••••••••• (9b)
An intermediate value (Pm) on the p-y curve can also be calculated
using either EQUATION 9 or 9b if the coefficient B (see FIGURE 10) is used
in place of A. The value of Pm is located on the curve (see FIGURE 11)
where y=b/60.
3. Example p-y Curve
To illustrate the procedure further, a set of p-y curves will be
developed for a fine sand. For use in this example, the sand will be taken
to have a standard penetration blowcount (N) of 15. Based on the given N
value, the sand will be assumed to have medium relative density and
moderate strength. In this case, values of 105 pounds per cubic foot and
30 degrees will be used for effective unit weight and friction angle,
respectively. Using EQUATION 9a, the H value is 11.4. Selecting x equal
to 3 feet, EQUATION 9 yields Pu equal to 184 pounds per inch and Pm equal
to 104 pounds per inch.
The initial straight portion of the p-y curve is defined by the
modulus of subgrade reaction (k), where k = °hX, and nh is the constant
of horizontal subgrade reaction.36 An appropriate value for nh is selected
from TABLE 3. Since the results are reletively sensitive to the value
selected, correlation with field tests is desireable.
39
APPROXIMATE p-y CURVE FOR A FINE SAND
200 ,X
150
100
50
(lb/in)
x
x
k
. I
y (in)
x
- Using the method of Reese et al 33
. ·· .. using the power curve only
.2 .3 .5
FIGURE 11
Reletive Density
Reconmended nh lb/in3
TABLE 3 Loose
20
RECOMMENDED nh VALUEs33
40
Medium Dense
60 125
The general shape of the curve is shown in FIGURE 11. Points m and u
are established at:
Ym = b/60 and Yu = 3b/80. . . . . . . . • (10)
Point k is located at:
Yk = (C/nhx) n/n-1 . . . . . . . . . . . • (11)
Where:
c = Pm/Yml/n
n = Pm/mym
m = (Pu-Pm) IYu-Ym) •
In this example the following values are obtained using the above
equations and the assumed values of effective unit weight and friction
angle for a fine sand:
Yu = .375 inches
Ym = .167 inches
m = 385.0 pounds per square
n = 1.62
C = 314.0 pounds per inch
Yk = .0065 inches
inch
The portion of the curve between k and mis defined by p = 314yl/l.64.
41
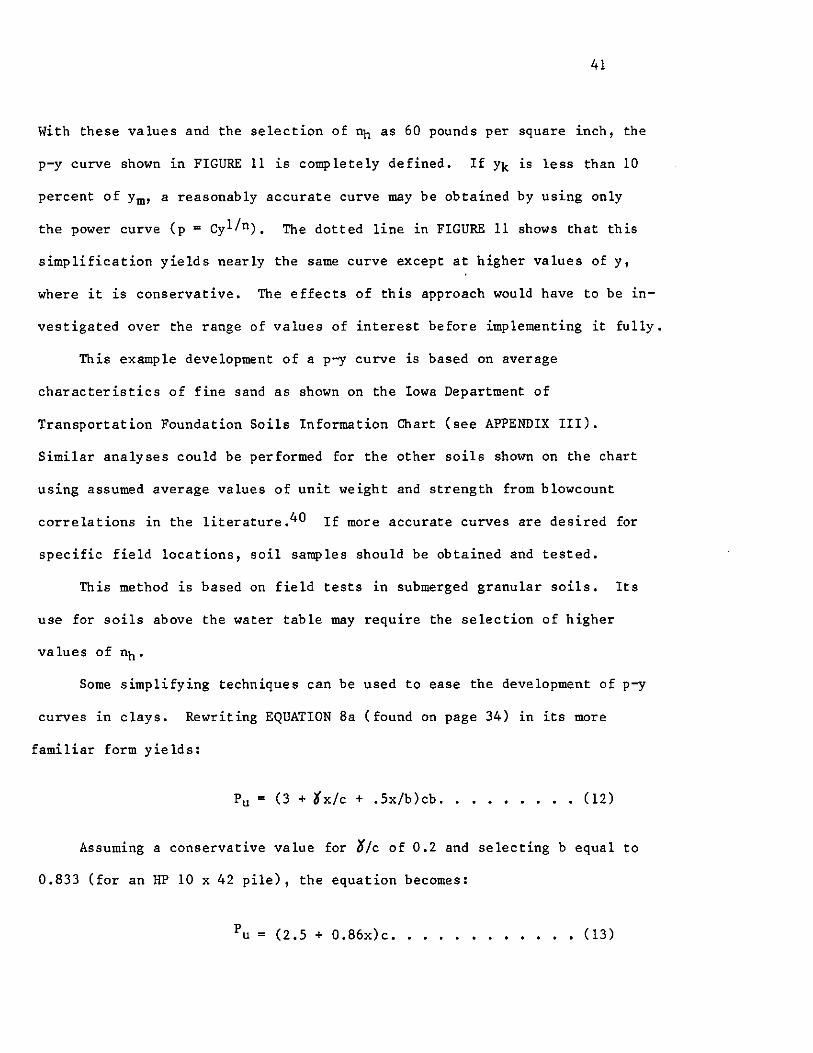
With these values and the selection of nh as 60 pounds per square inch, the
p-y curve shown in FIGURE 11 is completely defined. If Yk is less than 10
percent of Ym, a reasonably accurate curve may be obtained by using only
the power curve (p = cylfn). The dotted line in FIGURE 11 shows that this
simplification yields nearly the same curve except at higher values of y,
where it is conservative. The effects of this approach would have to be in
vestigated over the range of values of interest before implementing it fully.
This example development of a p-y curve is based on average
characteristics of fine sand as shown on the Iowa Department of
Transportation Foundation Soils Information Chart (see APPENDIX III).
Similar analyses could be performed for the other soils shown on the chart
using assumed average values of unit weight and strength from blowcount
correlations in the literature.40 If more accurate curves are desired for
specific field locations, soil samples should be obtained and tested.
This method is based on field tests in submerged granular soils. Its
use for soils above the water table may require the selection of higher
values of nh.
Some simplifying techniques can be used to ease the development of p-y
curves in clays. Rewriting EQUATION Ba (found on page 34) in its more
familiar form yields:
Pu = (3 + tx/c + .Sx/b)cb .•••••••• (12)
Assuming a conservative value for o/c of 0.2 and selecting b equal to
0.833 (for an HP 10 x 42 pile), the equation becomes:
Pu = (2.5 + 0.86x)c •••••••••••• (13)
42
EQUATION Sb can be written for an HP 10 x 42 pile as:
Pu= 7.Sc • ..•..•............ . (14)
Therefore, EQUATION 13 controls to a depth of 5.8 feet. Thereafter,
equation 14 begins yielding a lower value of Pu•
If 6'50 in EQUATION Be is taken as 0 .02 for soft clays,10 the
constant C can be written as:
c = {C4.6 + l.6x)c 13.Bc
and there fore:
p = fC4.6 + l.6x)cyl/3 13.Scyl/3
x<5 .8 feet x)5.8 feet ' ' ' ' .(l 5)
x(5,8 feet x)5.8 feet ' ' ' ' ,(16 )
A similar development can be done for stiff clay takinge50 as 0.005
so that:
p = [(4.7 + l.6x)cyl/4 13.Scyl/4
x<5. 7 feet x>5.7 feet • • • • .Cl 7)
This approximate formulation is good for 10 inch piles only. It is
useful, however, since only a shear strength value is needed to develop p-y
curves for various depths. In an effort to develop a method of predicting
average shear strength values for conman surface soils in Iowa, historical
soil test records from the Iowa Department of Transportation were studied
by the writer. Soil test data from split tube samples were available from
locations throughout the state. However, the writer selected data from 19
sites in 4 Iowa counties (Blackhawk, Benton, Buchanan, and Linn) for further
study. Values of standard penetration blowcount (N) and shear strength (c)

43
were fit to a simple linear prediction model. The following best fit
equation had a correlation of 0.82 with the actual data:
c = 97.0 N+114.0 pounds per square foot •••• (18)
Where:
c = Shear strength
N = Standard penetration blowcount
This simplified procedure should allow quick calculation of approximate
p-y curves based only on readily available N values. If this method were
to be routinely used, further study should be done to verify and improve
the shear strength prediction model and to further limit the 't/c ratio for
soft and firm clays.
4. Development of Load-Slip Curves
The vertical load on a pile can be carried by shear transfer to the
adjacent soil and by bearing at the end point. Numerous methods have been
proposed for estimating the ultimate end-bearing resistance of an embedded
pile.40 There are large variations in the results from these methods in
part since they are based on different failure modes, The skin resistance
can be estimated by methods proposed by Meyerhof,24 Tomlinson,37 and Seed
and Reese. 40 Their procedures involve empirica 1 re la tionsh ips derived from
pile load tests.
The basic expression for the ultimate soil resistance for point
bearing of a pile in clay is:
qf = cNc + q0 Nq ••••••••••••••• (19)
44
Where:
qf = Ultimate soil resistance
c = Shear strength
qo = Effective vertical stress at the pile tip
Nc,Nq = Dimensionless bearing capacity factors
Ne = (Nq-l)cot Ji
The strength parameters for a typical glacial clayl5 in Iowa may be
represented by c = 1400 pounds per square foot and ~ = 9°. Using an
Nq of 3 as recollll\ended by Meyerhof40 and an assumed average buoyant unit
weight for the overburden of 65 pounds per square foot, a 40-foot
pile has an ultimate end-bearing of 25 kips per square foot. Using an
HP 10 x 42 pile as is conman in Iowa, the ultimate point load is about 2.2
kips. Iowa glacial clay deposits can yield much higher bearing values than
this, but on the average the point resistance can be neglected for the
purpose of this study. Certainly if the pile is founded in alluvial silts
or soft clay soils, the end-bearing is also negligible.
The point load in sandy soils can be estimated using the traditional
bearing capacity formula with appropriate estimates of the shear strength
and density. Meyerhof40 has also proposed an empirical method for use in
granular soils.
qf = SN ••••••••••••••••••• (20)
Where:
qf = Ultimate soil resistance
N = Standard penetration blowcount
45
For example, gravelly sand as shown in the Iowa Department of
Transportation Foundation Soils Information Chart has an average N value of
21. The point load using a HP 10 x 42 pile is 14.5 kips. Alternately,
under the same assumptions used in the glacial clay example and assuming a
friction angle of 35 degrees (Nq = 49)3 for the gravelly sand, the bearing
capacity formula yields an ultimate point load of 11 kips. Unless the
friction angle and soil density are known at a specific site, EQUATION 20
can be used as a satisfactory approximation.
Point-bearing piles which are properly seated in bedrock can normally
be assumed capable of carrying allowable pile loads with little or no
displacement. That is, they behave like elastic columns.40 This limits
the amount of skin resistance that can develop. Some shear load transfer
will occur, however, due to elastic shortening of the pile.
The following is a typical note included on bridge foundation plans by
the Iowa Department of Transportation to assure proper seating of point
bearing piles:
"Steel HP 10 x 42 point-bearing piling shall be driven to practical
refusal and seated in sound rock. Seating shall be done with a
diesel hamner with a ram weight of at least 2,700 pounds
delivering at least 19,000-foot pounds of energy or a gravity
hamner having an effective weight of at least 4,500 pounds and
driving energy of not less than 36,000-foot pounds nor more than
40 ,000-foot pounds. u26
The design bearing value is also normally specified. In Iowa it is
limited to a load causing an axial stress of 6,000 pounds per square inch
when used in an integral abutment. Under these conditions it may be

46
assumed that virtually no settlement of the pile tip occurs.
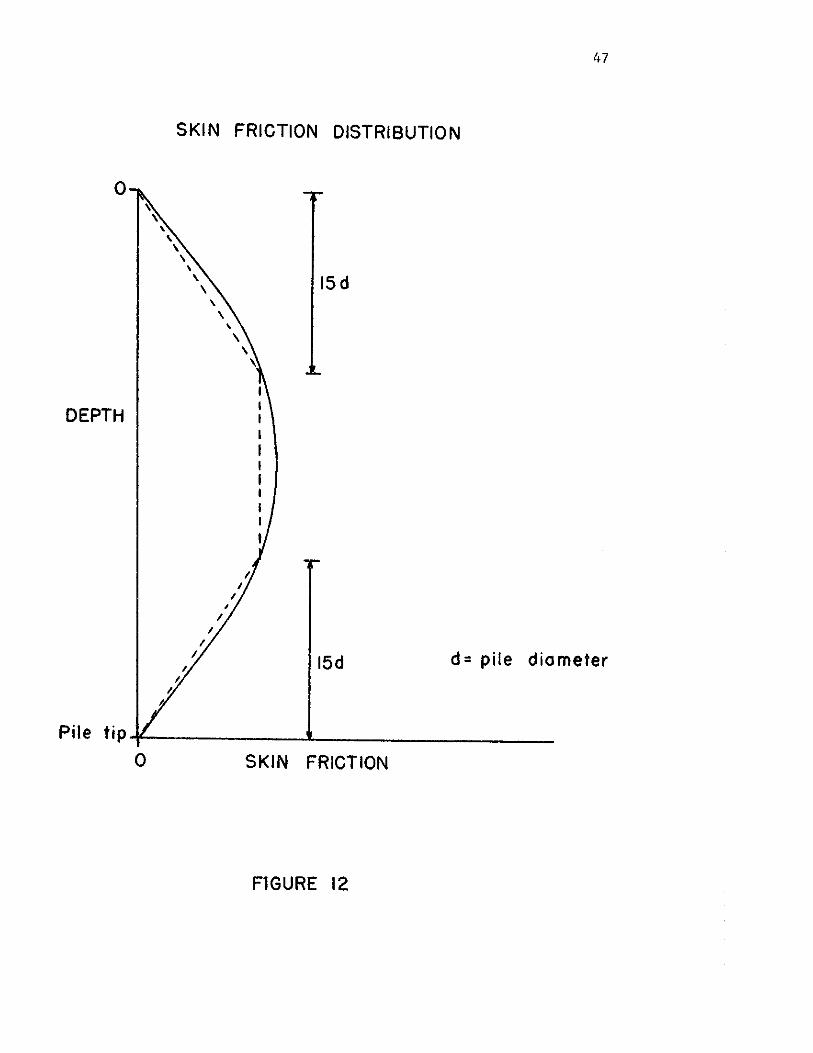
Some investigators40 have assumed that the distribution of skin
friction along the length of the pile is parabolic for a floating point
pile (see FIGURE 12). This is intuitively reasonable if the shear transfer
is considered to be a function of the pile displacement and available shear
resistance, which vary inversely along the length of the pile to some point
where the resistance may reach a maximum. For practical problems the
distribution can be assumed to be linear to a depth of about 15 pile
dia012ters where a maximum value of shear resistance can be taken.40 This
is shown in FIGURE 12 as a dashed line. Meyerhof24 has related this
maximum value to the standard penetration blowcount (N).
17nax = .02 N kips per square foot ••••• (21)
Where:
~ax = Ultimate soil shear resistance
Tomlinson37 has presented a method to estimate the maximum value using
the soil shear strength (c).
Where:
Jmax = acPp ••• • • •••• • • ••••• (22)
Pp = Pi le perimeter
a= 0.7 for most applications in soft clay. (Other suggested values are contained in the literature.)
These two methods24,37 were compared by the writer to empirical data
developed by the Iowa Department of Transportation35 for routine pile length
design as shown in TABLE 4. The previously described blowcount-shear
0
DEPTH
47
SKIN FRICTION DISTRIBUTION
, I
I. ,
15d
15d d= pile diameter
Pile tiP 4----------"'-----------0 SKIN FRICTION
FlGURE 12

TABLE 4
Ave N-value Steel H-Pile 16" Concrete Pile
Iowa DOT Meyerhof Tomlinson Iowa DOT Meyerhof Tomlinson
Very soft silty clay 1 .8 .27 .49 2.0 .44 1.1 So ft silty clay 3 .8 .82 .94 2.0 1.3 2.2 Stiff silty clay 6 1.6 1.6 1.6 3.2 2.6 3.7 Stiff silt 5 1.6 1.4 1.4 3.2 2.2 3.2 Stiff sandy silt 5 1.6 1.4 1.4 3.6 2.2 3.2 Stiff sandy clay 6 2.4 1.6 1.6 3.6 2.6 3.7 Silty sand 8 2.8 2.2 4.0 3.5 Clayey sand 13 2.4 3.6 4.0 5.7 Fine sand 15 2.4 4 .1 4.4 6.6 Course sand 20 3.6 5.5 4.8 8.7 Gravelly sand 21 3.6 5.7 6.4 9.2
Ultimate Soil Shear Resistance (kips /linear foot of pile)

49
strength correlation was used to establish c for use in Tomlinson•s37
formula. The values used by Iowa are based on numerous pile load tests,
many of which were taken to yield.14 The shear resistance was assumed to
be equal at all depths within a given soil type layer. Values were first
developed from tests in predominately one soil type. Once some of the
values were established, others could be obtained from tests in multi
layered soils. For the purposes of this study, it is recomnended that the
Iowa Department of Transportation values be used.
In many of the pile load tests conducted by the Iowa Department of
Transportation the yield point was taken at a vertical settlement of 0.2
inches. Notable exceptions to this were long piles driven through a thick
layer of soft soil which had high yield displacements (up to 1.5 inches)
and point bearing piles which had very low yield displacements (as low as
0.04 inches). For pile load testing currently conducted by Iowa, the yield
point is defined as the point where settlement is no longer proportional to
the load and shows a marked deviation from normal. The Department of
Transportation soil engineering staff believe that testing under this
criteria tends to support the 0.2 inch yield point for most Iowa soils.14
This value represents the gross displacement at the top of the pile.
However, it can be used to estimate the point where the maximum load
transfer to the soil occurs if elastic shortening of the pile is accounted
for by using an arbitrary reduction of 0.05 inch. This is the elastic
shortening of an HP 10 x 42 steel pile loaded at half the normal allowable
load (37 tons) in Iowa at a point halfway down a 40-foot embedment length.
5. Example Load-Slip Curves
Based on the foregoing empirical data, the load-slip relationships
50
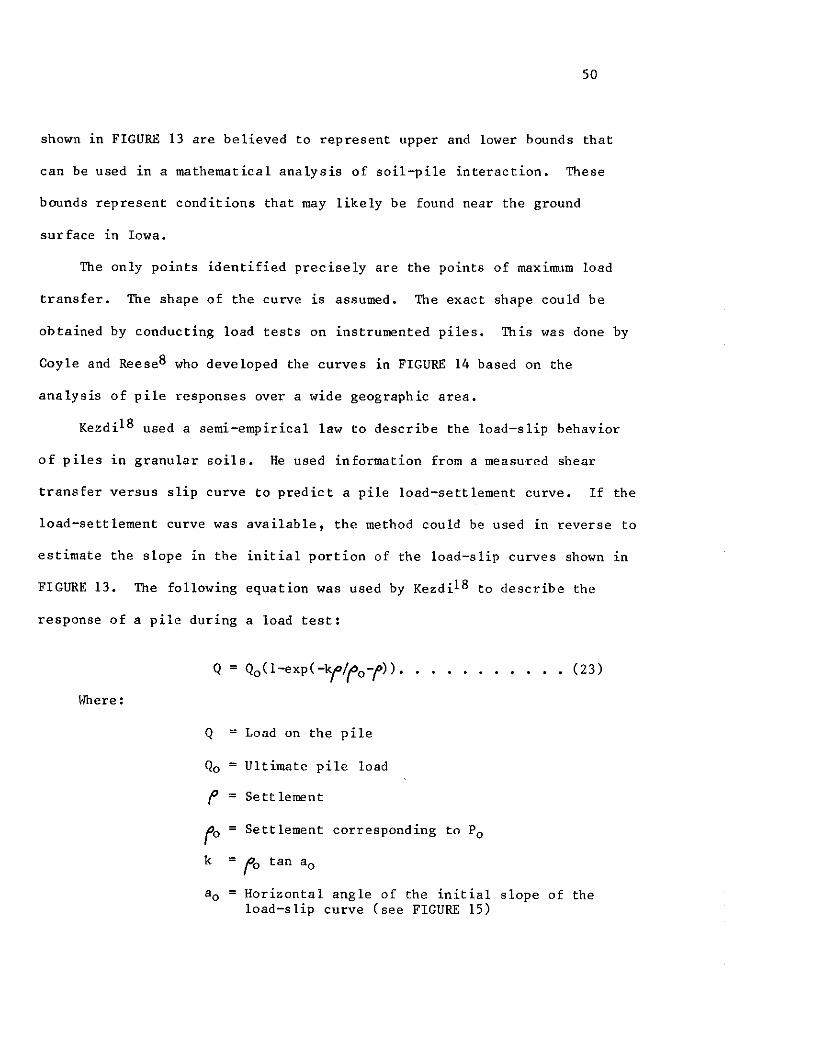
shown in FIGURE 13 are believed to represent upper and lower bounds that
can be used in a mathematical analysis of soil-pile interaction. These
bounds represent conditions that may likely be found near the ground
surface in Iowa.
The only points identified precisely are the points of maximum load
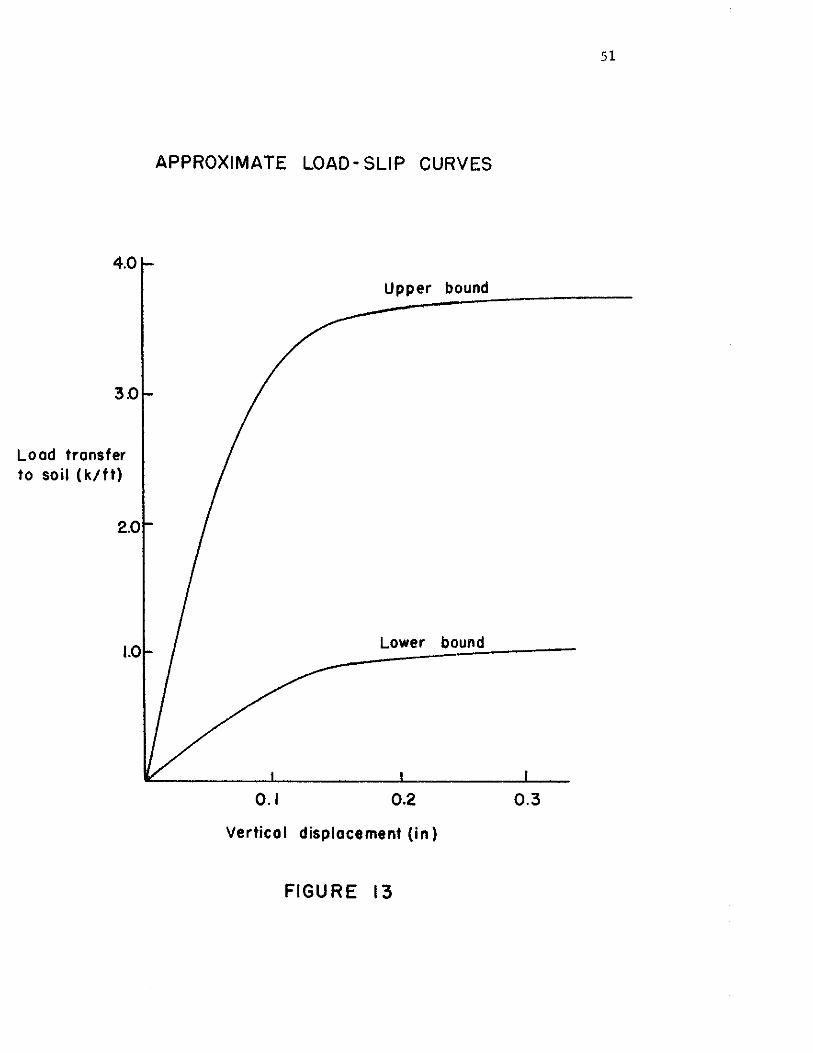
transfer. The shape of the curve is assumed. The exact shape could be
obtained by conducting load tests on instrumented piles. This was done by
Coyle and ReeseB who developed the curves in FIGURE 14 based on the
analysis of pile responses over a wide geographic area.
KezdilB used a semi-empirical law to describe the load-slip behavior
of piles in granular soils. He used information from a measured shear
transfer versus slip curve to predict a pile load-settlement curve. If the
load-settlement curve was available, the method could be used in reverse to
estimate the slope in the initial portion of the load-slip curves shown in
FIGURE 13. The following equation was used by KezdilB to describe the
response of a pile during a load test:
Q = Qo(l-exp(-kflfo-f)) • . . . . . . . . . (23)
Where:
Q = Load on the pile
Qo = Ultimate pile load
f = Settlement
fo = Settlement corresponding to P0
k = fo tan a0
ao = Horizontal angle of the initial slope of the load-slip curve (see FIGURE 15)
4.0
Load transfer to soil (k/ft)
APPROXIMATE LOAD· SLIP CURVES
Upper bound
Lower bound
0.1 0.2
Vertical displacement (in)
FIGURE 13
51
0.3
EMPIRICAL LOAD-SLIP CURVES
1.5
1.0 Load transfer
Shear resistance 0.5
o.o 5 0.10 0.15
Slip (in)
FIGURE 14 2
52

5.0
4.0
Shear transfer (kp t)
2.0
1.0
INITIAL SLOPE ESTIMATION FOR
LOAD-SLIP CURVES
53
ACTUAL PILE LOAD
TEST DATA
Oo
Pile lood Q(kips)
I
: ,,Oo
Settlement p (in)
FOR GRANULAR SOILS
Q0 = Ultimate pile load
fo = Ultimate settlement
0.1 0.2 0.3 Slip (in)
FIGURE 15
54
This equation can be solved for a0 as shown in FIGURE 15. By knowing
the yield point and any other point on the pile load test curve, an
estimate of the initial slope of the load-slip curve can be obtained. In
an effort to estimate this angle for the soils described on the Iowa
Department of Transportation soils chart, actual pile load test records
were reviewed by the writer. Several tests were selected where the pile
was embedded in predominately one soil type. Values of the angle a0 were
calculated using the load and settlement values at yield and at a point
about one half of yield. The results are shown in TABLE 5. Note that the
writer has extended the use of the method to apply it to predominately
cohesive soils. This was done only for academic interest since Kezdi 1 sl8
original work included correlations with granular soils only.
6. Previous Research
a. California27
California began informal studies of some of their long structures
without expansion joints about 15 years ago. Their efforts consisted
of identifying appropriate structures and conducting periodic
inspections to monitor performance. Twenty-seven bridges were
studied. They varied in length from 269 feet to 566 feet. About
18 of the bridges had integral abutments while the others had
semi-integral. An example of a typical inspection record4 is shown in
FIGURE 16.
Although a final report on this study will not be available until
1982, the Structures Office, California Department of Transportation,
has reported the following interim findings: 7
1. There is no apparent distress at end bent columns;

55
TABLE 5
Soil Description ~o (degrees)
Very soft silty clay *70
Soft silty clay *72
Stiff silty clay *71+
Stiff silt *74
Stiff sandy silt *74
Stiff sandy clay *74
Silty sand 75
Clayey sand 76
Fine sand 78
Coarse sand 80
Gravelly sand 82
* Kezdi'sl8 semi-empirical law was correlated to load tests in
granular soils only (see text).
LOAD-SLIP CURVE INITIAL SLOPE RECOMMENDATIONS
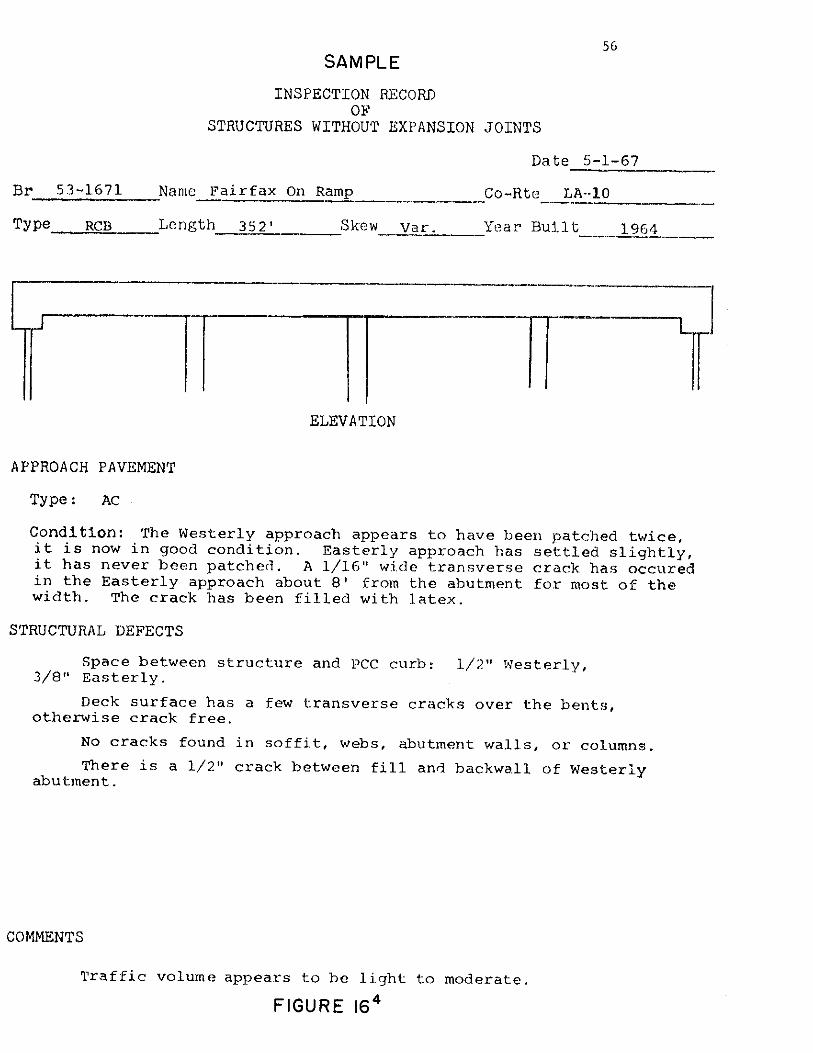
SAMPLE
INSPECTION RECORD 01<'
56
STRUCTURES WITHOUT EXPANSION .TOIN'rS
Date 5-1-67
Br 53-1671 Name ~'airfax On ~-a_m.._p __ _ Co-Rte r,A-·10 --- ----~--
Type RCB Length 352' ---'~----
Skew var. Year Bull t ·--- 1964
-
ELEVATION
APPROACH PAVEMENT
Type: AC
Condition: The Westerly approach appears to have been patched twice, it is now in good condition. Easterly approach has settled slightly, it has never been patched. A 1/16'' wide transverse crack has occured in the Easterly approach about 8' from the abutment for most of the width. The crack has been filled with latex.
S'rRUCTURAL DEFECTS
Space between structure and PCC curb: 1/2" Westerly, 3/8" Easterly.
Deck surface has a few transverse cracks over the bents, otherwise crack free.
No cracks found in soffit, webs, abutment walls, or columns. There is a 1/2" crack between fill anC! backwa.11 of Westerly
abutment.
COMMEN'l'S
Traffic volume appears to be light to moderate.
FIGURE 16 4
J
57
2, There is no cracking on girder soffits related to the lack
of deck joints;
3. No structural distress is apparent at the abutments;
4. Some problems have occurred from erosion and piping of
abutment support soils due to small amounts of water flowing
down behind the abutments; and
5. There are no apparent deck cracking problems associated with
expansion stresses.
The interim report recomnends that a reinforced concrete approach
slab be used with all jointless structures.
In 1971 and 1972 the California Department of Transportation and
the Federal Highway Administration sponsored a research project to
correlate theoretical solutions for laterally loaded piles to full
scale field tests in bridge embankments. Most of the work was done by
Mr. w. S. Yee at the University of California at Sacramento.
Mr. Yee worked with two available solutions for laterally loaded
piles. The first was the non-dimensional solutions with soil modulus
proportional to depth developed by Reese and Matlock,31 This method
allows analysis of variable fixity conditions at the pile top and can
be used in an iterative solution for other than linear variations of the
soil modulus. Mr. Yee also used the finite difference solution to the
general differential equation. Since the pile is separated into small
elements in this solution, any discrete variation in the soil modulus
can be accomnodated.
In Mr. Yee's study, however, a linear variation was assumed. The
coefficient of soil modulus (nh) was determined by measuring the

58
deflection and rotation at the top of a laterally loaded pile as
described by Davisson.9
Load tests were performed on instrumented piling at 3 actual
bridge construction sites. Using strain gauge measurements, the moment
in the pile was calculated and compared to calculated moments using the
experimentally determined nh value. A typical example of the results
is shown in FIGURE 17.
Y 42 Mr. ee concluded that:
1. Reliable predictions of bending moments and pile stresses could
be found using experimentally determined llh values and either
the non-dimensional solution or the finite difference method;
2. The use of a linear variation in soil modulus with depth is a
good approximation;
3. The influence of the soil below about 12 to 20 feet on pile
stresses was practically negligible; and
4. The effective length of the pile was about 15 feet for a free-
head condition and about 21 feet for a fixed-head condition.
The results of this research were used to develop guidelines for
the use of integral abutments in California. They are used when up to
1 1/2 inches of total movement due to thermal forces is expected in a
reinforced concrete bridge. Also to avoid rotation problems at the
abutment, the end span is limited to 160 feet. The use of integral
abutments is limited on prestressed bridges to those where the elastic
shortening due to post-tensioning is less than 3/8 inch, and the end
span is less than 115 feet (see APPENDIX II).
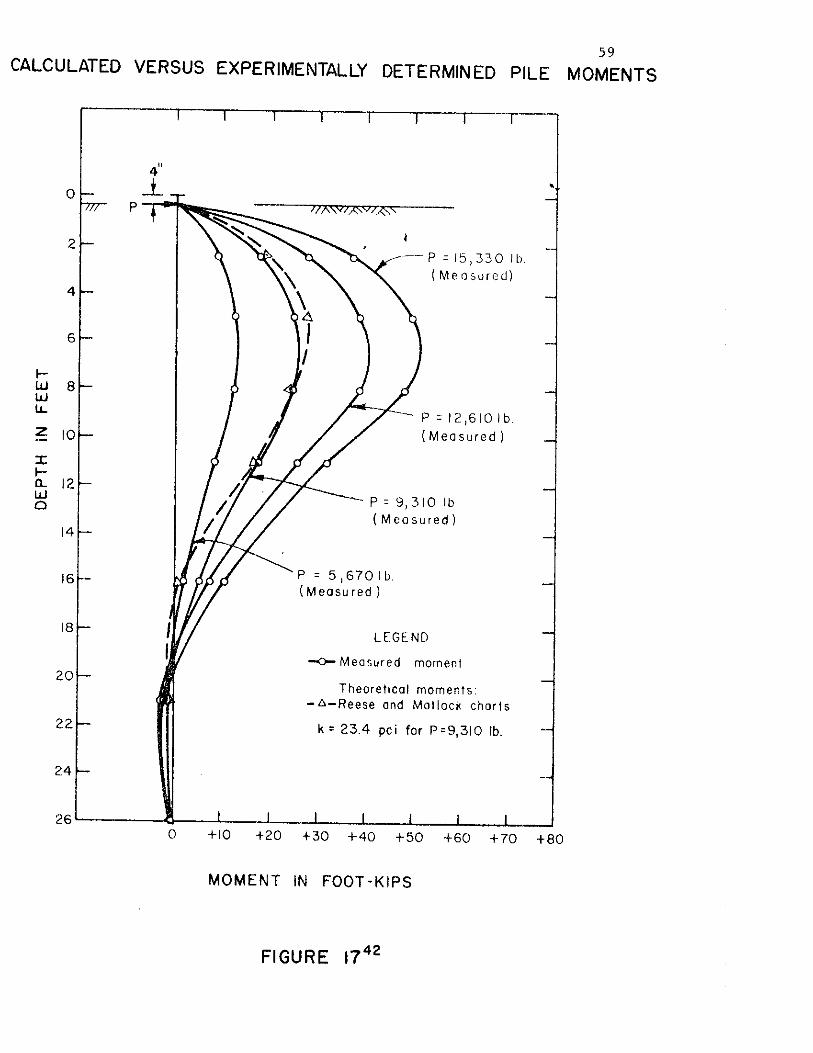
59 CALCULATED VERSUS EXPERIMENTALLY DETERMINED PILE MOMENTS
0
2
4
6
f-w 8 w LL
z 10
:i:: f-Cl.. 12 w 0
14
16
18
20
22
24
---- P = 15, 3 3 0 I b. (Measured)
p = 12,6101b. (Measured)
P=9,3101b (Measured)
p = 5,6701b. (Measured)
LEGEND
-<>-Measured moment
Theoretical moments. - t>-Reese and Matlack charts
k= 23.4 pci for P=9,310 lb.
•
0 +10 +20 +30 +40 +50 +60 + 70 +80
MOMENT IN FOOT-KIPS
FIGURE 1742
60
b. Missouril2
In 1972 the University of Missouri conducted a survey and
feasibility study of integral and semi-integral abutments. The work
was sponsored by the Missouri State Highway Department and the Federal
Highway Administration.12 The survey was undertaken to determine
current design methods and limitations used by state highway agencies.
The study was made to determine the feasibility of instrumenting a
jointless bridge to obtain thermal induced stresses.
The survey indicated that 13 states were using integral
abutments with steel bridges and 24 with concrete bridges. The
distribution of length limitations was as shown in TABLE 6. Three
states allowed the use of integral abutments for non-skewed bridges
only; none used them with skews over 30 degrees.
The survey concluded that:
1. The use of superstructures connected to flexible substructures
was becoming generally acceptable;
2. Design limitations were more restrictive for steel bridges
than concrete;
3. There was no simple design criteria which accounted for
shrinkage, creep, temperature, or substructure flexibility;
4. Induced stresses resulting from thermal effects, creep,
shrinkage, backfill movement, etc., are recognized by bridge
engineers as potentially significant, but there is a wide
variance in method for considering them; and
5. Bridge design engineers are interested in induced stresses and
associated problems, are generally uncertain as to the
61
TABLE 6
Maximum Length (feet) Number of States Steel Concrete
100 2 4
200 8 6
300 2 7
400 2
450 2
500 1
INTEGRAL ABUTMENT BRIDGE LENGTH LIMITATIONS (1972)
62
significance of and suitable methods for consideration of these
stresses, and would welcome a simple, rational design criteria
and specific reconmendations as to design details.
In the feasibility study a temperature distribution model was
developed and superstructure stresses were calculated for a wide range
of temperature variations. The non-dimensional solutions for laterally
loaded piles developed by Reese and Matlock31 were used with an assumed
value of the modulus of soil reaction. Instrumentation procedures were
reconmended for a field test to verify the theoretical results. The
field test, however, was not carried out and no further work has been
done on the project.
c. South Dakotal9
In 1973 South Dakota State University conducted full-scale model
tests on integral abutments to determine induced stresses in the
superstructure and the upper portion on the piling. The model
consisted of two HP 10 x 42 steel piles on 8-foot 6-inch centers cast
into a rigid concrete abutment with 2 plate girders about 26 feet
long. The 32-foot piles were driven into silty clay over glacial till
to a bearing capacity of 23 tons. The pile tops were welded to the
bottom flanges of the girders.
Various lateral displacements within plus or minus 1 inch were
induced at the abutment by jacking at the free end during four
construction stages. The results of interest are with the slab and
backfill in place. Strains were measured corresponding to stresses of
up to .42 kips per square inch in the piling. Th is occurred just below
the bottom of the concrete abutment. Several conclusions were drawn by
63
the investigators. They were called qualitative results which would
require further study to verify.
1. Stresses were induced into the girders which in some cases
were additive with dead and live load stresses. The induced
stresses were generally within the 40 percent overstress
allowed by AASHTO.
2. Horizontal movements over about 1/2 inch will cause yielding
in the piles.
3. Free draining backfill is recoDIOended since frozen soil against
the abutment can greatly increase induced girder stresses by
limiting free movement.
4. The use of approach slabs which allow rotation and translation
of the abutment and, if possible, avoid continuing compaction
of the backfill by traffic is recoDIOended.
As part of this study a questionnaire was sent to 10 states in
the North Central part of the United States. Two trends can be
identified when the survey is compared to the responses of these states
to the survey recently conducted by Iowa. Four of the states (Idaho,
Missouri, North Dakota, and South Dakota) have substantially increased
their length limitations for use with integral abutments. Four of the
states (Iowa, Kansas, Nebraska, and Wisconsin) have retained the same
limits and 2 states still do not routinely use integral abutments.
Also of interest is the fact that 3 of the states have begun to
routinely use integral abutments with steel bridges since 1973; 4
of them already did and 1 still does not.
64
d. North Dakotal7
A recently constructed county road bridge near Fargo, North
Dakota, was instrumented and monitored for temperature induced stresses
by North Dakota State University. The study is being conducted by
Dr. J. Jorgenson, Chairman of the Civil Engineering Department, and is
sponsored by the State Highway Department.
The bridge is a 450-foot by 30-foot prestressed concrete box
girder with six 75-foot spans and no skew angle. It was built in
August 1979 on a very low volume gravel road.
The bridge was designed by Moore Engineering, West Fargo, North
Dakota. Since the bridge length was at the limit for the use of
integral abutments in North Dakota, a unique system was used to limit
the passive earth pressure on the backwall. A diagranmatic represen
tation of the abutment is shown in FIGURE 18.
The purpose of the expansion joint material behind the abutment is
to hold back the soil during thermal contraction of the superstructure
and to provide a collapsible mass to work against during expansion.
Dr. Jorgenson informed the writer that the maximum lateral movement
measured at the pile top has been about 2 inches. No distress has
been noted which could reasonably be attributed to this movement.
Dr. Jorgenson also reported that the bridge approach to superstructure
transition was still very smooth.
The piling are founded in a deep glacial clay layer. Soft clay
deposits exist near the surface and down to the limit of influence on
the temperature stresses in the pile. Actual stresses in the piles are
being determined from strain gauge readings for various temperature

65
SKETCH OF MOORE ENGINEERING INTEGRAL ABUTMENT SYSTEM 17
linimun 10' Jvement sect1o~I
r 20' Reinforced approach slob
5' 1- -I Reaction slab
4" Preformed expans10~ joint moterio I
FIGURE 18
- - - - +---------1
r-;;·, I I I I I : : I I I I I I 11 I I I
I I
I I I I 0 I
' I , , I 1
I I I I
: I I I
I I I
"-HP 10X42x 100'
66
ranges throughout the year. The results of this analysis will be
available in the late sumner of 1981. Based on the results of the
South Dakota study, it seems likely that the piles are being stressed
above yield with the reported off-center deflections of up to 1 inch
occurring.
7. Summary
Based on a review of available literature, the most attractive
analytical approaches to obtaining solutions for pile stresses in integral
abutments are iterative methods using a finite difference or finite element
formulation. Both methods require knowledge of soil parameters to predict
load-slip and resistance-displacement (p-y) relations.
The writer has presented recomnendations for use in the development
of p-y and load-slip curves to be used in analytical model for investigating
pile stresses in integral abutments, TABLE 7 shows the reconmended range
of ultimate shear resistance (J"'max) and initial horizontal angle (a0 ) of
the load-slip curve.
The range of soil strengths recomnended for developement of p-y curves
is shown in TABLE 8. Other relationships for granular soils or intermediate
strength cohesive soils can be developed as described in the body of the
report, if desired.
Previous research work in the area of integral abutments includes:
1, Surveys of detailing and design criteria used by the state highway
a gene ies;
2. Full-scale model tests; and
3. Monitoring performance of actual bridge installations.
The survey conducted by the University of Missouri in 1972 showed that
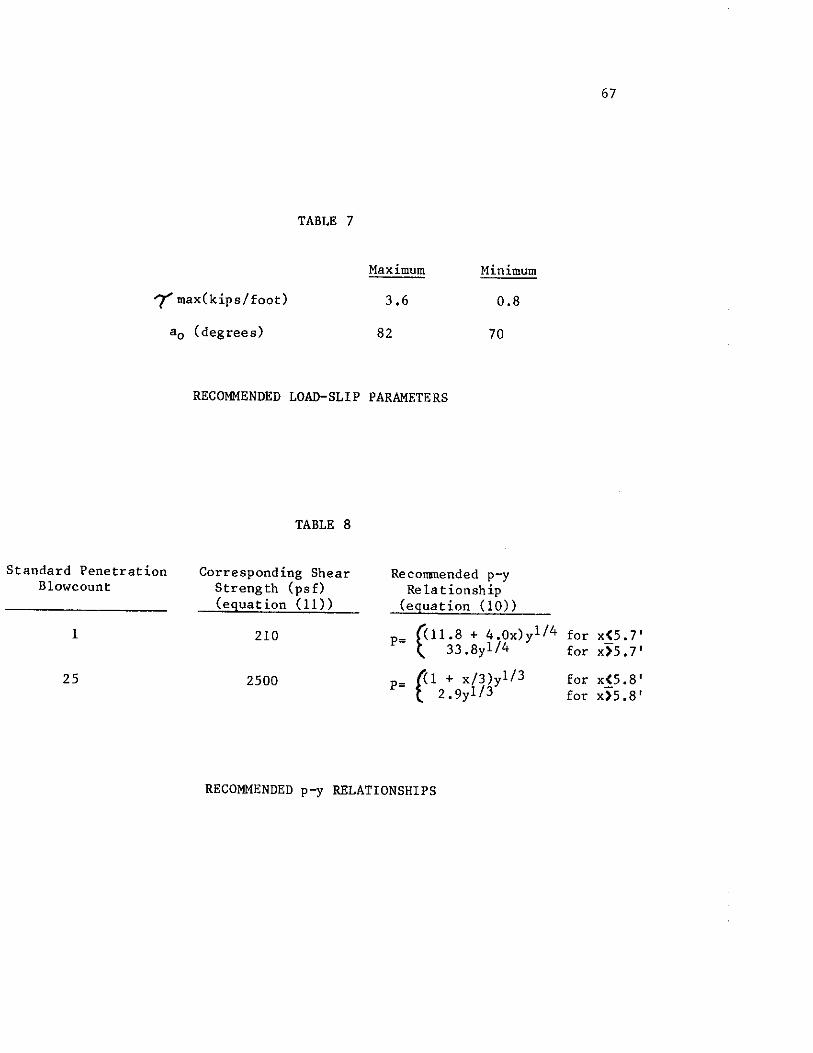
TABLE 7
Maximum Minimum
"(max( kips/foot) 3.6 0.8
Standard Penetration Blowcount
1
25
a0 (degrees) 82 70
RECOMMENDED LOAD-SLIP PARAMETERS
TABLE 8
Corresponding Shear Streng th ( ps f) (equation (11))
210
2500
Recommended p-y Re lat ionsh ip
(equation (10))
P= (<11.8 + 4.0x)yl/4 t 33.8yl/4
P= ({1 + x/3)yl/3 t 2.9yl/3
RECOMMENDED p-y RELATIONSHIPS
67
for x(5.7' for x)5, 7'
for x(5.8' for x)5,8'

68
the use of integral abutments in highway bridges was a generally accepted
practice. Although no simple rational design method was available, some
states were building bridges up to 500 feet long without expansion devices.
The few problems reported were judged to be of no greater magnitude than
those experienced when movable supports and expansion devices are used.
The full-scale model tests in South Dakota in 1973 showed that for
lateral pile top deflections over 1/2 inch, the stress in the upper portion
of the pile may be at yield. The tests results indicated that the use of
approach slabs that allow rotation and translation of the abutment was
advisable. Free draining backfill was reconmended in cold climate areas.
Research on full-scale bridge abutments in California in 1973 showed that
the non-dimensional solution as proposed by Reese and Matlock31 and the
finite element formulation could accurately predict piling stresses. The
effective length of laterally loaded piles was shown to vary from 15 to 21
feet. The results of this work were used by the California Department of
Transportation to develop design criteria for integral abutments which are
still in use today.
The performance monitoring of an integral abutment bridge in North
Dakota is still underway. With measured total deflections at the pile top
of about 2 inches, the abutment appears to be functioning properly with no
movement related distress.
IV. CONCLUSIONS
The responses to the nationwide survey indicate that a majority of the
state highway agencies use integral abutments and are pleased with their perfor
mance. Three more states are using them with concrete bridges today than did in
1973 and 10 more are using them with steel bridges.
Most states that use integral abutments have increased their maximum
allowable bridge length since 1973. Length limitations in 1973 were on the
order of 200 to 300 feet. Several states are now building concrete bridges over
400 feet long without expansion joints. Many would like to increase their
length limitations but are concerned about possible additional abutment
distress, approach pavement failures, and overstressed piling.
Problems mentioned by some of the states seemed to be restricted to only a
few respondents. Others noted that they had experienced problems but had since
implemented effective solutions. Wingwalls which had cracked at the backwall
interface are now being designed for greater loads with more reinforcing. Some
erosion and backfill containment problems are being solved by using longer
wingwalls. Many states noted the importance of using an adequate approach slab.
Positive containment of runoff at the bridge ends can also help keep backfill
problems to a minimum. End span rotation problems can be reduced by limiting
the length of the endspan.
Several states said that unknown piling stresses were a deterrent to the use
of integral abutments, Studies have indeed shown that under normal temperature
variations, piling in integral abutments of long bridges will be stressed to
yield. This may occur with lateral movements of as little as 1/2 inch.
70
Several states are now building bridges with integral abutments that can have
greater potential movements. As shown by the survey, the piling stress due to
thermal movements is generally ignored since no simple rational method of analysis
is readily available, Some states have assumed simplified fixity conditions and
effective lengths of the piles in order to calculate stresses, but they realize
that the results are only approximations of the actual conditions,
Analytical methods are available that can accurately predict pile response
to lateral loads, but they generally require a full-scale testing program to
supply the needed soil information. Soil parameters can be estimated from
standard laboratory tests, but the results are much less accurate. Another
approach is to develop bounds for the soil information and analyze each
critical corrbination of input data. To this end these limits have been
established for typical Iowa soils and presented in this paper. It is hoped
that this data will enable accurate analyses to be performed for use in the
development of easy to use design charts capable of predicting safe integral
abutment bridge designs for given soil conditions.

V. REFERENCES
1. Alizadeh, M. and Davisson, M. T., "Lateral Load Tests on Piles-
Arkansas River Project," Journal of the Soil Mechanics and Foundations
Division, ASCE, September 1970.
2. Bowles, J. E., Analytical and Computer Methods in Foundation
Engineering, McGraw-Hill Book Co., 1974.
3. Bowles, J. E., Foundation Analysis and Design, McGraw-Hill, 1977.
4. Bridge Department, California Division of Highways, "Long Structures
Without Expansion Joints," June 1967.
5. Bridge Division, Missouri Highway and Transportation Corrmission,
"Design Manual," Section 3.72, Sheet 4.3.1, October 1977.
6. California DOT, "Bridge Planning and Design Manual," Vol. IV,
Detailing, June 1979.
7. Cassano, R. C., Chief, Office of Structures Design, California DOT,
Correspondence, 900.05, June 10, 1981, and telephone conversations, June, 1
8. Coyle and Reese, "Load Transfer of Axially Loaded Piles in Clay,"
Journal of the Soil Mechanics and Foundations Division, ASCE, Vol. 92,
SM 2, March 1966.
9. Davisson, M. T., "Lateral Load Capacity of Piles," Transportation
Research Record 333, 1970.
10. Desai, C. s. and Christian, J., Editors, Numerical Methods in
Geotechnical Engineering, McGraw-Hill, 1977.
11. Durrow, F., Assistant Bridge Engineer, North Dakota State Highway
Department, Telephone Conversation, May 1981.

72
12. Emanuel, J. H. et al, "An Investigation of Design Criteria for Stresses
Induced by Semi-Integral End Bents," University of Missouri, Rolla, 1972.
13. Gee, H., "Length Limit of a Bridge Using Integral Abutments,"
Office of Bridge Design, Iowa DOT, February 13, 1969.
14. Gee, H., Structural Engineer; Lundquist, W., Bridge Design Engineer;
and Miller, G., Geotechnical Engineer; Iowa DOT - Conversations, June 1981.
lS. Handy, R. L., "The Pleistocene of Iowa: An Engineering Appraisal,"
Proceedings, Iowa Academy of Science, Vol. 75, 1968.
l6. Hetenyi, M., "Beams on Elastic Foundations," University of Michigan
Press and Oxford University Press, 1946.
l7. Jorgenson, J., Chairman of the Civil Engineering Department, North
Dakota State University, Telephone Conversations, June 1981.
c8. Kezdi, A., "Bearing Capacity of Piles and Pile Groups," Proceedings,
Fourth International Conference on Soil Mechanics and Foundations, Vol. 2,
London, 1957 •
. 9. Lee, H. and Sarsam, M., "Analysis of Integral Abutment Bridges," South
Dakota Department of Highways, March 1973.
'.O. Matlock, H., "Correlations for Design of Laterally Loaded Piles in
Soft Clay," Proceedings of the Offshore Technology Conference, Houston,
Texas, 1970.
1. Mat lock, H. and Reese, L., "Foundation Analysis of Offshore Pi le
Supported Structures," Fifth International Conference on Soil Mechanics
and Foundation Engineering, Vol. 2, 1961.
2. Matlock, H. and Reese, L., "Generalized Solutions for Laterally
Loaded Piles," Journal of the Soil Mechanics and Foundations Division,
ASCE, October 1960.
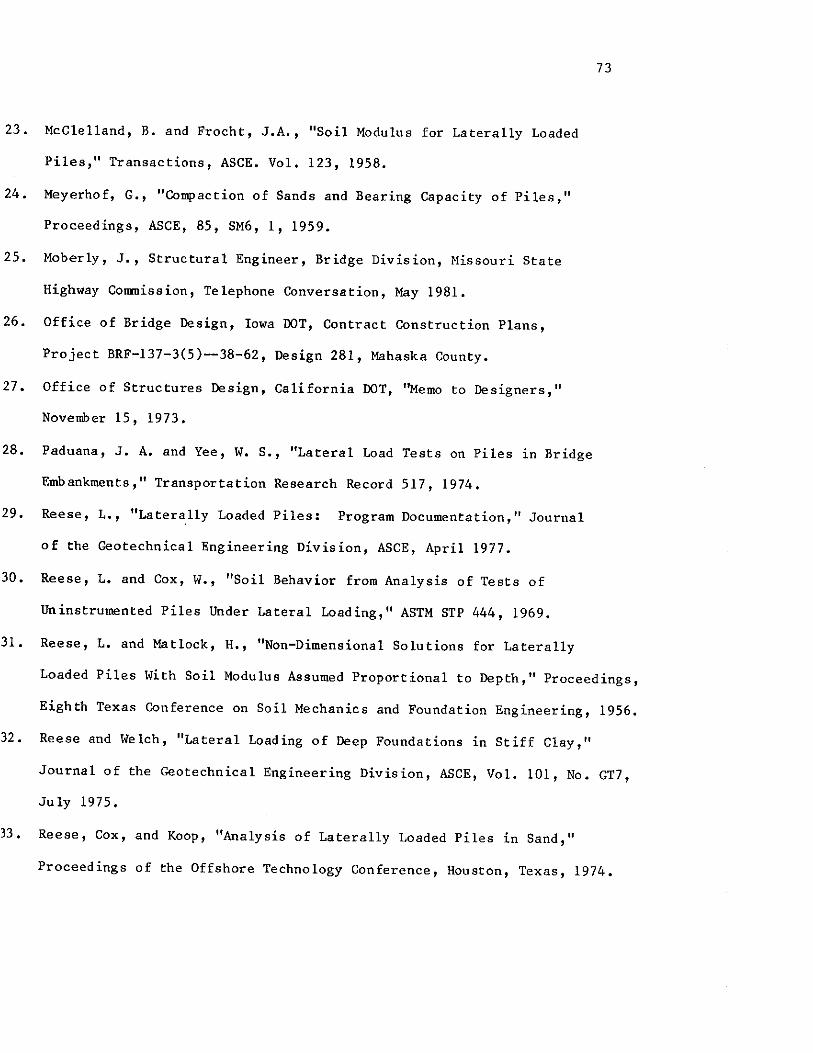
23. McClelland, B. and Frocht, J.A., "Soil Modulus for Laterally Loaded
Piles," Transactions, ASCE. Vol. 123, 1958.
24. Meyerhof, G., "Compaction of Sands and Bearing Capacity of Piles,"
Proceedings, ASCE, 85, SM6, 1, 1959.
25. Moberly, J., Structural Engineer, Bridge Division, Missouri State
Highway Conmission, Telephone Conversation, May 1981.
26. Office of Bridge Design, Iowa DOT, Contract Construction Plans,
Project BRF-137-3(5)--38-62, Design 281, Mahaska County.
27. Office of Structures Design, California DOT, ''Memo to Designers,"
November 15, 1973.
28. Paduana, J. A. and Yee, w. S., "Lateral Load Tests on Piles in Bridge
Embankments," Transportation Research Record 517, 1974.
29. Reese, L., "Latera.lly Loaded Piles: Program Documentation," Journal
of the Geotechnical Engineering Division, ASCE, April 1977.
30. Reese, L. and Cox, W., "Soil Behavior from Analysis of Tests of
Un instrumented Piles Under Lateral Loading," ASTM STP 444, 1969.
31. Reese, L. and Matlock, H., "Non-Dimensional Solutions for Laterally
73
Loaded Piles With Soil Modulus Assumed Proportional to Depth," Proceedings,
Eighth Texas Conference on Soil Mechanics and Foundation Engineering, 1956.
32. Reese and Welch, "Lateral Loading of Deep Foundations in Stiff Clay,"
Journal of the Geotechnical Engineering Division, ASCE, Vol. 101, No. GT7,
July 1975.
33. Reese, Cox, and Koop, "Analysis of Laterally Loaded Piles in Sand,"
Proceedings of the Offshore Technology Conference, Houston, Texas, 1974.
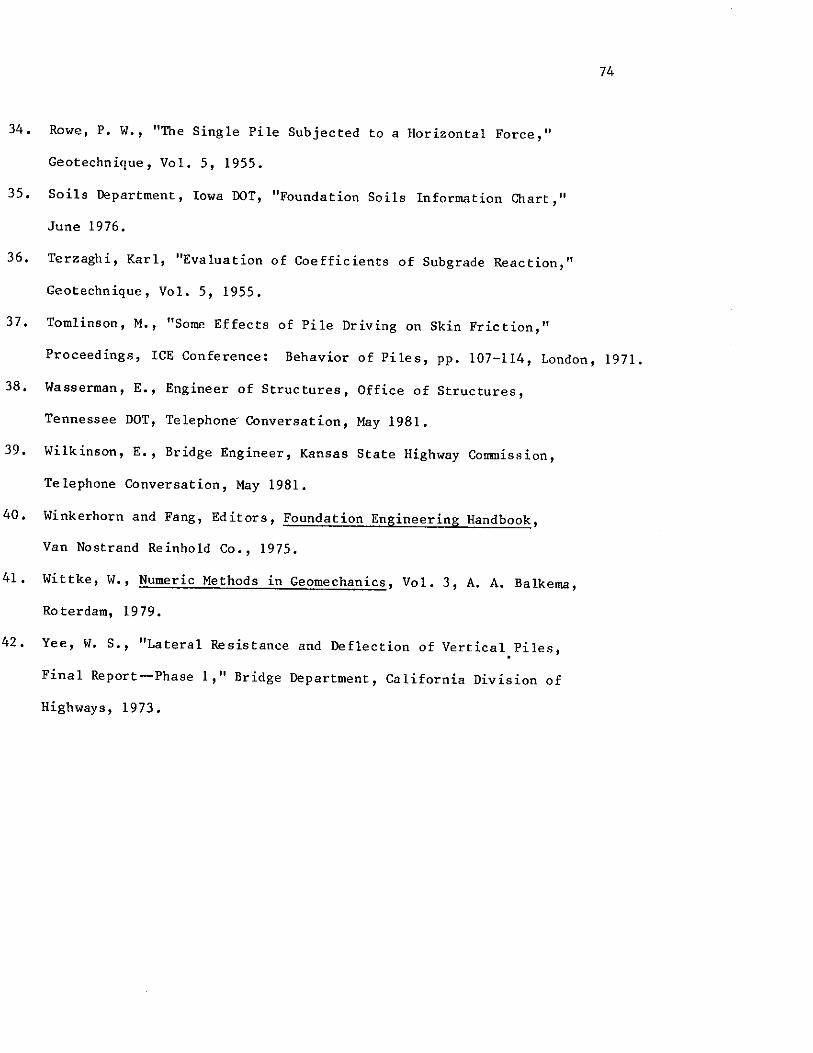
34, Rowe, P, W., "The Single Pile Subjected to a Horizontal Force,"
Geotechnique, Vol. 5, 1955.
35, Soils Department, Iowa DOT, "Foundation Soils Information Chart,"
June 1976.
36. Terzaghi, Karl, "Evaluation of Coefficients of Subgrade Reaction,"
Geotechnique, Vol. 5, 1955.
74
37. Tomlinson, M., "Some Effects of Pile Driving on Skin Friction,"
Proceedings, ICE Conference: Behavior of Piles, pp. 107-114, London, 1971.
38, Wasserman, E., Engineer of Structures, Office of Structures,
Tennessee DOT, Telephone· Conversation, May 1981.
39, Wilkinson, E., Bridge Engineer, Kansas State Highway Commission,
Telephone Conversation, May 1981.
40. Winkerhorn and Fang, Editors, Foundation Engineering Handbook,
Van Nostrand Reinhold Co., 1975.
41. Wittke, W., Numeric Methods in Geomechanics, Vol. 3, A. A. Balkema,
Roterdam, 1979.
42. Yee, W. s., "Lateral Resistance and Deflection of Vertical.Piles,
Final Report-Phase 1," Bridge Department, California Division of
Highways, 1973.

VI. APPENDIX I
Questionnaire for Bridges with Integral Abutments
and
Summary of Responses
Part 1. Responses to all questions except number 4
Part 2. Responses to question 4
Part 3. Additional conments made by some of the states
Note: States not listed in Part 1 answered no to question 1 and,
therefore, did not complete the remainder of the questionnaire.
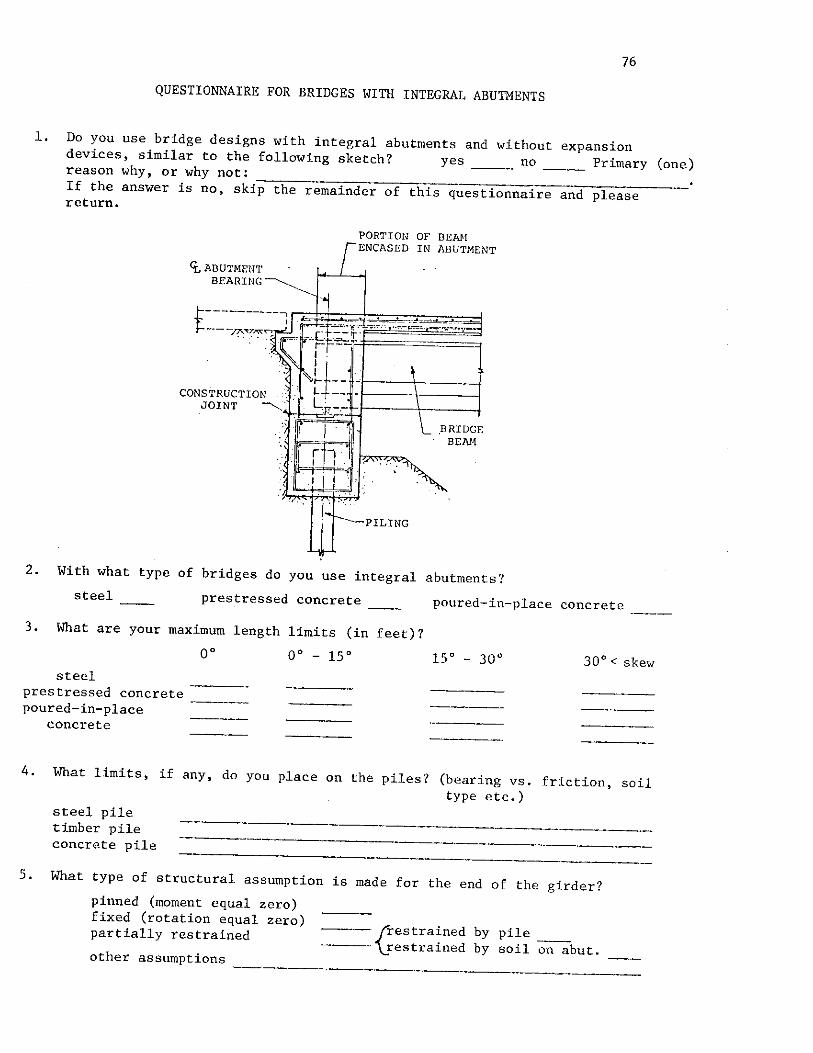
76
QUESTIONNAIRE FOR BRIDGES WITH INTEGRAL ABUTMENTS
1. Do you use bridge designs with integral abutments and without expansion devices, similar to the following sketch? yes no Primary (one) reason why, or why not: If the answer is no, skip the remainder of this questionnaire and please return.
PORTION OF BEAM ENCASED IN ABUTMENT
PILING
.BRIDGE BEN1
2. With what type of bridges do you use integral abutments? steel prestressed concrete __ poured-in-place concrete
3. What are your maximum length limits (in feet)? oo 0° - 15° 15° - 30° 30° < skew
steel prestressed concrete--~poured-in-place
concrete
4. What limits, if any, do you place on the piles? (bearing vs. friction, soil type etc.)
steel pile timber pile concrete pile
5. What type of structural assumption is made for the end of the girder? pinned (moment equal zero) fixed (rotation equal zero) partially restrained
other assumptions
--- [restrained by pile '\]:"estrained by soil on abut.
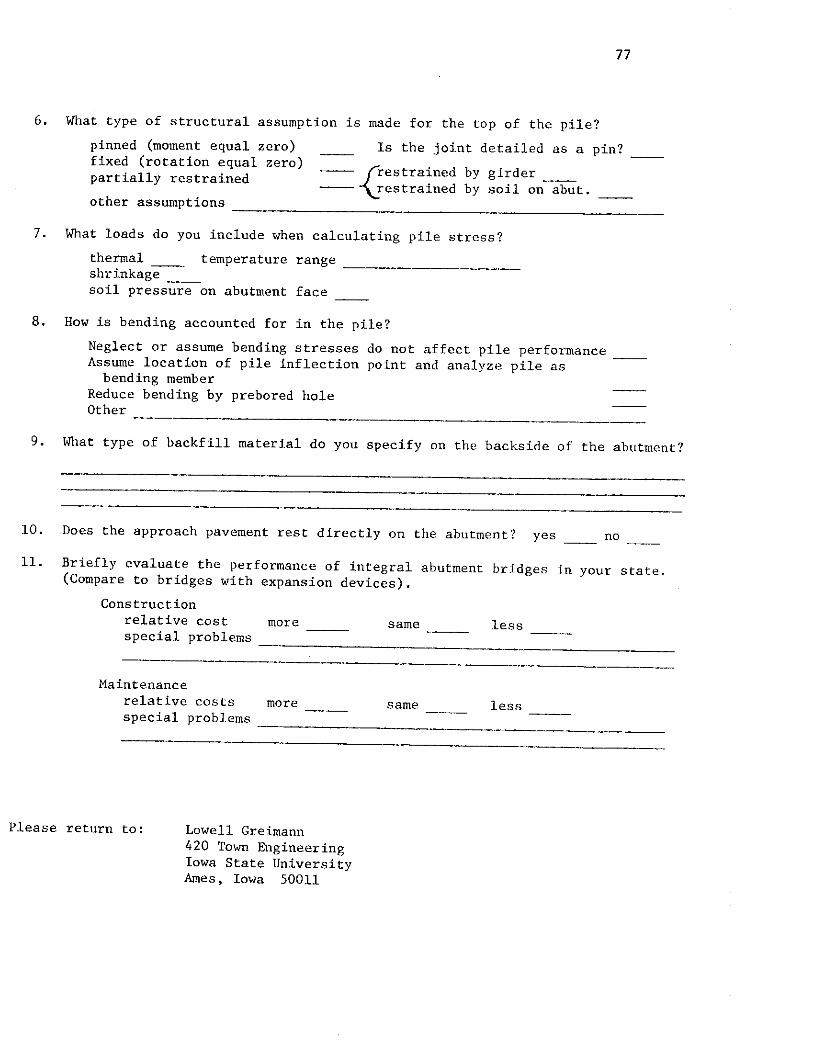
77
6. What type of structural assumption is made for the top of the pile? pinned (moment equal zero) fixed (rotation equal zero) partially restrained
Is the joint detailed as a pin?
-~ (""restrained by girder ~-"\_!estrained by soil on abut.-~
other assumptions ---------------------------~
7. What loads do you include when calculating pile stress?
thermal temperature range -----shrinkage soil pressure on abutment face
8. How is bending accounted for in the pile?
Neglect or assume bending stresses do not affect pile performance Assume location of pile inflection point and analyze pile as
bending member Reduce bending by prebored hole Other
9. What type of backfill material do you specify on the backside of the abutment?
10. Does the approach pavement rest directly on the abutment? yes no
11. Briefly evaluate the performance of integral abutment bridges in your state. (Compare to bridges with expansion devices).
Construction relative cost special problems
more --- same __ _ less
-----------------Maintenance
relative costs more ---special problems
Please return to: Lowell Greimann 420 Town Engineering Iowa State University Ames, Iowa 50011
same __ _ less ---
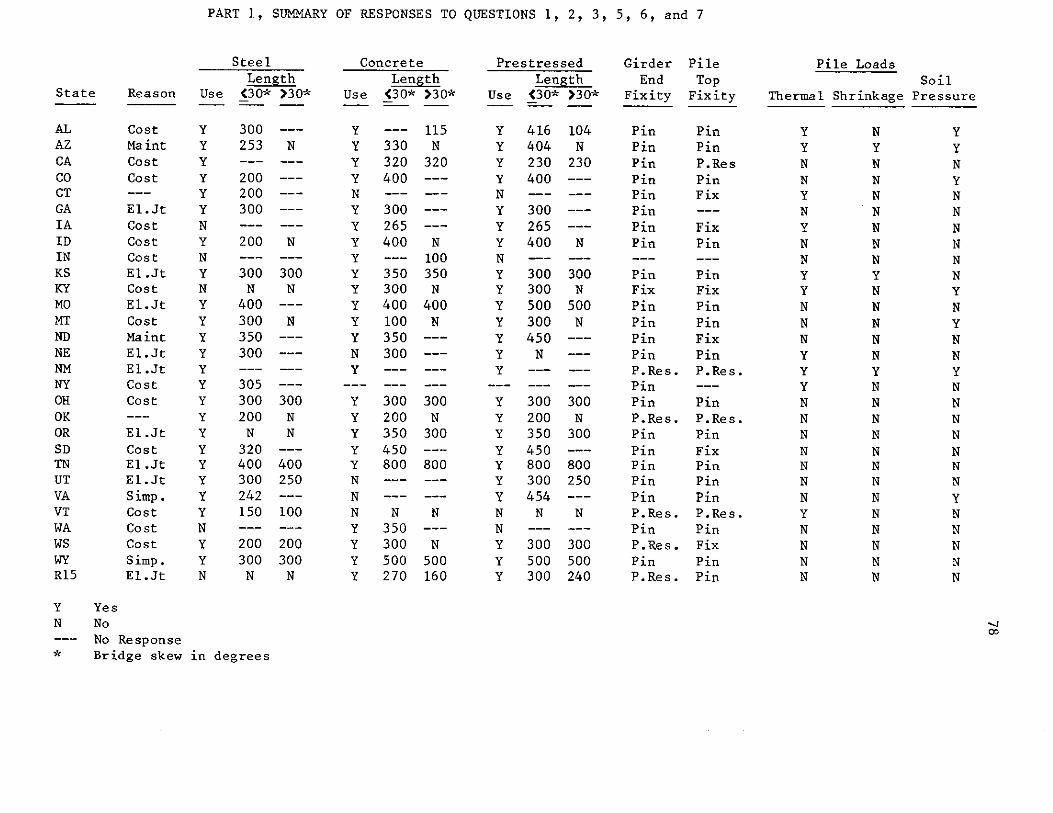
PART 1, SlJM!l,ARY OF RESPONSES TO QUESTIONS 1, 2, 3, 5, 6, and 7
State
AL AZ CA co CT GA IA ID IN KS KY MO MT ND NE NM NY OH OK OR SD TN UT VA VT WA ws WY Rl5
y
N Yes No
Reason
Cost Maint Cost Cost
El.Jt Cost Cost Cost El.Jt Cost El.Jt Cost Ma int El.Jt El.Jt Cost Cost
El.Jt Cost El.Jt El.Jt Simp. Cost Cost Cost Simp. El.Jt
No Response
Steel Length
Use (30* )30*
y y y y y y
N y
N y
N y y y y y y y y y y y y y y
N y y
N
300 253 N
200 200 300
200 N
300 300 N N
400 300 N 350 300
305 300 300 200 N
N N 320 400 400 300 250 242 150 100
200 200 300 300
N N
* Bridge skew in degrees
Concrete Length
Use (30* )30*
y y y y
N y y y y y y y y y
N y
y y y
y y
N N N y y y y
115 330 N 320 320 400
300 265 400 N
100 350 350 300 N 400 400 100 N 350 300
300 300 200 N 350 300 450 800 800
N N 350 300 N 500 500 270 160
Pres tressed Length
Use (30* )30*
y y y y
N y y y
N y y y y y y y
y y y
y y y y N N y y y
416 404 230 400
300 265 400
300 300 500 300 450
N
300 200 350 450 800 300 454
N
300 500 300
104 N
230
N
300 N
500 N
300 N
300
800 250
N
300 500 240
Girder End
Fixity
Pin Pin Pin Pin Pin Pin Pin Pin
Pin Fix Pin Pin Pin Pin P.Res. Pin Pin P.Res. Pin Pin Pin Pin Pin P.Res. Pin P.Res. Pin P.Res.
Pile Top
Fixity
Pin Pin P.Res Pin Fix
Fix Pin
Pin Fix Pin Pin Fix Pin P.Res.
Pin P.Res. Pin Fix Pin Pin Pin P.Res. Pin Fix Pin Pin
Pile Loads Soil
Thermal Shrinkage Pressure
y y N N y
N y
N N y y
N N N y y y
N N N
N N N N y
N N N N
N y
N N N N N N N y
N N N N N y
N N N N N N N
N N N N N N
y y
N y
N N N N N N y
N y
N N y
N N N N N N N y
N N N N N

Approach Pile Bending Pavmt. on Construction Cost Maintenance Cost
State Neglect Infl. Pt. Pre bore Backfill Abutment More Same Less More Same Less
AL y y N Gran. N N N y N N y AZ y N N Co hes. y N N y N N y CA y N N Perv. y N N y N N y co y N y Gran. y N N y N N y CT y N N Perv. y N N y N N y GA y N N Rd .Fill y N N y N N y IA N N y Gran. y N N y N N y ID y N N Rd .Fill y N N y N N y IN y N N Gran. y N N y N N y KS y N N Rd .Fill y N N y N N y KY N y y Gran. N N N y N N y MO y N N Rd .Fill y N N y N N y MT y N N Gran. y N N y N N y ND y N N Gran. y N N y N N y NE y N N Rd .Fill y N y N N N y NM N y N Rd.Fill Y-N N N N N N N NY y N N Gran. y N N y N N y OH y N N Gran. y N N y N N y OK y N N y N N y N N y OR y N N Gran. y N N y N N y SD N N y Gran. y N N y N N y TN y N N Gran. y N N y N N y UT y N N Gran. y N N y N N y VA y N N Gran. N N N N N N N VT y N N N N N y N N y WA N N N Gran. y N N y N N y ws y N N Gran. N N N y N N y WY y N N Gran. y N N y N N y Rl5 y N N Perv. y N N y N y N
y Yes N No
No Response ...., "'
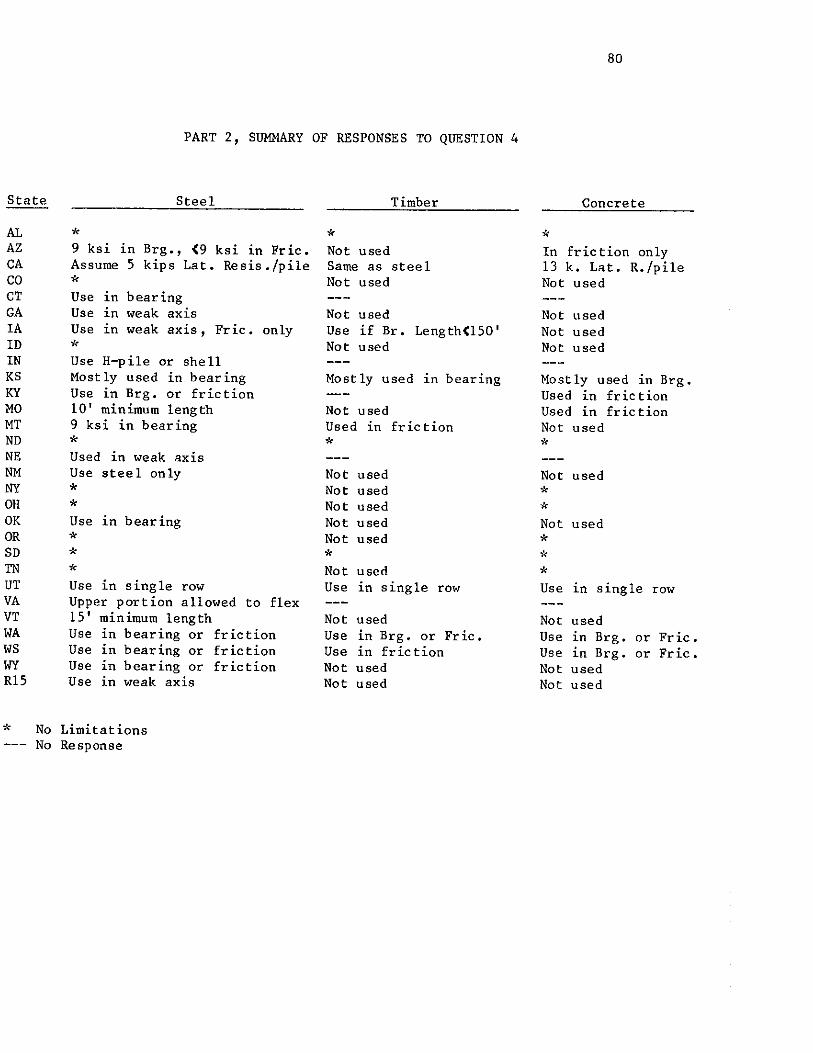
PART 2, SUMMARY OF RESPONSES TO QUESTION 4
State Steel
AL * AZ 9 ksi in Brg., (9 ksi in Frie. CA Assume 5 kips Lat. Resis./pile co * CT Use in bearing GA Use in weak axis IA Use in weak axis, Frie. only ID * IN Use H-pile or shell KS Mostly used in bearing KY Use in Brg. or friction MO 10' minimum length MT 9 ksi in bearing ND * NE Used in weak axis NM Use stee 1 only NY * OH * OK Use 1n bearing OR * SD * TN * UT Use in single row VA Upper portion allowed to flex VT 15' minimum length WA Use in bearing or friction ws Use in bearing or friction WY Use 1n bearing or friction Rl5 Use in weak axis
* No Limitations No Response
Timber
* Not used Same as steel Not used
Not used Use if Br. Length(l50' Not used
Mostly used in bearing
Not used Used in friction
* Not used Not used Not used Not used Not used
* Not used Use in single row
Not used Use in Brg. or Frie. Use in friction Not used Not used
80
Concrete
* In friction only 13 k. Lat. R. /pile Not used
Not used Not used Not used
Mostly used in Brg. Used 1n friction Used in friction Not used
* Not used
* * Not used
* * * Use 1Il single row
Not used Use in Brg. or Frie. Use in Brg. or Frie. Not used Not used
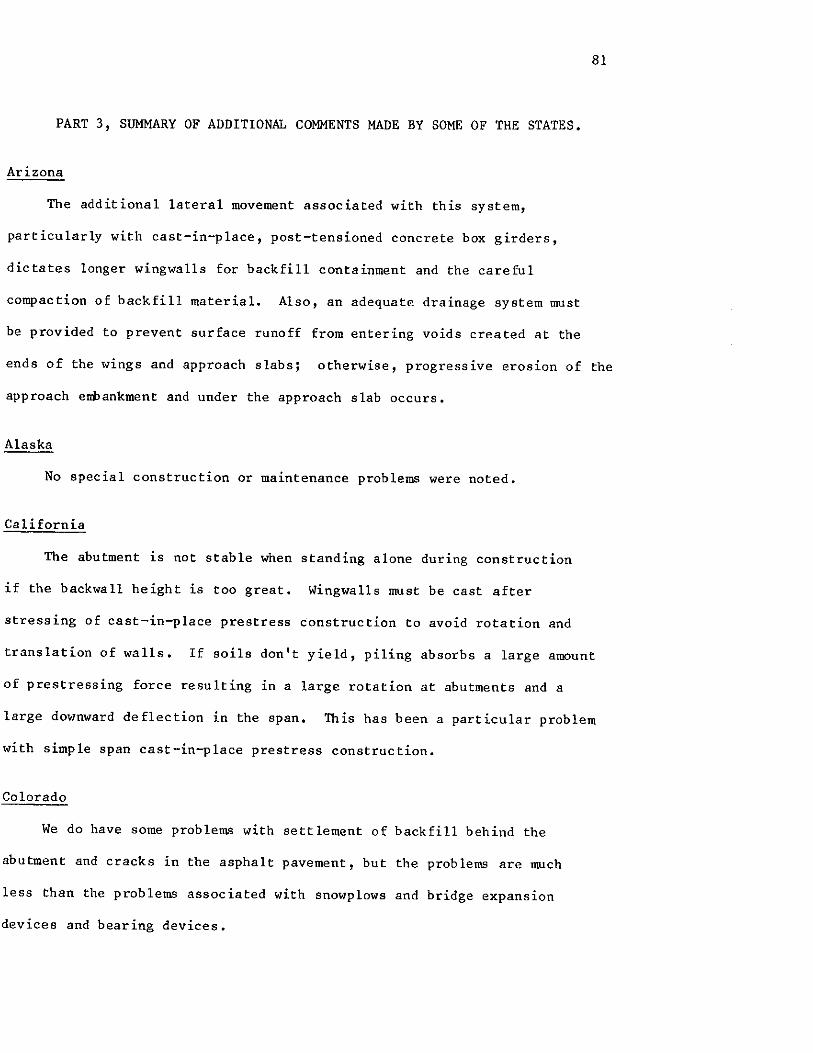
PART 3, SUMMARY OF ADDITIONAL COMMENTS MADE BY SOME OF THE STATES.
Arizona
The additional lateral movement associated with this system,
particularly with cast-in-place, post-tensioned concrete box girders,
dictates longer wingwalls for backfill containment and the careful
compaction of backfill material. Also, an adequate drainage system must
81
be provided to prevent surface runoff from entering voids created at the
ends of the wings and approach slabs; otherwise, progressive erosion of the
approach enhankment and under the approach slab occurs.
Alaska
No special construction or maintenance problems were noted.
California
The abutment is not stable when standing alone during construction
if the backwall height is too great. Wingwalls must be cast after
stressing of cast-in-place prestress construction to avoid rotation and
translation of walls. If soils don't yield, piling absorbs a large amount
of prestressing force resulting in a large rotation at abutments and a
large downward deflection in the span. This has been a particular problem
with simple span cast-in-place prestress construction.
Colorado
We do have some problems with settlement of backfill behind the
abutment and cracks in the asphalt pavement, but the problems are much
less than the problems associated with snowplows and bridge expansion
devices and bearing devices.
~onnecticut
We have constructed one bridge to date and are very satisfied
;ith it.
;eorgia
Have had a problem with cracks in the wingwalls.
:daho
82
Some problems have resulted from failing to provide adequate expansion
joints in concrete approach pavements, but such problems are not peculiar
:o design concept under consideration. Problems are to be expected if the
•ridge is long, has no expansion joints anywhere, is a steel bridge, is on
L substantial skew, or a combination of the foregoing. If used with
liscretion, the design concept is good in that it saves initial and
ia intenance costs of expansion joints.
:entucky
No special construction or maintenance problems have been reported.
~issouri
We limit integral abutment bridges to a 40 degree skew.
:ontana
No special contruction problems noted. Integral abutment bridges
robably require a little more maintenance due to embankment settlement.
ebraska
Maintenance can be a problem if no concrete approach slab is provided.

83
New York
We assume that construction costs are lower because of simpler abutment
forming details and fewer piles. Setting the girders directly on the piles
created some alignment difficulty for the contractor. In the future we
plan to use a detail similar to the detail shown in No. 1 of your questionnaire.
The continuous approach slab on a 125 foot single-span steel bridge built
in 1980 has cracked at the rear face of the backwall. It is a tight
crack that runs tha full width of the slab but does not appear to be
detrimental. To date, no detectable cracking has occured in the backwalls
and the abutments seem to be functioning as designed.
~io
As yet, no significant construction or maintenance problems have been
~ted.
)klahoma
Integral abutments are used only on bridges with zero skew.
)outh Dakota
With steel bridges and longer concrete, we still utilize an expansion
levice in the approach slab system. Savings is in bearings and piling.
>ill or abutment does not have to be designed for overturning loads.
For most steel bridges and longer concrete, we feel it is necessary to
1ttach the approach slab with integral curb and gutter to the bridge.
lithout this provision, severe erosion around the wings can result and
>roblems with approach fill settlement are increased.
84
Utah
No special construction or maintenance problems have been noted.
Vermont
Some minor approach settlement is anticipated.
Washington
Sometimes the piles may not end up in a straight line and at the right
location. Some maintenance problems with downdrag and settlement
have been noted.
Wisconsin
Cracking of diaphragms has been noted on bridges with large skews (greater
than 20 degrees) and/or with long abutments. We limit integral abutment
bridges to 40 degree skews.
Wyoming
No special construction or maintenance problems have been noted.
~HWA Region 15
We noted a problem with pavement cracking at bridge ends. This has
since been eliminated with the use of approach slabs.
VII. APPENDIX II
Memorandum to Designers, Office of Structures Design,
California Department of Transportation
This memorandum was attached to California's response to the integral
abutment questionnaire. It describes California's criteria for the use of end
diaphragm abutments, which includes both integral and semi-integral types.
Examples of details used by California are shown in FIGURES 1 and 2 in the
body the this report,
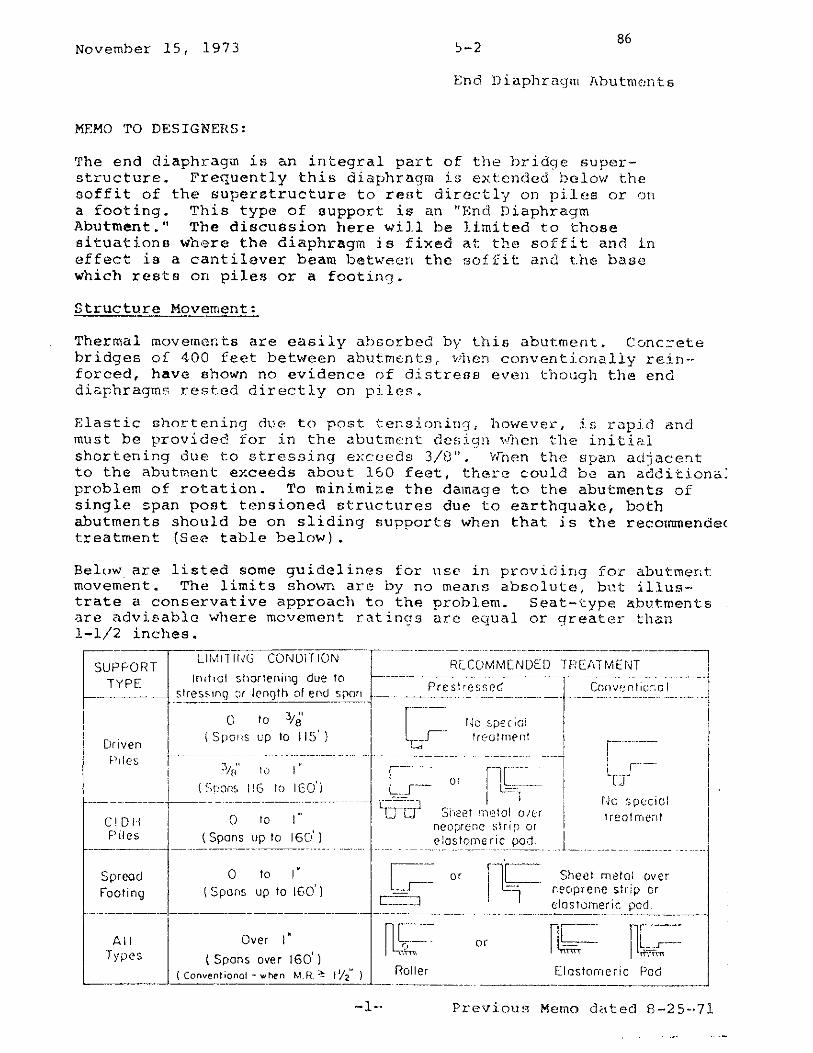
November 15, 1973 5-2 86
End Diaphragm Abutments
MEMO TO DESIGNERS:
The end diaphragm is an integral part of the brid9e superstructure. Frequently this diaphragm i.s extended below the soffit of the superstructure to reot directly on piles or on a footing. This type of aupport is <m "End Diaphragm Abutment." The discussion here will be limited to those situations where the diaphragm is fixed at the soffit ancl in effect is a cantilever beam between the soffit and the base which rests on piles or a footing.
Structure Movement:
Thermal movemer. ts are easily absorbed by this abutment. Conc.:::-ete bridges of 400 feet between abutments, '-'hen conventionally rein-forced, have shown no evidence of distrens ev('n though the end di~phragms rested directly on piles.
Elastic shortening due to post tensioning, however, is rapid and must be provided for in the abutmcr1t desig11 ,~1en t11e initial shortening due to stressing exceeds 3/8". vrnen the span ad"jacecit to the abutment exceeds about 160 feet, there could be an a~ditiona: problem of rotation. To minimize the dama9e to the abutmentG of single span post tensioned structures due to earthquake, both abutments should be on sliding supports when that is the reconnnendec treatment (See table below} .
Below are listed some guidelines for nse in providing fo:c abutment movement. The limits shown are by no means absolute, bnt illustrate a conservative approach to the problem. Seat-type abutments are advisable ~1ere movement ratings are equal or greater than 1-1/2 inches.
Spread Footing
All Types
O to 1'
I Spans up to 160')
(Spans over 160') (Conventional - when M.R. ~ 11/2" )
or r~·-- Sheet meta! ov~·r -1· r.eoprene strip or elostorneric pod
----·------~-----·----------------~-
n ~-- or ,,m,
Roller Elostomeric Pod J Over I
---- --------- -- ----------- --- _J
-1·· Previous Memo dHted 8-25-·71
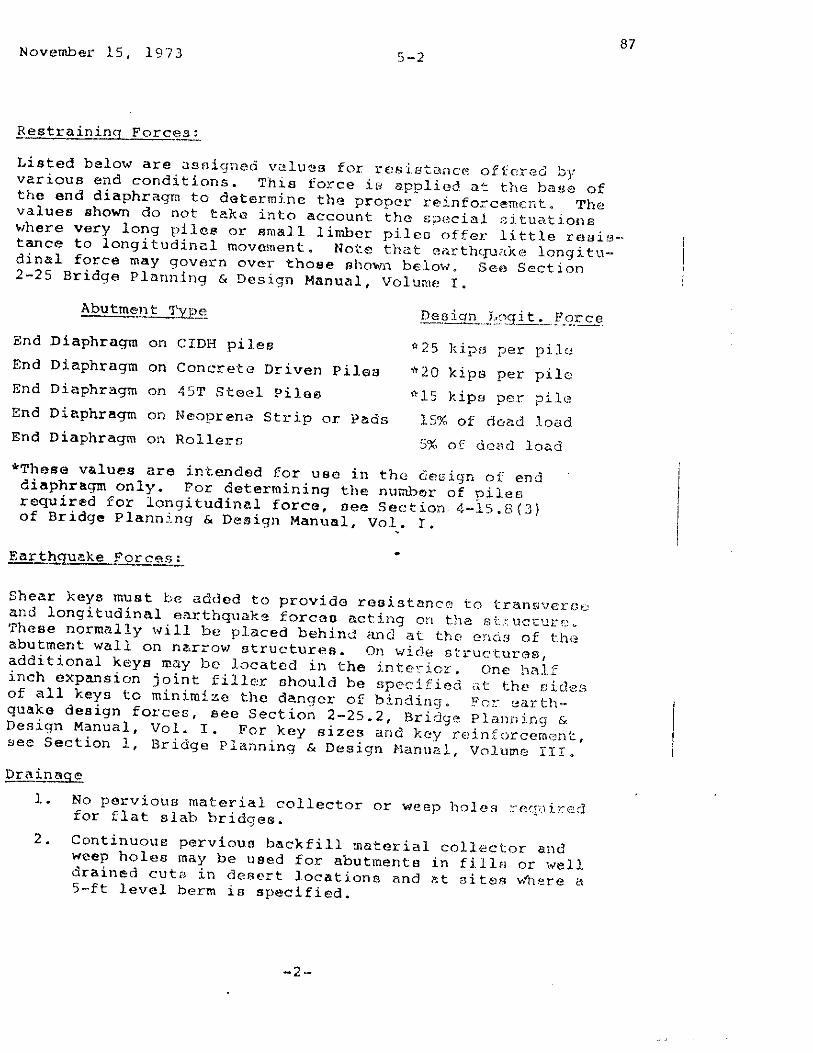
87 November 15, 1973 5-2
Restraining Forces:
Listed below are :.isoigr1ed \'<.t.lu~a for resistt!ncc-; offer::-!c1 by various end conditions. This force ie applied a~ the ba•e of the end diaphraqm to determine the proper re>info::-cemcnL The values 11hown do not tako into account the s;:iccial zitu2'.tions where very long piles or ama11 limber pileo offer little reai0-· tance to longitudinal movement. Note that ci;1rthqucike iongitu·· dinal force may qovm:n over those shown beiow. See Sect ion 2-25 Bridqe Planning & Design Manual, Volume I.
Abutment 1'yp{",
End Diaphragm on CIDH pi lee "2 5 ltipr3 per pile, End Diaphragm on ConcretG Driven Pi lea "20 kip a per pile End Diaphragm on 45T Steel Pile a "15 Jdpo per ?ilc.~ End Diaphragm on 1-.leor>rena Strip or Pads 15% of do ad load End Diaphragm 01) Rollern S'Xl of doacl loacl
*These vnlues are int.ended for use in tho cim;ign of end diaphragm only. For determining the numb~r of pileo required for longitudinal force, oee Section 4-lS.8(3) of Bridge P lann!.ng & DeBign Manual, Vol_. I •
• Earthquake Forces:
Shear keys must be added to provide reaistancG to tran5vcrot:· and longitudinal earthquake forcao acting on t:1e "'Uc uc>:ure, •rheae normally will be placed behind and at the enC.r; of the~ abutment wall on narrow structures. On wide structUrGs, additional keys may be located in the interior. One half inch expansion joint filler ahould be specified c>t the cides of all keys to minimize the danger of binding. ~or earthquake design forces, see Section 2-25.2, Bridge Planning & Design Manual, Vol. I. For key sizes and key reinforcement, 8ee Section l, Bridge Planning & Design Manu;;l, Volume III.
~i_nage
1. No pervioue material collector or weep holes reqaircd for flat elab bridges. 2. Continuous pervioua backfill material collector and weep holes may be used for abutments in fille or well drained cuta in deAcrt locationo and l':t niteB where a 5-ft level berm io specified.
-2-
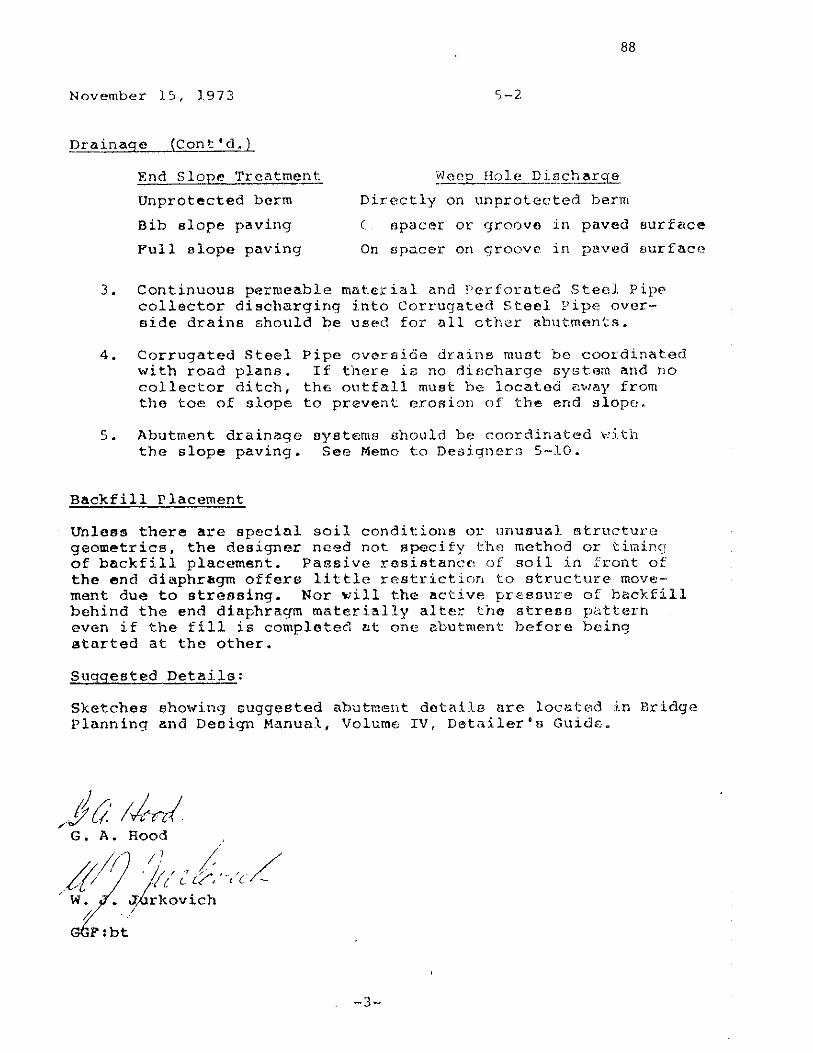
88
November 15, 1973
prainage (Cont'd.)
End Slope Treatment
Unprotected berm
Bib slope paving
Pull slope paving
Weep Bole D~!J_g_har'.:@.
Directly on unprotected berm
C spacer or groove in paved surface
On apacer on groove ir1 r)aved aurfact~
3. Continuous permeable material and Perforated Steel Pipe collector discharging into Corrugated Steel Pipe overside drains should be used for all other abutments.
4. Corrugated Steel with road plans. collector ditch, the toe of slope
Pipe overaide drains must be coordinated If there ie no discharge system and no
th" outfall must be located <0way from to prevent erosion of the end slope!.
5. Abutment drainage aystems should be coordinated ~ith the slope paving. See Memo to Designers 5-10.
Backfill Placement
Unless there are special soil conditions or unuaual !'ltructure geometrics, the designer need not specify thfl method or timing of backfill placement. Passive resistance of soil in i'ront of the end diaphragm offeri; little restriction to structure movement due to stressing. Nor will the active presaure of backfill behind the end diaphragm materially alter the stress pattern even if the fill is completed z.t one abutment before being started at the other.
Suggested Details:
Sketches showing suggested abutment details are loc1-:.t~1d in Bridg<~ Planning and Deoign Manual, Volume IV, Detailer's Guide.
;it!' ;jyJ G. A. Hood
I 11
/ / ;/ ··1-r:/, .~ '//{ L l/, '·,'c -' W. • J,.6~kovich
;;, . /
P' :bt
-3-

VIII. APPENDIX III
Iowa Department of Transportation
Foundation Soils Information Chart
90
FOUNDATION SOILS INFORMATION CHART
A majority of the bridge foundations designed by the
Highway Division, Iowa Department of Transportation rest upon
piling which derive their support primarily from the shear strength
of the surrounding soil rather Lhiln from end bearing. Economical
and safe design of such foundaU ons rcquj res a knowl0dge of the
bearing capacity of the foundaL.lon soils. 1\ chart for pile
length determination based upon tho available information and
experience was first introduced in 1958. This chart provided
a feasible method of selecting pile lengths which effectively
reduced pile cut-off. As more information becomes available,
it is necessary that the "Foundation soils Information Chart",
used for estimating pile lengths, be periodically updated.
1\ total of 234 pile load tests have been performed since
1950. To properly evaluate the information, the tests were
categorized as (a) pile tested to yjeld, and (b) pile tested to
bearing. Of the total, 117 pile load tests were grouped intc
the "pile tested to yield" cate<jory. To evaluaLe the bearinc;
capacity of foundation soils the piles tested to yield were
reviewed, excluding the inconclusive tests. Sufficient nurnbers
of conclusive tests are available for review.

Yl
-), -
The pile load tests performed on piles founded in only one
foundation soil have enabled establishing a definite bearing
value for that soil. Pile tests on certain soils have indicated
~ need for change in the bearing values given in the previous
::harts.
All available foundation soil information has been evaluated
and incorporated in the revised design chart. Blow count values
(N-Values*) obtained from standard penetration tests performed
on foundation soils and bedrocks have been included in the chart
and in the additional recommendations. Statistical analysis
was used to determine the mean value and standard deviation for
blow counts on all soils.
Evaluation of pile load tests performed upon tapered steel
shell piles on the I-129 project at the Missouri River crossing
south of Sioux City indicate that the bearing value of the tapered
pile in cohesionless foundation soils is greater than the bearing
for parallel sided pile. However, the bearing value for tapered
piling is not as high as originally indicated by the test loads
made at the council Bluffs viaduct. The additional column for
steel shell piles has been lef L in the revised chart but the
*N-Value: The number of blows required by a 140 lbs. hammer
with a free fall of 30 in. to driv<e a 2 in. O.D. by 1-3/8 in.
l.D. split tube sampler 1.0 ft. into the soil.
j
J
~ I I
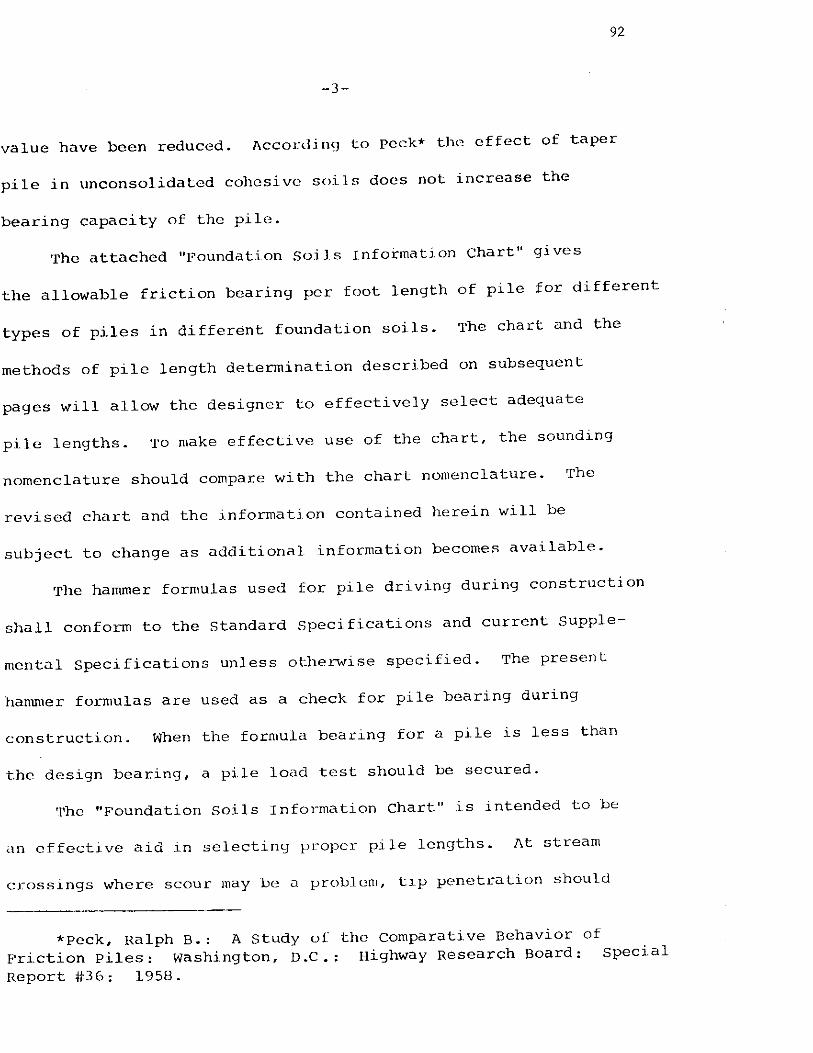
92
-3-
value have been reduced. Acconjj 119 to peck* the effect of taper
pile in unconsolidated cohesive soils does not increase the
bearing capacity of the pile.
'!'he attached "Foundation Soils Information Chart" gives
the allowable friction bearing per foot length of pile for different
types of piles in different foundation soils. '!'he chart and the
methods of pile length determination described on subsequent
pages will allow the designer to effectively select adequate
pile lengths. 'l'O make effective use of the chart, the sounding
nomenclature should compare with the chart nomenclature. '!'he
revised chart and the information contained herein will be
subject to change as additional information becomes available.
'rhe hammer formulas used for pile driving during construction
shall conform to the standard Specifications and current supple-
mental Specifications unless otherwise specified. The present
hammer formulas are used as a check for pile bearing during
construction. When the formula bearing for a pile is less than
the design bearing, a pile load test should be secured.
'rhe "Foundation soi 1 s Information chart" is intended to be
an effective aid in selecting proper pile lengths. At stream
crossings where scour may be LI problem, tip penetration should
*Peck, Ralph B.: A study of the comparative Behavior of
Priction Piles: Washington, D.C.: Highway Research Board: Special
Report #36: 1958.

-4-
be specified. Preliminary Bridge Design will determine the
ipproximate scour depth.
Where compressible (unconsolidated) soils are under a
fill, the fill should be predrilled, and drag forces calculated
in accordance with the method described elsewhere.
A steel test pile in Johnson County was tested by pulling.
The resultant allowable bearing value for very firm glacial
clay fill was 0.3 tons per foot in uplift.
93
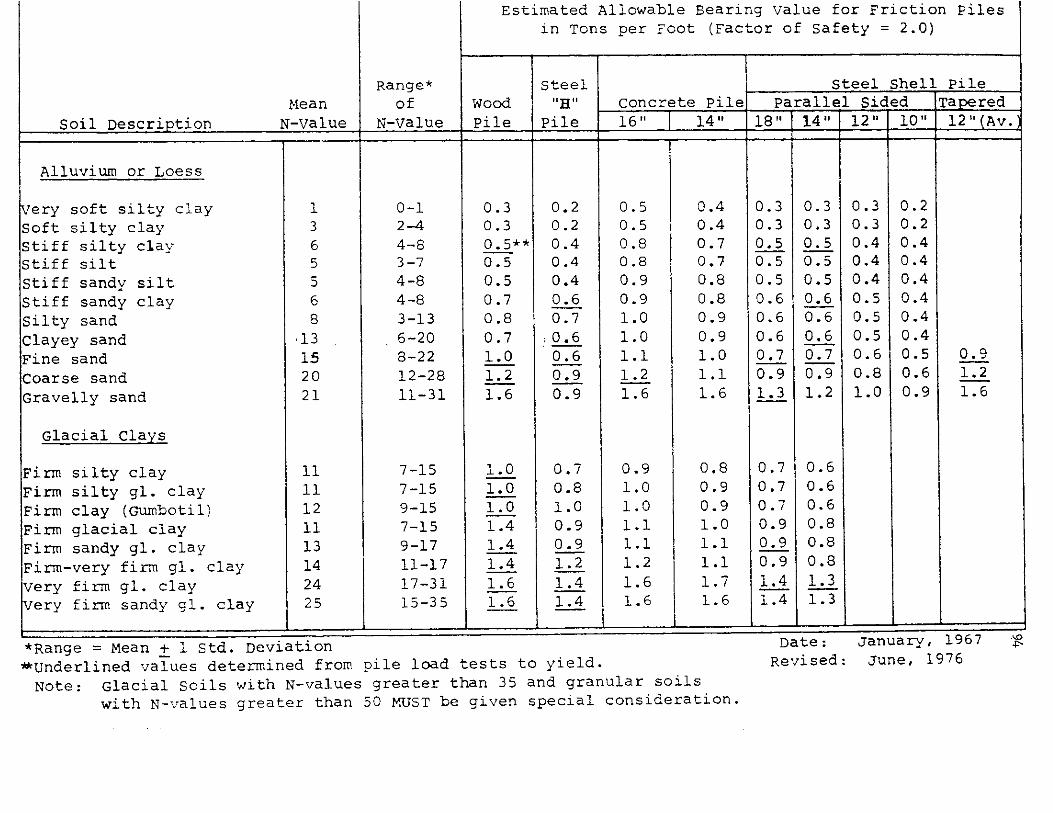
Estimated Allowable in Tons per Foot
Range* Steel Mean of Wood 11Hu concrete
Soil Description N-Value N-Value Pile Pile 16"
Alluvium or Loess
Klery soft silty clay 1 0-1 0.3 0.2 0.5 Soft silty clay 3 2-4 0.3 0.2 0.5 Stiff silty clay 6 4-8 0.5** 0.4 0.8 Stiff silt 5 3-7 0.5 0.4 0.8 Stiff sandy silt 5 4-8 0.5 0.4 0.9
Stiff sandy clay 6 4-8 0.7 0.6 0.9 --Silty sand 8 3-13 0.8 0.7 1.0
Clayey sand 13 6-20 0.7 '0 .6 1.0
Fine sand 15 8-22 1.0 0.6 1.1 --Coarse sand 20 12-28 l. 2 0.9 1.2 -- --Gravelly sand 21 11-31 1.6 0.9 1.6
Glacial Clays
Firm silty clay 11 7-15 1.0 0.7 0.9
Firm silty gl. clay 11 7-15 1.0 0.8 l. 0
Firm clay (Gumbotil) 12 9-15 1.0 1.0 1.0
Firm glacial clay 11 7-15 1.4 0.9 1.1
Firm sandy gl. clay 13 9-17 1.4 0.9 1.1
Firm-very firm gl. clay 14 11-17 1.4 1.2 1.2
very firm gl. clay 24 17-31 1.6 1.4 1.6
very firm sandy gl. clay 25 15-3 5 1.6 1.4 1.6
*Range = Mean + 1 Std. Deviation ~underlined values determined from pile load tests to yield.
Bearing value for Friction Piles (Factor of Safety = 2. 0)
Pile 14"
0.4 0.4 0.7 0.7 0.8 0.8 0.9 0.9 1.0 1.1 1.6
0.8 0.9 0.9 1.0 1.1 1.1 1.7 1.6
Steel Shell Pile Parallel Sided Ta DE' red
18" 14" 12" 10" 12"(Av.
0.3 0.3 0.3 0.2 0.3 0.3 0.3 0.2 0.5 0.5 0.4 0.4 --0.5 0.5 0.4 0.4 0.5 0.5 0.4 0.4 0.6 0.6 0.5 0.4 0.6 0.6 0.5 0.4 0.6 0.6 0.5 0.4 0.7 0.7 0.6 0.5 0.9 --0.9 0.9 0.8 0.6 1.2 1.3 1.2 1.0 0.9 l. 6
0.7 0.6 0.7 0.6 0.7 0.6 0.9 0.8 0.9 0.8 0.9 0.8 1.4 1.3 1.4 1.3
Date: January, 1967 Revised: June, 1976
Note: Glacial Soils with N-values greater than 35 and granular soils
with N-values greater than 50 MUST be given special consideration.
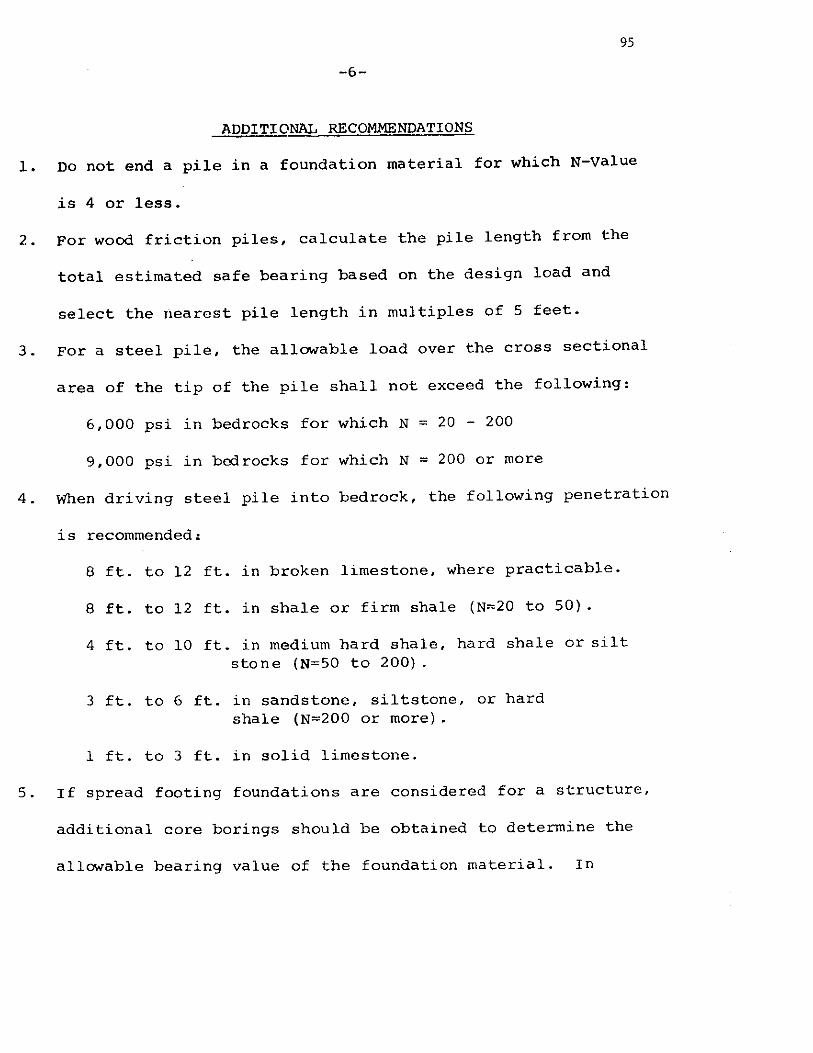
95
-6-
ADDITIONAL RECOMMENDATIONS
1. Do not end a pile in a foundation material for which N-Value
is 4 or less.
2. For wood friction piles, calculate the pile length from the
total estimated safe bearing based on the design load and
select the nearest pile length in multiples of 5 feet.
3. For a steel pile, the allowable load over the cross sectional
area of the tip of the pile shall not exceed the following:
6,000 psi in bedrocks for which N = 20 - 200
9,000 psi in bedrocks for which N = 200 or more
4. When driving steel pile into bedrock, the following penetration
is recommended:
8 ft. to 12 ft. in broken limestone, where practicable.
8 ft. to 12 ft. in shale or firm shale (N=20 to 50).
4 ft. to 10 ft. in medium hard shale, hard shale or silt stone (N=50 to 200).
3 ft. to 6 ft. in sandstone, siltstone, or hard shale (N=200 or more) .
1 ft. to 3 ft. in solid limestone.
5. If spread footing foundations are considered for a structure,
additional core borings should be obtained to determine the
allowable bearing value of the foundation material. In
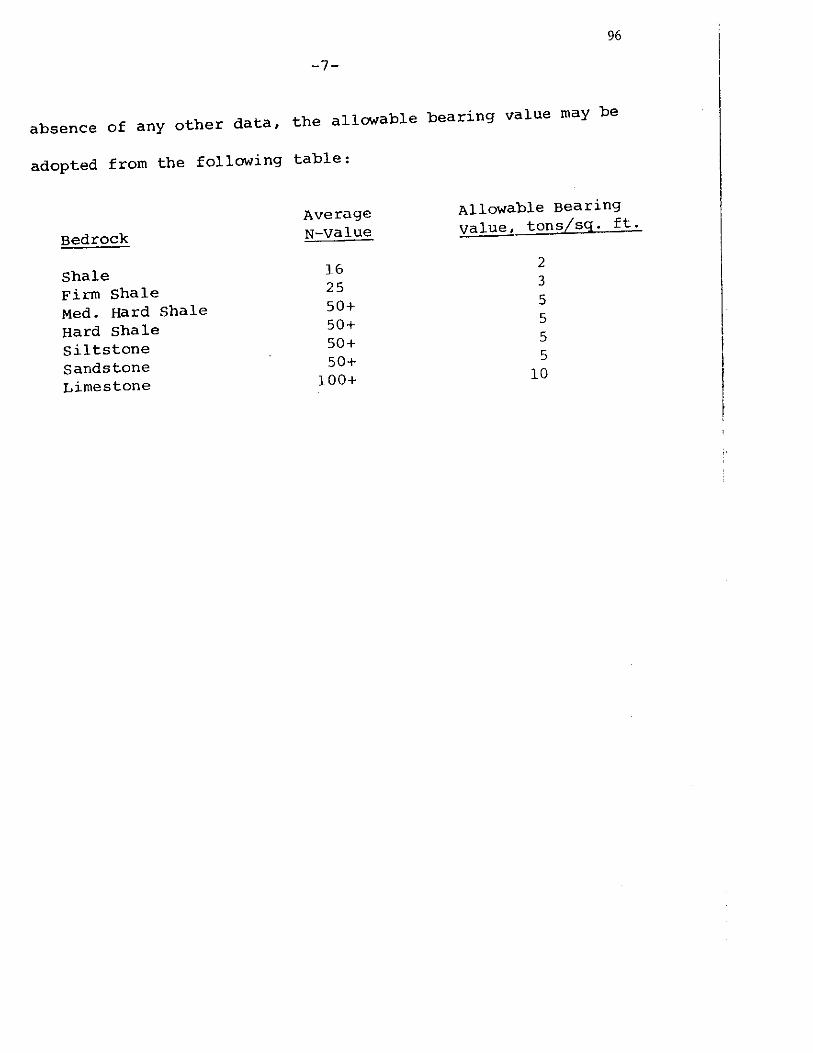
96
-7-
absence of any other data, the allowable bearing value may be
adopted from the following table:
Average Allowable Bearing
Bedrock N-value value, tons/sq. ft.
Shale 16 2
Firm shale 25 3
Med. Hard Shale 50+ 5
Hard Shale 50+ 5
Siltstone 50+ 5
Sandstone 50+ 5
Limestone 100+ 10
ACKNOWLEDGMENTS
The study presented in this report was conducted by the
Engineering Research Institute of Iowa State University and was
sponsored by the Iowa Department of Transportation, Highway Division,
through the Iowa Highway Research Board, and the Federal Highway
Administration.
97
I wish to express my appeciation to Dr. Amde M. Wolde-Tinsae and
Dr. Lowell F. Greimann, co-Principal Investigators of the research
project, for their assistance during the investigation and preparation
of this report.
I gratefully acknowledge the assistance and use of soil test
in formation of the Soils Department of the Iowa Department of
Transportation, Highway Division.
I express thanks to all those in the highway agencies who helped
to make this report complete by returning the survey questionnaire.
I offer a special thanks to those who provided additional information
concerning their design and detailing procedures.