state of wisconsin health care utilization summary...
TRANSCRIPT

State of Wisconsin
Health Care Utilization SummaryMay 2007
Prepared by:
© 2007 Wisconsin Physicians Service Insurance Corporation. All rights reserved. 22862-009-0705


Executive Summary Introduction iBenchmarks iiMember/Demographic Data iiiClaims Data iv, vProvider Data vi
Summary Level Cost and MembershipMonthly Cost and Membership 1 1-A
Group DemographicsEnrollment by Plan & Dual Choice Changes 2
Enrollment by Plan 2-ADual Choice Enrollment Changes by Plan 2-B
Member Census Grids 3 3-A, 3-B, 3-CWisconsin Enrollment 4
State of Wisconsin Map 4-AEnrollment by County 4-B
Out of State Enrollment 5United States Map 5-AOut of State Enrollment 5-B
Plan UtilizationPaid Per Member Per Month Costs 6a, 6b
Paid Medical and Drug PMPM 6-APaid Medical PMPM 6-B
PMPM by Type of Service 7a, 7bTotal PMPM by Type of Service 7-A, 7-CPaid PMPM by Type of Service 7-B, 7-D, 7-E
Type of Service Detail 8a, 8b 8-A, 8-BInpatient Utilization, Days/1000 & Average Length of Stay 9a, 9b
Inpatient Utilization 9-A, 9-BMonthly Inpatient Days/1000 9-CMonthly Inpatient Average Length of Stay 9-D
Claim Costs by Major Diagnostic Categories 10 10-A, 10-B, 10-C, 10-D
2006 STATE OF WISCONSIN UTILIZATION REPORTTable of Contents
SECTION 1: State Employee Trust FundsExhibitPage

2006 STATE OF WISCONSIN UTILIZATION REPORTTable of Contents
ExhibitPageProvider Utilization
Top 20 Providers 11a, 11b Top 20 Facility Providers 11-A, 11-BTop 20 Professional Providers 11-C, 11-D
Out of Network Utilization 12Facility Out of Network Utilization 12-AProfessional Out of Network Utilization 12-B
Large ClaimsHigh Cost Patients 13 13-A
Member Cost ShareMedical and Drug Cost Sharing 14 14-AMedical and Drug Out of Pocket by Member 15 15-A
Medical Claims Cost SavingsMedical Claims Saving Analysis 16
Medical Claims Saving Analysis 16-AMedical Claims Saving Analysis Summary 16-B
Executive Summary Member/Demographic Data iClaims Data ii, iiiProvider Data iv
Summary Level Cost and MembershipMonthly Cost and Membership 1 1-B
Group DemographicsEnrollment by Plan & Dual Choice Changes 2
Enrollment by Plan 2-CDual Choice Enrollment Changes by Plan 2-D
Member Census Grids 3 3-D, 3-E, 3-FWisconsin Enrollment 4
SECTION 2: Wisconsin Public Employers

2006 STATE OF WISCONSIN UTILIZATION REPORTTable of Contents
ExhibitPageState of Wisconsin Map 4-CEnrollment by County 4-D
Out of State Enrollment 5United States Map 5-COut of State Enrollment 5-D
Plan UtilizationPaid Per Member Per Month Costs 6
Paid Medical and Drug PMPM 6-CPaid Medical PMPM 6-D
PMPM by Type of Service 7a, 7bTotal PMPM by Type of Service 7-F, 7-HPaid PMPM by Type of Service 7-G, 7-I, 7-J
Type of Service Detail 8a, 8b 8-C, 8-DInpatient Utilization, Days/1000 & Average Length of Stay 9a, 9b
Inpatient Utilization 9-E, 9-FMonthly Inpatient Days/1000 9-GMonthly Inpatient Average Length of Stay 9-H
Claim Costs by Major Diagnostic Categories 10 10-E, 10-F, 10-G, 10-H
Provider UtilizationTop 20 Providers 11
Top 20 Facility Providers 11-E, 11-FTop 20 Professional Providers 11-G, 11-H
Out of Network Utilization N/AFacility Out of Network Utilization N/AProfessional Out of Network Utilization N/A
Large ClaimsHigh Cost Patients 13 13-B
Member Cost ShareMedical and Drug Cost Sharing 14 14-BMedical and Drug Out of Pocket by Member 15 15-B
Medical Claims Cost SavingsMedical Claims Saving Analysis 16
2006 STATE OF WISCONSIN UTILIZATION REPORTTable of Contents
ExhibitPageMedical Claims Saving Analysis 16-CMedical Claims Saving Analysis Summary 16-D
Executive Summary Value Care Medical Management Process i
Care Management Care Management Descriptions 1a, 1bCalculations of Savings from Medical Management - 2006 1cMedical Management Activity - 2006 1dDisease Management Activity - 2006 1e
Care Management Summary 1-ACase Management Cases 1-BBehavioral Health Case Management Cases 1-C
Focus on Wellness and Prevention 2Bariatric Surgery Center of Excellence 3
SECTION 3: Value Care Medical Management

State of Wisconsin
Section 1: State Employee Trust Funds


i
State Employee Trust Funds Executive Summary
Introduction The Health Care Utilization Summary Report provides highlights of the analysis performed by WPS Health Insurance for the State of Wisconsin self-insured plans. The report contains details for the Standard, SMP and Medicare Plus $1M Plans. The enrollment data spans the period of January 2006 through January 2007, including changes that occurred as a result of the 2007 Dual Choice Enrollment.
The claims data has three sources, WPS (medical), Navitus (drug), and Blue Cross Blue Shield (historical). WPS and Navitus claim information is the primary source of data used in this report. All WPS and Navitus claims are incurred between January 2006 and December 2006, and paid by the end of March 2007. The report does contain a small amount of medical only data received from Blue Cross Blue Shield for calendar year 2005 with a 12 month run-out period. WPS has used the Blue Cross Blue Shield data as it was received and cannot verify its accuracy. Only a few comparisons have been made to the prior plan year with Blue Cross Blue Shield due to data compatibility issues
The report is organized as follows:
• Executive Summary - Highlights of the report and explanation of Benchmarks used.
• Member Information - Enrollment details, including membership changes over the course of the year, geographic summaries, and demographic summaries.
• Medical and Prescription Drug Claims Data for 2006 - Per member per month(PMPM) claim costs on a monthly, calendar year type of service and Major Diagnostic Category basis, compared to a demographically adjusted WPS benchmark specific to each ETF class. Benchmarks have not been adjusted for benefit differences (for which the ETF plans have a richer than average plan design). Inpatient hospital utilization information is also included.
• Facility and Professional Provider Utilization Data - In network utilization for the Standard and SMP Plans, as well as out of network utilization for the Standard Plan has been included.
• Miscellaneous Claims Information - High cost members, medical and prescription drug cost sharing, and medical claims savings analysis.

ii
State Employee Trust Funds Executive Summary
Benchmarks The benchmarks used in this report are derived from the experience of WPS large group business. In general, these groups are a combination of private and public employers, ranging in size from 51 employees to 5,000. All groups have their primary location and the majority of their population in Wisconsin. Only groups with a full year of experience with WPS were included to avoid any biases resulting from seasonality.
Demographic benchmarks are based on calendar year 2005 data. For Medicare classes, demographic benchmarks are based on comparable WPS Medicare enrollment as appropriate.
Claim cost benchmarks are also based on calendar year 2005 data, but have been trended forward to be representative of expected results for year 2006. To make the claim benchmarks more meaningful, they have been adjusted for demographic differences between the specific population profiled in each report and the population in the WPS benchmark. For example, an older population may be expected to have higher prescription drug costs but lower maternity costs. Unless otherwise specified, each claim based benchmark has had such an adjustment made, including not only PMPM costs but days/1000 and cost/day. The factors that go into each adjustment are unique to the particular claim-based statistic. Claim benchmarks are not adjusted, however, for plan benefit differences between the average represented in the WPS benchmark and the specific reported ETF class.
In general, the ETF plans have richer plan designs than the average represented in the WPS Benchmark. Therefore, all other things being equal, the ETF plan would be expected to exceed WPS Benchmarks.

iii
State Employee Trust Funds Executive Summary
Member / Demographic Data Total enrollment was 14,489 members as of January 2007, down 8,136 members from the 22,625 members in the plan in December 2006. The reduction in membership was mainly due to the loss of 7,638 members in the SMP Plan related to the introduction of Security Health Plan as an HMO option.
The Standard Plan membership is much older than the normative distribution with 52% of membership over the age of 50 compared to the benchmark of 25%. 78% of the Standard Plan participants live within Wisconsin. Much of the Standard Plan population is located near larger metropolitan areas in Wisconsin with 25% of the population living in Dane County and 18% living in Milwaukee County.
The ages of the SMP Plan members by comparison are in line with the normative distribution showing a slightly older population as compared to the benchmark. The SMP Plan membership is almost entirely within Wisconsin, especially in the more rural areas with a majority of the population in the north central region. Only 0.7% of the population live outside of Wisconsin. For the SMP Plan 76% of plan participants live in a 5 county area including Portage, Marathon, Wood, Lincoln and Oneida counties. In 2007 the SMP Plan is available in 12 counties, down from 27 in 2006. As of January 2007, this change has resulted in a population reduction from the current 8,246 members to 593 members.
See pages 2-5 for more detail on Member/Demographic Data.

iv
State Employee Trust Funds Executive Summary
Claims Data
Summary
In 2006, the Standard Plan was 64% higher in medical PMPM claims cost than the SMP Plan. The Standard Plan’s enrollment is generally in more expensive urban areas such as Milwaukee and Dane Counties, but that accounts for only about 10% of the cost differential with the SMP Plan. A bigger factor is the difference in demographics between the two plans, which by itself would be expected to raise the Standard Plan’s costs another 27% above the SMP Plan. The final piece is simply the anti-selection that the Standard Plan is subject to vs. the other options available to the members. A broader provider panel is more attractive to members who utilize healthcare services and therefore value provider access, despite a larger premium contribution and the presence of modest cost sharing provisions within the benefit plan.
See Pages 6-10 for additional detail on the Claims Data.
Standard Plan
The Standard Plan has seen a 13.2% increase in medical claim costs between 2005 (Blue Cross Blue Shield) and 2006 (WPS). A majority of the variance to expected can be explained by one unusually large claim that is equivalent to 2.4% of the total claims for the plan. If this outlier claim is not included in the calculation, the medical trend from 2005 to 2006 would have been around 10%.
The Standard Plan’s costs were 45.6% above the benchmark in 2006. The variance to the benchmark is primarily a result of the anti-selection resulting from the dual choice open enrollment. Other contributing factors include the location of the Standard Plan’s enrolled membership (the higher cost urban areas) and the rich benefit design (relative to the benchmark).
A review of claims by Major Diagnostic Category helps explain some of the benchmark variance as well. Higher than expected costs associated with gastric bypass procedures, medical back problems, and other diagnostic procedures, combined with an above average outpatient psychiatric benefit and overall unusual large claim activity all contributed to the actual claim results being higher than the benchmark.
The Standard Plan has 44 members with claims over $100,000 for a total of $8,363,919 in claim costs. These 44 members represent 23.2% of total claims paid under the Standard Plan. The expected percent of claims over $100,000 for a group of this size is 12.1%. The Standard Plan members pay 3.5% of their own medical claims as compared to the benchmark of 7-8%.
v
WPS paid 69.2% of submitted charges on behalf of the plan.
SMP Plan
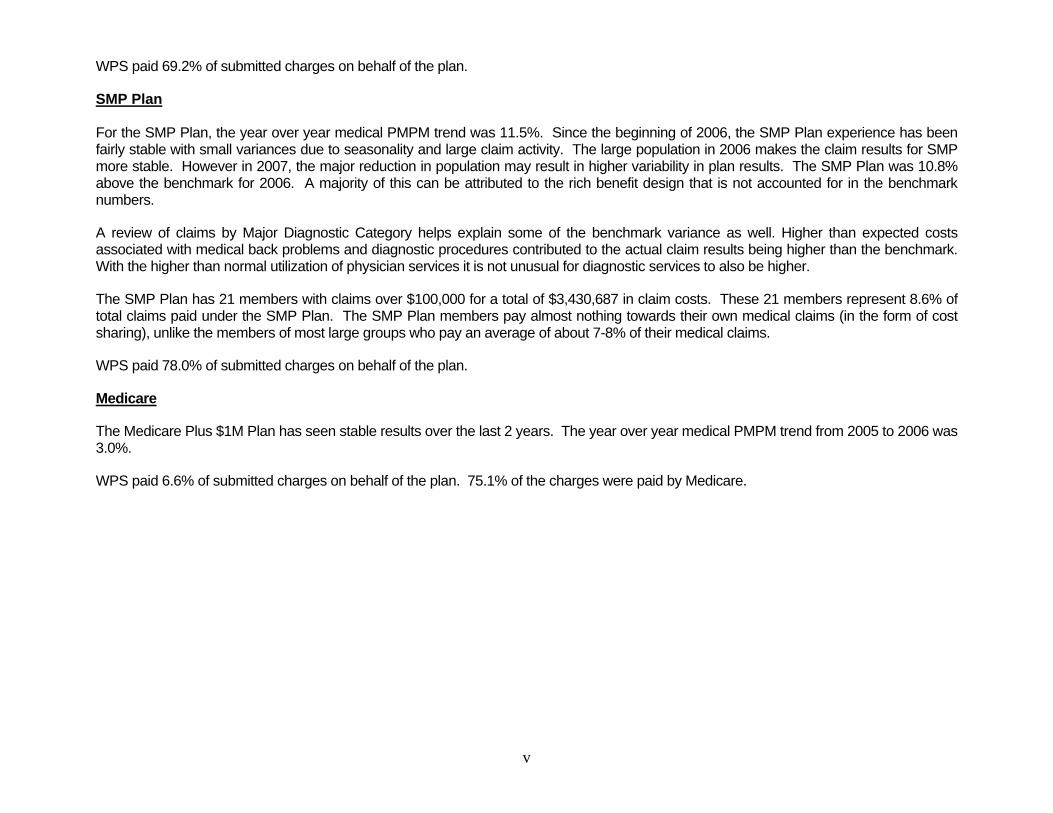
For the SMP Plan, the year over year medical PMPM trend was 11.5%. Since the beginning of 2006, the SMP Plan experience has been fairly stable with small variances due to seasonality and large claim activity. The large population in 2006 makes the claim results for SMP more stable. However in 2007, the major reduction in population may result in higher variability in plan results. The SMP Plan was 10.8% above the benchmark for 2006. A majority of this can be attributed to the rich benefit design that is not accounted for in the benchmark numbers.
A review of claims by Major Diagnostic Category helps explain some of the benchmark variance as well. Higher than expected costs associated with medical back problems and diagnostic procedures contributed to the actual claim results being higher than the benchmark. With the higher than normal utilization of physician services it is not unusual for diagnostic services to also be higher.
The SMP Plan has 21 members with claims over $100,000 for a total of $3,430,687 in claim costs. These 21 members represent 8.6% of total claims paid under the SMP Plan. The SMP Plan members pay almost nothing towards their own medical claims (in the form of cost sharing), unlike the members of most large groups who pay an average of about 7-8% of their medical claims.
WPS paid 78.0% of submitted charges on behalf of the plan.
Medicare
The Medicare Plus $1M Plan has seen stable results over the last 2 years. The year over year medical PMPM trend from 2005 to 2006 was 3.0%.
WPS paid 6.6% of submitted charges on behalf of the plan. 75.1% of the charges were paid by Medicare.

vi
State Employee Trust Funds Executive Summary
Provider Data
For the Standard Plan, the top 20 facilities provide 62% of the total facility charges for the plan. By far, the largest percent of claims and number of patients came from the University of Wisconsin hospital. 40.5% of professional charges are from the top 20 providers. The University of Wisconsin Medical Foundation is the leading professional provider. Like the facility charges, a majority of the top professional providers are from the Dane and Milwaukee Counties regions. However we do see providers from different states and regions in the top 20 providers.
For the SMP Plan, the top 20 facilities provide 93% of the total facility charges for the plan. The largest percentage of paid claims is from St. Michaels Hospital in Steven Point, followed closely by St. Josephs in Marshfield and Aspirus in Wausau. 77.8% of the paid claims are from the top 20 professional providers. Marshfield Clinic was the top professional provider receiving 37% of the overall payments, followed by St Michael’s Hospital which received 17.3% of the payment.
See pages 11 & 12 for more detail on Provider Data.


1
State Employee Trust Funds Summary Level Cost and Membership
Monthly Cost and Membership The Monthly Cost and Membership report in Exhibit 1-A shows monthly membership and incurred claims for the Standard, SMP and Medicare Plus $1M Plans from January 2006 through December 2006. The total Paid Claims include medical and drug claims and represent all claims paid through the end of March 2007. The Paid PMPM shows the average amount paid per member each month in the time period.
Enrollment on the Standard Plan averaged 4,335 members per month in 2006. The membership over the course of the year remained fairly stable with a modest increase beginning in September. The Paid PMPM cost for the Standard Plan averaged $691.73, with the first half of the year above the average at $711.82 in Paid PMPM costs and the second half of the year below the average at $672.13 in Paid PMPM costs. The monthly variance in the Paid PMPM cost can be attributed to seasonality, credibility and large claim activity.
SMP Plan enrollment averaged 8,163 members per month in 2006. The 2006 membership remained relatively stable in 2006 but also had a small increase in membership in September. The Paid PMPM cost for the SMP Plan averaged $406.21 in 2006 with little variance from this average over the year.
The Medicare Plus $1M Plan enrollment averaged 10,076 members per month in 2006. The membership declined over the course of the year, beginning with 10,235 members in January and gradually falling to 9,961 members in December. The Paid PMPM cost for the Medicare Plus $1M averaged $328.51 in 2006. Although the membership decreased throughout 2006, the Paid PMPM cost slowly increased, beginning at $317.68 in the first quarter and increasing steadily to $348.35 in the fourth quarter of 2006.

Exhibit 1-A
Covered Members Paid Claims Paid PMPM
Covered Members Paid Claims Paid PMPM
Covered Members Paid Claims Paid PMPM
2006 January 4,293 $2,835,312 $660.45 8,119 $3,365,410 $414.51 10,235 $3,407,079 $332.89February 4,304 $2,878,120 $668.71 8,123 $2,977,945 $366.61 10,201 $3,054,970 $299.48March 4,294 $3,369,696 $784.75 8,127 $3,414,222 $420.11 10,167 $3,259,836 $320.63April 4,250 $2,889,590 $679.90 8,128 $3,018,529 $371.37 10,151 $3,049,089 $300.37May 4,251 $2,890,469 $679.95 8,130 $3,366,297 $414.06 10,099 $3,373,361 $334.03June 4,297 $3,422,738 $796.54 8,134 $3,486,697 $428.66 10,059 $3,288,538 $326.92July 4,354 $2,882,327 $662.00 8,140 $3,362,621 $413.10 10,035 $3,137,401 $312.65August 4,293 $2,894,899 $674.33 8,139 $3,447,639 $423.59 10,024 $3,444,960 $343.67September 4,361 $2,750,591 $630.72 8,243 $3,004,444 $364.48 10,013 $3,279,772 $327.55October 4,465 $3,724,409 $834.13 8,246 $3,916,330 $474.94 9,988 $3,468,076 $347.22November 4,435 $2,789,040 $628.87 8,204 $3,079,590 $375.38 9,984 $3,483,099 $348.87December 4,419 $2,653,874 $600.56 8,228 $3,353,432 $407.56 9,961 $3,476,069 $348.97
Total 52,016 $35,981,065 $691.73 97,961 $39,793,155 $406.21 120,917 $39,722,250 $328.51
Note: Paid claims include prescription drugs and injectablesNote: Member counts in this exhibit have been restated to reflect retroactive membership changes through March 2007
Incurred Month
MEDICARE
STATE EMPLOYEE TRUST FUNDSMonthly Cost and Membership
Paid Through March 2007
SMPSTANDARD
2
State Employee Trust Funds Group Demographics
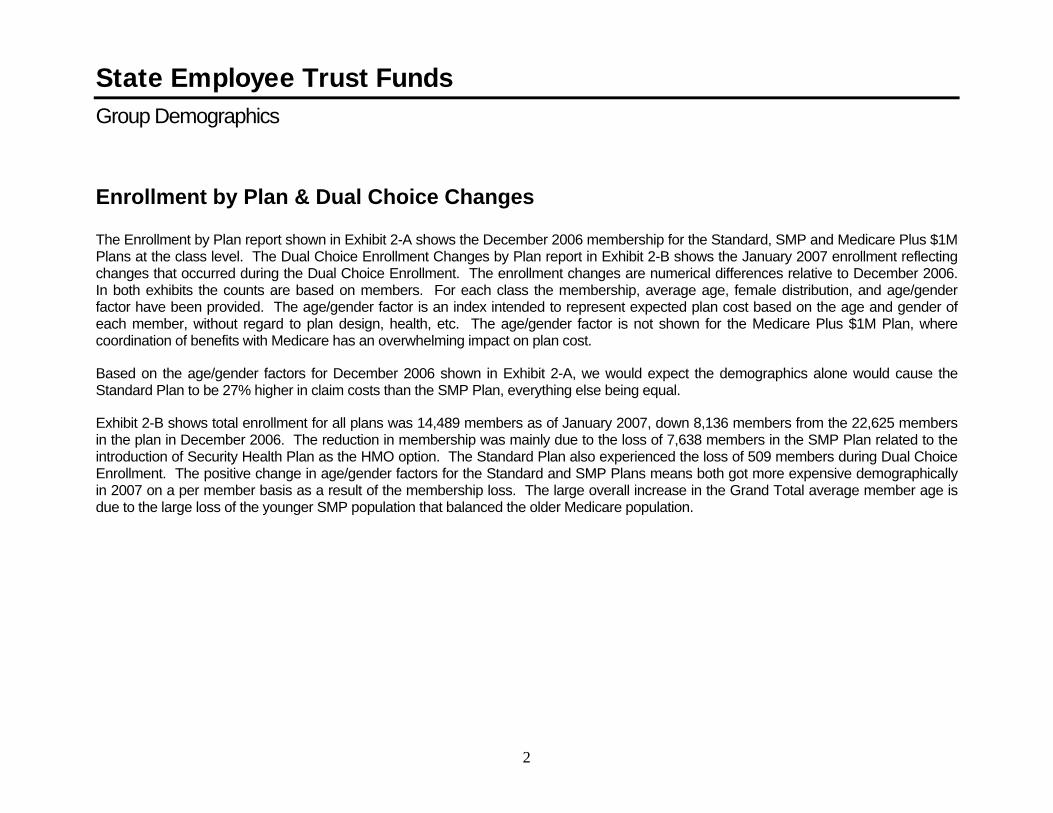
Enrollment by Plan & Dual Choice Changes The Enrollment by Plan report shown in Exhibit 2-A shows the December 2006 membership for the Standard, SMP and Medicare Plus $1M Plans at the class level. The Dual Choice Enrollment Changes by Plan report in Exhibit 2-B shows the January 2007 enrollment reflecting changes that occurred during the Dual Choice Enrollment. The enrollment changes are numerical differences relative to December 2006. In both exhibits the counts are based on members. For each class the membership, average age, female distribution, and age/gender factor have been provided. The age/gender factor is an index intended to represent expected plan cost based on the age and gender of each member, without regard to plan design, health, etc. The age/gender factor is not shown for the Medicare Plus $1M Plan, where coordination of benefits with Medicare has an overwhelming impact on plan cost.
Based on the age/gender factors for December 2006 shown in Exhibit 2-A, we would expect the demographics alone would cause the Standard Plan to be 27% higher in claim costs than the SMP Plan, everything else being equal.
Exhibit 2-B shows total enrollment for all plans was 14,489 members as of January 2007, down 8,136 members from the 22,625 members in the plan in December 2006. The reduction in membership was mainly due to the loss of 7,638 members in the SMP Plan related to the introduction of Security Health Plan as the HMO option. The Standard Plan also experienced the loss of 509 members during Dual Choice Enrollment. The positive change in age/gender factors for the Standard and SMP Plans means both got more expensive demographically in 2007 on a per member basis as a result of the membership loss. The large overall increase in the Grand Total average member age is due to the large loss of the younger SMP population that balanced the older Medicare population.

Exhibit 2-A
Plan Class # of Members
Average Member
Age
Member Gender
Distribution Female
Member Age/
Gender Factor
Standard Regular 3,201 42.7 53.9% 1.585Graduate Assistant (including GA continuation) 418 27.3 45.5% 0.882Continuation 19 36.4 47.4% 1.236Annuitants 768 56.9 67.1% 2.354
Subtotal 4,406 43.7 55.4% 1.651SMP Regular 7,469 34.9 49.9% 1.215
Graduate Assistant (including GA continuation) 88 28.6 47.7% 0.952Continuation 7 44.9 42.9% 1.568Annuitants 667 55.6 58.8% 2.261
Subtotal 8,231 36.5 50.6% 1.297Medicare Plus One Million Single 4,691 80.1 73.1% N/A
One Over 377 69.1 11.9% N/ATwo Over 4,920 75.7 50.1% N/A
Subtotal 9,988 77.5 59.5% N/AETF Grand Total 22,625 56.0 55.4% N/A
STATE EMPLOYEE TRUST FUNDSEnrollment by Plan
December 2006

Exhibit 2-B
Plan ClassJanuary 2007 Membership
Change in Membership from Prior
Month
Change in Average Member
Age
Change in Member Gender
Distibution Female
Change in Member
Age/ Gender
Standard Regular 2,712 -489 1.0 -0.2% 3.21%Graduate Assistant (including GA continuation) 390 -28 0.1 1.7% 1.52%Continuation 20 1 -2.2 7.6% -2.89%Annuitants 775 7 0.2 -0.9% 0.51%
Subtotal 3,897 -509 1.0 0.1% 3.27%SMP Regular 486 -6,983 -0.2 1.5% -0.22%
Graduate Assistant (including GA continuation) 6 -82 1.7 -14.4% -16.73%Continuation 6 -1 3.8 -9.5% 6.66%Annuitants 95 -572 -2.4 -0.9% -6.09%
Subtotal 593 -7,638 1.2 1.5% 4.74%Medicare Plus One Million Single 4,715 24 0.0 -0.2% N/A
One Over 273 -104 0.6 1.3% N/ATwo Over 5,011 91 0.0 0.0% N/A
Subtotal 9,999 11 0.1 0.4% N/AETF Grand Total 14,489 -8,136 11.1 2.9% N/A
STATE EMPLOYEE TRUST FUNDSDual Choice Enrollment Changes by Plan
December 2006 to January 2007


3
State Employee Trust Funds Group Demographics
Member Census Grids The Member Census Grid breaks down the December 2006 membership into age and gender categories for the Standard, SMP and Medicare Plus $1M Plans. The Standard and SMP distributions are compared to a benchmark distribution based on WPS large group business as described in the Executive Summary. The benchmark distribution for the Medicare plan is based on comparable WPS Medicare enrollment.
Standard Plan
The Standard Plan membership shown in Exhibit 3-A appears to be much older than the normative distribution with 52% of membership over the age of 50 compared to the benchmark of 25%. The broad provider panel and out of state membership produce an upward bias on the average age. Older members tend to seek more medical care and tend to select a broader panel of providers for that care. Since the Standard Plan has a broader panel of providers, this causes the average age to be higher. Secondly, the Standard Plan is the only out of state offering. Therefore, all retirees who move out of state will select the Standard Plan, again contributing to a higher average age.
Also corresponding to the older than expected membership is the smaller than expected population of children with only 16% of the membership under the age of 20 compared to the benchmark of 30%. The Standard Plan also has a slightly higher than normal population of females with 55.4% female as compared to the benchmark of 51.7%.
SMP Plan
The SMP Plan membership shown in Exhibit 3-B by comparison seems to be in line with the normative distribution with only a slightly older population as compared to the benchmark. The SMP distribution was above the benchmark from age 45 to age 65 which is pushing the average age slightly above the norm.
Medicare
The Medicare Plus $1M Plan membership is shown in Exhibit 3-C. The population over the age of 65 is distributed evenly, with most age bands containing about 20% of the population.

Exhibit 3-A
Age Band # of Members % of Total Benchmark Age Band # of Members % of Total Benchmark Age Band # of Members % of Total Benchmark
< 20 373 8.5% 14.5% < 20 344 7.8% 15.3% < 20 717 16.3% 29.8%20 - 24 146 3.3% 3.9% 20 - 24 139 3.2% 3.3% 20 - 24 285 6.5% 7.2%25 - 29 104 2.4% 3.3% 25 - 29 112 2.5% 2.7% 25 - 29 216 4.9% 6.0%30 - 34 109 2.5% 3.4% 30 - 34 82 1.9% 3.1% 30 - 34 191 4.3% 6.5%35 - 39 97 2.2% 4.0% 35 - 39 92 2.1% 3.6% 35 - 39 189 4.3% 7.6%40 - 44 121 2.7% 4.8% 40 - 44 91 2.1% 4.2% 40 - 44 212 4.8% 9.0%45 - 49 201 4.6% 5.0% 45 - 49 122 2.8% 4.4% 45 - 49 323 7.3% 9.4%50 - 54 256 5.8% 5.0% 50 - 54 196 4.4% 4.3% 50 - 54 452 10.3% 9.3%55 - 59 399 9.1% 4.2% 55 - 59 252 5.7% 3.7% 55 - 59 651 14.8% 7.9%60 - 64 525 11.9% 2.5% 60 - 64 377 8.6% 2.5% 60 - 64 902 20.5% 5.0%65 + 108 2.5% 1.1% 65 + 160 3.6% 1.2% 65 + 268 6.1% 2.3%
Total 2,439 55.4% 51.7% Total 1,967 44.6% 48.3% Total 4,406 100.0% 100.0%
MALE TOTAL
STATE EMPLOYEE TRUST FUNDSMember Census Grid - Standard
December 2006
FEMALE
Membership Distribution
0.0%
5.0%
10.0%
15.0%
20.0%
25.0%
30.0%
35.0%
< 20 20 - 24 25 - 29 30 - 34 35 - 39 40 - 44 45 - 49 50 - 54 55 - 59 60 - 64 65 +
ETF Standard Benchmark

Exhibit 3-B
Age Band # of Members % of Total Benchmark Age Band # of Members % of Total Benchmark Age Band # of Members % of Total Benchmark
< 20 1,040 12.6% 14.5% < 20 1,156 14.0% 15.3% < 20 2,196 26.7% 29.8%20 - 24 302 3.7% 3.9% 20 - 24 237 2.9% 3.3% 20 - 24 539 6.5% 7.2%25 - 29 165 2.0% 3.3% 25 - 29 128 1.6% 2.7% 25 - 29 293 3.6% 6.0%30 - 34 207 2.5% 3.4% 30 - 34 179 2.2% 3.1% 30 - 34 386 4.7% 6.5%35 - 39 279 3.4% 4.0% 35 - 39 240 2.9% 3.6% 35 - 39 519 6.3% 7.6%40 - 44 353 4.3% 4.8% 40 - 44 311 3.8% 4.2% 40 - 44 664 8.1% 9.0%45 - 49 485 5.9% 5.0% 45 - 49 391 4.8% 4.4% 45 - 49 876 10.6% 9.4%50 - 54 530 6.4% 5.0% 50 - 54 534 6.5% 4.3% 50 - 54 1,064 12.9% 9.3%55 - 59 429 5.2% 4.2% 55 - 59 485 5.9% 3.7% 55 - 59 914 11.1% 7.9%60 - 64 340 4.1% 2.5% 60 - 64 344 4.2% 2.5% 60 - 64 684 8.3% 5.0%65 + 35 0.4% 1.1% 65 + 61 0.7% 1.2% 65 + 96 1.2% 2.3%
Total 4,165 50.6% 51.7% Total 4,066 49.4% 48.3% Total 8,231 100.0% 100.0%
MALE TOTAL
STATE EMPLOYEE TRUST FUNDSMember Census Grid - SMP
December 2006
FEMALE
Membership Distribution
0.0%
5.0%
10.0%
15.0%
20.0%
25.0%
30.0%
35.0%
< 20 20 - 24 25 - 29 30 - 34 35 - 39 40 - 44 45 - 49 50 - 54 55 - 59 60 - 64 65 +
ETF SMP Benchmark
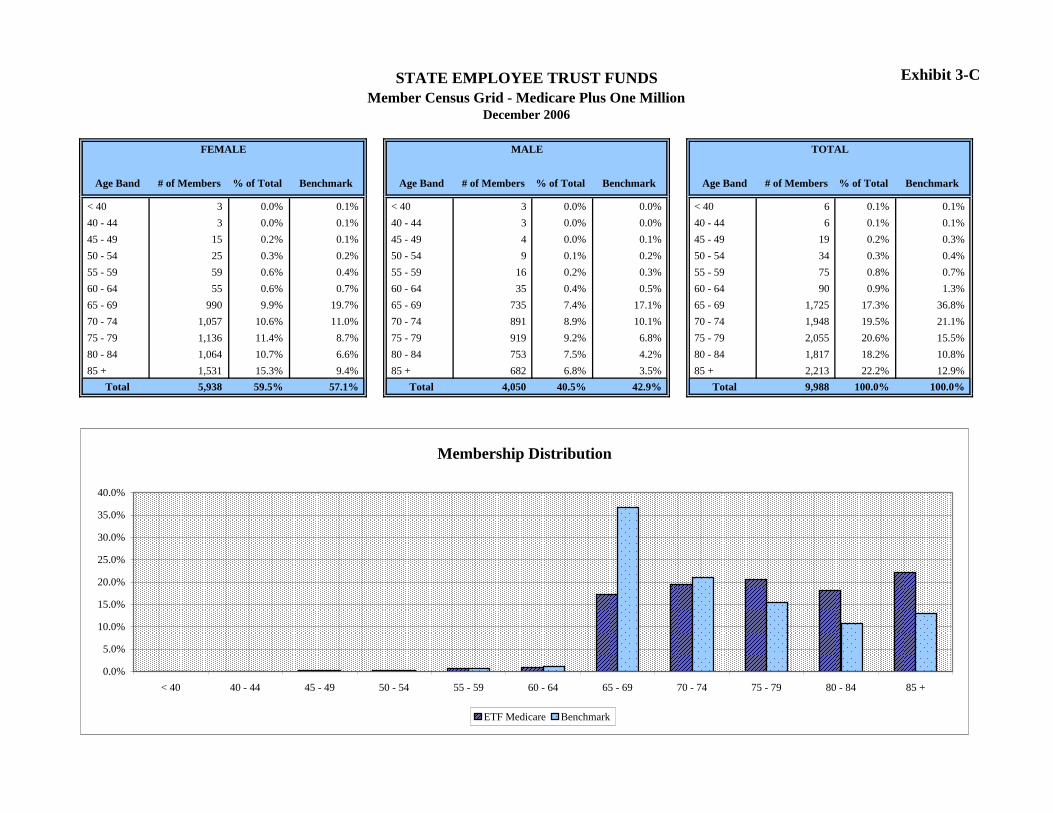
Exhibit 3-C
Age Band # of Members % of Total Benchmark Age Band # of Members % of Total Benchmark Age Band # of Members % of Total Benchmark
< 40 3 0.0% 0.1% < 40 3 0.0% 0.0% < 40 6 0.1% 0.1%40 - 44 3 0.0% 0.1% 40 - 44 3 0.0% 0.0% 40 - 44 6 0.1% 0.1%45 - 49 15 0.2% 0.1% 45 - 49 4 0.0% 0.1% 45 - 49 19 0.2% 0.3%50 - 54 25 0.3% 0.2% 50 - 54 9 0.1% 0.2% 50 - 54 34 0.3% 0.4%55 - 59 59 0.6% 0.4% 55 - 59 16 0.2% 0.3% 55 - 59 75 0.8% 0.7%60 - 64 55 0.6% 0.7% 60 - 64 35 0.4% 0.5% 60 - 64 90 0.9% 1.3%65 - 69 990 9.9% 19.7% 65 - 69 735 7.4% 17.1% 65 - 69 1,725 17.3% 36.8%70 - 74 1,057 10.6% 11.0% 70 - 74 891 8.9% 10.1% 70 - 74 1,948 19.5% 21.1%75 - 79 1,136 11.4% 8.7% 75 - 79 919 9.2% 6.8% 75 - 79 2,055 20.6% 15.5%80 - 84 1,064 10.7% 6.6% 80 - 84 753 7.5% 4.2% 80 - 84 1,817 18.2% 10.8%85 + 1,531 15.3% 9.4% 85 + 682 6.8% 3.5% 85 + 2,213 22.2% 12.9%
Total 5,938 59.5% 57.1% Total 4,050 40.5% 42.9% Total 9,988 100.0% 100.0%
MALE TOTAL
STATE EMPLOYEE TRUST FUNDSMember Census Grid - Medicare Plus One Million
December 2006
FEMALE
Membership Distribution
0.0%
5.0%
10.0%
15.0%
20.0%
25.0%
30.0%
35.0%
40.0%
< 40 40 - 44 45 - 49 50 - 54 55 - 59 60 - 64 65 - 69 70 - 74 75 - 79 80 - 84 85 +
ETF Medicare Benchmark

4
State Employee Trust Funds Group Demographics
Wisconsin Enrollment The Wisconsin Enrollment map in Exhibit 4-A visually shows how the membership for the Standard and SMP Plans are dispersed throughout Wisconsin. The map shows enrollment on December 1, 2006. Each of the dots represents one address. Members of the SMP plan that appear to be living outside the available SMP county region are typically dependent students. Exhibit 4-B shows the same information numerically.
78% of the Standard Plan participants live within Wisconsin. Much of the Standard Plan population is located near larger metropolitan areas in Wisconsin with 25% of the population living in Dane County and 18% living in Milwaukee County.
The SMP Plan membership in comparison is almost entirely within Wisconsin and in the more rural areas with a majority of the population in the north central region. 76% of the SMP Plan participants live in a 5 county area including Portage, Marathon, Wood, Lincoln and Oneida counties. In 2007 the SMP Plan will only be available in 12 counties down from the current 27 county region. This change has resulted in a population reduction from the current 8,246 members to 593 members as of January 2007. The large loss of the membership in the north central region may lead to increased volatility in SMP Plan results for 2007.

State Employee Trust Funds
Wisconsin Membership Locations December 2006
Standard
SMP
30 miles
Exhibit 4-A

Exhibit 4-B
County# of
Members% of
Members# of
Members% of
Members County# of
Members% of
Members# of
Members% of
Members County# of
Members% of
Members# of
Members% of
Members
ADAMS 2 0.0% 1 0.0% IRON 2 0.0% 49 0.6% PRICE 4 0.1% 183 2.2%ASHLAND 4 0.1% 74 0.9% JACKSON 2 0.0% 0 0.0% RACINE 154 3.5% 4 0.0%BARRON 11 0.2% 1 0.0% JEFFERSON 20 0.5% 0 0.0% RICHLAND 2 0.0% 1 0.0%BAYFIELD 7 0.2% 62 0.8% JUNEAU 7 0.2% 0 0.0% ROCK 38 0.9% 0 0.0%BROWN 62 1.4% 0 0.0% KENOSHA 52 1.2% 0 0.0% RUSK 1 0.0% 0 0.0%BUFFALO 4 0.1% 1 0.0% KEWAUNEE 2 0.0% 0 0.0% SAUK 8 0.2% 0 0.0%BURNETT 4 0.1% 40 0.5% LACROSSE 28 0.6% 0 0.0% SAWYER 5 0.1% 34 0.4%CALUMET 11 0.2% 0 0.0% LAFAYETTE 0 0.0% 0 0.0% SHAWANO 7 0.2% 40 0.5%CHIPPEWA 27 0.6% 0 0.0% LANGLADE 4 0.1% 185 2.2% SHEBOYGAN 16 0.4% 0 0.0%CLARK 0 0.0% 199 2.4% LINCOLN 12 0.3% 790 9.6% ST CROIX 7 0.2% 66 0.8%COLUMBIA 5 0.1% 0 0.0% MANITOWOC 23 0.5% 0 0.0% TAYLOR 1 0.0% 114 1.4%CRAWFORD 0 0.0% 0 0.0% MARATHON 23 0.5% 1,120 13.6% TREMPEALEAU 4 0.1% 0 0.0%DANE 1,112 25.2% 10 0.1% MARINETTE 29 0.7% 189 2.3% VERNON 2 0.0% 0 0.0%DODGE 7 0.2% 0 0.0% MARQUETTE 0 0.0% 1 0.0% VILAS 13 0.3% 366 4.4%DOOR 4 0.1% 0 0.0% MENOMINEE 5 0.1% 0 0.0% WALWORTH 50 1.1% 0 0.0%DOUGLAS 4 0.1% 34 0.4% MILWAUKEE 809 18.4% 0 0.0% WASHBURN 4 0.1% 30 0.4%DUNN 78 1.8% 1 0.0% MONROE 2 0.0% 0 0.0% WASHINGTON 42 1.0% 0 0.0%EAU CLAIRE 87 2.0% 0 0.0% OCONTO 6 0.1% 7 0.1% WAUKESHA 167 3.8% 0 0.0%FLORENCE 0 0.0% 30 0.4% ONEIDA 9 0.2% 729 8.9% WAUPACA 29 0.7% 33 0.4%FOND DU LAC 46 1.0% 3 0.0% OUTAGAMIE 25 0.6% 0 0.0% WAUSHARA 3 0.1% 31 0.4%FOREST 4 0.1% 63 0.8% OZAUKEE 82 1.9% 0 0.0% WINNEBAGO 141 3.2% 3 0.0%GRANT 35 0.8% 0 0.0% PEPIN 2 0.0% 0 0.0% WOOD 10 0.2% 888 10.8%GREEN 7 0.2% 0 0.0% PIERCE 25 0.6% 78 0.9% OUT OF STATE 939 21.3% 55 0.7%GREEN LAKE 15 0.3% 0 0.0% POLK 0 0.0% 27 0.3%IOWA 9 0.2% 0 0.0% PORTAGE 45 1.0% 2,689 32.7% Totals 4,406 100.0% 8,231 100.0%
STATE EMPLOYEE TRUST FUNDSEnrollment By County
December 2006
STANDARD SMP STANDARD SMP STANDARD SMP


5
State Employee Trust Funds Group Demographics
Out of State Enrollment The United States Enrollment Map in Exhibit 5-A visually depicts how the enrollment in the Standard and SMP Plans is spread throughout the United States. The out of state enrollment is based on the member’s address as of December 2006 and could change as members relocate. The map displays the number of Standard and SMP Plan members living in each state along with a shading scheme in which higher population areas are represented with increasingly darker shading. Exhibit 5-B shows the same information numerically.
The Standard Plan has 21.3% of the population living outside the state of Wisconsin with the membership dispersed over 45 states with an additional 46 members living internationally. 32% of the out of state enrollment lives along the Wisconsin border with the largest number of members living in Illinois (190 members or 20%). Another 28% of the out of state membership lives in the sunbelt with 105 members in Florida, 63 members in Arizona, 62 members in California, and 30 members in Texas.
The SMP Plan in comparison has only 0.7% of the population living outside the state of Wisconsin. A majority of the out of state membership resides in Minnesota and Michigan who are likely employees living on the Wisconsin border. The SMP Plan does have some provider coverage in the states bordering Wisconsin however the plan does not have any non-emergency provider coverage in other states.

Exhibit 5-A
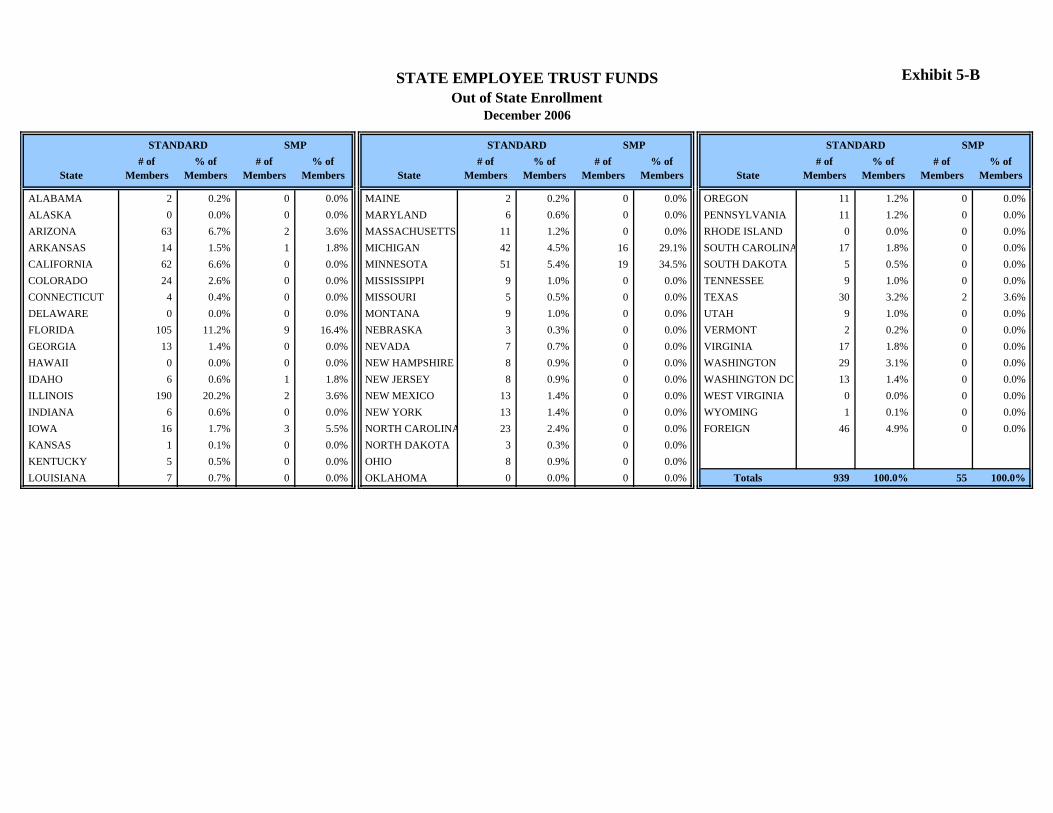
Exhibit 5-B
State# of
Members% of
Members# of
Members% of
Members State# of
Members% of
Members# of
Members% of
Members State# of
Members% of
Members# of
Members% of
Members
ALABAMA 2 0.2% 0 0.0% MAINE 2 0.2% 0 0.0% OREGON 11 1.2% 0 0.0%ALASKA 0 0.0% 0 0.0% MARYLAND 6 0.6% 0 0.0% PENNSYLVANIA 11 1.2% 0 0.0%ARIZONA 63 6.7% 2 3.6% MASSACHUSETTS 11 1.2% 0 0.0% RHODE ISLAND 0 0.0% 0 0.0%ARKANSAS 14 1.5% 1 1.8% MICHIGAN 42 4.5% 16 29.1% SOUTH CAROLINA 17 1.8% 0 0.0%CALIFORNIA 62 6.6% 0 0.0% MINNESOTA 51 5.4% 19 34.5% SOUTH DAKOTA 5 0.5% 0 0.0%COLORADO 24 2.6% 0 0.0% MISSISSIPPI 9 1.0% 0 0.0% TENNESSEE 9 1.0% 0 0.0%CONNECTICUT 4 0.4% 0 0.0% MISSOURI 5 0.5% 0 0.0% TEXAS 30 3.2% 2 3.6%DELAWARE 0 0.0% 0 0.0% MONTANA 9 1.0% 0 0.0% UTAH 9 1.0% 0 0.0%FLORIDA 105 11.2% 9 16.4% NEBRASKA 3 0.3% 0 0.0% VERMONT 2 0.2% 0 0.0%GEORGIA 13 1.4% 0 0.0% NEVADA 7 0.7% 0 0.0% VIRGINIA 17 1.8% 0 0.0%HAWAII 0 0.0% 0 0.0% NEW HAMPSHIRE 8 0.9% 0 0.0% WASHINGTON 29 3.1% 0 0.0%IDAHO 6 0.6% 1 1.8% NEW JERSEY 8 0.9% 0 0.0% WASHINGTON DC 13 1.4% 0 0.0%ILLINOIS 190 20.2% 2 3.6% NEW MEXICO 13 1.4% 0 0.0% WEST VIRGINIA 0 0.0% 0 0.0%INDIANA 6 0.6% 0 0.0% NEW YORK 13 1.4% 0 0.0% WYOMING 1 0.1% 0 0.0%IOWA 16 1.7% 3 5.5% NORTH CAROLINA 23 2.4% 0 0.0% FOREIGN 46 4.9% 0 0.0%KANSAS 1 0.1% 0 0.0% NORTH DAKOTA 3 0.3% 0 0.0%KENTUCKY 5 0.5% 0 0.0% OHIO 8 0.9% 0 0.0%LOUISIANA 7 0.7% 0 0.0% OKLAHOMA 0 0.0% 0 0.0% Totals 939 100.0% 55 100.0%
STATE EMPLOYEE TRUST FUNDSOut of State Enrollment
December 2006
STANDARD SMP STANDARD SMP STANDARD SMP


6a
State Employee Trust Funds Plan Utilization
Paid Per Member Per Month Costs The Paid Medical and Drug PMPM report in Exhibit 6-A displays the average amount paid per member each month for the Standard, SMP and Medicare Plus $1M Plans incurred from January 2006 through December 2006. The PMPM costs for each plan represent medical and drug claims paid through the end of March 2007. The Paid Medical PMPM report in exhibit 6-B is similar except it excludes drugs and includes data from Blue Cross Blue Shield going back to January 2005, completed through December 2006. WPS has used the Blue Cross Blue Shield data as given and cannot verify its accuracy.
Standard Plan
The Standard Plan has seen a 13.2% increase in medical claim costs between 2005 and 2006. Claim costs rose sharply starting in December 2005, remained relatively steady throughout most of 2006 and then generally fell in late 2006, aside from a spike in October due to a large claim. Independent trend estimates for medical claims for 2006 were 10-12%, thus the Standard Plan ran slightly above expected. A majority of the variance between actual trend and expected trend can be explained by the unusually large claim that is equivalent to 2.4% of the total claims for the plan. If this single outlier claim is not included in the calculation, the medical trend from 2005 to 2006 would have been 10% and therefore well within the expected range. The smaller population of the Standard Plan as compared to the SMP Plan lead to instability in the monthly claim results. The monthly spikes in claim costs are generally due to large claim activity that occurred in those months.
In 2006, the Standard Plan was 64% higher in medical PMPM claims cost than the SMP Plan. The Standard Plan’s enrollment is generally in more expensive urban areas such as Milwaukee and Dane Counties, but that accounts for only about 10% of the cost differential with the SMP Plan. A bigger factor is the difference in demographics between the two plans, which by itself would be expected to raise the Standard Plan’s costs another 27% above the SMP Plan. The final piece is simply the anti-selection that the Standard Plan is subject to versus the other options available to the membership. Members who utilize healthcare services are generally willing to make a larger premium contribution and incur modest cost sharing provisions within the benefit plan in exchange for the broader panel of providers.

6b
SMP Plan
The SMP Plan has also seen an increase in claims over the last year beginning in October 2005. The Medical Only PMPM was the highest in the third quarter of 2005 at $361.70 but is averaging $348.95 in 2006. The year over year medical PMPM trend was 11.5%. Since the beginning of 2006, the SMP Plan experience has been fairly stable with only small variances due to seasonality and large claim activity. However in 2007, the large reduction in population will result in higher variability in plan results.
Medicare
The Medicare Plus $1M Plan has seen stable results over the last 2 years. We would expect this population to have stable results since Medicare is the primary payer and the plan has a large population. Seasonally, the medical only costs start out high during the first months of the year and then decline. When drug costs are added, the pattern is reversed and more resembles a typical non-Medicare plan. The year over year medical PMPM trend from 2005 to 2006 was 3.0%. We would expect a small increase in the medical claims each year due to the benefit changes Medicare makes annually and medical cost trend.

Exhibit 6-ASTATE EMPLOYEE TRUST FUNDSPaid Medical and Drug PMPM
Paid Through March 2007
$0
$100
$200
$300
$400
$500
$600
$700
$800
$900
$1,000
Incurred Month
PMPM
Standard $660.45 $668.71 $784.75 $679.90 $679.95 $796.54 $662.00 $674.33 $630.72 $834.13 $628.87 $600.56
SMP $414.51 $366.61 $420.11 $371.37 $414.06 $428.66 $413.10 $423.59 $364.48 $474.94 $375.38 $407.56
Medicare $332.89 $299.48 $320.63 $300.37 $334.03 $326.92 $312.65 $343.67 $327.55 $347.22 $348.87 $348.97
Jan 2006 Feb 2006 Mar 2006 Apr 2006 May 2006 Jun 2006 Jul 2006 Aug 2006 Sep 2006 Oct 2006 Nov 2006 Dec 2006

Exhibit 6-B
Jan 05 Feb 05 Mar 05 Apr 05 May 05 Jun 05 Jul 05 Aug 05 Sep 05 Oct 05 Nov 05 Dec 05 Jan 06 Feb 06 Mar 06 Apr 06 May 06 Jun 06 Jul 06 Aug 06 Sep 06 Oct 06 Nov 06 Dec 06
Standard $423.85 $513.42 $510.85 $531.91 $523.17 $608.46 $481.49 $523.61 $557.86 $512.59 $455.95 $588.95 $560.25 $575.39 $682.31 $576.66 $564.96 $688.48 $561.24 $565.10 $535.16 $733.82 $523.07 $490.57
SMP $304.57 $277.01 $301.74 $334.63 $320.39 $290.77 $301.55 $285.53 $255.13 $378.46 $347.63 $358.99 $366.10 $317.93 $365.67 $320.29 $356.63 $371.30 $357.66 $363.19 $306.33 $413.05 $311.43 $337.90
Medicare $155.15 $123.82 $129.49 $135.06 $119.61 $116.99 $108.18 $112.59 $109.30 $112.31 $110.47 $106.00 $160.44 $126.55 $130.70 $118.49 $130.61 $123.71 $107.62 $121.33 $114.75 $122.14 $119.18 $107.09
STATE EMPLOYEE TRUST FUNDSPaid Medical PMPM
Paid Through March 2007
INCURRED MONTH
$0
$100
$200
$300
$400
$500
$600
$700
$800
$900
$1,000
Jan 05 Feb 05 Mar 05 Apr 05 May 05 Jun 05 Jul 05 Aug 05 Sep 05 Oct 05 Nov 05 Dec 05 Jan 06 Feb 06 Mar 06 Apr 06 May 06 Jun 06 Jul 06 Aug 06 Sep 06 Oct 06 Nov 06 Dec 06
Standard SMP Medicare

7a
State Employee Trust Funds Plan Utilization
PMPM by Type of Service Reports The Total PMPM by Type of Service reports (7-A and 7-C) provide a breakdown of the PMPM by major type of service compared to the benchmark. The pie chart also provides an overview of the percentage of the PMPM each major type of service is contributing to the total PMPM plus a comparison to the benchmark. The total PMPM costs are for claims incurred January 2006 - December 2006 and paid through the end of March 2007. The Paid PMPM by Type of Service reports (7-B, 7-D, and 7-E) show the same actual data on a month by month basis for 2006.
Standard Plan
The Standard Plan in Exhibit 7-A shows that the percentage breakdown by major type of service is in line with the benchmark with a slightly smaller percentage falling into the physician category and a little more falling into the other services category. Although the percentage breakdown is relatively close to expected, the total PMPM cost is 45.6% above the benchmark. The inpatient facility PMPM cost is 54.7% above the benchmark and outpatient facility is 47.5% above the benchmark. The Standard Plan did experience higher than expected large claim activity which is directly correlated with inpatient charges. The physician PMPM cost is 21.2% above the benchmark. The drug paid PMPM cost is 41.8% above the benchmark and roughly in line with the variance of the non-drug paid costs. Lastly the other services category is 132.2% over the norm. The largest contributor to this differential is the psychiatric/AODA benefit sub-category which is $25.41 above the norm. The overrun in the psychiatric/AODA benefit sub-category was caused by a combination of higher utilization and generous benefits. Every $1.00 PMPM represented in the graph is equivalent to $52,016 in annual plan costs for the Standard Plan.
Exhibit 7-B shows the Standard Plan’s paid PMPM costs on a monthly basis for 2006. As expected, facility inpatient is the most volatile due to large claim activity.
SMP Plan
Exhibit 7-C shows the percentage breakdown by type of service for the SMP Plan is slightly different than the benchmark. The healthier population in the SMP Plan results in facility charges being a smaller percentage of total costs and physician charges being a larger percentage of the total. The inpatient facility PMPM cost is 20.0% below the norm and outpatient facility is 3.9% below the

7b
norm. The SMP Plan experienced a lower than expected incidence of large claim activity thus we would expect facility charges to compare favorably to the norm. Physician charges however were 34.6% above the benchmark for 2006. This was influenced by the SMP Plan’s rich benefit design, contributing not only to higher utilization but higher plan costs due to low member cost sharing. The drug PMPM is in line with the norm, being only 6.1% high. More notably, the other services category is 46.2% above the norm driven mainly by chiropractic, physical therapy and outpatient psychiatric claims.
When looking at the month by month results in exhibit 7-D, the SMP plan was more stable throughout the year. There was less large claim activity and claims tended to stay in a narrow range.
Medicare
The Medicare Plus $1M Plan in Exhibit 7-E averaged a total of $328.51 PMPM in 2006. The medical segment of the paid PMPM cost accounts for only 36.5% of the payments made under the plan due to the impact of coordination of benefits with Medicare. The medical segment of the Medicare plan averaged $33.47 PMPM for inpatient facility, $32.50 PMPM for outpatient facility, $37.32 PMPM for physician, and $16.51 PMPM for other services. All of these segments had nearly flat line results over the calendar year with the exception of physician where the Medicare Part B deductible caused an increase in plan costs in January and February. The other 63.5% of the paid PMPM for the plan is for drugs. Over the calendar year the drug costs had an upward trend. The trend from the first quarter of 2006 to the fourth quarter of 2006 was 29.4%, thus driving the overall trend for this plan.

Exhibit 7-A
Actual Benchmark $ %Facility Inpatient $158.97 $102.77 $56.20 54.7%Facility Outpatient $158.61 $107.53 $51.08 47.5%Physician $181.10 $149.38 $31.72 21.2%Drugs $116.99 $82.51 $34.48 41.8%Other Services $76.09 $32.77 $43.32 132.2%
Totals $691.76 $474.96 $216.80 45.6%
Note: Drugs include prescriptions and injectablesNote: Benchmark data has been age/sex adjusted to correspond to the population included in this exhibit* Each $1.00 paid PMPM = $52,016 in plan costs.
STATE EMPLOYEE TRUST FUNDSTotal PMPM by Type of Service - Standard
Incurred January 2006 - December 2006 Paid Through March 2007
Difference
Actual PMPM
Facility Inpatient23%
Physician26%
Drugs17%
Other Services11%
Facility Outpatient23%
Benchmark PMPM
Facility Inpatient22%
Facility Outpatient23%
Physician31%
Drugs17%
Other Services7%

Exhibit 7-B
JAN FEB MAR APR MAY JUN JUL AUG SEP OCT NOV DEC
Member Months 4,293 4,304 4,294 4,250 4,251 4,297 4,354 4,293 4,361 4,465 4,435 4,419
Facility Inpatient $162.57 $192.80 $214.86 $143.91 $121.29 $180.38 $155.32 $111.08 $148.44 $246.89 $95.66 $133.26Facility Outpatient $145.65 $151.07 $157.50 $153.83 $161.34 $167.73 $133.78 $188.79 $144.27 $197.93 $165.59 $135.22Physician $157.32 $156.49 $203.90 $194.65 $193.40 $216.71 $182.70 $178.16 $166.80 $201.24 $177.26 $145.36Drug $120.26 $105.30 $116.39 $116.38 $125.84 $126.93 $111.26 $121.10 $103.42 $114.97 $119.26 $123.05Other Services $74.64 $63.05 $92.10 $71.14 $78.08 $104.79 $78.93 $75.21 $67.80 $73.11 $71.11 $63.67
Total $660.45 $668.71 $784.75 $679.90 $679.95 $796.54 $662.00 $674.33 $630.72 $834.13 $628.87 $600.56
Note: Drug includes prescription and injectables
INCURRED MONTH
STATE EMPLOYEE TRUST FUNDSPaid PMPM by Type of Service - Standard
Paid Through March 2007
$0
$50
$100
$150
$200
$250
$300
JAN FEB MAR APR MAY JUN JUL AUG SEP OCT NOV DEC
Facility Inpatient Facility Outpatient Physician Drug Other Services

Exhibit 7-C
Actual Benchmark $ %Facility Inpatient $60.79 $75.99 -$15.20 -20.0%Facility Outpatient $80.05 $83.26 -$3.21 -3.9%Physician $156.88 $116.53 $40.35 34.6%Drugs $64.99 $61.23 $3.76 6.1%Other Services $43.50 $29.75 $13.75 46.2%
Totals $406.21 $366.76 $39.45 10.8%
Note: Drugs include prescriptions and injectablesNote: Benchmark data has been age/sex adjusted to correspond to the population included in this exhibit* Each $1.00 paid PMPM = $97,961 in plan costs.
STATE EMPLOYEE TRUST FUNDSTotal PMPM by Type of Service - SMP
Incurred January 2006 - December 2006 Paid Through March 2007
Difference
Actual PMPM
Facility Inpatient15%
Physician38%
Drugs16%
Other Services11%
Facility Outpatient20%
Benchmark PMPM
Facility Inpatient21%
Facility Outpatient23%
Physician31%
Drugs17%
Other Services8%

Exhibit 7-D
JAN FEB MAR APR MAY JUN JUL AUG SEP OCT NOV DEC
Member Months 8,119 8,123 8,127 8,128 8,130 8,134 8,140 8,139 8,243 8,246 8,204 8,228
Facility Inpatient $61.40 $50.60 $61.62 $48.96 $66.90 $63.37 $86.42 $47.77 $51.96 $95.37 $31.93 $63.01Facility Outpatient $83.54 $79.00 $92.55 $93.45 $79.42 $87.04 $73.51 $82.02 $67.54 $75.87 $76.16 $70.85Physician $169.32 $142.59 $161.52 $137.48 $160.68 $168.13 $150.55 $169.79 $138.73 $186.07 $148.65 $149.20Drug $54.68 $57.67 $61.44 $56.08 $62.76 $65.32 $62.79 $70.74 $65.32 $71.83 $71.88 $79.02Other Services $45.58 $36.75 $42.98 $35.41 $44.29 $44.79 $39.83 $53.29 $40.93 $45.80 $46.76 $45.48
Total $414.51 $366.61 $420.11 $371.37 $414.06 $428.66 $413.10 $423.59 $364.48 $474.94 $375.38 $407.56
Note: Drug includes prescription and injectables
INCURRED MONTH
STATE EMPLOYEE TRUST FUNDSPaid PMPM by Type of Service - SMP
Paid Through March 2007
$0
$50
$100
$150
$200
$250
$300
JAN FEB MAR APR MAY JUN JUL AUG SEP OCT NOV DEC
Facility Inpatient Facility Outpatient Physician Drug Other Services

Exhibit 7-E
JAN FEB MAR APR MAY JUN JUL AUG SEP OCT NOV DEC
Member Months 10,235 10,201 10,167 10,151 10,099 10,059 10,035 10,024 10,013 9,988 9,984 9,961
Facility Inpatient $36.07 $33.44 $36.56 $32.87 $35.17 $34.84 $30.87 $34.43 $33.20 $31.31 $30.46 $32.33Facility Outpatient $34.69 $31.31 $32.89 $31.05 $34.61 $34.14 $29.66 $34.27 $31.46 $34.75 $32.01 $29.08Physician $61.74 $41.69 $39.43 $35.36 $38.82 $35.16 $30.08 $33.43 $31.85 $34.42 $35.02 $30.12Drug $177.64 $176.30 $193.82 $185.48 $207.15 $206.50 $208.38 $226.37 $216.21 $229.97 $234.58 $244.36Other Services $22.75 $16.73 $17.95 $15.61 $18.29 $16.29 $13.65 $15.18 $14.84 $16.78 $16.80 $13.08
Total $332.89 $299.48 $320.63 $300.37 $334.03 $326.92 $312.65 $343.67 $327.55 $347.22 $348.87 $348.97
Note: Drug includes prescription and injectables
INCURRED MONTH
STATE EMPLOYEE TRUST FUNDSPaid PMPM by Type of Service - Medicare Plus One Million
Paid Through March 2007
$0
$50
$100
$150
$200
$250
$300
JAN FEB MAR APR MAY JUN JUL AUG SEP OCT NOV DEC
Facility Inpatient Facility Outpatient Physician Drug Other Services


8a
State Employee Trust Funds Plan Utilization
Type of Service Detail The Type of Service Detail report provides an overview of paid medical costs on a PMPM basis divided into 5 major service categories and further divided into 26 subcategories. The Actual PMPM costs are compared to the benchmark PMPM to help determine where the plan is experiencing higher than normal claim costs. The comparison to the benchmark is displayed as a PMPM difference and as a percentage difference. The Actual PMPM costs are for claims incurred January 2006 – December 2006 and paid through the end of March 2007.
Standard Plan
The Standard Plan in Exhibit 8-A was 45.6% above the benchmark in 2006. The variance to the benchmark is primarily a result of the anti-selection resulting from the dual choice open enrollment. Other contributing factors include the location of the Standard Plan’s enrolled membership (the higher cost urban areas) and the rich benefit design. Since the percentage comparison can be deceiving, it is more important to look at the PMPM difference with $1.00 PMPM being equivalent to $52,016 in annual plan costs. Below are some areas that stand out relative to the benchmark and some analysis on what is driving the higher costs:
• Facility Inpatient – The majority of dollars are for surgical/medical services. Within surgical/medical, $15.06 PMPM is due to a single large claimant. Another $9.75 PMPM is due to gastric bypass procedures not included in the norm. Another contributor to the overage is higher than expected large claim activity. For those claimants over $100,000, 52% of their claims fall into the inpatient facility category and drive a higher than expected PMPM.
• Facility Outpatient – Higher than expected costs in this category are reflective of the relative morbidity of the Standard Plan’s population. Greater use of diagnostic services such as CT scans, MRIs and lab work has lead to cost variances versus the norm for outpatient radiology and pathology services. Costs for other outpatient facility services such as chemotherapy and physical therapy are also very high.
• Physician – The surgery category is $11.90 PMPM above the benchmark. Gastric bypass procedures have added $4.51 to the Paid PMPM cost. Costs for these procedures are not accounted for in the benchmark.

8b
• Drug – The prescription drug costs are higher than the benchmark, however they are in line with the plan’s performance overall. Injectable drug cost is only slightly above the norm. However it is a category warranting special attention into the future. Specialty drugs can have exceptionally high mark-ups when provided in a physician’s office. Certain drugs are often less costly to the plan if provided through the PBM. Select drugs can be self-injected by the patient in their own home, which is often viewed positively by the member. Taking a proactive approach, contract/benefit language should be reviewed so specialty drugs can be most effectively managed in the future.
• Other services – The other services category is $43.32 above the benchmark. The major contributor to the variance is the Psychiatric /AODA cost which is $25.41 PMPM above the benchmark. The Standard Plan’s benefit design in this sub-category is more comprehensive than the typical commercial plan, which is often limited to the Wisconsin state mandate.
SMP Plan
The SMP Plan in Exhibit 8-B by comparison is 10.8% above the benchmark for 2006. A majority of this can be attributed to the rich benefit design that is not accounted for in the benchmark numbers. For the plan $1.00 PMPM represented in the chart is equivalent to $97,961 in annual plan costs.
• Inpatient/Outpatient Facility – Overall both of these categories are running at or below the norm which is a function of the better risks enrolled in the SMP Plan.
• Physician – The Office Visit, Radiology, Pathology, and Surgery sub-categories are all running well above the norm. It appears these services are mostly subject to higher than expected utilization due to the rich benefits. Claim costs for these services correlate with each other. If the plan is having higher office visit utilization, it would be expected to have higher usage of office diagnostic testing, with the potential for more surgical procedures.
• Drug – The prescription drug PMPM cost is running 7.7% above the norm and the injectable drug costs are running 4.2% below norm. Overall the drug cost is in line with the plan performance for 2006.
• Other Services – The Chiropractic sub-category is $4.33 above the norm which is a function of the region in which the SMP population resides. In the north central region, chiropractic care is more commonly used to treat back problems in comparison to other areas of the state. The other sub-category is $7.18 PMPM above the norm and appears to be driven by higher than expected costs for immunizations, physical exams and vision exams.
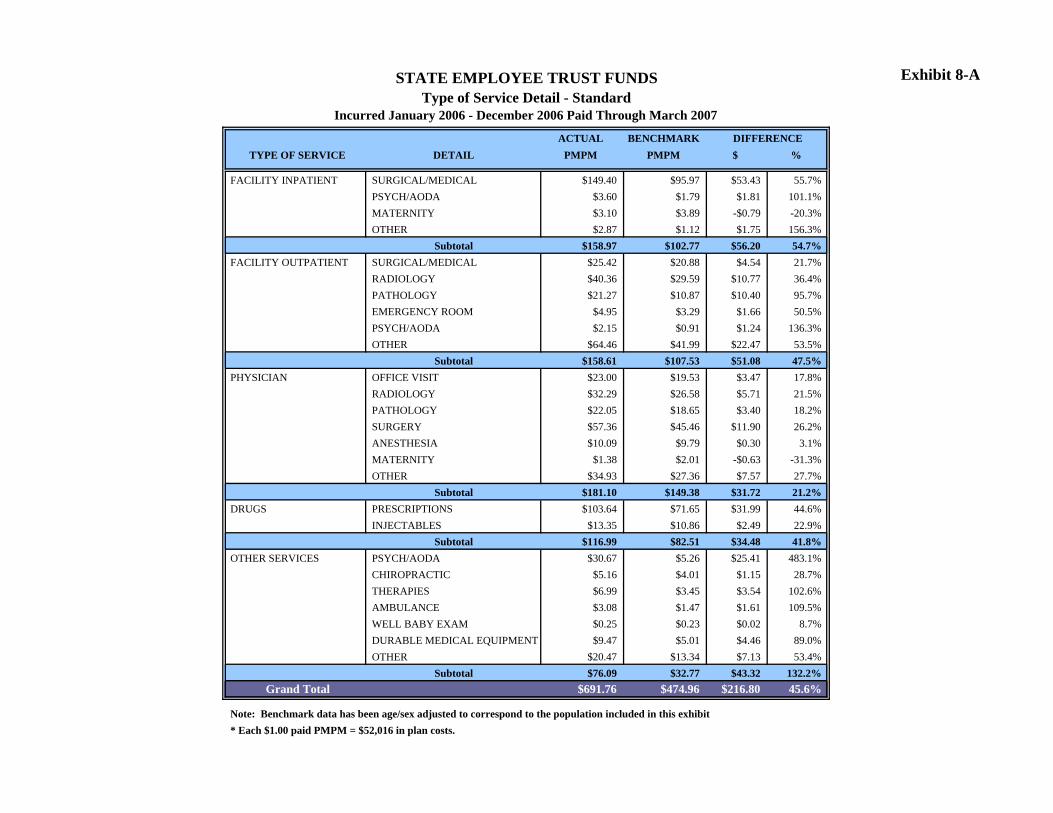
Exhibit 8-A
ACTUAL BENCHMARKTYPE OF SERVICE DETAIL PMPM PMPM $ %
FACILITY INPATIENT SURGICAL/MEDICAL $149.40 $95.97 $53.43 55.7%PSYCH/AODA $3.60 $1.79 $1.81 101.1%MATERNITY $3.10 $3.89 -$0.79 -20.3%OTHER $2.87 $1.12 $1.75 156.3%
Subtotal $158.97 $102.77 $56.20 54.7%FACILITY OUTPATIENT SURGICAL/MEDICAL $25.42 $20.88 $4.54 21.7%
RADIOLOGY $40.36 $29.59 $10.77 36.4%PATHOLOGY $21.27 $10.87 $10.40 95.7%EMERGENCY ROOM $4.95 $3.29 $1.66 50.5%PSYCH/AODA $2.15 $0.91 $1.24 136.3%OTHER $64.46 $41.99 $22.47 53.5%
Subtotal $158.61 $107.53 $51.08 47.5%PHYSICIAN OFFICE VISIT $23.00 $19.53 $3.47 17.8%
RADIOLOGY $32.29 $26.58 $5.71 21.5%PATHOLOGY $22.05 $18.65 $3.40 18.2%SURGERY $57.36 $45.46 $11.90 26.2%ANESTHESIA $10.09 $9.79 $0.30 3.1%MATERNITY $1.38 $2.01 -$0.63 -31.3%OTHER $34.93 $27.36 $7.57 27.7%
Subtotal $181.10 $149.38 $31.72 21.2%DRUGS PRESCRIPTIONS $103.64 $71.65 $31.99 44.6%
INJECTABLES $13.35 $10.86 $2.49 22.9%Subtotal $116.99 $82.51 $34.48 41.8%
OTHER SERVICES PSYCH/AODA $30.67 $5.26 $25.41 483.1%CHIROPRACTIC $5.16 $4.01 $1.15 28.7%THERAPIES $6.99 $3.45 $3.54 102.6%AMBULANCE $3.08 $1.47 $1.61 109.5%WELL BABY EXAM $0.25 $0.23 $0.02 8.7%DURABLE MEDICAL EQUIPMENT $9.47 $5.01 $4.46 89.0%OTHER $20.47 $13.34 $7.13 53.4%
Subtotal $76.09 $32.77 $43.32 132.2%Grand Total $691.76 $474.96 $216.80 45.6%
Note: Benchmark data has been age/sex adjusted to correspond to the population included in this exhibit* Each $1.00 paid PMPM = $52,016 in plan costs.
STATE EMPLOYEE TRUST FUNDSType of Service Detail - Standard
Incurred January 2006 - December 2006 Paid Through March 2007
DIFFERENCE

Exhibit 8-B
ACTUAL BENCHMARKTYPE OF SERVICE DETAIL PMPM PMPM $ %
FACILITY INPATIENT SURGICAL/MEDICAL $53.15 $69.04 -$15.89 -23.0%PSYCH/AODA $1.09 $1.85 -$0.76 -41.1%MATERNITY $6.35 $4.37 $1.98 45.3%OTHER $0.20 $0.73 -$0.53 -72.6%
Subtotal $60.79 $75.99 -$15.20 -20.0%FACILITY OUTPATIENT SURGICAL/MEDICAL $13.76 $16.38 -$2.62 -16.0%
RADIOLOGY $25.15 $22.30 $2.85 12.8%PATHOLOGY $6.49 $8.19 -$1.70 -20.8%EMERGENCY ROOM $2.31 $2.96 -$0.65 -22.0%PSYCH/AODA $0.23 $1.00 -$0.77 -77.0%OTHER $32.11 $32.43 -$0.32 -1.0%
Subtotal $80.05 $83.26 -$3.21 -3.9%PHYSICIAN OFFICE VISIT $22.74 $15.81 $6.93 43.8%
RADIOLOGY $25.92 $19.89 $6.03 30.3%PATHOLOGY $23.60 $14.82 $8.78 59.2%SURGERY $46.65 $34.86 $11.79 33.8%ANESTHESIA $8.06 $7.61 $0.45 5.9%MATERNITY $3.35 $2.25 $1.10 48.9%OTHER $26.56 $21.29 $5.27 24.8%
Subtotal $156.88 $116.53 $40.35 34.6%DRUGS PRESCRIPTIONS $57.27 $53.17 $4.10 7.7%
INJECTABLES $7.72 $8.06 -$0.34 -4.2%Subtotal $64.99 $61.23 $3.76 6.1%
OTHER SERVICES PSYCH/AODA $6.79 $5.78 $1.01 17.5%CHIROPRACTIC $7.95 $3.62 $4.33 119.6%THERAPIES $4.21 $2.88 $1.33 46.2%AMBULANCE $1.18 $1.14 $0.04 3.5%WELL BABY EXAM $0.57 $0.51 $0.06 11.8%DURABLE MEDICAL EQUIPMENT $3.68 $3.88 -$0.20 -5.2%OTHER $19.12 $11.94 $7.18 60.1%
Subtotal $43.50 $29.75 $13.75 46.2%Grand Total $406.21 $366.76 $39.45 10.8%
Note: Benchmark data has been age/sex adjusted to correspond to the population included in this exhibit* Each $1.00 paid PMPM = $97,961 in plan costs.
STATE EMPLOYEE TRUST FUNDSType of Service Detail - SMP
Incurred January 2006 - December 2006 Paid Through March 2007
DIFFERENCE

9a
State Employee Trust Funds Plan Utilization
Inpatient Utilization, Days/1000 and Average Length of Stay The Inpatient Utilization report compares annual inpatient days per 1,000, admits per 1,000, average length of stay, cost per day, cost per admit, and inpatient PMPM cost to the benchmark for the 5 major inpatient service categories. Days/1000 is the annual average number of hospital days utilized by a population of 1,000 members which is calculated by taking (Total Days/Member Months)*12000. The Admits/1000 is the annual number of admits that occur within a typical population of 1,000 members which is calculated by taking (Total Admits/Member Months)*12000. The Days/1000 and Admits/1000 are calculations that allow a comparison of one population to another regardless of group size. Average Length of Stay (ALOS) shows the average length of hospitalization experienced for the entire group (Total Days/Total Admits). Cost per Day is an average of the cost per hospital day (Total Cost/Total Days). The cost per admit is an average of the cost per hospital admission (Total Cost/Total Admits). Lastly the inpatient PMPM is the per member per month cost incurred by the plan. Beyond the numerical comparison, a percentage has been included as observed in the pie charts, including a comparison to the benchmark.
Standard Plan
The totals for the Standard Plan in Exhibit 9-A exceed the benchmark totals for all statistics. The Medical category well exceeds the benchmark in Cost/Day, Cost/Admit, and PMPM Cost. This difference can be explained by the claims of 1 large claimant. Without the claims from this one individual the Cost/Day, Cost/Admit, and PMPM Cost would all be in line with the benchmark. The Surgical category exceeds the benchmark in Days/1000, Admits/1000, and PMPM Cost while the cost per unit components appear to be in line with the benchmark. Contributing factors to the variance include gastric bypass procedures that are not accounted for in the benchmark as well as higher than expected large claim activity. For claimants with annual claims over $100,000, 52% of their claims fall into the inpatient hospital category.
The Standard Plan had an average of 460 days per 1000 members over the course of 2006. Although the monthly results shown in Exhibit 9-C are very volatile, the plan was generally above the demographically adjusted benchmark average of 375 days per 1000 members. The inpatient days per 1000 are highly correlated with large claim activity. Since the large claim activity was higher than expected, we’d also expect the days per 1000 to be higher than our benchmark.

9b
The Monthly Average Length of Stay for the Standard Plan is shown in Exhibit 9-D. For the year the average was 5.07 days compared to a benchmark of 4.52.
SMP
The SMP Plan in Exhibit 9-B is below the benchmark in total for most inpatient utilization statistics. This correlates with the lower than expected large claim activity which is typically the major contributor to inpatient hospital costs. The only category that appears to stand out for the SMP Plan is Maternity. The SMP Plan had slightly higher utilization of Maternity services than expected and slightly higher costs associated with these services. The cost variance is influenced by a higher incidence rate of cesarean deliveries in the SMP Plan when compared to the benchmark.
The SMP Plan had an average of 214 days per 1000 members over the course of 2006. The SMP Plan performed much better than our benchmark of 292 days per 1000 overall and only exceeded the benchmark in the month of July. Exhibit 9-C shows the monthly variations in inpatient days / 1000.
The Monthly Average Length of Stay for the SMP Plan is shown in Exhibit 9-D. For the year the average was 3.22 days, which is below the benchmark of 4.00.
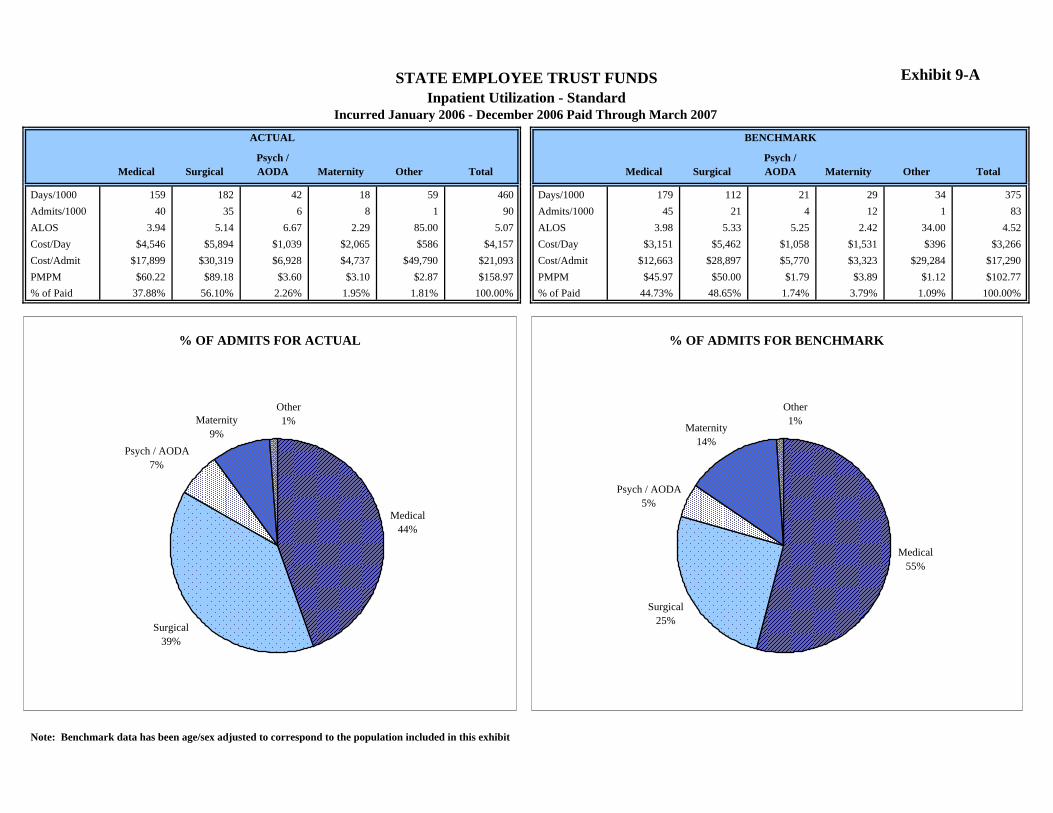
Exhibit 9-A
Medical SurgicalPsych / AODA Maternity Other Total Medical Surgical
Psych / AODA Maternity Other Total
Days/1000 159 182 42 18 59 460 Days/1000 179 112 21 29 34 375Admits/1000 40 35 6 8 1 90 Admits/1000 45 21 4 12 1 83ALOS 3.94 5.14 6.67 2.29 85.00 5.07 ALOS 3.98 5.33 5.25 2.42 34.00 4.52Cost/Day $4,546 $5,894 $1,039 $2,065 $586 $4,157 Cost/Day $3,151 $5,462 $1,058 $1,531 $396 $3,266Cost/Admit $17,899 $30,319 $6,928 $4,737 $49,790 $21,093 Cost/Admit $12,663 $28,897 $5,770 $3,323 $29,284 $17,290PMPM $60.22 $89.18 $3.60 $3.10 $2.87 $158.97 PMPM $45.97 $50.00 $1.79 $3.89 $1.12 $102.77% of Paid 37.88% 56.10% 2.26% 1.95% 1.81% 100.00% % of Paid 44.73% 48.65% 1.74% 3.79% 1.09% 100.00%
Note: Benchmark data has been age/sex adjusted to correspond to the population included in this exhibit
BENCHMARK
STATE EMPLOYEE TRUST FUNDSInpatient Utilization - Standard
Incurred January 2006 - December 2006 Paid Through March 2007
ACTUAL
% OF ADMITS FOR BENCHMARK
Medical55%
Psych / AODA5%
Maternity14%
Other1%
Surgical25%
% OF ADMITS FOR ACTUAL
Surgical39%
Other1%Maternity
9%Psych / AODA
7%
Medical44%

Exhibit 9-B
Medical SurgicalPsych / AODA Maternity Other Total Medical Surgical
Psych / AODA Maternity Other Total
Days/1000 80 72 10 47 5 214 Days/1000 132 83 22 33 22 292Admits/1000 23 22 3 18 0 66 Admits/1000 37 18 4 14 0 73ALOS 3.49 3.28 3.19 2.59 13.33 3.22 ALOS 3.57 4.61 5.50 2.36 62.86 4.00Cost/Day $2,800 $5,721 $1,290 $1,637 $486 $3,411 Cost/Day $3,050 $5,287 $1,058 $1,531 $396 $3,086Cost/Admit $9,762 $18,782 $4,119 $4,232 $6,481 $10,967 Cost/Admit $10,975 $25,046 $5,805 $3,598 $25,722 $12,720PMPM $18.63 $34.51 $1.09 $6.35 $0.20 $60.78 PMPM $33.07 $35.97 $1.85 $4.37 $0.73 $75.99% of Paid 30.65% 56.78% 1.79% 10.45% 0.33% 100.00% % of Paid 43.52% 47.33% 2.43% 5.75% 0.96% 100.00%
Note: Benchmark data has been age/sex adjusted to correspond to the population included in this exhibit
BENCHMARK
STATE EMPLOYEE TRUST FUNDSInpatient Utilization - SMP
Incurred January 2006 - December 2006 Paid Through March 2007
ACTUAL
% OF ADMITS FOR BENCHMARK
Medical51%
Psych / AODA5%
Maternity19%
Other0%
Surgical25%
% OF ADMITS FOR ACTUAL
Surgical33%
Other0%
Maternity27%
Psych / AODA5%
Medical35%
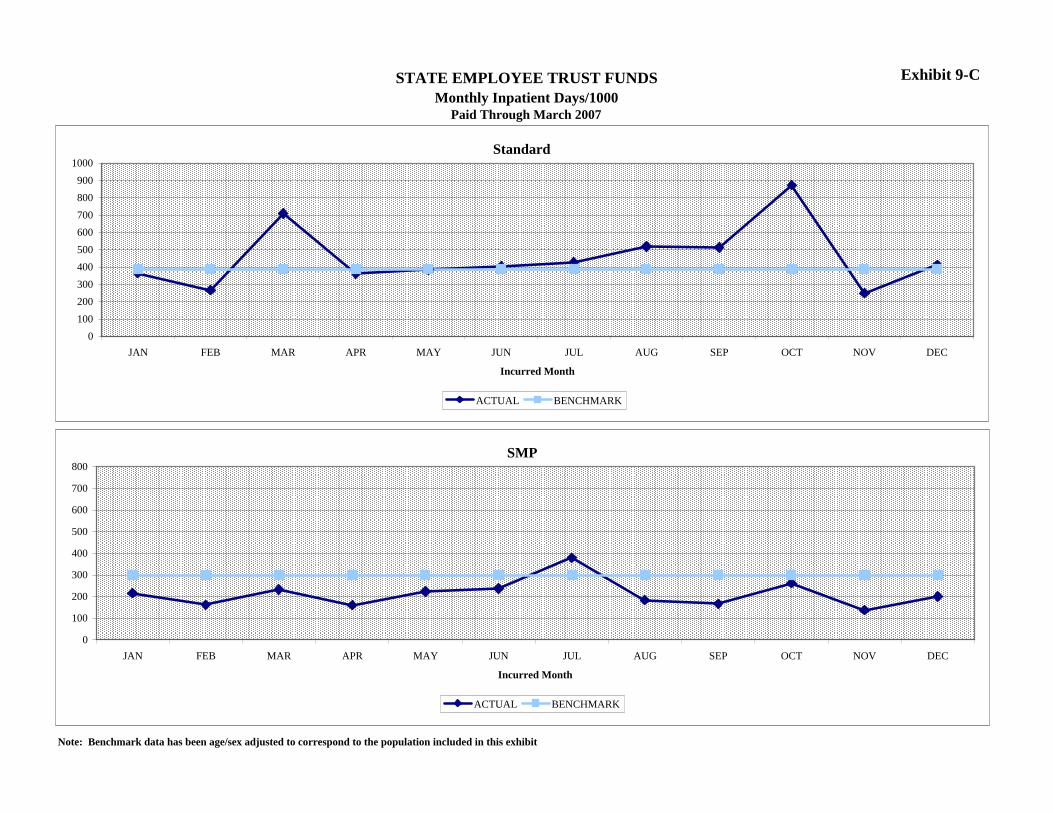
Exhibit 9-C
Note: Benchmark data has been age/sex adjusted to correspond to the population included in this exhibit
STATE EMPLOYEE TRUST FUNDSMonthly Inpatient Days/1000
Paid Through March 2007
Standard
0100200300400500600700800900
1000
JAN FEB MAR APR MAY JUN JUL AUG SEP OCT NOV DEC
Incurred Month
ACTUAL BENCHMARK
SMP
0
100
200
300
400
500
600
700
800
JAN FEB MAR APR MAY JUN JUL AUG SEP OCT NOV DEC
Incurred Month
ACTUAL BENCHMARK

Exhibit 9-D
Note: Benchmark data has been age/sex adjusted to correspond to the population included in this exhibit
STATE EMPLOYEE TRUST FUNDSMonthly Inpatient Average Length of Stay
Paid Through March 2007
Standard
0
1
2
3
4
5
6
7
8
JAN FEB MAR APR MAY JUN JUL AUG SEP OCT NOV DEC
Incurred Month
ACTUAL BENCHMARK
SMP
0
1
2
3
4
5
6
7
8
JAN FEB MAR APR MAY JUN JUL AUG SEP OCT NOV DEC
Incurred Month
ACTUAL BENCHMARK

10
State Employee Trust Funds Plan Utilization
Claim Costs by Major Diagnostic Categories (MDC) The Claim Costs by Major Diagnostic Categories report divides medical claim costs into 25 mutually exclusive diagnostic categories. The diagnoses in each MDC correspond to a single organ system and, in general, are associated with a particular medical specialty. The actual PMPM costs by major diagnostic category are compared to the WPS benchmark PMPM. The following exhibits display numerical and graphical comparisons to the benchmark data. The Actual PMPM costs are for claims incurred January 2006 – December 2006 and paid through the end of March 2007.
Prior exhibits have shown the Standard Plan’s costs exceed the benchmark overall. Exhibits 10-A and 10-B show this deviation by MDC. Variation from the benchmark can be the result of many different factors. Since the benchmark is not adjusted for plan differences we can attribute some variation to non-standard benefits included in the Standard Plan. An example of this is gastric bypass procedures which contributed $14.98 PMPM to MDC 10. Without this non-standard benefit, MDC 10 would actually be below the benchmark. Another instance of non-standard benefit variance is MDC 19 where the outpatient psychiatric benefit is adding over $16.00 PMPM of additional costs. Another reason for variances from the norm can be unusual large claim activity. This is what happened for MDC 6 where one member contributed $15.57 PMPM. The largest variance is in MDC 8 which appears to be driven by back problems and not large claims. Lastly another large variance was seen in MDC 23 which is mostly diagnostics. MDC 23 is generally proportional to benefit utilization in total. For the Standard Plan $1.00 PMPM in claim costs represented in the chart is equivalent to $52,016 annual in plan costs.
The SMP Plan, shown in Exhibits 10-C and 10-D, is experiencing slightly higher than expected PMPM Cost overall. For SMP, the variances to the norm are less severe than the Standard Plan. The largest variation again is for MDC 8 for which the largest contributor is medical back problems (DRG 243) representing around 28% of the paid claims. The second largest is MDC 23 which is primarily diagnostics and includes cancer screenings, general examinations, and specialty examinations. With the higher than normal utilization of the physician services it is not unusual for diagnostic services to also be higher. For the SMP Plan $1.00 PMPM in claim cost represented in the charts is equivalent to $97,961 in annual plan costs.

Exhibit 10-A
MDC MAJOR DIAGNOSTIC CATEGORY ACTUAL BENCHMARKCODE DESCRIPTION PMPM PMPM $ %
1 DISEASES AND DISORDERS OF THE NERVOUS SYSTEM $43.60 $19.39 $24.21 124.9%2 DISEASES AND DISORDERS OF THE EYE $12.63 $11.12 $1.51 13.6%3 DISEASES AND DISORDERS OF THE EAR, NOSE, MOUTH AND THROAT $21.83 $16.86 $4.97 29.5%4 DISEASES AND DISORDERS OF THE RESPIRATORY SYSTEM $22.43 $19.32 $3.11 16.1%5 DISEASES AND DISORDERS OF THE CIRCULATORY SYSTEM $61.36 $56.79 $4.57 8.0%6 DISEASES AND DISORDERS OF THE DIGESTIVE SYSTEM $65.00 $42.07 $22.93 54.5%7 DISEASES AND DISORDERS OF THE HEPATOBILIARY SYSTEM AND PANCREAS $11.03 $10.46 $0.57 5.4%8 DISEASES AND DISORDERS OF THE MUSCULOSKELETAL SYSTEM AND CONNECTIVE TISSUE $107.33 $71.53 $35.80 50.0%9 DISEASES AND DISORDERS OF THE SKIN, SUBCUTANEOUS TISSUE AND BREAST $29.91 $21.36 $8.55 40.0%
10 ENDOCRINE, NUTRITIONAL AND METABOLIC DISEASES AND DISORDERS $29.04 $14.41 $14.63 101.5%11 DISEASES AND DISORDERS OF THE KIDNEY AND URINARY TRACT $20.72 $12.88 $7.84 60.9%12 DISEASES AND DISORDERS OF THE MALE REPRODUCTIVE SYSTEM $4.15 $4.77 -$0.62 -13.0%13 DISEASES AND DISORDERS OF THE FEMALE REPRODUCTIVE SYSTEM $13.99 $13.36 $0.63 4.7%14 PREGNANCY, CHILDBIRTH AND THE PUERPERIUM $5.32 $6.61 -$1.29 -19.5%15 NEWBORNS AND OTHER NEONATES WITH CONDITIONS ORIGINATING IN PERINATAL PERIOD $1.39 $3.12 -$1.73 -55.4%16 DISEASES AND DISORDERS OF THE BLOOD AND BLOOD FORMING ORGANS AND IMMUNOLOGICAL $8.95 $5.74 $3.21 55.9%17 MYELOPROLIFERATIVE DISEASES AND DISORDERS, AND POORLY DIFFERENTIATED NEOPLASMS $17.63 $12.70 $4.93 38.8%18 INFECTIOUS AND PARASITIC DISEASES $11.50 $4.75 $6.75 142.1%19 MENTAL DISEASES AND DISORDERS $37.31 $8.96 $28.35 316.4%20 ALCOHOL/DRUG USE AND ALCOHOL/DRUG INDUCED ORGANIC MENTAL DISORDERS $1.10 $1.10 $0.00 0.0%21 INJURIES, POISONINGS AND TOXIC EFFECTS OF DRUGS $5.08 $3.62 $1.46 40.3%22 BURNS $0.03 $0.15 -$0.12 -80.0%23 FACTORS INFLUENCING HEALTH STATUS AND OTHER CONTACTS WITH HEALTH SERVICES $55.87 $36.38 $19.49 53.6%24 MULTIPLE SIGNIFICANT TRAUMA $0.00 $0.44 -$0.44 -100.0%25 HUMAN IMMUNODEFICIENCY VIRUS INFECTIONS $0.12 $0.05 $0.07 140.0%
0 UNGROUPABLE $0.74 $1.51 -$0.77 -51.0%Total $588.06 $399.45 $188.61 47.2%
Note: Benchmark data has been age/sex adjusted to correspond to the population included in this exhibit* Each $1.00 paid PMPM = $52,016 in plan costs.
DIFFERENCE
STATE EMPLOYEE TRUST FUNDSClaim Costs by Major Diagnostic Categories - Standard
Incurred January 2006 - December 2006 Paid Through March 2007

Exhibit 10-BSTATE EMPLOYEE TRUST FUNDSClaim Costs by Major Diagnostic Categories - Standard
Incurred January 2006 - December 2006 Paid Through March 2007
$0 $50 $100 $150 $200 $250
UNGROUPABLE (0)
HUMAN IMMUNODEFICIENCY VIRUS INFECTIONS (25)
MULTIPLE SIGNIFICANT TRAUMA (24)
FACTORS INFLUENCING HEALTH STATUS AND OTHER CONTACTS WITH HEALTH SERVICES (23)
BURNS (22)
INJURIES, POISONINGS AND TOXIC EFFECTS OF DRUGS (21)
ALCOHOL/DRUG USE AND ALCOHOL/DRUG INDUCED ORGANIC MENTAL DISORDERS (20)
MENTAL DISEASES AND DISORDERS (19)
INFECTIOUS AND PARASITIC DISEASES (18)
MYELOPROLIFERATIVE DISEASES AND DISORDERS, AND POORLY DIFFERENTIATED NEOPLASMS (17)
DISEASES AND DISORDERS OF THE BLOOD AND BLOOD FORMING ORGANS AND IMMUNOLOGICAL (16)
NEWBORNS AND OTHER NEONATES WITH CONDITIONS ORIGINATING IN PERINATAL PERIOD (15)
PREGNANCY, CHILDBIRTH AND THE PUERPERIUM (14)
DISEASES AND DISORDERS OF THE FEMALE REPRODUCTIVE SYSTEM (13)
DISEASES AND DISORDERS OF THE MALE REPRODUCTIVE SYSTEM (12)
DISEASES AND DISORDERS OF THE KIDNEY AND URINARY TRACT (11)
ENDOCRINE, NUTRITIONAL AND METABOLIC DISEASES AND DISORDERS (10)
DISEASES AND DISORDERS OF THE SKIN, SUBCUTANEOUS TISSUE AND BREAST (9)
DISEASES AND DISORDERS OF THE MUSCULOSKELETAL SYSTEM AND CONNECTIVE TISSUE (8)
DISEASES AND DISORDERS OF THE HEPATOBILIARY SYSTEM AND PANCREAS (7)
DISEASES AND DISORDERS OF THE DIGESTIVE SYSTEM (6)
DISEASES AND DISORDERS OF THE CIRCULATORY SYSTEM (5)
DISEASES AND DISORDERS OF THE RESPIRATORY SYSTEM (4)
DISEASES AND DISORDERS OF THE EAR, NOSE, MOUTH AND THROAT (3)
DISEASES AND DISORDERS OF THE EYE (2)
DISEASES AND DISORDERS OF THE NERVOUS SYSTEM (1)
Actual Benchmark

Exhibit 10-C
MDC MAJOR DIAGNOSTIC CATEGORY ACTUAL BENCHMARK
CODE DESCRIPTION PMPM PMPM $ %
1 DISEASES AND DISORDERS OF THE NERVOUS SYSTEM $13.59 $17.15 -$3.56 -20.8%2 DISEASES AND DISORDERS OF THE EYE $12.47 $7.50 $4.97 66.3%3 DISEASES AND DISORDERS OF THE EAR, NOSE, MOUTH AND THROAT $18.63 $16.91 $1.72 10.2%4 DISEASES AND DISORDERS OF THE RESPIRATORY SYSTEM $8.90 $14.11 -$5.21 -36.9%5 DISEASES AND DISORDERS OF THE CIRCULATORY SYSTEM $32.76 $39.25 -$6.49 -16.5%6 DISEASES AND DISORDERS OF THE DIGESTIVE SYSTEM $34.19 $32.99 $1.20 3.6%7 DISEASES AND DISORDERS OF THE HEPATOBILIARY SYSTEM AND PANCREAS $6.37 $7.88 -$1.51 -19.2%8 DISEASES AND DISORDERS OF THE MUSCULOSKELETAL SYSTEM AND CONNECTIVE TISSUE $71.66 $56.94 $14.72 25.9%9 DISEASES AND DISORDERS OF THE SKIN, SUBCUTANEOUS TISSUE AND BREAST $22.38 $17.12 $5.26 30.7%
10 ENDOCRINE, NUTRITIONAL AND METABOLIC DISEASES AND DISORDERS $11.31 $10.77 $0.54 5.0%11 DISEASES AND DISORDERS OF THE KIDNEY AND URINARY TRACT $11.02 $10.28 $0.74 7.2%12 DISEASES AND DISORDERS OF THE MALE REPRODUCTIVE SYSTEM $4.28 $3.66 $0.62 16.9%13 DISEASES AND DISORDERS OF THE FEMALE REPRODUCTIVE SYSTEM $18.70 $12.07 $6.63 54.9%14 PREGNANCY, CHILDBIRTH AND THE PUERPERIUM $10.84 $7.93 $2.91 36.7%15 NEWBORNS AND OTHER NEONATES WITH CONDITIONS ORIGINATING IN PERINATAL PERIOD $7.35 $4.67 $2.68 57.4%16 DISEASES AND DISORDERS OF THE BLOOD AND BLOOD FORMING ORGANS AND IMMUNOLOGICAL $2.95 $4.14 -$1.19 -28.7%17 MYELOPROLIFERATIVE DISEASES AND DISORDERS, AND POORLY DIFFERENTIATED NEOPLASMS $8.62 $8.58 $0.04 0.5%18 INFECTIOUS AND PARASITIC DISEASES $2.45 $3.34 -$0.89 -26.6%19 MENTAL DISEASES AND DISORDERS $9.14 $9.45 -$0.31 -3.3%20 ALCOHOL/DRUG USE AND ALCOHOL/DRUG INDUCED ORGANIC MENTAL DISORDERS $0.87 $1.17 -$0.30 -25.6%21 INJURIES, POISONINGS AND TOXIC EFFECTS OF DRUGS $2.25 $3.27 -$1.02 -31.2%22 BURNS $0.36 $0.17 $0.19 111.8%23 FACTORS INFLUENCING HEALTH STATUS AND OTHER CONTACTS WITH HEALTH SERVICES $37.08 $29.32 $7.76 26.5%24 MULTIPLE SIGNIFICANT TRAUMA $0.00 $0.60 -$0.60 -100.0%25 HUMAN IMMUNODEFICIENCY VIRUS INFECTIONS $0.21 $0.07 $0.14 200.0%
0 UNGROUPABLE $0.58 $1.11 -$0.53 -47.7%Total $348.96 $320.45 $28.51 8.9%
Note: Benchmark data has been age/sex adjusted to correspond to the population included in this exhibit* Each $1.00 paid PMPM = $97,961 in plan costs.
STATE EMPLOYEE TRUST FUNDSClaim Costs by Major Diagnostic Categories - SMP
Incurred January 2006 - December 2006 Paid Through March 2007
DIFFERENCE

Exhibit 10-DSTATE EMPLOYEE TRUST FUNDSClaim Costs by Major Diagnostic Categories - SMP
Incurred January 2006 - December 2006 Paid Through March 2007
$0 $50 $100 $150 $200 $250
UNGROUPABLE (0)
HUMAN IMMUNODEFICIENCY VIRUS INFECTIONS (25)
MULTIPLE SIGNIFICANT TRAUMA (24)
FACTORS INFLUENCING HEALTH STATUS AND OTHER CONTACTS WITH HEALTH SERVICES (23)
BURNS (22)
INJURIES, POISONINGS AND TOXIC EFFECTS OF DRUGS (21)
ALCOHOL/DRUG USE AND ALCOHOL/DRUG INDUCED ORGANIC MENTAL DISORDERS (20)
MENTAL DISEASES AND DISORDERS (19)
INFECTIOUS AND PARASITIC DISEASES (18)
MYELOPROLIFERATIVE DISEASES AND DISORDERS, AND POORLY DIFFERENTIATED NEOPLASMS (17)
DISEASES AND DISORDERS OF THE BLOOD AND BLOOD FORMING ORGANS AND IMMUNOLOGICAL (16)
NEWBORNS AND OTHER NEONATES WITH CONDITIONS ORIGINATING IN PERINATAL PERIOD (15)
PREGNANCY, CHILDBIRTH AND THE PUERPERIUM (14)
DISEASES AND DISORDERS OF THE FEMALE REPRODUCTIVE SYSTEM (13)
DISEASES AND DISORDERS OF THE MALE REPRODUCTIVE SYSTEM (12)
DISEASES AND DISORDERS OF THE KIDNEY AND URINARY TRACT (11)
ENDOCRINE, NUTRITIONAL AND METABOLIC DISEASES AND DISORDERS (10)
DISEASES AND DISORDERS OF THE SKIN, SUBCUTANEOUS TISSUE AND BREAST (9)
DISEASES AND DISORDERS OF THE MUSCULOSKELETAL SYSTEM AND CONNECTIVE TISSUE (8)
DISEASES AND DISORDERS OF THE HEPATOBILIARY SYSTEM AND PANCREAS (7)
DISEASES AND DISORDERS OF THE DIGESTIVE SYSTEM (6)
DISEASES AND DISORDERS OF THE CIRCULATORY SYSTEM (5)
DISEASES AND DISORDERS OF THE RESPIRATORY SYSTEM (4)
DISEASES AND DISORDERS OF THE EAR, NOSE, MOUTH AND THROAT (3)
DISEASES AND DISORDERS OF THE EYE (2)
DISEASES AND DISORDERS OF THE NERVOUS SYSTEM (1)
Actual Benchmark


11a
State Employee Trust Funds Provider Utilization
Top 20 Provider Reports The Top 20 Provider reports display the top 20 Facility and Professional Providers sorted by total paid charges. Within the facility report, charges have also been broken out by Inpatient and Outpatient paid charges for additional analysis. The Paid % shows the percentage of the group’s total facility or professional charges from a specific provider.
Facility
The report for the Standard Plan in Exhibit 11-A shows that the top 20 facilities provide 62% of the total facility charges for the plan. By far, the largest percent of claims and number of patients came from the University of Wisconsin hospital. Second was Fairview University in Minneapolis, only because there was a claim approaching $1 million at this facility. There were actually only a small number of members treated there. As expected, a majority of the top 20 facility providers are located in the Dane and Milwaukee County areas where a majority of the Standard Plan population resides. Since the Standard Plan is available nationwide, however, we do see providers from various regions and states. The report for the SMP Plan in Exhibit 11-B shows that the top 20 facilities provide 93% of the total facility charges for the plan. The largest percentage of paid claims is from St. Michaels Hospital in Steven Point, followed closely by St. Josephs in Marshfield and Aspirus in Wausau. Due to the HMO type coverage and limited plan area of the SMP Plan we would expect to see a majority of services received at a relatively small number of hospitals within the SMP region. You will notice services were received at St. Mary’s Medical Center in Duluth (part of the SMP network in 2006) and Thomas Jefferson Hospital in Philadelphia (emergency care).
Professional
The Standard Plan shown in Exhibit 11-C received 40.5% of professional charges from the top 20 providers. Once again the University of Wisconsin Medical Foundation is the leading professional provider which corresponds to the top facility charges for the plan. Like the facility charges a majority of the top providers are from the Dane and Milwaukee Counties regions. However we do see providers from different states and regions in the top 20 providers as well.

11b
The SMP Plan in Exhibit 11-D received 77.8% of the paid claims from the top 20 professional providers. Marshfield Clinic was the top provider receiving 37% of the overall payments, followed by St Michael’s Hospital which received 17.3% of the payment. Like the facility charges we see a majority of the charges are received at regional facilities due to the HMO-type coverage and the limited service area. You can also see some services were received in Duluth, MN since the SMP does have limited coverage in the states surrounding Wisconsin.

Exhibit 11-A
Facility Provider City State# of Unique
PatientsInpatient Paid
ClaimsOutpatient Paid
Claims Total Paid Claims Paid %
1 UNIVERSITY WI HSP CL AUTHORITY MADISON WI 622 $1,167,794 $1,631,873 $2,799,667 16.9%2 FAIRVIEW UNIVERSITY MED CTR MINNEAPOLIS MN 14 $1,038,703 $90,529 $1,129,232 6.8%3 FROEDTERT MEM LUTH HOSP MILWAUKEE WI 141 $446,117 $444,091 $890,208 5.4%4 AURORA ST LUKES MEDICAL CENTER MILWAUKEE WI 116 $560,205 $305,602 $865,807 5.2%5 COLUMBIA ST MARYS HOSPITAL MIL MILWAUKEE WI 258 $326,509 $443,962 $770,471 4.7%6 MERITER HOSPITAL INC MADISON WI 130 $296,645 $271,916 $568,561 3.4%7 LUTHER HOSPITAL EAU CLAIRE WI 48 $250,625 $144,608 $395,233 2.4%8 ALL SAINTS ST MARYS MED CENTER RACINE WI 93 $51,423 $264,772 $316,195 1.9%9 CEDARS SINAI MED CTR W HOLLYWOOD CA 1 $284,506 $1,764 $286,270 1.7%
10 ST MARYS HOSP MED CTR MADISON WI 27 $179,282 $81,793 $261,075 1.6%11 CHILDRENS HOSP OF WISCONSIN MILWAUKEE WI 58 $161,612 $88,164 $249,776 1.5%12 WHEATON FRANCISCAN HEALTHCARE BROOKFIELD WI 29 $151,372 $94,991 $246,363 1.5%13 ST MARYS HSP-ROCHESTER ROCHESTER MN 15 $184,037 $61,551 $245,588 1.5%14 AURORA SINAI SAMARTN MED CTR MILWAUKEE WI 38 $144,772 $84,155 $228,927 1.4%15 AURORA MEDICAL CENTER OSHKOSH OSHKOSH WI 46 $116,120 $99,217 $215,337 1.3%16 WAUKESHA MEM HSP INC WAUKESHA WI 44 $60,522 $112,319 $172,841 1.0%17 RIVER FALLS AREA HOSPITAL RIVER FALLS WI 19 $101,444 $66,659 $168,103 1.0%18 UNIVERSITY OF CHICAGO HOSP CHICAGO IL 11 $81,003 $82,516 $163,519 1.0%19 ST VINCENT HOSPITAL GREEN BAY WI 22 $119,493 $42,413 $161,906 1.0%20 ST MARYS HOSP OZAUKEE MEQUON WI 51 $47,310 $107,273 $154,583 0.9%
Top 20 Total 1,783 $5,769,494 $4,520,168 $10,289,662 62.3%All Other Facility Charges 1,659 $2,499,096 $3,729,781 $6,228,877 37.7%Total Facility Charges 3,442 $8,268,590 $8,249,949 $16,518,539 100.0%
STATE EMPLOYEE TRUST FUNDSTop 20 Facility Providers - Standard
Incurred January 2006 - December 2006 Paid Through March 2007

Exhibit 11-B
Facility Provider City State# of Unique
PatientsInpatient Paid
ClaimsOutpatient Paid
Claims Total Paid Claims Paid %
1 ST MICHAELS HOSP STEVENS POINT WI 1,146 $768,652 $2,663,353 $3,432,005 24.9%2 ST JOSEPHS HOSPITAL MARSHFIELD WI 207 $2,125,150 $360,060 $2,485,210 18.0%3 ASPIRUS WAUSAU HOSPITAL INC WAUSAU WI 485 $1,178,873 $977,295 $2,156,168 15.6%4 ST MARYS HOSPITAL INC RHINELANDER WI 433 $254,431 $964,325 $1,218,756 8.8%5 RIVERVIEW HOSPITAL WISC RAPIDS WI 289 $183,521 $487,216 $670,737 4.9%6 HOWARD YOUNG MED CTR WOODRUFF WI 157 $278,727 $281,694 $560,421 4.1%7 BAY AREA MEDICAL CENTER MARINETTE WI 79 $137,457 $172,110 $309,567 2.2%8 LANGLADE MEM HOSP ANTIGO WI 114 $48,448 $249,233 $297,681 2.2%9 GOOD SAMRTN HL CTR INC MERRILL WI 168 $43,931 $247,242 $291,173 2.1%
10 ST MARYS MED CTR DULUTH MN 14 $138,421 $72,925 $211,346 1.5%11 ST CLARES HOSPITAL OF WESTON WESTON WI 42 $185,484 $17,719 $203,203 1.5%12 UNIVERSITY WI HSP CL AUTHORITY MADISON WI 23 $100,943 $65,262 $166,205 1.2%13 FLAMBEAU MEDICAL CENTER INC PARK FALLS WI 72 $23,599 $123,047 $146,646 1.1%14 HEALTHSOUTH WAUSAU SURGERY CEN WAUSAU WI 52 $0 $123,646 $123,646 0.9%15 MEMORIAL HOSP NEILLSVILLE WI 29 $42,355 $79,625 $121,980 0.9%16 RIVER FALLS AREA HOSPITAL RIVER FALLS WI 24 $26,168 $69,015 $95,183 0.7%17 MEMORIAL HEALTH CENTER INC MEDFORD WI 55 $1,780 $93,226 $95,006 0.7%18 MEMORIAL MED CTR INC ASHLAND WI 35 $15,804 $75,579 $91,383 0.7%19 EAGLE RIVER MEM HOSP EAGLE RIVER WI 51 $0 $75,458 $75,458 0.5%20 THOMAS JEFFERSON HOSPITAL PHILADELPHIA PA 1 $63,937 $8,419 $72,356 0.5%
Top 20 Total 3,476 $5,617,681 $7,206,449 $12,824,130 93.0%All Other Facility Charges 421 $337,285 $634,986 $972,272 7.0%Total Facility Charges 3,897 $5,954,966 $7,841,435 $13,796,402 100.0%
STATE EMPLOYEE TRUST FUNDSTop 20 Facility Providers - SMP
Incurred January 2006 - December 2006 Paid Through March 2007
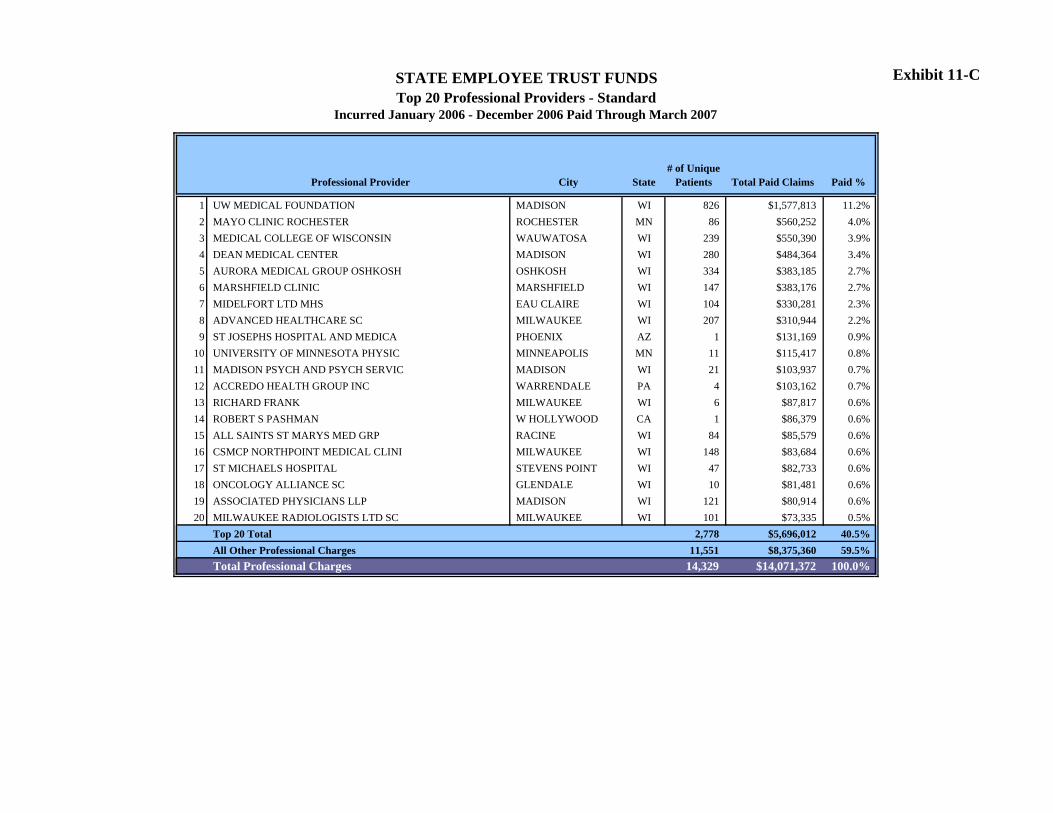
Exhibit 11-C
Professional Provider City State# of Unique
Patients Total Paid Claims Paid %
1 UW MEDICAL FOUNDATION MADISON WI 826 $1,577,813 11.2%2 MAYO CLINIC ROCHESTER ROCHESTER MN 86 $560,252 4.0%3 MEDICAL COLLEGE OF WISCONSIN WAUWATOSA WI 239 $550,390 3.9%4 DEAN MEDICAL CENTER MADISON WI 280 $484,364 3.4%5 AURORA MEDICAL GROUP OSHKOSH OSHKOSH WI 334 $383,185 2.7%6 MARSHFIELD CLINIC MARSHFIELD WI 147 $383,176 2.7%7 MIDELFORT LTD MHS EAU CLAIRE WI 104 $330,281 2.3%8 ADVANCED HEALTHCARE SC MILWAUKEE WI 207 $310,944 2.2%9 ST JOSEPHS HOSPITAL AND MEDICA PHOENIX AZ 1 $131,169 0.9%
10 UNIVERSITY OF MINNESOTA PHYSIC MINNEAPOLIS MN 11 $115,417 0.8%11 MADISON PSYCH AND PSYCH SERVIC MADISON WI 21 $103,937 0.7%12 ACCREDO HEALTH GROUP INC WARRENDALE PA 4 $103,162 0.7%13 RICHARD FRANK MILWAUKEE WI 6 $87,817 0.6%14 ROBERT S PASHMAN W HOLLYWOOD CA 1 $86,379 0.6%15 ALL SAINTS ST MARYS MED GRP RACINE WI 84 $85,579 0.6%16 CSMCP NORTHPOINT MEDICAL CLINI MILWAUKEE WI 148 $83,684 0.6%17 ST MICHAELS HOSPITAL STEVENS POINT WI 47 $82,733 0.6%18 ONCOLOGY ALLIANCE SC GLENDALE WI 10 $81,481 0.6%19 ASSOCIATED PHYSICIANS LLP MADISON WI 121 $80,914 0.6%20 MILWAUKEE RADIOLOGISTS LTD SC MILWAUKEE WI 101 $73,335 0.5%
Top 20 Total 2,778 $5,696,012 40.5%All Other Professional Charges 11,551 $8,375,360 59.5%Total Professional Charges 14,329 $14,071,372 100.0%
STATE EMPLOYEE TRUST FUNDSTop 20 Professional Providers - Standard
Incurred January 2006 - December 2006 Paid Through March 2007

Exhibit 11-D
Professional Provider City State# of Unique
Patients Total Paid Claims Paid %
1 MARSHFIELD CLINIC MARSHFIELD WI 3,034 $7,541,021 37.0%2 ST MICHAELS HOSPITAL STEVENS POINT WI 2,491 $3,527,931 17.3%3 MINISTRY MEDICAL GRP NORTHERN RHINELANDER WI 929 $1,276,541 6.3%4 ASPIRUS CLINIC INC WAUSAU WI 914 $640,119 3.1%5 ALLIED HEALTH OF WISCONSIN SC TOMAHAWK WI 466 $333,666 1.6%6 CENTRAL WISCONSIN RADIOLOGIST STEVENS POINT WI 1,165 $243,108 1.2%7 DULUTH CLINIC LTD DULUTH MN 133 $233,387 1.1%8 EYE CLINIC OF WISCONSIN SC WAUSAU WI 487 $226,060 1.1%9 DIAGNOSTIC AND TREATMENT WESTON WI 275 $221,877 1.1%
10 CARDIOVASCULAR ASSOCIATES OF WAUSAU WI 161 $187,663 0.9%11 ASPIRUS DOCTORS CLINIC WISC RAPIDS WI 382 $185,031 0.9%12 CENTRAL WISCONSIN ANESTHESIOLO WAUSAU WI 148 $157,259 0.8%13 BAY AREA MEDICAL CENTER MARINETTE WI 22 $150,018 0.7%14 STEVENS POINT ANESTHESIA ASSOC STEVENS POINT WI 142 $149,448 0.7%15 ST MICHAELS HOSP STEVENS POINT WI 652 $147,435 0.7%16 RADIOLOGY ASSOCIATES OF WAUSAU WAUSAU WI 384 $146,699 0.7%17 UW MEDICAL FOUNDATION MADISON WI 119 $144,126 0.7%18 BONE AND JOINT CLINIC SC WAUSAU WI 90 $135,684 0.7%19 GASTROINTESTINAL ASSOC SC WAUSAU WI 121 $112,842 0.6%20 BAY AREA BELLIN HEALTH LLC MARINETTE WI 133 $100,495 0.5%
Top 20 Total 12,248 $15,860,410 77.8%All Other Professional Charges 7,403 $4,526,293 22.2%Total Professional Charges 19,651 $20,386,703 100.0%
STATE EMPLOYEE TRUST FUNDSTop 20 Professional Providers - SMP
Incurred January 2006 - December 2006 Paid Through March 2007

12
State Employee Trust Funds Provider Utilization
Out of Network Utilization The Out of Network Utilization reports in exhibit 12-A and 12-B display the top 20 out of network facility providers and top 20 out of network professional providers for the Standard Plan sorted by total paid charges. These providers were not in a WPS network at the time the service was rendered. Within the facility report, charges have been broken out by Inpatient and Outpatient paid charges for additional analysis.
Facility
The Standard Plan out of network facility utilization in total was 3.9% of the total facility claims for the plan in 2006. 15 of the 20 out of network providers were from outside the state which is expected given 21.3% of the Standard Plan population lives outside the state of Wisconsin and are more likely to see an out of network provider depending on location.
Professional
The Standard Plan out of network professional utilization in total was 6.3% of the total professional claims for the plan in 2006. 12 of the top 20 professional providers practice in Wisconsin, however they all appear to be specialty providers not contracted with WPS. The other top professional providers are from outside the state of WI which is expected given the large out of state population.
Midwest Kidney Care and Alexander Hawkins were contracted as in network providers during 2006.

Exhibit 12-A
Facility Provider City State# of Unique
Patients Inpatient Paid
ClaimsOutpatient Paid
Claims Total Paid Claims
1 FLETCHER ALLEN HEALTH CARE BURLINGTON VT 1 $66,995.26 $0.00 $66,995.262 G W UNIVERSITY HOSPITAL WASHINGTON DC 1 $55,285.85 $0.00 $55,285.853 ST JOHNS HM HLTH SERV MILWAUKEE WI 2 $31,950.31 $1,220.00 $33,170.314 TUCSON ORTHOPAEDIC SURGERY CTR TUCSON AZ 5 $0.00 $28,365.90 $28,365.905 WEBSTER SURGERY CENTERLOS LOS ANGELES CA 3 $0.00 $24,173.80 $24,173.806 ST ALPHONSUS HOSP BOISE ID 2 $20,723.19 $230.00 $20,953.197 CHP METHODIST/IU/RILEY INDIANAPOLIS IN 2 $19,087.60 $132.64 $19,220.248 MIDWEST KIDNEY CARE RACINE WI 2 $0.00 $16,935.18 $16,935.189 WISCONSIN RENAL CARE GROUP MILWAUKEE WI 4 $0.00 $15,998.63 $15,998.63
10 BETH ISRAEL MED CTR NEW YORK NY 1 $14,560.08 $0.00 $14,560.0811 PENOBSCOT BAY MED CTR ROCKPORT ME 1 $14,194.49 $0.00 $14,194.4912 PROMINENT HLTH CARE SEVEN OAKS GLENDALE WI 1 $13,803.54 $0.00 $13,803.5413 SWEDISH AMERICAN HOSP ROCKFORD IL 3 $0.00 $13,372.19 $13,372.1914 HOUSTON TOWN AND COUNTRY HOSP HOUSTON TX 2 $11,449.53 $0.00 $11,449.5315 WOODLAND SURGERY CENTER APPLETON WI 2 $0.00 $10,728.67 $10,728.6716 JOHN DEMPSEY HOSP FARMINGTON CT 1 $9,961.55 $0.00 $9,961.5517 CAMP LOWELL SURGERY CENTER TUCSON AZ 3 $0.00 $8,106.06 $8,106.0618 SUMMIT SURGERY CENTER SANTA BARBARA CA 1 $0.00 $7,570.00 $7,570.0019 NORTH TEXAS HOSPITAL DENTON TX 3 $0.00 $7,308.81 $7,308.8120 MAIN ST SPECIALTY SURGERY CTR ORANGE CA 3 $0.00 $5,340.00 $5,340.00
TOTAL 43 $258,011.40 $139,481.88 $397,493.28
Incurred January 2006 - December 2006 Paid Through March 2007Facility Out of Network Utilization - Standard
STATE EMPLOYEE TRUST FUNDS

Exhibit 12-B
Professional Provider City State# of Unique
Patients Total Paid Claims
1 ROBERT S PASHMAN LOS ANGELES CA 4 $86,379.242 WISCONSIN RENAL CARE GROUP MILWAUKEE WI 3 $41,394.603 CHARLES P MELONE NEW YORK NY 4 $35,915.004 MIDWEST SPINAL CENTER MILWAUKEE WI 6 $34,336.855 GOODYEAR CHIROPRACTIC GLENDALE WI 8 $28,551.306 MIDWEST KIDNEY CARE RACINE WI 1 $16,204.437 SPINE RECONSTRUCTION PARTNERS W HOLLYWOOD CA 2 $15,149.518 CULLY R WHITE MILWAUKEE WI 3 $14,413.409 ALEXANDER T HAWKINS BURLINGTON WI 4 $13,230.00
10 RHEUMATOLOGY ASSOCIATES CHICAGO IL 4 $11,415.0111 PHYSICAL THERAPY INTEGRATION MADISON WI 1 $9,241.8012 FLETCHER ALLEN HEALTH CARE BURLINGTON VT 13 $8,064.2013 COMMUNICATION DEVELOPMENT CNT MADISON WI 1 $7,899.2014 JOHN S ROGERSON MD SC MADISON WI 7 $7,359.2015 BAY ORAL-MAX SURG LTD GREEN BAY WI 5 $7,202.8816 EVOLUTION SPINE CENTER PEWAUKEE WI 1 $6,721.0017 BACK 2 LIFE HEALTH CENTER DENVER CO 1 $6,695.7518 VASCULAR SURGERY ASSOC LOS ANGELES CA 2 $5,850.0019 VAIL VALLEY MED CTR VAIL CO 5 $5,813.7020 NEW HOPE CENTER INC CHILTON WI 2 $5,408.00
TOTAL 77 $367,245.07
Incurred January 2006 - December 2006 Paid Through March 2007Professional Out of Network Utilization - Standard
STATE EMPLOYEE TRUST FUNDS


13
State Employee Trust Funds Large Claims
High Cost Patients The High Cost Patients report in Exhibit 13-A lists the plan members with claims over $100,000 for claims incurred January 2006 – December 2006 and paid through March 2007 for the Standard, SMP and Medicare Plus $1M Plans. The Primary Condition is the condition associated with the largest percentage of claim payments and therefore may not be representative of a patient’s complete condition. The Care Management section shows the type of care management provided on each case. For a detailed description of care management processes please reference the Case Management Description in Section 3, pages 1a and 1b.
The Standard Plan has 44 members with claims over $100,000 for a total of $8,363,919 in claim costs. Of these 44 members 32 are employees, 9 are spouses, and 3 are dependents. Another way to break down these members is that 22 are regular members, 22 are annuitants, 34 of the members reside in state and 10 are out of state. These 44 members represent 23.2% of total claims paid under the Standard Plan, compared to the WPS benchmark of 12.1%. The higher than expected results can be attributed to a single claimant that is 2.4% of total claims alone, severity of cases for the year and plan anti-selection (One source of anti-selection is discussed on page 6a in the last two sentences of the last paragraph).
The SMP Plan has 21 members with claims over $100,000 for a total of $3,430,687 in claim costs. Of these 21 members, 13 are employees, 6 are spouses and 2 are dependents. 15 are regular members, 4 are annuitants, 1 is a graduate assistant and 1 is a continuation member. All of the large claimants for the SMP Plan reside in Wisconsin. These 21 members represent 8.6% of total claims paid under the SMP Plan compared to the WPS benchmark of 12.1%.
The Medicare Plus $1M Plan has 2 members with claims over $100,000 for a total $228,980 in claim costs. Although these two members only represent 0.5% of claim costs it is unusual to have claims over $100,000 on benefits wrapping Medicare. Both of these members reside out of state. One member had a very long skilled nursing facility stay that exhausted the Medicare benefit and a portion of the remainder was paid by the plan. The second member had a large amount of outpatient pharmacy costs for treatment of cancer that were not covered by Medicare which contributed to the high level of claim payments.

Exhibit 13-A
Patient Status Plan Care Management Primary Condition Total Paid
1 CANCELLED STANDARD Preauth, UM, CM GASTROINTESTINAL HEMORRHA $875,647.262 ACTIVE STANDARD Preauth, UM, CM SEPTICEMIA $480,327.233 CANCELLED STANDARD UM, CM INTERVERTEBRAL DISC DIS $418,930.724 CANCELLED SMP Preauth, UM, CM MALIG NEO FEMALE BREAST $380,329.975 CANCELLED SMP Preauth, CM SINGLE LIVEBORN $354,712.296 ACTIVE STANDARD Preauth, UM, CM, DM COMPL PECULIAR TO CERTAIN $349,311.787 CANCELLED STANDARD Preauth, UM, CM MALIGNANT NEO PANCREAS $321,907.498 ACTIVE STANDARD UM, CM MALIGNANT NEOPLASM BRAIN $294,635.639 ACTIVE STANDARD Preauth, UM,CM OTHER BRAIN CONDITIONS $292,637.57
10 CANCELLED STANDARD Preauth, UM, CM CHRONIC PULMONARY HEART D $289,158.3411 CANCELLED SMP Preauth, UM, CM CHRONIC RENAL FAILURE $254,529.0012 ACTIVE STANDARD UM, CM MYELOID LEUKEMIA $227,386.4913 CANCELLED STANDARD Preauth, UM, CM MAL NEO UTERINE ADNEXA $226,062.0714 ACTIVE SMP Preauth, UM, CM SECONDRY MAL NEO GI/RESP $216,113.5515 ACTIVE SMP Preauth, UM, CM OTH MAL NEO LYMPH/HISTIO $201,602.5516 ACTIVE STANDARD Preauth, UM EPILEPSY $199,750.9417 ACTIVE STANDARD UM, CM OTH BACTERIAL PNEUMONIA $197,792.9118 CANCELLED STANDARD Preauth, UM, CM MALIGNANT NEOPLASM BRAIN $182,572.9919 CANCELLED SMP Preauth, UM, CM, BH OTH SURGICAL COMPL NEC $179,890.9120 ACTIVE STANDARD Preauth, UM, CM REHABILITATION PROCEDURE $179,766.4221 CANCELLED STANDARD UM, CM SEC MALIG NEO OTH SITES $172,765.1422 ACTIVE STANDARD UM, CM INTRACRANIAL HEMORRHAGE N $163,039.1623 CANCELLED STANDARD Preauth, UM, CM CNS ABSCESS $162,714.9224 ACTIVE STANDARD Preauth, UM, CM ANKLE FRACTURE $158,953.3225 CANCELLED STANDARD Preauth, UM, CM REHABILITATION PROCEDURE $158,516.8926 CANCELLED STANDARD UM, CM CARDIAC DYSRHYTHMIAS $156,689.7527 ACTIVE STANDARD CM MULTIPLE MYELOMA ET AL $155,686.2328 CANCELLED SMP UM, CM MAL NEO UTERINE ADNEXA $153,992.1729 CANCELLED SMP Preauth, UM, CM LYMPHOID LEUKEMIA $153,773.8830 ACTIVE STANDARD Preauth, UM, CM REHABILITATION PROCEDURE $150,859.6031 ACTIVE STANDARD Preauth, UM MALIG NEO FEMALE BREAST $150,116.2832 CANCELLED SMP Preauth, UM, CM DIS REL SHORT GESTATION/U $141,059.02
Preauth = Preauthorization UM = Utilization Management CM = Case Management DM = Disease Management BH = Behavioral Health
Incurred January 2006 - December 2006 Paid Through March 2007High Cost Patients (over $100,000)
STATE EMPLOYEE TRUST FUNDS

Exhibit 13-A
Patient Status Plan Care Management Primary Condition Total Paid
Incurred January 2006 - December 2006 Paid Through March 2007High Cost Patients (over $100,000)
STATE EMPLOYEE TRUST FUNDS
33 CANCELLED STANDARD Preauth, UM, CM SECONDRY MAL NEO GI/RESP $139,839.3434 ACTIVE STANDARD UM, DM GENERAL SYMPTOMS $138,414.5535 CANCELLED SMP Preauth, UM, CM ENCOUNTR PROC/AFTRCR NEC $134,799.4736 CANCELLED SMP Preauth, UM, CM SPONDYLOSIS AND ALLIED DI $134,078.1337 CANCELLED SMP UM, DM ACUTE MYOCARDIAL INFARCTI $130,847.8838 ACTIVE STANDARD Preauth, UM, CM MULTIPLE MYELOMA ET AL $130,227.6639 CANCELLED SMP Preauth, UM, CM MAL NEO UTERINE ADNEXA $129,069.3340 ACTIVE MEDICARE PLUS ONE MILLION ENCOUNTR PROC/AFTRCR NEC $126,437.3841 ACTIVE STANDARD UM, DM OTH FORMS CHRONIC ISCHEMI $126,126.1642 ACTIVE STANDARD Preauth, CM ENCOUNTR PROC/AFTRCR NEC $124,892.7043 ACTIVE STANDARD Preauth, UM, CM APLASTIC ANEMIA $119,505.7544 ACTIVE SMP UM, DM OTH FORMS CHRONIC ISCHEMI $118,733.8845 CANCELLED STANDARD UM, CM MENINGEAL HEM FOLLOW INJ $117,843.5946 CANCELLED SMP Preauth, UM OTH DISORDERS OF BONE & C $117,128.0247 ACTIVE STANDARD Preauth, UM OTH DISORDERS OF BONE & C $117,102.2548 CANCELLED STANDARD Preauth, CM HEART FAILURE $114,406.2549 ACTIVE STANDARD Preauth, UM, CM OSTEOARTHROSIS AND ALLIED $114,303.5350 ACTIVE STANDARD UM, DM OTH FORMS CHRONIC ISCHEMI $111,612.0951 CANCELLED STANDARD UM MALIG NEO FEMALE BREAST $110,451.6952 ACTIVE STANDARD UM, CM MALIGNANT NEOPLASM BRAIN $109,090.4553 CANCELLED SMP Preauth, DM OTH DISORDERS OF EYE $107,853.1354 CANCELLED SMP Preauth, UM, DM OTH FORMS CHRONIC ISCHEMI $106,907.8355 CANCELLED STANDARD UM, CM DIVERTICULA OF INTESTINE $105,922.1156 ACTIVE STANDARD UM, CM OTH DISEASES OF LUNG $105,169.0257 CANCELLED SMP UM, CM MALIGNANT NEOPLASM UNSPEC $104,701.1858 ACTIVE STANDARD UM, CM CHRONIC RENAL FAILURE $104,170.9059 CANCELLED SMP UM BH ENCOUNTR PROC/AFTRCR NEC $103,977.9960 ACTIVE STANDARD UM, CM VASCULAR INSUFFICIENCY OF $103,641.3361 CANCELLED SMP UM, CM ACUTE PULMONARY HEART DIS $103,597.4062 CANCELLED SMP Preauth, UM, CM OTH MAL NEO LYMPH/HISTIO $102,989.1563 ACTIVE MEDICARE PLUS ONE MILLION UM, CM OTH DISEASES OF LUNG $102,542.7464 ACTIVE STANDARD UM, CM ENCOUNTR PROC/AFTRCR NEC $102,425.43
Preauth = Preauthorization UM = Utilization Management CM = Case Management DM = Disease Management BH = Behavioral Health

Exhibit 13-A
Patient Status Plan Care Management Primary Condition Total Paid
Incurred January 2006 - December 2006 Paid Through March 2007High Cost Patients (over $100,000)
STATE EMPLOYEE TRUST FUNDS
65 ACTIVE STANDARD UM, CM CHRONIC RENAL FAILURE $102,166.8866 CANCELLED STANDARD Preauth, UM, CM DISEASES OF ESOPHAGUS $100,887.1667 ACTIVE STANDARD Preauth, UM, DM OTH FORMS CHRONIC ISCHEMI $100,491.45
Total $12,023,586.27
Preauth = Preauthorization UM = Utilization Management CM = Case Management DM = Disease Management BH = Behavioral Health

14
State Employee Trust Funds Member Cost Share
Medical and Drug Cost Sharing The Medical and Drug Cost Sharing graphs in Exhibit 14-A show the percent of eligible medical and drug claim costs paid by the member. This percentage is compared to the WPS benchmark though for this comparison the benchmark is unadjusted.
The Standard Plan members pay about 3.5% of their own medical claims as compared to the benchmark of 7-8%. The prescription drug cost share is slightly closer to our normative benchmark with the Standard Plan around 16.5% and the benchmark at 19.5%.
The SMP Plan members by comparison pay almost nothing towards their own medical claims (in the form of cost sharing), unlike the members of most large groups who pay an average of about 7-8% of their medical claims. The SMP cost share for prescription drugs is just over 15% compared to the benchmark of 19.5%. Even though the Standard and SMP Plans have the same prescription drug benefit, they have slightly different drug utilization profiles, the result of each plan’s unique blend of treated conditions.

Exhibit 14-A
Note: Benchmark data has been age/sex adjusted to correspond to the population included in this exhibit
STATE EMPLOYEE TRUST FUNDSMedical and Drug Cost Sharing
Incurred January 2006 - December 2006 Paid Through March 2007
Standard
0%
5%
10%
15%
20%
Medical Drug
Perc
ent O
OP
Actual Norm
SMP
0%
5%
10%
15%
20%
Medical Drug
Perc
ent O
OP
Actual Norm

15
State Employee Trust Funds Member Cost Share
Medical and Drug Out of Pocket by Member The Medical and Drug Out of Pocket by Member bar graph shown in Exhibit 15-A divides members with out of pocket cost sharing into categories based on the annual amount of out of pocket costs they paid in 2006. The annual out of pocket for each member includes medical and prescription drug costs.
The Standard Plan has a large disparity between the members as far as out of pocket costs. A good portion of members pay between $100 and $200 out of pocket annually. There are almost 900 members in the $500 to $999 range but it is important to note the range for this category is larger than the previous categories. Lastly there are just over 500 members who pay over $1000 out of pocket annually.
The SMP Plan by comparison has a large number of all members paying between $1and $99 in cost sharing. Most of the cost sharing comes from prescription drug copays.
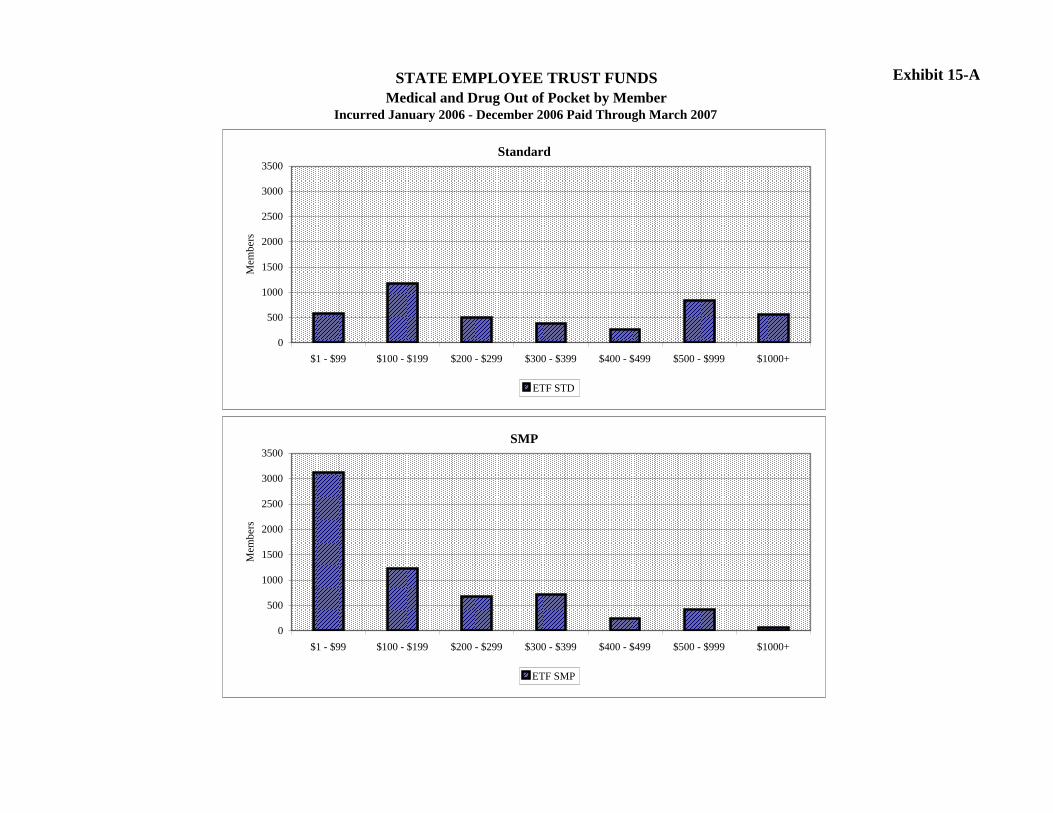
Exhibit 15-ASTATE EMPLOYEE TRUST FUNDSMedical and Drug Out of Pocket by Member
Incurred January 2006 - December 2006 Paid Through March 2007
Standard
0
500
1000
1500
2000
2500
3000
3500
$1 - $99 $100 - $199 $200 - $299 $300 - $399 $400 - $499 $500 - $999 $1000+
Mem
bers
ETF STD
SMP
0
500
1000
1500
2000
2500
3000
3500
$1 - $99 $100 - $199 $200 - $299 $300 - $399 $400 - $499 $500 - $999 $1000+
Mem
bers
ETF SMP

16
State Employee Trust Funds Medical Claims Cost Savings
Medical Claim Savings Analysis The Medical Claim Saving Analysis in Exhibit 16-A takes the charges submitted on behalf of the ETF members and details the savings that take place before the final payments are made to the providers. The submitted charges represent medical claims only. The charges are split between the Standard, SMP and Medicare Plus $1M Plans for claims incurred January 2006 through December 2006 and paid through the end of March 2007. Exhibit 16-B provides a summary of the savings by plan along with a pie chart that provides the percentage of savings in each category combining all plans.
For the Standard Plan, WPS paid 69.2% of submitted charges on behalf of the plan. Of the 30.8% savings, 17.5% came from pricing cutbacks from the network providers. Another 7.3% of savings was received from the rejection of duplicate charges or charges that were not eligible. Another 3.1% of savings was received by rejection of non-covered services. The Standard Plan also had 2.1% of charges paid by the members with deductibles, coinsurance and copays. The savings due to third party liability is small at this time but these types of recoveries can be long term and may take several years to be completed.
For the SMP Plan, WPS paid 78.0% of submitted charges on behalf of the plan. Of the 22% savings, 13.0% was received from pricing cutbacks from network providers. Another 6.9% was saved on claims rejected for duplicate submission, non-eligible claims, and services not covered by the plan. In comparison to the Standard Plan, the SMP Plan members contributed only 0.3% in out-of-pocket costs. The SMP Plan does have some out-of-pocket costs in the form of ER Copays and coinsurance on DME and Outpatient Psychiatric Visits. The total seen in the copayment segment is not just ER copays but also encompasses coinsurance amounts that do not apply to the annual out-of-pocket maximum for a member.
For the Medicare Plus $1M Plan, WPS paid 6.6% of submitted charges on behalf of the plan. Payments made by Medicare have an overwhelming impact on savings by accounting for 75.1% of the submitted charges. The second highest savings came from the rejection of duplicate or non-eligible charges. This number was higher than expected due to the submission of duplicate electronic and paper claims. The WPS claims area has worked hard on provider education in this area and we expect this percentage to be lower in the future.
As seen in the pie chart in Exhibit 16-B, the total payment made by WPS for all plan types in 2006 was 25.3% of submitted charges. With the Medicare population’s impact, 54% of the savings was provided by Medicare, followed by 13.9% in rejections for duplicates and non-eligible services and 4.4% in pricing cutback.

Exhibit 16-A
$ Amount % of Total $ Amount % of Total $ Amount % of Total
Submitted Charges $44,216,156.17 100.0% $43,822,967.91 100.0% $226,490,495.15 100.0%Duplicates/Not Eligible $3,222,444.30 7.3% $1,307,777.22 3.0% $39,267,014.43 17.3%Pricing Cutbacks $7,750,643.72 17.5% $5,709,690.32 13.0% $477,766.47 0.2%Out-of-Pocket
Deductible $599,542.53 1.4% $0.00 0.0% $0.00 0.0%Coinsurance $332,113.98 0.8% $65,812.69 0.2% $12,522.76 0.0%Copayments $800.00 0.0% $84,030.82 0.2% $0.00 0.0%
Total $932,456.51 2.1% $149,843.51 0.3% $12,522.76 0.0%Not Covered
Medical Necessity $189,746.12 0.4% $93,793.49 0.2% $129,448.64 0.1%Inappropriate Provider $97,468.16 0.2% $6,535.43 0.0% $39,617.63 0.0%Benefit Maximum $139,446.80 0.3% $78,362.95 0.2% $187,186.37 0.1%Experimental/Fertility $71,912.05 0.2% $39,020.77 0.1% $1,810.50 0.0%Dental $62,202.50 0.1% $62,353.56 0.1% $23,587.58 0.0%Custodial $49,136.45 0.1% $56.00 0.0% $315,050.27 0.1%Code Review $438,408.04 1.0% $562,908.52 1.3% $24,141.39 0.0%Contact Lens/Hearing Aid $11,775.31 0.0% $54,124.40 0.1% $122,026.96 0.1%Drugs $0.00 0.0% $588.75 0.0% $181,311.40 0.1%No Referral $0.00 0.0% $617,702.19 1.4% $0.00 0.0%All Other $292,449.43 0.7% $186,595.51 0.4% $666,743.70 0.3%
Total $1,352,544.86 3.1% $1,702,041.57 3.9% $1,690,924.44 0.7%Third Party Liability
Workers Compensation $72,672.09 0.2% $92,231.85 0.2% $663.37 0.0%Subrogation $1,950.36 0.0% $4,363.50 0.0% $2,322.56 0.0%Coordination of Benefits $124,392.94 0.3% $652,836.60 1.5% $0.00 0.0%
Total $199,015.39 0.5% $749,431.95 1.7% $2,985.93 0.0%Medicare $168,555.43 0.4% $21,080.23 0.0% $170,089,416.90 75.1%Payments $30,590,495.96 69.2% $34,183,103.11 78.0% $14,949,864.22 6.6%
STATE EMPLOYEE TRUST FUNDSMedical Claim Savings Analysis
Incurred January 2006 - December 2006 Paid Through March 2007
Category
MEDICARE PLUS ONE MILLIONSMPSTANDARD

Exhibit 16-B
$ Amount % of Total $ Amount % of Total $ Amount % of Total
Payments $30,590,495.96 69.2% $34,183,103.11 78.0% $14,949,864.22 6.6%Pricing Cutbacks $7,750,643.72 17.5% $5,709,690.32 13.0% $477,766.47 0.2%Duplicates/Not Eligible $3,222,444.30 7.3% $1,307,777.22 3.0% $39,267,014.43 17.3%Not Covered $1,352,544.86 3.1% $1,702,041.57 3.9% $1,690,924.44 0.7%Out-of-Pocket $932,456.51 2.1% $149,843.51 0.3% $12,522.76 0.0%Third Party Liability $199,015.39 0.5% $749,431.95 1.7% $2,985.93 0.0%Medicare $168,555.43 0.4% $21,080.23 0.0% $170,089,416.90 75.1%
STANDARD, SMP, MEDICARE PLUS ONE MILLION
STATE EMPLOYEE TRUST FUNDSMedical Claim Savings Analysis Summary
Incurred January 2006 - December 2006 Paid Through March 2007
STANDARD SMPMEDICARE PLUS ONE
MILLION
TOTAL% OF CLAIMS SAVINGS
Pricing Cutbacks4.4%
Out-of-Pocket0.3%
Not Covered1.5%
Duplicates/Not Eligible13.9%
Payments25.3%
Medicare54.1%
Third Party Liability0.3%

State of Wisconsin
Section 2: Wisconsin Public Employers

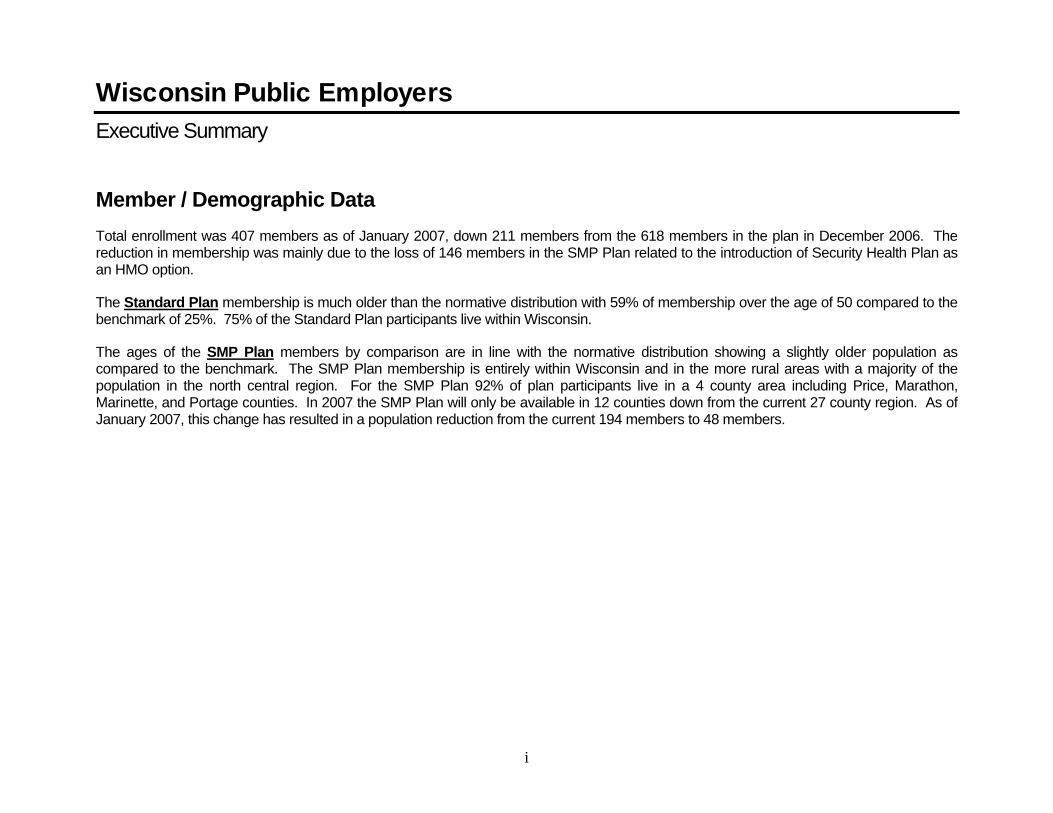
i
Wisconsin Public Employers Executive Summary
Member / Demographic Data Total enrollment was 407 members as of January 2007, down 211 members from the 618 members in the plan in December 2006. The reduction in membership was mainly due to the loss of 146 members in the SMP Plan related to the introduction of Security Health Plan as an HMO option.
The Standard Plan membership is much older than the normative distribution with 59% of membership over the age of 50 compared to the benchmark of 25%. 75% of the Standard Plan participants live within Wisconsin.
The ages of the SMP Plan members by comparison are in line with the normative distribution showing a slightly older population as compared to the benchmark. The SMP Plan membership is entirely within Wisconsin and in the more rural areas with a majority of the population in the north central region. For the SMP Plan 92% of plan participants live in a 4 county area including Price, Marathon, Marinette, and Portage counties. In 2007 the SMP Plan will only be available in 12 counties down from the current 27 county region. As of January 2007, this change has resulted in a population reduction from the current 194 members to 48 members.
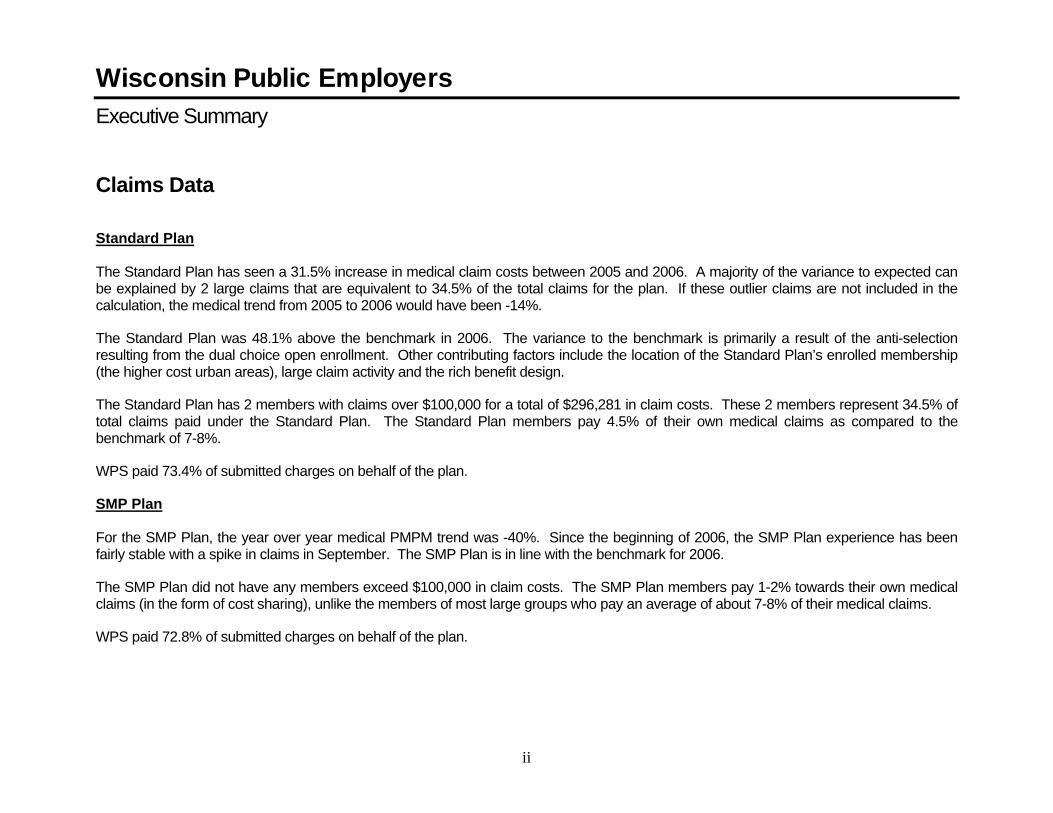
ii
Wisconsin Public Employers Executive Summary
Claims Data
Standard Plan
The Standard Plan has seen a 31.5% increase in medical claim costs between 2005 and 2006. A majority of the variance to expected can be explained by 2 large claims that are equivalent to 34.5% of the total claims for the plan. If these outlier claims are not included in the calculation, the medical trend from 2005 to 2006 would have been -14%.
The Standard Plan was 48.1% above the benchmark in 2006. The variance to the benchmark is primarily a result of the anti-selection resulting from the dual choice open enrollment. Other contributing factors include the location of the Standard Plan’s enrolled membership (the higher cost urban areas), large claim activity and the rich benefit design.
The Standard Plan has 2 members with claims over $100,000 for a total of $296,281 in claim costs. These 2 members represent 34.5% of total claims paid under the Standard Plan. The Standard Plan members pay 4.5% of their own medical claims as compared to the benchmark of 7-8%.
WPS paid 73.4% of submitted charges on behalf of the plan.
SMP Plan
For the SMP Plan, the year over year medical PMPM trend was -40%. Since the beginning of 2006, the SMP Plan experience has been fairly stable with a spike in claims in September. The SMP Plan is in line with the benchmark for 2006.
The SMP Plan did not have any members exceed $100,000 in claim costs. The SMP Plan members pay 1-2% towards their own medical claims (in the form of cost sharing), unlike the members of most large groups who pay an average of about 7-8% of their medical claims.
WPS paid 72.8% of submitted charges on behalf of the plan.

iii
Medicare Carve-out Plan
The Medicare Carve-out Plan has seen stable results over the last 2 years. The year over year medical PMPM trend from 2005 to 2006 was 11.3%.
WPS paid 5.9% of submitted charges on behalf of the plan. 74.1% of the charges were paid by Medicare.

iv
Wisconsin Public Employers Executive Summary
Provider Data
For the Standard Plan, the top 20 facilities provide 90.7% of the total facility charges for the plan. 69.0% of professional charges are from the top 20 providers.
For the SMP Plan, the top 20 facilities provide 99.9% of the total facility charges for the plan. The largest percentage of paid claims is from Aspirus in Wausau. 77.6% of the paid claims are from the top 20 professional providers. Marshfield Clinic was the top professional provider receiving 33% of the overall payments, followed by St Michael’s Hospital which received 9.2% of the payment.


1
Wisconsin Public Employers Summary Level Cost and Membership
Monthly Cost and Membership The Monthly Cost and Membership report in Exhibit 1-B shows monthly membership and incurred claims for the Standard, SMP and Medicare Carve-out plans from January 2006 through December 2006. The total Paid Claims include medical and drug claims and represent all claims paid through the end of March 2007. The Paid PMPM shows the average amount paid per member each month in the time period.
Enrollment on the Standard Plan averaged 106 members per month in 2006. The membership over the course of the year remained fairly stable with a modest increase beginning in October. The Paid PMPM cost for the Standard Plan averaged $781.08, with the first quarter of the year well above the average at $1,425.97 in Paid PMPM. The monthly variance in the Paid PMPM cost can be attributed to seasonality, credibility and large claim activity.
SMP Plan enrollment averaged 201 members per month in 2006. The 2006 membership remained very stable in 2006. The Paid PMPM cost for the SMP Plan averaged $354.26 in 2006 with some variance from this average over the year.
The Medicare Carve-out Plan enrollment averaged 307 members per month in 2006. The membership declined over the course of the year, beginning with 315 members in January and gradually declining to 302 members in December. The Paid PMPM cost for the Medicare Carve-out Plan averaged $141.62 in 2006.

Exhibit 1-B
Covered Members Paid Claims Paid PMPM
Covered Members Paid Claims Paid PMPM
Covered Members Paid Claims Paid PMPM
2006 January 103 $161,110 $1,564.18 205 $76,362 $372.50 315 $50,613 $160.68February 100 $187,434 $1,874.34 205 $65,751 $320.74 312 $39,750 $127.40March 100 $83,939 $839.39 200 $64,423 $322.11 308 $54,826 $178.01April 102 $83,855 $822.10 204 $53,860 $264.02 308 $34,067 $110.61May 102 $67,181 $658.63 204 $62,873 $308.20 307 $51,719 $168.46June 100 $37,734 $377.34 203 $74,536 $367.17 305 $43,278 $141.89July 97 $57,278 $590.50 202 $64,488 $319.25 303 $35,097 $115.83August 99 $48,256 $487.43 199 $58,238 $292.66 306 $40,960 $133.86September 103 $35,088 $340.66 197 $124,652 $632.75 306 $40,247 $131.53October 123 $61,025 $496.14 198 $82,707 $417.71 304 $46,960 $154.48November 122 $107,981 $885.09 196 $55,276 $282.02 303 $40,782 $134.59December 122 $63,437 $519.97 194 $69,544 $358.47 302 $42,733 $141.50
Total 1,273 $994,316 $781.08 2,407 $852,709 $354.26 3,679 $521,030 $141.62
Note: Paid claims include prescription drugs (except Dean Medicare Part D drugs) and injectablesNote: Member counts in this exhibit have been restated to reflect retroactive membership changes through March 2007
Incurred Month
MEDICARE
WISCONSIN PUBLIC EMPLOYERSMonthly Cost and Membership
Paid Through March 2007
SMPSTANDARD

2
Wisconsin Public Employers Group Demographics
Enrollment by Plan & Dual Choice Changes The Enrollment by Plan report shown in Exhibit 2-C shows the December 2006 membership for the Standard, SMP and Medicare Carve-out Plans at the class level. The Dual Choice Enrollment Changes by Plan report in Exhibit 2-D shows the January 2007 enrollment reflecting changes that occurred during the Dual Choice Enrollment. The enrollment changes are numerical differences relative to December 2006. In both exhibits the counts are based on members. For each class the membership, average age, female distribution, and age/gender factor have been provided. The age/gender factor is an index intended to represent expected plan cost based on the age and gender of each member, without regard to plan design, health, etc. The age/gender factor is not shown for the Medicare Carve-out Plan, where coordination of benefits with Medicare has an overwhelming impact on plan cost.
Total enrollment was 407 members as of January 2007, down 211 members from the 618 members in the plan in December 2006. The reduction in membership was mainly due to the loss of 146 members in the SMP Plan related to the introduction of Security Health Plan as the HMO option. The Standard Plan also experienced the loss of 65 members during Dual Choice Enrollment. The overall increase in age in the totals in Exhibit 2-D is due to the large loss of the younger SMP Plan population that balanced the older Medicare Carve-out Plan population.

Exhibit 2-C
Plan Class # of Members
Average Member
Age
Member Gender
Distribution Female
Member Age/
Gender Factor
Classic Standard Milwaukee 28 54.4 46.4% 2.123Waukesha 8 47.0 37.5% 1.528Dane 10 46.1 60.0% 1.806Rest of State 63 43.4 44.4% 1.509Annuitants 11 58.4 63.6% 2.340Continuation 0 0.0 0.0% 0.000Medicare 288 75.3 56.9% 1.134
Subtotal 408 67.2 54.2% 1.317Deductible Standard Milwaukee 0 0.0 0.0% 0.000
Waukesha 0 0.0 0.0% 0.000Dane 0 0.0 0.0% 0.000Rest of State 0 0.0 0.0% 0.000Annuitants 0 0.0 0.0% 0.000Continuation 0 0.0 0.0% 0.000Medicare 0 0.0 0.0% 0.000
Subtotal 0 0.0 0.0% 0.000Standard Preferred Milwaukee 0 0.0 0.0% 0.000
Waukesha 0 0.0 0.0% 0.000Dane 0 0.0 0.0% 0.000Rest of State 0 0.0 0.0% 0.000Annuitants 0 0.0 0.0% 0.000Continuation 0 0.0 0.0% 0.000Medicare 1 82.0 100.0% 1.103
Subtotal 1 82.0 100.0% 1.103Deductible Standard Preferred Milwaukee 0 0.0 0.0% 0.000
Waukesha 0 0.0 0.0% 0.000Dane 0 0.0 0.0% 0.000Rest of State 1 52.0 100.0% 1.840Annuitants 1 52.0 100.0% 1.840Continuation 0 0.0 0.0% 0.000Medicare 13 74.3 53.8% 1.137
Subtotal 15 71.3 60.0% 1.230SMP Local 194 36.0 50.0% 1.243
Annuitants 0 0.0 0.0% 0.000Continuation 0 0.0 0.0% 0.000
Subtotal 194 36.0 50.0% 1.243Deductible SMP Local 0 0.0 0.0% 0.000
Annuitants 0 0.0 0.0% 0.000Continuation 0 0.0 0.0% 0.000
Subtotal 0 0.0 0.0% 0.000WPE Grand Total 618 57.5 53.1% 1.291
Enrollment by Plan December 2006
WISCONSIN PUBLIC EMPLOYERS

Exhibit 2-D
Plan ClassJanuary 2007 Membership
Change in Membership from Prior
Month
Change in Average Member
Age
Change in Member Gender
Distribution Female
Change in Member
Age/ Gender
Classic Standard Milwaukee 23 -5 2.9 5.7% 9.19%Waukesha 1 -7 0.0 -37.5% 2.73%Dane 9 -1 0.5 -4.4% 2.95%Rest of State 27 -36 7.8 -3.7% 26.27%Annuitants 9 -2 -0.8 3.0% -3.36%Continuation 0 0 0.0 0.0% 0.00%Medicare 290 2 0.0 0.0% 0.00%
Subtotal 359 -49 3.9 1.3% -0.07%Deductible Standard Milwaukee 0 0 0.0 0.0% 0.00%
Waukesha 0 0 0.0 0.0% 0.00%Dane 0 0 0.0 0.0% 0.00%Rest of State 0 0 0.0 0.0% 0.00%Annuitants 0 0 0.0 0.0% 0.00%Continuation 0 0 0.0 0.0% 0.00%Medicare 0 0 0.0 0.0% 0.00%
Subtotal 0 0 0.0 0.0% 0.00%Standard Preferred Milwaukee 0 0 0.0 0.0% 0.00%
Waukesha 0 0 0.0 0.0% 0.00%Dane 0 0 0.0 0.0% 0.00%Rest of State 0 0 0.0 0.0% 0.00%Annuitants 0 0 0.0 0.0% 0.00%Continuation 0 0 0.0 0.0% 0.00%Medicare 0 -1 -82.0 -100.0% -100.00%
Subtotal 0 -1 -82.0 -100.0% -100.00%Deductible Standard Preferred Milwaukee 0 0 0.0 0.0% 0.00%
Waukesha 0 0 0.0 0.0% 0.00%Dane 0 0 0.0 0.0% 0.00%Rest of State 0 -1 -52.0 -100.0% -100.00%Annuitants 0 -1 -52.0 -100.0% -100.00%Continuation 0 0 0.0 0.0% 0.00%Medicare 0 -13 -74.3 -53.8% -100.00%
Subtotal 0 -15 -71.3 -60.0% -100.00%SMP Local 48 -146 -5.5 -4.2% -19.73%
Annuitants 0 0 0.0 0.0% 0.00%Continuation 0 0 0.0 0.0% 0.00%
Subtotal 48 -146 -5.5 -4.2% -19.73%Deductible SMP Local 0 0 0.0 0.0% 0.00%
Annuitants 0 0 0.0 0.0% 0.00%Continuation 0 0 0.0 0.0% 0.00%
Subtotal 0 0 0.0 0.0% 0.00%WPE Grand Total 407 -211 8.8 -53.1% -1.00%
WISCONSIN PUBLIC EMPLOYERSDual Choice Enrollment Changes by Plan
December 2006 to January 2007


3
Wisconsin Public Employers Group Demographics
Member Census Grids The Member Census Grid breaks down the December 2006 membership into age and gender categories for the Standard, SMP and Medicare Carve-out Plans. The Standard and SMP distributions are compared to a benchmark distribution based on WPS large group business as described in the Executive Summary. The benchmark distribution for the Medicare plan is based on comparable WPS Medicare enrollment.
Standard Plan
The Standard Plan membership shown in Exhibit 3-D appears to be much older than the normative distribution with 59% of membership over the age of 50 compared to the benchmark of 25%. Older members tend to seek more medical care and tend to select a broader panel of providers for that care. Since the Standard Plan has a broader panel of providers, this causes the average age to be higher.
Also contributing to the older than expected membership is the smaller than expected population of children with only 11% of the membership under the age of 20 compared to the benchmark of 29.8%. The Standard Plan also has a slightly higher than normal population of males with 51.6% male as compared to the benchmark of 48.3%.
SMP Plan
The SMP Plan membership shown in Exhibit 3-E by comparison seems to be in line with the normative distribution with only a slightly older population as compared to the benchmark. The SMP distribution was above the benchmark from age 50 to age 64 which is pushing the average age slightly above the norm.
Medicare Carve-out Plan
The Medicare Carve-out Plan membership is shown in Exhibit 3-F. The population is in line with the normative distribution.

Exhibit 3-D
Age Band # of Members % of Total Benchmark Age Band # of Members % of Total Benchmark Age Band # of Members % of Total Benchmark
< 20 7 5.7% 14.5% < 20 6 4.9% 15.3% < 20 13 10.7% 29.8%20 - 24 1 0.8% 3.9% 20 - 24 3 2.5% 3.3% 20 - 24 4 3.3% 7.2%25 - 29 0 0.0% 3.3% 25 - 29 2 1.6% 2.7% 25 - 29 2 1.6% 6.0%30 - 34 0 0.0% 3.4% 30 - 34 0 0.0% 3.1% 30 - 34 0 0.0% 6.5%35 - 39 2 1.6% 4.0% 35 - 39 5 4.1% 3.6% 35 - 39 7 5.7% 7.6%40 - 44 4 3.3% 4.8% 40 - 44 5 4.1% 4.2% 40 - 44 9 7.4% 9.0%45 - 49 7 5.7% 5.0% 45 - 49 8 6.6% 4.4% 45 - 49 15 12.3% 9.4%50 - 54 14 11.5% 5.0% 50 - 54 5 4.1% 4.3% 50 - 54 19 15.6% 9.3%55 - 59 10 8.2% 4.2% 55 - 59 12 9.8% 3.7% 55 - 59 22 18.0% 7.9%60 - 64 13 10.7% 2.5% 60 - 64 15 12.3% 2.5% 60 - 64 28 23.0% 5.0%65 + 1 0.8% 1.1% 65 + 2 1.6% 1.2% 65 + 3 2.5% 2.3%
Total 59 48.4% 51.7% Total 63 51.6% 48.3% Total 122 100.0% 100.0%
MALE TOTAL
WISCONSIN PUBLIC EMPLOYERSMember Census Grid - Standard
December 2006
FEMALE
Membership Distribution
0.0%
5.0%
10.0%
15.0%
20.0%
25.0%
30.0%
35.0%
< 20 20 - 24 25 - 29 30 - 34 35 - 39 40 - 44 45 - 49 50 - 54 55 - 59 60 - 64 65 +
WPE Standard Benchmark

Exhibit 3-E
Age Band # of Members % of Total Benchmark Age Band # of Members % of Total Benchmark Age Band # of Members % of Total Benchmark
< 20 23 11.9% 14.5% < 20 32 16.5% 15.3% < 20 55 28.4% 29.8%20 - 24 9 4.6% 3.9% 20 - 24 3 1.5% 3.3% 20 - 24 12 6.2% 7.2%25 - 29 1 0.5% 3.3% 25 - 29 3 1.5% 2.7% 25 - 29 4 2.1% 6.0%30 - 34 4 2.1% 3.4% 30 - 34 6 3.1% 3.1% 30 - 34 10 5.2% 6.5%35 - 39 8 4.1% 4.0% 35 - 39 5 2.6% 3.6% 35 - 39 13 6.7% 7.6%40 - 44 9 4.6% 4.8% 40 - 44 12 6.2% 4.2% 40 - 44 21 10.8% 9.0%45 - 49 13 6.7% 5.0% 45 - 49 4 2.1% 4.4% 45 - 49 17 8.8% 9.4%50 - 54 12 6.2% 5.0% 50 - 54 16 8.2% 4.3% 50 - 54 28 14.4% 9.3%55 - 59 10 5.2% 4.2% 55 - 59 7 3.6% 3.7% 55 - 59 17 8.8% 7.9%60 - 64 6 3.1% 2.5% 60 - 64 8 4.1% 2.5% 60 - 64 14 7.2% 5.0%65 + 2 1.0% 1.1% 65 + 1 0.5% 1.2% 65 + 3 1.5% 2.3%
Total 97 50.0% 51.7% Total 97 50.0% 48.3% Total 194 100.0% 100.0%
MALE TOTAL
WISCONSIN PUBLIC EMPLOYERSMember Census Grid - SMP
December 2006
FEMALE
Membership Distribution
0.0%
5.0%
10.0%
15.0%
20.0%
25.0%
30.0%
35.0%
< 20 20 - 24 25 - 29 30 - 34 35 - 39 40 - 44 45 - 49 50 - 54 55 - 59 60 - 64 65 +
WPE SMP Benchmark

Exhibit 3-F
Age Band # of Members % of Total Benchmark Age Band # of Members % of Total Benchmark Age Band # of Members % of Total Benchmark
< 40 0 0.0% 0.0% < 40 0 0.0% 0.1% < 40 0 0.0% 0.2%40 - 44 0 0.0% 0.1% 40 - 44 0 0.0% 0.1% 40 - 44 0 0.0% 0.1%45 - 49 0 0.0% 0.1% 45 - 49 0 0.0% 0.1% 45 - 49 0 0.0% 0.2%50 - 54 2 0.7% 0.4% 50 - 54 0 0.0% 0.2% 50 - 54 2 0.7% 0.6%55 - 59 3 1.0% 0.8% 55 - 59 0 0.0% 0.6% 55 - 59 3 1.0% 1.4%60 - 64 2 0.7% 1.8% 60 - 64 1 0.3% 1.0% 60 - 64 3 1.0% 2.8%65 - 69 36 11.9% 13.4% 65 - 69 26 8.6% 10.1% 65 - 69 62 20.5% 23.5%70 - 74 42 13.9% 12.2% 70 - 74 35 11.6% 9.3% 70 - 74 77 25.5% 21.6%75 - 79 43 14.2% 12.9% 75 - 79 32 10.6% 8.6% 75 - 79 75 24.8% 21.5%80 - 84 20 6.6% 9.7% 80 - 84 24 7.9% 5.8% 80 - 84 44 14.6% 15.5%85 + 24 7.9% 9.3% 85 + 12 4.0% 3.4% 85 + 36 11.9% 12.7%
Total 172 57.0% 60.7% Total 130 43.0% 39.3% Total 302 100.0% 100.0%
MALE TOTAL
WISCONSIN PUBLIC EMPLOYERSMember Census Grid - Medicare
December 2006
FEMALE
Membership Distribution
0.0%
5.0%
10.0%
15.0%
20.0%
25.0%
30.0%
< 40 40 - 44 45 - 49 50 - 54 55 - 59 60 - 64 65 - 69 70 - 74 75 - 79 80 - 84 85 +
WPE Medicare Benchmark

4
Wisconsin Public Employers Group Demographics
Wisconsin Enrollment The Wisconsin Enrollment map in Exhibit 4-C visually shows how the membership for the Standard and SMP plans are dispersed throughout Wisconsin. The map shows enrollment on December 1, 2006. Each of the dots represents one address. Exhibit 4-D shows the same information numerically.
75% of the Standard Plan participants live within Wisconsin. The Standard Plan population is spread out among 25 counties in Wisconsin with 8% of the population living in Milwaukee County, 7% in Barron County, 6% in Dane County and 6% in Sheboygan County.
The SMP Plan membership in comparison is entirely within Wisconsin and in the more rural areas with a majority of the population in the north central region. For the SMP Plan 92% of plan participants live a 4 county area including Price, Marathon, Marinette, and Portage counties. In 2007 the SMP Plan will only be available in 12 counties down from the current 27 county region. As of January 2007, this change has resulted in a membership reduction from the current 194 members to 48 members.

Wisconsin Public Employers
Wisconsin Membership Locations - December 2006
StandardSMP
30 miles
Exhibit 4-C

Exhibit 4-D
County# of
Members% of
Members# of
Members% of
Members County# of
Members% of
Members# of
Members% of
Members County# of
Members% of
Members# of
Members% of
Members
ADAMS 0 0.0% 0 0.0% IRON 0 0.0% 0 0.0% PRICE 1 0.8% 50 25.8%ASHLAND 0 0.0% 0 0.0% JACKSON 0 0.0% 0 0.0% RACINE 3 2.5% 0 0.0%BARRON 9 7.4% 0 0.0% JEFFERSON 5 4.1% 0 0.0% RICHLAND 0 0.0% 0 0.0%BAYFIELD 0 0.0% 0 0.0% JUNEAU 1 0.8% 0 0.0% ROCK 1 0.8% 0 0.0%BROWN 0 0.0% 0 0.0% KENOSHA 0 0.0% 0 0.0% RUSK 0 0.0% 0 0.0%BUFFALO 0 0.0% 0 0.0% KEWAUNEE 4 3.3% 0 0.0% SAUK 0 0.0% 0 0.0%BURNETT 0 0.0% 0 0.0% LACROSSE 0 0.0% 0 0.0% SAWYER 0 0.0% 0 0.0%CALUMET 0 0.0% 0 0.0% LAFAYETTE 0 0.0% 0 0.0% SHAWANO 0 0.0% 0 0.0%CHIPPEWA 0 0.0% 0 0.0% LANGLADE 0 0.0% 0 0.0% SHEBOYGAN 7 5.7% 0 0.0%CLARK 0 0.0% 0 0.0% LINCOLN 0 0.0% 2 1.0% ST CROIX 0 0.0% 0 0.0%COLUMBIA 2 1.6% 0 0.0% MANITOWOC 0 0.0% 0 0.0% TAYLOR 0 0.0% 4 2.1%CRAWFORD 0 0.0% 0 0.0% MARATHON 0 0.0% 44 22.7% TREMPEALEAU 1 0.8% 0 0.0%DANE 7 5.7% 0 0.0% MARINETTE 0 0.0% 45 23.2% VERNON 0 0.0% 0 0.0%DODGE 4 3.3% 0 0.0% MARQUETTE 6 4.9% 0 0.0% VILAS 5 4.1% 6 3.1%DOOR 5 4.1% 0 0.0% MENOMINEE 0 0.0% 0 0.0% WALWORTH 5 4.1% 0 0.0%DOUGLAS 0 0.0% 0 0.0% MILWAUKEE 10 8.2% 0 0.0% WASHBURN 0 0.0% 0 0.0%DUNN 1 0.8% 0 0.0% MONROE 0 0.0% 0 0.0% WASHINGTON 0 0.0% 0 0.0%EAU CLAIRE 1 0.8% 0 0.0% OCONTO 0 0.0% 0 0.0% WAUKESHA 3 2.5% 0 0.0%FLORENCE 0 0.0% 0 0.0% ONEIDA 3 2.5% 0 0.0% WAUPACA 0 0.0% 0 0.0%FOND DU LAC 0 0.0% 0 0.0% OUTAGAMIE 0 0.0% 0 0.0% WAUSHARA 1 0.8% 0 0.0%FOREST 0 0.0% 0 0.0% OZAUKEE 3 2.5% 0 0.0% WINNEBAGO 0 0.0% 0 0.0%GRANT 0 0.0% 0 0.0% PEPIN 0 0.0% 0 0.0% WOOD 0 0.0% 4 2.1%GREEN 0 0.0% 0 0.0% PIERCE 0 0.0% 0 0.0% OUT OF STATE 30 24.6% 0 0.0%GREEN LAKE 2 1.6% 0 0.0% POLK 0 0.0% 0 0.0%IOWA 0 0.0% 0 0.0% PORTAGE 2 1.6% 39 20.1% Totals 122 100.0% 194 100.0%
WISCONSIN PUBLIC EMPLOYERSEnrollment By County
December 2006
STANDARD SMP STANDARD SMP STANDARD SMP


5
Wisconsin Public Employers
Group Demographics
Out of State Enrollment The United States Enrollment Map in Exhibit 5-C visually depicts how the enrollment in the Standard and SMP plans is spread throughout the United States. The out of state enrollment is based on the member’s address as of December 2006 and could change as members relocate. The map displays the number of Standard and SMP plan members living in each state along with a shading scheme in which higher population areas are represented with increasingly darker shading. Exhibit 5-D shows the same information numerically.
The Standard Plan has 24.6% of the population living outside the state of Wisconsin with the membership dispersed over 12 states. 70% of the out of state membership lives in the sunbelt.
The SMP Plan in comparison has does not have members residing outside of Wisconsin.
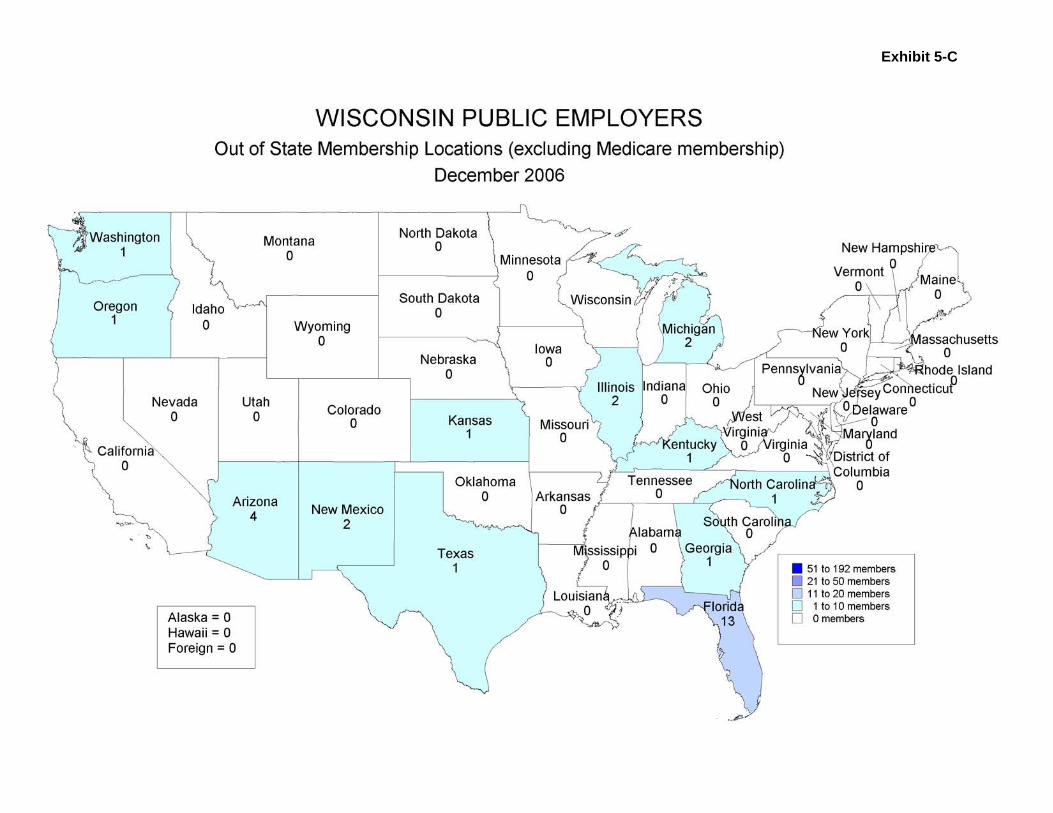
Exhibit 5-C
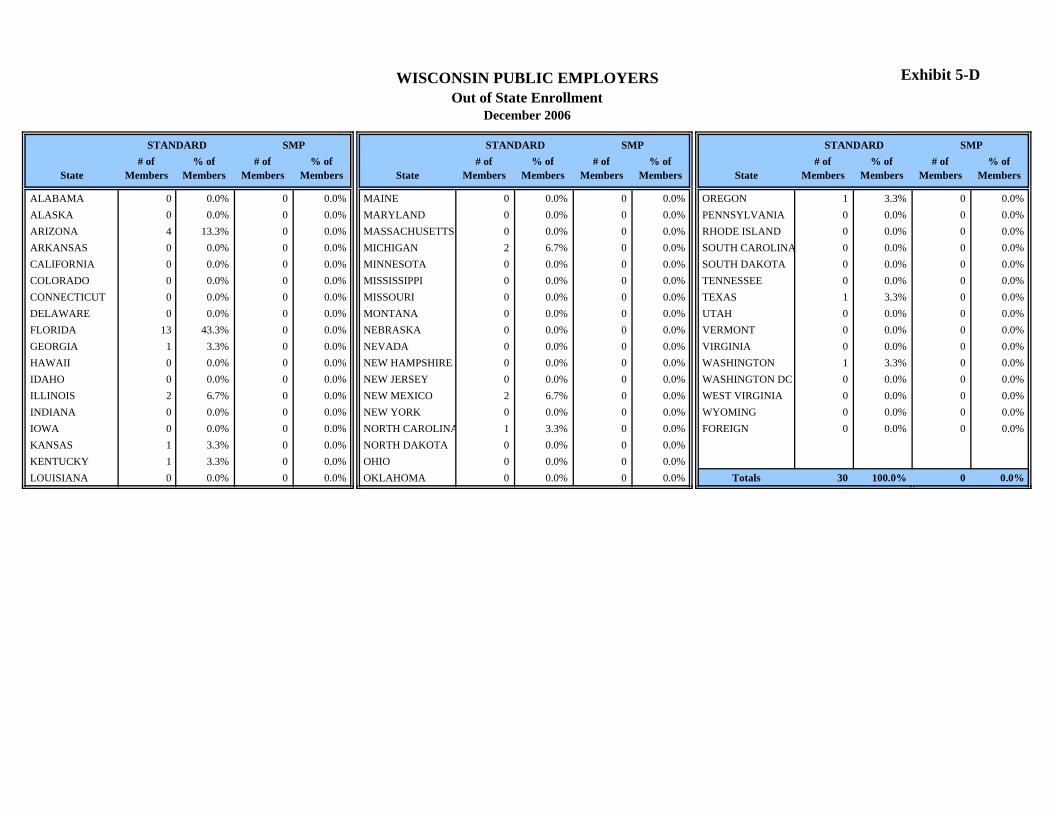
Exhibit 5-D
State# of
Members% of
Members# of
Members% of
Members State# of
Members% of
Members# of
Members% of
Members State# of
Members% of
Members# of
Members% of
Members
ALABAMA 0 0.0% 0 0.0% MAINE 0 0.0% 0 0.0% OREGON 1 3.3% 0 0.0%ALASKA 0 0.0% 0 0.0% MARYLAND 0 0.0% 0 0.0% PENNSYLVANIA 0 0.0% 0 0.0%ARIZONA 4 13.3% 0 0.0% MASSACHUSETTS 0 0.0% 0 0.0% RHODE ISLAND 0 0.0% 0 0.0%ARKANSAS 0 0.0% 0 0.0% MICHIGAN 2 6.7% 0 0.0% SOUTH CAROLINA 0 0.0% 0 0.0%CALIFORNIA 0 0.0% 0 0.0% MINNESOTA 0 0.0% 0 0.0% SOUTH DAKOTA 0 0.0% 0 0.0%COLORADO 0 0.0% 0 0.0% MISSISSIPPI 0 0.0% 0 0.0% TENNESSEE 0 0.0% 0 0.0%CONNECTICUT 0 0.0% 0 0.0% MISSOURI 0 0.0% 0 0.0% TEXAS 1 3.3% 0 0.0%DELAWARE 0 0.0% 0 0.0% MONTANA 0 0.0% 0 0.0% UTAH 0 0.0% 0 0.0%FLORIDA 13 43.3% 0 0.0% NEBRASKA 0 0.0% 0 0.0% VERMONT 0 0.0% 0 0.0%GEORGIA 1 3.3% 0 0.0% NEVADA 0 0.0% 0 0.0% VIRGINIA 0 0.0% 0 0.0%HAWAII 0 0.0% 0 0.0% NEW HAMPSHIRE 0 0.0% 0 0.0% WASHINGTON 1 3.3% 0 0.0%IDAHO 0 0.0% 0 0.0% NEW JERSEY 0 0.0% 0 0.0% WASHINGTON DC 0 0.0% 0 0.0%ILLINOIS 2 6.7% 0 0.0% NEW MEXICO 2 6.7% 0 0.0% WEST VIRGINIA 0 0.0% 0 0.0%INDIANA 0 0.0% 0 0.0% NEW YORK 0 0.0% 0 0.0% WYOMING 0 0.0% 0 0.0%IOWA 0 0.0% 0 0.0% NORTH CAROLINA 1 3.3% 0 0.0% FOREIGN 0 0.0% 0 0.0%KANSAS 1 3.3% 0 0.0% NORTH DAKOTA 0 0.0% 0 0.0%KENTUCKY 1 3.3% 0 0.0% OHIO 0 0.0% 0 0.0%LOUISIANA 0 0.0% 0 0.0% OKLAHOMA 0 0.0% 0 0.0% Totals 30 100.0% 0 0.0%
WISCONSIN PUBLIC EMPLOYERSOut of State Enrollment
December 2006
STANDARD SMP STANDARD SMP STANDARD SMP


6
Wisconsin Public Employers Plan Utilization
Paid Per Member Per Month Costs The Paid Medical and Drug PMPM report in Exhibit 6-C displays the average amount paid per member each month for the Standard, SMP and Medicare Carve-out Plans incurred from January 2006 through December 2006. The PMPM costs for each plan represent medical and drug claims paid through the end of March 2007. The Paid Medical PMPM report in exhibit 6-D is similar except it excludes drugs and includes data from Blue Cross Blue Shield going back to January 2005, completed through December 2006. WPS has used the Blue Cross Blue Shield data as given and cannot verify its accuracy.
The Standard Plan has seen a 31.5% increase in medical claim costs between 2005 and 2006. Independent trend estimates for medical claims for 2006 were 10-12% thus the Standard Plan ran above expected. A majority of the variance to expected can be explained by 2 large claims that are equivalent to 34.5% of the total claims for the plan. If these outlier claims are not included in the calculation, the medical trend from 2005 to 2006 would have been -14% and therefore well below the expected range. The small population of the Standard Plan leads to instability in the monthly claim results, however the larger spikes in claims are generally due to large claim activity that occurred in those months.
The SMP Plan has seen a decrease in claims over the last year. The Medical Only PMPM was the highest in the fourth quarter of 2005 at $584.61 but is averaging $291.33 in 2006. The year over year medical PMPM trend was -40%. Since the beginning of 2006, the SMP Plan experience has been fairly stable with a spike in claims in September.
The Medicare Carve-out Plan has seen stable results over the last 2 years. We would expect this population to have stable results since Medicare is the primary payer. The year over year medical PMPM trend from 2005 to 2006 was 11.3%. We would expect an increase in the medical claims each year due to the benefit changes Medicare makes annually and medical cost trend.

Exhibit 6-C
Note: Paid claims include prescription drugs (except Dean Medicare Part D drugs) and injectables
WISCONSIN PUBLIC EMPLOYERSPaid Medical and Drug PMPM
Paid Through March 2007
$0
$200
$400
$600
$800
$1,000
$1,200
$1,400
$1,600
$1,800
$2,000
Incurred Month
PMPM
Standard $1,564.18 $1,874.34 $839.39 $822.10 $658.63 $377.34 $590.50 $487.43 $340.66 $496.14 $885.09 $519.97
SMP $372.50 $320.74 $322.11 $264.02 $308.20 $367.17 $319.25 $292.66 $632.75 $417.71 $282.02 $358.47
Medicare $160.68 $127.40 $178.01 $110.61 $168.46 $141.89 $115.83 $133.86 $131.53 $154.48 $134.59 $141.50
Jan 2006 Feb 2006 Mar 2006 Apr 2006 May 2006 Jun 2006 Jul 2006 Aug 2006 Sep 2006 Oct 2006 Nov 2006 Dec 2006

Exhibit 6-D
Jan 05 Feb 05 Mar 05 Apr 05 May 05 Jun 05 Jul 05 Aug 05 Sep 05 Oct 05 Nov 05 Dec 05 Jan 06 Feb 06 Mar 06 Apr 06 May 06 Jun 06 Jul 06 Aug 06 Sep 06 Oct 06 Nov 06 Dec 06
Standard $313.75 $564.05 $502.91 $288.40 $491.25 $693.17 $405.65 $454.37 $598.54 $384.38 $910.45 $559.07 $1,400.93 $1,773.94 $720.95 $707.53 $549.07 $267.13 $477.72 $383.65 $229.90 $408.11 $808.48 $425.93
SMP $403.20 $184.21 $512.42 $189.22 $791.69 $267.38 $212.23 $828.26 $622.87 $576.37 $706.40 $472.33 $321.54 $252.75 $250.86 $211.71 $247.96 $299.88 $256.06 $234.48 $575.95 $339.95 $215.80 $294.98
Medicare $155.45 $106.16 $129.79 $149.84 $128.77 $101.80 $94.59 $98.30 $116.76 $143.03 $159.97 $134.70 $157.29 $126.34 $177.07 $109.63 $167.50 $141.09 $114.49 $132.98 $131.53 $154.48 $134.59 $141.50
WISCONSIN PUBLIC EMPLOYERSPaid Medical PMPM
Paid Through March 2007
INCURRED MONTH
$0
$200
$400
$600
$800
$1,000
$1,200
$1,400
$1,600
$1,800
$2,000
Jan 05 Feb 05 Mar 05 Apr 05 May 05 Jun 05 Jul 05 Aug 05 Sep 05 Oct 05 Nov 05 Dec 05 Jan 06 Feb 06 Mar 06 Apr 06 May 06 Jun 06 Jul 06 Aug 06 Sep 06 Oct 06 Nov 06 Dec 06
Standard SMP Medicare


7a
Wisconsin Public Employers Plan Utilization
PMPM by Type of Service Reports The Total PMPM by Type of Service reports (7-F and 7-H) provide a breakdown of the PMPM by major type of service compared to the benchmark. The pie chart also provides an overview of the percentage of the PMPM each major type of service is contributing to the total PMPM plus a comparison to the benchmark. The total PMPM costs are for claims incurred January 2006 – December 2006 and paid through the end of March 2007. The Paid PMPM by Type of Service reports (7-G, 7-I and 7-J) show the same actual data on a month by month basis for 2006.
Standard Plan
The Standard Plan in Exhibit 7-F shows that the percentage breakdown by major type of service is different than the benchmark. The drug and facility inpatient costs make up a larger percent of the total costs while the physician and facility outpatient costs make up less. The total PMPM cost is 48.1% above the benchmark. The inpatient facility PMPM cost is 67.8% above the benchmark and outpatient facility is 20.0% above the benchmark. The Standard Plan did experience higher than expected large claim activity which is directly correlated with inpatient charges. The physician PMPM cost is 6.0% above the benchmark. The drug paid PMPM cost is 134.3% above the benchmark and driven by injectable drug costs. Lastly the other services category is 49.7% over the norm. Every $1.00 PMPM represented in the graph is equivalent to $1,273 in annual plan costs for the Standard plan.
Exhibit 7-G shows the Standard Plan’s paid PMPM costs on a monthly basis for 2006.
SMP Plan
Exhibit 7-H shows the percentage breakdown by type of service for the SMP Plan is slightly different than the benchmark. The healthier population in the SMP Plan results in facility charges being a smaller percentage of total costs and physician charges being a larger percentage of the total. The total PMPM cost is in line with the benchmark. The inpatient facility PMPM cost is 28.0% below the norm and outpatient facility is 3.4% below the norm. Physician charges however were 17.3% above the benchmark for 2006. This was influenced by the SMP’s rich benefit design, contributing not only to higher utilization but higher plan costs due to low

7b
member cost sharing. The drug PMPM is in line with the norm, being only 5.3% higher. The other services category is 6.9% below the norm.
Exhibit 7-I shows the SMP Plan’s paid PMPM costs on a monthly basis for 2006.
Medicare Carve-out Plan
The Medicare Carve-out Plan in Exhibit 7-J averaged a total of $141.62 PMPM in 2006. The medical segment of the Medicare plan averaged $37.97 PMPM for inpatient facility, $33.79 PMPM for outpatient facility, $39.70 PMPM for physician, and $23.64 PMPM for other services. All of the medical segments had nearly flat line results over the calendar year. The drug segment of the Medicare Carve-out Plan averaged only $6.65 PMPM or 4.7% of the total payments. Over the calendar year the drug costs had a downward trend.

Exhibit 7-F
Actual Benchmark $ %Facility Inpatient $193.63 $115.41 $78.22 67.8%Facility Outpatient $144.45 $120.33 $24.12 20.0%Physician $174.92 $164.99 $9.93 6.0%Drugs $216.78 $92.51 $124.27 134.3%Other Services $51.31 $34.27 $17.04 49.7%
Totals $781.09 $527.51 $253.58 48.1%
Note: Drugs include prescriptions and injectablesNote: Benchmark data has been age/sex adjusted to correspond to the population included in this exhibit* Each $1.00 paid PMPM = $1,273 in plan costs.
WISCONSIN PUBLIC EMPLOYERSTotal PMPM by Type of Service - Standard
Incurred January 2006 - December 2006 Paid Through March 2007
Difference
Actual PMPM
Facility Inpatient25%
Physician22%
Drugs28%
Other Services7%
Facility Outpatient18%
Benchmark PMPM
Facility Inpatient22%
Facility Outpatient23%
Physician31%
Drugs18%
Other Services6%
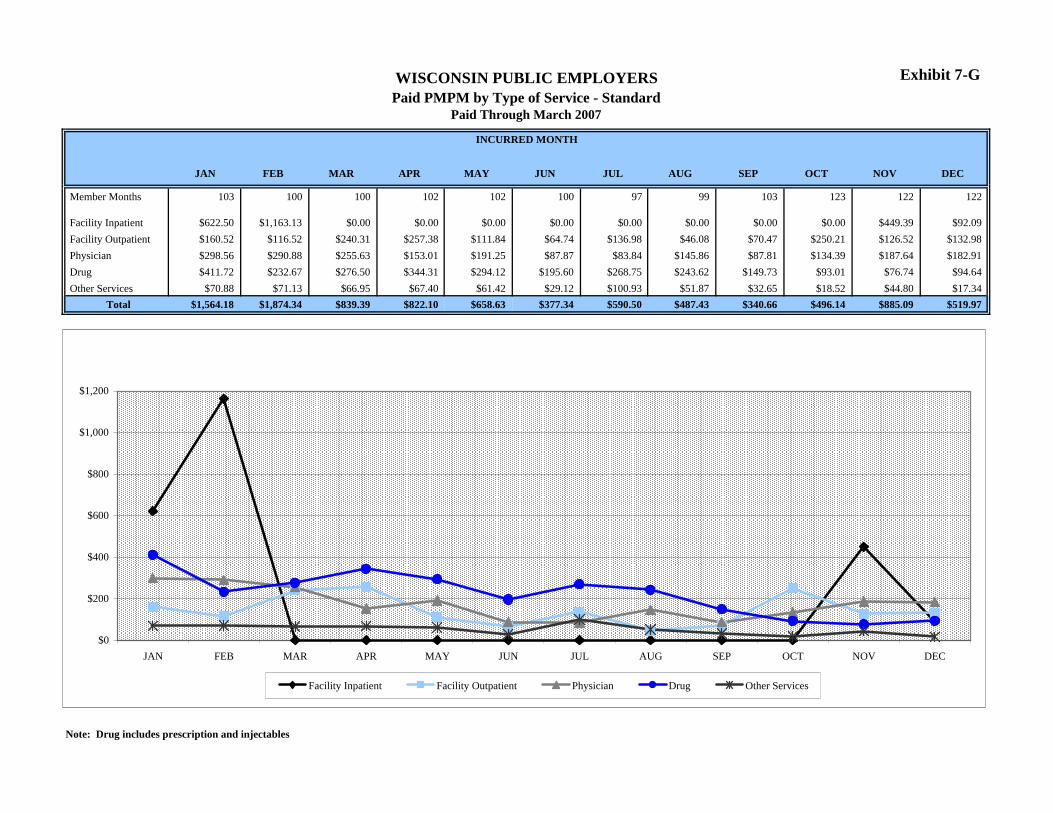
Exhibit 7-G
JAN FEB MAR APR MAY JUN JUL AUG SEP OCT NOV DEC
Member Months 103 100 100 102 102 100 97 99 103 123 122 122
Facility Inpatient $622.50 $1,163.13 $0.00 $0.00 $0.00 $0.00 $0.00 $0.00 $0.00 $0.00 $449.39 $92.09Facility Outpatient $160.52 $116.52 $240.31 $257.38 $111.84 $64.74 $136.98 $46.08 $70.47 $250.21 $126.52 $132.98Physician $298.56 $290.88 $255.63 $153.01 $191.25 $87.87 $83.84 $145.86 $87.81 $134.39 $187.64 $182.91Drug $411.72 $232.67 $276.50 $344.31 $294.12 $195.60 $268.75 $243.62 $149.73 $93.01 $76.74 $94.64Other Services $70.88 $71.13 $66.95 $67.40 $61.42 $29.12 $100.93 $51.87 $32.65 $18.52 $44.80 $17.34
Total $1,564.18 $1,874.34 $839.39 $822.10 $658.63 $377.34 $590.50 $487.43 $340.66 $496.14 $885.09 $519.97
Note: Drug includes prescription and injectables
INCURRED MONTH
WISCONSIN PUBLIC EMPLOYERSPaid PMPM by Type of Service - Standard
Paid Through March 2007
$0
$200
$400
$600
$800
$1,000
$1,200
JAN FEB MAR APR MAY JUN JUL AUG SEP OCT NOV DEC
Facility Inpatient Facility Outpatient Physician Drug Other Services

Exhibit 7-H
Actual Benchmark $ %Facility Inpatient $52.38 $72.77 -$20.39 -28.0%Facility Outpatient $78.45 $81.23 -$2.78 -3.4%Physician $132.91 $113.35 $19.56 17.3%Drugs $63.22 $60.04 $3.18 5.3%Other Services $27.28 $29.29 -$2.01 -6.9%
Totals $354.24 $356.68 -$2.44 -0.7%
Note: Drugs include prescriptions and injectablesNote: Benchmark data has been age/sex adjusted to correspond to the population included in this exhibit* Each $1.00 paid PMPM = $2,407 in plan costs.
WISCONSIN PUBLIC EMPLOYERSTotal PMPM by Type of Service - SMP
Incurred January 2006 - December 2006 Paid Through March 2007
Difference
Actual PMPM
Facility Inpatient15%
Physician37%
Drugs18%
Other Services8%
Facility Outpatient22%
Benchmark PMPM
Facility Inpatient20%
Facility Outpatient23%
Physician32%
Drugs17%
Other Services8%

Exhibit 7-I
JAN FEB MAR APR MAY JUN JUL AUG SEP OCT NOV DEC
Member Months 205 205 200 204 204 203 202 199 197 198 196 194
Facility Inpatient $0.00 $24.69 $53.17 $49.64 $0.00 $95.99 $47.19 $0.00 $272.25 $0.00 $51.75 $38.43Facility Outpatient $156.15 $103.90 $72.97 $48.29 $57.93 $38.35 $57.09 $84.56 $65.92 $134.85 $37.21 $83.18Physician $135.34 $108.22 $102.38 $89.60 $166.00 $141.53 $132.14 $113.06 $203.78 $174.76 $92.46 $137.05Drug $50.96 $67.99 $71.29 $52.30 $60.25 $67.44 $63.19 $58.18 $60.14 $77.77 $66.22 $63.49Other Services $30.05 $15.93 $22.30 $24.18 $24.03 $23.86 $19.63 $36.85 $30.65 $30.34 $34.38 $36.32
Total $372.50 $320.74 $322.11 $264.02 $308.20 $367.17 $319.25 $292.66 $632.75 $417.71 $282.02 $358.47
Note: Drug includes prescription and injectables
INCURRED MONTH
WISCONSIN PUBLIC EMPLOYERSPaid PMPM by Type of Service - SMP
Paid Through March 2007
$0
$50
$100
$150
$200
$250
$300
JAN FEB MAR APR MAY JUN JUL AUG SEP OCT NOV DEC
Facility Inpatient Facility Outpatient Physician Drug Other Services

Exhibit 7-J
JAN FEB MAR APR MAY JUN JUL AUG SEP OCT NOV DEC
Member Months 315 312 308 308 307 305 303 306 306 304 303 302
Facility Inpatient $36.27 $27.08 $48.68 $17.26 $32.56 $37.07 $42.97 $48.91 $31.11 $39.93 $44.49 $49.25Facility Outpatient $22.67 $35.94 $45.34 $41.25 $42.41 $42.71 $19.45 $24.60 $32.08 $37.99 $30.80 $30.28Physician $40.56 $39.99 $53.02 $30.89 $40.99 $40.42 $26.05 $39.75 $35.29 $57.32 $31.87 $40.28Drug $19.33 $8.20 $8.90 $6.30 $14.26 $6.50 $5.50 $5.14 $1.89 $1.36 $1.79 $0.67Other Services $41.84 $16.19 $22.07 $14.91 $38.25 $15.21 $21.86 $15.46 $31.16 $17.88 $25.65 $21.01
Total $160.68 $127.40 $178.01 $110.61 $168.46 $141.89 $115.83 $133.86 $131.53 $154.48 $134.59 $141.50
Note: Drug includes prescription (except Dean Medicare Part D drugs) and injectables
INCURRED MONTH
WISCONSIN PUBLIC EMPLOYERSPaid PMPM by Type of Service - Medicare
Paid Through March 2007
$0
$50
$100
$150
$200
$250
$300
JAN FEB MAR APR MAY JUN JUL AUG SEP OCT NOV DEC
Facility Inpatient Facility Outpatient Physician Drug Other Services


8a
Wisconsin Public Employers Plan Utilization
Type of Service Detail The Type of Service Detail report provides an overview of paid medical costs on a PMPM basis divided into 5 major service categories and further divided into 26 subcategories. The Actual PMPM costs are compared to the Benchmark PMPM to help determine where the plan is experiencing higher than normal claim costs. The comparison to the Benchmark is displayed as a PMPM difference and as a percentage difference. The Actual PMPM costs are for claims incurred January 2006 – December 2006 and paid through the end of March 2007.
Standard Plan
The Standard Plan in Exhibit 8-C was 48.1% above the benchmark in 2006. The variance to the benchmark is primarily a result of the anti-selection resulting from the dual choice open enrollment and the rich benefit design. Since the percentage comparison can be deceiving, it is more important to look at the PMPM difference with $1.00 PMPM being equivalent to $1,273 in annual plan costs. Below are some areas that stand out relative to the benchmark and some analysis on what is driving the higher costs.
• Facility Inpatient – The majority of dollars here are for surgical/medical services. Within surgical/medical, $76.07 PMPM is due to 2 large claimants. Another $21.59 PMPM is due to gastric bypass procedures not included in the norm.
• Facility Outpatient – Higher than expected costs in this category are reflective of the relative morbidity of the Standard Plan’s population. Greater use of diagnostic services such as CT scans and MRIs has lead to cost variances versus the norm for outpatient radiology. Lastly the Other sub-category is $17.73 PMPM above the benchmark.
• Physician – Gastric bypass procedures have added $8.29 to the Paid PMPM cost. Costs for these are not accounted for in the benchmark.
• Drug – The prescription drug costs are higher than the Benchmark. The prescription drug cost is 33.8% above the norm however injectable drug costs are 797.2% above the norm. The injectable drug costs are driven by one large claimant who contributed 85% of the costs. Specialty drugs can have exceptionally high mark-ups when provided in a physician’s office. Certain drugs are often less costly to the plan if provided through the PBM. Select drugs can be self-injected by the patient in their own home, which is often viewed positively by the member. Taking a proactive approach, contract/benefit language should be reviewed so specialty drugs can be most effectively managed in the future.

8b
• Other services – The other services category is $17.04 PMPM above the benchmark. The major contributor to the variance is the Therapy sub-category which is $7.00 PMPM above the benchmark.
SMP Plan
The SMP Plan in Exhibit 8-D by comparison is in line with the benchmark for 2006. For the plan $1.00 PMPM represented in the chart is equivalent to $2,407 in annual plan costs.
• Inpatient/Outpatient Facility – Overall both of these categories are running below the norm which is a function of the better risks enrolled in the SMP Plan.
• Physician – The Office Visit and Pathology sub-categories are all running well above the norm. It appears these services are mostly subject to higher than expected utilization due to the rich benefits. Claim costs for these services correlate with each other. If the plan is having higher office visit utilization, it would be expected to have higher usage of office diagnostic testing.
• Drug – The prescription drug PMPM cost is running 20.7% above the norm and the injectable drug costs are running 96.3% below norm. Overall the drug cost is in higher than total plan performance for 2006.
• Other Services – The Chiropractic sub-category is $5.41 PMPM above the norm which is a function of the region in which the SMP population resides. In the north central region, chiropractic care is more commonly used to treat back problems in comparison to other areas of the state.

Exhibit 8-C
ACTUAL BENCHMARKTYPE OF SERVICE DETAIL PMPM PMPM $ %
FACILITY INPATIENT SURGICAL/MEDICAL $193.63 $111.46 $82.17 73.7%PSYCH/AODA $0.00 $1.79 -$1.79 -100.0%MATERNITY $0.00 $0.91 -$0.91 -100.0%OTHER $0.00 $1.25 -$1.25 -100.0%
Subtotal $193.63 $115.41 $78.22 67.8%FACILITY OUTPATIENT SURGICAL/MEDICAL $19.83 $23.31 -$3.48 -14.9%
RADIOLOGY $40.42 $33.44 $6.98 20.9%PATHOLOGY $13.78 $12.29 $1.49 12.1%EMERGENCY ROOM $5.18 $3.37 $1.81 53.7%PSYCH/AODA $0.50 $0.91 -$0.41 -45.1%OTHER $64.74 $47.01 $17.73 37.7%
Subtotal $144.45 $120.33 $24.12 20.0%PHYSICIAN OFFICE VISIT $17.69 $21.27 -$3.58 -16.8%
RADIOLOGY $42.61 $29.55 $13.06 44.2%PATHOLOGY $21.95 $20.69 $1.26 6.1%SURGERY $50.40 $51.63 -$1.23 -2.4%ANESTHESIA $10.48 $10.80 -$0.32 -3.0%MATERNITY $0.00 $0.45 -$0.45 -100.0%OTHER $31.79 $30.60 $1.19 3.9%
Subtotal $174.92 $164.99 $9.93 6.0%DRUGS PRESCRIPTIONS $107.50 $80.33 $27.17 33.8%
INJECTABLES $109.28 $12.18 $97.10 797.2%Subtotal $216.78 $92.51 $124.27 134.3%
OTHER SERVICES PSYCH/AODA $8.80 $5.22 $3.58 68.6%CHIROPRACTIC $4.17 $4.41 -$0.24 -5.4%THERAPIES $10.79 $3.79 $7.00 184.7%AMBULANCE $0.92 $1.58 -$0.66 -41.8%WELL BABY EXAM $0.00 $0.00 $0.00 0.0%DURABLE MEDICAL EQUIPMENT $4.56 $5.54 -$0.98 -17.7%OTHER $22.07 $13.73 $8.34 60.7%
Subtotal $51.31 $34.27 $17.04 49.7%Grand Total $781.09 $527.51 $253.58 48.1%
Note: Benchmark data has been age/sex adjusted to correspond to the population included in this exhibit* Each $1.00 paid PMPM = $1,273 in plan costs.
WISCONSIN PUBLIC EMPLOYERSType of Service Detail - Standard
Incurred January 2006 - December 2006 Paid Through March 2007
DIFFERENCE

Exhibit 8-D
ACTUAL BENCHMARKTYPE OF SERVICE DETAIL PMPM PMPM $ %
FACILITY INPATIENT SURGICAL/MEDICAL $42.10 $66.20 -$24.10 -36.4%PSYCH/AODA $7.31 $1.90 $5.41 284.7%MATERNITY $2.97 $3.96 -$0.99 -25.0%OTHER $0.00 $0.71 -$0.71 -100.0%
Subtotal $52.38 $72.77 -$20.39 -28.0%FACILITY OUTPATIENT SURGICAL/MEDICAL $17.90 $15.97 $1.93 12.1%
RADIOLOGY $29.57 $21.75 $7.82 36.0%PATHOLOGY $8.11 $7.99 $0.12 1.5%EMERGENCY ROOM $3.78 $2.91 $0.87 29.9%PSYCH/AODA $0.58 $1.02 -$0.44 -43.1%OTHER $18.51 $31.59 -$13.08 -41.4%
Subtotal $78.45 $81.23 -$2.78 -3.4%PHYSICIAN OFFICE VISIT $22.40 $15.46 $6.94 44.9%
RADIOLOGY $18.73 $19.47 -$0.74 -3.8%PATHOLOGY $23.14 $14.40 $8.74 60.7%SURGERY $36.84 $34.00 $2.84 8.4%ANESTHESIA $6.75 $7.37 -$0.62 -8.4%MATERNITY $1.72 $2.04 -$0.32 -15.7%OTHER $23.33 $20.61 $2.72 13.2%
Subtotal $132.91 $113.35 $19.56 17.3%DRUGS PRESCRIPTIONS $62.93 $52.14 $10.79 20.7%
INJECTABLES $0.29 $7.90 -$7.61 -96.3%Subtotal $63.22 $60.04 $3.18 5.3%
OTHER SERVICES PSYCH/AODA $3.17 $5.90 -$2.73 -46.3%CHIROPRACTIC $9.00 $3.59 $5.41 150.7%THERAPIES $1.48 $2.85 -$1.37 -48.1%AMBULANCE $0.52 $1.12 -$0.60 -53.6%WELL BABY EXAM $0.29 $0.37 -$0.08 -21.6%DURABLE MEDICAL EQUIPMENT $2.02 $3.80 -$1.78 -46.8%OTHER $10.80 $11.66 -$0.86 -7.4%
Subtotal $27.28 $29.29 -$2.01 -6.9%Grand Total $354.24 $356.68 -$2.44 -0.7%
Note: Benchmark data has been age/sex adjusted to correspond to the population included in this exhibit* Each $1.00 paid PMPM = $2,407 in plan costs.
WISCONSIN PUBLIC EMPLOYERSType of Service Detail - SMP
Incurred January 2006 - December 2006 Paid Through March 2007
DIFFERENCE

9a
Wisconsin Public Employers Plan Utilization
Inpatient Utilization, Days/1000 and Average Length of Stay The Inpatient Utilization reports compare annual inpatient days per 1,000, admits per 1,000, average length of stay, cost per day, cost per admit, and inpatient PMPM costs to the Benchmark for the 5 major inpatient service categories. Days/1000 is the annual average number of hospital days utilized by a population of 1,000 members which is calculated by taking (Total Days/Member Months)*12000. The Admits/1000 is the annual number of admits that occur within a typical population of 1,000 members which is calculated by taking (Total Admits/Member Months)*12000. The Days/1000 and Admits/1000 are calculations that allow a comparison of one population to another regardless of group size. Average Length of Stay (ALOS) shows the average length of hospitalization experienced for the entire group (Total Days/Total Admits). Cost per Day is an average of the cost per hospital day (Total Cost/Total Days). The cost per admit is an average of the cost per hospital admission (Total Cost/Total Admits). Lastly the inpatient PMPM is the per member per month cost incurred by the plan. Beyond the numerical comparison, a percentage has been included as observed in the pie charts, including a comparison to the benchmark.
Standard Plan
The totals for the Standard Plan in Exhibit 9-E exceed the benchmark in admits per 1,000, cost per day, and cost per admit. The Medical category exceeds the benchmark in all statistics. The Surgical category exceeds the benchmark in most statistics with one large claimant being a contributing factor. Without this claimant the surgical category would be at or below the benchmark.
The Standard Plan had an average of 377 days per 1000 members over the course of 2006. The monthly results shown in exhibit 9-G are very volatile with inpatient stays occurring only at the beginning and end of the year. The plan was generally below the demographically adjusted benchmark average of 400 days per 1000 members.
The Monthly Average Length of Stay for the Standard Plan is shown in Exhibit 9-H. For the year the average was 4.00 days compared to a benchmark of 4.88.

9b
SMP
The SMP Plan in Exhibit 9-F is below the benchmark in total for most inpatient utilization statistics. The Psychiatric/AODA category exceeds the benchmark in most statistics which is driven by high utilization.
The SMP Plan had an average of 165 days per 1000 members over the course of 2006. The SMP plan performed much better than our benchmark of 278 days per 1000 overall and only exceeded the benchmark in the months of September and November. Exhibit 9-G shows the monthly variations in inpatient days per 1000.
The Monthly Average Length of Stay for the SMP Plan is shown in Exhibit 9-H. For the year the average was 2.75 days, which is below the benchmark of 4.03.

Exhibit 9-E
Medical SurgicalPsych / AODA Maternity Other Total Medical Surgical
Psych / AODA Maternity Other Total
Days/1000 273 104 0 0 0 377 Days/1000 206 129 21 6 38 400Admits/1000 66 28 0 0 0 94 Admits/1000 50 24 4 3 1 82ALOS 4.14 3.67 0.00 0.00 0.00 4.00 ALOS 4.12 5.38 5.25 2.00 38.00 4.88Cost/Day $4,159 $11,442 $0 $0 $0 $6,162 Cost/Day $3,241 $5,617 $1,058 $1,531 $396 $3,432Cost/Admit $17,232 $41,956 $0 $0 $0 $24,649 Cost/Admit $13,677 $31,213 $5,621 $2,895 $31,412 $19,570PMPM $94.76 $98.87 $0.00 $0.00 $0.00 $193.63 PMPM $53.39 $58.07 $1.79 $0.91 $1.25 $115.41% of Paid 48.94% 51.06% 0.00% 0.00% 0.00% 100.00% % of Paid 46.26% 50.32% 1.55% 0.79% 1.08% 100.00%
Note: Benchmark data has been age/sex adjusted to correspond to the population included in this exhibit
BENCHMARK
WISCONSIN PUBLIC EMPLOYERSInpatient Utilization - Standard
Incurred January 2006 - December 2006 Paid Through March 2007
ACTUAL
% OF ADMITS FOR BENCHMARK
Medical61%
Psych / AODA5%
Maternity4%
Other1%
Surgical29%
% OF ADMITS FOR ACTUAL
Surgical30%
Medical70%

Exhibit 9-F
Medical SurgicalPsych / AODA Maternity Other Total Medical Surgical
Psych / AODA Maternity Other Total
Days/1000 50 40 55 20 0 165 Days/1000 126 79 23 29 21 278Admits/1000 25 20 10 5 0 60 Admits/1000 36 17 4 12 0 69ALOS 2.00 2.00 5.50 4.00 0.00 2.75 ALOS 3.50 4.65 5.75 2.42 60.00 4.03Cost/Day $2,582 $9,438 $1,600 $1,788 $0 $3,820 Cost/Day $3,038 $5,266 $1,058 $1,531 $396 $3,050Cost/Admit $5,164 $18,875 $8,800 $7,151 $0 $10,506 Cost/Admit $10,820 $24,691 $5,919 $3,704 $26,057 $12,209PMPM $10.73 $31.37 $7.31 $2.97 $0.00 $52.38 PMPM $31.71 $34.49 $1.90 $3.96 $0.71 $72.77% of Paid 20.48% 59.89% 13.96% 5.67% 0.00% 100.00% % of Paid 43.58% 47.40% 2.61% 5.44% 0.98% 100.00%
Note: Benchmark data has been age/sex adjusted to correspond to the population included in this exhibit
BENCHMARK
WISCONSIN PUBLIC EMPLOYERSInpatient Utilization - SMP
Incurred January 2006 - December 2006 Paid Through March 2007
ACTUAL
% OF ADMITS FOR BENCHMARK
Medical52%
Psych / AODA6%
Maternity17%
Other0%
Surgical25%
% OF ADMITS FOR ACTUAL
Surgical33%
Other0%Maternity
8%
Psych / AODA17% Medical
42%

Exhibit 9-G
Note: Benchmark data has been age/sex adjusted to correspond to the population included in this exhibit
WISCONSIN PUBLIC EMPLOYERSMonthly Inpatient Days/1000
Paid Through March 2007
Standard
0
200
400
600
800
1000
1200
1400
1600
1800
JAN FEB MAR APR MAY JUN JUL AUG SEP OCT NOV DEC
Incurred Month
ACTUAL BENCHMARK
SMP
0
100
200
300
400
500
600
700
800
JAN FEB MAR APR MAY JUN JUL AUG SEP OCT NOV DEC
Incurred Month
ACTUAL BENCHMARK

Exhibit 9-H
Note: Benchmark data has been age/sex adjusted to correspond to the population included in this exhibit
WISCONSIN PUBLIC EMPLOYERSMonthly Inpatient Average Length of Stay
Paid Through March 2007
Standard
0
1
2
3
4
5
6
7
8
JAN FEB MAR APR MAY JUN JUL AUG SEP OCT NOV DEC
Incurred Month
ACTUAL BENCHMARK
SMP
0
1
2
3
4
5
6
7
8
JAN FEB MAR APR MAY JUN JUL AUG SEP OCT NOV DEC
Incurred Month
ACTUAL BENCHMARK

10
Wisconsin Public Employers Plan Utilization
Claim Costs by Major Diagnostic Categories (MDC) The Claim Costs by Major Diagnostic Categories report divides medical claim costs into 25 mutually exclusive diagnostic categories. The diagnoses in each MDC correspond to a single organ system and, in general, are associated with a particular medical specialty. The actual PMPM costs by major diagnostic category are compared to the WPS Benchmark PMPM. The following exhibits display numerical and graphical comparisons to the benchmark data. The Actual PMPM costs are for claims incurred January 2006 – December 2006 and paid through the end of March 2007.
Prior exhibits have shown the Standard Plan exceeds the benchmark overall. Exhibits 10-E and 10-F show this deviation by MDC. Variation from the Benchmark can be the result of many different factors. Since the Benchmark is not adjusted for plan differences we can attribute some variation to non-standard benefits included in the Standard Plan. An example of this is gastric bypass procedures which contributed $29.88 PMPM to MDC 10. Without this non standard benefit, MDC 10 would actually be below the benchmark. Another reason for variances from the norm is large claim activity. This is what happened for MDC 9 where one member contributed $124.74 PMPM and MDC 8 where one member contributed $78.67 PMPM. For the standard plan $1.00 PMPM in claim costs represented in the chart is equivalent to $1,273 in annual plan costs.
The SMP Plan, shown in Exhibits 10-G and 10-H, is experiencing slightly lower than expected PMPM Cost overall. The largest variations are in MDC 13 and MDC 5 and cannot be attributed to a single factor. For the SMP plan $1.00 PMPM in claim cost represented in the charts is equivalent to $2,407 in annual plan costs.

Exhibit 10-E
MDC MAJOR DIAGNOSTIC CATEGORY ACTUAL BENCHMARK
CODE DESCRIPTION PMPM PMPM $ %
1 DISEASES AND DISORDERS OF THE NERVOUS SYSTEM $22.63 $21.40 $1.23 5.7%2 DISEASES AND DISORDERS OF THE EYE $6.28 $12.67 -$6.39 -50.4%3 DISEASES AND DISORDERS OF THE EAR, NOSE, MOUTH AND THROAT $11.73 $17.02 -$5.29 -31.1%4 DISEASES AND DISORDERS OF THE RESPIRATORY SYSTEM $44.74 $22.71 $22.03 97.0%5 DISEASES AND DISORDERS OF THE CIRCULATORY SYSTEM $104.48 $70.84 $33.64 47.5%6 DISEASES AND DISORDERS OF THE DIGESTIVE SYSTEM $43.28 $48.32 -$5.04 -10.4%7 DISEASES AND DISORDERS OF THE HEPATOBILIARY SYSTEM AND PANCREAS $11.94 $12.50 -$0.56 -4.5%8 DISEASES AND DISORDERS OF THE MUSCULOSKELETAL SYSTEM AND CONNECTIVE TISSUE $160.16 $80.33 $79.83 99.4%9 DISEASES AND DISORDERS OF THE SKIN, SUBCUTANEOUS TISSUE AND BREAST $161.97 $22.99 $138.98 604.5%
10 ENDOCRINE, NUTRITIONAL AND METABOLIC DISEASES AND DISORDERS $44.21 $16.28 $27.93 171.6%11 DISEASES AND DISORDERS OF THE KIDNEY AND URINARY TRACT $7.89 $15.14 -$7.25 -47.9%12 DISEASES AND DISORDERS OF THE MALE REPRODUCTIVE SYSTEM $2.52 $6.40 -$3.88 -60.6%13 DISEASES AND DISORDERS OF THE FEMALE REPRODUCTIVE SYSTEM $5.27 $13.36 -$8.09 -60.6%14 PREGNANCY, CHILDBIRTH AND THE PUERPERIUM $0.00 $1.82 -$1.82 -100.0%15 NEWBORNS AND OTHER NEONATES WITH CONDITIONS ORIGINATING IN PERINATAL PERIOD $0.00 $1.97 -$1.97 -100.0%16 DISEASES AND DISORDERS OF THE BLOOD AND BLOOD FORMING ORGANS AND IMMUNOLOGICAL $2.81 $6.53 -$3.72 -57.0%17 MYELOPROLIFERATIVE DISEASES AND DISORDERS, AND POORLY DIFFERENTIATED NEOPLASMS $3.05 $15.57 -$12.52 -80.4%18 INFECTIOUS AND PARASITIC DISEASES $0.78 $5.10 -$4.32 -84.7%19 MENTAL DISEASES AND DISORDERS $9.57 $8.62 $0.95 11.0%20 ALCOHOL/DRUG USE AND ALCOHOL/DRUG INDUCED ORGANIC MENTAL DISORDERS $0.07 $1.16 -$1.09 -94.0%21 INJURIES, POISONINGS AND TOXIC EFFECTS OF DRUGS $0.55 $3.99 -$3.44 -86.2%22 BURNS $0.09 $0.14 -$0.05 -35.7%23 FACTORS INFLUENCING HEALTH STATUS AND OTHER CONTACTS WITH HEALTH SERVICES $29.51 $39.28 -$9.77 -24.9%24 MULTIPLE SIGNIFICANT TRAUMA $0.00 $0.44 -$0.44 -100.0%25 HUMAN IMMUNODEFICIENCY VIRUS INFECTIONS $0.00 $0.06 -$0.06 -100.0%
0 UNGROUPABLE $0.04 $1.70 -$1.66 -97.6%Total $673.57 $446.34 $227.23 50.9%
Note: Benchmark data has been age/sex adjusted to correspond to the population included in this exhibit* Each $1.00 paid PMPM = $1,273 in plan costs.
WISCONSIN PUBLIC EMPLOYERSClaim Costs by Major Diagnostic Categories - Standard
Incurred January 2006 - December 2006 Paid Through March 2007
DIFFERENCE

Exhibit 10-FWISCONSIN PUBLIC EMPLOYERSClaim Costs by Major Diagnostic Categories - Standard
Incurred January 2006 - December 2006 Paid Through March 2007
$0 $20 $40 $60 $80 $100 $120 $140 $160 $180
UNGROUPABLE (0)
HUMAN IMMUNODEFICIENCY VIRUS INFECTIONS (25)
MULTIPLE SIGNIFICANT TRAUMA (24)
FACTORS INFLUENCING HEALTH STATUS AND OTHER CONTACTS WITH HEALTH SERVICES (23)
BURNS (22)
INJURIES, POISONINGS AND TOXIC EFFECTS OF DRUGS (21)
ALCOHOL/DRUG USE AND ALCOHOL/DRUG INDUCED ORGANIC MENTAL DISORDERS (20)
MENTAL DISEASES AND DISORDERS (19)
INFECTIOUS AND PARASITIC DISEASES (18)
MYELOPROLIFERATIVE DISEASES AND DISORDERS, AND POORLY DIFFERENTIATED NEOPLASMS (17)
DISEASES AND DISORDERS OF THE BLOOD AND BLOOD FORMING ORGANS AND IMMUNOLOGICAL (16)
NEWBORNS AND OTHER NEONATES WITH CONDITIONS ORIGINATING IN PERINATAL PERIOD (15)
PREGNANCY, CHILDBIRTH AND THE PUERPERIUM (14)
DISEASES AND DISORDERS OF THE FEMALE REPRODUCTIVE SYSTEM (13)
DISEASES AND DISORDERS OF THE MALE REPRODUCTIVE SYSTEM (12)
DISEASES AND DISORDERS OF THE KIDNEY AND URINARY TRACT (11)
ENDOCRINE, NUTRITIONAL AND METABOLIC DISEASES AND DISORDERS (10)
DISEASES AND DISORDERS OF THE SKIN, SUBCUTANEOUS TISSUE AND BREAST (9)
DISEASES AND DISORDERS OF THE MUSCULOSKELETAL SYSTEM AND CONNECTIVE TISSUE (8)
DISEASES AND DISORDERS OF THE HEPATOBILIARY SYSTEM AND PANCREAS (7)
DISEASES AND DISORDERS OF THE DIGESTIVE SYSTEM (6)
DISEASES AND DISORDERS OF THE CIRCULATORY SYSTEM (5)
DISEASES AND DISORDERS OF THE RESPIRATORY SYSTEM (4)
DISEASES AND DISORDERS OF THE EAR, NOSE, MOUTH AND THROAT (3)
DISEASES AND DISORDERS OF THE EYE (2)
DISEASES AND DISORDERS OF THE NERVOUS SYSTEM (1)
Actual Benchmark

Exhibit 10-G
MDC MAJOR DIAGNOSTIC CATEGORY ACTUAL BENCHMARK
CODE DESCRIPTION PMPM PMPM $ %
1 DISEASES AND DISORDERS OF THE NERVOUS SYSTEM $6.84 $16.84 -$10.00 -59.4%2 DISEASES AND DISORDERS OF THE EYE $4.25 $7.20 -$2.95 -41.0%3 DISEASES AND DISORDERS OF THE EAR, NOSE, MOUTH AND THROAT $20.73 $16.79 $3.94 23.5%4 DISEASES AND DISORDERS OF THE RESPIRATORY SYSTEM $10.94 $13.55 -$2.61 -19.3%5 DISEASES AND DISORDERS OF THE CIRCULATORY SYSTEM $52.31 $36.88 $15.43 41.8%6 DISEASES AND DISORDERS OF THE DIGESTIVE SYSTEM $26.26 $32.00 -$5.74 -17.9%7 DISEASES AND DISORDERS OF THE HEPATOBILIARY SYSTEM AND PANCREAS $0.00 $7.53 -$7.53 -100.0%8 DISEASES AND DISORDERS OF THE MUSCULOSKELETAL SYSTEM AND CONNECTIVE TISSUE $51.82 $55.92 -$4.10 -7.3%9 DISEASES AND DISORDERS OF THE SKIN, SUBCUTANEOUS TISSUE AND BREAST $9.78 $16.85 -$7.07 -42.0%
10 ENDOCRINE, NUTRITIONAL AND METABOLIC DISEASES AND DISORDERS $13.84 $10.46 $3.38 32.3%11 DISEASES AND DISORDERS OF THE KIDNEY AND URINARY TRACT $12.13 $9.93 $2.20 22.2%12 DISEASES AND DISORDERS OF THE MALE REPRODUCTIVE SYSTEM $0.57 $3.39 -$2.82 -83.2%13 DISEASES AND DISORDERS OF THE FEMALE REPRODUCTIVE SYSTEM $31.21 $11.87 $19.34 162.9%14 PREGNANCY, CHILDBIRTH AND THE PUERPERIUM $6.48 $7.46 -$0.98 -13.1%15 NEWBORNS AND OTHER NEONATES WITH CONDITIONS ORIGINATING IN PERINATAL PERIOD $0.42 $4.77 -$4.35 -91.2%16 DISEASES AND DISORDERS OF THE BLOOD AND BLOOD FORMING ORGANS AND IMMUNOLOGICAL $0.42 $3.99 -$3.57 -89.5%17 MYELOPROLIFERATIVE DISEASES AND DISORDERS, AND POORLY DIFFERENTIATED NEOPLASMS $1.52 $8.07 -$6.55 -81.2%18 INFECTIOUS AND PARASITIC DISEASES $0.71 $3.28 -$2.57 -78.4%19 MENTAL DISEASES AND DISORDERS $12.87 $9.45 $3.42 36.2%20 ALCOHOL/DRUG USE AND ALCOHOL/DRUG INDUCED ORGANIC MENTAL DISORDERS $0.00 $1.18 -$1.18 -100.0%21 INJURIES, POISONINGS AND TOXIC EFFECTS OF DRUGS $1.12 $3.20 -$2.08 -65.0%22 BURNS $0.00 $0.17 -$0.17 -100.0%23 FACTORS INFLUENCING HEALTH STATUS AND OTHER CONTACTS WITH HEALTH SERVICES $26.10 $28.65 -$2.55 -8.9%24 MULTIPLE SIGNIFICANT TRAUMA $0.00 $0.63 -$0.63 -100.0%25 HUMAN IMMUNODEFICIENCY VIRUS INFECTIONS $0.00 $0.07 -$0.07 -100.0%
0 UNGROUPABLE $1.01 $1.07 -$0.06 -5.6%Total $291.33 $311.20 -$19.87 -6.4%
Note: Benchmark data has been age/sex adjusted to correspond to the population included in this exhibit* Each $1.00 paid PMPM = $2,407 in plan costs.
WISCONSIN PUBLIC EMPLOYERSClaim Costs by Major Diagnostic Categories - SMP
Incurred January 2006 - December 2006 Paid Through March 2007
DIFFERENCE

Exhibit 10-HWISCONSIN PUBLIC EMPLOYERSClaim Costs by Major Diagnostic Categories - SMP
Incurred January 2006 - December 2006 Paid Through March 2007
$0 $50 $100 $150 $200 $250
UNGROUPABLE (0)
HUMAN IMMUNODEFICIENCY VIRUS INFECTIONS (25)
MULTIPLE SIGNIFICANT TRAUMA (24)
FACTORS INFLUENCING HEALTH STATUS AND OTHER CONTACTS WITH HEALTH SERVICES (23)
BURNS (22)
INJURIES, POISONINGS AND TOXIC EFFECTS OF DRUGS (21)
ALCOHOL/DRUG USE AND ALCOHOL/DRUG INDUCED ORGANIC MENTAL DISORDERS (20)
MENTAL DISEASES AND DISORDERS (19)
INFECTIOUS AND PARASITIC DISEASES (18)
MYELOPROLIFERATIVE DISEASES AND DISORDERS, AND POORLY DIFFERENTIATED NEOPLASMS (17)
DISEASES AND DISORDERS OF THE BLOOD AND BLOOD FORMING ORGANS AND IMMUNOLOGICAL (16)
NEWBORNS AND OTHER NEONATES WITH CONDITIONS ORIGINATING IN PERINATAL PERIOD (15)
PREGNANCY, CHILDBIRTH AND THE PUERPERIUM (14)
DISEASES AND DISORDERS OF THE FEMALE REPRODUCTIVE SYSTEM (13)
DISEASES AND DISORDERS OF THE MALE REPRODUCTIVE SYSTEM (12)
DISEASES AND DISORDERS OF THE KIDNEY AND URINARY TRACT (11)
ENDOCRINE, NUTRITIONAL AND METABOLIC DISEASES AND DISORDERS (10)
DISEASES AND DISORDERS OF THE SKIN, SUBCUTANEOUS TISSUE AND BREAST (9)
DISEASES AND DISORDERS OF THE MUSCULOSKELETAL SYSTEM AND CONNECTIVE TISSUE (8)
DISEASES AND DISORDERS OF THE HEPATOBILIARY SYSTEM AND PANCREAS (7)
DISEASES AND DISORDERS OF THE DIGESTIVE SYSTEM (6)
DISEASES AND DISORDERS OF THE CIRCULATORY SYSTEM (5)
DISEASES AND DISORDERS OF THE RESPIRATORY SYSTEM (4)
DISEASES AND DISORDERS OF THE EAR, NOSE, MOUTH AND THROAT (3)
DISEASES AND DISORDERS OF THE EYE (2)
DISEASES AND DISORDERS OF THE NERVOUS SYSTEM (1)
Actual Benchmark


11
Wisconsin Public Employers Provider Utilization
Top 20 Provider Reports The Top 20 Provider reports display the top 20 Facility and Professional Providers sorted by total paid charges. Within the facility report, charges have also been broken out by inpatient and outpatient paid charges for additional analysis. The Paid % shows the percentage of the group’s total facility or professional charges from a specific provider.
Facility
The report for the Standard Plan in Exhibit 11-E shows that the top 20 facilities provide 90.7% of the total facility charges for the plan. By far, the largest percent of claims came from the Abbott Northwestern Hospital in Minneapolis however only 1 member was treated there. The second largest percent of claims came from Aurora St. Lukes in Milwaukee followed by University of Wisconsin in Madison which also treated the highest number of patients. Since the Standard Plan is available nationwide, we see providers from various regions and states. The report for the SMP Plan in Exhibit 11-F shows that the top 20 facilities provide 99.9% of the total facility charges for the plan. The largest percentage of paid claims is from Aspirus in Wausau, followed by Dickinson County Memorial in Iron Mountain, Michigan and St. Michaels Hospital in Steven Point. Due to the HMO type coverage and limited plan area of the SMP plan we would expect to see a majority of services received at a finite number of hospitals within the SMP region.
Professional
The Standard Plan shown in Exhibit 11-G received 69.0% of professional charges from the top 20 providers. The top professional provider is New Mexico Cancer Care Associates. Once again the top provider treated only 1 patient. The top Wisconsin provider by paid claims was the Ministry Medical Group in Rhinelander while UW Medical Foundation treated the most patients.
The SMP Plan in Exhibit 11-H received 77.6% of the paid claims from the top 20 professional providers. Marshfield Clinic was the top provider receiving 33% of the overall payments, followed by St Michael’s Hospital which received 9.2% of the payments.

Exhibit 11-E
Facility Provider City State# of Unique
PatientsInpatient Paid
ClaimsOutpatient Paid
Claims Total Paid Claims Paid %
1 ABBOTT NORTHWESTERN HOSPITAL MINNEAPOLIS MN 1 $88,922 $0 $88,922 20.7%2 AURORA ST LUKES MEDICAL CENTER MILWAUKEE WI 4 $34,478 $7,672 $42,150 9.8%3 UNIVERSITY WI HSP CL AUTHORITY MADISON WI 13 $15,548 $16,407 $31,955 7.4%4 ALL SAINTS ST MARYS MED CENTER RACINE WI 1 $28,163 $1,457 $29,620 6.9%5 SCOTTSDALE HLTH SHEA SCOTTSDALE AZ 1 $27,392 $1,212 $28,604 6.6%6 SACRED HEART HOSP EAU CLAIRE WI 2 $26,662 $161 $26,823 6.2%7 CUMBERLAND MEMORIAL HOSPITAL CUMBERLAND WI 7 $10,283 $10,224 $20,507 4.8%8 SARASOTA MEM HOSP SARASOTA FL 2 $0 $15,950 $15,950 3.7%9 NORTH MEM HEALTH CENTER ROBBINSDALE MN 1 $0 $15,574 $15,574 3.6%
10 ST VINCENT HOSP SANTA FE NM 1 $7,921 $4,713 $12,634 2.9%11 AURORA MEDICAL CENTER OSHKOSH OSHKOSH WI 1 $0 $10,838 $10,838 2.5%12 ST MARYS HOSPITAL INC RHINELANDER WI 1 $6,170 $4,575 $10,745 2.5%13 AURORA SHEBOYGAN MED CTR SHEBOYGAN WI 1 $0 $9,245 $9,245 2.1%14 LAKEVIEW MED CENTER RICE LAKE WI 3 $0 $8,933 $8,933 2.1%15 WAUKESHA MEM HSP INC WAUKESHA WI 2 $0 $8,407 $8,407 2.0%16 BOULDER COMMUNITY MUSCULOSKELE DENVER CO 1 $0 $7,245 $7,245 1.7%17 FORT HEALTHCARE INC FORT ATKINSON WI 4 $0 $6,375 $6,375 1.5%18 AURORA MEDICAL CTR HARTFORD HARTFORD WI 2 $0 $5,732 $5,732 1.3%19 AURORA MEMORIAL HOSPITAL OF BU BURLINGTON WI 4 $0 $5,648 $5,648 1.3%20 RUSK CO MEM HOSP LADYSMITH WI 1 $0 $4,644 $4,644 1.1%
Top 20 Total 53 $245,539 $145,012 $390,551 90.7%All Other Facility Charges 38 $952 $38,882 $39,834 9.3%Total Facility Charges 91 $246,491 $183,894 $430,385 100.0%
WISCONSIN PUBLIC EMPLOYERSTop 20 Facility Providers - Standard
Incurred January 2006 - December 2006 Paid Through March 2007

Exhibit 11-F
Facility Provider City State# of Unique
PatientsInpatient Paid
ClaimsOutpatient Paid
Claims Total Paid Claims Paid %
1 ASPIRUS WAUSAU HOSPITAL INC WAUSAU WI 15 $60,768 $41,154 $101,922 32.4%2 DICKINSON COUNTY MEMORIAL HOSP IRON MOUNTAIN MI 25 $23,889 $49,217 $73,106 23.2%3 ST MICHAELS HOSP STEVENS POINT WI 15 $0 $41,236 $41,236 13.1%4 HOWARD YOUNG MED CTR WOODRUFF WI 3 $18,756 $473 $19,229 6.1%5 FLAMBEAU MEDICAL CENTER INC PARK FALLS WI 15 $0 $17,930 $17,930 5.7%6 ST MARYS HOSPITAL INC RHINELANDER WI 3 $7,455 $8,739 $16,194 5.1%7 BELLIN PSYCH CENTER GREEN BAY WI 1 $10,144 $0 $10,144 3.2%8 MEMORIAL HEALTH CENTER INC MEDFORD WI 6 $0 $7,456 $7,456 2.4%9 ST CLARES HOSPITAL OF WESTON WESTON WI 2 $5,062 $263 $5,325 1.7%
10 ST JOSEPHS HOSPITAL MARSHFIELD WI 2 $0 $4,984 $4,984 1.6%11 BAYCARE AURORA LLC EAST GREEN BAY WI 2 $0 $3,517 $3,517 1.1%12 HEALTHSOUTH WAUSAU SURGERY CEN WAUSAU WI 2 $0 $2,956 $2,956 0.9%13 MARQUETTE GENERAL HOSPITAL INC MARQUETTE MI 6 $0 $2,608 $2,608 0.8%14 NIAGARA HEALTH CENTER NIAGARA WI 1 $0 $2,083 $2,083 0.7%15 COMMUNITY MEM HOSPITAL OCONTO FALLS WI 1 $0 $1,887 $1,887 0.6%16 NIAGARA HEALTH CENTER NIAGARA WI 1 $0 $1,785 $1,785 0.6%17 EAGLE RIVER MEM HOSP EAGLE RIVER WI 1 $0 $687 $687 0.2%18 RIVERVIEW HOSPITAL WISC RAPIDS WI 1 $0 $650 $650 0.2%19 ST MARYS HOSP MED CTR MADISON WI 1 $0 $568 $568 0.2%20 ST ELIZABETH HOSP APPLETON WI 1 $0 $387 $387 0.1%
Top 20 Total 104 $126,074 $188,580 $314,654 99.9%All Other Facility Charges 3 $0 $257 $257 0.1%Total Facility Charges 107 $126,074 $188,837 $314,911 100.0%
WISCONSIN PUBLIC EMPLOYERSTop 20 Facility Providers - SMP
Incurred January 2006 - December 2006 Paid Through March 2007

Exhibit 11-G
Professional Provider City State# of Unique
Patients Total Paid Claims Paid %
1 NEW MEXICO CANCER CARE ASSOC SANTA FE NM 1 $137,897 32.3%2 MINISTRY MEDICAL GRP NORTHERN RHINELANDER WI 2 $24,657 5.8%3 AURORA HEALTH CENTER-DO SHEBOYGAN WI 7 $22,391 5.2%4 RADIATION ONCOLOGY ASSOCIATES SANTA FE NM 1 $17,833 4.2%5 UW MEDICAL FOUNDATION MADISON WI 15 $15,255 3.6%6 MARSHFIELD CLINIC MARSHFIELD WI 13 $14,607 3.4%7 LAKESHORE MEDICAL CLINIC MILWAUKEE WI 5 $8,899 2.1%8 TWIN CITIES SPINE CENTER MINNEAPOLIS MN 1 $6,440 1.5%9 M M PHYSICAL THERAPY LLC S MILWAUKEE WI 1 $6,431 1.5%
10 DEAN MEDICAL CENTER MADISON WI 8 $5,590 1.3%11 AUSTIN MEDICAL CENTER AUSTIN MN 2 $5,475 1.3%12 WATERFRONT SPORTS PHYSICAL THE EDMONDS WA 1 $3,987 0.9%13 NORTHWEST ANESTHESIA PA MINNEAPOLIS MN 1 $3,787 0.9%14 ALL SAINTS ST MARYS MED GRP RACINE WI 1 $3,781 0.9%15 DAVID CANZONE SANTA FE NM 1 $3,530 0.8%16 SPORTS MEDICINE & ORTHOPEDIC MILWAUKEE WI 1 $3,504 0.8%17 CUMBERLAND CLINIC SC CUMBERLAND WI 7 $3,103 0.7%18 DIAGNOSTIC RADIOLOGY ASSOC RICE LAKE WI 5 $2,648 0.6%19 FRANCISCAN SKEMP MEDICAL CTR ARCADIA WI 1 $2,595 0.6%20 PAIN CLINIC OF NW WISCONSIN SC EAU CLAIRE WI 1 $2,486 0.6%
Top 20 Total 75 $294,896 69.0%All Other Professional Charges 322 $132,185 31.0%Total Professional Charges 397 $427,081 100.0%
WISCONSIN PUBLIC EMPLOYERSTop 20 Professional Providers - Standard
Incurred January 2006 - December 2006 Paid Through March 2007

Exhibit 11-H
Professional Provider City State# of Unique
Patients Total Paid Claims Paid %
1 MARSHFIELD CLINIC MARSHFIELD WI 71 $126,150 32.7%2 ST MICHAELS HOSPITAL STEVENS POINT WI 34 $35,619 9.2%3 ASPIRUS CLINIC INC WAUSAU WI 19 $19,700 5.1%4 MINISTRY MEDICAL GRP NORTHERN RHINELANDER WI 8 $14,928 3.9%5 CARDIOVASCULAR ASSOCIATES OF WAUSAU WI 6 $12,033 3.1%6 MEMORIAL HEALTH CENTER INC MEDFORD WI 16 $10,054 2.6%7 ALLIED HEALTH OF WISCONISN SC WAUSAU WI 11 $9,602 2.5%8 DIAGNOSTIC AND TREATMENT WESTON WI 8 $8,748 2.3%9 WISCONSIN MICHIGAN PHYSICIANS NIAGARA WI 4 $7,881 2.0%
10 RADIOLOGY ASSOCIATES OF WAUSAU WAUSAU WI 14 $7,165 1.9%11 JOHN M COOK IRON MOUNTAIN MI 6 $6,667 1.7%12 KLASINSKI CLINIC SC STEVENS POINT WI 3 $5,747 1.5%13 GASTROINTESTINAL ASSOC SC WAUSAU WI 5 $5,391 1.4%14 DICKINSON CO HEALTHCARE SYSTEM IRON MOUNTAIN MI 14 $5,288 1.4%15 DEWANE D FRASE PHILLIPS WI 5 $5,030 1.3%16 WAUSAU SPINE AND NEUROSCIENCES WAUSAU WI 1 $4,813 1.2%17 NORTHERN MICHIGAN ANESTHESIA IRON MOUNTAIN MI 4 $4,214 1.1%18 BONE AND JOINT CLINIC SC WAUSAU WI 4 $3,879 1.0%19 JAMES E MERRILL IRON MOUNTAIN MI 1 $3,615 0.9%20 CENTRAL WISCONSIN ANESTHESIOLO WAUSAU WI 3 $3,423 0.9%
Top 20 Total 237 $299,947 77.6%All Other Professional Charges 240 $86,369 22.4%Total Professional Charges 477 $386,316 100.0%
WISCONSIN PUBLIC EMPLOYERSTop 20 Professional Providers - SMP
Incurred January 2006 - December 2006 Paid Through March 2007


13
Wisconsin Public Employers Large Claims
High Cost Patients The High Cost Patients report in Exhibit 13-B lists the plan members with claims over $100,000 for claims incurred January 2006 – December 2006 and paid through March 2007 for the Standard, SMP and Medicare Carve-out Plans. The Primary Condition is the condition associated with the largest percentage of claims and therefore may not be representative of a patient’s complete condition. The Care Management section shows the type of care management provided on each case. For a detailed description of care management processes please reference the Care Management Description in Section 3 pages 1a and 1b.
The Standard Plan has 2 members with claims over $100,000 for a total of $296,281 in claim costs. Both of the claimants are spouses with one residing out of state and the other in Wisconsin. These 2 members represent 34.5% of total claims paid under the Standard Plan.
The SMP Plan did not have any members exceed $100,000 in 2006.
The Medicare Carve-out Plan did not have any members exceed $100,000 in 2006.

Exhibit 13-B
Patient Information Plan Care Management Primary Condition Total Paid
1 ACTIVE STANDARD Preauth, UM, CM MALIG NEO FEMALE BREAST $192,497.902 ACTIVE STANDARD Preauth, UM INTERVERTEBRAL DISC DIS $103,782.85
Total $296,280.75
Preauth = Preauthorization UM = Utilization Management CM = Case Management DM = Disease Management BH = Behavioral Health
Incurred January 2006 - December 2006 Paid Through March 2007High Cost Patients (over $100,000)
WISCONSIN PUBLIC EMPLOYERS

14
Wisconsin Public Employers Member Cost Share
Medical and Drug Cost Sharing The Medical and Drug Cost Sharing graphs in Exhibit 14-B show the percent of eligible medical and drug claim costs paid by the member. This percentage is compared to the WPS Benchmark though for this comparison the benchmark is unadjusted.
The Standard Plan members pay about 4.5% of their own medical claims as compared to the benchmark of 7-8%. The prescription drug cost share is slightly closer to our normative benchmark with the Standard Plan around 17% and the benchmark at 19.5%.
The SMP Plan members by comparison pay a smaller amount towards their own medical claims (in the form of cost sharing). Unlike the members of most large groups who pay an average of about 7-8% of their medical claims, SMP Plan members pay 1-2%. The SMP cost share for prescription drugs is similar to benchmark of 19.5%. Even though the Standard and SMP plans have the same prescription drug benefit, they have slightly different drug utilization profiles, the result of each plan’s unique blend of treated conditions.

Exhibit 14-B
Note: Benchmark data has been age/sex adjusted to correspond to the population included in this exhibit
WISCONSIN PUBLIC EMPLOYERSMedical and Drug Cost Sharing
Incurred January 2006 - December 2006 Paid Through March 2007
Standard
0%
5%
10%
15%
20%
Medical Drug
Perc
ent O
OP
Actual Norm
SMP
0%
5%
10%
15%
20%
Medical Drug
Perc
ent O
OP
Actual Norm
15
Wisconsin Public Employers Member Cost Share
Medical and Drug Out of Pocket by Member The Medical and Drug Out of Pocket by Member bar graph shown in Exhibit 15-B divides members with out of pocket cost sharing into categories based on the annual amount of out of pocket costs they paid in 2006. The annual out of pocket for each member includes medical and prescription drug costs.
The Standard Plan has a large disparity between the members as far as out of pocket costs. A good portion of members pay between $1 and $99 out of pocket annually. There are also almost 30 members in the $500 to $999 range but it is important to note the range for this category is larger than the previous categories. Lastly there are just over 20 members who pay over $1000 out of pocket annually.
The SMP Plan by comparison has a large number of all members paying between $1 and $99 in cost sharing. Most of the cost sharing comes from prescription drug copays.

Exhibit 15-BWISCONSIN PUBLIC EMPLOYERSMedical and Drug Out of Pocket by Member
Incurred January 2006 - December 2006 Paid Through March 2007
Standard
0
10
20
30
40
50
60
$1 - $99 $100 - $199 $200 - $299 $300 - $399 $400 - $499 $500 - $999 $1000+
Mem
bers
WPE STD
SMP
0
10
20
30
40
50
60
$1 - $99 $100 - $199 $200 - $299 $300 - $399 $400 - $499 $500 - $999 $1000+
Mem
bers
WPE SMP

16
Wisconsin Public Employers Medical Claims Cost Savings
Medical Claim Savings Analysis The Medical Claim Saving Analysis in Exhibit 16-C takes the charges submitted on behalf of the ETF members and details the savings that take place before the final payments are made to the providers. The submitted charges represent medical claims only. The charges are split between the Standard, SMP and Medicare Carve-out plans for claims incurred January 2006 through December 2006 and paid through the end of March 2007. Exhibit 16-D provides a summary of the savings by plan along with a pie chart that provides the percentage of savings in each category combining all plans.
For the Standard Plan, WPS paid 73.4% of submitted charges on behalf of the plan. Of the 26.6% savings, 11.9% came from pricing cutbacks from the network providers. Another 5.8% was saved on claims rejected for duplicate submission, non-eligible claims, and services not covered by the plan. The Standard Plan also had 3.5% of charges paid by the members with deductibles, coinsurance and copays. The savings due to third party liability is small at this time but these types of recoveries can be long term and may take several years to be completed.
For the SMP Plan, WPS paid 72.8% of submitted charges on behalf of the plan. Of the 27.2% savings, 13.2% was received from pricing cutbacks from network providers. Another 12.3% was saved on claims rejected for duplicate submission, non-eligible claims, and services not covered by the plan. In comparison to the Standard Plan, the SMP plan members contributed only 1.3% in out-of-pocket costs. The SMP plan does have some out-of-pocket costs in the form of ER Copays and coinsurance on DME and Outpatient Psychiatric Visits. The total seen in the copayment segment is not just ER copays but also encompasses coinsurance amounts that do not apply to the annual out-of-pocket maximum for a member.
For the Medicare Carve-out Plan, WPS paid 5.9% of submitted charges on behalf of the plan. Payments made by Medicare have an overwhelming impact on savings by accounting for 74.1% of the submitted charges. The second highest savings came from the rejection of duplicate or non-eligible charges. This number was higher than expected due to the submission of duplicate electronic and paper claims. The WPS claims area has worked hard on provider education in this area and we expect this percentage to be lower in the future.
As seen in the pie chart in Exhibit 16-D, the total payment made by WPS for all plan types in 2006 was 19.1% of submitted charges. With the Medicare population’s impact, 59.8% of the savings was provided by Medicare, followed by 14.5% in rejections for duplicates and non-eligible services and 2.8% in pricing cutback.

Exhibit 16-C
$ Amount % of Total $ Amount % of Total $ Amount % of Total
Submitted Charges $1,168,427.69 100.0% $963,870.45 100.0% $8,752,475.34 100.0%Duplicates/Not Eligible $33,757.48 2.9% $23,860.61 2.5% $1,519,606.16 17.4%Pricing Cutbacks $139,192.72 11.9% $127,089.54 13.2% $40,420.77 0.5%Out-of-Pocket
Deductible $20,932.90 1.8% $7,222.37 0.7% $49,587.47 0.6%Coinsurance $18,957.28 1.6% $3,815.37 0.4% $22,118.85 0.3%Copayments $1,204.81 0.1% $1,100.23 0.1% $2,151.19 0.0%
Total $41,094.99 3.5% $12,137.97 1.3% $73,857.51 0.8%Not Covered
Medical Necessity $1,320.00 0.1% $1,357.20 0.1% $27.69 0.0%Inappropriate Provider $1,128.50 0.1% $0.00 0.0% $352.67 0.0%Benefit Maximum $7,012.57 0.6% $3,761.90 0.4% $33,026.81 0.4%Experimental/Fertility $0.00 0.0% $402.20 0.0% $877.65 0.0%Dental $752.00 0.1% $36.00 0.0% $645.00 0.0%Custodial $0.00 0.0% $0.00 0.0% $0.00 0.0%Code Review $16,655.94 1.4% $10,367.14 1.1% $3,797.10 0.0%Contact Lens/Hearing Aid $274.98 0.0% $417.10 0.0% $2,269.69 0.0%Drugs $0.00 0.0% $0.00 0.0% $0.00 0.0%No Referral $0.00 0.0% $23,439.53 2.4% $0.00 0.0%All Other $7,107.13 0.6% $55,070.50 5.7% $73,755.80 0.8%
Total $34,251.12 2.9% $94,851.57 9.8% $114,752.41 1.3%Third Party Liability
Workers Compensation $6,125.80 0.5% $1,494.50 0.2% $0.00 0.0%Subrogation $347.00 0.0% $0.00 0.0% $384.88 0.0%Coordination of Benefits $32,987.69 2.8% $3,209.49 0.3% $0.00 0.0%
Total $39,460.49 3.4% $4,703.99 0.5% $384.88 0.0%Medicare $23,204.51 2.0% $0.00 0.0% $6,485,627.77 74.1%Payments $857,466.38 73.4% $701,226.77 72.8% $517,825.84 5.9%
WISCONSIN PUBLIC EMPLOYERSMedical Claim Savings Analysis
Incurred January 2006 - December 2006 Paid Through March 2007
Category
MEDICARESMPSTANDARD

Exhibit 16-D
$ Amount % of Total $ Amount % of Total $ Amount % of Total
Payments $857,466.38 73.4% $701,226.77 72.8% $517,825.84 5.9%Pricing Cutbacks $139,192.72 11.9% $127,089.54 13.2% $40,420.77 0.5%Duplicates/Not Eligible $33,757.48 2.9% $23,860.61 2.5% $1,519,606.16 17.4%Not Covered $34,251.12 2.9% $94,851.57 9.8% $114,752.41 1.3%Out-of-Pocket $41,094.99 3.5% $12,137.97 1.3% $73,857.51 0.8%Third Party Liability $39,460.49 3.4% $4,703.99 0.5% $384.88 0.0%Medicare $23,204.51 2.0% $0.00 0.0% $6,485,627.77 74.1%
STANDARD, SMP, MEDICARE
WISCONSIN PUBLIC EMPLOYERSMedical Claim Savings Analysis Summary
Incurred January 2006 - December 2006 Paid Through March 2007
STANDARD SMP MEDICARE
TOTAL% OF CLAIMS SAVINGS
Pricing Cutbacks2.8%
Out-of-Pocket1.2%
Not Covered2.2%
Duplicates/Not Eligible14.5%
Payments19.1%
Medicare59.8%
Third Party Liability0.4%
State of Wisconsin
Section 3: Value Care Medical Management


i
State of Wisconsin Plans Executive Summary
Value Care Medical Management Process WPS Value Care uses a variety of methods to identify members for medical management. When the State of Wisconsin became effective in January 2006, the medical management of any open case was picked up by Medical Affairs. In addition, there was proactive identification of new cases through the preauthorization and precertification process, plus we used a MeDecision predictive modeling tool called CaseAlert.
CaseAlert looks back at twelve months of claims to identify members with potentially high cost illnesses. It can also identify and apply a burden of illness score to members on a disease specific basis. Claims are run through CaseAlert on a regular basis and new cases that would benefit from Case Management or Disease Management are referred to the appropriate care managers.
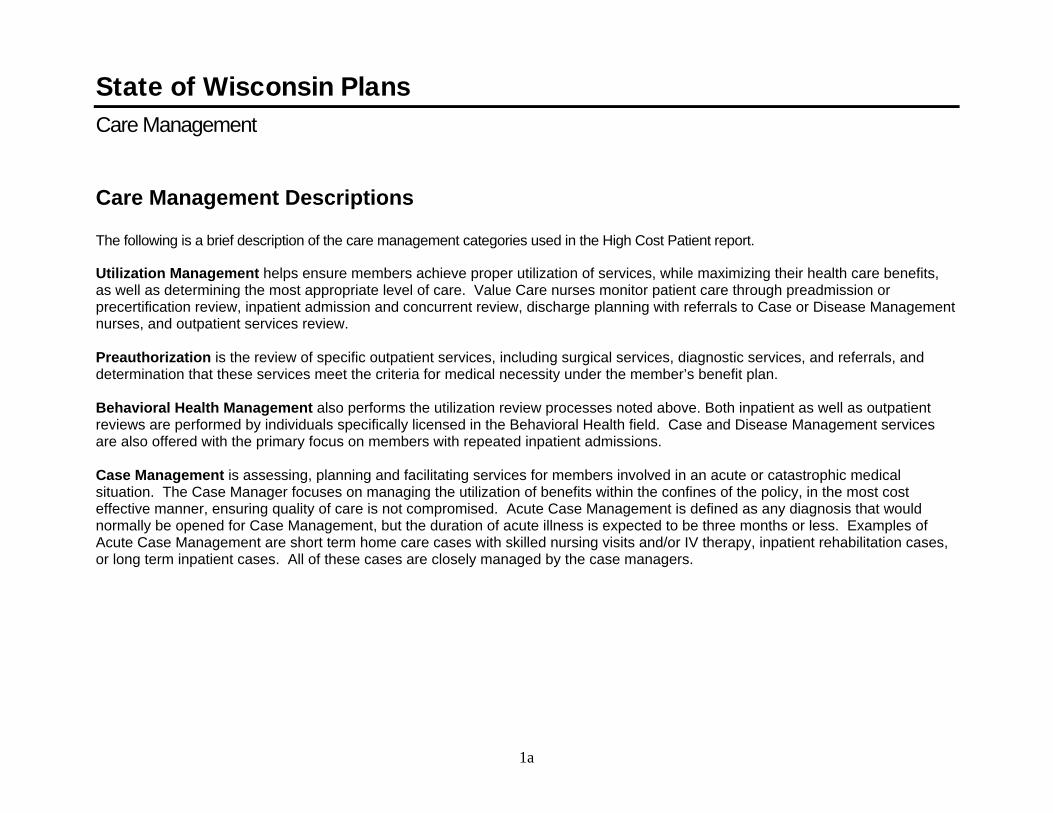
1a
State of Wisconsin Plans Care Management
Care Management Descriptions The following is a brief description of the care management categories used in the High Cost Patient report.
Utilization Management helps ensure members achieve proper utilization of services, while maximizing their health care benefits, as well as determining the most appropriate level of care. Value Care nurses monitor patient care through preadmission or precertification review, inpatient admission and concurrent review, discharge planning with referrals to Case or Disease Management nurses, and outpatient services review. Preauthorization is the review of specific outpatient services, including surgical services, diagnostic services, and referrals, and determination that these services meet the criteria for medical necessity under the member’s benefit plan. Behavioral Health Management also performs the utilization review processes noted above. Both inpatient as well as outpatient reviews are performed by individuals specifically licensed in the Behavioral Health field. Case and Disease Management services are also offered with the primary focus on members with repeated inpatient admissions. Case Management is assessing, planning and facilitating services for members involved in an acute or catastrophic medical situation. The Case Manager focuses on managing the utilization of benefits within the confines of the policy, in the most cost effective manner, ensuring quality of care is not compromised. Acute Case Management is defined as any diagnosis that would normally be opened for Case Management, but the duration of acute illness is expected to be three months or less. Examples of Acute Case Management are short term home care cases with skilled nursing visits and/or IV therapy, inpatient rehabilitation cases, or long term inpatient cases. All of these cases are closely managed by the case managers.

1b
Disease Management utilizes a proactive approach through education, treatment and appropriate care to prevent long-term and unnecessary complications of chronic disease. Through education, the Disease Manager empowers the members to take ownership of their health, decreasing future health risks, minimizing the need for medical services, and ultimately, improving the quality of life. The Disease Management conditions managed for ETF are: Asthma, Congestive Heart Failure, Coronary Artery Disease (which includes Hypertension & High Cholesterol), Diabetes, Neonatal, Alcohol & Drug Abuse, & Depression. (Please note Chronic Kidney Disease is managed under Case Management). Medical Review is an additional process in the Medical Management area that does post-claim review to ensure that those services that received prior approval are billed appropriately, and/or that services billed are covered by the member’s plan and are medically necessary.
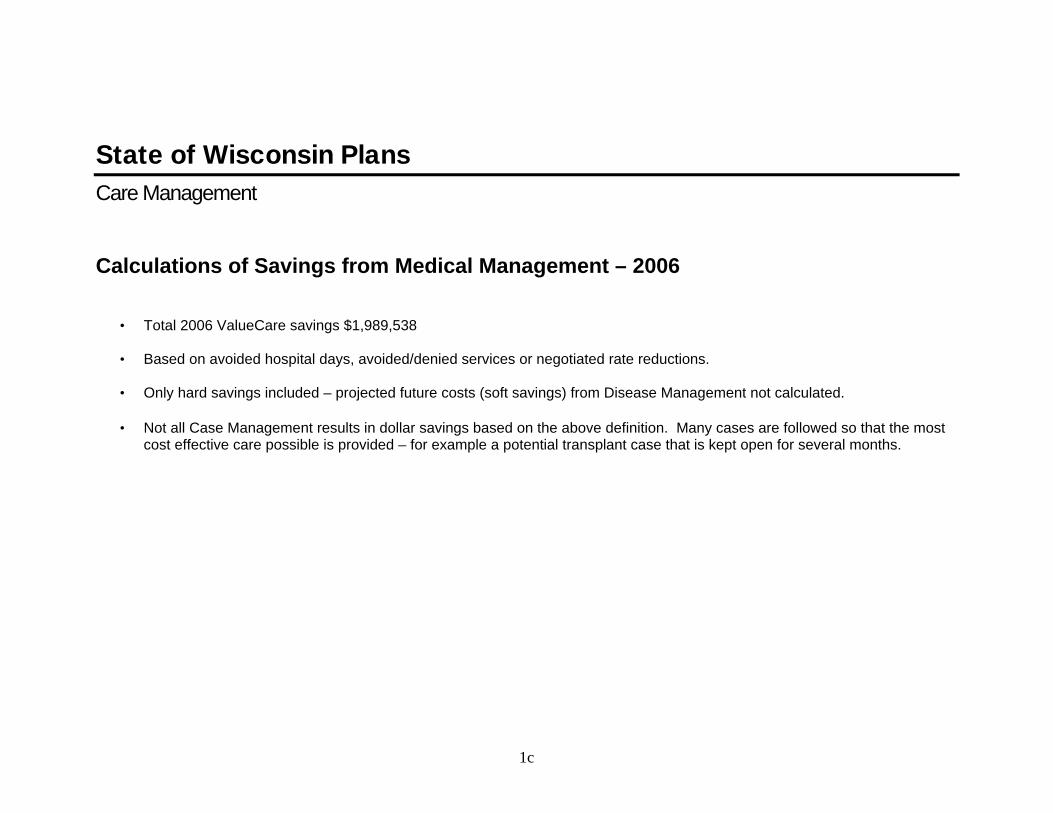
1c
State of Wisconsin Plans Care Management
Calculations of Savings from Medical Management – 2006
• Total 2006 ValueCare savings $1,989,538
• Based on avoided hospital days, avoided/denied services or negotiated rate reductions.
• Only hard savings included – projected future costs (soft savings) from Disease Management not calculated.
• Not all Case Management results in dollar savings based on the above definition. Many cases are followed so that the most cost effective care possible is provided – for example a potential transplant case that is kept open for several months.

1d
State of Wisconsin Plans Care Management
Medical Management Activity – 2006 • 349 Case Management (CM) • 233 Disease Management (DM*) • 944 Utilization Management (UM) • 956 Preauthorization • Total 1988 Closed in 2006 *Includes 87 OB case in “Great Beginnings” disease management.

1e
State of Wisconsin Plans Care Management
Disease Management Activity – 2006
• 233 cases opened
• 68 - Cardiac Disease • 37 - Diabetes • 87 - High Risk OB • 41 - Closed Cases
(or mailings only) WPS Disease Management is an opt-in program which means when a member is identified for case or disease management they are offered the opportunity to participate and must consent either verbally or in writing.
Disease Management Process
– Introductory DM letter followed by 2 phone contacts. (If no listed phone numbers, member is sent 2 letters). – If no response from member to opt-in, transferred to mailing queue. – Those enrolled in active management by an RN are highly satisfied based on surveys.
An example of Disease Management activity is the early and consistent intervention post coronary artery bypass graft(CABG) surgery. WPS analyzed these types of surgical admissions in 2004 and determined that there were frequent readmissions post CABG surgery. This analysis found that the most common causes of readmission were related to potentially avoidable complications such as heart failure and wound infection. This readmission rate has been significantly reduced by the implementation of the CABG Disease Management program in 2005.

Exhibit 1-A
Note: Based on avoided hospital days, avoided/denied services or negotiated rate reductions (includes Medical Review savings)Note: Only "hard" savings included - projected future costs (soft savings) from Disease Management not calculated
STATE OF WISCONSIN PLANSCare Management Summary
Calendar Year 2006
TOTAL SAVINGS: $1,989,538
SAVINGS
$0$20,000$40,000$60,000$80,000
$100,000$120,000$140,000$160,000$180,000
Jan Feb Mar Apr May Jun Jul Aug Sep Oct Nov Dec
Month
CM UM Med Review
DISEASE MANAGEMENT CASES
Diabetes16%
Closed Cases18%
High Risk OB37%
Cardiac Disease29%
MEDICAL MANAGEMENT CASESCase Mgmt
349
Utilization Mgmt944
Preauth956
Disease Mgmt233

Exhibit 1-B$
Case ID Case OpenedTreatment
Ended Diagnosis Savings$
05363-0124 12/29/2005 03/31/2006 ACUTE LYMPHOCYTIC LEUKEMIA $8,721.0005363-0126 12/29/2005 03/07/2006 COMPLICATIONS OF BONE MARROW TRANSPLANT $523.6106003-0072 01/03/2006 03/04/2006 LEG FRACTURE $0.0006003-0117 01/03/2006 01/20/2006 STATUS POST TOTAL KNEE REPLACEMENT $508.8906004-0003 01/04/2006 01/16/2006 HYPOGLYCEMIA, UNSPECIFIED $60.0006005-0051 01/05/2006 12/31/2006 ENCEPHALOPATHY $151,487.3006005-0065 01/05/2006 02/09/2006 OTHER POSTOPERATIVE INFECTION $1,470.0006005-0073 01/05/2006 02/09/2007 SYMPATHETIC DYSTROPHY $10,604.9306005-0075 01/05/2006 01/16/2006 STATUS POST LEFT TOTAL HIP REPLACEMENT $734.2006010-0002 01/10/2006 03/10/2006 KIDNEY REPLACED BY TRANSPLANT $0.0006010-0023 01/10/2006 01/29/2007 BACTEREMIA $4,894.5606012-0036 01/12/2006 01/16/2006 CEREBRAL VASCULAR ACCIDENT (STROKE) $1,519.8006012-0042 01/12/2006 01/25/2006 GENERALIZED WEAKNESS $220.0006012-0068 01/12/2006 01/18/2006 LEFT ANKLE FRACTURE $162.0006016-0107 01/16/2006 05/31/2006 CONGENITAL HEART DISEASE $340.0006016-0112 01/16/2006 01/24/2006 RECTAL CANCER $0.0006017-0029 01/17/2006 01/05/2006 HYPEREMESIS GRAVIDARUM, METABOLIC DISTURBANCE UNSPECIFIED EPISODE CARE OR NOT APPLICABLE $16.2006018-0074 01/18/2006 01/24/2006 LEUKEMIA $113.2506020-0060 01/20/2006 02/04/2006 STROKE $0.0006024-0009 01/24/2006 03/08/2006 CEREBRAL VASCULAR ACCIDENT $432.0006026-0088 01/26/2006 01/31/2007 DEBILITY $8,063.5006030-0028 01/30/2006 03/15/2006 SEPTIC KNEE JOINT $45.0006032-0056 02/01/2006 03/11/2006 CHRONIC OBSTRUCTIVE PULMONARY DISEASE $984.0006033-0063 02/02/2006 02/02/2006 CARDIOVASCULAR DISEASE $60.0006038-0026 02/07/2006 02/17/2006 OVARIAN CANCER $0.0006041-0055 02/10/2006 02/14/2006 DEGENERATIVE JOINT DISEASE $138.0106044-0052 02/13/2006 04/14/2006 APLASTIC ANEMIA $2,560.6406045-0070 02/14/2006 02/27/2006 DEMENTIA $0.0006046-0004 02/15/2006 02/13/2006 CHRONIC ISCHEMIC HEART DISEASE, UNSPECIFIED $0.0006046-0065 02/15/2006 02/25/2006 LUNG CANCER $532.9806048-0049 02/17/2006 03/28/2006 ACUTE OSTEOMYELITIS SITE UNSPECIFIED $5,000.0006055-0080 02/24/2006 04/07/2006 OSTEOMYELITIS $3,064.3006058-0038 02/27/2006 12/31/2006 BREAST CANCER $0.0006058-0039 02/27/2006 04/24/2006 TALIPES, UNSPECIFIED $65.1606060-0031 03/01/2006 04/12/2006 PNEUMONIA $5,166.50
Calendar Year 2006Case Management Cases
STATE OF WISCONSIN PLANS

Exhibit 1-B$
Case ID Case OpenedTreatment
Ended Diagnosis Savings$
Calendar Year 2006Case Management Cases
STATE OF WISCONSIN PLANS
06061-0013 03/02/2006 03/23/2006 LUNG CANCER $191.2106061-0024 03/02/2006 08/31/2006 OTHER INFLAMMATORY AND TOXIC NEUROPATHY $662.0006062-0023 03/03/2006 03/31/2006 APLASTIC ANEMIA $1,847.3606062-0032 03/03/2006 06/11/2006 MALIGNANT NEOPLASM OF HEAD, FACE, AND NECK $0.0006066-0068 03/07/2006 09/09/2006 CHRONIC KIDNEY DISEASE $37,574.7406067-0071 03/08/2006 05/03/2006 SEPTIC ARTHRITIC SHOULDER $2,836.0506069-0060 03/10/2006 03/15/2006 STATUS POST KNEE REPLACEMENT $306.2006073-0004 03/14/2006 03/21/2006 JOINT REPLACEMENT $0.0006074-0047 03/15/2006 04/05/2006 STATUS POST KNEE REPLACEMENT $198.0006075-0055 03/16/2006 06/15/2006 CONGESTIVE HEART FAILURE, UNSPECIFIED $28,611.0006075-0083 03/16/2006 04/03/2006 SEVERE PNEUMONIA $0.0006076-0093 03/17/2006 03/21/2006 OTHER AND UNSPECIFIED SLEEP APNEA $0.0006079-0041 03/20/2006 03/29/2006 SICKLE CELL ANEMIA $21,540.0006081-0035 03/22/2006 04/15/2006 CELLULITIS OF FOOT $0.0006081-0042 03/22/2006 05/01/2006 COMMON VARIABLE IMMUNODEFICIENCY $2,864.7506081-0048 03/22/2006 04/08/2006 CELLULITIS $336.2806082-0089 03/23/2006 04/20/2006 SEPTIC ARTHRITIS $2,575.4806083-0032 03/24/2006 04/17/2006 OSTEOARTHROSIS, LOCALIZED, NOT SPECIFIED PRIMARY OR SECONDARY, LOWER LEG $0.0006083-0035 03/24/2006 05/12/2006 CHRONIC MYELOID LEUKEMIA $0.0006087-0002 03/28/2006 04/28/2006 FREQUENT FALLS (no services under this case) $0.0006088-0008 03/29/2006 01/06/2006 GENERALIZED CONVULSIVE EPILEPSY, WITHOUT MENTION OF INTRACTABLE EPILEPSY $0.0006088-0028 03/29/2006 01/27/2006 CONGESTIVE HEART FAILURE, UNSPECIFIED $0.0006089-0013 03/30/2006 02/17/2006 CARE INVOLVING OTHER SPECIFIED REHABILITATION PROCEDURE $0.0006089-0059 03/30/2006 02/28/2006 DELIRIUM DUE TO CONDITIONS CLASSIFIED ELSEWHERE $0.0006089-0079 03/30/2006 04/02/2006 FEVER $135.0006090-0093 03/31/2006 02/01/2006 FRACTURE OF UNSPECIFIED PART OF NECK OF FEMUR, CLOSED $0.0006093-0077 04/03/2006 01/17/2006 CARE INVOLVING OTHER SPECIFIED REHABILITATION PROCEDURE $0.0006093-0095 04/03/2006 01/10/2006 LEFT HEART FAILURE $0.0006097-0023 04/07/2006 05/05/2006 CHRONIC BACK PAIN $792.0006100-0008 04/10/2006 01/09/2006 CARE INVOLVING OTHER PHYSICAL THERAPY $0.0006100-0071 04/10/2006 04/13/2006 PARKINSONISM non covered services -not a benefit of the policy-no savings $0.0006101-0013 04/11/2006 02/25/2006 CARE INVOLVING OTHER PHYSICAL THERAPY $0.0006101-0025 04/11/2006 01/31/2006 HIP JOINT REPLACEMENT STATUS $0.0006101-0040 04/11/2006 02/14/2006 CARE INVOLVING OTHER SPECIFIED REHABILITATION PROCEDURE $0.0006101-0067 04/11/2006 02/20/2006 DIABETES MELLITUS WITHOUT MENTION OF COMPLICATION, TYPE I (JUVENILE TYPE), NOT STATED AS $0.00

Exhibit 1-B$
Case ID Case OpenedTreatment
Ended Diagnosis Savings$
Calendar Year 2006Case Management Cases
STATE OF WISCONSIN PLANS
06102-0072 04/12/2006 10/31/2006 PULMONARY HYPERTENSION $131,071.9306102-0104 04/12/2006 01/18/2006 CARE INVOLVING OTHER SPECIFIED REHABILITATION PROCEDURE $0.0006103-0086 04/13/2006 01/24/2006 CEREBRAL ARTERY OCCLUSION, UNSPECIFIED, WITH CEREBRAL INFARCTION $0.0006107-0040 04/17/2006 11/10/2006 ADENOCARCINOMA PANCREAS $56.8506107-0094 04/17/2006 05/03/2006 MALIGNANT NEOPLASM OF BREAST (FEMALE), UNSPECIFIED $0.0006110-0035 04/20/2006 01/31/2006 INTRACEREBRAL HEMORRHAGE $0.0006110-0037 04/20/2006 01/07/2006 FRACTURE OF INTERTROCHANTERIC SECTION OF FEMUR, CLOSED $0.0006110-0044 04/20/2006 02/11/2006 CARE INVOLVING OTHER SPECIFIED REHABILITATION PROCEDURE $0.0006110-0062 04/20/2006 10/25/2006 CYSTIC FIBROSIS $126.0006110-0073 04/20/2006 01/31/2006 MUSCLE WEAKNESS (GENERALIZED) $0.0006110-0087 04/20/2006 02/28/2006 CARE INVOLVING OTHER SPECIFIED REHABILITATION PROCEDURE $0.0006111-0032 04/21/2006 01/18/2006 DECUBITUS ULCER, HEEL $0.0006111-0039 04/21/2006 01/31/2006 VOLUME DEPLETION, UNSPECIFIED $0.0006111-0059 04/21/2006 03/15/2006 CARE INVOLVING OTHER SPECIFIED REHABILITATION PROCEDURE $0.0006111-0071 04/21/2006 02/28/2006 CLOSED DISLOCATION HIP UNSPECIFIED $0.0006111-0076 04/21/2006 03/01/2006 CELLULITIS AND ABSCESS OF LEG, EXCEPT FOOT $0.0006114-0023 04/24/2006 03/16/2006 PNEUMONIA DUE TO HEMOPHILUS INFLUENZAE (H. INFLUENZAE) $0.0006114-0073 04/24/2006 02/27/2006 FRACTURE OF INTERTROCHANTERIC SECTION OF FEMUR, CLOSED $0.0006115-0301 04/25/2006 07/21/2006 ABSCESS $9,946.5006115-0315 04/25/2006 03/30/2006 CONGESTIVE HEART FAILURE, UNSPECIFIED $0.0006116-0016 04/26/2006 02/16/2006 CONGESTIVE HEART FAILURE, UNSPECIFIED $0.0006116-0074 04/26/2006 01/13/2006 FRACTURE OF UNSPECIFIED PART OF NECK OF FEMUR, CLOSED $0.0006117-0046 04/27/2006 01/07/2006 CONGESTIVE HEART FAILURE, UNSPECIFIED $0.0006118-0046 04/28/2006 05/02/2006 ADULT FAILURE TO THRIVE no services provided (medicare covered under hospice) $0.0006118-0053 04/28/2006 02/28/2006 OBSTRUCTIVE CHRONIC BRONCHITIS, WITH (ACUTE) EXACERBATION $0.0006121-0062 05/01/2006 05/02/2006 AFTERCARE FOLLOWING JOINT REPLACEMENT $154.0006121-0107 05/01/2006 02/24/2006 CARE INVOLVING OTHER SPECIFIED REHABILITATION PROCEDURE $0.0006122-0067 05/02/2006 01/20/2006 PNEUMONIA, ORGANISM UNSPECIFIED $0.0006122-0079 05/02/2006 01/09/2006 CARE INVOLVING OTHER PHYSICAL THERAPY $0.0006124-0045 05/04/2006 01/01/2007 CHRONIC KIDNEY DISEASE $1,773.2706124-0047 05/04/2006 10/13/2006 END STAGE CARDIAC DISEASE $0.0006124-0089 05/04/2006 05/04/2006 UNSPECIFIED SLEEP APNEA $0.0006128-0045 05/08/2006 05/08/2006 UNSPECIFIED SLEEP APNEA $0.0006128-0083 05/08/2006 09/27/2006 ORGAN OR TISSUE REPLACED BY TRANSPLANT, PERIPHERAL STEM CELLS $21,791.0006130-0042 05/10/2006 05/31/2006 KNEE JOINT REPLACEMENT STATUS $378.00

Exhibit 1-B$
Case ID Case OpenedTreatment
Ended Diagnosis Savings$
Calendar Year 2006Case Management Cases
STATE OF WISCONSIN PLANS
06131-0003 05/11/2006 07/03/2007 CHRONIC KIDNEY DISEASE $619.0006131-0022 05/11/2006 06/13/2006 STAPHLOCOCCUS AUREUS $14,174.1606132-0028 05/12/2006 07/07/2006 ALPORT'S SYNDROME $22,492.6806135-0098 05/15/2006 05/15/2006 OSTEOARTHROSIS UNSPECIFIED WHETHER GENERALIZED OR LOCALIZED, SITE UNSPECIFIED $0.0006136-0072 05/16/2006 12/20/2006 PULMONARY ABCESS $34,104.0306137-0085 05/17/2006 TONGUE CANCER $0.0006143-0008 05/23/2006 06/20/2006 LUMBAGO $0.0006144-0004 05/24/2006 06/22/2006 CHEST CONTUSSION $0.0006145-0061 05/25/2006 03/31/2006 ACUTE RESPIRATORY FAILURE $36,800.0006150-0059 05/30/2006 06/02/2006 RECTAL CANCER $0.0006153-0015 06/02/2006 08/22/2006 SPINAL INJURY $29,096.0006153-0017 06/02/2006 12/31/2006 NEUROGENIC BLADDER, NOT OTHERWISE SPECIFIED $1,360.6906153-0094 06/02/2006 08/07/2006 OSTEOARTHROSIS, LOCALIZED, PRIMARY LOWER LEG $123.9006156-0006 06/05/2006 03/01/2006 ULCER OF HEEL AND MIDFOOT $0.0006156-0037 06/05/2006 08/02/2006 FRACTURE OF TIBIA/FIBULA, SHAFT, CLOSED, FIBULA WITH TIBIA $0.0006157-0041 06/06/2006 06/06/2006 UNSPECIFIED SLEEP APNEA $0.0006163-0106 06/12/2006 07/03/2006 MENINGITIS $18,725.9106166-0019 06/15/2006 09/20/2006 MALIGNANT NEOPLASM OF CERVIX UTERI, UNSPECIFIED $0.0006170-0109 06/19/2006 07/02/2006 OPEN WOUND KNEE/LEG/ANKLE $778.0006171-0077 06/20/2006 07/03/2006 ACUTE LYMPHOID LEUKEMIA $702.2406174-0016 06/23/2006 12/01/2006 MALIGNANT NEOPLASM OF OVARY $668.3906174-0080 06/23/2006 07/31/2006 DEGENERATIVE JOINT DISEASE $580.0006177-0101 06/26/2006 04/30/2006 ULCER OF HEEL AND MIDFOOT $0.0006178-0015 06/27/2006 09/15/2006 OSTEOARTHROSIS UNSPECIFIED WHETHER GENERALIZED OR LOCALIZED, SITE UNSPECIFIED $0.0006180-0089 06/29/2006 08/09/2006 HIP FRACTURE $10,019.6006186-0022 07/05/2006 01/04/2007 ARTERIOVENOUS FISTULA, ACQUIRED $0.0006191-0029 07/10/2006 08/05/2006 OTHER POSTSURGICAL STATUS $507.0006192-0039 07/11/2006 12/11/2006 DIAGNOSIS OR CONDITION DEFERRED ON AXIS I, OR AXIS II $0.0006192-0104 07/11/2006 10/19/2006 METHICILLIN RESISTANT STAPHYLOCOCCUS AUREUS $0.0006192-0106 07/11/2006 07/31/2006 STATUS POST MILD CLOSED HEAD INJURY $16.0006195-0049 07/14/2006 08/07/2006 CARE INVOLVING OTHER SPECIFIED REHABILITATION PROCEDURE $0.0006198-0051 07/17/2006 10/15/2006 ONE SIDED WEAKNESS $1,830.0006201-0038 07/20/2006 08/06/2006 OTHER LYMPHOMAS UNSPECIFIED SITE, EXTRANODAL AND SOLID ORGAN SITES $0.0006202-0037 07/21/2006 07/22/2006 OSTEOARTHROSIS $170.0006202-0065 07/21/2006 09/11/2006 PELVIS FRACTURE $0.00

Exhibit 1-B$
Case ID Case OpenedTreatment
Ended Diagnosis Savings$
Calendar Year 2006Case Management Cases
STATE OF WISCONSIN PLANS
06202-0067 07/21/2006 08/10/2006 PELVIX FRACTURE $1,029.0006202-0073 07/21/2006 09/08/2006 STATUS POST TOTAL HIP REPLACEMENT $0.0006202-0081 07/21/2006 10/12/2006 STATUS POST LAMINECTOMY $46.6006205-0019 07/24/2006 08/29/2006 CHRONIC KIDNEY DISEASE $0.0006212-0095 07/31/2006 10/04/2006 FRACTURE ANKLE $0.0006214-0068 08/02/2006 08/15/2006 WEAKNESS $900.0006216-0074 08/04/2006 10/03/2006 INCISIONAL WOUND $2,154.0006221-0022 08/09/2006 08/09/2006 DEEP VEIN THROMBOSIS $38.0006222-0029 08/10/2006 09/01/2006 LYME DISEASE $1,850.0006222-0075 08/10/2006 09/21/2006 FEEDING DIFFICULTIES AND MISMANAGEMENT $18,960.0006223-0039 08/11/2006 09/16/2006 CHRONIC OBSTRUCTIVE PULMONARY DISEASE $23,265.0006223-0077 08/11/2006 08/15/2006 CHEMICAL BURNS $22.5006228-0088 08/16/2006 08/31/2006 PERFORATED VISCUS $282.0006229-0054 08/17/2006 02/07/2007 RENAL FAILURE $4,218.5306234-0096 08/22/2006 08/14/2006 MALIGNANT NEOPLASM OF BREAST (FEMALE), UNSPECIFIED $0.0006236-0006 08/24/2006 09/24/2006 OTHER MALIGNANT NEOPLASM OF SKIN OF LIP $250.3806236-0020 08/24/2006 09/25/2006 PNEUMONIA $6,748.3906237-0014 08/25/2006 12/31/2006 MALIGNANT NEOPLASM OF CHOROID $0.0006240-0080 08/28/2006 10/04/2006 ENDOCARDITIS $0.0006241-0017 08/29/2006 08/29/2006 UNSPECIFIED SLEEP APNEA $0.0006241-0044 08/29/2006 01/24/2007 OSTEOMYELITIS $21,631.1406243-0034 08/31/2006 04/30/2007 APERT SYNDROME $170.0006244-0085 09/01/2006 09/29/2006 STATUS POST HIP REPLACEMENT $5,225.0006250-0058 09/07/2006 10/18/2006 UROSEPSIS $10,443.1206251-0049 09/08/2006 09/15/2006 PNEUMONIA $221.2206254-0062 09/11/2006 09/11/2006 STATUS POST TOTAL KNEE REPLACEMENT $775.0006262-0039 09/19/2006 02/04/2006 UNSPECIFIED FRACTURE OF ANKLE, CLOSED $0.0006262-0072 09/19/2006 10/06/2006 TOTAL KNEE REPLACEMENT $0.0006263-0070 09/20/2006 09/20/2006 AFTERCARE FOR HEALING TRAUMATIC FRATURE OF UPPER LEG $0.0006264-0014 09/21/2006 10/20/2006 HEMORRHAGE OF GASTROINTESTINAL TRACT, UNSPECIFIED $377.1006264-0082 09/21/2006 11/30/2006 BRAIN MASS $0.0006265-0059 09/22/2006 10/06/2006 LOCALIZED ADIPOSITY $36.0006265-0071 09/22/2006 09/29/2006 ANKLE FRACTURE $2,590.0006268-0012 09/25/2006 10/26/2006 AFTERCARE FOR HEALING TRAUMATIC FRACTURE OF HIP $0.0006269-0018 09/26/2006 09/27/2006 SEVERE BURN $0.00

Exhibit 1-B$
Case ID Case OpenedTreatment
Ended Diagnosis Savings$
Calendar Year 2006Case Management Cases
STATE OF WISCONSIN PLANS
06270-0005 09/27/2006 11/29/2006 BREAST CANCER $0.0006270-0021 09/27/2006 11/06/2007 MALIGNANT NEOPLASM OF BREAST (FEMALE), UNSPECIFIED $0.0006271-0019 09/28/2006 10/03/2006 MESOTHELIOMA RIGHT LUNG $0.0006271-0040 09/28/2006 10/24/2006 HYPOTENSION $12,660.0006275-0093 10/02/2006 07/31/2006 ACUTE RESPIRATORY FAILURE $0.0006277-0003 10/04/2006 10/20/2006 FRACTURE OF UNSPECIFIED PART OF NECK OF FEMUR, CLOSED $0.0006279-0028 10/06/2006 10/20/2006 URINARY TRACT INFECTION, SITE NOT SPECIFIED $1,459.9206282-0039 10/09/2006 11/17/2006 WOUND DEHISCENCE $944.0006283-0002 10/10/2006 10/17/2006 OSTEOARTHROSIS UNSPECIFIED WHETHER GENERALIZED OR LOCALIZED, LOWER LEG $0.0006283-0010 10/10/2006 10/13/2006 RASH ON BUTTOCKS $114.0006283-0011 10/10/2006 03/21/2007 ESOPHAGEAL CANCER $183.4506283-0025 10/10/2006 12/31/2006 PREMATURE INFANT $1,891.2806285-0036 10/12/2006 11/23/2006 FALL $1,297.9106286-0029 10/13/2006 11/15/2006 PROSTATE CANCER $0.0006286-0056 10/13/2006 11/29/2006 OSTEOMYELITIS OF KNEE $24,464.1606290-0080 10/17/2006 06/30/2006 CHRONIC AIRWAY OBSTRUCTION, NOT ELSEWHERE CLASSIFIED $3,442.3506291-0039 10/18/2006 11/19/2006 PNEUMONITIS DUE TO INHALATION OF FOOD OR VOMITUS $296.7506292-0010 10/19/2006 12/04/2006 MALIGNANT NEOPLASM OF LOWER THIRD OF ESOPHAGUS $0.0006292-0022 10/19/2006 12/21/2006 PNEUMONIA $2,065.3406292-0076 10/19/2006 11/03/2006 STATUS POST HIP REPLACEMENT $157.4406293-0070 10/20/2006 08/23/2006 UNSPECIFIED ESSENTIAL HYPERTENSION $0.0006297-0095 10/24/2006 01/02/2007 NEOPLASM OF UNSPECIFIED NATURE OF BRAIN $0.0006297-0103 10/24/2006 11/10/2006 GLIOBLASTOMA $129.0006298-0046 10/25/2006 HEPATOCELLULAR CARCINOMA $0.0006300-0016 10/27/2006 05/31/2006 CARE INVOLVING OTHER PHYSICAL THERAPY $6,300.0006303-0045 10/30/2006 11/13/2006 SINUSITIS $0.0006305-0068 11/01/2006 MALIGNANT NEOPLASM OF OTHER SPECIFIED SITES OF FEMALE BREAST $0.0006305-0069 11/01/2006 12/08/2006 MALIGNANT NEOPLASM OF OVARY $0.0006306-0037 11/02/2006 11/14/2006 PYLONEPHRITIS $2,909.9006306-0086 11/02/2006 12/28/2006 HODGKIN'S DISEASE, UNSPECIFIED TYPE, UNSPECIFIED SITE, EXTRANODAL AND SOLID ORGAN SITES $0.0006307-0073 11/03/2006 12/11/2006 MORBID OBESITY $0.0006307-0079 11/03/2006 06/18/2007 RESTRICTIVE PULMONARY DISEASE $228.9406310-0142 11/06/2006 01/06/2007 ANGINA $596.3106311-0034 11/07/2006 11/07/2006 UNSPECIFIED SLEEP APNEA $0.0006312-0020 11/08/2006 08/31/2006 DEBILITY, UNSPECIFIED $15,810.00

Exhibit 1-B$
Case ID Case OpenedTreatment
Ended Diagnosis Savings$
Calendar Year 2006Case Management Cases
STATE OF WISCONSIN PLANS
06312-0072 11/08/2006 01/15/2007 LATE EFFECTS OF ACUTE POLIOMYELITIS $8,749.8706313-0004 11/09/2006 11/29/2006 ACUTE MYOCARDIAL INFARCTION (HEART ATTACK) $0.0006313-0143 11/09/2006 11/16/2006 LUNG INFECTION $5,239.7806318-0010 11/14/2006 01/11/2007 OLECRANON BURSITIS $586.6006319-0035 11/15/2006 12/31/2006 PREGNANT STATE, INCIDENTAL $57,174.7906321-0112 11/17/2006 12/31/2006 RIGHT KNEE INFECTION $3,566.0006325-0012 11/21/2006 12/06/2006 NEOPLASM OF UNSPECIFIED NATURE OF BRAIN $0.0006325-0021 11/21/2006 11/16/2006 DECUBITUS ULCER, BUTTOCK $12,480.0006326-0042 11/22/2006 12/13/2006 HEAD AND NECK CANCER $855.0006331-0013 11/27/2006 12/30/2006 ENDOCARDITIS $91.0006331-0089 11/27/2006 12/27/2006 WOUND INFECTION $432.0006348-0025 12/14/2006 12/29/2006 COMPLICATIONS FROM OUTPATIENT SURGERY $0.0006349-0059 12/15/2006 STAGE 2 LYMPHOMA $0.0006352-0036 12/18/2006 12/18/2006 MALIGNANT NEOPLASM OF PROSTATE $0.0006352-0098 12/18/2006 12/18/2006 CELLULITIS AND ABSCESS OF LEG, EXCEPT FOOT $0.0006354-0030 12/20/2006 01/03/2007 OVARIAN CANCER $0.0006354-0031 12/20/2006 01/02/2007 PELVIC CANCER $0.0006355-0031 12/21/2006 01/10/2007 MALIGNANT NEOPLASM OF ESOPHAGUS, UNSPECIFIED $0.0006355-0081 12/21/2006 MALIGNANT NEOPLASM OF OVARY $0.0006360-0093 12/26/2006 01/10/2007 FRACTURE PATELLA $0.0006362-0088 12/28/2006 02/28/2007 OSTEOARTHROSIS UNSPECIFIED WHETHER GENERALIZED OR LOCALIZED, SITE UNSPECIFIED $0.00
Total $911,381.82

Exhibit 1-C$
Case ID Case Opened Diagnosis Savings$
06072-0115 03/13/2006 SCHIZOAFFECTIVE DISORDER $4,800.0006082-0092 03/23/2006 SCHIZOAFFECTIVE DISORDER $23,800.0006115-0310 04/24/2006 MOOD DISORDER $1,140.0006321-0095 11/17/2006 DEPRESSION $1,512.0006152-0027 07/15/2006 BIPOLAR DISORDER $400.0006089-0081 03/30/2006 DEPRESSIVE DISORDER $1,900.0006059-0064 02/28/2006 MAJOR DEPRESSIVE DISORDER-RECURRENT $3,500.0006107-0045 08/01/2006 MAJOR DEPRESSION $1,050.0006208-0031 07/27/2006 DEPRESSIVE DISORDER $1,000.0006243-0014 08/30/2006 ANXIETY DISORDER $1,800.0006305-0087 10/30/2006 MAJOR DEPRESSIVE DISORDER-RECURRENT $250.0006027-0021 03/03/2006 ALCOHOL DEPENDENCE $2,160.0006047-0053 02/22/2006 MAJOR DEPRESSIVE DISORDER-RECURRENT $1,382.0006058-0091 02/27/2006 DYSTHYMIC DISORDER $2,080.0006060-0082 08/24/2006 DISSOCIATIVE IDENTITY DISORDER $935.0006060-0088 03/06/2006 RECURRENT SEVERE DEPRESSIVE DISORDER WITHOUT PSYCHOTIC FEATURES $900.0006068-0081 03/09/2006 ADJUSTMENT DISORDER $1,320.0006073-0107 09/30/2006 DYSTHYMIC DISORDER $750.0006081-0049 11/10/2006 MAJOR DEPRESSION $1,820.0006089-0073 07/31/2006 ANXIETY DISORDER $560.0006094-0062 04/18/2006 PERVASIVE DEVELOPMENTAL DISORDER $1,860.0006095-0079 07/11/2006 ANXIETY DISORDER $1,260.0006101-0050 08/30/2006 MAJOR DEPRESSION $1,640.0006129-0025 05/05/2006 BIPOLAR DISORDER $972.0006157-0017 06/06/2006 DYSTHYMIC DISORDER $2,800.0006164-0068 06/12/2006 ADJUSTMENT DISORDER $840.0006205-0088 07/25/2006 MAJOR DEPRESSION $1,440.0006223--0034 08/10/2006 ADJUSTMENT DISORDER $720.0006250-0057 09/07/2006 MAJOR DEPRESSION $3,890.0006130-0058 04/14/2006 DEPRESSION $1,620.0006102-0058 04/12/2006 ADJUSTMENT DISORDER WITH ANXIETY AND DEPRESSION $480.0006118-0029 07/06/2006 MAJOR DEPRESSION $720.0006128-0079 05/10/2006 CCOGNITIVE DISORDER $1,134.0006172-0008 09/22/2006 BBIPOLAR DISORDER $1,120.0006181-0050 10/06/2006 ANXIETY DISORDER $1,440.00
Calendar Year 2006Behavioral Health Case Management Cases
STATE OF WISCONSIN PLANS

Exhibit 1-C$
Case ID Case Opened Diagnosis Savings$
Calendar Year 2006Behavioral Health Case Management Cases
STATE OF WISCONSIN PLANS
06228-0089 08/16/2006 DSYTHMIC DISORDER $2,500.0006229-0071 08/17/2006 ANXIETY DISORDER $560.0006234-0066 08/22/2006 ALCOHOL DEPENDENCE $1,400.0006250-0015 09/07/2006 MAJOR DEPRESSION $1,066.0006257-0092 09/14/2006 MAJOR DEPRESSION $280.0006265-0079 09/22/2006 DSYTHMIC DISORDER $840.0006304-0119 10/31/2006 OPIOD DEPENDENCE $560.0006271-0008 09/27/2006 ANXIETY DISORDER $840.00
Total $83,041.00

2
State of Wisconsin Plans Care Management Focus on Wellness and Prevention
Prevalence of Hypertension is high
10% of WPS members have high blood pressure identified from claims analysis 35 are severe (that we identified from CaseAlert predictive modeling) Hypertension is often unidentified and unmanaged
Impact of Hypertension Increased risk of serious health complications including:
– Heart attack/heart failure – Stroke – Arteriosclerosis/Atherosclerosis – Coronary Artery disease – Kidney failure – Metabolic syndrome
What can the State of Wisconsin do for state employees in collaboration with WPS and other health plans? Provide visible messages of concern through education in the workplace about:
− Understanding hypertension and how to manage it through diet and exercise. − Blood Pressure Screening in the workplace or Encouragement to “know your numbers”

3
State of Wisconsin Plans Care Management Bariatric Surgery Center of Excellence In 2006 23 Bariatric Surgeries were covered by the WPS plans for state employees. Criteria has been established by the American Society of Bariatric Surgery in conjunction with the Surgery Review Corporation for designating Bariatric Surgery Centers of Excellence. Currently, eight centers have such a designation in Wisconsin and are distributed geographically around the state: Brookfield – Elmbrook Memorial Green Bay – Bellin Health LaCrosse – Gundersen Lutheran Medical Center Madison – UW Hospital and Clinics Milwaukee – Aurora Sinai Medical Center Columbia/St. Mary’s Bariatric Center Froedtert Memorial Lutheran Hospital Neenah – Theda Clark Medical Center Note: WPS will need to develop special provider agreements with selected centers to obtain case rates or other pricing arrangements. To assist with managing the cost and quality of care, WPS will work with the State of WI staff to determine an approach, and 2008 benefit language, to direct members to Bariatric Surgery Centers of Excellence with whom we have provider agreements for coverage and care for this procedure, assuming the member meets the WPS medical necessity criteria.