state population forecast: 2010-2040 office of financial management forecasting division november...
TRANSCRIPT
State Population Forecast: 2010-2040
Office of Financial ManagementForecasting Division
November 29, 2012
Office of Financial Management
General Findings
• State population growth is expected slow around 2025.
• The state’s population will become increasingly older each year. This aging process will cause a decline in the number of births due to a smaller proportion of women at child bearing age. At the same time, an elderly population is at greater risk of dying, thus contributing to an increase in the number of deaths.
• Migration is expected to bounce back to 45,000 annually after 2022 and will continue to serve as the main contributor to state population growth.
Office of Financial Management
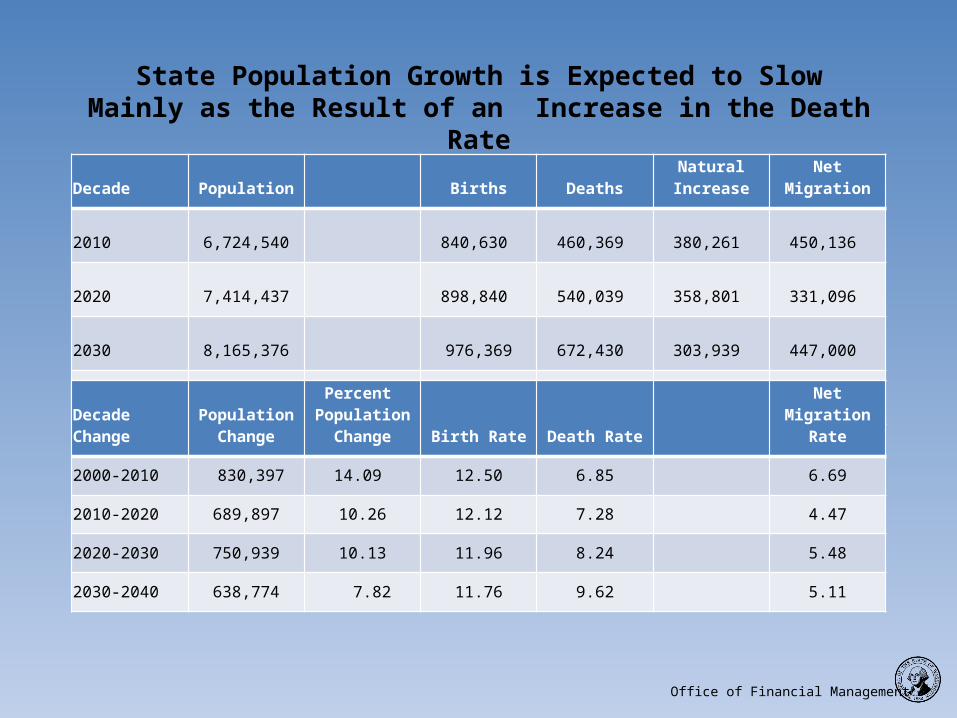
State Population Growth is Expected to Slow Mainly as the Result of an Increase in the Death Rate
Decade Population Births DeathsNatural
Increase Net Migration
2010 6,724,540 840,630 460,369 380,261 450,136
2020 7,414,437 898,840 540,039 358,801 331,096
2030 8,165,376 976,369 672,430 303,939 447,000
2040 8,804,150 1,035,618 846,844 188,774 450,000
Decade Change
Population Change
Percent Population
Change Birth Rate Death RateNet Migration
Rate
2000-2010 830,397 14.09 12.50 6.85 6.69
2010-2020 689,897 10.26 12.12 7.28 4.47
2020-2030 750,939 10.13 11.96 8.24 5.48
2030-2040 638,774 7.82 11.76 9.62 5.11
Office of Financial Management
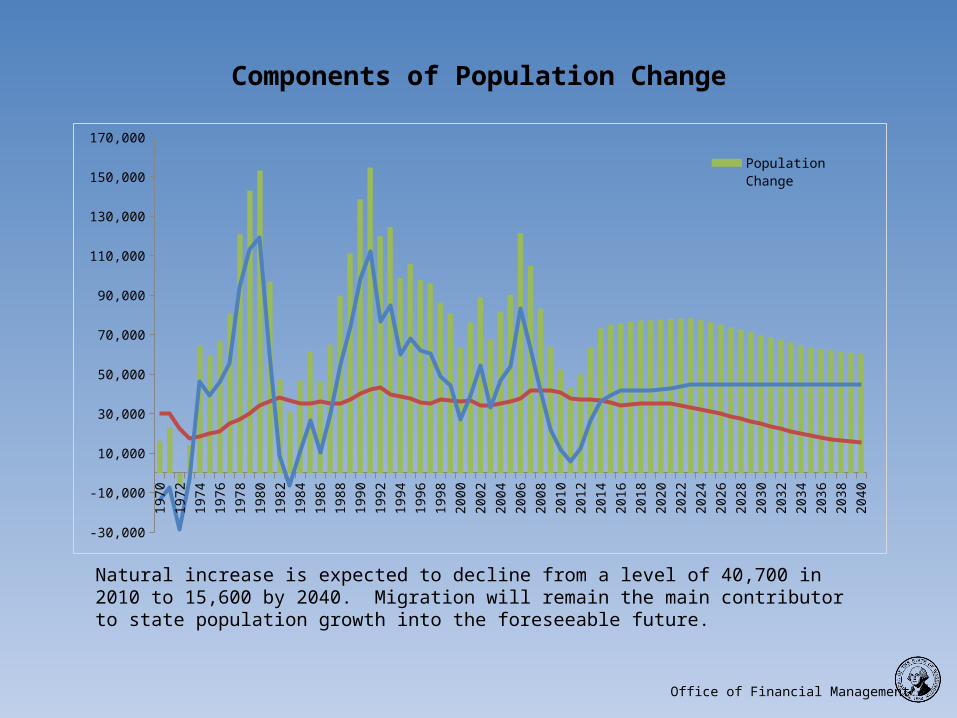
Components of Population Change
1970
1972
1974
1976
1978
1980
1982
1984
1986
1988
1990
1992
1994
1996
1998
2000
2002
2004
2006
2008
2010
2012
2014
2016
2018
2020
2022
2024
2026
2028
2030
2032
2034
2036
2038
2040
-30,000
-10,000
10,000
30,000
50,000
70,000
90,000
110,000
130,000
150,000
170,000Population Change
Natural Increase
Net Migration
Natural increase is expected to decline from a level of 40,700 in 2010 to 15,600 by 2040. Migration will remain the main contributor to state population growth into the foreseeable future.

Office of Financial Management
1970 1980 1990 2000 2010 2020 2030 20400
200,000
400,000
600,000
800,000
1,000,000
1,200,000
1,400,000
1,600,000
1,800,000
2,000,000
Washington State PopulationAge 65+
Pop 65+ Pop 70+ Pop 80+ Pop 85+
1970-80 1980-90 1990-00 2000-10 2010-20 2020-30 2030-400%
10%
20%
30%
40%
50%
60%
21%18%
21%
14%10% 10%
8%
35%32%
16%
25%
51%
34%
11%
Percent Decade Growth TrendsTotal Population and Age 65+
Total Pop Pop 65+
Between 2011 and 2029, all of the Baby Boomers will turn 65. While the total population is expected to grow by no more than 10 percent per decade in the next 30 years, the 65 and over population is expected to grow by 51 percent between 2010-20, and 34 percent between 2020-30. By 2040, the 65 and over population is projected to reach 1.8 million—an increase of just over one million persons since 2010.
As the Baby Boomers Age, the Demand for Senior Services Will Increase
Office of Financial Management
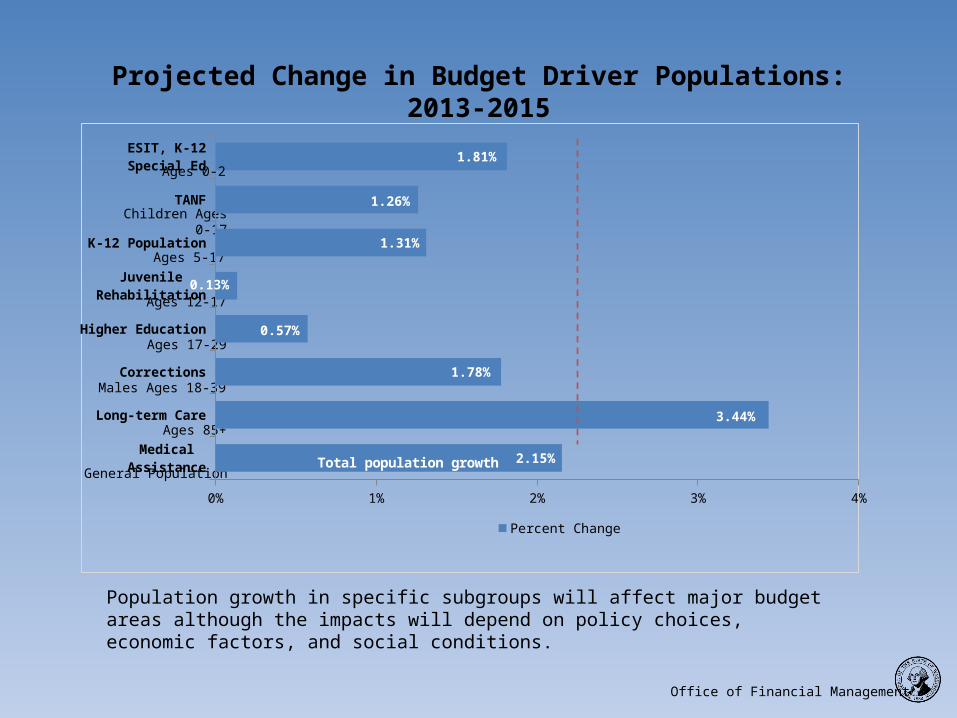
Projected Change in Budget Driver Populations: 2013-2015
Population growth in specific subgroups will affect major budget areas although the impacts will depend on policy choices, economic factors, and social conditions.
Ages 12-17
Males Ages 18-39
General Population
Ages 85+
Children Ages 0-17
Ages 17-29
Ages 5-17
Medical Assistance
Long-term Care
Corrections
Higher Education
Juvenile Rehabilita-tion
K-12 Population
TANF
ESIT, K-12 Special Ed
0% 1% 2% 3% 4%
2.15%
3.44%
1.78%
0.57%
0.13%
1.31%
1.26%
1.81%
Percent Change
Total population growth
Ages 0-2

Office of Financial Management
Contact Information
Yi Zhao, Chief DemographerOFM / Forecasting