statewide economic impact report
DESCRIPTION
NAIOP Colorado is proud to announce the publication of its inaugural study on the impact of commercial real estate on Colorado\'s economy. A joint study by the University of Colorado and the University of Denver finds that the commercial real estate sector accounts for more than 10 percent of Colorado\'s economy. Commercial real estate generated $23.4 billion in 2006 economic impact, with almost 70 percent coming from existing properties.TRANSCRIPT

Submitted by
University of Colorado Real Estate Center Thomas G. Thibodeau Ph.D. -Academic DirectorBrian Lewandowski - MBA, Leeds School of Business
University of Denver, Franklin L. Burns School of Real Estate & Construction ManagementGlenn R. Mueller Ph.D. - ProfessorAndrew G. Mueller, MSRECM candidate,Burns School of RECM
McGraw Hill Construction Research & Analytics
Real Capital Analytics, Inc.
Colorado’s Commercial Real Estate IndustryStatewide Economic Impact Report
Research sponsored by:
National Association ofIndustrial and Office Properties
The Forum for Commercial Real Estate
Colorado Chapter


Submitted by
University of Colorado Real Estate Center Thomas G. Thibodeau Ph.D. -Academic DirectorBrian Lewandowski - MBA, Leeds School of Business
University of Denver, Franklin L. Burns School of Real Estate & Construction ManagementGlenn R. Mueller Ph.D. - ProfessorAndrew G. Mueller, MSRECM candidate,Burns School of RECM
McGraw Hill Construction Research & Analytics
Real Capital Analytics, Inc.
NAIOP Colorado Chapter1720 S. Bellaire Street, Suite 110
Denver, CO 80222-4303Ph: (303) 782-0155Fax: (303) 820-3844
www.naiop-colorado.org
Research sponsored by
Colorado’s Commercial Real Estate IndustryStatewide Economic Impact Report

The National Association of Industrial and Office Properties is thenation’s leading trade association for developers, owners, investors andother professionals in industrial, office, retail and mixed-use commercialreal estate. Founded in 1967, NAIOP comprises 15,000+ members in 54chapters throughout North America. NAIOP provides networking oppor-tunities, educational programs, research on trends and innovations andstrong legislative representation.
The Colorado Chapter includes over 700 members. Our monthly breakfast meetings are open to non-members.
If you are involved with commercial real estate in Colorado (includingoffice, industrial, retail, mixed use, etc.) as a developer, owner or investoror affiliated service provider, then you should be involved with us!
©2008 National Association of Industrial and Office Properties ColoradoChapter. All Rights Reserved.
Is is important to remember that the data collection measures includedin this report should be regarded as guidelines rather than as absolutestandards. The information readily available may differ according to thegeographic area in question, and results may vary accordingly. Local andregional economic performance is a key factor. Further study and evalua-tion are recommended before any investment decisions are made.
This project is intended to provide information and insight to industrypractitioners and does not constitute advice or recommendations.NAIOP Colorado disclaims any liability for action taken as a result of thisproject and its findings.
About NAIOP

Preface

Foreward

i
List of Tables / List of Figures ................................................................iiList of Appendices..................................................................................iiiExecutive Summary ................................................................................1Introduction ............................................................................................5
Commercial and Multifamily Property in Colorado: 1967-2006 ........7Methodology ........................................................................................10Economic Impacts of Existing Commercial Property ..........................11
Total Area ..........................................................................................11Summary of Impacts for Existing Commercial Properties ................12
Existing Office Properties ..............................................................13Existing Industrial Properties..........................................................14Existing Retail Properties ..............................................................15Existing Hotel Properties................................................................16
Economic Impacts of Tenant Improvements ........................................17Summary of Tenant Improvements Impacts ......................................17
Office Property Tenant Improvements ..........................................18Industrial Property Tenant Improvements ......................................18Retail Property Tenant Improvements............................................19Hotel Property Tenant Improvements ............................................19Multifamily Property Tenant Improvements ..................................20
Economic Impacts of New Construction ..............................................21Summary of Impacts for New Construction ......................................21
Office Property New Construction ................................................22Industrial Property New Construction............................................22Retail Property New Construction..................................................23Hotel Property New Construction..................................................23Multifamily Property New Construction ........................................24
Economic Impacts of Commercial Property Transactions ....................25Economic Impacts of Commercial Property Refinancing ....................26Fiscal Impacts ........................................................................................27
Commercial Property Taxes ..............................................................27Commercial Property Sales Taxes......................................................28
Conclusion ............................................................................................28
Table of Contents

ii
Table 1: Economic Impacts of Commercial Real Estate and Multifamily Construction on Colorado’s Economy....................................................................................2
Table 2: Colorado Real Estate Regions ..................................................................................................................6Table 3: Existing Property, Square Feet (000), by Region, 2006 ..........................................................................12Table 4: Economic Impacts of Existing Commercial Property, by Region, 2006 ................................................13Table 5: Economic Impacts of Existing Office Real Estate, by Region, 2006 ......................................................14Table 6: Economic Impacts of Existing Industrial Real Estate, by Region, 2006..................................................15Table 7: Economic Impacts of Existing Retail Real Estate, by Region, 2006 ......................................................16Table 8: Economic Impacts of Existing Hotel Real Estate, by Region, 2006........................................................17Table 9: Economic Impacts of Tenant Improvements, by Region, 2006 ..............................................................18Table 10: Economic Impacts of Office Tenant Improvements, by Region, 2006 ..................................................18Table 11: Economic Impacts of Industrial Tenant Improvements, by Region, 2006 ..............................................19Table 12: Economic Impacts of Retail Tenant Improvements, by Region, 2006 ....................................................19Table 13: Economic Impacts of Hotel Tenant Improvements, by Region, 2006 ....................................................20Table 14: Economic Impacts of Multifamily Tenant Improvements, by Region, 2006 ..........................................20Table 15: Economic Impacts of New Construction, by Region, 2006 ....................................................................21Table 16: Economic Impacts of Office Construction, by Region, 2006..................................................................22Table 17: Economic Impacts of Industrial Construction, by Region, 2006 ............................................................22Table 18: Economic Impacts of Retail Construction, by Region, 2006 ..................................................................23Table 19: Economic Impacts of Hotel Construction, by Region, 2006 ..................................................................23Table 20: Economic Impacts of Multifamily Construction, by Region, 2006..........................................................24Table 21: Total Commercial Property Transaction Volume, in 000s, by Region, 2006 ..........................................25Table 22: Total Commercial Property Transaction Fees, in 000s, by Region, 2006 ..............................................25Table 23: Total Commercial Property Refinancing Volume, in 000s, by Region, 2006 ..........................................26Table 24: Total Commercial Property Refinancing Fees, in 000s, by Region, 2006 ..............................................26Table 25: Colorado Assessed Property Value and Estimated Taxes, 000s, by Region, 2006 ................................27Table 26: Summary Impacts of Commercial Real Estate and
Multifamily Construction on Colorado’s Economy, 2006........................................................................29Table 27: Per Square Foot Office Property Operating Expenses ..........................................................................32Table 28: Per Square Foot Retail Property Operating Expenses ..........................................................................33Table 29: Industrial Property Operating Expenses, 2006 Estimates ......................................................................33Table 30: Denver-Boulder-Greeley CPI ..................................................................................................................34Table 31: Construction and Tenant Improvements Soft Costs Estimates ..............................................................35
Figure 1: Impacts of Commercial Real Estate and Multifamily Construction on Colorado Regions, 2006 ............3
Figure 2: Direct Spending Per Employee, 2006 ......................................................................................................3
Figure 3: Per Capita Impacts of Commercial Real Estate and Multifamily
Construction on Colorado Regions, 2006 ................................................................................................4
Figure 4: Map of Colorado Real Estate Regions......................................................................................................6
Figure 5: Colorado Commercial and Multifamily Construction, 1967-2006 ............................................................7
Figure 6: Colorado Commercial and Multifamily Property Stock, 1970-2006 ........................................................7
Figure 7: Colorado Commercial and Multifamily Construction Value Versus GDP, 1967-2006 ..............................8
Figure 8: Colorado Commercial and Multifamily Construction as a Percent of GDP, 1967-2006 ..........................9
Figure 9: Colorado Property Tenant Improvements, 1967-2006 ............................................................................9
List of Tables
List of Figures

iii
Appendix A: Economic Impacts, by County, 2006 ..................................................................................................30
Appendix B: Notes to Methodology........................................................................................................................31
Appendix C: RIMS II Colorado Regions ..................................................................................................................36
Appendix D: Supply of Existing Commercial and Multifamily Property
(000s sf), by Property Type, by County, 2006 ....................................................................................37
Appendix E: Economic Impacts of Existing Commercial Property, by County, 2006..............................................38
Appendix F: BOMA Office Expense Definitions ......................................................................................................39
Appendix G: Economic Impacts of Existing Office Real Estate, by County, 2006 ..................................................40
Appendix H: Economic Impacts of Existing Industrial Real Estate, by County, 2006..............................................41
Appendix I: Urban Land Institute Retail Expense Definitions ................................................................................42
Appendix J: Economic Impacts of Existing Retail Real Estate, by County, 2006 ..................................................43
Appendix K: Economic Impacts of Existing Hotel Real Estate, by County, 2006....................................................44
Appendix L: Economic Impacts of Tenant Improvements, by County, 2006 ..........................................................45
Appendix M: Economic Impacts of Office Tenant Improvements, by County, 2006................................................46
Appendix N: Economic Impacts of Industrial Tenant Improvements, by County 2006 ..........................................47
Appendix O: Economic Impacts of Retail Tenant Improvements, by County, 2006 ................................................48
Appendix P: Economic Impacts of Hotel Tenant Improvements, by County, 2006 ................................................49
Appendix Q: Economic Impacts of Multifamily Tenant Improvements, by County, 2006........................................50
Appendix R: Economic Impacts of New Construction, by County, 2006 ................................................................51
Appendix S: Economic Impacts of Office Construction, by County, 2006..............................................................52
Appendix T: Economic Impacts of Industrial Construction, by County, 2006 ........................................................53
Appendix U: Economic Impacts of Retail Construction, by County, 2006 ..............................................................54
Appendix V: Economic Impacts of Hotel Construction, by County, 2006 ..............................................................55
Appendix W: Economic Impacts of Multifamily Construction, by County, 2006......................................................56
Appendix X: Colorado Assessed Property Value and Estimated Taxes, by County, 2006 ......................................57
Appendix Y: Assessed Valuation, Revenue, and Average Levies by County, 2006 ................................................59
List of Appendices


1
The commercial real estate industry impacts the Colorado economy ina variety of ways. The industry purchases construction and buildingmaintenance materials from Colorado suppliers and provides jobs forColorado residents. Existing income-producing properties providepermanent jobs maintaining, managing, and leasing property. Newconstruction and tenant improvements employ construction workers,architects, and engineers. Income-producing property transactions andrefinancing provide employment in the brokerage, financing, and legalprofessions. Finally, revenues generated by property and sales taxesare important sources of financing public services.
Activities in the commercial and multifamily property sectors have twomeasurable impacts on Colorado’s economy. First, income-producingproperty spending has direct impacts on the State’s output, earnings,and employment. Second, each dollar spent in the Colorado realestate industry has an indirect, or multiplier, effect on the Coloradoeconomy. The indirect influence of real estate spending occurs whenmoney spent on real property is used to purchase other goods andservices in the State. For example, real estate employees spend wagesearned in their jobs on housing, food, clothes, entertainment and othergoods and services in Colorado. These expenditures create moreemployment and increase output in other industries.
This report estimates the direct and indirect impacts that income-producing property has on the Colorado economy. Economic impactsare reported separately for existing properties, for tenantimprovements, new construction, transactions, refinancing, and for thefiscal impacts of property and sales taxes. Economic impacts arereported for the entire State of Colorado, for eight regions in Coloradoand for each county.
Direct income-producing property spending was estimated at $12.3 billion in 2006, or 5.4% of Colorado’s economy. The total (direct andindirect) economic impact that income-producing properties had onthe State’s output totaled $24.3 billion in 2006, or 10.5% of Colorado’seconomy. In 2006, there were 137,832 direct employees servicingColorado’s income-producing property sector, earning an annualaverage income of $32,832. Total 2006 employment (direct plusindirect) in the State attributable to income-producing property was254,976, with employees earning an average annual wage of $32,177(Table 1). Most of the economic impact ($16.1B of the $24.3B) wasgenerated by existing income-producing properties. Office and hotelproperties account for nearly 76% of this contribution. New income-producing construction contributed $3.3B in direct spending and $6.9Bin total output (direct plus indirect economic impacts). See Appendix Afor county specific impacts of existing, tenant improvements, andconstruction.
Executive Summary

2
Existing2
Office 3,377,771 7,026,103 1,386,691 2,509,433 38,973 74,756
Industrial 301,387 623,368 132,039 230,295 3,293 6,449
Retail 1,574,128 3,256,520 705,653 1,219,051 18,627 35,106
Hotel 2,881,556 5,158,947 984,274 1,663,087 45,793 67,255
Total Existing 8,134,842 16,064,938 3,208,657 5,621,866 106,686 183,566
Tenant Improvements
Office 96,426 212,582 35,339 72,056 840 1,995
Industrial 14,693 33,231 5,367 11,261 128 312
Retail 94,036 211,932 34,496 71,906 820 1,987
Hotel 112,504 248,651 40,974 84,157 974 2,321
Multifamily 27,195 60,587 10,016 20,616 238 571
Total TI 344,854 766,983 126,192 259,996 3,000 7,186
New Construction
Office 465,385 1,008,333 170,534 341,997 4,054 9,478
Industrial 517,969 1,091,131 190,880 371,999 4,560 10,386
Retail 536,406 1,179,158 196,923 400,545 4,681 11,080
Hotel 313,518 574,134 109,816 189,096 2,608 5,249
Multifamily 1,431,905 3,016,571 522,341 1,018,760 12,242 28,031
Total Construction 3,265,183 6,869,327 1,190,494 2,322,397 28,145 64,224
Other3
Construction Period
Interest/Fees 137,294 137,294 - - - -
Transactions 411,408 411,408 - - - -
Refinancing 47,093 47,093 - - - -
Total Other 595,795 595,795 - - - -
Total All 12,340,674 24,297,043 4,525,343 8,204,259 137,832 254,976
1Employment refers to the number of workers, both full time and part time. 2Existing does not include multifamily.3Other does not include multifamily, nor the impact on employment, earnings, multiplier effect, or impact on individual counties due to the uncertainty of the source of, and redeployment of funds.
Sources: McGraw-Hill Construction Research & Analytics, 2007; BOMA International, Experience Exchange Report 2007; Urban Land Institute, Dollars & Cents ofShopping Centers / The SCORE 2006; PKF Hospitality Research; NAIOP Industrial Income and Expense Report 2001-2002; Real Capital Analytics; NorthMarq Capital; University of Colorado-Boulder; University of Denver
Table 1: Economic Impacts of Commercial Real Estate and Multifamily Construction on Colorado’s Economy
Direct Spending
(000)Total Output
(000)Direct Earnings
(000)Total Earnings
(000)Direct
Employment1
Total Employment
The impact of income-producing property was highly variable by region, with the greatest impactslocated in the Denver Metro, North Front Range, and Mountain Resort regions, tallying 79.3% of thetotal impact collectively (Figure 1).

3
Figure 1: Impacts of Commercial Real Estate and Multifamily Construction on Colorado Regions, 2006
* Regions exclude the refinancing and transaction impacts because these impacts were measured at the state level, but not the county or regional level.
Average direct spending per income-producing real estate employee was $85,212, with a regional standard deviationof $8,613 (10.1%) (Figure 2). The Denver Metro region accounted for nearly 53.2% of direct spending, and thereforegreatly impacted the average.
Figure 2: Direct Spending Per Employee, 2006

4
The per capita impacts of income-producing property on Colorado regions were highly variable in 2006, with thegreatest impact at $16.35 per person occurring in the Mountain Resort region (Figure 3). Naturally, areas with higherlevels of income-producing property activity and comparably smaller populations will have larger per capita impacts, asis true in the Mountain Resort and Pueblo regions. The average per capita impact for the eight regions was $4.34.
Figure 3: Per Capita Impacts of Commercial Real Estate and Multifamily Construction on Colorado Regions, 2006
County Population Source: U.S. Census Bureau, www.census.gov, as of September 26, 2007.

5
I. Introduction
At the request of the Colorado Chapter of the National Association ofIndustrial and Office Properties (NAIOP), the University of Colorado-Boulder and the University of Denver collaboratively analyzed the economic impacts of income-producing property on Colorado’seconomy in 2006.
Income-producing property is undoubtedly a major contributor to theColorado economy in terms of output, employment, and wages. Thisreport defines commercial property as office, industrial, retail, and hotel.Income-producing property is commercial and new multifamilyconstruction. It estimates the economic and fiscal impacts of the income-producing property industry on output, earnings, and employment.
Economic impacts are reported for the entire State of Colorado andseparately by region based on economic and geographic similaritiesidentified in the 2006 publication “Economic Contributions of RealEstate Activity and Value in Colorado” produced by the BusinessResearch Division of the Leeds School of Business at the University ofColorado-Boulder (Table 2 and Figure 4). The appendices provideindividual county impacts. Impacts for Broomfield County are notreported separately due to the inauguration of county status in 2001.Since Broomfield County was created from land located in Adams,Boulder, Jefferson, and Weld counties, the impacts that income-producing property had in Broomfield County are included in thesefour counties.
The income-producing property industry contributes to the Coloradoeconomy by purchasing goods and services from Colorado suppliersand by providing jobs throughout the lifecycle of a property. From the time an income-producing property is conceived by a developer,lawyers, architects, engineers, and a host of other real estateprofessionals become involved in the planning of the building, thesurrounding land, and the public and private infrastructure required tosupport the development. During the construction phase, an even largergroup of professionals are called to action, from builders to constructionmanagers orchestrating numerous construction trades, includingcarpenters, steel workers, plumbers, electricians, landscape architects,heavy equipment operators, concrete specialists, and many more.Finally, once construction is complete, the property employs another setof individuals to keep the building operating, including leasing agents,financiers, maintenance workers, and property managers.

6
Figure 4: Map of Colorado Real Estate Regions
Source: Business Research Division, Leeds School of Business.
The total economic impact of income-producing property spending on the Colorado economy is estimated in twoparts. First, spending has a direct contribution to output, earnings, and employment. Employment refers to the number of employees, both full time and part time. Spending also has an indirect, or multiplier, effect on the economybecause the dollars spent (or earned) in income-producing property are used to purchase other goods and services inthe state. This multiplier effect is measured using the U.S. Department of Commerce, Bureau of Economic Analysis’s(BEAs) Regional Input-Output Modeling System (RIMS) II multipliers. These multipliers estimate the influence ofspending in one or more industries on output, earnings, and employment in other industries. The multipliers areproduced by BEA using data on the local area personal income and the national input-output accounts.
This report captures a snapshot of the lifecycle of income-producing property for the State of Colorado in 2006.
Table 2: Colorado Real Estate Regions
Region Counties
North Front Range Boulder, Weld, and Larimer CountiesGrand Junction Mesa CountyDenver Metro Denver, Arapahoe, Adams, Broomfield, Douglas, and Jefferson CountiesEastern Plains Baca, Bent, Cheyenne, Crowley, Elbert, Huerfano, Kiowa, Kit Carson, Las Animas, Lincoln, Logan, Morgan,
Otero, Phillips, Prowers, Sedgwick, Washington, and Yuma CountiesMountain Resort Eagle, Pitkin, Routt, San Miguel, Summit, Garfield, and Grand CountiesPueblo Pueblo CountyColorado Springs El Paso and Teller CountiesMountain Rural Alamosa, Archuleta, Chaffee, Clear Creek, Conejos, Costilla, Custer, Delta, Dolores, Fremont, Gilpin,
Gunnison, Hinsdale, Jackson, La Plata, Lake, Mineral, Moffat, Montezuma, Montrose, Ouray, Park, RioBlanco, Rio Grande, Saguache, and San Juan Counties
Source: Business Research Division, Leeds School of Business

7
A. Commercial and Multifamily Property in Colorado: 1967-2006The commercial and multifamily construction industries have added more than one billion square feet of office,industrial, retail, hotel and multifamily space in Colorado since 1967. Construction has traversed through three majorcycles over 30 years, and it is currently in its fourth. The first cycle started in the 1960s and peaked in 1973. The nextcycle bottomed out in 1975 and peaked in 1984, fueled by office construction. The third cycle bottomed in 1991, withthe slowest construction expansion in the 30-year period, which was followed by 10 years of increasing constructionactivity. Colorado is currently in another cycle that bottomed in 2003 and is now moving toward another peak (Figure 5).
Figure 5: Colorado Commercial and Multifamily Construction, 1967-2006
Sources: McGraw-Hill Construction Research & Analytics, Bureau of Economic Analysis
The total stock of income-producing property increased at a 2.84% compound annual growth rate from 1970 to 2006.The total stock naturally tracks the construction of new income-producing property as it is the product of existing, new,and decommissioned properties. In 2006, income-producing property, including office, industrial, retail, hotel, and multifamily, totaled nearly 1.35 billion square feet in Colorado, compared to 491.3 million in 1970 (Figure 6).
Figure 6: Colorado Commercial and Multifamily Property Stock, 1970-2006
Source: McGraw-Hill Construction Research & Analytics

8
The rate of income-producing property construction and the growth rate of the Colorado economy are closely linked,with a correlation of 0.79 from 1967 to 2006 (Figure 7). Over time, the major drivers of Colorado’s economy have alsochanged, with manufacturing representing 16.5% of Colorado’s GDP in 1967, compared to 6.5% in 2006. Conversely,Professional Business Services is now a major underpinning of the Colorado economy, representing 13.7% of 2006State GDP.
Figure 7: Colorado Commercial and Multifamily Construction Value Versus GDP, 1967-2006
Sources: McGraw-Hill Construction Research & Analytics, Bureau of Economic Analysis
Real estate is one of the three basic “factors of production” (land, labor, and capital) required for virtually all economicactivities. When new jobs are created in the state, greater demand is placed on places to eat, work, shop, play, and sleep.
From 1967 to 2006, commercial and multifamily property construction has gone through four extended growth periods(including the current cycle). Peak construction as a percent of GDP occurred in 1972, comprising 4.9% of GDP (Figure8). Conversely, at 0.37%, 1991 brought the lowest contribution of GDP from construction. Income-producing propertyconstruction’s 30-year average contribution to Colorado’s GDP is 2.0%, signaling that the 1.4% of State GDP in 2006was an underperforming year overall.

Figure 8: Colorado Commercial and Multifamily Construction as a Percent of GDP, 1967-2006
Source: Bureau of Economic Analysis, University of Colorado-Boulder, University of Denver.
In addition to income-producing property construction, expenditures on tenant improvements are a major contributorto local and state economies. From 1996 to 2006, tenant improvements have averaged $262 million annually inColorado (Figure 9).
Figure 9: Colorado Tenant Improvements, 1967-2006
Source: McGraw-Hill Construction Research & Analytics.
9

10
With the continued growth in population and employment, thedemand for income-producing property is expected to continue toremain strong, with the natural cycles inherent to the industry.
II. Methodology
The base methodology for this report was obtained from the NAIOPpublication “How to Calculate the Economic Contribution of Office,Industrial and Retail Real Estate to the Local Community” by StephenS. Fuller, Ph.D., George Mason University (2007). This study builds onthe NAIOP methodology by including commercial tenantimprovements, commercial transaction costs and commercial financingcosts. For greater detail regarding the methodology, see Appendix B.
Data from McGraw-Hill Construction Research & Analytics on the totalsquare feet of existing commercial real estate for each property typewere employed, along with data on specific property-type operatingexpenses to estimate aggregate spending and employment foroperations, maintenance, management, and utilities. McGraw-HillConstruction Research & Analytics data on square feet of newconstruction, by property type, along with data on per square footconstruction costs obtained from R. S. Means, were used to estimatethe value of new construction. Data on tenant improvements were alsoprovided by McGraw-Hill Construction Research & Analytics.
RIMS II multipliers, obtained from the BEA through the StateDemography Office, provided the basis for estimating directemployment and earnings based on direct spending, as well as theindirect output, employment, and earnings.
BEA publishes RIMS II multipliers by industry sector and by economicregion in Colorado (Appendix C). This study employs the multipliersthat include the impact of local government. Multipliers are reportedfor output, earnings, and employment. For instance, if the utilitiesindustry output multiplier is 2.1365 for the State of Colorado, then theimpact of $1 million in utilities spending on Colorado’s economy is$2.1365 million ($1 million direct spending and $1.1365 millionindirect). Direct earnings can be estimated using the BEA directearnings per dollar of sales to final demand multiplier, which in thisscenario is 0.1808. Therefore, the $1 million in utilities spendinggenerates $180,800 in direct earnings. Similarly, employment can beestimated using the direct employment per million dollars of sales tofinal demand multiplier. The employment multiplier in this example is2.2577. That means there are 2.2577 jobs generated for every $1million in utility expenditures. It should be noted that the estimatedmultiplier impacts on specific counties are estimates and are moreaccurate in non-metropolitan areas. The difficulty estimatingmetropolitan county multiplier effects is because metropolitan areas

11
have greater economic overlap since goods and labor are oftenprovided from neighboring counties; and commuting employees spenda higher proportion of their earnings near their home. The multipliereffects in this report assume that the economic activities from income-producing property in a county are proportional to the area of income-producing property in that region.
The economic impacts of income-producing property transactions andrefinancing were estimated on a direct basis only. The indirect, or multiplier, effect is omitted because of the difficulty in knowing howmuch of the interest and fee income is spent in Colorado. Fiscalimpacts are based on State of Colorado reported estimates of assessedincome-producing property values and estimated property mill levies ineach county.
III. Economic Impacts of Existing Commercial Property
Existing commercial property undoubtedly has a profound impact onthe Colorado economy in terms of output, earnings, and employmentderived from operating expenditures. These operating expendituresinclude a variety of services, such as management, cleaning, repairs,maintenance, leasing, expenditures on utilities, and so on, that keepthe property functioning.
To assess these impacts, data has been gathered from numerous publicand private sources. Necessary data included existing income-producing property area in square feet by type and by county,operating expenditures per square foot, and industry economicmultipliers. The economic impact of tenant improvements andconstruction of new properties are examined in a later section.
A. Total AreaIn 2006, the three major metropolitan areas in Colorado (DenverMetro, North Front Range, and Colorado Springs) contained 83.5% ofthe existing commercial and multifamily stock in Colorado, with nearly1.13 billion square feet of income-producing property. The DenverMetro region alone represented 57.2% of the existing stock of income-producing property. Table 3 provides total income-producing propertyspace, by property type, for each of the eight regions in the State.Individual county estimates are provided in Appendix D.

12
B. Summary of Impacts for Existing Commercial PropertiesDirect spending in the existing inventory of all commercial properties totaled $8.1 billion in 2006, for a total (direct andindirect) effect of $16.1 billion on Colorado’s economy, or 7.0% of State GDP (Table 4)1. For existing real estate, directspending generally includes operating costs associated with the administration, cleaning, maintenance, utilities, andtaxes on the properties. The existing income-producing property sector employed 106,686 direct employees earningan average wage of $30,076. The 183,566 direct and indirect employees earned an average wage of $30,626. SeeAppendix E for county impact.
1 The analysis of existing property does not include multifamily.

13
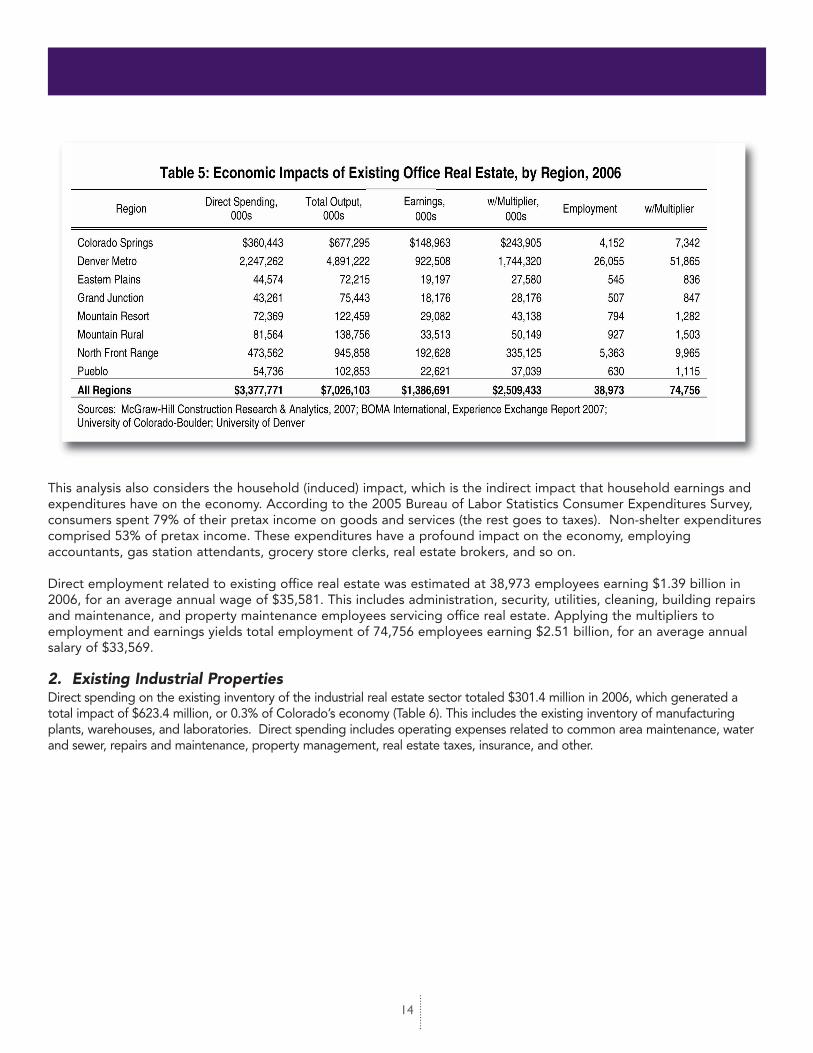
1. Existing Office PropertiesDirect spending in the existing inventory of office properties totaled $3.38 billion in 2006, which generated a $7.03billion total impact on Colorado’s economy, more than 3.0% of Colorado’s total output (Table 5). Direct spendingincludes operating expenses related to administration, security, utilities, cleaning, building repairs and maintenance, andproperty maintenance (see Appendix F for the Building Owners and Managers Association definitions). This sectordirectly employed 38,973 workers at an average wage of $35,581. The impacts varied widely by region, with the DenverMetropolitan region accounting for two-thirds of the existing office impact. Appendix G provides county level impacts.
Each dollar spent providing goods and services for existing office properties has a multiplier effect on the economydue to inter-industry relationships. For example, office properties occasionally need parking lots resurfaced, whichaffect the resurfacing company directly, but also impacts revenues for companies that sell resurfacing supplies andequipment. Hence, a dollar spent by a firm on commercial property has a ripple effect throughout the economy. Sincesome of the supplies and equipment are purchased from out of state, the multiplier effect is smaller than the nationalmultiplier. The same holds true for counties within Colorado – goods and services are imported from other counties,which reduces the impact on the primary county. This regional multiplier disparity has been accounted for by the BEARIMS II multipliers.
14
This analysis also considers the household (induced) impact, which is the indirect impact that household earnings andexpenditures have on the economy. According to the 2005 Bureau of Labor Statistics Consumer Expenditures Survey,consumers spent 79% of their pretax income on goods and services (the rest goes to taxes). Non-shelter expenditurescomprised 53% of pretax income. These expenditures have a profound impact on the economy, employingaccountants, gas station attendants, grocery store clerks, real estate brokers, and so on.
Direct employment related to existing office real estate was estimated at 38,973 employees earning $1.39 billion in2006, for an average annual wage of $35,581. This includes administration, security, utilities, cleaning, building repairsand maintenance, and property maintenance employees servicing office real estate. Applying the multipliers toemployment and earnings yields total employment of 74,756 employees earning $2.51 billion, for an average annualsalary of $33,569.
2. Existing Industrial PropertiesDirect spending on the existing inventory of the industrial real estate sector totaled $301.4 million in 2006, which generated atotal impact of $623.4 million, or 0.3% of Colorado’s economy (Table 6). This includes the existing inventory of manufacturingplants, warehouses, and laboratories. Direct spending includes operating expenses related to common area maintenance, waterand sewer, repairs and maintenance, property management, real estate taxes, insurance, and other.

15
Direct employment related to industrial real estate was estimated at 3,293 employees earning $132.0 million in 2006,for an average annual wage of $40,092 (see Appendix H for county impacts). Applying the multipliers to employmentand earnings yields total employment of 6,449 employees earning $230.3 million, for an average annual salary of$35,708.
3. Existing Retail PropertiesDirect spending in the retail real estate sector totaled $1.57 billion in 2006, which generated a $3.26 billion impact onColorado’s economy, or roughly 1.4% of Colorado’s total output (Table 7). Direct spending includes operating expensesrelated to building maintenance, external property maintenance (i.e., parking lot), utilities, advertising and promotion,insurance, and general and administrative expenses, and so on (See Appendix I for Urban Land Institute definitions).

16
Direct employment related to retail real estate was estimated at 18,627 employees earning $705.7 million in 2006, for an average wage of $37,884 (see Appendix J for county impacts). This includes building maintenance, externalproperty maintenance (i.e., parking lot), utilities, advertising and promotion, insurance, and general and administrativeexpenses. Applying the household multipliers to employment and earnings yields total employment of 35,106 employees earning $1.2 billion, for an average salary of $34,725.
4. Existing Hotel PropertiesDirect spending in the hotel real estate sector totaled $2.88 billion in 2006, which generated a $5.16 billion impact onColorado’s economy, or roughly 2.2% of Colorado’s total output (Table 8). Direct spending operating expenditures persquare foot were obtained from PKF Hospitality Research. This sector employed an estimated 45,793 workers at anaverage wage of $21,494 (see Appendix K for impact by county). This includes managerial operations and buildingmaintenance workers, as well as hotel room cleaners. Applying the household multipliers to employment and earningsyields total employment of 67,255 employees earning $1.7 billion, for an average salary of $24,728.

17
IV. Economic Impacts of Tenant Improvements
The economic impacts of tenant improvements were calculated separately. However, since tenant improvements areessentially construction, the RIMS II construction multipliers were employed to calculate the multiplier effects of directspending on output, earnings, and employment resulting from industry expenditures on tenant improvements.
Necessary data included income-producing property alterations by value, by type, and by county; industry soft costs(i.e., architectural, engineering, construction management, and site improvement); hard costs (construction materialsand construction worker wages); and industry multipliers. Property alteration figures were obtained from McGraw-HillConstruction Research & Analytics; industry soft costs were estimated as a percentage of total project costs obtainedby RS Means CostWorks for Building Construction; and RIMS II construction industry multipliers were obtained fromthe State Demography Office, compiled by the Bureau of Economic Analysis.
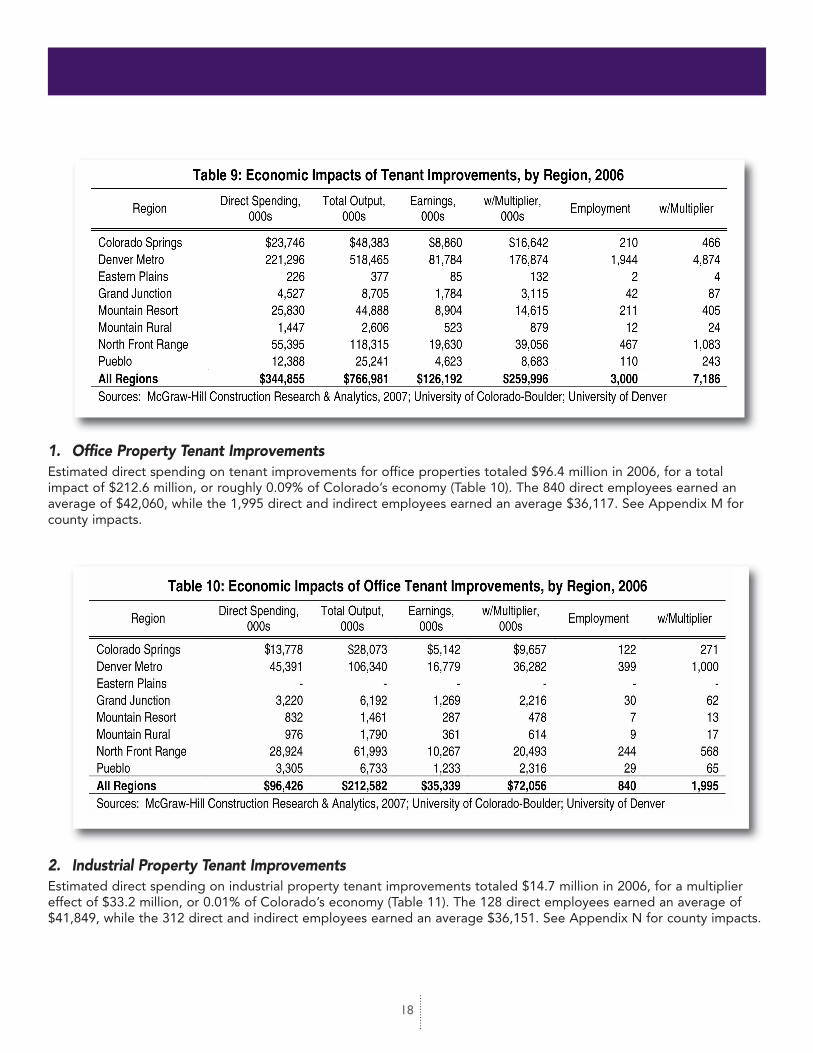
A. Summary of Tenant Improvements ImpactsDirect spending on tenant improvements totaled $344.9 million in 2006, for a total (direct and indirect) effect of $767.0million on Colorado’s economy, or 0.33% of State GDP (Table 9). Income-producing property tenant improvementsemployed 3,000 direct employees earning an average wage of $42,062. The 7,186 direct and indirect employees earned an average wage of $36,181. See Appendix L for county impacts.
18
2. Industrial Property Tenant ImprovementsEstimated direct spending on industrial property tenant improvements totaled $14.7 million in 2006, for a multipliereffect of $33.2 million, or 0.01% of Colorado’s economy (Table 11). The 128 direct employees earned an average of$41,849, while the 312 direct and indirect employees earned an average $36,151. See Appendix N for county impacts.
1. Office Property Tenant ImprovementsEstimated direct spending on tenant improvements for office properties totaled $96.4 million in 2006, for a totalimpact of $212.6 million, or roughly 0.09% of Colorado’s economy (Table 10). The 840 direct employees earned anaverage of $42,060, while the 1,995 direct and indirect employees earned an average $36,117. See Appendix M forcounty impacts.

19
4. Hotel Property Tenant ImprovementsEstimated direct spending on hotel property tenant improvements totaled $112.5 million in 2006, for a multiplier effectof $248.7 million, or 0.11% of Colorado’s economy (Table 13). The 974 direct employees earned an average of $42,086,while the 2,321 direct and indirect employees earned an average $36,252. See Appendix P for county impacts.
3. Retail Property Tenant ImprovementsEstimated direct spending on retail property tenant improvements totaled $94.0 million in 2006, for a multiplier effect of$211.9 million, or roughly 0.09% of Colorado’s economy (Table 12). The 820 direct employees earned an average of$42,065, while the 1,987 direct and indirect employees earned an average $36,186. See Appendix O for county impacts.

20
5. Multifamily Property Tenant ImprovementsEstimated direct spending on tenant improvements for multifamily properties totaled an estimated $27.2 million in2006, for a multiplier effect of $60.6 million, or 0.03% of Colorado’s economy (Table 14). The 238 direct employeesearned an average of $42,073, while the 571 direct and indirect employees earned an average $36,112. See AppendixQ for county impacts.

Table 15: Economic Impacts of New Construction, by Region, 2006
21
V. Economic Impacts of New Construction
Necessary data for calculating the impacts of income-producing property construction include the amount of newincome-producing space, by property type, and by county; site development costs; industry soft costs (i.e.,architectural, engineering, and construction management); hard costs (construction materials and construction workerwages); and industry construction multipliers. Financing development costs (construction loan fees and constructionloan interest) are accounted for in the Transactions and Refinancing sections. Data on new construction were obtainedfrom McGraw-Hill Construction Research & Analytics; industry soft costs were estimated as a percentage of totalproject costs obtained by RS Means CostWorks for Building Construction; and RIMS II construction industry multiplierswere obtained from the State Demography Office, compiled by the Bureau of Economic Analysis.
A. Summary of Impacts for New Construction
Direct spending on income-producing property construction totaled $3.3 billion in 2006, with an output multipliereffect of $6.9 billion, or roughly 3.0% of Colorado’s output (Table 15). Direct employment in new commercial andmultifamily construction totaled 28,145 employees earning $1.2 million, for an average wage of $42,298. Theemployment multiplier effect of new construction totaled 64,224 direct and indirect employees earning an estimated$2.3 billion, for an average wage of $36,161 in 2006. See Appendix R for county impacts. Separately, the impacts ofconstruction loan interest and fees attributable to new construction were estimated at $117.0 million.
Region Direct Spending,
000s Total Output,
000s Earnings,
000s w/Multiplier,
000s Employment w/Multiplier
Colorado Springs $300,118 $611,511 $111,952 $210,309 2,660 5,892
Denver Metro 1,368,077 3,197,129 512,550 1,097,491 12,014 30,099
Eastern Plains 8,034 13,429 3,018 4,718 72 131
Grand Junction 56,719 109,104 22,315 39,015 532 1,090
Mountain Resort 444,195 772,354 153,133 251,526 3,636 6,972
Mountain Rural 270,627 474,764 94,434 155,989 2,242 4,330
North Front Range 506,165 1,056,574 177,518 345,656 4,230 9,598
Pueblo 311,248 634,462 115,574 217,693 2,759 6,110
All Regions $3,265,183 $6,869,328 $1,190,494 $2,322,398 28,145 64,224 Sources: McGraw-Hill Construction Research & Analytics, 2007; University of Colorado-Boulder; University of Denver

Table 16: Economic Impacts of Office Construction, by Region, 2006
22
2. Industrial Property New ConstructionDirect spending on industrial property construction totaled an estimated $518.0 million in 2006, for a total effect of$1.09 billion, or 0.47% of Colorado’s economy (Table 17). The 4,560 direct employees earned an average of $41,861,while the 10,386 direct and indirect employees earned an average $35,817. See Appendix T for county impacts.
1. Office Property New ConstructionDirect spending on office property construction totaled $465.4 million in 2006, for a total effect of $1.01 billion, or0.44% of Colorado’s economy (Table 16). The 4,054 direct employees earned an average of $42,068, while the 9,478direct and indirect employees earned an average $36,084. See Appendix S for county impacts.
Region Direct Spending,
000s Total Output,
000s Earnings,
000s w/Multiplier,
000s Employment w/Multiplier
Colorado Springs $91,291 $186,003 $34,070 $63,985 809 1,792
Denver Metro 237,507 556,420 87,797 189,843 2,087 5,231
Eastern Plains 240 401 90 141 2 4
Grand Junction 17,885 34,389 7,046 12,308 168 344
Mountain Resort 16,919 29,520 5,836 9,628 139 266
Mountain Rural 17,101 30,378 5,995 10,017 142 278
North Front Range 67,385 136,467 23,333 44,118 556 1,228
Pueblo 17,058 34,755 6,366 11,956 151 335
All Regions $465,385 $1,008,333 $170,534 $341,997 4,054 9,478
Sources: McGraw-Hill Construction Research & Analytics, 2007; University of Colorado-Boulder; University of Denver
Table 17: Economic Impacts of Industrial Construction, by Region, 2006
Region Direct Spending,
000s Total Output,
000s Earnings,
000s w/Multiplier,
000s Employment w/Multiplier
Colorado Springs $26,640 $54,306 $9,889 $18,630 236 523
Denver Metro 127,348 298,623 46,835 101,652 1,119 2,806
Eastern Plains 750 1,255 281 440 7 12
Grand Junction 17,236 33,185 6,759 11,843 162 332
Mountain Resort 6,448 11,199 2,210 3,633 53 101
Mountain Rural 1,618 2,832 575 945 14 26
North Front Range 46,013 94,657 15,971 30,713 382 855
Pueblo 291,916 595,075 108,359 204,143 2,587 5,731
All Regions $517,969 $1,091,131 $190,880 $371,999 4,560 10,386
Sources: McGraw-Hill Construction Research & Analytics, 2007; University of Colorado-Boulder; University of Denver

23
3. Retail Property New ConstructionDirect spending on retail property construction totaled an estimated $536.4 million in 2006, for a multiplier effect of$1.18 billion, or 0.51% of Colorado’s output (Table 18). The 4,681 direct employees earned an average of $42,070,while the 11,080 direct and indirect employees earned an average $36,150. See Appendix U for county impacts.
4. Hotel Property New ConstructionDirect spending on hotel property construction totaled $313.5 million in 2006, for a multiplier effect of $574.1 million,or 0.25% of Colorado’s economy (Table 19). The 2,608 direct employees earned an average of $42,100, while the 5,249direct and indirect employees earned an average $36,024. See Appendix V for county impacts.

Table 20: Economic Impacts of Multifamily Construction, by Region, 2006
24
5. Multifamily Property New ConstructionDirect spending on multifamily construction totaled $1.4 billion in 2006, for a multiplier effect of $3.0 billion, or 1.3% ofColorado’s economy (Table 20). The 12,242 direct employees earned an average of $42,667, while the 28,031 directand indirect employees earned an average $36,344. See Appendix W for county impacts.
Region Direct Spending,
000s Total Output,
000s Earnings,
000s w/Multiplier,
000s Employment w/Multiplier
Colorado Springs $88,705 $180,734 $33,105 $62,173 786 1,742
Denver Metro 663,282 1,545,691 252,256 534,276 5,822 14,577
Eastern Plains - - - - - -
Grand Junction 4,866 9,356 1,917 3,348 46 94
Mountain Resort 341,461 593,816 117,729 193,406 2,795 5,361
Mountain Rural 43,500 76,195 15,170 25,022 360 695
North Front Range 290,091 610,781 102,164 200,535 2,433 5,564
Pueblo - - - - - -
All Regions $1,431,905 $3,016,571 $522,341 $1,018,760 12,242 28,031 Sources: McGraw-Hill Construction Research & Analytics, 2007; University of Colorado-Boulder; University of Denver

25
VI. Economic Impacts of Commercial Property Transactions
The buying and selling of commercial property in 2006 resulted in a total sales volume of $7.48 billion in the State ofColorado and an estimated $411.4 million in transaction fees (Tables 21 and 22). According to NorthMarq Capital, atypical commercial property transaction generates 5.5% of the total transaction amount in fees that are paid toprofessionals and businesses engaged in the transaction. This percentage represents the total of brokeragecommissions, loan origination fees, title insurance fees, engineering costs, closing costs, and other typical fees incurredwhen the title of a commercial property changes hands. The impact of transaction fees on direct employment andearnings, including their multipliers, have not been calculated due to the ambiguous sources and uses of funds. Forinstance, loan origination fees paid to a bank are not bank expenditures nor purely profit; rather, these funds arereinvested in and out of the state. See Appendix B for notes on methodology.

26
VII. Economic Impacts of Commercial Property Refinancing
Refinancing commercial property in 2006 created a total new loan volume of $3.14 billion in the State of Colorado, andan estimated $47.1 million in fees (Tables 23 and 24). According to NorthMarq Capital, a typical commercial propertyloan refinancing generates an average 1.5% of the total loan amount in fees paid to commercial banks, loan officers,appraisers, inspectors, engineers, and other professionals involved with refinancing. The indirect impacts of refinancingfees and mortgage interest on economic activity have not been calculated due to the ambiguous sources and uses offunds. For instance, mortgage interest paid to a bank are not bank expenditures nor purely profit; rather, these fundsare deposited nationally and reinvested in and out of the state. See Appendix B for details on methodology.

27
VIII. Fiscal Impacts
Commercial property impacts federal, state, and local governments in terms of property taxes, sales taxes, anddevelopment fees. Development fees were excluded from the fiscal analysis due to the extremely varying feestructures throughout Colorado counties and cities; however, fees were included in the output analysis since they wereaggregated in the per square foot soft construction costs. Most fees are designed to directly offset a public cost, suchas adding water meters, inspecting properties, or providing other services. Property taxes have a direct local impactbased on the geographical locale of the property, whereas sales taxes depend on where purchases are made. Bothhave significant impacts on government revenues, contributing a combined estimated $1.26 billion to local, county,and state government.
A. Commercial Property TaxesCommercial property taxes, excluding multifamily properties, totaled $1.18 billion in 2006, including county, city,school, and special districts. In 2006, office property taxes were estimated at $353.5 million; industrial property taxes,including manufacturing, totaled $430.7 million; retail property taxes were estimated at $326.2 million; and hotelproperty taxes were estimated at $67.0 million (Table 25).
Colorado property taxes are calculated based on assessed values and mill levies (county, city, special district, andschool). Property values are multiplied by the assessment ratio (29% for non-residential property), then multiplied bythe property tax mill rate.
Assessed property values for 2006 and estimated mill levies are published on the Department of Local Affairs, Divisionof Property Taxation website as of September 7, 2007(http://www.dola.colorado.gov/dpt/publications/2006_annual_report_index.htm). See Appendix X and Appendix Y forcounty detail.
28
B. Commercial Property Sales Taxes
Sales tax revenues obtained from direct spending on constructionmaterials in the State of Colorado were estimated at $75.2 million in2006. The total impact of sales tax revenues (direct and indirectimpacts) were estimated at $160.7 million in 2006. This assumes that60% of new construction are material purchases, 20% of additions toproperties are material purchases, and 40% of tenant alterations arematerial purchases.
Material purchases have a direct impact on municipalities and countiesbased on the location of the purchases (which may be a differentcounty). Therefore, if an office building is constructed in Greeley,Colorado, a portion of the materials are probably purchased inCommerce City. Hence, Greeley does not receive the full benefit ofthe construction expenditure. For simplicity in estimating sales taxesfrom construction material purchases, an assumption was made that100% of the materials are purchased in the county where constructiontakes place. This surely overstates the impacts for some counties andunderstates the impacts for other counties, but only the aggregatefiscal impact is reported here.
Conclusion
The impact of the income-producing property industry on Colorado’seconomy is significant. Adding together the individual property sectorsfor existing property operations, new construction, transactions, andrefinancing, commercial property and new multifamily constructiondirectly contributed $12.3 billion to Colorado’s economy in 2006.Including the indirect impact on output, income-producing propertycontributed an estimated $24.3 billion to Colorado’s GDP, or 10.5% ofthe State economy (Table 26). Income-producing property directemployment totaled 137,832 in Colorado in 2006, or 6.1% of Stateemployment, at an average wage of $32,832. Including the indirectemployment, income-producing property employed 254,976 in 2006,at an average wage of $32,177.

29
1 Existing does not include multifamilies.2 Other does not include the impact on employment, earnings, multiplier effect, or impact on individual counties due to the uncertainty of
the source of, and redeployment of funds.
Sources: McGraw-Hill Construction Research & Analytics, 2007; BOMA International, Experience Exchange Report 2007; Urban LandInstitute, Dollars & Cents of Shopping Centers / The SCORE 2006; PKF Hospitality Research; NAIOP Industrial Income and ExpenseReport 2001-2002; Real Capital Analytics; NorthMarq Capital; University of Colorado-Boulder; University of Denver
Direct Spending (000) Total Output (000) Percent of Colorado’s GDP
Existing1
Office 3,377,771 7,026,103 3.0%Industrial 301,387 623,368 0.3%Retail 1,574,128 3,256,520 1.4%Hotel 2,881,556 5,158,947 2.2%Total Existing 8,134,842 16,064,938 7.0%
Tenant ImprovementsOffice 96,426 212,582 0.1%Industrial 14,693 33,231 0.0%Retail 94,036 211,932 0.1%Hotel 112,504 248,651 0.1%Multifamily 27,195 60,587 0.0%Total TI 344,854 766,983 0.3%
New ConstructionOffice 465,385 1,008,333 0.4%Industrial 517,969 1,091,131 0.5%Retail 536,406 1,179,158 0.5%Hotel 313,518 574,134 0.2%Multifamily 1,431,905 3,016,571 1.3%Total Construction 3,265,183 6,869,327 3.0%
Other2
Construction Period Interest/Fees 137,294 137,294 0.1%Transactions 411,408 411,408 0.2%Refinancing 47,093 47,093 0.0%Total Other 595,795 595,795 0.3%
Total All 12,340,674 24,297,043 10.5%
Table 26: Summary Impacts of Commercial Real Estate and Multifamily Construction on Colorado’s Economy, 2006

30
Ap
pend
ix A
: Eco
nom
ic Im
pact
s, b
y Co
unty
, 200
6 *E
XIS
TIN
G, T
EN
AN
T IM
PR
OV
EM
EN
TS, A
ND
CO
NS
TRU
CTI
ON
Cou
nty
Dire
ct
Spe
ndin
g, 0
00s
Tota
l Out
put,
000s
E
arni
ngs,
00
0s
w/M
ultip
lier,
000s
E
mpl
oym
ent
w/M
ultip
lier
Cou
nty
Dire
ct
Spe
ndin
g,
000s
Tota
l Out
put,
000s
E
arni
ngs,
00
0s
w/M
ultip
lier,
000s
E
mpl
oym
ent
w/M
ultip
lier
Ada
ms
$847
,960
$1
,910
,667
$3
31,4
86
$666
,440
9,12
9
19,
490
La
Pla
ta
$82,
382
$1
35,0
71
$30,
243
$4
5,15
8
1,15
7
1,66
9
Ala
mos
a
2
3,04
2
36,2
30
9
,268
1
3,32
0
315
4
56
La
ke
33
,507
57,8
66
11,
883
19,
103
294
540
Ara
paho
e
1,39
3,23
4
3,0
90,0
47
554,
390
1
,086
,026
1
5,82
7
32,
334
Larim
er
520
,519
9
51,5
38
1
92,7
22
3
16,4
26
5,33
7
9,48
5
Arc
hule
ta
8
,357
14
,067
3,0
47
4,
701
9
6
152
Las
Ani
mas
16,1
21
25
,096
6,29
7
9,04
9
23
0
32
5
Bac
a
1,9
54
3,1
13
870
1,22
6
25
37
Li
ncol
n
8,8
59
14
,440
3,48
9
5,23
1
99
159
Ben
t
2,4
65
3,9
07
1
,029
1,47
4
33
49
Lo
gan
25
,772
40,8
40
10,
467
15,
117
351
509
Bou
lder
79
4,11
8
1,7
55,4
91
313,
782
614
,778
9,29
2
18,
610
Mes
a
1
95,5
15
350
,032
7
9,07
0
127
,418
2,
348
3,
971
Cha
ffee
19,
955
32,7
21
7
,324
1
0,94
1
281
4
05
M
iner
al
2
,026
3,4
04
830
1,
217
24
37
Che
yenn
e
2,8
12
4,5
45
1
,171
1,70
9
33
52
M
offa
t
14,3
51
23
,733
5,30
7
7,97
7
18
2
27
1
Cle
ar C
reek
9,9
04
16,4
30
3
,802
5,64
9
130
1
93
M
onte
zum
a
29,9
80
49
,561
1
1,27
8
16,
837
401
592
Con
ejos
2,1
17
3,3
41
894
1,27
0
28
41
M
ontro
se
44
,456
80,4
47
17,
930
29,
228
51
5
89
4
Cos
tilla
1,2
66
1,9
92
526
74
9
17
25
M
orga
n
16,5
69
28
,886
6,68
3
1
0,13
9
19
4
31
3
Cro
wle
y
7
06
1,1
25
304
43
3
9
14
O
tero
18,1
10
28
,749
7,57
5
1
0,85
7
24
4
35
6
Cus
ter
1
,777
2
,730
6
37
929
2
7
37
Our
ay
2
,832
4,7
21
1,
072
1,
610
35
54
Del
ta
11,
105
19
,354
4,6
68
7,
223
14
1
228
Par
k
9,7
39
16
,795
3,47
5
5,56
3
87
158
Den
ver
2,
018,
989
4
,410
,503
80
7,29
6 1
,553
,129
2
4,45
0
47,
624
Phi
llips
2,9
04
4
,650
1,28
2
1,82
2
3
7
5
6
Dol
ores
1
2,65
3
21,4
93
5
,399
7,88
1
136
2
22
P
itkin
3
40,1
30
569
,276
117
,798
184
,652
4,
045
6,
318
Dou
glas
42
8,83
8
9
64,0
24
168,
492
337
,017
4,64
9
9
,868
Pro
wer
s
14,6
57
22
,877
5,81
6
8,33
7
206
294
Eag
le
550,
747
9
04,1
54
189,
822
2
91,5
36
7,
587
1
1,04
2
Pue
blo
476
,610
9
47,6
24
1
83,0
13
3
29,5
58
4,83
0
9,65
7
El P
aso
847,
023
1,5
86,9
34
342,
970
5
64,4
21
11,
014
1
8,36
7
Rio
Bla
nco
7
,199
11,9
20
2,
665
4,
007
9
0
13
6
Elb
ert
315,
190
641
,237
11
7,74
2
220
,718
2,80
3
6
,187
Rio
Gra
nde
7
,796
12,4
05
3,
268
4,68
7
10
0
15
0
Frem
ont
28,
520
54
,752
1
1,67
9
19,
616
33
9
602
Rou
tt
1
83,1
62
303
,201
6
3,69
6
9
8,39
6
2,
379
3,
559
Gar
field
16
0,32
8
264
,997
5
4,91
0
8
5,30
9
1,97
6
2
,980
Sag
uach
e
1,0
35
1
,648
46
1
64
9
13
20
Gilp
in
213,
870
3
66,1
26
73,
534
1
18,7
31
2,
057
3,5
93
S
an J
uan
1
,348
2,2
27
512
760
1
8
2
7
Gra
nd
184,
233
304
,082
6
3,28
1
9
7,95
2
2,
441
3,6
18
S
an M
igue
l
1
21,5
80
199
,535
4
1,68
7
64,
142
1,
676
2,
438
Gun
niso
n
6
6,61
6
1
12,0
97
23,
519
3
6,78
5
760
1,2
12
S
edgw
ick
2
,835
4,4
70
1,
153
1,
656
4
0
5
7
Hin
sdal
e
1,6
58
2,6
87
580
87
2
2
5
35
Sum
mit
278
,854
4
52,7
95
96,
690
1
46,2
55
4,14
6
5,83
0
Hue
rfano
6,0
55
9,3
83
2
,298
3,31
7
8
8
123
Telle
r
30,2
22
57
,685
1
1,32
5
1
9,73
5
384
659
Jack
son
1
,435
2
,397
5
65
835
1
8
27
Was
hing
ton
2
,154
3,4
50
952
1,35
2
2
7
4
1
Jeffe
rson
1,00
6,53
2
2,2
31,2
63
401,
639
785
,150
1
1,59
5
23,
488
Wel
d
2
69,3
72
491
,505
101
,264
164
,944
2,
738
4,
881
Kio
wa
7
,829
12
,410
3,2
65
4,
675
105
1
53
Y
uma
4
,388
7,0
17
1,
900
2,
712
5
7
8
5
Kit
Car
son
8
,611
13
,484
3,3
55
4,
853
125
1
76
CO
LORA
DO
11,
744,
880
23,
701,
247
4,5
25,3
43
8,2
04,2
61
137
,831
2
54,9
76
Sou
rces
:
McG
raw
-Hill
Con
stru
ctio
n R
esea
rch
& A
naly
tics,
200
7; B
OM
A In
tern
atio
nal,
Exp
erie
nce
Exc
hang
e R
epor
t 200
7; U
rban
Lan
d In
stitu
te, D
olla
rs &
Cen
ts o
f Sho
ppin
g C
ente
rs /
The
SC
OR
E 2
006;
PK
F H
ospi
talit
y R
esea
rch;
NA
IOP
Indu
stria
l Inc
ome
and
Exp
ense
Rep
ort 2
001-
2002
; Uni
vers
ity o
f Col
orad
o-B
ould
er; U
nive
rsity
of D
enve
r. C
ount
y im
pact
s ex
clud
e ec
onom
ic e
ffect
s of
tran
sact
ions
and
refin
anci
ng.
31
EXISTING PROPERTIESTo estimate direct spending (from total operating expenses) byproperty type and by county, total area was multiplied by the persquare foot (PSF) operating expenses. Total square feet of commercialand multifamily property space, by property type, by county, wasobtained from McGraw-Hill Construction Research & Analytics.Operating expenses by property type were obtained from BOMA, ULI,NAIOP, PKF Hospitality Research, and RS Means CostWorks. Whenpossible, expenditures were segmented by services to buildings,management services, and utilities.
Total operating expenses were multiplied by the output multiplier toestimate the total impact of the sector on Colorado’s GDP. The directearnings per dollar of sales to final demand were used to estimate thedirect impact of expenditures in the commercial real estate sector. Thetotal earnings per dollar of sales to final demand multipliers were usedto estimate the total (direct and multiplied) impacts of the sector onincomes. Similarly, the direct employment per million dollars of sales tofinal demand multipliers were used to estimate the impacts of thesector on employment; and total employment per dollar of sales tofinal demand was used to estimate the total (direct and multiplied)employment impact.
Employment is limited to those employed by the commercial realestate sector, specifically omitting those employees working in thecommercial real estate space (i.e., the retail space lessor, not theclothing store clerk).
Note that Broomfield was not included in the McGraw-Hill ConstructionResearch & Analytics data for existing commercial real estate.Broomfield became a county in 2001, comprised of land from Adams,Boulder, Jefferson, and Weld counties. The impact from BroomfieldCounty real estate is included in these four counties.
1. OFFICE DATAPer square foot (PSF) office operating costs were obtained from theExperience Exchange Report 2007 published by BOMA International(Table 27). BOMA reports PSF operating costs categorized by cleaning,repairs/maintenance, utilities, roads/grounds, security and administrative(Appendix F). For the purpose of this study, these categories were thengrouped by services to buildings (cleaning, repairs/maintenance,roads/grounds, and security), management services (administrative), andutilities. Taxes have been included by BOMA in the administrative seg-ment of operating expenses.
Appendix B: Notes to Methodology

32
BOMA segregated the data by three regions: Denver, Suburbs, and Boulder. Denver and Suburbs had similar costestimates ($11.11 PSF and $14.19 PSF, respectively). Boulder estimates were much less ($6.45 PSF), since this analysiswas performed at the county level and not the city level.
2. RETAIL DATAPer square foot retail operating expenses were provided in the Urban Land Institute’s Dollars and Cents of ShoppingCenters (see Table 28). The PSF operating expenses were categorized by maintenance and housekeeping, advertisingand promotion, real estate taxes, insurance, and general and administrative functions (Appendix I). For the purpose ofthis study, these categories were then grouped by services to buildings (cleaning, repairs/maintenance, roads/grounds,and security) and management services (administrative).

33
ULI data was segmented into five categories of shopping centers: Super Regional, Regional, Super Community,Neighborhood, and Convenience. A weighted average was calculated using the total area by type in Colorado, fortotal PSF operating expenditures of $9.84.
3. INDUSTRIAL DATAPer square foot industrial operating expenses were provided in NAIOP’s Industrial Income and Expense Report: 2001-2002 (Table 29). This was the most current expense report detailing operating expenses for the industry; thereforeexpenses were inflated appropriately for 2006 using the Denver-Boulder-Greeley CPI (Table 30). The median operatingexpenses of $1.08 were applied throughout Colorado.

34
4. HOTEL DATAPer square foot hotel operating expenses were obtained from PKF Hospitality Research and were estimated at $46.98per square foot.
5. MULTIPLIERSRegional Input-Output Modeling System (RIMS II) multipliers published by the Bureau of Economic Analysis were usedto estimate the total output, earnings, and employment multiplier effects by industry sector by region in Colorado.
RIMS II multipliers are segmented by industry sector and by economic region in Colorado (Appendix C). This studyemploys the multipliers with the impact of local government included. Multipliers are reported by output, earnings,and employment and impacts can be calculated as a function of output, earnings, and employment, or from outputalone. For instance, if the utilities industry output multiplier is 2.1365 for the State of Colorado, then the impact of $1million in utilities spending on Colorado’s economy is $2.1365 million ($1 million direct spending and $1.1365 indirect).Direct earnings can then be calculated using the direct earnings per dollar of sales to final demand multiplier, which inthis scenario is 0.1808. Therefore, the $1 million in utilities spending equates to $180,800 in direct earnings. Similarly,employment can be calculated using the direct employment per million dollars of sales to final demand multiplier,which in this scenario is 2.2577, or 2.2577 employees for every $1 million in utility expenditures. Conversely, simpleearnings and employment multipliers can be utilized if direct earnings and employment are already known.
TENANT IMPROVEMENTS & CONSTRUCTIONTenant improvements and construction area and value were obtained from McGraw-Hill Construction Research &Analytics. This value does not include soft costs or site development. Soft costs for architectural, engineering, and construction management were obtained from RS Means CostWorks, while site development costs were obtainedanecdotally from the Clayton Lane2 case.
2 The Clayton Lane case was prepared November 8, 2006 by David B. Agnew, Esq., and Thomas G. Thibodeau, Ph.D., as an analysis tool of amajor redevelopment in Cherry Creek, Colorado.
Table 30: Denver-Boulder-Greeley CPI
Year Index Percentage
Change
2001 181.3 - 2002 184.8 1.93% 2003 186.8 1.08% 2004 187.0 0.11% 2005 190.9 2.09% 2006 197.7 3.56%
Source: Bureau of Labor Statistics, http://data.bls.gov/

35
HARD AND SOFT COSTSThe economic value of construction spending to the Colorado economy can be separated into two components, softcosts and hard costs. Soft costs are defined as the initial spending on a construction project that include architects,engineers, development (land entitlement), land planning, legal services, land improvements, landscape architecture,and infrastructure improvements (Table 31). Hard costs are defined as direct outlays during the construction processand include both labor and building materials plus construction equipment costs. The labor spending represents theemployment in the construction sector of skilled workers, including carpenters, steel workers, electricians, plumbers,building engineers, and heavy equipment operators. It also includes indirectly employed workers in such companies asraw materials producers of lumber, concrete, and steel.
BUILDING OPERATIONSBuildings also contribute economically to the State of Colorado’s economy after construction is complete and thespace is occupied. This contribution can be defined as the amount of money spent on an annual basis to operate,maintain, and clean the property; property management services used to bill and maintain relationships with tenants;the utilities that the building consumes; and financing costs that are received by lenders within the State of Colorado.
TRANSACTIONS AND REFINANCINGTwo industries rely heavily on commercial real estate transactions: commercial real estate brokerage, and commercialmortgage brokerage and investment. Commercial real estate brokers make their entire profession from buying andselling real estate for investors and leasing of commercial space to and for tenants. Banks invest a large portion oftheir mortgage pools in commercial properties and draw significant fees from securitizing large portfolios ofcommercial mortgages into commercial mortgage-backed security (CMBS) pools.
Transaction and refinancing values and area were obtained from Real Capital Analytics’ “Capital Trends Monthly”. Thisdata encompassed all commercial transactions in Colorado over $2.5 million for the full year of 2006. Real CapitalAnalytics tracks the major metropolitan areas in Colorado: Denver Metro, North Front Range, and Colorado Springs.Total transaction and refinancing value were allocated to each county in these regions on a pro rata basis using squarefootage for each property type. Transaction and refinancing volumes for counties outside the Front Range wereestimated in two steps. First, the square feet of commercial space that was either sold or refinanced was estimatedusing the same proportion sold or refinanced in the Front Range. We then used the average Front Range propertyprice per square foot for actual transactions and refinancing (obtained from Real Capital Analytics) to estimate totaltransaction/refinancing volume. For Colorado’s Front Range, Real Capital Analytics estimated 2006 transaction volumeat $6.5 billion and 2006 refinancing volume at $2.5 billion. For non-Front Range counties, we estimate 2006transaction volume at $1.4 billion and 2006 refinancing volume at $610 million.

36
Region 1 - Eastern Plains Agricultural Bent, Cheyenne, Crowley, Elbert, Kiowa, KitCarson, Lincoln, Logan, Otero, Phillips,Sedgwick, Washington Counties
Region 2 - Southern Colorado Alamosa, Baca, Conejos, Costilla, Custer,Huerfano, Las Animas, Prowers, Rio Grande,Saguache Counties
Region 3 - Pueblo Fremont, Pueblo Counties
Region 4 - Colorado Springs El Paso, Teller Counties
Region 5 - Denver Metropolitan Adams, Arapahoe, Boulder, Broomfield,Denver, Douglas, Jefferson Counties
Region 6 - Larimer-Weld Larimer, Morgan, Weld Counties
Region 7 - Scenic and Resort Chaffee, Clear Creek, Dolores, Eagle,Gilpin, Grand, Gunnison, Hinsdale, Jackson,Lake, Mineral, Ouray, Pitkin, Routt, SanJuan, San Miguel, Summit, Archuleta, LaPlata, Montezuma Counties
Region 8 - Western Slope Urban Delta, Mesa, Montrose Counties
Region 9 - Energy and Mining Garfield, Moffat, Rio Blanco Counties
Region 10 - State of Colorado Colorado
Source: Bureau of Labor Statistics, Colorado State Demography Office
Appendix C: RIMS II Colorado Regions

37
Ap
pen
dix
D:
Su
pp
ly o
f E
xist
ing
Co
mm
erci
al a
nd
Mu
ltif
amily
Pro
per
ty (
000s
sf)
, by
Pro
per
ty T
ype,
by
Co
un
ty, 2
006
Cou
nty
Offi
ce
Indu
stria
l R
etai
l H
otel
M
ultif
amily
To
tal
C
ount
y O
ffice
In
dust
rial
Ret
ail
Hot
el
Mul
tifam
ily
Tota
l
ADAM
S
12,6
47
37,
149
1
8,12
3
2
,194
4
0,43
1
110
,544
LA
PLAT
A
1,14
4
89
8
1,72
3
1
,260
4,
051
9,07
6
ALAM
OSA
3
94
293
8
56
229
75
5
2,52
7
L
AKE
274
79
155
16
40
5
929
AR
APAH
OE
44
,076
2
4,95
4
27,
498
3,7
18
82,
863
1
83,1
10
L
ARIM
ER
8,28
9
1
2,99
7
1
1,82
2
1
,673
27,
599
6
2,38
0
ARC
HU
LETA
74
3
28
134
65
797
1,
398
LAS
AN
IMAS
261
159
495
2
08
77
7
1,
900
BA
CA
6
8
336
72
3
9
7
57
6
L
INC
OLN
108
108
146
34
17
5
570
BE
NT
8
0
94
70
17
12
5
38
5
L
OG
AN
47
0
72
1
89
4
239
937
3,26
0
BOU
LDER
19,7
22
28,
220
1
7,59
2
3
,439
3
7,40
4
106
,376
MES
A
3,04
9
4,46
7
6,02
4
1
,030
8,
763
2
3,33
3
CH
AFFE
E
2
39
199
4
64
308
69
6
1,90
5
M
INER
AL
1
4
1,18
0
1
2
11
21
1,23
9
CH
EYEN
NE
104
1
20
31
6
67
328
MO
FFAT
247
309
495
1
61
96
7
2,
178
C
LEAR
CR
EEK
177
54
384
1
03
479
1,
197
MO
NTE
ZUM
A
35
6
56
0
1,01
6
372
603
2,90
8
CO
NEJ
OS
8
3
125
48
11
20
2
46
9
M
ON
TRO
SE
64
0
1,02
3
1,10
6
192
1,
283
4,24
3
CO
STIL
LA
5
9
21
13
7
8
1
18
2
M
OR
GAN
493
1,
183
763
68
1,02
2
3,
529
C
RO
WLE
Y
27
25
24
3
68
147
OTE
RO
462
1,
029
643
1
29
90
4
3,
166
C
UST
ER
1
4
88
8
34
9
1
23
6
O
UR
AY
4
6
55
3
2
0
26
107
75
2
DEL
TA
254
4
91
622
56
613
2,
036
PAR
K
7
5
5
3
7
8
8
163
37
7
DEN
VER
67,6
37
62,
470
3
3,99
0
10,
004
121
,002
2
95,1
02
P
HIL
LIPS
129
8
9
11
3
4
97
43
2 D
OLO
RES
1
74
9
,142
17
4
1
6
9,35
3
P
ITKI
N
90
7
31
5
1,32
9
1
,753
5,
483
9,78
6
DO
UG
LAS
8
,364
3,7
69
10,
362
9
90
20,
662
44,
148
PR
OW
ERS
257
538
459
1
71
55
9
1,
984
EA
GLE
1,2
92
741
2,4
34
4
,360
1
5,82
9
2
4,65
6
P
UEB
LO
3,85
7
1
3,33
2
6,04
6
970
10,
290
3
4,49
5
EL P
ASO
25,2
25
29,
166
2
8,40
5
6
,077
5
9,07
2
147
,945
RIO
BLA
NC
O
19
4
183
156
75
34
3
950
ELBE
RT
8
8
67
1
19
2
7
2
34
9
R
IO G
RAN
DE
237
338
215
39
48
9
1,
317
FR
EMO
NT
533
2,1
89
1
,179
1
15
1,
618
5,
634
RO
UTT
693
574
1,
059
1,2
13
6,87
3
10,
412
G
ARFI
ELD
1,0
79
662
2,1
33
986
3,38
9
8,24
8
S
AGU
ACH
E
5
5
4
9
2
8
-
124
25
6
GIL
PIN
24
2
20
91
9
67
405
1,70
8
SAN
JU
AN
2
4
33
41
16
6
2
177
GR
AND
2
27
296
6
18
1
,334
4,25
3
6,72
8
S
AN M
IGU
EL
23
2
15
2
30
3
976
1,
743
3,40
6
GU
NN
ISO
N
362
2
23
597
5
93
2,
211
3,
986
SED
GW
ICK
59
114
92
29
8
6
380
H
INSD
ALE
5
63
12
34
48
163
SU
MM
IT
67
1
16
2
2,44
1
2
,613
15,
639
2
1,52
6
HU
ERFA
NO
81
65
141
91
408
78
6
TEL
LER
177
15
1
44
5
321
569
1,66
4 JA
CKS
ON
52
88
32
9
58
239
WAS
HIN
GTO
N
9
5
13
8
7
5
3
143
45
3
JEFF
ERSO
N
25
,646
2
1,67
4
28,
922
3,3
20
58,
297
1
37,8
58
W
ELD
5,
363
9,
495
6,
278
5
94
1
4,84
7
36,
576
KI
OW
A
60
3
,677
28
67
3
2
3,86
4
Y
UM
A
14
2
15
3
19
5
15
237
74
2
KIT
CAR
SON
1
56
255
1
64
118
20
5
898
T
ota
l 2
38,0
39
278
,398
2
19,8
50
53,
482
5
57,7
06
1,3
47,4
75
Sour
ce: M
cGra
w-H
ill C
onst
ruct
ion
Res
earc
h &
Anal
ytic
s

38
A ppe
ndix
E: E
cono
mic
Impa
cts
ofEx
istin
gCo
mm
erci
al P
rope
rty,b
yCo
unty
,200
6
Cou
nty
Di re
ctS
pend
i ng,
000s
Tota
lOu t
put,
000s
Ear
ning
s,00
0 sw
/Mul
tiplie
r ,00
0sE
mp l
oym
ent
w/M
ulti p
lier
Cou
nty
Dir e
c tS
pend
ing,
000s
Tota
lO
utpu
t,00
0s
Ear
ning
s,00
0sw
/Mul
tiplie
r,00
0sE
mpl
oym
ent
w/M
ultip
lier
Ada
ms
$441
,122
$957
,390
$181
, 22 8
$341
,325
5,55
410
,529
La P
lata
$82,
207
$134
,768
$30,
183
$45,
060
1,15
61,
666
Ala
mos
a21
,617
33, 8
198,
707
12,4
5030
243
2La
ke5,
743
9,65
92 ,
314
3 ,41
367
105
Ara
pah o
e1,
004 ,
734
2,17
9,87
541
0,79
077
5,49
912
,41 4
23,7
78La
rimer
286,
248
497,
625
113,
130
172,
410
3,43
75,
463
Arc
hule
ta5 ,
090
8,39
51,
921
2 ,85
569
101
Las
Ani
mas
16,1
2125
, 096
6,2 9
79,
0 49
230
325
Bac
a1,
954
3 ,11
38 7
01,
226
2537
Linc
o ln
4,10
76,
499
1 ,70
42,
441
5682
Ben
t2,
465
3 ,90
71,
029
1,4 7
433
49Lo
gan
23,8
1537
,570
9,73
213
,968
334
478
Bou
l der
5 80,
0 58
1 ,25
3 ,97
123
4,67
944
3,69
27,
412
13,8
95M
esa
134,
270
232,
224
54,9
7185
,287
1,77
42,
794
Cha
ffee
19,7
8032
,418
7,26
410
,843
279
402
Min
eral
2,02
63,
404
830
1,2 1
724
37
Che
yenn
e2,
062
3,29
088
91,
268
2640
Mof
fat
14,1
1323
, 314
5,2 2
47 ,
8 40
1 80
268
Cle
arC
ree k
9,6 4
01 5
,972
3,7 1
15,
500
127
189
Mon
tezu
ma
28,4
7446
,947
10,7
6015
,987
389
569
Con
ejo s
2 ,11
73,
341
8 94
1,2 7
028
41M
ontro
se26
,133
45,2
1510
,711
16,6
1834
354
2
Co s
t illa
1,26
61,
992
526
749
1725
Mor
gan
16,5
6928
,886
6 ,68
310
,139
1 94
313
Cro
wle
y70
61,
125
304
433
914
Ote
ro17
,657
27,9
927,
406
10,5
912 4
034
9
Cus
ter
1,77
72,
730
637
929
2737
Our
ay2,
483
4,11
595
31,
413
3248
De l
ta10
,930
19,0
184,
599
7,10
414
022
4P
ark
2,01
83,
388
814
1,19
924
37
Den
ver
1,6 8
8,8 0
93,
645,
133
678,
222
1,28
5,13
521
,55 4
40,3
83P
hilli
ps2,
904
4,65
01,
282
1,82
237
56
Dol
ores
12,6
532 1
,493
5,3 9
97,
881
136
222
Pitk
in18
1,58
529
3,99
163
,148
95,0
532,
748
3,83
2
Dou
gla s
2 38,
3 33
517,
672
98,1
0918
4,76
72,
975
5,67
3P
row
ers
14,6
5722
,877
5,81
68,
337
206
2 94
Eag
le4 3
1,7 8
869
7,60
214
8,82
222
4,31
16,
614
9,17
7P
uebl
o15
2,97
428
7,92
062
, 816
103,
183
1,96
23 ,
303
El P
aso
8 46,
8 48
1,58
6,64
234
2,90
556
4,31
911
,01 2
18, 3
64R
io B
lanc
o7 ,
199
11,9
202,
665
4,00
790
136
Elb
ert
2,26
63 ,
633
1,0 1
31,
4 35
2943
Rio
Gra
nde
6,88
010
,856
2,90
84,
129
9113
4
Frem
ont
23,1
7 44 3
,861
9,6 8
415
,869
291
497
Rou
tt12
7,96
420
7,35
744
,679
67,2
091,
927
2,6 9
3
Gar
field
120,
6 67
195,
007
41,2
0362
,370
1,65
02 ,
349
Sag
uach
e1,
035
1,64
846
164
913
20
Gilp
in41
, 627
6 7,0
5814
,163
21,3
9064
889
3S
anJu
an1,
348
2,22
751
276
018
27
Gra
nd1 2
8,8 9
820
8,00
344
,207
66,6
801,
988
2 ,75
0S
anM
igue
l94
,060
151,
753
32,2
0248
,589
1,45
12,
007
Gun
niso
n34
,425
5 6,2
0212
,423
18,5
9349
770
7S
edgw
i ck
2,83
54,
470
1,15
31,
656
4057
Hin
s dal
e1,
658
2,68
75 8
087
225
35S
umm
it26
4,04
742
7,08
591
,586
137,
888
4,02
55,
598
Hue
rfano
6,05
59,
383
2,29
83,
3 17
8812
3Te
ller
19,2
8135
,394
7,24
212
,067
2 87
444
Jack
son
1,43
52,
397
5 65
8 35
1827
Was
hing
ton
2,15
43,
450
952
1,35
22 7
41
Jeffe
rson
733,
182
1,5 9
0,84
030
0,6 2
056
6,67
39,
193
17,4
68W
eld
156,
143
272,
049
62,8
1195
,334
1,82
02,
936
Kio
wa
7,82
91 2
,410
3,26
54,
6 75
105
153
Yum
a4,
214
6,72
51,
835
2,61
055
82
Kit
Car
son
8,61
11 3
,484
3 ,35
54 ,
853
125
176
AllR
egio
ns8,
134 ,
842
16,0
64,9
383,
208,
657
5,62
1,86
710
6,68
618
3,56
6
Not
e :O
mi ts
exis
ting
mul
tifam
ilyho
usin
g.
Sou
rce s
:M
cGr a
w-H
illC
onst
r uct
i on
Res
earc
h &
Ana
lyti c
s,20
07; B
OM
A I n
ter n
a tio
nal ,
Exp
erie
nce
Exc
hang
eR
epo r
t20 0
7;U
r ban
Land
Inst
itute
,Do l
lars
& C
ents
ofS
hopp
i ng
Cen
ters
/Th
e S
CO
RE
2006
;P
KF
Hos
pita
lity
Re s
earc
h;N
AIO
PIn
dust
rial I
ncom
ean
d E
xpen
seR
epo r
t 200
1-20
02;U
nive
rsity
ofC
olor
ado-
Bou
lder
;Uni
vers
ityof
Den
ver

39
Total Operating Expenses: Total or summation of cleaning,repairs/maintenance, utilities, roads/grounds, security andAdministrative.
Cleaning: All required items for both daytime and nighttime cleaningof offices, public areas, atrium, elevators, restrooms, windows, and soforth. Cleaning includes upkeep and ordinary expenses, as well asreplacement of cleaning equipment and supplies. It does not includeany expenses for machine rooms and other restricted access areas.
Repairs/Maintenance: All expenses for elevators, HVAC, electrical,structural/roof, plumbing, and other building maintenance (includingcommon areas, parking lots and general upkeep). Total payroll fromindividual item categories should be included in payroll.
Utilities: All utilities expensed to the building. Includes any energythat is sub-metered, even if tenants are directly off-setting the costs;show the total expenses, not the net expense after tenantreimbursement.
Roads/Ground: Any expense related to exterior maintenance (excludeparking lot r/m) other than the building structure (or related remotemechanical equipment), such as landscaping, snow removal, sitesignage, site lighting, and so forth.
Security: Expenses related to the security of tenants and buildings.
Administrative: Expenses directly connected with administration ofthe building. Administrative expenses do not include generalmaintenance/operation costs.
Source: BOMA International. Experience Exchange Report 2007. 2007,pages 554-555.
Appendix F: BOMA Office Expense Definitions

40
Appe
ndix
G: E
cono
mic
Impa
cts
of E
xist
ing
Offi
ce R
eal E
stat
e, b
y Co
unty
, 200
6
Cou
nty
Dire
ct
Spe
ndin
g,
000s
Tota
l Out
put,
000s
E
arni
ngs,
00
0s
w/M
ultip
lier,
000s
E
mpl
oym
ent
w/M
ultip
lier
Cou
nty
Dire
ct
Spe
ndin
g,
000s
Tota
l Out
put,
000s
E
arni
ngs,
00
0s
w/M
ultip
lier,
000s
E
mpl
oym
ent
w/M
ultip
lier
Ada
ms
$179
,461
$3
90,6
01
$73,
669
$1
39,2
97
2
,081
4,
142
La P
lata
$1
6,23
2
$27,
394
$6
,523
$9
,645
1
78
28
7
Ala
mos
a
5,
584
8,86
8
2,43
9
3,44
9
7
0
10
6
La
ke
3,
887
6,56
0
1,
562
2,31
0
4
3
6
9
Ara
paho
e 6
25,4
44
1,3
61,2
96
256
,747
4
85,4
69
7
,251
14,
435
La
rimer
117
,614
204
,466
4
7,20
6
71,
588
1,2
86
2,12
9
Arc
hule
ta
1,05
2
1,
776
423
62
5
1
2
19
Las
Ani
mas
3,70
5
5,
883
1,61
8
2,28
8
46
70
Bac
a
964
1,53
1
42
1
59
5
1
2
1
8
Li
ncol
n
1,53
1
2,
452
66
7
952
19
29
Ben
t
1,
134
1,81
6
49
4
70
5
1
4
2
1
Lo
gan
6,
665
10,
674
2,90
5
4,
143
83
126
Bou
lder
2
79,8
50
6
09,1
00
114
,879
2
17,2
19
3
,245
6,
459
Mes
a
4
3,26
1
75,
443
1
8,17
6
28,
176
5
07
84
7
Cha
ffee
3,38
7
5,
716
1,
361
2,
013
3
7
6
0
Min
eral
20
5
346
8
2
122
2
4
Che
yenn
e
1,
476
2,36
5
64
4
91
8
1
8
28
Mof
fat
3,
502
5,98
5
1,
407
2,
112
3
8
6
2
Cle
ar C
reek
2,
513
4,24
0
1,01
0
1,49
3
2
8
4
4
M
onte
zum
a
5,04
7
8,
517
2,02
8
2,
999
55
89
Con
ejos
1,
175
1,86
6
51
3
72
6
1
5
2
2
M
ontro
se
9,
079
1
5,83
3
3,
815
5,91
3
106
178
Cos
tilla
842
1,33
7
36
8
52
0
1
1
1
6
M
orga
n
6,99
7
12,
165
2,80
9
4,
259
77
127
Cro
wle
y
389
62
3
17
0
24
2
5
7
Ote
ro
6,
554
1
0,49
7
2,
857
4,07
4
8
2
12
4
Cus
ter
19
9
316
87
123
2
4
Our
ay
647
1,09
2
260
38
5
7
1
1
Del
ta
3,60
0
6,27
8
1,51
3
2,34
5
4
2
7
1
P
ark
1,
059
1,78
7
425
62
9
1
2
1
9
Den
ver
959
,765
2
,088
,953
3
93,9
87
744
,968
11,1
27
2
2,15
1
Phi
llips
1,82
5
2,
923
79
6
1,
135
23
34
Dol
ores
2,
465
4,16
0
99
1
1,46
5
2
7
44
Pitk
in
12,
874
2
1,72
7
5,
173
7,
650
141
228
Dou
glas
1
18,6
81
2
58,3
11
4
8,71
9
9
2,12
0
1,3
76
2,73
9
Pro
wer
s
3,64
9
5,
795
1,
594
2,
254
46
69
Eag
le
1
8,33
7
30,
948
7,
369
10,
896
2
02
32
4
Pue
blo
54,
736
102
,853
2
2,62
1
37,
039
6
30
1,11
5
El P
aso
357
,937
672
,587
1
47,9
28
242
,210
4,1
23
7,29
1
R
io B
lanc
o
2,75
0
4,
699
1,10
5
1,
658
30
49
Elb
ert
1,24
9
2,
000
544
776
16
24
R
io G
rand
e
3,36
4
5,
342
1,46
9
2,
078
42
6
4
Frem
ont
7,56
3
14,
211
3,
125
5,
117
87
15
4
R
outt
9,
828
1
6,58
6
3,
949
5,
840
108
174
Gar
field
15,
308
26,
158
6,
151
9,23
1
1
67
27
3
Sag
uach
e
77
9
1,
236
340
481
10
1
5
Gilp
in
34
3
579
138
20
4
4
6
S
an J
uan
340
575
13
7
202
4
6
Gra
nd
3,21
6
5,
428
1,
293
1,
911
35
5
7
S
an M
igue
l
3,28
9
5,
552
1,32
2
1,
955
36
5
8
Gun
niso
n
5,
143
8,68
0
2,06
7
3,
056
57
91
S
edgw
ick
840
1,
346
36
6
522
10
16
Hin
sdal
e
76
12
8
3
0
4
5
1
1
Sum
mit
9,
516
1
6,06
1
3,
824
5,
655
105
168
Hue
rfano
1,
149
1,
825
502
71
0
14
22
Te
ller
2,
506
4,
709
1,
036
1,
696
29
5
1
Jack
son
73
2
1,
235
294
43
5
8
1
3
Was
hing
ton
1,
353
2,
167
59
0
841
17
26
Jeffe
rson
3
63,9
11
7
92,0
62
149
,387
2
82,4
67
4
,219
8,
399
Wel
d
7
6,09
8
1
32,2
92
30,
543
4
6,31
8
832
1,
377
Kio
wa
85
4
1,
368
372
53
1
1
1
1
6
Yum
a
2,02
0
3,23
5
881
1,25
6
2
5
3
8
Kit
Car
son
2,21
7
3,
550
966
1,
378
28
42
All R
egio
ns
3,3
77,7
71
7,0
26,1
03
1,3
86,6
91
2,5
09,4
33
38
,973
74,
756
Sou
rces
:
McG
raw
-Hill
Con
stru
ctio
n R
esea
rch
& A
naly
tics,
200
7; B
OM
A In
tern
atio
nal,
Exp
erie
nce
Exc
hang
e R
epor
t 200
7; U
nive
rsity
of C
olor
ado-
Bou
lder
; Uni
vers
ity o
f Den
ver.

41
Appe
ndix
H: E
cono
mic
Impa
cts
of E
xist
ing
Indu
stria
l Rea
l Est
ate,
by
Coun
ty, 2
006
Cou
nty
Dire
ct
Spe
ndin
g,
000s
Tota
l O
utpu
t, 00
0s
Ear
ning
s,
000s
w
/Mul
tiplie
r, 00
0s
Em
ploy
men
t w
/Mul
tiplie
r
Cou
nty
Dire
ct
Spe
ndin
g,
000s
Tota
l O
utpu
t, 00
0s
Ear
ning
s,
000s
w
/Mul
tiplie
r, 00
0s
Em
ploy
men
t w
/Mul
tiplie
r
Ada
ms
$40,
216
$88,
896
$17,
548
$3
2,62
9
4
41
915
La P
lata
$9
73
$1,6
56
$422
$6
14
10
17
Ala
mos
a
317
509
1
46
20
5
4
6
La
ke
8
6
14
6
3
7
54
1
1
Ara
paho
e
27,
015
59,
715
11,7
88
2
1,91
8
2
96
615
Larim
er
1
4,07
0
2
4,83
4
6,09
7
9,
114
148
2
52
Arc
hule
ta
35
5
60
5
154
224
4
6
Las
Ani
mas
172
276
79
11
1
2
3
Bac
a
364
584
1
68
23
5
4
7
Li
ncol
n
117
188
54
7
6
1
2
Ben
t
101
164
47
66
1
2
Loga
n
780
1,
260
360
50
8
9
14
Bou
lder
30,
550
67,
530
13,3
31
2
4,78
7
3
35
695
Mes
a
4,
836
8,
553
2,
165
3,31
6
54
93
Cha
ffee
21
5
36
6
9
3
13
6
2
4
M
iner
al
1,27
7
2,17
5
55
5
807
1
3
22
Che
yenn
e
130
210
60
85
2
2
Mof
fat
33
4
57
6
14
5
213
4
6
Cle
ar C
reek
58
99
25
37
1
1
Mon
tezu
ma
60
7
1,03
3
26
3
383
6
11
Con
ejos
135
217
62
88
2
2
Mon
trose
1,
107
1,
958
496
75
9
12
21
Cos
tilla
23
37
11
15
0
0
Mor
gan
1,28
1
2,26
1
55
5
830
1
3
23
Cro
wle
y
27
43
12
17
0
0
Ote
ro
1,11
4
1,79
8
51
3
725
1
3
20
Cus
ter
9
6
15
4
4
4
6
2
1
2
O
uray
599
1,
019
260
37
8
6
10
Del
ta
53
2
94
1
238
365
6
10
Par
k
57
98
25
3
6
1
1
Den
ver
6
7,62
9
149
,490
29,5
09
5
4,87
0
7
41
1
,539
Phi
llips
96
155
44
6
3
1
2
Dol
ores
9,
897
16,
853
4,2
97
6,25
1
1
04
173
Pitk
in
34
1
58
0
14
8
215
4
6
Dou
glas
4,
081
9,
020
1,7
81
3,31
1
45
93
P
row
ers
58
2
93
5
26
9
377
7
11
Eag
le
80
2
1,36
6
348
507
8
14
Pue
blo
1
4,43
3
2
7,84
7
6,40
1
10,
398
158
2
92
El P
aso
3
1,57
5
6
0,92
0
14
,003
22,
748
347
6
40
R
io B
lanc
o
198
342
86
12
7
2
3
Elb
ert
7
3
11
8
3
4
4
7
1
1
R
io G
rand
e
366
587
169
23
7
4
7
Frem
ont
2,37
0
4,57
3
1
,051
1,
708
2
6
48
Rou
tt
622
1,
058
270
39
3
7
11
Gar
field
717
1,
236
3
11
45
8
8
13
S
agua
che
5
3
8
5
2
4
34
1
1
Gilp
in
23
8
40
6
104
151
3
4
San
Jua
n
36
61
16
2
3
0
1
Gra
nd
32
1
54
6
139
202
3
6
San
Mig
uel
16
5
28
1
7
2
104
2
3
Gun
niso
n
241
411
1
05
15
2
3
4
S
edgw
ick
12
4
20
0
5
7
81
1
2
Hin
sdal
e
69
117
30
43
1
1
Sum
mit
17
6
29
9
7
6
111
2
3
Hue
rfano
70
112
32
45
1
1
Telle
r
164
316
73
11
8
2
3
Jack
son
9
6
16
3
4
2
6
0
1
2
W
ashi
ngto
n
149
241
69
9
7
2
3
Jeffe
rson
23,
463
51,
865
10,2
38
1
9,03
7
2
57
534
Wel
d
10,
279
18,
142
4,
454
6,65
8
1
08
184
Kio
wa
3,98
0
6,42
7
1
,834
2,
589
4
7
73
Yum
a
166
268
76
10
8
2
3
Kit
Car
son
27
6
44
5
127
179
3
5
COLO
RADO
3
01,3
87
623
,368
1
32,0
39
2
30,2
95
3,2
93
6
,449
Sou
rces
:
McG
raw
-Hill
Con
stru
ctio
n R
esea
rch
& A
naly
tics,
200
7; N
AIO
P In
dust
rial I
ncom
e an
d E
xpen
se R
epor
t 200
1-20
02; U
nive
rsity
of C
olor
ado-
Bou
lder
; Uni
vers
ity o
f Den
ver.

42
Total Operating Expenses: Expenses for building maintenance; theparking lot, mall, and other common areas; the central utility system;office area services; advertising and promotion; real estate taxes; insurance; and general and administrative functions.
Utilities: All costs of tenant space HVAC and utilities provided by centers with central plants or systems. The center then bills tenants forthese services.
Building maintenance and repair: Roof maintenance and repair andsuch items as painting, repairs, systems equipment maintenance, andalterations to structures (not capitalized, etc.).
Total real estate taxes: Taxes paid by the building owners on thecounty-assessed property values, based on county, city, special, andschool mill levies.
Total insurance: Public liability, property, terrorism, special (e.g., earthquake/fire), and other-such as rental value (use and occupancy)insurance.
Total general and administrative expenses: Management agent fees(fees paid to an outside agent for managing the center’s operations);leasing agent fees (fees paid to an outside agent for leasing tenantspace); bad debt allowance; on-site payroll and benefits; legal andaudit services; other professional services; etc.
Total advertising and promotion: Contributions in kind, such assalaries, expenses, and other services (for example, cost of furnishing ameeting place for public use, net of any reimbursements). Thiscategory includes costs for advertising, promotions/special events,Christmas décor/events, marketing administration, and cashcontributions to the merchants association.
Parking lot, mall, and other common areas: Maintenance, repair, andstriping of parking lots; utilities, including lighting and power used formaintenance of signs that are the landlord’s responsibility; security;heating, ventilating, and air conditioning (HVAC) of an enclosed mall;snow and trash removal; maintenance of landscaping of grounds; maintenance of elevators and escalators; etc.
Other office area services: Janitorial services, lighting, etc., of officeareas occupied by tenants.
Source: Urban Land Institute. Dollars & Cents of Shopping Centers /The SCORE 2006. 2006, page 7
Appendix I: Urban Land Institute Retail Expense Definitions

43
Appe
ndix
J: E
cono
mic
Impa
cts
of E
xist
ing
Reta
il Re
al E
stat
e, b
y Co
unty
, 200
6
Cou
nty
Dire
ct
Spe
ndin
g,
000s
Tota
l O
utpu
t, 00
0s
Ear
ning
s,
000s
w
/Mul
tiplie
r, 00
0s
Em
ploy
men
t w
/Mul
tiplie
r
Cou
nty
Dire
ct
Spe
ndin
g,
000s
Tota
l O
utpu
t, 00
0s
Ear
ning
s,
000s
w
/Mul
tiplie
r, 00
0s
Em
ploy
men
t w
/Mul
tiplie
r
Ada
ms
$129
,763
$2
87,7
44
$58,
004
$106
,963
1,5
44
3,07
7
La
Pla
ta
$12,
337
$21,
020
$5
,463
$7
,919
1
40
22
7
Ala
mos
a
6,
130
9,
857
2,
903
4,
048
78
119
Lake
1,11
0
1,
892
492
71
3
1
3
2
0
Ara
paho
e 1
96,8
87
436
,590
88,
009
1
62,2
93
2
,342
4,
669
Larim
er
84,
643
149
,775
37,
361
5
5,68
5
958
1,
593
Arc
hule
ta
95
7
1,63
1
424
615
11
18
Las
Ani
mas
3,54
3
5,
698
1,
678
2,
340
45
69
Bac
a
516
829
24
4
340
7
10
Linc
oln
1,
048
1,69
0
49
6
695
13
20
Ben
t
500
807
23
7
33
2
6
1
0
Lo
gan
6,
403
1
0,32
5
3,
028
4,24
3
82
124
Bou
lder
1
25,9
59
279
,310
56,
304
1
03,8
27
1
,499
2,
987
Mes
a
4
3,13
5
76,
348
19,
726
3
0,00
8
519
870
Cha
ffee
3,32
0
5,65
6
1,
470
2,
131
38
61
Min
eral
8
7
148
38
5
6
1
2
Che
yenn
e
220
355
10
4
14
6
3
4
M
offa
t
3,54
4
6,
109
1,
562
2,
289
40
65
Cle
ar C
reek
2,
751
4,
688
1,21
8
1,
766
31
51
Mon
tezu
ma
7,
276
1
2,39
7
3,22
2
4,
671
83
134
Con
ejos
345
555
16
4
22
8
4
7
M
ontro
se
7,
916
1
4,01
2
3,62
0
5,
507
9
5
160
Cos
tilla
93
149
44
61
1
2
Mor
gan
5,
461
9,66
3
2,41
0
3,
592
62
103
Cro
wle
y
170
27
4
80
113
2
3
Ote
ro
4,
604
7,42
5
2,17
8
3,
051
59
89
Cus
ter
6
0
97
2
9
40
1
1
Our
ay
147
25
0
6
5
94
2
3
Del
ta
4,45
3
7,88
1
2,
036
3,09
8
54
90
Par
k
56
0
954
248
36
0
6
10
Den
ver
243
,367
5
39,6
57
108
,786
2
00,6
06
2
,895
5,
772
Phi
llips
80
8
1,
303
382
53
5
1
0
1
6
Dol
ores
124
211
55
79
1
2
Pitk
in
9,
513
1
6,20
8
4,21
2
6,10
6
108
175
Dou
glas
74,
192
164
,519
33,
164
61,
156
883
1,
760
Pro
wer
s
3,28
7
5,
286
1,
557
2,
171
42
6
4
Eag
le
1
7,42
6
29,
692
7,71
7
1
1,18
7
198
320
Pue
blo
43,
287
8
4,29
2
1
9,64
9
31,
884
5
15
92
4
El P
aso
203
,378
3
96,0
36
9
2,31
7
149
,806
2,4
18
4,34
1
Rio
Bla
nco
1,
115
1,92
2
49
1
720
13
20
Elb
ert
85
3
1,
375
40
3
565
11
17
Rio
Gra
nde
1,
538
2,47
3
72
8
1,
015
20
30
Frem
ont
8,43
9
1
6,43
2
3,83
0
6,21
6
1
00
18
0
R
outt
7,
583
1
2,92
0
3,35
8
4,86
8
8
6
13
9
Gar
field
15,
270
2
6,32
3
6,
731
9,
863
172
281
Sag
uach
e
20
3
327
96
134
3
4
Gilp
in
65
5
1,
116
29
0
42
0
7
12
San
Jua
n
29
6
504
131
19
0
3
5
Gra
nd
4,42
8
7,54
4
1,96
1
2,84
2
5
0
8
1
S
an M
igue
l
2,16
9
3,
696
961
1,39
2
2
5
4
0
Gun
niso
n
4,
273
7,
280
1,89
2
2,
743
49
7
8
S
edgw
ick
656
1,
057
310
43
4
8
1
3
Hin
sdal
e
86
147
38
56
1
2
S
umm
it
1
7,47
9
29,
781
7,
740
11,
220
1
99
32
1
Hue
rfano
1,
013
1,62
9
480
669
1
3
20
Telle
r
3,18
9
6,
211
1,
448
2,
349
38
6
8
Jack
son
22
7
387
10
1
14
6
3
4
Was
hing
ton
534
86
2
25
3
354
7
10
Jeffe
rson
2
07,0
84
459
,202
92,
567
1
70,6
98
2
,464
4,
911
Wel
d
4
4,94
9
79,
537
19,
840
2
9,57
1
509
846
Kio
wa
19
9
32
1
94
13
2
3
4
Yum
a
1,39
4
2,
248
659
92
4
1
8
2
7
Kit
Car
son
1,17
5
1,89
5
55
6
77
9
15
23
COLO
RADO
1
,574
,128
3
,256
,520
7
05,6
53
1,2
19,0
51
18
,627
35,
106
Sou
rces
:
McG
raw
-Hill
Con
stru
ctio
n R
esea
rch
& A
naly
tics,
200
7; U
rban
Lan
d In
stitu
te, D
olla
rs &
Cen
ts o
f Sho
ppin
g C
ente
rs /
The
SC
OR
E 2
006;
Uni
vers
ity o
f Col
orad
o-B
ould
er; U
nive
rsity
of D
enve
r.

44
Appe
ndix
K: E
cono
mic
Impa
cts
of E
xist
ing
Hote
l Rea
l Est
ate,
by
Coun
ty, 2
006
Cou
nty
Dire
ct
Spe
ndin
g,
000s
Tota
l O
utpu
t, 00
0s
Ear
ning
s,
000s
w
/Mul
tiplie
r, 00
0s
Em
ploy
men
t w
/Mul
tiplie
r
Cou
nty
Dire
ct
Spe
ndin
g,
000s
Tota
l O
utpu
t, 00
0s
Ear
ning
s,
000s
w
/Mul
tiplie
r, 00
0s
Em
ploy
men
t w
/Mul
tiplie
r
Ada
ms
$91,
682
$190
,149
$3
2,00
6 $6
2,43
5
1
,489
2,
395
La P
lata
$5
2,66
6 $8
4,69
8
$17,
775
$2
6,88
1
827
1,
135
Ala
mos
a
9,
585
14,
585
3,
219
4,74
8
150
201
Lake
66
0
1,
061
223
33
7
1
0
1
4
Ara
paho
e 1
55,3
88
322
,274
54,
246
105
,819
2,5
24
4,06
0
La
rimer
6
9,92
0
1
18,5
49
2
2,46
5
36,
023
1,0
45
1,48
9
Arc
hule
ta
2,72
5
4,38
3
92
0
1,
391
43
5
9
La
s A
nim
as
8,
701
1
3,24
0
2,92
2
4,
310
1
36
18
3
Bac
a
111
16
9
3
7
5
5
2
2
Linc
oln
1,
412
2,16
9
48
7
719
23
30
Ben
t
730
1,
121
252
37
1
1
2
16
Loga
n
9,96
7
15,
312
3,
439
5,07
4
160
214
Bou
lder
1
43,6
98
298
,031
50,
165
9
7,85
9
2
,334
3,
754
Mes
a
4
3,03
7
71,
881
14,
904
2
3,78
7
693
983
Cha
ffee
1
2,85
8
20,
679
4,
340
6,
563
2
02
27
7
M
iner
al
457
73
4
15
4
233
7
10
Che
yenn
e
235
361
81
11
9
4
5
Mof
fat
6,
733
1
0,64
4
2,11
0
3,
226
98
13
4
Cle
ar C
reek
4,
318
6,94
5
1,45
7
2,20
4
6
8
93
Mon
tezu
ma
15,
545
2
4,99
9
5,24
6
7,
934
2
44
33
5
Con
ejos
462
702
155
22
9
7
10
Mon
trose
8,03
0
13,
412
2,
781
4,43
8
129
183
Cos
tilla
308
469
103
15
3
5
6
Mor
gan
2,
830
4,79
8
90
9
1,
458
42
60
Cro
wle
y
120
18
4
4
1
6
1
2
3
Ote
ro
5,
385
8,27
2
1,85
8
2,
741
86
115
Cus
ter
1,42
2
2,16
4
47
7
70
4
2
2
30
Our
ay
1,
090
1,75
4
368
55
7
1
7
2
4
Del
ta
2,34
6
3,
918
812
1,29
7
3
8
54
Par
k
34
2
550
115
174
5
7
Den
ver
418
,048
8
67,0
32
145
,941
2
84,6
91
6
,790
10,
922
Phi
llips
17
5
268
6
0
89
3
4
Dol
ores
167
269
56
8
5
3
4
Pitk
in
1
58,8
59
2
55,4
76
5
3,61
5
81,
081
2
,494
3,
424
Dou
glas
41,
380
8
5,82
2
1
4,44
6
28,
180
6
72
1,08
1
P
row
ers
7,
138
1
0,86
1
2,
397
3,
535
112
150
Eag
le
395
,222
6
35,5
96
133
,387
2
01,7
21
6
,206
8,
518
Pue
blo
40,
518
7
2,92
9
1
4,14
5
23,
861
6
58
97
2
El P
aso
253
,958
4
57,0
99
8
8,65
7 1
49,5
56
4
,125
6,
093
Rio
Bla
nco
3,
136
4,
957
983
1,50
2
46
63
Elb
ert
9
1
14
0
3
1
4
6
1
2
Rio
Gra
nde
1,
613
2,45
4
54
2
799
25
34
Frem
ont
4,80
3
8,64
5
1,67
7
2,
829
78
11
5
R
outt
1
09,9
32
1
76,7
93
3
7,10
2
56,
110
1
,726
2,
369
Gar
field
89,
373
141
,290
28,
009
4
2,81
9
1
,303
1,
783
Sag
uach
e
-
-
-
-
-
-
Gilp
in
4
0,39
1
6
4,95
6
1
3,63
2
2
0,61
5
634
871
San
Jua
n
67
6
1,
087
228
34
5
1
1
1
5
Gra
nd
120
,933
1
94,4
84
4
0,81
5
61,
724
1,8
99
2,60
7
S
an M
igue
l
8
8,43
7
142
,224
29,
847
4
5,13
8
1,3
89
1,90
6
Gun
niso
n
24,
768
39,
831
8,
359
12,
641
3
89
53
4
S
edgw
ick
1,
216
1,86
7
41
9
619
20
26
Hin
sdal
e
1,
427
2,
295
482
72
8
2
2
31
Sum
mit
2
36,8
76
3
80,9
45
7
9,94
6
1
20,9
02
3
,719
5,
105
Hue
rfano
3,
823
5,81
7
1,
284
1,89
3
6
0
80
Telle
r
1
3,42
3
2
4,15
9
4,
686
7,
905
218
322
Jack
son
38
1
61
2
12
9
19
4
6
8
Was
hing
ton
117
18
0
40
6
0
2
3
Jeffe
rson
1
38,7
23
287
,712
48,
428
9
4,47
1
2
,253
3,
624
Wel
d
2
4,81
7
4
2,07
8
7,97
4
12,
786
3
71
52
9
Kio
wa
2,79
5
4,29
4
96
4
1,42
3
4
5
60
Yum
a
63
4
974
219
323
10
14
Kit
Car
son
4,94
3
7,59
4
1,70
5
2,
517
79
106
COLO
RADO
2
,881
,556
5
,158
,947
9
84,2
74
1,6
63,0
87
45
,793
67,
255
Sou
rces
:
McG
raw
-Hill
Con
stru
ctio
n R
esea
rch
& A
naly
tics,
200
7; P
KF
Hos
pita
lity
Res
earc
h; U
nive
rsity
of C
olor
ado-
Bou
lder
; Uni
vers
ity o
f Den
ver.

45
Appe
ndix
L: E
cono
mic
Impa
cts
of T
enan
t Im
prov
emen
ts, b
y Co
unty
, 200
6
Cou
nty
Dire
ct S
pend
ing,
00
0s
Tota
l O
utpu
t, 00
0s
Ear
ning
s,
000s
w
/Mul
tiplie
r, 00
0s
Em
ploy
men
t w
/Mul
tiplie
r
Cou
nty
Dire
ct S
pend
ing,
00
0s
Tota
l O
utpu
t, 00
0s
Ear
ning
s,
000s
w
/Mul
tiplie
r, 00
0s
Em
ploy
men
t w
/Mul
tiplie
r
Ada
ms
13
,611
31,9
00
5,
020
10,8
72
120
30
0
La
ke
$0
$0
$0
$0
-
-
Ala
mos
a
-
-
-
-
-
-
La P
lata
6
78
1
,177
233
3
83
6
11
Ara
paho
e
38,4
57
90
,096
1
4,21
5
30
,738
3
38
847
Larim
er
23
,812
46,1
37
8,0
90
14,
638
1
93
409
Arc
hule
ta
-
-
-
-
-
-
La
s A
nim
as
-
-
-
-
-
-
Bac
a
-
-
-
-
-
-
Li
ncol
n
-
-
-
-
-
-
Ben
t
-
-
-
-
-
-
Loga
n
-
-
-
-
-
-
Bou
lder
27,1
07
63
,507
1
0,01
9
21
,666
2
38
597
Mes
a
4,5
27
8
,705
1
,784
3,1
15
4
2
87
Cha
ffee
-
-
-
-
-
-
M
iner
al
-
-
-
-
-
-
Che
yenn
e
-
-
-
-
-
-
Mof
fat
-
-
-
-
-
-
Cle
ar C
reek
2
64
458
9
1
1
49
2
4
Mon
tezu
ma
-
-
-
-
-
-
Con
ejos
-
-
-
-
-
-
Mon
trose
5
05
971
199
3
47
5
10
Cos
tilla
-
-
-
-
-
-
Mor
gan
-
-
-
-
-
-
Cro
wle
y
-
-
-
-
-
-
Ote
ro
226
3
77
85
132
2
4
Cus
ter
-
-
-
-
-
-
O
uray
-
-
-
-
-
-
Del
ta
-
-
-
-
-
-
P
ark
-
-
-
-
-
-
Den
ver
127
,375
2
98,4
15
47,
080
1
01,8
10
1
,119
2,80
5
P
hilli
ps
-
-
-
-
-
-
Dol
ores
-
-
-
-
-
-
Pitk
in
-
-
-
-
-
-
Dou
glas
7,6
35
17
,886
2,82
2
6,1
02
6
7
168
Pro
wer
s
-
-
-
-
-
-
Eag
le
24
,227
42,0
65
8,
350
13,6
91
198
38
0
P
uebl
o
12,3
88
25
,241
4
,623
8,6
83
110
24
3
Elb
ert
-
-
-
-
-
-
R
io B
lanc
o
-
-
-
-
-
-
El P
aso
23
,434
47,7
47
8,
743
16,4
23
208
46
0
R
io G
rand
e
-
-
-
-
-
-
Frem
ont
-
-
-
-
-
-
R
outt
-
-
-
-
-
-
Gar
field
1,3
66
2
,411
47
2
7
90
1
1
22
Sag
uach
e
-
-
-
-
-
-
Gilp
in
-
-
-
-
-
-
S
an J
uan
-
-
-
-
-
-
Gra
nd
-
-
-
-
-
-
S
an M
igue
l
-
-
-
-
-
-
Gun
niso
n
-
-
-
-
-
-
Sed
gwic
k
-
-
-
-
-
-
Hin
sdal
e
-
-
-
-
-
-
Sum
mit
238
4
13
82
134
2
4
Hue
rfano
-
-
-
-
-
-
Telle
r
3
12
637
117
2
19
3
6
Jack
son
-
-
-
-
-
-
W
ashi
ngto
n
-
-
-
-
-
-
Jeffe
rson
34,2
19
80
,169
1
2,64
7
27,3
50
301
75
4
W
eld
4
,476
8,6
71
1,5
21
2
,751
36
7
7
Kio
wa
-
-
-
-
-
-
Y
uma
-
-
-
-
-
-
Kit
Car
son
-
-
-
-
-
-
To
tal
$344
,855
$7
66,9
81
$126
,192
$2
59,9
96
3
,000
7,18
6
Sou
rces
: M
cGra
w-H
ill C
onst
ruct
ion
Res
earc
h &
Ana
lytic
s, 2
007;
Uni
vers
ity o
f Col
orad
o-B
ould
er; U
nive
rsity
of D
enve
r.

46
Appe
ndix
M: E
cono
mic
Impa
cts
of O
ffice
Ten
ant I
mpr
ovem
ents
, by
Coun
ty, 2
006
Cou
nty
Dire
ct S
pend
ing,
00
0s
Tota
l O
utpu
t, 00
0s
Ear
ning
s,
000s
w
/Mul
tiplie
r, 00
0s
Em
ploy
men
t w
/Mul
tiplie
r
Cou
nty
Dire
ct S
pend
ing,
00
0s
Tota
l O
utpu
t, 00
0s
Ear
ning
s,
000s
w
/Mul
tiplie
r, 00
0s
Em
ploy
men
t w
/Mul
tiplie
r
Ada
ms
$2,2
47
$5,2
65
$831
$1
,796
20
4
9
La
ke
$0
$0
$0
$0
-
-
Ala
mos
a
-
-
-
-
-
-
La P
lata
2
08
361
72
1
17
2
3
Ara
paho
e
19,5
53
45
,807
7,22
8
15
,629
1
72
431
Larim
er
11
,634
22,5
39
3,9
53
7
,152
94
20
0
Arc
hule
ta
-
-
-
-
-
-
Las
Ani
mas
-
-
-
-
-
-
Bac
a
-
-
-
-
-
-
Linc
oln
-
-
-
-
-
-
Ben
t
-
-
-
-
-
-
Loga
n
-
-
-
-
-
-
Bou
lder
14,6
96
34
,430
5,43
3
11
,747
1
29
324
Mes
a
3,2
20
6
,192
1
,269
2,2
16
3
0
62
Cha
ffee
-
-
-
-
-
-
M
iner
al
-
-
-
-
-
-
Che
yenn
e
-
-
-
-
-
-
M
offa
t
-
-
-
-
-
-
Cle
ar C
reek
2
64
458
9
1
149
2
4
M
onte
zum
a
-
-
-
-
-
-
Con
ejos
-
-
-
-
-
-
Mon
trose
5
05
971
199
3
47
5
10
Cos
tilla
-
-
-
-
-
-
M
orga
n
-
-
-
-
-
-
Cro
wle
y
-
-
-
-
-
-
Ote
ro
-
-
-
-
-
-
Cus
ter
-
-
-
-
-
-
Our
ay
-
-
-
-
-
-
Del
ta
-
-
-
-
-
-
Par
k
-
-
-
-
-
-
Den
ver
9
,155
21,4
48
3,
384
7,3
18
8
0
202
Phi
llips
-
-
-
-
-
-
Dol
ores
-
-
-
-
-
-
Pitk
in
-
-
-
-
-
-
Dou
glas
5,2
23
12
,236
1,93
1
4
,175
46
11
5
P
row
ers
-
-
-
-
-
-
Eag
le
-
-
-
-
-
-
P
uebl
o
3,3
05
6
,733
1
,233
2,3
16
2
9
65
Elb
ert
-
-
-
-
-
-
R
io B
lanc
o
-
-
-
-
-
-
El P
aso
13
,466
27,4
36
5,
025
9,4
38
119
26
4
R
io G
rand
e
-
-
-
-
-
-
Frem
ont
-
-
-
-
-
-
R
outt
-
-
-
-
-
-
Gar
field
5
94
1
,048
20
5
344
5
9
S
agua
che
-
-
-
-
-
-
Gilp
in
-
-
-
-
-
-
S
an J
uan
-
-
-
-
-
-
Gra
nd
-
-
-
-
-
-
S
an M
igue
l
-
-
-
-
-
-
Gun
niso
n
-
-
-
-
-
-
S
edgw
ick
-
-
-
-
-
-
Hin
sdal
e
-
-
-
-
-
-
Sum
mit
238
4
13
82
134
2
4
Hue
rfano
-
-
-
-
-
-
Telle
r
3
12
637
117
2
19
3
6
Jack
son
-
-
-
-
-
-
W
ashi
ngto
n
-
-
-
-
-
-
Jeffe
rson
9,2
13
21
,584
3,40
6
7,3
64
8
1
203
Wel
d
2,5
93
5
,024
881
1,5
94
2
1
45
Kio
wa
-
-
-
-
-
-
Yum
a
-
-
-
-
-
-
Kit
Car
son
-
-
-
-
-
-
To
tal
$96,
426
$2
12,5
82
$35,
339
$7
2,05
6
840
1,99
5
Sou
rces
: M
cGra
w-H
ill C
onst
ruct
ion
Res
earc
h &
Ana
lytic
s, 2
007;
Uni
vers
ity o
f Col
orad
o-B
ould
er; U
nive
rsity
of D
enve
r.

47
Appe
ndix
N: E
cono
mic
Impa
cts
of In
dust
rial T
enan
t Im
prov
emen
ts, b
y Co
unty
200
6
Cou
nty
Dire
ct S
pend
ing,
00
0s
Tota
l O
utpu
t, 00
0s
Ear
ning
s,
000s
w
/Mul
tiplie
r, 00
0s
Em
ploy
men
t w
/Mul
tiplie
r
Cou
nty
Dire
ct S
pend
ing,
00
0s
Tota
l O
utpu
t, 00
0s
Ear
ning
s,
000s
w
/Mul
tiplie
r, 00
0s
Em
ploy
men
t w
/Mul
tiplie
r
Ada
ms
$6,1
74
$14,
479
$2
,271
$4
,929
54
13
6
La
ke
$0
$0
$0
$0
-
-
Ala
mos
a
-
-
-
-
-
-
La P
lata
2
33
404
80
1
31
2
4
Ara
paho
e
5
99
1
,405
22
0
478
5
1
3
La
rimer
9
98
1
,937
338
6
14
8
17
Arc
hule
ta
-
-
-
-
-
-
La
s A
nim
as
-
-
-
-
-
-
Bac
a
-
-
-
-
-
-
Linc
oln
-
-
-
-
-
-
Ben
t
-
-
-
-
-
-
Lo
gan
-
-
-
-
-
-
Bou
lder
9
05
2
,122
33
3
722
8
2
0
M
esa
-
-
-
-
-
-
Cha
ffee
-
-
-
-
-
-
Min
eral
-
-
-
-
-
-
Che
yenn
e
-
-
-
-
-
-
Mof
fat
-
-
-
-
-
-
Cle
ar C
reek
-
-
-
-
-
-
Mon
tezu
ma
-
-
-
-
-
-
Con
ejos
-
-
-
-
-
-
M
ontro
se
-
-
-
-
-
-
Cos
tilla
-
-
-
-
-
-
Mor
gan
-
-
-
-
-
-
Cro
wle
y
-
-
-
-
-
-
O
tero
2
26
377
85
1
32
2
4
Cus
ter
-
-
-
-
-
-
O
uray
-
-
-
-
-
-
Del
ta
-
-
-
-
-
-
Par
k
-
-
-
-
-
-
Den
ver
2
,937
6,8
86
1,
080
2,3
44
2
6
65
Phi
llips
-
-
-
-
-
-
Dol
ores
-
-
-
-
-
-
Pitk
in
-
-
-
-
-
-
Dou
glas
-
-
-
-
-
-
P
row
ers
-
-
-
-
-
-
Eag
le
291
5
05
100
164
2
5
P
uebl
o
-
-
-
-
-
-
Elb
ert
-
-
-
-
-
-
R
io B
lanc
o
-
-
-
-
-
-
El P
aso
1
,150
2,3
45
427
8
04
1
0
23
Rio
Gra
nde
-
-
-
-
-
-
Frem
ont
-
-
-
-
-
-
R
outt
-
-
-
-
-
-
Gar
field
-
-
-
-
-
-
S
agua
che
-
-
-
-
-
-
Gilp
in
-
-
-
-
-
-
S
an J
uan
-
-
-
-
-
-
Gra
nd
-
-
-
-
-
-
S
an M
igue
l
-
-
-
-
-
-
Gun
niso
n
-
-
-
-
-
-
Sed
gwic
k
-
-
-
-
-
-
Hin
sdal
e
-
-
-
-
-
-
Sum
mit
-
-
-
-
-
-
Hue
rfano
-
-
-
-
-
-
Te
ller
-
-
-
-
-
-
Jack
son
-
-
-
-
-
-
W
ashi
ngto
n
-
-
-
-
-
-
Jeffe
rson
1,1
82
2
,771
43
5
943
10
2
6
W
eld
-
-
-
-
-
-
Kio
wa
-
-
-
-
-
-
Y
uma
-
-
-
-
-
-
Kit
Car
son
-
-
-
-
-
-
To
tal
$14,
693
$3
3,23
1 $5
,367
$1
1,26
1
128
31
2
Sou
rces
: M
cGra
w-H
ill C
onst
ruct
ion
Res
earc
h &
Ana
lytic
s, 2
007;
Uni
vers
ity o
f Col
orad
o-B
ould
er; U
nive
rsity
of D
enve
r.

48
Ap
pend
ix O
: Eco
nom
ic Im
pact
s of
Ret
ail T
enan
t Im
prov
emen
ts, b
y Co
unty
, 200
6
Cou
nty
Dire
ct S
pend
ing,
00
0s
Tot
al
Out
put,
000s
Ear
ning
s,
000s
w
/Mul
tiplie
r,
000s
E
mpl
oym
ent
w/M
ultip
lier
C
ount
y D
irect
Spe
ndin
g,
000s
Tot
al
Out
put,
000s
Ear
ning
s,
000s
w
/Mul
tiplie
r, 00
0s
Em
ploy
men
t w
/Mul
tiplie
r
Ada
ms
$5,1
89
$12,
156
$1
,918
$4
,147
46
11
4
La
ke
$0
$0
$0
$0
-
-
Ala
mos
a
-
-
-
-
-
-
La
Pla
ta
238
4
13
82
134
2
4
Ara
paho
e
15,9
29
37
,319
5,88
8
12
,733
1
40
351
Larim
er
9
,957
19,2
90
3,3
83
6
,121
81
17
1
Arc
hule
ta
-
-
-
-
-
-
La
s A
nim
as
-
-
-
-
-
-
Bac
a
-
-
-
-
-
-
Linc
oln
-
-
-
-
-
-
Ben
t
-
-
-
-
-
-
Loga
n
-
-
-
-
-
-
Bou
lder
11,5
06
26
,955
4,25
3
9
,197
1
01
253
Mes
a
1,0
69
2
,056
421
7
36
1
0
21
Cha
ffee
-
-
-
-
-
-
M
iner
al
-
-
-
-
-
-
Che
yenn
e
-
-
-
-
-
-
Mof
fat
-
-
-
-
-
-
Cle
ar C
reek
-
-
-
-
-
-
Mon
tezu
ma
-
-
-
-
-
-
Con
ejos
-
-
-
-
-
-
Mon
trose
-
-
-
-
-
-
Cos
tilla
-
-
-
-
-
-
M
orga
n
-
-
-
-
-
-
Cro
wle
y
-
-
-
-
-
-
Ote
ro
-
-
-
-
-
-
Cus
ter
-
-
-
-
-
-
O
uray
-
-
-
-
-
-
Del
ta
-
-
-
-
-
-
P
ark
-
-
-
-
-
-
Den
ver
23
,425
54,8
79
8,
659
18,7
24
206
51
6
P
hilli
ps
-
-
-
-
-
-
Dol
ores
-
-
-
-
-
-
Pitk
in
-
-
-
-
-
-
Dou
glas
1,9
36
4
,536
71
6
1
,548
17
4
3
P
row
ers
-
-
-
-
-
-
Eag
le
-
-
-
-
-
-
P
uebl
o
3,0
26
6
,164
1
,129
2,1
21
2
7
59
Elb
ert
-
-
-
-
-
-
R
io B
lanc
o
-
-
-
-
-
-
El P
aso
7
,454
15,1
87
2,
782
5,2
24
6
6
146
Rio
Gra
nde
-
-
-
-
-
-
Fre
mon
t
-
-
-
-
-
-
Rou
tt
-
-
-
-
-
-
Gar
field
7
72
1
,363
26
7
447
6
1
2
S
agua
che
-
-
-
-
-
-
Gilp
in
-
-
-
-
-
-
S
an J
uan
-
-
-
-
-
-
Gra
nd
-
-
-
-
-
-
S
an M
igue
l
-
-
-
-
-
-
Gun
niso
n
-
-
-
-
-
-
S
edgw
ick
-
-
-
-
-
-
Hin
sdal
e
-
-
-
-
-
-
Sum
mit
-
-
-
-
-
-
Hue
rfano
-
-
-
-
-
-
Tel
ler
-
-
-
-
-
-
Jack
son
-
-
-
-
-
-
W
ashi
ngto
n
-
-
-
-
-
-
Jeffe
rson
13,2
98
31
,155
4,91
6
10,6
30
117
29
3
W
eld
238
4
60
81
146
2
4
Kio
wa
-
-
-
-
-
-
Yum
a
-
-
-
-
-
-
Kit
Car
son
-
-
-
-
-
-
To
tal
$94,
036
$2
11,9
32
$34,
496
$7
1,90
6
820
1,98
7
Sou
rces
: M
cGra
w-H
ill C
onst
ruct
ion
Res
earc
h &
Ana
lytic
s, 2
007;
Uni
vers
ity o
f Col
orad
o-B
ould
er; U
nive
rsity
of D
enve
r.

49
Appe
ndix
P: E
cono
mic
Impa
cts
of H
otel
Ten
ant I
mpr
ovem
ents
, by
Coun
ty, 2
006
Cou
nty
Dire
ct S
pend
ing,
00
0s
Tota
l O
utpu
t, 00
0s
Ear
ning
s,
000s
w
/Mul
tiplie
r, 00
0s
Em
ploy
men
t w
/Mul
tiplie
r
Cou
nty
Dire
ct S
pend
ing,
00
0s
Tota
l O
utpu
t, 00
0s
Ear
ning
s,
000s
w
/Mul
tiplie
r, 00
0s
Em
ploy
men
t w
/Mul
tiplie
r
Ada
ms
$0
$0
$0
$0
-
-
Lake
$0
$0
$0
$0
-
-
Ala
mos
a
-
-
-
-
-
-
La P
lata
-
-
-
-
-
-
Ara
paho
e
2,3
76
5
,566
87
8
1
,899
21
5
2
La
rimer
7
48
1
,450
254
4
60
6
13
Arc
hule
ta
-
-
-
-
-
-
La
s A
nim
as
-
-
-
-
-
-
Bac
a
-
-
-
-
-
-
Li
ncol
n
-
-
-
-
-
-
Ben
t
-
-
-
-
-
-
Loga
n
-
-
-
-
-
-
Bou
lder
-
-
-
-
-
-
Mes
a
2
38
457
94
1
63
2
5
Cha
ffee
-
-
-
-
-
-
M
iner
al
-
-
-
-
-
-
Che
yenn
e
-
-
-
-
-
-
Mof
fat
-
-
-
-
-
-
Cle
ar C
reek
-
-
-
-
-
-
Mon
tezu
ma
-
-
-
-
-
-
Con
ejos
-
-
-
-
-
-
Mon
trose
-
-
-
-
-
-
Cos
tilla
-
-
-
-
-
-
Mor
gan
-
-
-
-
-
-
Cro
wle
y
-
-
-
-
-
-
Ote
ro
-
-
-
-
-
-
Cus
ter
-
-
-
-
-
-
O
uray
-
-
-
-
-
-
Del
ta
-
-
-
-
-
-
P
ark
-
-
-
-
-
-
Den
ver
84
,494
1
97,9
48
31,
234
67,5
37
742
1,86
1
P
hilli
ps
-
-
-
-
-
-
Dol
ores
-
-
-
-
-
-
Pitk
in
-
-
-
-
-
-
Dou
glas
-
-
-
-
-
-
Pro
wer
s
-
-
-
-
-
-
Eag
le
23
,936
41,5
60
8,
250
13,5
27
196
37
5
P
uebl
o
-
-
-
-
-
-
Elb
ert
-
-
-
-
-
-
R
io B
lanc
o
-
-
-
-
-
-
El P
aso
-
-
-
-
-
-
R
io G
rand
e
-
-
-
-
-
-
Frem
ont
-
-
-
-
-
-
R
outt
-
-
-
-
-
-
Gar
field
-
-
-
-
-
-
Sag
uach
e
-
-
-
-
-
-
Gilp
in
-
-
-
-
-
-
S
an J
uan
-
-
-
-
-
-
Gra
nd
-
-
-
-
-
-
S
an M
igue
l
-
-
-
-
-
-
Gun
niso
n
-
-
-
-
-
-
Sed
gwic
k
-
-
-
-
-
-
Hin
sdal
e
-
-
-
-
-
-
Sum
mit
-
-
-
-
-
-
Hue
rfano
-
-
-
-
-
-
Telle
r
-
-
-
-
-
-
Jack
son
-
-
-
-
-
-
W
ashi
ngto
n
-
-
-
-
-
-
Jeffe
rson
7
13
1
,670
26
3
570
6
1
6
W
eld
-
-
-
-
-
-
Kio
wa
-
-
-
-
-
-
Y
uma
-
-
-
-
-
-
Kit
Car
son
-
-
-
-
-
-
Tota
l $1
12,5
04
$248
,651
$4
0,97
4
$84,
157
974
2,32
1
Sou
rces
: M
cGra
w-H
ill C
onst
ruct
ion
Res
earc
h &
Ana
lytic
s, 2
007;
Uni
vers
ity o
f Col
orad
o-B
ould
er; U
nive
rsity
of D
enve
r.

50
Appe
ndix
Q: E
cono
mic
Impa
cts
of M
ultif
amily
Ten
ant I
mpr
ovem
ents
, by
Coun
ty, 2
006
Cou
nty
Dire
ct S
pend
ing,
00
0s
Tota
l Out
put,
000s
E
arni
ngs,
00
0s
w/M
ultip
lier,
000s
E
mpl
oym
ent
w/M
ultip
lier
C
ount
y D
irect
Spe
ndin
g,
000s
To
tal O
utpu
t, 00
0s
Ear
ning
s,
000s
w
/Mul
tiplie
r, 00
0s
Em
ploy
men
t w
/Mul
tiplie
r
Ada
ms
$0
$0
$0
$0
-
-
Lake
$0
$0
$0
$0
-
-
Ala
mos
a
-
-
-
-
-
-
La P
lata
-
-
-
-
-
-
Ara
paho
e
-
-
-
-
-
-
Larim
er
475
9
21
1
61
292
4
8
Arc
hule
ta
-
-
-
-
-
-
La
s A
nim
as
-
-
-
-
-
-
Bac
a
-
-
-
-
-
-
Linc
oln
-
-
-
-
-
-
Ben
t
-
-
-
-
-
-
Loga
n
-
-
-
-
-
-
Bou
lder
-
-
-
-
-
-
Mes
a
-
-
-
-
-
-
Cha
ffee
-
-
-
-
-
-
M
iner
al
-
-
-
-
-
-
Che
yenn
e
-
-
-
-
-
-
Mof
fat
-
-
-
-
-
-
Cle
ar C
reek
-
-
-
-
-
-
Mon
tezu
ma
-
-
-
-
-
-
Con
ejos
-
-
-
-
-
-
Mon
trose
-
-
-
-
-
-
Cos
tilla
-
-
-
-
-
-
Mor
gan
-
-
-
-
-
-
Cro
wle
y
-
-
-
-
-
-
Ote
ro
-
-
-
-
-
-
Cus
ter
-
-
-
-
-
-
O
uray
-
-
-
-
-
-
Del
ta
-
-
-
-
-
-
P
ark
-
-
-
-
-
-
Den
ver
7
,365
17,2
54
2,
722
5,8
87
6
5
162
Phi
llips
-
-
-
-
-
-
Dol
ores
-
-
-
-
-
-
Pitk
in
-
-
-
-
-
-
Dou
glas
4
75
1
,113
17
6
380
4
1
0
P
row
ers
-
-
-
-
-
-
Eag
le
-
-
-
-
-
-
P
uebl
o
6,0
58
12
,343
2
,261
4,2
46
5
4
119
Elb
ert
-
-
-
-
-
-
R
io B
lanc
o
-
-
-
-
-
-
El P
aso
1
,364
2,7
78
509
9
56
1
2
27
Rio
Gra
nde
-
-
-
-
-
-
Frem
ont
-
-
-
-
-
-
R
outt
-
-
-
-
-
-
Gar
field
-
-
-
-
-
-
Sag
uach
e
-
-
-
-
-
-
Gilp
in
-
-
-
-
-
-
S
an J
uan
-
-
-
-
-
-
Gra
nd
-
-
-
-
-
-
S
an M
igue
l
-
-
-
-
-
-
Gun
niso
n
-
-
-
-
-
-
Sed
gwic
k
-
-
-
-
-
-
Hin
sdal
e
-
-
-
-
-
-
Sum
mit
-
-
-
-
-
-
Hue
rfano
-
-
-
-
-
-
Telle
r
-
-
-
-
-
-
Jack
son
-
-
-
-
-
-
W
ashi
ngto
n
-
-
-
-
-
-
Jeffe
rson
9,8
13
22
,990
3,62
7
7
,844
86
21
6
W
eld
1
,645
3,1
87
5
59
1
,011
13
2
8
Kio
wa
-
-
-
-
-
-
Y
uma
-
-
-
-
-
-
Kit
Car
son
-
-
-
-
-
-
To
tal
$27,
195
$6
0,58
7
$10,
016
$2
0,61
6
238
57
1
Sou
rces
: M
cGra
w-H
ill C
onst
ruct
ion
Res
earc
h &
Ana
lytic
s, 2
007;
Uni
vers
ity o
f Col
orad
o-B
ould
er; U
nive
rsity
of D
enve
r

51
Appe
ndix
R: E
cono
mic
Impa
cts
of N
ew C
onst
ruct
ion,
by
Coun
ty, 2
006
Cou
nty
Dire
ct S
pend
ing,
00
0s
Tota
l O
utpu
t, 00
0s
Ear
ning
s,
000s
w
/Mul
tiplie
r, 00
0s
Em
ploy
men
t w
/Mul
tiplie
r
Cou
nty
Dire
ct S
pend
ing,
00
0s
Tota
l O
utpu
t, 00
0s
Ear
ning
s,
000s
w
/Mul
tiplie
r, 00
0s
Em
ploy
men
t w
/Mul
tiplie
r
Ada
ms
$393
,228
$9
21,3
78
$145
,239
$3
14,2
43
3
,455
8,66
1
La
ke
$174
$3
03
$60
$9
8
1
3
Ala
mos
a
1,4
25
2
,411
561
8
71
1
3
24
La P
lata
27,0
86
47
,030
9,3
36
15,
307
2
22
425
Ara
paho
e
3
50,0
43
820
,077
129,
386
27
9,78
9
3
,075
7,70
9
La
rimer
2
10,4
59
407
,776
7
1,50
2
129,
377
1,7
06
3,
613
Arc
hule
ta
3
,267
5,6
72
1,1
26
1
,846
27
5
1
La
s An
imas
-
-
-
-
-
-
Bac
a
-
-
-
-
-
-
Li
ncol
n
4,7
52
7
,942
1,7
86
2
,791
43
7
7
Ben
t
-
-
-
-
-
-
Loga
n
1,9
56
3
,270
7
35
1
,149
18
3
2
Bou
lder
1
86,9
53
438
,013
69,
084
14
9,42
0
1
,642
4,11
7
M
esa
56
,719
1
09,1
04
22,
315
3
9,01
5
532
1,09
0
Cha
ffee
174
3
03
60
98
1
3
M
iner
al
-
-
-
-
-
-
Che
yenn
e
7
51
1
,255
282
4
41
7
12
Mof
fat
238
4
19
82
1
37
2
4
Cle
ar C
reek
-
-
-
-
-
-
M
onte
zum
a
1,5
05
2
,614
5
18
850
12
2
4
Con
ejos
-
-
-
-
-
-
Mon
trose
17,8
18
34
,261
7,0
20
12,
262
1
67
342
Cos
tilla
-
-
-
-
-
-
Mor
gan
-
-
-
-
-
-
Cro
wle
y
-
-
-
-
-
-
Ote
ro
227
3
79
85
1
33
2
4
Cus
ter
-
-
-
-
-
-
Our
ay
349
6
06
120
1
97
3
5
Del
ta
174
3
36
68
120
2
3
P
ark
7
,721
13,4
06
2
,661
4,3
64
6
3
121
Den
ver
202
,805
4
66,9
55
8
1,99
3
166,
184
1,7
77
4,
436
Phi
llips
-
-
-
-
-
-
Dol
ores
-
-
-
-
-
-
Pitk
in
158
,545
2
75,2
85
54,
649
8
9,60
0
1
,297
2,48
5
Dou
glas
1
82,8
70
428
,466
67,
560
14
6,14
8
1
,607
4,02
7
P
row
ers
-
-
-
-
-
-
Eag
le
94
,733
1
64,4
87
3
2,65
0
53,
534
7
75
1,
485
Pue
blo
311
,248
6
34,4
62
115,
574
21
7,69
3
2
,759
6,11
0
Elb
ert
174
2
92
65
102
2
3
R
io B
lanc
o
-
-
-
-
-
-
El P
aso
289
,490
5
89,8
57
10
7,98
6
202,
860
2,5
66
5,
684
Rio
Gra
nde
915
1,5
48
360
5
59
9
16
Frem
ont
5
,345
10,8
91
1,9
95
3
,747
47
10
5
R
outt
55
,198
95,8
44
19,
017
3
1,18
6
452
86
5
Gar
field
38,2
95
67
,580
13,
235
2
2,14
9
314
60
9
S
agua
che
-
-
-
-
-
-
Gilp
in
172
,243
2
99,0
68
5
9,37
1
97,
341
1,4
09
2,
700
San
Jua
n
-
-
-
-
-
-
Gra
nd
55
,335
96,0
79
1
9,07
4
31,
272
4
53
867
San
Mig
uel
27
,520
47,7
83
9
,486
1
5,55
2
225
43
1
Gun
niso
n
32,1
92
55
,895
11,
096
1
8,19
3
263
50
5
S
edgw
ick
-
-
-
-
-
-
Hin
sdal
e
-
-
-
-
-
-
Sum
mit
14
,569
25,2
97
5
,022
8,2
34
119
22
8
Hue
rfano
-
-
-
-
-
-
Te
ller
10
,628
21,6
54
3
,966
7,4
49
9
4
209
Jack
son
-
-
-
-
-
-
W
ashi
ngto
n
-
-
-
-
-
-
Jeffe
rson
2
39,1
31
560
,254
88,
372
19
1,12
7
2
,101
5,26
6
W
eld
108
,753
2
10,7
85
36,
932
6
6,85
9
882
1,86
8
Kio
wa
-
-
-
-
-
-
Y
uma
174
2
92
65
1
02
2
3
Kit
Car
son
-
-
-
-
-
-
To
tal
$3,2
65,1
83
$6,8
69,3
28
$1,1
90,4
94
$2,3
22,3
98
28
,145
6
4,22
4
Sou
rces
: M
cGra
w-H
ill C
onst
ruct
ion
Res
earc
h &
Ana
lytic
s, 2
007;
Uni
vers
ity o
f Col
orad
o-B
ould
er; U
nive
rsity
of D
enve
r.

52
A
ppen
dix
S: E
cono
mic
Impa
cts
of O
ffice
Con
stru
ctio
n, b
y C
ount
y, 2
006
Cou
nty
Dire
ct S
pend
ing,
00
0s
Tot
al
Out
put,
000s
Ear
ning
s,
000s
w
/Mul
tiplie
r,
000s
E
mpl
oym
ent
w/M
ultip
lier
C
ount
y D
irect
Spe
ndin
g,
000s
Tot
al
Out
put,
000s
Ear
ning
s,
000s
w
/Mul
tiplie
r,
000s
E
mpl
oym
ent
w/M
ultip
lier
Ada
ms
$92,
026
$2
15,5
95
$34,
018
$73,
558
8
08
2,
027
Lake
$0
$0
$0
$0
-
-
Ala
mos
a
-
-
-
-
-
-
La
Pla
ta
11
,092
19,2
60
3
,823
6,2
69
9
1
174
Ara
paho
e
19,4
54
45
,576
7
,191
1
5,55
0
171
42
8
La
rimer
42,3
23
81
,994
1
4,38
1
26,
017
3
43
726
Arc
hule
ta
2
,970
5,1
56
1,0
24
1
,678
24
4
7
La
s A
nim
as
-
-
-
-
-
-
Bac
a
-
-
-
-
-
-
Li
ncol
n
-
-
-
-
-
-
Ben
t
-
-
-
-
-
-
Lo
gan
-
-
-
-
-
-
Bou
lder
14,6
00
34
,205
5
,397
1
1,67
0
128
32
2
M
esa
17
,885
34,3
89
7
,046
1
2,30
8
168
34
4
Cha
ffee
-
-
-
-
-
-
Min
eral
-
-
-
-
-
-
Che
yenn
e
2
40
401
90
1
41
2
4
Mof
fat
-
-
-
-
-
-
Cle
ar C
reek
-
-
-
-
-
-
M
onte
zum
a
-
-
-
-
-
-
Con
ejos
-
-
-
-
-
-
M
ontr
ose
-
-
-
-
-
-
Cos
tilla
-
-
-
-
-
-
M
orga
n
-
-
-
-
-
-
Cro
wle
y
-
-
-
-
-
-
O
tero
-
-
-
-
-
-
Cus
ter
-
-
-
-
-
-
Our
ay
-
-
-
-
-
-
Del
ta
-
-
-
-
-
-
Par
k
-
-
-
-
-
-
Den
ver
57
,204
1
34,0
14
2
1,14
6
45,
724
5
03
1,
260
Phi
llips
-
-
-
-
-
-
Dol
ores
-
-
-
-
-
-
P
itkin
7,9
61
13
,823
2,7
44
4
,499
65
12
5
Dou
glas
57,6
98
135
,171
21,
329
4
6,11
9
507
1,27
1
P
row
ers
-
-
-
-
-
-
Eag
le
950
1,6
50
3
28
537
8
1
5
P
uebl
o
17,0
58
34
,755
6,3
66
11,
956
1
51
335
Elb
ert
-
-
-
-
-
-
Rio
Bla
nco
-
-
-
-
-
-
El P
aso
91
,176
1
85,7
68
3
4,02
7
63,
904
8
08
1,
790
Rio
Gra
nde
663
1,1
21
261
4
05
6
11
Fre
mon
t
2,3
76
4
,841
887
1,6
65
2
1
47
Rou
tt
2,9
73
5
,163
1,0
25
1
,680
24
4
7
Gar
field
5,0
34
8
,884
1
,740
2,9
12
4
1
80
Sag
uach
e
-
-
-
-
-
-
Gilp
in
-
-
-
-
-
-
San
Jua
n
-
-
-
-
-
-
Gra
nd
-
-
-
-
-
-
San
Mig
uel
-
-
-
-
-
-
Gun
niso
n
-
-
-
-
-
-
S
edgw
ick
-
-
-
-
-
-
Hin
sdal
e
-
-
-
-
-
-
S
umm
it
-
-
-
-
-
-
Hue
rfan
o
-
-
-
-
-
-
T
elle
r
1
15
235
43
81
1
2
Jack
son
-
-
-
-
-
-
Was
hing
ton
-
-
-
-
-
-
Jeffe
rson
11,1
26
26
,065
4
,113
8,8
93
9
8
245
Wel
d
10,4
62
20
,268
3,5
55
6
,431
85
18
0
Kio
wa
-
-
-
-
-
-
Yum
a
-
-
-
-
-
-
Kit
Car
son
-
-
-
-
-
-
Tota
l $4
65,3
85
$1,0
08,3
33
$170
,534
$3
41,9
97
4
,054
9,47
8
Sou
rces
: M
cGra
w-H
ill C
onst
ruct
ion
Res
earc
h &
Ana
lytic
s, 2
007;
Uni
vers
ity o
f Col
orad
o-B
ould
er; U
nive
rsity
of D
enve
r.

53
Appe
ndix
T: E
cono
mic
Impa
cts
of In
dust
rial C
onst
ruct
ion,
by
Coun
ty, 2
006
Cou
nty
Dire
ct S
pend
ing,
00
0s
Tota
l O
utpu
t, 00
0s
Ear
ning
s,
000s
w
/Mul
tiplie
r, 00
0s
Em
ploy
men
t w
/Mul
tiplie
r
Cou
nty
Dire
ct S
pend
ing,
00
0s
Tota
l O
utpu
t, 00
0s
Ear
ning
s,
000s
w
/Mul
tiplie
r, 00
0s
Em
ploy
men
t w
/Mul
tiplie
r
Ada
ms
$64,
629
$1
51,5
50
$23,
769
$5
1,58
8
568
1,42
4
La
ke
$174
$3
03
$60
$9
8
1
3
Ala
mos
a
-
-
-
-
-
-
La P
lata
1
16
202
40
66
1
2
Ara
paho
e
5,7
85
13
,565
2
,128
4,6
18
5
1
127
Larim
er
10
,845
21,0
56
3
,674
6,6
69
8
8
187
Arc
hule
ta
-
-
-
-
-
-
Las
Ani
mas
-
-
-
-
-
-
Bac
a
-
-
-
-
-
-
Linc
oln
-
-
-
-
-
-
Ben
t
-
-
-
-
-
-
Loga
n
1
74
292
65
102
2
3
Bou
lder
13,1
87
30
,924
4
,850
1
0,52
6
116
29
1
M
esa
17
,236
33,1
85
6
,759
1
1,84
3
162
33
2
Cha
ffee
174
3
03
60
98
1
3
M
iner
al
-
-
-
-
-
-
Che
yenn
e
-
-
-
-
-
-
M
offa
t
-
-
-
-
-
-
Cle
ar C
reek
-
-
-
-
-
-
Mon
tezu
ma
377
6
54
129
2
12
3
6
Con
ejos
-
-
-
-
-
-
Mon
trose
-
-
-
-
-
-
Cos
tilla
-
-
-
-
-
-
M
orga
n
-
-
-
-
-
-
Cro
wle
y
-
-
-
-
-
-
Ote
ro
227
3
79
85
1
33
2
4
Cus
ter
-
-
-
-
-
-
Our
ay
349
6
06
120
1
97
3
5
Del
ta
174
3
36
68
120
2
3
P
ark
-
-
-
-
-
-
Den
ver
22
,537
52,8
48
8,2
88
17,
989
1
98
497
Phi
llips
-
-
-
-
-
-
Dol
ores
-
-
-
-
-
-
Pitk
in
-
-
-
-
-
-
Dou
glas
21,0
13
49
,275
7
,728
1
6,77
3
185
46
3
P
row
ers
-
-
-
-
-
-
Eag
le
1
,704
2,9
59
5
84
960
14
2
7
P
uebl
o
2
91,9
16
595
,075
10
8,35
9
20
4,14
3
2
,587
5,73
1
Elb
ert
174
2
92
65
102
2
3
R
io B
lanc
o
-
-
-
-
-
-
El P
aso
26
,640
54,3
06
9,8
89
18,
630
2
36
523
Rio
Gra
nde
252
4
27
99
1
54
2
4
Frem
ont
-
-
-
-
-
-
R
outt
4
,744
8,2
39
1
,626
2,6
73
3
9
74
Gar
field
-
-
-
-
-
-
Sag
uach
e
-
-
-
-
-
-
Gilp
in
-
-
-
-
-
-
San
Jua
n
-
-
-
-
-
-
Gra
nd
-
-
-
-
-
-
S
an M
igue
l
-
-
-
-
-
-
Gun
niso
n
-
-
-
-
-
-
Sed
gwic
k
-
-
-
-
-
-
Hin
sdal
e
-
-
-
-
-
-
Sum
mit
-
-
-
-
-
-
Hue
rfano
-
-
-
-
-
-
Telle
r
-
-
-
-
-
-
Jack
son
-
-
-
-
-
-
Was
hing
ton
-
-
-
-
-
-
Jeffe
rson
13,3
84
31
,385
4
,922
1
0,68
3
118
29
5
W
eld
21
,981
42,6
77
7
,447
1
3,51
7
179
37
8
Kio
wa
-
-
-
-
-
-
Y
uma
174
2
92
65
1
02
2
3
Kit
Car
son
-
-
-
-
-
-
To
tal
$517
,969
$1
,091
,131
$1
90,8
80
$371
,999
4,5
60
10,
386
Sou
rces
: M
cGra
w-H
ill C
onst
ruct
ion
Res
earc
h &
Ana
lytic
s, 2
007;
Uni
vers
ity o
f Col
orad
o-B
ould
er; U
nive
rsity
of D
enve
r.

54
Appe
ndix
U: E
cono
mic
Impa
cts
of R
etai
l Con
stru
ctio
n, b
y Co
unty
, 200
6
Cou
nty
Dire
ct S
pend
ing,
00
0s
Tota
l O
utpu
t, 00
0s
Ear
ning
s,
000s
w
/Mul
tiplie
r, 00
0s
Em
ploy
men
t w
/Mul
tiplie
r
Cou
nty
Dire
ct S
pend
ing,
00
0s
Tota
l O
utpu
t, 00
0s
Ear
ning
s,
000s
w
/Mul
tiplie
r, 00
0s
Em
ploy
men
t w
/Mul
tiplie
r
Ada
ms
$142
,188
$3
33,1
11
$52,
561
$1
13,6
53
1
,249
3,13
1
La
ke
$0
$0
$0
$0
-
-
Ala
mos
a
1,4
25
2
,411
561
8
71
1
3
24
La P
lata
4,8
06
8
,345
1,6
57
2
,716
39
7
5
Ara
paho
e
65,7
02
153
,923
24,
287
5
2,51
6
577
1,44
7
La
rimer
33,4
92
64
,886
1
1,38
0
20,
589
2
71
575
Arc
hule
ta
297
5
16
1
02
168
2
5
La
s A
nim
as
-
-
-
-
-
-
Bac
a
-
-
-
-
-
-
Linc
oln
-
-
-
-
-
-
Ben
t
-
-
-
-
-
-
Loga
n
1,7
82
2
,978
6
70
1
,047
16
2
9
Bou
lder
36,7
76
86
,156
13,
594
2
9,39
5
323
81
0
M
esa
12
,511
24,0
56
4
,929
8,6
10
117
24
0
Cha
ffee
-
-
-
-
-
-
M
iner
al
-
-
-
-
-
-
Che
yenn
e
5
11
854
192
3
00
5
8
Mof
fat
238
4
19
82
1
37
2
4
Cle
ar C
reek
-
-
-
-
-
-
Mon
tezu
ma
1
,128
1,9
59
389
6
38
9
18
Con
ejos
-
-
-
-
-
-
Mon
trose
14,2
55
27
,409
5,6
16
9
,810
1
34
274
Cos
tilla
-
-
-
-
-
-
M
orga
n
-
-
-
-
-
-
Cro
wle
y
-
-
-
-
-
-
Ote
ro
-
-
-
-
-
-
Cus
ter
-
-
-
-
-
-
Our
ay
-
-
-
-
-
-
Del
ta
-
-
-
-
-
-
Par
k
7,7
21
13
,406
2,6
61
4
,364
63
12
1
Den
ver
27
,441
64,2
88
1
0,14
4
21,
934
2
41
604
Phi
llips
-
-
-
-
-
-
Dol
ores
-
-
-
-
-
-
Pitk
in
7
,530
13,0
74
2
,596
4,2
55
6
2
118
Dou
glas
23,7
40
55
,616
8
,776
1
8,97
6
209
52
3
P
row
ers
-
-
-
-
-
-
Eag
le
9
,242
16,0
47
3,1
86
5
,223
76
14
5
P
uebl
o
2,2
74
4
,632
8
49
1
,594
20
4
5
Elb
ert
-
-
-
-
-
-
R
io B
lanc
o
-
-
-
-
-
-
El P
aso
60
,171
1
22,5
97
2
2,45
6
42,
173
5
33
1,
181
Rio
Gra
nde
-
-
-
-
-
-
Frem
ont
-
-
-
-
-
-
R
outt
3
,104
5,3
89
1
,070
1,7
54
2
5
49
Gar
field
4
75
839
164
2
75
4
8
Sag
uach
e
-
-
-
-
-
-
Gilp
in
-
-
-
-
-
-
S
an J
uan
-
-
-
-
-
-
Gra
nd
-
-
-
-
-
-
S
an M
igue
l
-
-
-
-
-
-
Gun
niso
n
3,3
26
5
,775
1
,146
1,8
80
2
7
52
Sed
gwic
k
-
-
-
-
-
-
Hin
sdal
e
-
-
-
-
-
-
Sum
mit
2
,691
4,6
72
927
1,5
21
2
2
42
Hue
rfano
-
-
-
-
-
-
Telle
r
8,1
37
16
,579
3,0
37
5
,703
72
16
0
Jack
son
-
-
-
-
-
-
W
ashi
ngto
n
-
-
-
-
-
-
Jeffe
rson
55,3
30
129
,625
20,
453
4
4,22
6
486
1,21
9
W
eld
10
,115
19,5
96
3
,437
6,2
18
8
2
174
Kio
wa
-
-
-
-
-
-
Yum
a
-
-
-
-
-
-
Kit
Car
son
-
-
-
-
-
-
To
tal
$536
,406
$1
,179
,158
$1
96,9
23
$400
,545
4,6
81
11,
080
Sou
rces
: M
cGra
w-H
ill C
onst
ruct
ion
Res
earc
h &
Ana
lytic
s, 2
007;
Uni
vers
ity o
f Col
orad
o-B
ould
er; U
nive
rsity
of D
enve
r.

55
Appe
ndix
V: E
cono
mic
Impa
cts
of H
otel
Con
stru
ctio
n, b
y Co
unty
, 200
6
Cou
nty
Dire
ct S
pend
ing,
00
0s
Tota
l O
utpu
t, 00
0s
Ear
ning
s,
000s
w
/Mul
tiplie
r, 00
0s
Em
ploy
men
t w
/Mul
tiplie
r
Cou
nty
Dire
ct S
pend
ing,
00
0s
Tota
l O
utpu
t, 00
0s
Ear
ning
s,
000s
w
/Mul
tiplie
r, 00
0s
Em
ploy
men
t w
/Mul
tiplie
r
Ada
ms
$0
$0
$0
$0
-
-
Lake
$0
$0
$0
$0
-
-
Ala
mos
a
-
-
-
-
-
-
La P
lata
-
-
-
-
-
-
Ara
paho
e
10,0
97
23
,655
3
,732
8,0
71
8
9
222
Larim
er
16
,651
32,2
58
5
,658
1
0,23
6
135
28
6
Arc
hule
ta
-
-
-
-
-
-
La
s A
nim
as
-
-
-
-
-
-
Bac
a
-
-
-
-
-
-
Linc
oln
4
,752
7,9
42
1
,786
2,7
91
4
3
77
Ben
t
-
-
-
-
-
-
Lo
gan
-
-
-
-
-
-
Bou
lder
2,0
79
4
,870
768
1,6
62
1
8
46
Mes
a
4,2
22
8
,118
1,6
63
2
,905
40
8
1
Cha
ffee
-
-
-
-
-
-
M
iner
al
-
-
-
-
-
-
Che
yenn
e
-
-
-
-
-
-
Mof
fat
-
-
-
-
-
-
Cle
ar C
reek
-
-
-
-
-
-
Mon
tezu
ma
-
-
-
-
-
-
Con
ejos
-
-
-
-
-
-
Mon
trose
-
-
-
-
-
-
Cos
tilla
-
-
-
-
-
-
Mor
gan
-
-
-
-
-
-
Cro
wle
y
-
-
-
-
-
-
Ote
ro
-
-
-
-
-
-
Cus
ter
-
-
-
-
-
-
O
uray
-
-
-
-
-
-
Del
ta
-
-
-
-
-
-
P
ark
-
-
-
-
-
-
Den
ver
15
,442
36,1
78
5,7
08
12,
343
1
36
340
Phi
llips
-
-
-
-
-
-
Dol
ores
-
-
-
-
-
-
Pitk
in
35
,339
61,3
60
12,
181
1
9,97
2
289
55
4
Dou
glas
-
-
-
-
-
-
Pro
wer
s
-
-
-
-
-
-
Eag
le
-
-
-
-
-
-
P
uebl
o
-
-
-
-
-
-
Elb
ert
-
-
-
-
-
-
R
io B
lanc
o
-
-
-
-
-
-
El P
aso
25
,175
51,2
93
9,3
95
17,
645
2
23
494
Rio
Gra
nde
-
-
-
-
-
-
Frem
ont
2
,970
6,0
51
1,1
08
2
,081
26
5
8
R
outt
-
-
-
-
-
-
Gar
field
-
-
-
-
-
-
Sag
uach
e
-
-
-
-
-
-
Gilp
in
172
,243
2
99,0
68
5
9,37
1
97,
341
1,4
09
2,
700
San
Jua
n
-
-
-
-
-
-
Gra
nd
-
-
-
-
-
-
S
an M
igue
l
20,9
86
36
,439
7,2
34
11,
860
1
72
329
Gun
niso
n
-
-
-
-
-
-
Sed
gwic
k
-
-
-
-
-
-
Hin
sdal
e
-
-
-
-
-
-
Sum
mit
-
-
-
-
-
-
Hue
rfano
-
-
-
-
-
-
Telle
r
-
-
-
-
-
-
Jack
son
-
-
-
-
-
-
W
ashi
ngto
n
-
-
-
-
-
-
Jeffe
rson
-
-
-
-
-
-
Wel
d
3,5
64
6
,904
1,2
11
2
,191
29
6
1
Kio
wa
-
-
-
-
-
-
Y
uma
-
-
-
-
-
-
Kit
Car
son
-
-
-
-
-
-
To
tal
$313
,518
$5
74,1
34
$109
,816
$1
89,0
96
2
,608
5,24
9
Sou
rces
: M
cGra
w-H
ill C
onst
ruct
ion
Res
earc
h &
Ana
lytic
s, 2
007;
Uni
vers
ity o
f Col
orad
o-B
ould
er; U
nive
rsity
of D
enve
r.

56
Appe
ndix
W: E
cono
mic
Impa
cts
of M
ultif
amily
Con
stru
ctio
n, b
y Co
unty
, 200
6
Cou
nty
Dire
ct S
pend
ing,
00
0s
Tota
l Out
put,
000s
E
arni
ngs,
00
0s
w/M
ultip
lier,
000s
E
mpl
oym
ent
w/M
ultip
lier
C
ount
y D
irect
Spe
ndin
g,
000s
To
tal O
utpu
t, 00
0s
Ear
ning
s,
000s
w
/Mul
tiplie
r, 00
0s
Em
ploy
men
t w
/Mul
tiplie
r
Ada
ms
$94,
385
$221
,121
$3
4,89
0
$75,
444
8
29
2,
079
Lake
$0
$0
$0
$0
-
-
Ala
mos
a
-
-
-
-
-
-
La P
lata
11,0
71
19
,223
3,8
16
6
,257
91
17
4
Ara
paho
e
2
49,0
06
583
,359
92,
047
19
9,03
4
2
,188
5,48
4
La
rimer
1
07,1
48
207
,582
3
6,40
8
65,
867
8
69
1,
839
Arc
hule
ta
-
-
-
-
-
-
La
s A
nim
as
-
-
-
-
-
-
Bac
a
-
-
-
-
-
-
Linc
oln
-
-
-
-
-
-
Ben
t
-
-
-
-
-
-
Loga
n
-
-
-
-
-
-
Bou
lder
1
20,3
11
281
,858
44,
474
96,
166
1,0
57
2,
650
Mes
a
4,8
66
9
,356
1,9
17
3
,348
46
9
4
Cha
ffee
-
-
-
-
-
-
M
iner
al
-
-
-
-
-
-
Che
yenn
e
-
-
-
-
-
-
Mof
fat
-
-
-
-
-
-
Cle
ar C
reek
-
-
-
-
-
-
Mon
tezu
ma
-
-
-
-
-
-
Con
ejos
-
-
-
-
-
-
Mon
trose
3,5
64
6
,852
1,4
04
2
,452
33
6
8
Cos
tilla
-
-
-
-
-
-
Mor
gan
-
-
-
-
-
-
Cro
wle
y
-
-
-
-
-
-
Ote
ro
-
-
-
-
-
-
Cus
ter
-
-
-
-
-
-
O
uray
-
-
-
-
-
-
Del
ta
-
-
-
-
-
-
P
ark
-
-
-
-
-
-
Den
ver
80
,181
1
79,6
28
3
6,70
7
68,
194
7
00
1,
735
Phi
llips
-
-
-
-
-
-
Dol
ores
-
-
-
-
-
-
Pitk
in
107
,715
1
87,0
27
37,
128
6
0,87
3
881
1,68
9
Dou
glas
80,4
19
188
,403
29,
728
64,
281
7
06
1,
771
Pro
wer
s
-
-
-
-
-
-
Eag
le
82
,837
1
43,8
31
2
8,55
3
46,
814
6
78
1,
299
Pue
blo
-
-
-
-
-
-
Elb
ert
-
-
-
-
-
-
R
io B
lanc
o
-
-
-
-
-
-
El P
aso
86
,329
1
75,8
93
3
2,21
8
60,
507
7
65
1,
695
Rio
Gra
nde
-
-
-
-
-
-
Frem
ont
-
-
-
-
-
-
R
outt
44
,377
77,0
52
15,
296
2
5,07
9
363
69
6
Gar
field
32,7
85
57
,857
11,
331
1
8,96
2
269
52
2
S
agua
che
-
-
-
-
-
-
Gilp
in
-
-
-
-
-
-
S
an J
uan
-
-
-
-
-
-
Gra
nd
55
,335
96,0
79
1
9,07
4
31,
272
4
53
867
San
Mig
uel
6
,533
11,3
44
2
,252
3,6
92
5
3
102
Gun
niso
n
28,8
65
50
,120
9
,950
1
6,31
3
236
45
3
S
edgw
ick
-
-
-
-
-
-
Hin
sdal
e
-
-
-
-
-
-
Sum
mit
11
,879
20,6
25
4
,095
6,7
13
9
7
186
Hue
rfano
-
-
-
-
-
-
Telle
r
2,3
76
4
,841
8
87
1
,665
21
4
7
Jack
son
-
-
-
-
-
-
W
ashi
ngto
n
-
-
-
-
-
-
Jeffe
rson
1
59,2
91
373
,179
58,
884
12
7,32
4
1
,399
3,50
8
W
eld
62
,632
1
21,3
40
21,
282
3
8,50
2
508
1,07
5
Kio
wa
-
-
-
-
-
-
Y
uma
-
-
-
-
-
-
Kit
Car
son
-
-
-
-
-
-
To
tal
$1,4
31,9
05
$3,0
16,5
71
$522
,341
$1
,018
,760
12,2
42
28,
031
Sou
rces
: M
cGra
w-H
ill C
onst
ruct
ion
Res
earc
h &
Ana
lytic
s, 2
007;
Uni
vers
ity o
f Col
orad
o-B
ould
er; U
nive
rsity
of D
enve
r

57

58

59

60


NAIOP Colorado Chapter1720 S. Bellaire Street, Suite 110
Denver, CO 80222-4303Ph: (303) 782-0155Fax: (303) 820-3844
Web: www.naiop-colorado.org