static-content.springer.com10.1007/s105… · web view5 oued bon naima. algeria, morocco. ......
TRANSCRIPT

Online resources
Adaptation readiness and adaptive capacity of transboundary river basins
Submission to: Climatic Change
Simon Tilleard1, Department of Geography, McGill University, Montreal, Canada
James Ford, Department of Geography, McGill University, Montreal, Canada
1 Corresponding author: [email protected]

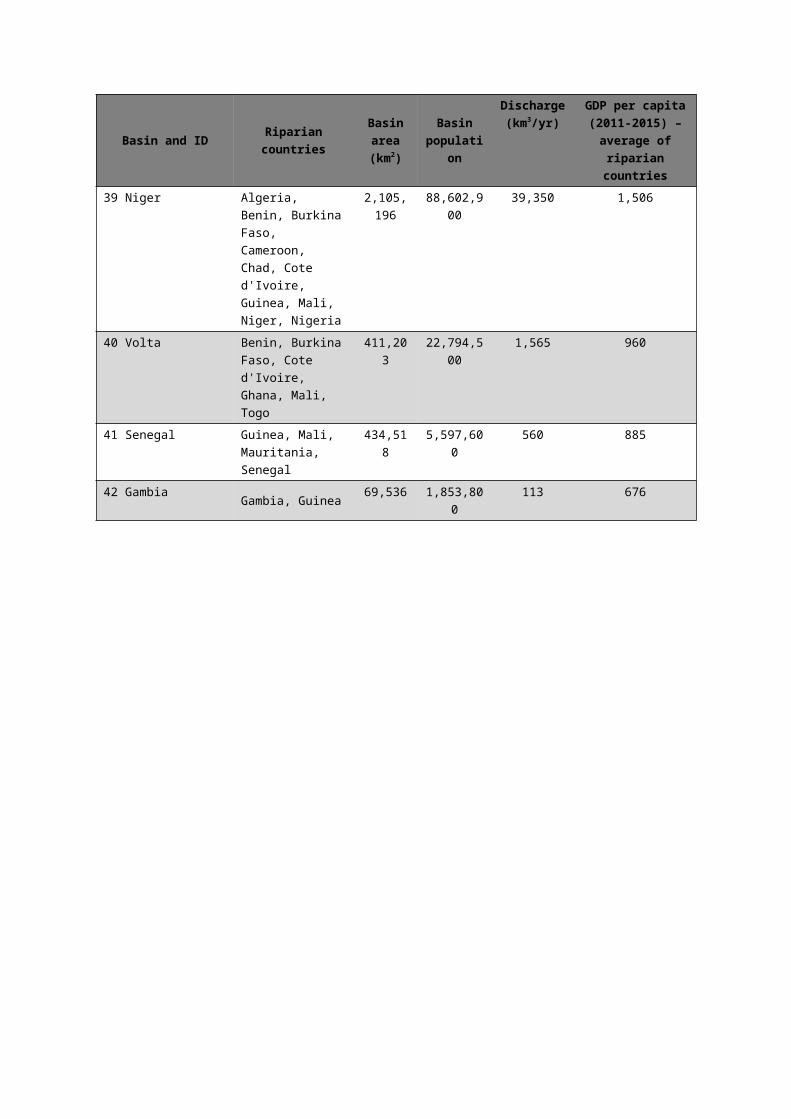
Online Resource 1: List of basin characteristics
Information has been sourced from Oregon State University Transboundary Freshwater Dispute Database (OSU 2011), Milman et al. (2013) and the World Bank (World Bank 2015).
Basin and ID Riparian countriesBasin area (km2)
Basin population
Discharge (km3/yr)
GDP per capita (2011-2015) –
average of riparian countries
1 Dra Algeria, Morocco 96,249 1,077,100 10 4,238
2 Daoura Algeria, Morocco 34,451 475,800 <1 4,238
3 Guir Algeria, Morocco 78,843 306,700 <1 4,238
4 Tafna Algeria, Morocco 9,430 1,329,200 1 4,238
5 Oued Bon Naima Algeria, Morocco 513 79,300 <1 4,238
6 Guadiana Portugal, Spain 67,974 1,631,700 110 26,058
7 Tagus/ Tejo Portugal, Spain 77,619 9,666,000 300 26,058
8 Douro/ Duero Portugal, Spain 98,997 4,366,000 760 26,058
9 Lima Portugal, Spain 2,289 109,700 1 26,058
10 Mino Portugal, Spain 15,105 992,800 61 26,058
11 Ebro Andorra, France, Spain
85,907 2,908,200 1,000 38,049
12 Bidasoa France, Spain 526 35,100 <1 36,390
13 Garonne Andorra, France Spain
55,864 3,659,470 400 38,049
14 Rhone France, Switzerland 100,272 10,364,000 2,050 63,924
15 Po France, Italy, Switzerland
87,213 18,055,480 2,005 54,587
16 Medjerda Algeria, Tunisia 23,149 1,632,000 23 4,872
17 Roia France, Italy 626 20,500 <1 39,209
18 Danube Albania, Austria, Bosnia and Herzegovina, Bulgaria, Croatia, Czech Republic, Germany, Hungary, Italy, Montenegro, Poland, Rep. of Moldova, Romania, Serbia, Slovakia, Slovenia, Switzerland, Ukraine
791,854 81,159,800 8,376 20,283
19 Isonzo Italy, Slovenia 3,023 367,700 4 29,796
20 Krka Bosnia and Herzegovina, Croatia
1,228 62,700 1 9,194
21 Neretva Bosnia and Herzegovina, Croatia
5,504 342,400 10 9,194
22 Lake Prespa Albania, Greece, The former Yugoslav Rep. of Macedonia
9,059 910,900 10 10,860
23 Vijose Albania, Greece 7,144 472,900 5 13,735
24 Maritsa Bulgaria, Greece, 49,606 3,103,700 111 13,737

Basin and ID Riparian countriesBasin area (km2)
Basin population
Discharge (km3/yr)
GDP per capita (2011-2015) –
average of riparian countries
Turkey
25 Velaka Bulgaria, Turkey 688 3,150 <1 9,092
26 Rezvaya Bulgaria, Turkey 670 3400 <1 9,092
27 Tigris-Euphrates/ Shatt al Arab
Iran (Islamic Rep. of), Iraq, Jordan, Saudi Arabia, Syrian Arab Rep., Turkey
788,795 53,909,200 11,200 10,614
28 Asi / Orontes Lebanon, Syrian Arab Rep., Turkey
37,910 5,607,100 60 10,191
29 Nahr El Kebir Syrian Arab Rep., Turkey
1,525 334,300 1 10,684
30 An Nahr Al Kabir Lebanon, Syrian Arab Rep.
1,270 279,500 <1 9,698
31 Wadi Al Izziyah Israel, Lebanon 569 118,300 <1 22,208
32 Jordan Egypt, Israel, Jordan, Lebanon, Syrian Arab Rep.
33,991 7,786,940 13 13,127
33 Baraka Eritrea, Sudan 66,177 2,029,600 <1 1,185
34 Gash Eritrea, Ethiopia, Sudan
39,892 3,687,500 3 948
35 Awash Djibouti, Ethiopia, Somalia
154,352 16,406,800 1,000 1,055
36 Juba-Shibeli Ethiopia, Kenya, Somalia
799,773 18,361,100 1,220 838
37 Nile Burundi , Central African Republic, Democratic Rep of Congo, Egypt, Eritrea, Ethiopia, Kenya, Rwanda, Sudan, Uganda, United Rep. of Tanzania
3,020,100 184,079,360
89,152 1,200
38 Lake Chad Algeria, Cameroon, Central African Republic, Chad, Libyan Arab Jamahiriya, Niger, Nigeria, Sudan
2,380,489 8,986,002 15,150 2,758
39 Niger Algeria, Benin, Burkina Faso, Cameroon, Chad, Cote d'Ivoire, Guinea, Mali, Niger, Nigeria
2,105,196 88,602,900 39,350 1,506
40 Volta Benin, Burkina Faso, Cote d'Ivoire, Ghana, Mali, Togo
411,203 22,794,500 1,565 960
41 Senegal Guinea, Mali, Mauritania, Senegal
434,518 5,597,600 560 885

Basin and ID Riparian countriesBasin area (km2)
Basin population
Discharge (km3/yr)
GDP per capita (2011-2015) –
average of riparian countries
42 Gambia Gambia, Guinea 69,536 1,853,800 113 676
Online Resource 2: Literature supporting dimensions and indicators for institutional adaptation readiness of transboundary river basins
Political leadership: The drive from basin governments to initiate the adaptation process and state that climate change and adaptation are a priority
Political leadership is needed to initiate the process of adaptation, provide strategic direction and sustain momentum over time (Smith et al. 2009). For transboundary basins credible, proactive, cooperative and visionary leadership is required to drive adaptation measures in the face of uncertainty and coordination challenges (Huntjens et al. 2010; Wilby and Vaughan 2011; UNECE and INBO 2015).
Adaptation processes are influenced by interactions and dynamics among multiple scales (Adger et al. 2005) and transboundary water management requires coordination and leadership at various scales of political, legal and institutional settings (Timmerman et al. 2011). Therefore, adaptation at the basin level is influenced by the riparian national institutions as well as basin level institutions (Kranz et al. 2010; Timmerman et al. 2011). Leadership on adaptation is needed at both levels (Krysanova et al. 2010).
Leadership on adaptation in transboundary basins can lead to the formulation and articulation of national and basin adaptation plans and strategies (Huntjens et al. 2010). Political leadership for climate change adaptation at the national level can lead to a national climate change strategy which outlines major threats posed by climate change and potential adaptation options (Kranz et al. 2010). Similarly, leadership from basin institutions can lead to development of basin scale adaptation plans (UNECE and INBO 2015). Ideally political leadership would ensure that the basin and national level adaptation plans are linked to “ensure implementation and to reduce gaps with policy” (UNECE and INBO 2015).
Institutional organisation: Existence of coordination bodies to oversees adaptation effortsInstitutions provide the political and administrative structure to enable adaptation (Massey and Huitema 2012; Pasquini et al. 2015). For transboundary adaptation, coordination is needed over a range of institutional levels, from the local to international (Timmerman et al. 2011; U.N. 2014). Institutions such as transboundary treaties, River Basin Organisations or national legislation can enable adaptation through increasing transparency, encouraging cooperation and clarifying expectations between riparians (McCaffrey 2003; Stefano et al. 2012). Transboundary basin adaptation should ultimately be embedded within a regulatory framework for water management and adaptation (UNECE and INBO 2015). National institutions for adaptation that support transboundary adaptation are developed and supported by legislation (U.N. 2014). Such legislation creates an enabling environment for adaptation at the national and basin level by climate-proofing institutional frameworks and providing clear institutional mandates for adaptation (U.N. 2014; UNECE and INBO 2015).Adaptation interventions and planning have been shown to be most effective when a coordinating body is mandated to oversee adaptation (Ford and King 2015). At the basin level a River Basin Organisation can play a key institutional role in overseeing adaptation (Kranz et al. 2010; Cooley and Gleick 2011; Stefano et al. 2012), and should be given a clear mandate to address the issue (Kistin and Ashton 2008; Kranz et al. 2010; UNECE and INBO 2015). River Basin Organisations can avoid conflict (Drieschova et al. 2008; Stefano et al. 2012; UNECE and INBO 2015), enhance cooperation (Timmerman et al. 2011; Cooley and Gleick 2011; Stefano et al. 2012), reduce the transaction costs of cooperation (Drieschova et al. 2008), develop adaptation frameworks and programmes (UNECE and INBO 2015), facilitate exchange of climate information and data (Heikkila et al. 2013; UNECE and INBO 2015), identify adaptation options, (Fischhendler 2004; Heikkila et al. 2013) and facilitate funding for adaptation measures (Eckstein 2009; Heikkila et al. 2013).
Adaptation decision making: Iterative and flexible decision makingAdaptation decision making is undertaken within a setting of inherent uncertainty (Moss et al. 2013). For water management, significant existing uncertainties in the hydrological system (Zeitoun et al. 2013) will only worsen as climate change alters the timing and variability of flows (Jiménez Cisneros et al. 2014; Kilroy 2015). Treaties that allow for flexible decision making enable the riparians to anticipate changes and include mechanisms to allow riparians to adjust basin management to suit changing circumstances (McCaffrey 2003; Fischhendler 2004; Drieschova et al. 2008; Kistin and Ashton 2008; Cooley and Gleick 2011; Zeitoun et al.

2013). Flexibility in transboundary treaties therefore enables adaptation (Kistin and Ashton 2008; Cooley and Gleick 2011; Stefano et al. 2012; U.N. 2014; UNECE and INBO 2015). There are a variety of mechanisms that can be incorporated into transboundary treaties to allow for the flexibility to adapt to climate change: i) clear decision making mechanisms that allow for adjustable allocation strategies; ii) response strategies for extreme events such as floods and droughts; iii) amendment and review procedures; iv) dispute/conflict resolution mechanisms; and v) joint management institutions such as River Basin Organisations (Drieschova et al. 2008; Cooley and Gleick 2011; Stefano et al. 2012; UNECE and INBO 2015). Adjustable allocation strategies enables the riparians to alter allocations as supply and quality changes. Amendment and review mechanisms allow the riparians to establish new guidelines for unforeseen circumstances and realign national and basin strategies with changing conditions (Kistin and Ashton 2008). Dispute or conflict resolution clauses establish an agreed forum for the riparians to discuss changes that were not predicted by the initial treaty (Drieschova et al. 2009). River Basin Organisations provide the organisational framework to negotiate and coordinate the navigation of unexpected issues and develop, implement and monitor adaptation strategies (UNECE and INBO 2015)
Stakeholder engagement: Stakeholder and community engagement in specification of adaptation plans, goals and timelines
Stakeholder engagement is critical in the development and implementation of transboundary water management adaptation measures (Raadgever et al. 2008; Krysanova et al. 2010; Kranz et al. 2010; U.N. 2014; UNECE and INBO 2015). Stakeholders include “the executive authorities and policy-making elites of the riparian states at national and local government level, and non-state actors, such as international donor institutions, multi-national firms, civil society and the environment” (Goulden et al. 2009). Engagement of stakeholders leads to an increased likelihood of acceptance of adaptation measures (Goulden et al. 2009; Timmerman et al. 2011; UNECE and INBO 2015). Effective stakeholder engagement is only possible through national commitment to: free exchange of information; open institutions; and transparent production and dissemination of information (Timmerman and Langaas 2005).
Transboundary water management in the context of climate change also depends on the international political context, including the relations and engagement of all riparians (Zeitoun et al. 2013). Due to asymmetric power relationships between riparians, cooperation does not always facilitate adaptation for all (Goulden et al. 2009). Some basins have a “hydro-hegemon”, a riparian that is more economically and/or militarily powerful than the others (Goulden et al. 2009). In basins with a “hydro-hegemon”, the more powerful riparian can determine the nature of the co-riparian interactions to benefit their own national interests (Zeitoun and Warner 2006; Goulden et al. 2009; Zeitoun et al. 2013). Therefore although the hydro-hegemon may choose to pressure the other riparians to prepare for adaptation, there is still an inherent power imbalance in this relationship. This power imbalance means the engagement is not equitable and fair and is thus unlikely to lead to good adaptation outcomes for the whole basin (i.e. positive outcomes will be centred on the hydro-hegemon) (Goulden et al. 2009). Power distribution between basin riparians can be measured as the natural logarithm of the stronger to weaker riparian’s capabilities, based on the Correlates of War Material Capabilities composite index (Singer et al. 1972; Tir and Stinnett 2012).
Usable science: Availability of usable science on threats, impacts, vulnerability and adaptation‘Usable science’ on possible impacts, adaptation and vulnerability to climate change is needed to inform adaptation, examine the costs of action, prioritize needs, and build support for taking action (Füssel and Klein 2006; Patt et al. 2009; Lemos et al. 2012). For transboundary basins, vulnerability assessments are needed to identify areas and people at greatest risk, and to inform the prioritization and design of adaptation by describing what to adapt to and how to adapt (UNECE and INBO 2015).Comprehensive collection and sharing of hydrological and other datasets is important for transboundary basin adaptation (U.N. 2014; UNECE and INBO 2015). Data collection and exchange across the whole basin can offset the impacts of climate change by enabling early identification of issues, improving hydrological and socio-economic models, building the knowledge base for all riparians, informing adaptation policies; and monitoring policy progress (Drieschova et al. 2008; Drieschova et al. 2009; Timmerman et al. 2011; Cooley and Gleick 2011; U.N. 2014; UNECE and INBO 2015). In addition, the cooperation required between countries to collect and exchange information can build trust and enhance further cooperation (Drieschova et al. 2009; Timmerman et al. 2011) River Basin Organisations are often assigned a monitoring and

information exchange role (Stefano et al. 2012).
Funding: Specific funding for adaptation activities and the ability to access itFunding for adaptation is required to cover the capital, maintenance and human resources costs to identify, implement, monitor, and maintain adaptation efforts, as well as support adaptation research (Moss et al. 2013; Ford and King 2015). Most adaptation measures cannot be implemented based on existing funding streams so “comprehensive, coordinated, and sustained multi-year funding has been identified in multiple contexts as limiting the ability to advance climate adaptation planning” (Ford and King, 2015). For many transboundary basins, the cost of adaptation will likely add to the already substantial financing gap, especially as adaptation costs for issues such as flood and drought protection will be substantial (UNECE and INBO 2015). For example, a recent study of six transboundary basins in Europe, Africa and Asia found that one of the key barriers to adaptation was the lack of financial resources (Krysanova et al. 2010)Experience in financing adaptation for transboundary basins is limited (UNECE and INBO 2015). Two clear funding mechanisms are described in the literature: international adapting financing; and mainstreaming adaptation in existing funding mechanisms (UNECE and INBO 2015). International adaptation financing mechanisms include multilateral and bilateral donor funding either specifically for adaptation, or for mitigation and adaptation measures. The ability to access these funds depends on the economic situation of the riparian countries (MRC 2014). The main multilateral adaptation funding mechanisms are the Climate Investment Fund’s Pilot Program for Climate Resilience, Global Environment Facility’s Least Development Countries Fund, Kyoto Protocol Adaptation Fund, International Fund for Agricultural Development’s Adaptation for Smallholder Agriculture Program and Global Environment Facility’s Special Funds for Adaptation (ODI and GPF 2014). Adaptation could also be funded through mainstreaming into existing funding streams (Timmerman et al. 2011; U.N. 2014) such as that for an existing RBO or treaty. This approach is seen as a more long term solution, as without a long term financing system, transboundary management is not viable (Raadgever et al. 2008). Other possible adaptation funding mechanisms include: i) dedicated national funding for climate change adaptation; and ii) private sector participation in adaptation, (UNECE and INBO 2015).
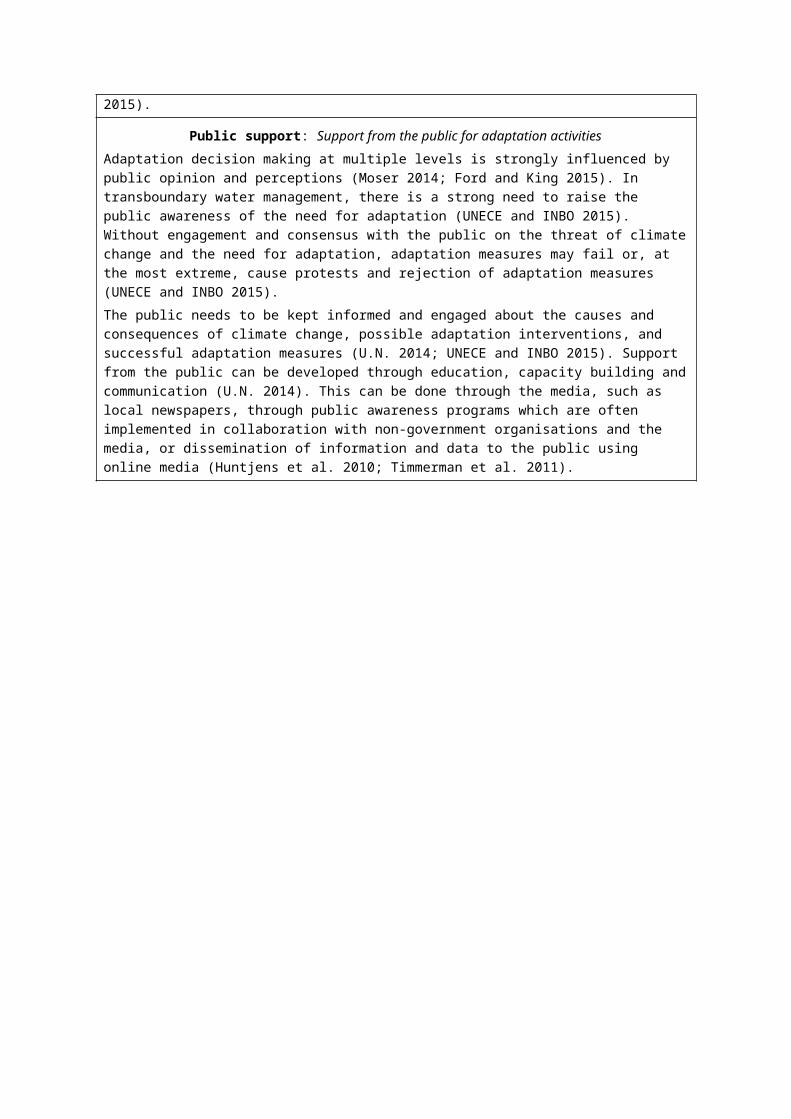
Public support: Support from the public for adaptation activitiesAdaptation decision making at multiple levels is strongly influenced by public opinion and perceptions (Moser 2014; Ford and King 2015). In transboundary water management, there is a strong need to raise the public awareness of the need for adaptation (UNECE and INBO 2015). Without engagement and consensus with the public on the threat of climate change and the need for adaptation, adaptation measures may fail or, at the most extreme, cause protests and rejection of adaptation measures (UNECE and INBO 2015). The public needs to be kept informed and engaged about the causes and consequences of climate change, possible adaptation interventions, and successful adaptation measures (U.N. 2014; UNECE and INBO 2015). Support from the public can be developed through education, capacity building and communication (U.N. 2014). This can be done through the media, such as local newspapers, through public awareness programs which are often implemented in collaboration with non-government organisations and the media, or dissemination of information and data to the public using online media (Huntjens et al. 2010; Timmerman et al. 2011).

Online Resource 3: Indicators for assessing institutional adaptation readiness of transboundary river basin
Indicators were selected to capture the theoretical determinants of adaptation readiness, represented by the seven adaptation readiness dimensions, in a standardized and comparable format. Selection sought to identify indicators that are easy to interpret, responsive to change, transparent and consistent, publically accessible, available for most countries, and from a reputable source.
Potential indicators were located through review of literature, consultation with experts and web searches using relevant terms. A total of 24 indicators were identified that met the required criteria and the relevant data collected for each basin. Ten were then excluded because they were found to be correlated, lacked data availability or showed little variation between the basins. Details on the final list of indicators is provided in the table below.
Dimension Indicator Indicator calculation Data source Aggregation method* Notes
Political leadership: The drive from basin governments to initiate the adaptation process and state that climate change and adaptation are a priority
National plan/strategy
Percentage of riparians in the basin that have a national plan or strategy addressing adaptation
National Adaptation Plan of Action database, National Adaptation Plan or similar document - http://unfccc.int/adaptation/items/4159.php
a
Basin plan
Progress in the development of a transboundary basin adaptation plan: Transboundary basin adaptation plan developed (100), being developed (50) or not developed (0)
MRC (2014) International experiences on the formulation and implementation oftransboundary climate change adaptation strategies. Vientiane: Timmerman, J, Thim, L and Phan N.
a
Institutional organisation: Existence coordination bodies to oversees adaptation efforts
Statutory requirement
Percentage of riparians that have a statutory requirement for adaptation
Columbia University Climate change laws of the world database -http://web.law.columbia.edu/climate-change/resources/climate-change-laws-world-----------------------------------------------London School of Economics GLOBE climate legislation study country profiles - http://www.lse.ac.uk/GranthamInstitute/legislation/countries/
a
If data was missing from any riparian, the calculation was undertaken excluding that riparian. This applies to the Danube (various), Isonzo (Slovenia), Krka and Neretva (Bosnia and Herzegovina, and Croatia), Lake Prespa (Albania and Macedonia), Vijose (Albania), Tigris-Euphrates/Shatt al Arab (Iraq and Syria), Asi/Orontes (Lebanon and Syria), Nahr El Kebir (Syria), An Nahr Al Kabir (Lebanon and Syria), Wadi Al Izziyah (Lebanon) and Jordan (Lebanon and Syria) Basins.
No calculation was undertaken for Krka, Neretva and An Nahr Al Kabir Basins because no data was available for any riparian.
Climate change Percentage of riparians that Oregon State University International a
8

Dimension Indicator Indicator calculation Data source Aggregation method* Notes
River Basin Organisation (RBO)
are a member of an RBO with designated climate change function
River Basin Organisation database - http://www.transboundarywaters.orst.edu/research/RBO/index.html
Adaptation decision making: Iterative and flexible decision making
Treaty flexible decision making
Percentage of riparians signatory to a formal basin agreement that stipulates mechanisms for variability management
Oregon State University International Freshwater Treaties Database - http://www.transboundarywaters.orst.edu/database/interfreshtreatdata.html
a
River Basin Organisation flexible decision making
For each of the following decision making mechanisms if they were stipulated for an RBO that included a sub-set of riparians then 16.5 points were added and if the RBO included all riparians, 33 points were added: i) decision making mechanism; ii) mechanism to adapt RBO underlying documents; and iii) dispute resolution mechanism
Oregon State University International River Basin Organisation database - http://www.transboundarywaters.orst.edu/research/RBO/index.html
a
Stakeholder engagement: Stakeholder and community engagement in specification of adaptation plans, goals and timelines
Voice and Accountability Index
Aggregate of World Bank Voice and Accountability Index for the riparian countries
The World Bank, Worldwide Governance Indicators - http://info.worldbank.org/governance/wgi/index.aspx#home
b
The Voice and Accountability Index is distributed as a random variable with a mean of zero and a unit standard variation, translating into a range of -2.5 to 2.5. We therefore transformed the Index values for each riparian by setting -2.5 as zero and 2.5 as equal to 100 (Milman et al, 2013).
Relative power distribution
Natural logarithm of the stronger to weaker riparian’s Material Capabilities Index
University of California Correlates of War database - http://www.correlatesofwar.org/data-sets/folder_listing
c Two transformations are required. Firstly, the relative power distribution values fall between zero and 10, so the values are transformed to a range of zero to 100 by multiplying by 10. Secondly, the relative power distribution values are inverse to our scale – i.e. high values of relative power distribution indicate basins where power is
9
Dimension Indicator Indicator calculation Data source Aggregation method* Notes
not well distributed (a negative effect on adaptation readiness). Therefore the relative power distribution values are transformed by subtracting each from 100.
If data was missing from any riparian, the calculation was undertaken excluding that riparian. This applies to the Danube (Serbia).
Usable science: Availability of usable science on threats, impacts, vulnerability and adaptation
National Communications
Aggregation of each riparian's National Communication coverage of: i) the specific basin as vulnerable and/or as part of adaptation measures (50 points); and ii) watershed management principles informing adaptation measures (50 points).
UNFCC database of Annex I and Annex II National Reports - http://unfccc.int/national_reports/items/1408.php
b
If data was missing from any riparian, the calculation was undertaken excluding that riparian. This applies to Danube (Ukraine1), Tigris-Euphrates/Shatt al Arab (Iraq and Syria), Asi/Orontes (Syria), An Nahr Al Kabir (Syria), Jordan (Syria), Awash and Juba-Shibeli (Somalia) and Lake Chad (Libya).
Basin monitoring and information sharing
For each of the following characteristics if they were included in an RBO or treaty that included a sub-set of riparians, 12.5 points were added and if they were included in an RBO or treaty that included all riparians, 25 points were added: i) information sharing mechanisms; and ii) monitoring functions.
Oregon State University International River Basin Organisation database - http://www.transboundarywaters.orst.edu/research/RBO/index.html
a
Funding: Specific funding for adaptation activities and the ability
Access to adaptation funds
Aggregate of riparian recipient or donor status for the five largest adaptation funds2 (20 per fund for
Climate Funds Tracking database - http://www.climatefundsupdate.org/data
b
1 Content analysis of the Ukraine National Communication was not possible because the document is entirely in Russian. 2 Five largest adaptation funds were identified as funds with the highest amount of pledged funding according to the Climate Funds Tracking database. The five funds include: Pilot Program for Climate Resilience, Least Developed Countries Fund, Adaptation Fund, Adaptation for Smallholder Agriculture Program and Special Climate Change Fund.
10

Dimension Indicator Indicator calculation Data source Aggregation method* Notes
to access it
designation as recipient or donor)
Funding for basin institutions
For each of the following funding mechanisms, 50 points were added if it included all riparians, 25 points were added if it included a sub-set of riparians: i) RBO with funding mechanism; and ii) formal basin agreement with funding mechanism
Oregon State University International River Basin Organisation database - http://www.transboundarywaters.orst.edu/research/RBO/index.html----------------------------------------------------Oregon State University International Freshwater Treaties Database - http://www.transboundarywaters.orst.edu/database/interfreshtreatdata.html
a
Public support: Support from the public for adaptation activities
Public perception of climate change as a personal threat
Aggregated public perception of climate change as a personal threat
Gallup poll on perception of personal threat from climate change - http://www.gallup.com/poll/124595/Top-Emitting-Countries-Differ-Climate-Change-Threat.aspx#2
b
If data was missing from any riparian, the calculation was undertaken excluding that riparian. This applies to Ebro (Andorra), Garonne (Andorra), Rhone (Switzerland), Po (Switzerland), Danube (various), Isonzo (Slovenia), Krka and Neretva (Bosnia and Herzegovina, and Croatia), Lake Prespa (Albania and Macedonia), Vijose (Albania), Maritsa, Velaka and Rezvaya (Bulgaria), Baraka, Gash and Nile (Eritrea), Awash and Juba-Shibeli (Somalia), Lake Chad (Libya), Niger (Chad), Volta (Cote d’Ivoire) and Gambia (Gambia)
No calculation was undertaken for Krka and Neretva Basins because no data was available for any riparian.
Media coverage of water-related issues
Aggregated percentage of all media articles that cover water-related issues
Word Resources Institute Aqueduct Water Risk Atlas - http://www.wri.org/resources/maps/aqueduct-water-risk-atlas
b
If data was missing from any riparian, the calculation was undertaken excluding that riparian. This applies to Gambia Basin (Gambia).
* The aggregation methods for adaptation readiness indicators outlined below are described by Milman et al. (2013):
11

a) Data intrinsically basin wide - No aggregation required because indicators are already at the basin scaleb) Limited-substitutability aggregation - Indicators are intrinsically at the basin scale and need to be aggregated to the basin. It is assumed that the indicators are not
perfectly substitutable across countries therefore an aggregation method that assumes limited substitutability is used. The aggregation method used by Milman et al. (2013) is described in the equation below:
Basinscore=100−(∑i=1n
Pi∝
n )1/∝
Where Pi is the raw indicator transformed at the country level (100 minus the raw indicator) n is the number of riparians in the basin α is the elasticity of substitution, assumed to be 3
c) Data describes relationship between riparians - No aggregation required because indicators are already at the basin scale
12

Online Resource 4: Methodology notes
O.R. 4.1 Aggregation of adaptation readiness dimensions
To assist in identifying basins with higher and lower adaption readiness, a composite, or aggregated, indicator is calculated. The choice between an additive or geometric aggregation method is a subjective decision that can have a major influence on results (Vincent 2007). Taking an additive approach such as the average of the sub-indicators implies that the dimensions and sub-indicators are substitutable so that a low value in one can be offset by a high value in another (OECD 2008; Barnett et al. 2008; Hinkel 2011). In contrast, using geometric aggregation implies that the dimensions are not substitutable, a low value in one cannot be made up for by a higher value in another (OECD 2008).
In the case of adaptation readiness, although knowledge on how the dimensions interact is limited, it is assumed that not all factors are needed to adapt, implying some substitutability (Ford and King 2015). Recent studies on adaptive capacity argued that substitution can occur across some indicators but not against others, and that the appropriateness of assuming indicator substitutability may differ between river basins (Tol and Yohe 2007; Milman et al. 2013). Indicators of adaptation readiness are likely to act similarly. Therefore some substitutability is assumed, implying an additive approach can be taken (OECD 2008; Barnett et al. 2008; Hinkel 2011) and the aggregate adaptation index for each basin is calculated as the average across the 14 indicators. Due to the subjectively and uncertainty in selecting an aggregation method, the aggregated index is used only for identifying basins with low and high adaptation readiness (Milman et al. 2013), and the sub-indicators are reported for interpretation and transparency (as suggested by Vincent, 2007).
O.R. 4.2 Weighting and sensitivity analysis of adaptation readiness dimensions
The weighting of indicators is a challenging problem in the development of climate change aggregate indicators (Barnett et al. 2008). Weighting should be used where some dimensions and indicators are considered more important than others (Brooks et al. 2005; Gupta et al. 2010). For example, in some cases funding for adaptation may be considered more important than engaging stakeholders in adaptation decision making. Decisions on indicator weightings can have a major effect on an aggregate index and subsequent country rankings (OECD 2008; Perch-Nielsen 2009). In line with other climate related indicator assessments (Cutter et al. 2000; Brenkert and Malone 2005), Ford and King (2015) suggest that for adaptation readiness, the potential for weighting is limited due to the lack of knowledge on the relationship between readiness factors. For the adaptation readiness indicator framework developed in this paper, to ensure robustness of the results, a sensitivity analysis was undertaken and indicates limited sensitivity to different dimension weighting sets (the details of the sensitivity analysis are provided in O.R. 4..4). Therefore no weighting was used, implying that all the indicators are of equal importance in defining adaptation readiness.
O.R. 4.3 Cluster analysis of adaptation readiness dimensions
Cluster analysis aims to group together sets of objects so that each cluster are more similar to each other than those in other clusters. Cluster analysis was undertaken to develop groups of basins for a typology of adaptation readiness. To ensure consistency, the cluster analysis was based on that described by Milman et al. (2013). They use a hierarchical clustering method with multiple distance metrics including within-groups, between-groups, nearest, furthest, median, centroid, and ward methods. The final categorisation is based on basins that consistently group together for multiple distance metrics.
13

O.R. 4.4 Weighting sensitivity analysis for indicators of institutional adaptation readiness of transboundary river basins
To ensure robustness of the adaptation readiness indicator framework results, a sensitivity analysis was undertaken by testing the impacts of different weighting schemes as described by Brooks et al. (Brooks et al. 2005)Three sets of weighting schemes were tested: i) equal weighting which assumes that all dimensions are of equal importance; ii) varying indicator weights to emphasise national or basin level indicators; and iii) varying indicator weights to emphasise different adaptation readiness dimensions. The weightings assigned to each scheme is outlined in the table below.
Political leadership
Institutional organisation
Adaptive decision
Stakeholder engagement Usable science Funding Public support
Weighting scheme Nati
onal
pla
n/st
rate
gy
Basin
pla
n
Stat
utor
y re
quire
men
t
Clim
ate
chan
ge R
iver
Ba
sin O
rgan
isatio
n
Trea
ty fl
exib
le d
ecisi
on
mak
ing
RBO
flex
ible
dec
ision
m
akin
g
Voic
e an
d Ac
coun
tabi
lity
Inde
x
Rela
tive
pow
er
dist
ributi
on
Nati
onal
Com
mun
icati
ons
RBO
mon
itorin
g an
d in
form
ation
shar
ing
Acce
ss to
ada
ptati
on
fund
s
Fund
ing
for b
asin
in
stitu
tions
Publ
ic p
erce
ption
of
clim
ate
chan
ge
Med
ia co
vera
ge o
f wat
er-
rela
ted
issue
s
Tota
l
1. Even weighting1.1 No emphasis 1 1 1 1 1 1 1 1 1 1 1 1 1 1 14
2. Basin versus national 2.1 Emphasise basin 0.5 1.5 0.5 1.5 1.5 1.5 0.5 1.5 0.5 1.5 0.5 1.5 0.5 0.5 14
2.2 Emphasise national 1.5 0.5 1.5 0.5 0.5 0.5 1.5 0.5 1.5 0.5 1.5 0.5 1.5 1.5 14
3. Dimensions3.1 Emphasise political leadership 2.0 2.0 0.83 0.83 0.83 0.83 0.83 0.83 0.83 0.83 0.83 0.83 0.83 0.83 14
3.2 Emphasise institutional organisation 0.83 0.83 2.0 2.0 0.83 0.83 0.83 0.83 0.83 0.83 0.83 0.83 0.83 0.83 14
3.2 Emphasise adaptive decision making 0.83 0.83 0.83 0.83 2.0 2.0 0.83 0.83 0.83 0.83 0.83 0.83 0.83 0.83 14
3.2 Emphasise stakeholder engagement 0.83 0.83 0.83 0.83 0.83 0.83 2.0 2.0 0.83 0.83 0.83 0.83 0.83 0.83 14
3.2 Emphasise usable science 0.83 0.83 0.83 0.83 0.83 0.83 0.83 0.83 2.0 2.0 0.83 0.83 0.83 0.83 14
3.2 Emphasise funding 0.83 0.83 0.83 0.83 0.83 0.83 0.83 0.83 0.83 0.83 2.0 2.0 0.83 0.83 14
3.2 Emphasise Public support 0.83 0.83 0.83 0.83 0.83 0.83 0.83 0.83 0.83 0.83 0.83 0.83 2.0 2.0 14
14

Figure 1 illustrates the change in the aggregate adaptation readiness score and basin rankings when altering the indicator weighting to emphasise either national level or basin level indicators. The sensitivity analysis results show that particularly at the ten highest and ten lowest rated basins, the ranking results are not overly sensitive to the weighting of basin or national indicators.
Figure 1. Sensitivity to indicator weightings emphasising national or basin level indicators. The markers show the aggregate score or ranking with equal weighting and the whiskers show the max and min ranking or aggregate index resulting from varying the weighting to alternatively emphasise national or basin level indicators by a factor of three
15
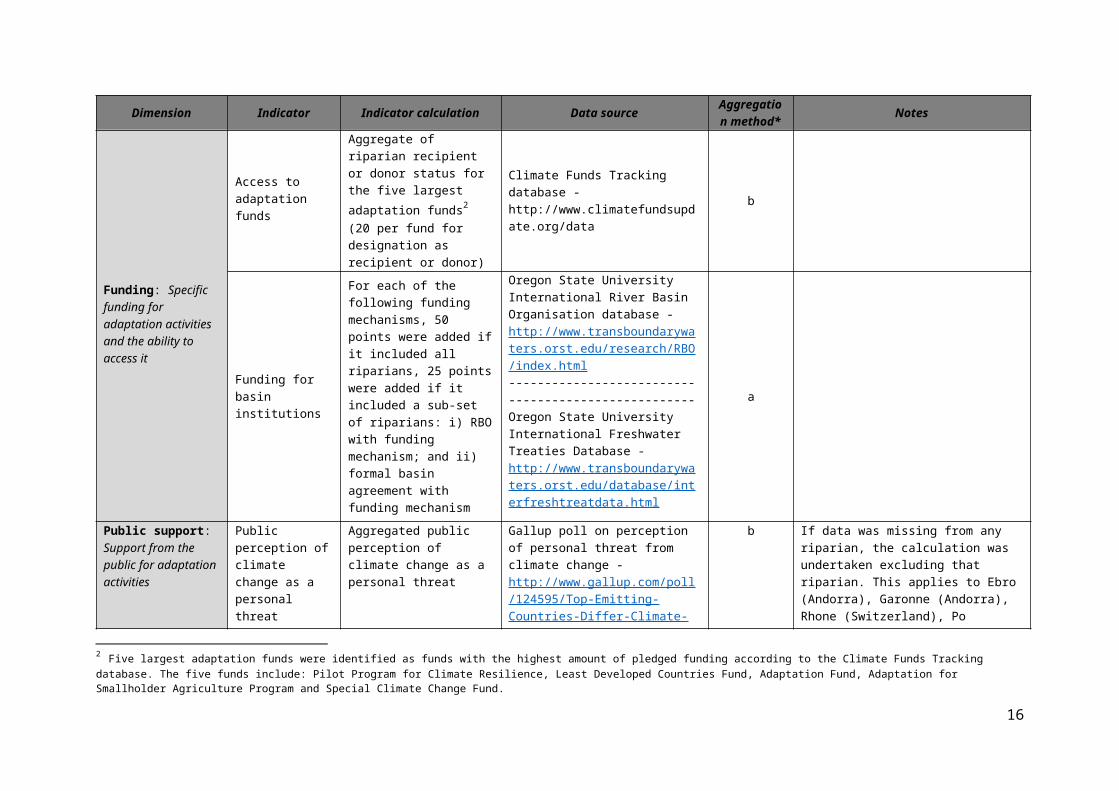
Figure 2 illustrates the change in the aggregate adaptation readiness score and basin ranking when altering weighting to respectively emphasise each of the dimensions. The sensitivity analysis results shows that particularly at the ten highest and ten lowest scoring basins, the results are not overly sensitive to dimension weighting. Whilst there is some variation in the adaptation readiness aggregate depending on the weightings assigned, the distribution of scores is not systematically or radically altered which suggests that the evenly weighted aggregated index is robust in its representation of adaptation readiness (Brooks et al. 2005). Therefore it was decided to proceed with no weighting of the dimensions.
Figure 2. Sensitivity to indicator weightings emphasising adaptation readiness dimensions. The markers show the aggregate score with equal weighting and the whiskers show the max and min ranking or aggregate index results obtained by varying the weighting to emphasise each dimension respectively.
16

Online Resource 5: Discerning between adaptive capacity and adaptation readiness
Adaptive capacity and adaptation readiness are parallel and complimentary concepts. Whilst the conceptual difference is clear, the separation becomes more difficult when focussing on finer detail such as their dimensions and when selecting indicators from the limited datasets available. Whilst some dimensions and indicators of adaptive capacity and adaptation readiness are similar, reflecting the fine distinction between the two concepts and the availability of useful datasets, there are no direct overlaps and they have been carefully chosen to reflect the broader conceptual understanding of the two terms. The table below outlines the four pairs of similar dimensions developed for adaptive capacity and adaptation readiness of transboundary river basins and outlines the crucial differences in the reasoning for selection of their indicators.
Pair AC/AR Dimension Description Selected indicators Indicator selection reasoning
1
Adaptive capacity
Authority Institutional structure with the capability to facilitate planning and undertake transboundary action
Percentage of riparians signatory to any formal basin agreement Percentage of riparians that are members of any River Basin
Organisation
Chosen to indicate if there are institutional structures with the ability to plan and support adaptation
Adaptation readiness
Institutional organisation
Coordination bodies in place to oversee adaptation efforts
Percentage of riparians that have a statutory requirement for adaptation
Percentage of riparians that are a member of an RBO with designated climate change function
Chosen to indicate if institutions are being put in place for adaptation
2
Adaptive capacity
National-level governance
Capacity of riparians to initiate, implement and enforce actions
World Bank Political Stability indicators for each riparian normalised to a scale from 1 to 100 and aggregated
World Bank Government Effectiveness indicators for each riparian normalised to a scale from 1 to 100 and aggregated
Chosen to indicate whether national governments have the ability to initiate, implement and enforce adaption
Adaptation readiness
Political leadership
Drive from governments to initiate adaptation process and state that adaptation is a priority
Percentage of riparians in the basin that have a national plan or strategy addressing adaptation
Progress in development of a basin adaptation plan: Transboundary basin adaptation plan developed (100), being developed (50) or not developed (0)
Chosen to indicate political leadership to drive adaptation at the basin and national level
17

Pair AC/AR Dimension Description Selected indicators Indicator selection reasoning
3
Adaptive capacity
Risk planning and provisions
Awareness of and flexibility to address changes and unexpected hazards
For each of the following formal agreement characteristics, five points added if at least two riparians party to agreement, and ten points if all riparians: i) flow variability provisions; ii) management variability provisions (flood or dry season controls); iii) variability in hydropower or water need provisions; iv) provisions for at least one situation in which a different development can occur and alternative modes of action are stipulated; v) develops or mentions mechanisms for predicting aspects about the future
Percentage of riparians that have completed the Hyogo Framework for Action Progress Reports. Half a riparian is counted if the report is in process but not complete
Chosen to indicate whether national and transboundary institutions have the ability to be aware and flexible to address changes
Adaptation readiness
Adaptation decision making:
Iterative and flexible decision making
Percentage of riparians signatory to a formal basin agreement that stipulates mechanisms for variability management
For each of the following decision making mechanisms if stipulated for an RBO with sub-set of riparians then 16.5 points were added and if RBO with riparians, 33 points were added: i) decision making mechanism; ii) mechanism to adapt RBO underlying documents; and iii) dispute resolution mechanism
Chosen to indicate whether procedures or institutional structures for adaptive management have been put in place
4
Adaptive capacity
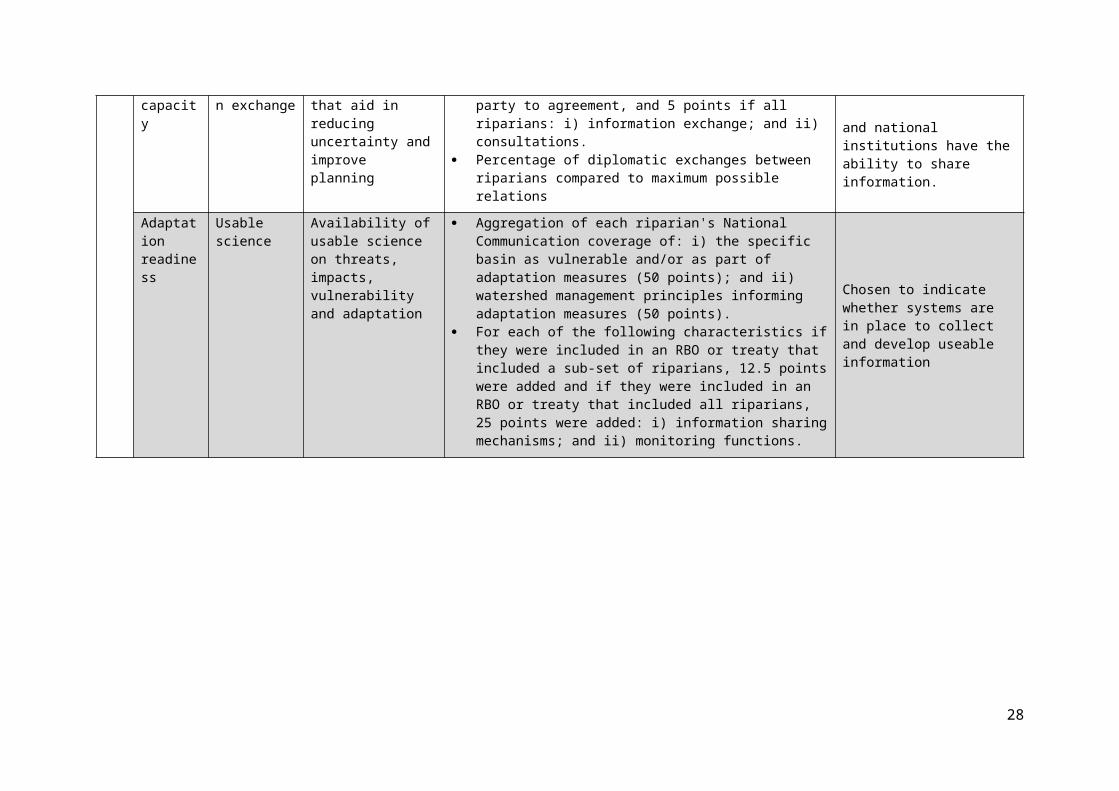
Basin information exchange
Mechanisms for communication that aid in reducing uncertainty and improve planning
For each of the following characteristics, 25 points added if at least two riparians party to agreement, and 5 points if all riparians: i) information exchange; and ii) consultations.
Percentage of diplomatic exchanges between riparians compared to maximum possible relations
Chosen to indicate whether transboundary and national institutions have the ability to share information.
Adaptation readiness
Usable science Availability of usable science on threats, impacts, vulnerability and adaptation
Aggregation of each riparian's National Communication coverage of: i) the specific basin as vulnerable and/or as part of adaptation measures (50 points); and ii) watershed management principles informing adaptation measures (50 points).
For each of the following characteristics if they were included in an RBO or treaty that included a sub-set of riparians, 12.5 points were added and if they were included in an RBO or treaty that included all riparians, 25 points were added: i) information sharing mechanisms; and ii) monitoring functions.
Chosen to indicate whether systems are in place to collect and develop useable information
18

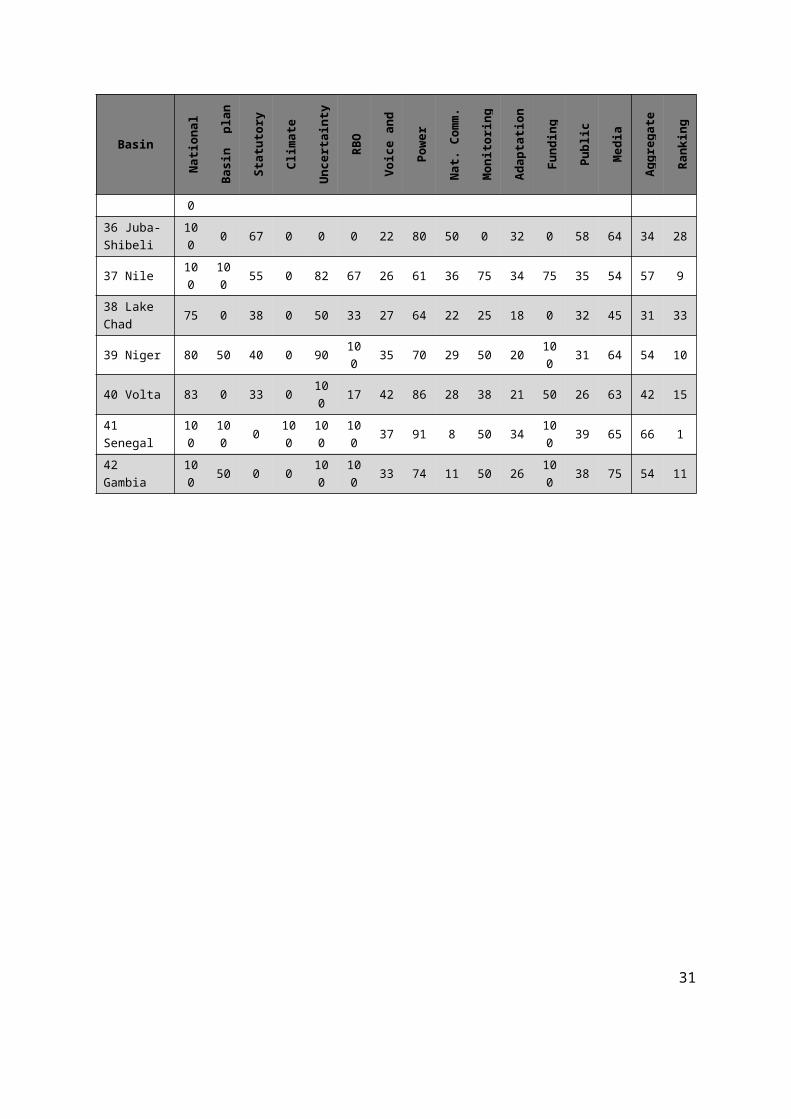
Online Resource 6: Tabulation of basin and county unit results
O.R. 6.1 Adaptation readiness results by basin unit
BasinN
ation
al
plan
/str
ateg
yBa
sin p
lan
Stat
utor
y re
quire
men
tCl
imat
e ch
ange
RB
OU
ncer
tain
ty
man
agem
ent
RBO
dec
ision
m
akin
gVo
ice
and
Acco
unta
bilit
yPo
wer
di
strib
ution
Nat
. Com
m.
Mon
itorin
g &
sh
arin
gAd
apta
tion
fund
sFu
ndin
g b
asin
in
stitu
tions
Publ
ic
perc
eptio
nM
edia
cove
rage
Aggr
egat
e
Rank
ing
1 Dra 100 0 100 0 0 0 34 98 60 0 15 0 36 75 37 19
2 Daoura 100 0 100 0 0 0 34 98 50 0 15 0 36 75 36 21
3 Guir 100 0 100 0 0 0 34 98 50 0 15 0 36 75 36 21
4 Tafna 100 0 100 0 0 0 34 98 50 0 15 0 36 75 36 21
5 Oued Bon Naima
100 0 100 0 0 0 34 98 50 0 15 0 36 75 36 21
6 Guadiana 100 0 100 0 100 33 70 82 50100
52 50 74 0 58 3
7 Tagus/Tejo 100 0 100 0 100 33 70 82 50100
52 50 74 0 58 3
8 Douro/Duero
100 0 100 0 100 33 70 82 50100
52 50 74 0 58 3
9 Lima 100 0 100 0 100 33 70 82 50100
52 50 74 0 58 3
10 Mino 100 0 100 0 100 33 70 82 50100
52 50 74 0 58 3
11 Ebro 67 0 67 0 67 0 73 11 25 0 26 0 72 0 29 36
12 Bidasoa 100 0 100 0 100 0 71 95 50 50 52 0 72 0 49 13
13 Garonne 67 0 67 0 67 0 73 11 28 13 26 0 72 0 30 35
14 Rhone 100 0 100 0 100 33 78 71 50 50 48 100 75 11 58 2
15 Po 67 0 67 0 67 17 74 71 56 38 45 75 75 7 47 14
16 Medjerda 50 0 50 0 0 0 39 81 50 0 9 0 46 59 27 37
17 Roia 50 0 50 0 100 0 71 99 50 13 40 0 75 0 39 16
18 Danube 61 100 73 78 94 50 59 48 37 63 11 50 58 30 58 8
19 Isonzo 0 0 0 0 100 0 69 61 60 25 15 50 76 17 34 27
20 Krka 0 0 0 0 0 52 96 60 0 9 0 59 20 41
21 Neretva 0 0 0 0 0 52 96 100 0 9 0 59 23 40
22 Lake Prespa
67 100 0 0 100 33 54 74 50 50 6 75 82 25 51 12
23 Vijose 50 0 0 0 100 0 56 74 50 25 9 50 82 17 37 20
24 Maritsa 33 0 33 0 67 0 53 77 25 50 0 25 72 15 32 30
25 Velaka 50 0 50 0 0 0 50 77 17 0 0 0 66 25 24 39
26 Rezvaya 50 0 50 0 100 0 50 77 17 0 0 50 66 25 35 26
27 Tigris-Euphrates/Shatt al Arab
50 0 50 0 67 17 24 77 30 38 3 25 43 17 31 31
19

Basin
Nati
onal
pl
an/s
trat
egy
Basin
pla
n
Stat
utor
y re
quire
men
tCl
imat
e ch
ange
RB
OU
ncer
tain
ty
man
agem
ent
RBO
dec
ision
m
akin
gVo
ice
and
Acco
unta
bilit
yPo
wer
di
strib
ution
Nat
. Com
m.
Mon
itorin
g &
sh
arin
gAd
apta
tion
fund
sFu
ndin
g b
asin
in
stitu
tions
Publ
ic
perc
eptio
nM
edia
cove
rage
Aggr
egat
e
Rank
ing
28 Asi/Orontes
67 0 100 0 67 0 31 72 50 25 6 25 52 31 37 18
29 Nahr El Kebir
100 0 100 0 0 0 27 88 50 25 0 0 50 25 33 29
30 An Nahr Al Kabir
50 0 0 100 0 25 83 50 50 9 50 47 35 36 25
31 Wadi Al Izziyah
0 0 0 0 0 0 50 85 50 0 9 0 58 17 19 42
32 Jordan 60 0 67 0 80 33 33 76 19 50 15 50 42 16 39 17
33 Baraka 100 0 0 0 0 0 11 97 17 0 29 0 42 75 26 38
34 Gash 100 0 33 0 0 0 15 95 28 0 32 0 52 78 31 32
35 Awash 100 0 33 0 0 0 16 68 60 0 36 0 47 64 30 34
36 Juba-Shibeli
100 0 67 0 0 0 22 80 50 0 32 0 58 64 34 28
37 Nile 100 100 55 0 82 67 26 61 36 75 34 75 35 54 57 9
38 Lake Chad
75 0 38 0 50 33 27 64 22 25 18 0 32 45 31 33
39 Niger 80 50 40 0 90 100 35 70 29 50 20 100 31 64 54 10
40 Volta 83 0 33 0 100 17 42 86 28 38 21 50 26 63 42 15
41 Senegal 100 100 0 100 100 100 37 91 8 50 34 100 39 65 66 1
42 Gambia 100 50 0 0 100 100 33 74 11 50 26 100 38 75 54 11
20

O.R. 6.2 Adaptation readiness results by country unit
Basin Country
Nati
onal
pl
an/s
trat
egy
Basin
pla
n
Stat
utor
y re
quire
men
t
Clim
ate
chan
ge
RBO
Unc
erta
inty
m
anag
emen
t
RBO
flex
ible
de
cisio
n m
akin
g
Voic
e an
d Ac
coun
tabi
lity
Pow
er
dist
ributi
on
Nati
onal
Co
mm
unic
ation
s
Mon
itorin
g &
sh
arin
g
Adap
tatio
n fu
nds
Fund
ing
bas
in
insti
tutio
ns
Publ
ic p
erce
ption
Med
ia co
vera
ge
Aggr
egat
e
Wea
kest
link
?
1 Dra Algeria 100 0 100 0 0 0 32 5 50 0 0 0 46 75 29 N
Morocco 100 0 100 0 0 0 36 4 100 0 40 0 29 75 35 N
2 Daoura Algeria 100 0 100 0 0 0 32 5 50 0 0 0 46 75 29 N
Morocco 100 0 100 0 0 0 36 4 50 0 40 0 29 75 31 N
3 Guir Algeria 100 0 100 0 0 0 32 5 50 0 0 0 46 75 29 N
Morocco 100 0 100 0 0 0 36 4 50 0 40 0 29 75 31 N
4 Tafna Algeria 100 0 100 0 0 0 32 5 50 0 0 0 46 75 29 N
Morocco 100 0 100 0 0 0 36 4 50 0 40 0 29 75 31 N
5 Oued Bon Naima
Algeria 100 0 100 0 0 0 32 5 50 0 0 0 46 75 29 N
Morocco 100 0 100 0 0 0 36 4 50 0 40 0 29 75 31 N
6 Guadiana Portugal 100 0 100 0 100 33 71 2 50 100 40 50 85 0 52 N
Spain 100 0 100 0 100 33 69 11 50 100 80 50 69 0 55 N
7 Tagus/ Tejo
Portugal 100 0 100 0 100 33 71 2 50 100 40 50 85 0 52 N
Spain 100 0 100 0 100 33 69 11 50 100 80 50 69 0 55 N
8 Douro/ Duero
Portugal 100 0 100 0 100 33 71 2 50 100 40 50 85 0 52 N
Spain 100 0 100 0 100 33 69 11 50 100 80 50 69 0 55 N
9 Lima Portugal 100 0 100 0 100 33 71 2 50 100 40 50 85 0 52 N
Spain 100 0 100 0 100 33 69 11 50 100 80 50 69 0 55 N
10 Mino Portugal 100 0 100 0 100 33 71 2 50 100 40 50 85 0 52 N
Spain 100 0 100 0 100 33 69 11 50 100 80 50 69 0 55 N
21

Basin Country
Nati
onal
pl
an/s
trat
egy
Basin
pla
n
Stat
utor
y re
quire
men
t
Clim
ate
chan
ge
RBO
Unc
erta
inty
m
anag
emen
t
RBO
flex
ible
de
cisio
n m
akin
g
Voic
e an
d Ac
coun
tabi
lity
Pow
er
dist
ributi
on
Nati
onal
Co
mm
unic
ation
s
Mon
itorin
g &
sh
arin
g
Adap
tatio
n fu
nds
Fund
ing
bas
in
insti
tutio
ns
Publ
ic p
erce
ption
Med
ia co
vera
ge
Aggr
egat
e
Wea
kest
link
?
11 Ebro Andorra 0 0 0 0 0 0 78 0 0 0 0 0 NA 0 6 Y
France 100 0 100 0 100 0 74 19 50 0 40 0 75 0 40 N
Spain 100 0 100 0 100 0 69 11 50 0 80 0 69 0 41 N
12 Bidasoa France 100 0 100 0 100 0 74 19 50 50 40 0 75 0 43 N
Spain 100 0 100 0 100 0 69 11 50 50 80 0 69 0 45 N
13 Garonne Andorra 0 0 0 0 0 0 78 0 0 0 0 0 NA 0 6 Y
France 100 0 100 0 100 0 74 19 100 25 40 0 75 0 45 N
Spain 100 0 100 0 100 0 69 11 50 25 80 0 69 0 43 N
14 Rhone France 100 0 100 0 100 33 74 19 50 50 40 100 75 0 53 N
Switzerland 100 0 100 0 100 33 83 1 50 50 60 100 NA 25 54 N
15 Po France 100 0 100 0 0 0 74 19 50 25 40 50 75 0 38 N
Italy 0 0 0 0 100 33 69 17 100 50 40 100 76 0 42 N
Switzerland 100 0 100 0 100 33 83 1 50 50 60 100 NA 25 54 N
16 Medjerda
Algeria 100 0 100 0 0 0 32 5 50 0 0 0 46 75 29 N
Tunisia 0 0 0 0 0 0 48 1 50 0 20 0 46 50 15 Y
17 Roia France 100 0 100 0 100 0 74 19 50 25 40 0 75 0 42 N
Italy 0 0 0 0 100 0 69 17 50 25 40 0 76 0 27 Y
18 Danube Albania 100 100 NA 0 100 0 51 0 50 50 20 50 NA 50 48 N
Austria 100 100 100 100 100 100 79 3 0 100 40 100 54 25 71 N
Bosnia and Herzegovina
0 100 NA 100 100 100 47 0 50 100 20 100 NA 75 66 N
Bulgaria 0 100 0 100 100 100 56 1 0 100 0 100 NA 25 53 N
22

Basin Country
Nati
onal
pl
an/s
trat
egy
Basin
pla
n
Stat
utor
y re
quire
men
t
Clim
ate
chan
ge
RBO
Unc
erta
inty
m
anag
emen
t
RBO
flex
ible
de
cisio
n m
akin
g
Voic
e an
d Ac
coun
tabi
lity
Pow
er
dist
ributi
on
Nati
onal
Co
mm
unic
ation
s
Mon
itorin
g &
sh
arin
g
Adap
tatio
n fu
nds
Fund
ing
bas
in
insti
tutio
ns
Publ
ic p
erce
ption
Med
ia co
vera
ge
Aggr
egat
e
Wea
kest
link
?
Croatia 0 100 NA 100 100 100 59 1 50 100 0 100 NA 50 63 N
Czech Republic 100 100 0 100 100 100 69 2 50 100 20 100 39 50 66 N
Germany 100 100 100 100 100 100 78 24 50 100 80 100 60 0 78 N
Hungary 100 100 100 100 100 100 65 2 100 100 20 100 75 50 79 N
Italy 0 100 0 0 100 0 69 17 50 25 40 50 76 0 38 N
Montenegro 100 100 NA 100 0 100 54 0 50 100 0 50 NA 0 54 N
Poland 100 100 100 0 100 0 69 7 0 50 0 0 54 50 45 N
Rep. of Moldova 0 100 NA 100 100 100 48 0 100 100 0 100 73 25 65 N
Romania 100 100 100 100 100 100 56 3 50 100 0 100 66 50 73 N
Serbia 0 100 NA 100 100 100 56 NA 100 100 0 100 NA 75 76 N
Slovakia 100 100 100 100 100 100 69 1 50 100 0 100 NA 50 75 N
Slovenia 0 100 NA 100 100 100 70 0 100 100 0 100 NA 50 68 N
Switzerland 100 100 100 0 100 0 83 1 50 25 60 50 NA 25 53 N
Ukraine 100 100 100 100 100 100 43 12 NA 100 0 100 52 25 72 N
19 Isonzo Italy 0 0 0 0 100 0 69 17 50 25 40 50 76 0 31 N
Slovenia 0 0 NA 0 100 0 70 0 100 25 0 50 NA 50 33 N
20 Krka Bosnia and Herzegovina
0 0 NA 0 0 0 47 0 50 0 20 0 NA 75 16 N
Croatia 0 0 NA 0 0 0 59 1 100 0 0 0 NA 50 18 N
21 Neretva Bosnia and Herzegovina
0 0 NA 0 0 0 47 0 100 0 20 0 NA 75 20 N
Croatia 0 0 NA 0 0 0 59 1 100 0 0 0 NA 50 18 N
23

Basin Country
Nati
onal
pl
an/s
trat
egy
Basin
pla
n
Stat
utor
y re
quire
men
t
Clim
ate
chan
ge
RBO
Unc
erta
inty
m
anag
emen
t
RBO
flex
ible
de
cisio
n m
akin
g
Voic
e an
d Ac
coun
tabi
lity
Pow
er
dist
ributi
on
Nati
onal
Co
mm
unic
ation
s
Mon
itorin
g &
sh
arin
g
Adap
tatio
n fu
nds
Fund
ing
bas
in
insti
tutio
ns
Publ
ic p
erce
ption
Med
ia co
vera
ge
Aggr
egat
e
Wea
kest
link
?
22 Lake Prespa
Albania 100 100 NA 0 100 67 51 0 50 50 20 100 NA 50 57 N
Greece 0 100 0 0 100 67 63 4 50 75 0 100 82 0 46 N
The former Yugoslav Rep. of
Macedonia100 100 NA 0 100 0 49 0 50 50 0 50 NA 50 46 N
23 Vijose Albania 100 0 NA 0 100 0 51 0 50 25 20 50 NA 50 37 N
Greece 0 0 0 0 100 0 63 4 50 25 0 50 82 0 27 N
24 Maritsa Bulgaria 0 0 0 0 100 0 56 1 0 50 0 50 NA 25 22 N
Greece 0 0 0 0 0 0 63 4 50 50 0 0 82 0 18 N
Turkey 100 0 100 0 100 0 45 14 50 50 0 50 66 25 43 N
25 Velaka Bulgaria 0 0 0 0 0 0 56 1 0 0 0 0 NA 25 6 Y
Turkey 100 0 100 0 0 0 45 14 50 0 0 0 66 25 29 N
26 Rezvaya Bulgaria 0 0 0 0 100 0 56 1 0 0 0 50 NA 25 18 Y
Turkey 100 0 100 0 100 0 45 14 50 0 0 50 66 25 39 N
27 Tigris-Euphrates/ Shatt al Arab
Iran (Islamic Rep. of)
0 0 0 0 100 0 18 13 50 50 0 0 43 0 20 N
Iraq 0 0 NA 0 100 33 28 5 NA 50 0 50 28 0 25 N
Jordan 100 0 100 0 0 0 34 1 0 0 20 0 51 25 24 N
Saudi Arabia 0 0 0 0 0 0 14 11 50 0 0 0 40 50 12 N
Syrian Arab Rep. 100 0 NA 0 100 33 15 4 NA 50 0 0 41 25 31 N
Turkey 100 0 100 0 100 33 45 14 50 75 0 50 66 25 47 N
28 Asi / Lebanon 0 0 NA 0 100 0 41 1 50 50 20 50 54 50 32 N
24

Basin Country
Nati
onal
pl
an/s
trat
egy
Basin
pla
n
Stat
utor
y re
quire
men
t
Clim
ate
chan
ge
RBO
Unc
erta
inty
m
anag
emen
t
RBO
flex
ible
de
cisio
n m
akin
g
Voic
e an
d Ac
coun
tabi
lity
Pow
er
dist
ributi
on
Nati
onal
Co
mm
unic
ation
s
Mon
itorin
g &
sh
arin
g
Adap
tatio
n fu
nds
Fund
ing
bas
in
insti
tutio
ns
Publ
ic p
erce
ption
Med
ia co
vera
ge
Aggr
egat
e
Wea
kest
link
?
Orontes Syrian Arab Rep. 100 0 NA 0 100 0 15 4 NA 50 0 50 41 25 32 N
Turkey 100 0 100 0 0 0 45 14 50 25 0 0 66 25 30 N
29 Nahr El Kebir
Syrian Arab Rep. 100 0 NA 0 0 0 15 4 NA 25 0 0 41 25 17 Y
Turkey 100 0 100 0 0 0 45 14 50 25 0 0 66 25 30 N
30 An Nahr Al Kabir
Lebanon 0 0 NA 0 100 0 41 1 50 50 20 50 54 50 32 N
Syrian Arab Rep. 100 0 NA 0 100 0 15 4 NA 50 0 50 41 25 32 N
31 Wadi Al Izziyah
Israel 0 0 0 0 0 0 63 4 50 0 0 0 62 0 13 N
Lebanon 0 0 NA 0 0 0 41 1 50 0 20 0 54 50 17 N
32 Jordan Egypt 100 0 100 0 0 0 29 10 0 0 60 0 21 0 23 N
Israel 0 0 0 0 100 33 63 4 100 100 0 50 62 0 37 N
Jordan 100 0 100 0 100 67 34 1 0 100 20 100 51 25 50 N
Lebanon 0 0 NA 0 100 0 41 1 50 50 20 50 54 50 32 N
Syrian Arab Rep. 100 0 NA 0 100 67 15 4 NA 100 0 100 41 25 46 N
33 Baraka Eritrea 100 0 0 0 0 0 7 2 50 0 40 0 NA 75 21 N
Sudan 100 0 0 0 0 0 14 3 0 0 20 0 42 75 18 N
34 Gash Eritrea 100 0 0 0 0 0 7 2 100 0 40 0 NA 75 25 N
Ethiopia 100 0 100 0 0 0 24 4 50 0 40 0 73 100 35 N
Sudan 100 0 0 0 0 0 14 3 0 0 20 0 42 75 18 N
35 Awash Djibouti 100 0 0 0 0 0 21 0 50 0 60 0 35 75 24 N
Ethiopia 100 0 100 0 0 0 24 4 100 0 40 0 73 100 39 N
Somalia 100 0 0 0 0 0 6 1 NA 0 20 0 NA 50 15 N
25

Basin Country
Nati
onal
pl
an/s
trat
egy
Basin
pla
n
Stat
utor
y re
quire
men
t
Clim
ate
chan
ge
RBO
Unc
erta
inty
m
anag
emen
t
RBO
flex
ible
de
cisio
n m
akin
g
Voic
e an
d Ac
coun
tabi
lity
Pow
er
dist
ributi
on
Nati
onal
Co
mm
unic
ation
s
Mon
itorin
g &
sh
arin
g
Adap
tatio
n fu
nds
Fund
ing
bas
in
insti
tutio
ns
Publ
ic p
erce
ption
Med
ia co
vera
ge
Aggr
egat
e
Wea
kest
link
?
36 Juba-Shibeli
Ethiopia 100 0 100 0 0 0 24 4 50 0 40 0 73 100 35 N
Kenya 100 0 100 0 0 0 45 2 50 0 40 0 49 75 33 N
Somalia 100 0 0 0 0 0 6 1 NA 0 20 0 NA 50 15 Y
37 Nile Burundi 100 100 0 0 100 67 31 1 50 75 20 100 20 75 53 N
C.A.R. 100 100 0 0 0 67 19 0 50 50 20 50 37 100 42 N
D.R.C. 100 100 0 0 100 67 21 4 50 50 20 50 41 100 50 N
Egypt 100 100 100 0 100 67 29 10 50 75 60 100 21 0 58 N
Eritrea 100 100 0 0 0 67 7 2 50 50 40 50 NA 75 42 N
Ethiopia 100 100 100 0 100 67 24 4 100 50 40 50 73 100 65 N
Kenya 100 100 100 0 100 67 45 2 50 100 40 100 49 75 66 N
Rwanda 100 100 100 0 100 67 26 1 50 75 60 100 22 75 63 N
Sudan 100 100 0 0 100 67 14 3 0 75 20 100 42 75 50 N
Uganda 100 100 100 0 100 67 39 1 100 100 40 100 30 75 68 N
U.R. of Tanzania 100 100 100 0 100 67 45 2 0 100 60 100 48 100 66 N
38 Lake Chad
Algeria 100 0 100 0 0 0 32 5 50 0 0 0 46 75 29 N
Cameroon 0 0 100 0 100 67 29 1 50 50 20 0 32 75 37 N
C.A.R. 100 0 0 0 0 67 19 0 100 25 20 0 37 100 33 N
Chad 100 0 0 0 100 67 22 1 0 50 40 0 38 50 33 N
Libyan A.J. 0 0 0 0 0 67 30 2 NA 25 0 0 NA 0 10 N
Niger 100 0 0 0 100 67 43 1 0 50 40 0 21 100 37 N
Nigeria 100 0 100 0 100 67 35 8 50 50 20 0 18 50 43 N
Sudan 100 0 0 0 0 0 14 3 0 0 20 0 42 75 18 N
26

Basin Country
Nati
onal
pl
an/s
trat
egy
Basin
pla
n
Stat
utor
y re
quire
men
t
Clim
ate
chan
ge
RBO
Unc
erta
inty
m
anag
emen
t
RBO
flex
ible
de
cisio
n m
akin
g
Voic
e an
d Ac
coun
tabi
lity
Pow
er
dist
ributi
on
Nati
onal
Co
mm
unic
ation
s
Mon
itorin
g &
sh
arin
g
Adap
tatio
n fu
nds
Fund
ing
bas
in
insti
tutio
ns
Publ
ic p
erce
ption
Med
ia co
vera
ge
Aggr
egat
e
Wea
kest
link
?
39 Niger Algeria 100 50 100 0 0 100 32 5 50 25 0 100 46 75 49 N
Benin 100 50 0 0 100 100 52 0 100 75 2 100 15 75 55 N
Burkina Faso 100 50 100 0 100 100 44 1 0 75 20 100 34 75 57 N
Cameroon 0 50 100 0 100 100 29 1 50 75 20 100 32 75 52 N
Chad 100 50 0 0 100 100 22 1 0 75 40 100 38 50 48 N
Cote d'Ivoire 0 50 0 0 100 100 35 1 50 75 20 100 NA 75 47 N
Guinea 100 50 0 0 100 100 29 0 100 75 20 100 43 75 57 N
Mali 100 50 0 0 100 100 44 1 50 75 40 100 48 50 54 N
Niger 100 50 0 0 100 100 43 1 50 75 40 100 21 100 56 N
Nigeria 100 50 100 0 100 100 35 8 0 75 20 100 18 50 54 N
40 Volta Benin 100 0 0 0 100 33 52 0 100 25 2 50 15 75 40 N
Burkina Faso 100 0 100 0 100 33 44 1 0 50 20 50 34 75 43 N
Cote d'Ivoire 0 0 0 0 100 0 35 1 50 25 20 50 NA 75 27 N
Ghana 100 0 100 0 100 33 58 1 100 25 40 50 19 50 48 N
Mali 100 0 0 0 100 33 44 1 0 50 40 50 48 50 37 N
Togo 100 0 0 0 100 33 30 0 50 25 20 50 23 100 38 N
41 Senegal Guinea 100 100 0 100 100 100 29 0 50 50 20 100 43 75 62 N
Mali 100 100 0 100 100 100 44 1 0 50 40 100 48 50 59 N
Mauritania 100 100 0 100 100 100 31 0 0 50 40 100 35 75 59 N
Senegal 100 100 0 100 100 100 51 1 0 50 40 100 33 75 61 N
42 Gambia Gambia 100 50 0 0 100 100 25 0 0 50 20 100 NA NA 45 N
Guinea 100 50 0 0 100 100 29 0 50 50 20 100 43 75 51 N
27
Online Resources References
Adger WN, Arnell NW, Tompkins EL (2005) Successful adaptation to climate change across scales. Glob Environ Change 15:77–86. doi: 10.1016/j.gloenvcha.2004.12.005
Barnett J, Lambert S, Fry I (2008) The Hazards of Indicators: Insights from the Environmental Vulnerability Index. Ann Assoc Am Geogr 98:102–119. doi: 10.1080/00045600701734315
Brenkert AL, Malone EL (2005) Modeling Vulnerability and Resilience to Climate Change: A Case Study of India and Indian States. Clim Change 72:57–102. doi: 10.1007/s10584-005-5930-3
Brooks N, Neil Adger W, Mick Kelly P (2005) The determinants of vulnerability and adaptive capacity at the national level and the implications for adaptation. Glob Environ Change 15:151–163. doi: 10.1016/j.gloenvcha.2004.12.006
Cooley H, Gleick PH (2011) Climate-proofing transboundary water agreements. Hydrol Sci J 56:711–718. doi: 10.1080/02626667.2011.576651
Cutter SL, Mitchell JT, Scott MS (2000) Revealing the Vulnerability of People and Places: A Case Study of Georgetown County, South Carolina. Ann Assoc Am Geogr 90:713–737. doi: 10.1111/0004-5608.00219
Drieschova A, Giordano M, Fischhendler I (2008) Governance mechanisms to address flow variability in water treaties. Glob Environ Change 18:285–295. doi: 10.1016/j.gloenvcha.2008.01.005
Drieschova A, Giordano M, Fischhendler I (2009) Climate change, international cooperation and adaptation in transboundary water management. In: Adger WN, Lorenzoni I, O’Brien K (eds) Adapting to climate change: thresholds, values and governance. Cambridge University Press, Cambridge, United Kingdom and New York, NY, USA,
Eckstein G (2009) Water scarcity, conflict and security in a climate change world: Challenges and opportunities for international law and policy. Wis Int Law J 27:409–461.
Fischhendler I (2004) Legal and institutional adaptation to climate uncertainty: a study of international rivers. Water Policy 6:281–302.
Ford JD, King D (2015) A framework for examining adaptation readiness. Mitig Adapt Strateg Glob Change Mitig Adapt Strateg Glob Change Int J Devoted Sci Eng Socio-Econ Policy Responses Environ Change 20:505–526.
Füssel H-M, Klein RJT (2006) Climate Change Vulnerability Assessments: An Evolution of Conceptual Thinking. Clim Change 75:301–329. doi: 10.1007/s10584-006-0329-3
Goulden M, Conway D, Persechino A (2009) Adaptation to climate change in international river basins in Africa: a review / Adaptation au changement climatique dans les bassins fluviaux internationaux en Afrique: une revue. Hydrol Sci J 54:805–828. doi: 10.1623/hysj.54.5.805
Gupta J, Termeer C, Klostermann J, et al (2010) The Adaptive Capacity Wheel: a method to assess the inherent characteristics of institutions to enable the adaptive capacity of society. Environ Sci Policy 13:459–471. doi: 10.1016/j.envsci.2010.05.006
Heikkila T, Gerlak AK, Bell AR, Schmeier S (2013) Adaptation in a transboundary river basin: Linking stressors and adaptive capacity within the Mekong River Commission. Environ Sci Policy 25:73–82. doi: 10.1016/j.envsci.2012.09.013
28

Hinkel J (2011) “Indicators of vulnerability and adaptive capacity”: Towards a clarification of the science–policy interface. Glob Environ Change 21:198–208. doi: 10.1016/j.gloenvcha.2010.08.002
Huntjens P, Pahl-Wostl C, Grin J (2010) Climate change adaptation in European river basins. Reg Environ Change 10:263–284. doi: 10.1007/s10113-009-0108-6
Jiménez Cisneros BE, Oki T, Arnell NW, et al (2014) Freshwater resources. In: Field CB, Barros VR, Dokken DJ, et al. (eds) Climate Change 2014: Impacts, Adaptation, and Vulnerability. Part A: Global and Sectoral Aspects. Contribution of Working Group II to the Fifth Assessment Report of the Intergovernmental Panel on Climate Change. Cambridge University Press, Cambridge, United Kingdom and New York, NY, USA, pp 229–269
Kilroy G (2015) A review of the biophysical impacts of climate change in three hotspot regions in Africa and Asia. Reg Environ Change 1–12. doi: 10.1007/s10113-014-0709-6
Kistin EJ, Ashton PJ (2008) Adapting to Change in Transboundary Rivers: An Analysis of Treaty Flexibility on the Orange-Senqu River Basin. Int J Water Resour Dev 24:385–400. doi: 10.1080/07900620802127325
Kranz N, Menniken T, Hinkel J (2010) Climate change adaptation strategies in the Mekong and Orange-Senqu basins: What determines the state-of-play? Environ Sci Policy 13:648–659. doi: 10.1016/j.envsci.2010.09.003
Krysanova V, Dickens C, Timmerman J, et al (2010) Cross-Comparison of Climate Change Adaptation Strategies Across Large River Basins in Europe, Africa and Asia. Water Resour Manag 24:4121–4160. doi: 10.1007/s11269-010-9650-8
Lemos MC, Kirchhoff CJ, Ramprasad V (2012) Narrowing the climate information usability gap. Nat Clim Change 2:789–794. doi: 10.1038/nclimate1614
Massey E, Huitema D (2012) The emergence of climate change adaptation as a policy field: the case of England. Reg Environ Change 13:341–352. doi: 10.1007/s10113-012-0341-2
McCaffrey SC (2003) The need for flexibility in freshwater treaty regimes. Nat Resour Forum 27:156–162. doi: 10.1111/1477-8947.00050
Milman A, Bunclark L, Conway D, Adger WN (2013) Assessment of institutional capacity to adapt to climate change in transboundary river basins. Clim Change 121:755–770. doi: 10.1007/s10584-013-0917-y
Moser SC (2014) Communicating adaptation to climate change: the art and science of public engagement when climate change comes home. Wiley Interdiscip Rev Clim Change 5:337–358. doi: 10.1002/wcc.276
Moss RH, Meehl GA, Lemos MC, et al (2013) Hell and High Water: Practice-Relevant Adaptation. Science 342:696–698. doi: 10.1126/science.1239569
MRC (2014) International experiences on the formulation and implementation of transboundary climate change adaptation strategies. Mekong River Commission (MRC), Vientane, Lao PDR
ODI ODI, GPF the GPF (2014) The data. In: Clim. Funds Update. http://www.climatefundsupdate.org/data. Accessed 9 Jun 2015
OECD (2008) Handbook on constructing composite indicators: Methodology and user guide. Organisation for Economic Co-operation and Development (OECD), Paris, France
29

OSU OSU (2011) Transboundary freshwater spatial database. In: Transbound. Freshw. Dispute Database. http://www.transboundarywaters.orst.edu/database/transfreshspatdata.html. Accessed 15 Jul 2015
Pasquini L, Ziervogel G, Cowling RM, Shearing C (2015) What enables local governments to mainstream climate change adaptation? Lessons learned from two municipal case studies in the Western Cape, South Africa. Clim Dev 7:60–70. doi: 10.1080/17565529.2014.886994
Patt A, Schroter D, de la Vega-Leinert A, Klien R (2009) Vulnerability research and assessment to support adaptation and mitigation: Common themes from the diversity of approaches. In: Patt A, Schroter D, de la Vega-Leinert A, Klien R (eds) Assessing vulnerability to global environmental change: Making ressearch useful for adaptation decision making and policy. Earthscan, London, United Kingdom,
Perch-Nielsen SL (2009) The vulnerability of beach tourism to climate change—an index approach. Clim Change 100:579–606. doi: 10.1007/s10584-009-9692-1
Raadgever GT (Tom), Mostert E, Kranz N, et al (2008) Assessing Management Regimes in Transboundary River Basins: Do They Support Adaptive Management?
Singer D, Bremer S, Stuckey J (1972) Capability distribution, uncertainty and major power war, 1820-1965. In: Russett B (ed) Peace, war and numbers. Sage Publications, Beverly Hills. United States of America, pp 19–48
Smith JB, Vogel JM, Iii JEC (2009) An architecture for government action on adaptation to climate change. An editorial comment. Clim Change 95:53–61. doi: 10.1007/s10584-009-9623-1
Stefano LD, Duncan J, Dinar S, et al (2012) Climate change and the institutional resilience of international river basins. J Peace Res 49:193–209. doi: 10.1177/0022343311427416
Timmerman JG, Koeppel S, Bernardini F, Buntsma JJ (2011) Adaptation to Climate Change: Challenges for Transboundary Water Management. In: Filho WL (ed) The Economic, Social and Political Elements of Climate Change. Springer Berlin Heidelberg, pp 523–541
Timmerman JG, Langaas S (2005) Water information: what is it good for? The use of information in transboundary water management. Reg Environ Change 5:177–187. doi: 10.1007/s10113-004-0087-6
Tir J, Stinnett DM (2012) Weathering climate change: Can institutions mitigate international water conflict? J Peace Res 49:211–225. doi: 10.1177/0022343311427066
Tol RSJ, Yohe GW (2007) The weakest link hypothesis for adaptive capacity: An empirical test. Glob Environ Change 17:218–227. doi: 10.1016/j.gloenvcha.2006.08.001
U.N. (2014) Guidance on water and adaptation to climate change. United Nations
UNECE UNEC for E, INBO IN of BO (2015) Water and climate change adaptation in transboundary basins: Lessons learned and good practices. United Nations, Geneva, Swizterland
Vincent K (2007) Uncertainty in adaptive capacity and the importance of scale. Glob Environ Change 17:12–24. doi: 10.1016/j.gloenvcha.2006.11.009
Wilby R l., Vaughan K (2011) Hallmarks of organisations that are adapting to climate change. Water Environ J 25:271–281. doi: 10.1111/j.1747-6593.2010.00220.x
World Bank (2015) GDP per capita (current US$). In: World Bank Data. http://data.worldbank.org/indicator/NY.GDP.PCAP.CD. Accessed 20 Oct 2015
30
Zeitoun M, Goulden M, Tickner D (2013) Current and future challenges facing transboundary river basin management. Wiley Interdiscip Rev Clim Change 4:331–349. doi: 10.1002/wcc.228
Zeitoun M, Warner J (2006) Hydro-hegemony – a framework for analysis of trans-boundary water conflicts. Water Policy 8:435–460.
31