statistical modelling to optimise paid media campaigns
TRANSCRIPT

Using regression analysis, Monte Carlo simulations and more to optimise paid media budget allocations
Simon Löfwander – Data Analyst, Ayima
25/03/17
Contact: [email protected]
Introduction and problem description
• How do we find the optimal allocations to spend on our campaigns to maximise the total amount of conversions?
• Inspiration from financial statistics and portfolio theory
• We view each account as a portfolio. Each campaign in a portfolio is considered an asset
Adjusting the method to fit our domain
• Omitting riskMaximise conversions w.r.t. cost. Minimising volatility would favour stable campaigns.
• Using a proxy for stock returnsInterpretable and suitable in our domain
• Weighting factor for campaignsIf conversions from specific campaigns are more valuable
• Adjusted model for e-commerceMaximise conversion value when plausible
• VersatileApplicable for all paid media campaigns

Calculating a proxy for stock returns
• Square root ruleConversion as a function of the square root of spend
• K = conversions per unit of square root of spendOur proxy. The higher K, the more conversions per money spent
• Controlling spendThe square root rule makes sure the model won’t recommend too high allocations
Conversions = K√Spend

Visualizing the relationship between conversions and cost
Simulating possible outcomes
• RobustnessLeverage the distribution of data to simulate many possible scenarios
• Monte Carlo simulationsWe obtain a distribution of outcomes – can conveniently pick the most likely
• Technical detailsInverse CDF to transform simulations to appropriate distributions
• Conversions distributionPositive integer. Negative binomial distribution
• Cost distributionContinuous variable ≥ 0. Truncated normal distribution

Visualizing the simulations in heatmaps
• To evaluate our distribution assumptions and the simulation results

Solving for theoptimal weights
• The total amount of conversions is maximized
• We obtain optimal weights for each campaign and each simulation run
• For every campaign we get a distribution of optimal weights
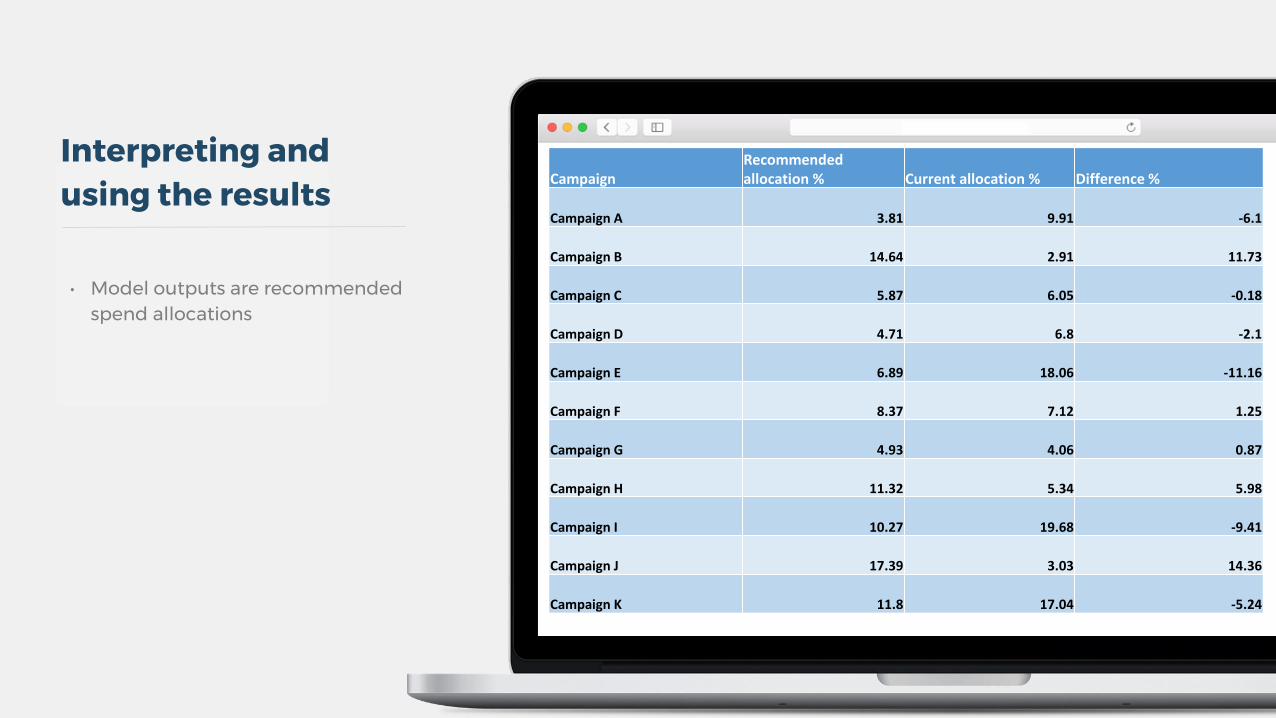
CampaignRecommended allocation % Current allocation % Difference %
Campaign A 3.81 9.91 -6.1
Campaign B 14.64 2.91 11.73
Campaign C 5.87 6.05 -0.18
Campaign D 4.71 6.8 -2.1
Campaign E 6.89 18.06 -11.16
Campaign F 8.37 7.12 1.25
Campaign G 4.93 4.06 0.87
Campaign H 11.32 5.34 5.98
Campaign I 10.27 19.68 -9.41
Campaign J 17.39 3.03 14.36
Campaign K 11.8 17.04 -5.24
Interpreting andusing the results
• Model outputs are recommended spend allocations
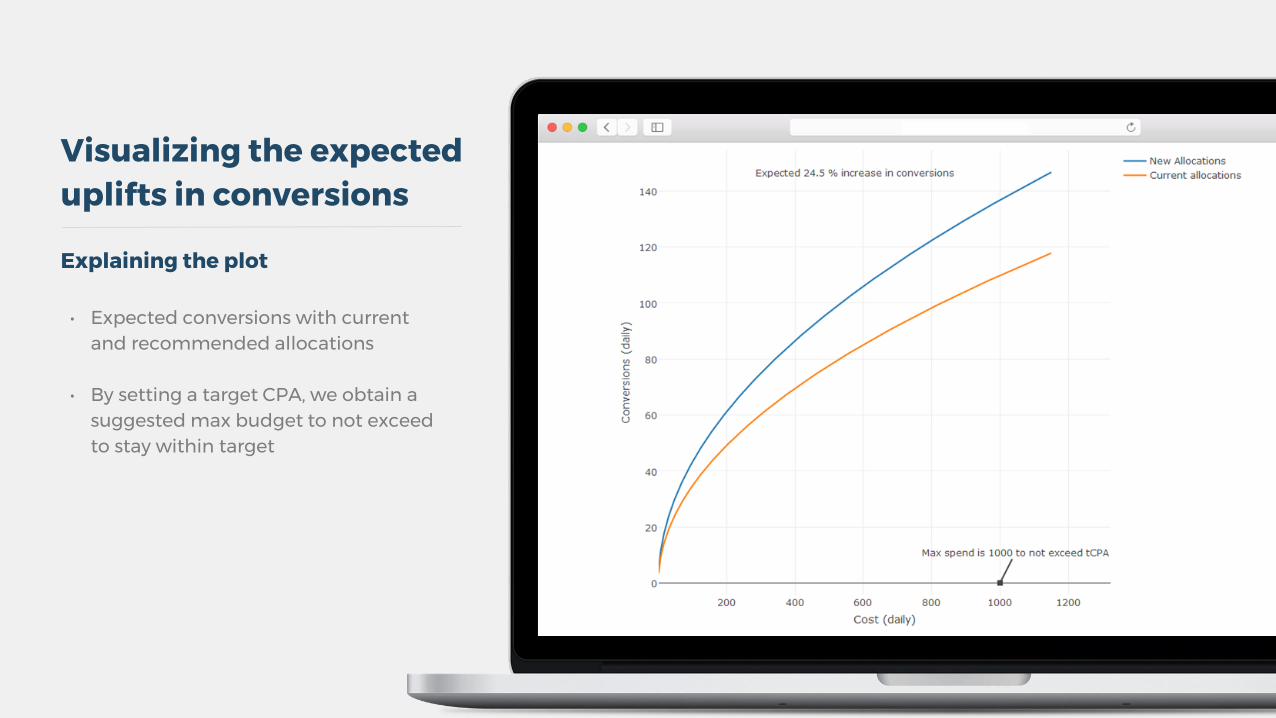
Visualizing the expected uplifts in conversions
Explaining the plot
• Expected conversions with current and recommended allocations
• By setting a target CPA, we obtain a suggested max budget to not exceed to stay within target

How do weKnow this works?
We can’t do A/B testing if we reallocate budgets throughout an entire account. Need to make sure of causality
Causal Impact
• Predicts what should have happened and compares to what happened
• Confidence intervals with predictions
• Great R-coverage and library developed by Google. “CausalImpact” is available on CRAN

Automating the procedure in RShiny applications for cross-agency use
Creating user friendly applications in Shiny
• Allowing for analytical methods to be standardized

1 Reasonable amount of conversions and spend for each campaignThe simulations will work best for data rich campaigns
2 Maxed out campaigns will be favoured if they have good performanceHence, campaigns in e.g. an AdWords context that has Search Impression share~100% should be omitted
3 For seasonal data, we need overlapping time periodsThe same time period for all campaigns should be used
Limitations

Questions and discussion
Contact: [email protected]
Slides will be available on SlideShare Email or www.ayima.com for access