statistics in evidence based medicine
TRANSCRIPT

1
Statistics in Evidence Based Medicine
Lecture 5: Vocabulary of inferential statistics
www.epilepsy.va.gov/Statistics

Inferential Statistics
The branch of statistics dealing with conclusions,
generalizations, predictions, and estimations
based on data from small data sets
Answers the following questions
How far the computed value of a quantity of interest from a small data set be from the broader population’s value?
Confidence Interval
Is our computed statistic statistically different from the norm?
Hypothesis testing 2

Examples of Confidence Intervals
3
Q A: The sample mean of blood pressure for Printers is 88mmHg. What is the 95% C.I around this mean? Q B: The difference in mean blood pressures of Printers and Farmers is 9 mmHg. What is the 95% C.I for this difference?
There is a 5% chance that the range provided by C.I will exclude the true mean blood pressure of all printers in example A and true mean difference of blood pressures between Printers and Farmers .

Examples of Hypotheses Testing
4
Q A: Previous studies show that the mean estimated blood pressure of all Farmers is 87mmHg. Is this sample mean (n=48) unusually low? Null Hypothesis Ho: µ=87 Alternative Hypothesis HA: µ<87 Q B: Is there is a statistically significant difference between the blood pressure means of Printers and Farmers? Null Hypothesis Ho: µ1 = µ2
Alternative hypothesis HA: : µ1 ≠ µ2

Confidence Intervals & Hypothesis Testing are Complimentary
Similar terms are used in both.
In computing confidence intervals we assume that alternative hypothesis is true while in test of significance we assume that null hypothesis is true.
Both will lead us to the same conclusion.
Confidence intervals give more information than a hypothesis test.
5

Overview
Populations & samples
Probability & probability distributions
Sampling distributions
Variation between samples: standard error
Confidence intervals
6

Population vs. Sample
Population
Aggregate of all objects under consideration
Population parameters describe characteristics of population; generally denoted by Greek letters
Sample
A subset of population: A well chosen sample should contain all the properties of population
Simple Random Sample: Every member of population has an equal chance of being selected
Sample characteristics (statistics) are described by Roman letters
7
We infer from a sample to a larger population

Symbols: Population vs. Sample
Characteristic Population parameter
Sample statistic
mean µ
variance σ2
s 2
standard deviation σ s
proportion π p
8
x

Reasons for Sampling
Samples can be studied more quickly.
Less expensive
Sometimes population study is impossible.
Sample results are more accurate than population results.
9
Probability theory enables us to use sample statistics to estimate population parameters
Importance of a Random Sample
Random sampling ensures that the differences from the population are solely due to chance.
Methods of probability theory can be applied
to draw inferences about population from the sample.
Convenience sampling should ensure samples
are typical of population and results can be generalized.
10

Probability
The probability that an event (a possible outcome of an experiment) will happen under given circumstances is the proportions of repetitions of that event in the long run.
11
experiment an of outcomes of number Total
happen can event waysof number TotalPr(event)
Example Experiment: A die is thrown, Event: A six appears Pr(event)=1/6

Random Variable
The characteristic of interest in a study is called a variable.
Age, sex, height, blood pressure, etc
A variable selected through randomization process is called a random variable.
Values of a random variable can be summarized in a frequency distribution known as probability distribution.
12

Probability Distribution
A probability distribution is a table or an equation that links each possible value that a random variable can assume with its probability of occurrence.
Example: Tossing a coin
Random variable: # of times a head appears
Pr(head appears zero times)= 1/2
Pr(head appears one time)= 1/2
In many situations, a theoretical probability distribution is a good fit to the distribution of variable of interest.
13

Familiar Theoretical Probability Distributions
14
Standard normal z distribution
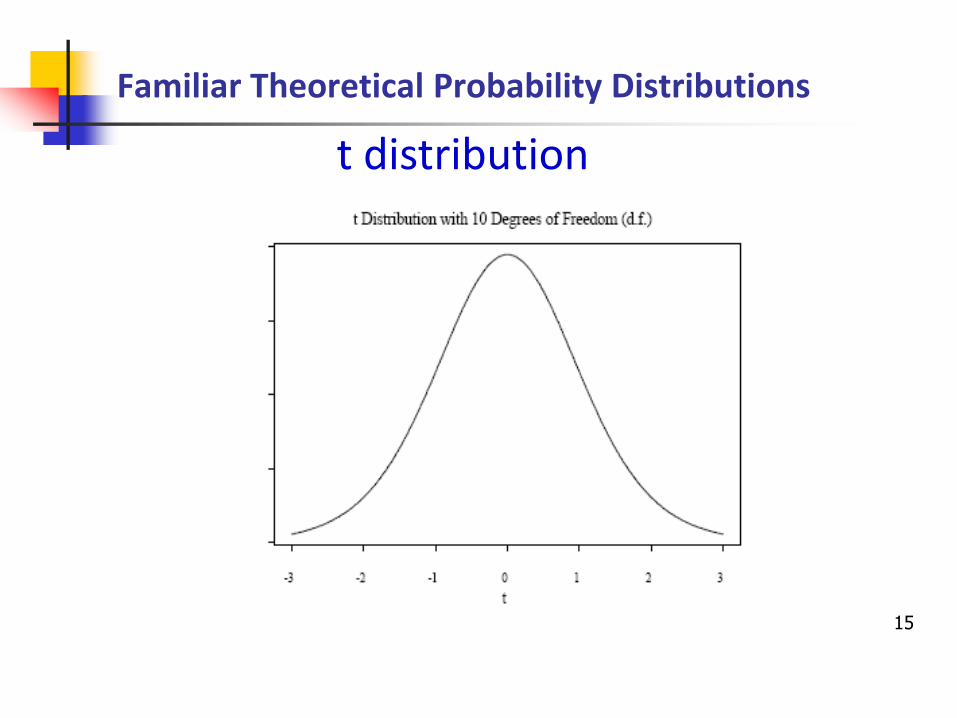
Familiar Theoretical Probability Distributions
15
t distribution

Familiar Theoretical Probability Distributions
16
chi-square distribution

Sampling Distribution
Suppose all possible samples of size n are drawn from a population.
A statistic of interest such as mean from each sample is calculated.
The probability distribution of this series of statistics is called a sampling distribution.
The distribution of data in a sample may be similar or different from sampling distributions of statistic
of interest.
17

Similarity of Sampling Distributions with Known Theoretical Distributions
When the data are normal: Sampling distribution of mean is approximately normal and variance follows a chi square distribution.
Data not normally distributed: Sampling distribution of mean still normal for large (n ≥ 30) sample size and sampling distribution of mean follows a t distribution when sample size is small (n < 30).
Sampling distribution of ratio of two variances assumes F distribution.
18

Standard Error: Variation between Samples
Standard error of a statistic is the standard
deviation of sampling distribution of the statistic.
The standard error of the sample mean is .
Standard error (SE) is a measure of the variability that a constant (population parameter) would be expected to show during sampling. It provides a measure of how far from the true value the estimate is likely to be.
A population parameter usually lies within statistic 2 SE.
19
n
s

Standard Error: Estimated Standard Deviation of a Statistic
20
n
)p(100p
n
)p(100p spercentage two between difference for SE
SESE means two between difference for SE
n
p)-p(100percentage or proportion for SE
n
smean for SE
2
22
1
11
2
2
2
1
SE is used in computation of confidence intervals and hypothesis testing.
Confidence Intervals
21
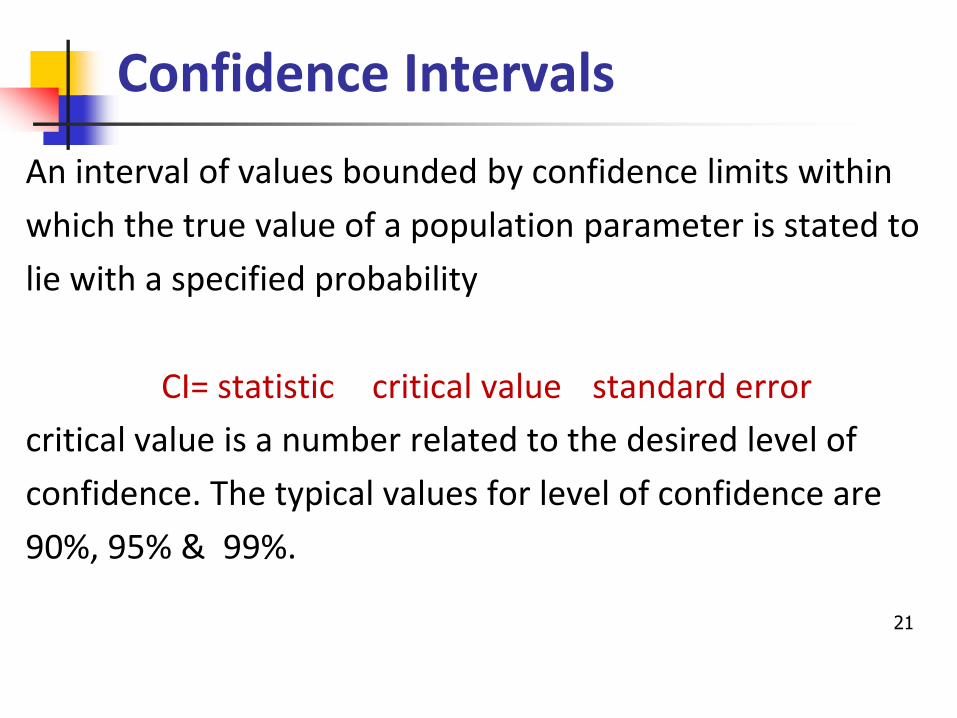
An interval of values bounded by confidence limits within
which the true value of a population parameter is stated to
lie with a specified probability
CI= statistic critical value standard error
critical value is a number related to the desired level of
confidence. The typical values for level of confidence are
90%, 95% & 99%.

Example of a Confidence Interval
Mean diastolic blood pressure of a group
of 72 Printers = 88mmHg
Standard deviation = 4.5mmHg
Standard error=0.53mmHg
Critical value at 95% confidence level =1.96
CI =mean 1.96 0.53 =(86.96, 89.04)
Question: How to interpret this confidence interval?
22

Interpretation of Confidence Interval There is only a 5% chance that the range
86.96 to 89.04 mmHg excludes the
population mean.
In the long run if we take many samples and compute 95% confidence intervals for each sample, then 95% of these intervals will include population mean.
In practice it is hard to determine whether our C.I is one of 95% (that include population mean) or the 5% (that must exclude population mean).
23

How NOT to Interpret Confidence Interval
24
There is 95% probability that the mean of another sample lies in the range 86.96 to 89.04 mmHg.
There is a 95% probability that the true mean lies within the range (86.96,89.04).
If the study is repeated with same sample size, the new result falls in the confidence interval (86.96, 89.04) 95% of the time.

Another Example for Confidence Intervals
25 an introduction to medical statistics by Martin Bland

Reference Range for a Mean
Suppose data obtained are normally distributed.
The 95% reference range is given by
sample mean 1.96 standard deviation of the sample
Mean diastolic BP of Printers was 88 mmHg with SD
4.5mmHg. Ref. Range is from 79.2 mmHg to 96.8mmHg.
Only 1 in 20 of printers would be expected to have a
diastolic BP below 79 or above 97 mmHg.
26
Things to Remember
Reference range and confidence interval are different.
If a study is repeated with the same sample size, the new results DON’T fall in the confidence interval 95% of the time.
To avoid confusion with negative numbers, it is better to quote a confidence interval as a to b or (a , b) instead of (a - b)
27
Questions/Comments
(919) 286-0411 ext: 5024
Next lecture’s highlights
Hypothesis testing, p value, Type 1 & type 2
errors, power, sample size calculation
28
www.epilepsy.va.gov/Statistics