statistika bisnis 1 - telkom university
TRANSCRIPT
Statistika Bisnis 1
Week 2
Organizing Data
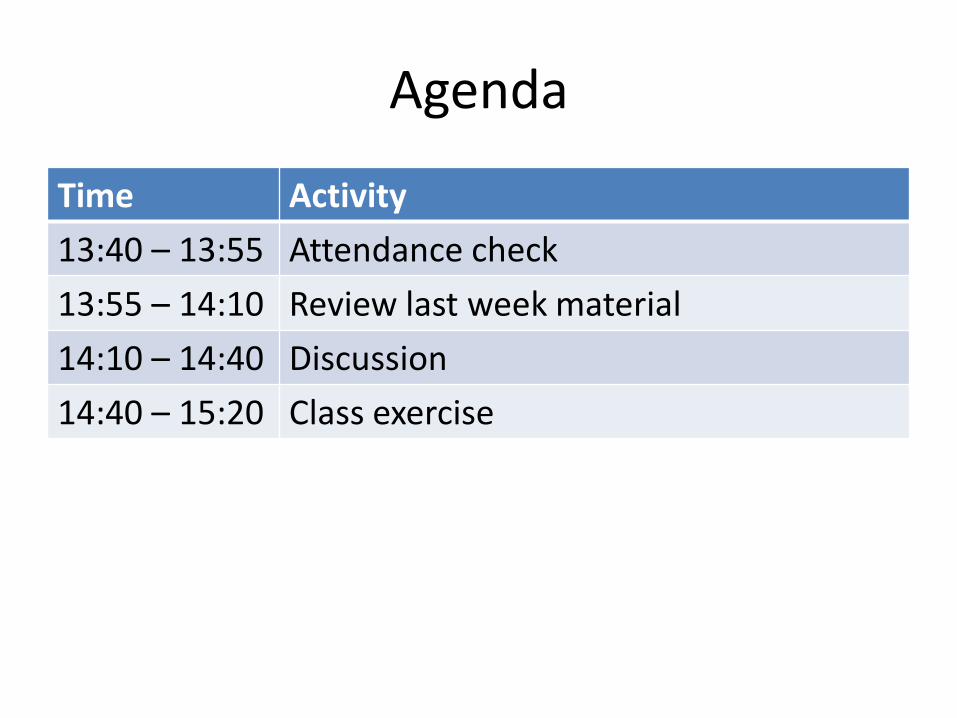
Agenda
Time Activity
13:40 – 13:55 Attendance check
13:55 – 14:10 Review last week material
14:10 – 14:40 Discussion
14:40 – 15:20 Class exercise
Objectives
By the end of this class, students will:
• Understand how to collect data in statistic
• Be able to organize categorical and numerical data
• Understand how to read and interpret an organized data (table)

DISCUSSION
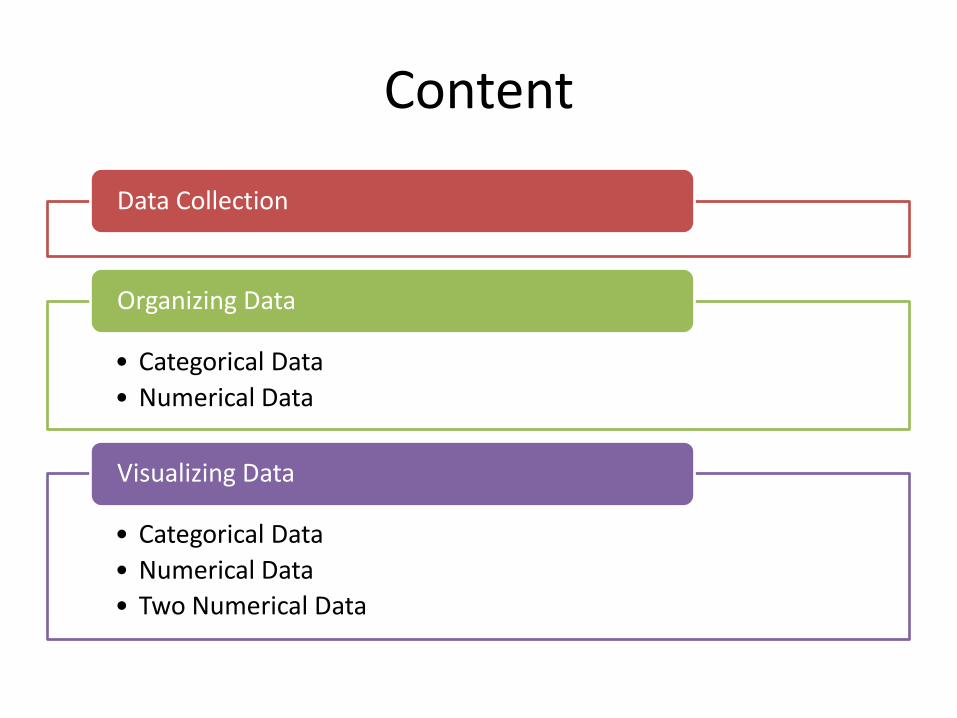
Content
Data Collection
• Categorical Data
• Numerical Data
Organizing Data
• Categorical Data
• Numerical Data
• Two Numerical Data
Visualizing Data
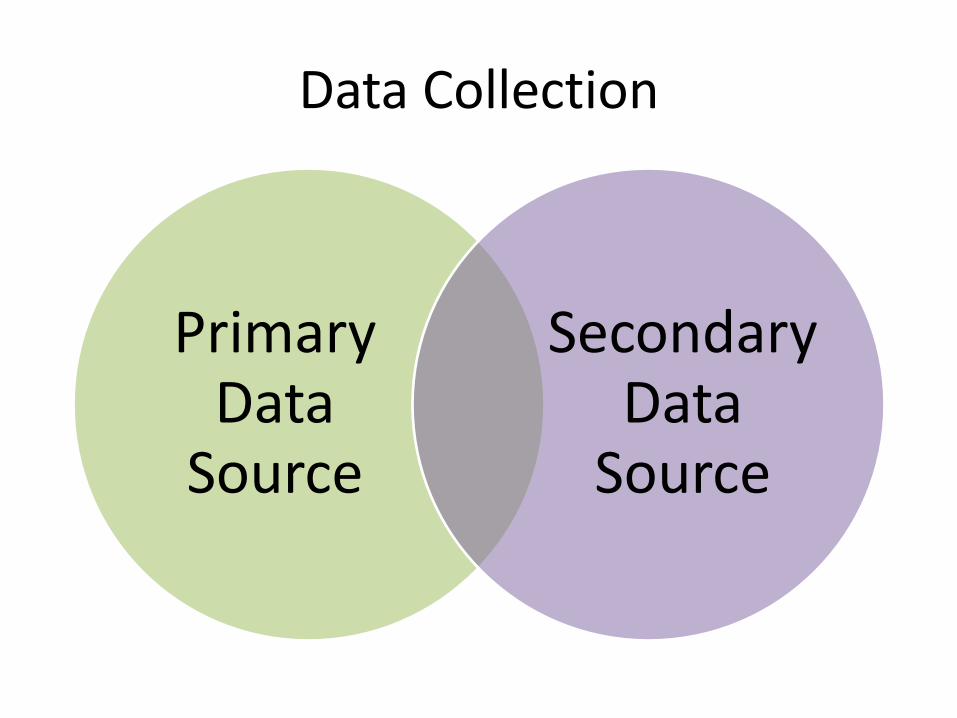
Data Collection
Primary Data
Source
Secondary Data
Source
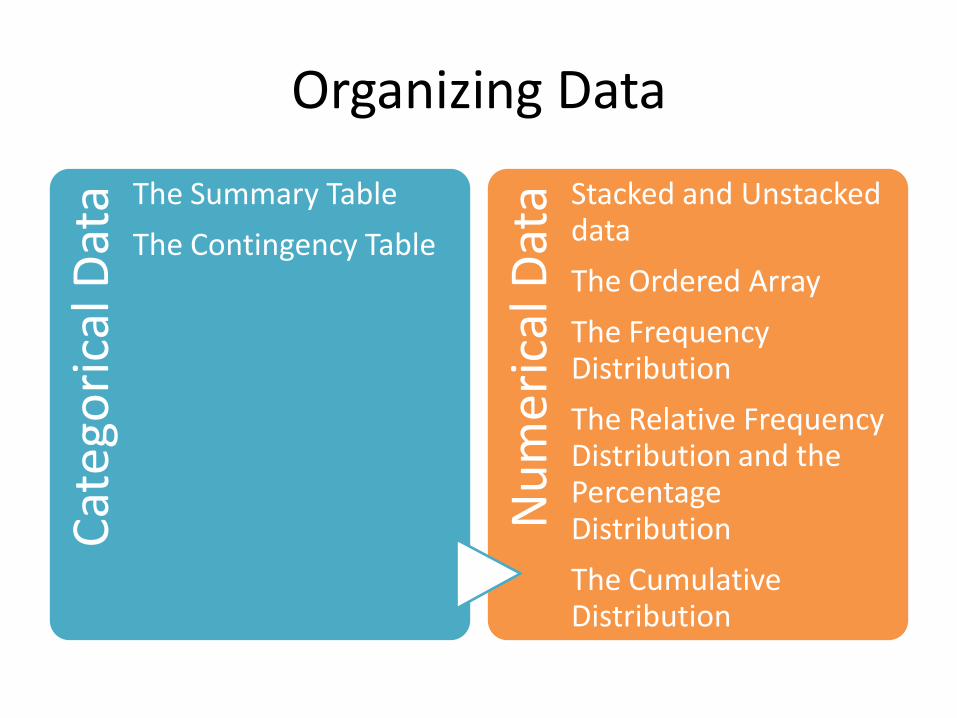
Organizing Data C
ateg
ori
cal D
ata The Summary Table
The Contingency Table
Nu
mer
ical
Dat
a Stacked and Unstacked data
The Ordered Array
The Frequency Distribution
The Relative Frequency Distribution and the Percentage Distribution
The Cumulative Distribution
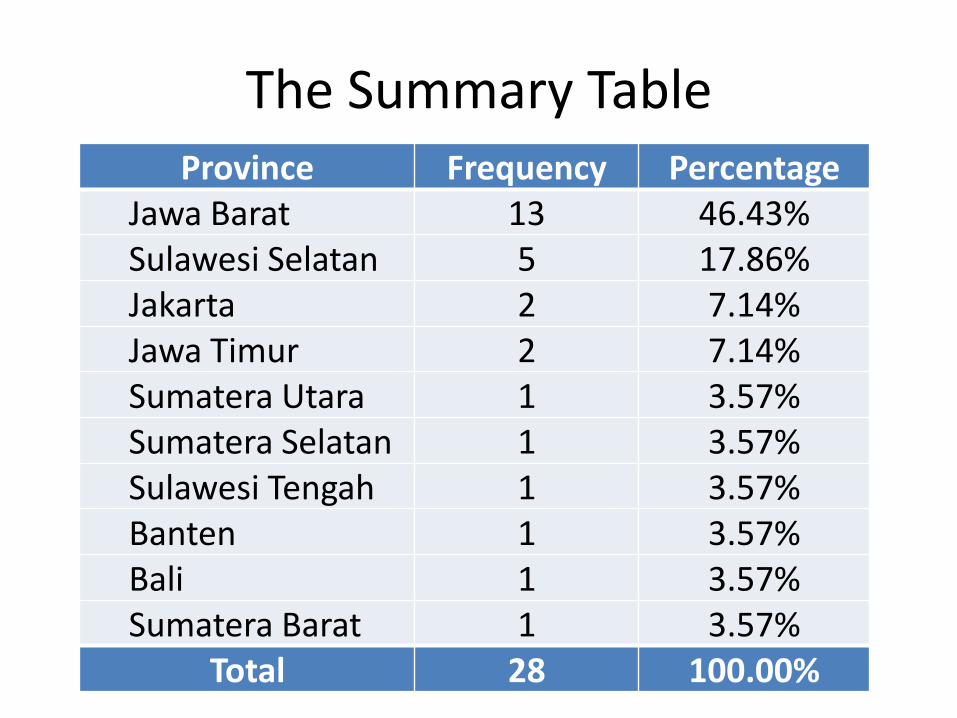
The Summary Table Province Frequency Percentage
Jawa Barat 13 46.43%
Sulawesi Selatan 5 17.86%
Jakarta 2 7.14%
Jawa Timur 2 7.14%
Sumatera Utara 1 3.57%
Sumatera Selatan 1 3.57%
Sulawesi Tengah 1 3.57%
Banten 1 3.57%
Bali 1 3.57%
Sumatera Barat 1 3.57%
Total 28 100.00%
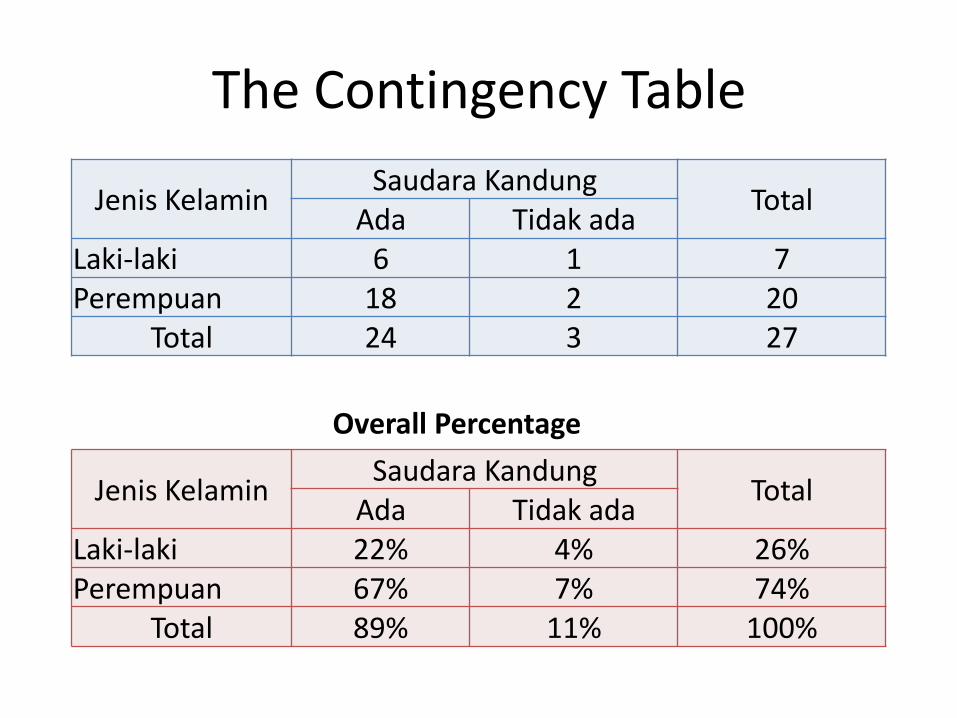
The Contingency Table
Jenis Kelamin Saudara Kandung
Total Ada Tidak ada
Laki-laki 6 1 7 Perempuan 18 2 20
Total 24 3 27
Jenis Kelamin Saudara Kandung
Total Ada Tidak ada
Laki-laki 22% 4% 26% Perempuan 67% 7% 74%
Total 89% 11% 100%
Overall Percentage
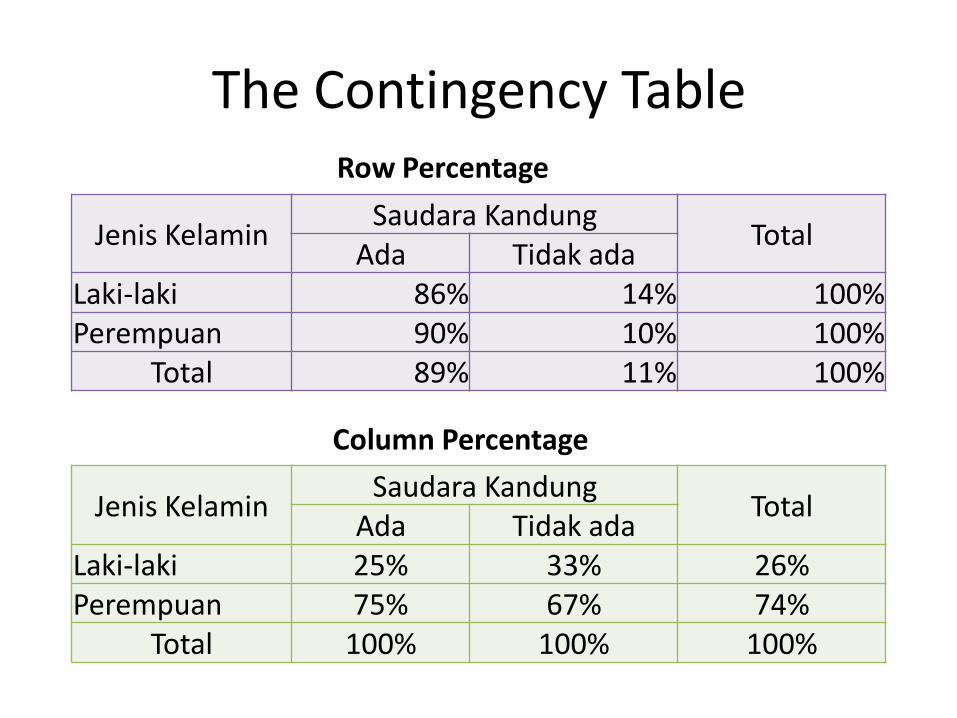
The Contingency Table
Jenis Kelamin Saudara Kandung
Total Ada Tidak ada
Laki-laki 86% 14% 100% Perempuan 90% 10% 100%
Total 89% 11% 100%
Jenis Kelamin Saudara Kandung
Total Ada Tidak ada
Laki-laki 25% 33% 26% Perempuan 75% 67% 74%
Total 100% 100% 100%
Column Percentage
Row Percentage
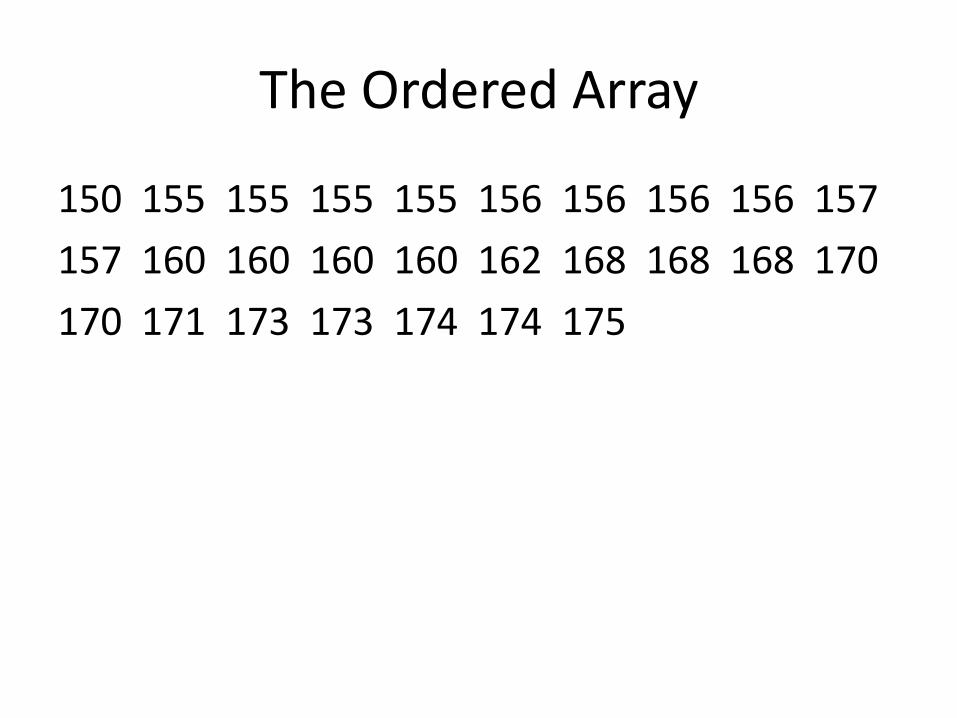
The Ordered Array
150 155 155 155 155 156 156 156 156 157
157 160 160 160 160 162 168 168 168 170
170 171 173 173 174 174 175
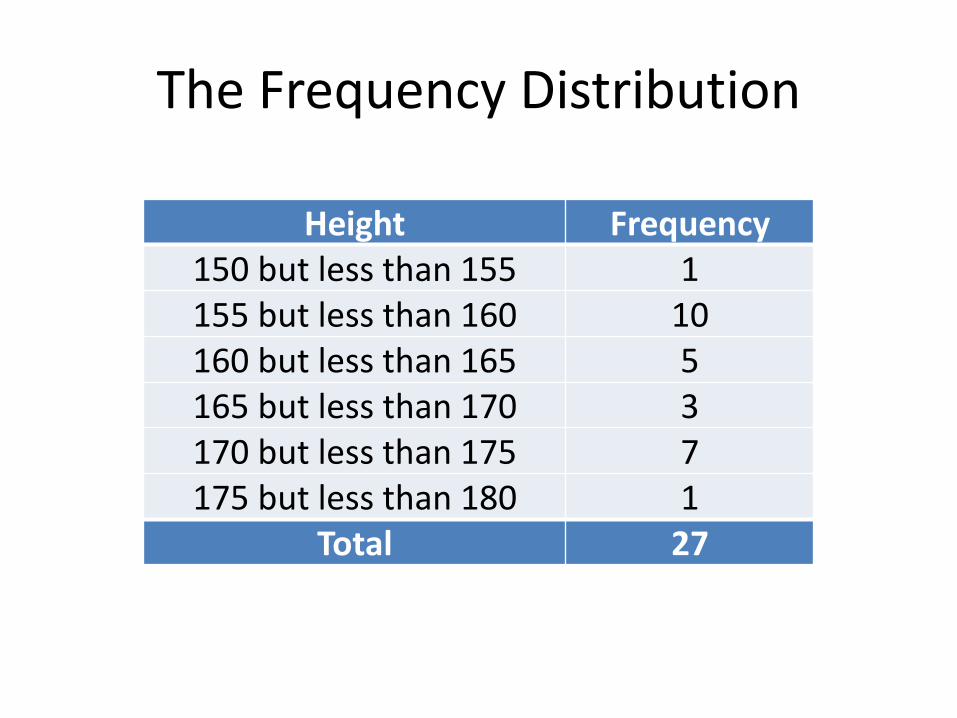
The Frequency Distribution
Height Frequency
150 but less than 155 1
155 but less than 160 10
160 but less than 165 5
165 but less than 170 3
170 but less than 175 7
175 but less than 180 1
Total 27
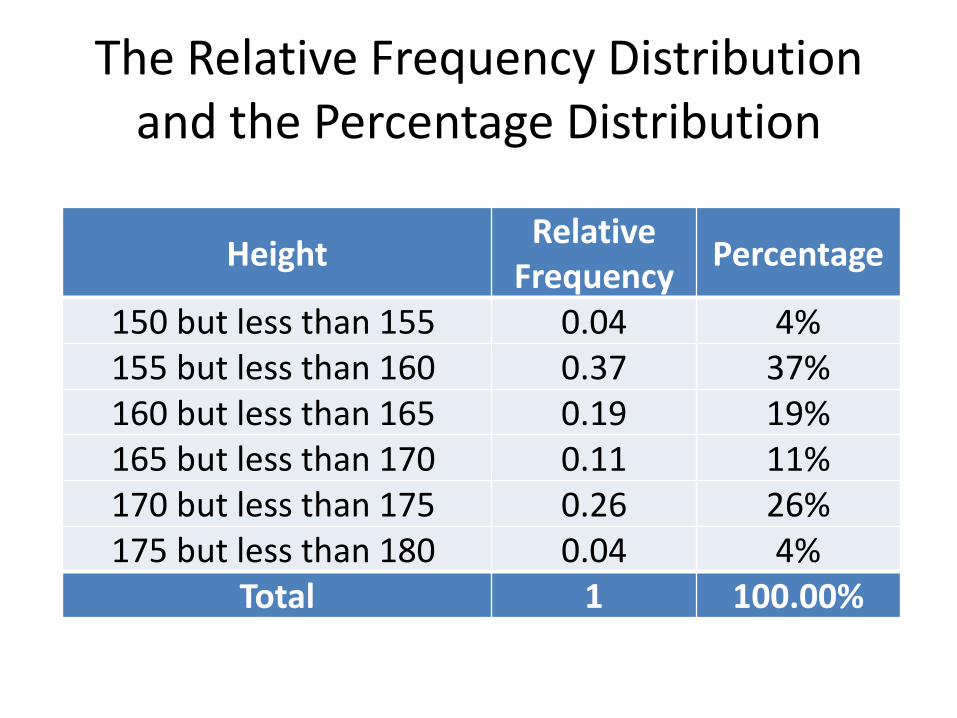
The Relative Frequency Distribution and the Percentage Distribution
Height Relative
Frequency Percentage
150 but less than 155 0.04 4%
155 but less than 160 0.37 37%
160 but less than 165 0.19 19%
165 but less than 170 0.11 11%
170 but less than 175 0.26 26%
175 but less than 180 0.04 4%
Total 1 100.00%
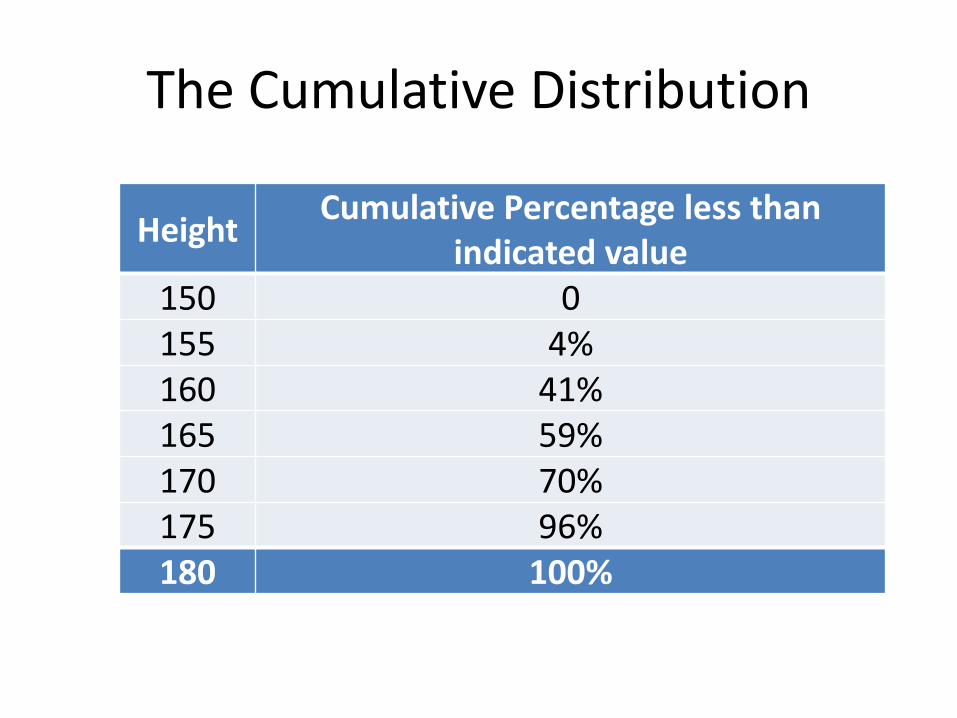
The Cumulative Distribution
Height Cumulative Percentage less than
indicated value
150 0
155 4%
160 41%
165 59%
170 70%
175 96%
180 100%

EXCERCISE
2.9
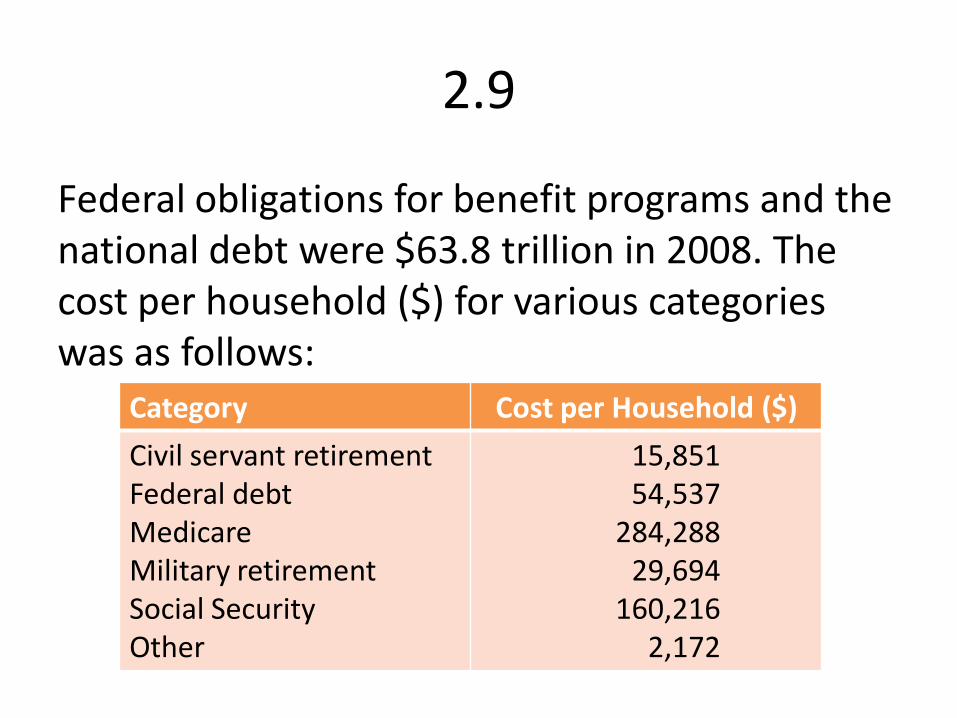
Federal obligations for benefit programs and the national debt were $63.8 trillion in 2008. The cost per household ($) for various categories was as follows:
Category Cost per Household ($)
Civil servant retirement Federal debt Medicare Military retirement Social Security Other
15,851 54,537 284,288 29,694 160,216 2,172
2.9
a. Compute the percentage of values in each category.
b. What conclusions can you reach concerning the benefit programs?
2.10
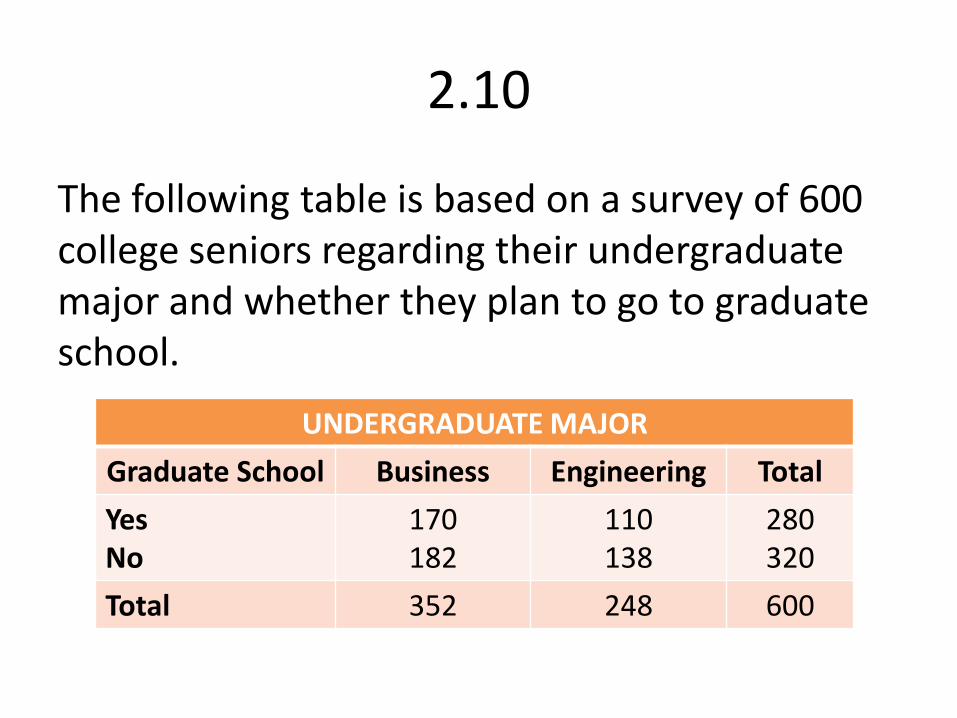
The following table is based on a survey of 600 college seniors regarding their undergraduate major and whether they plan to go to graduate school.
UNDERGRADUATE MAJOR
Graduate School Business Engineering Total
Yes No
170 182
110 138
280 320
Total 352 248 600
2.10
a. Construct contingency table based on total percentages, row percentages, and column percentages.
b. What conclusions can you draw from these analyses?
2.17
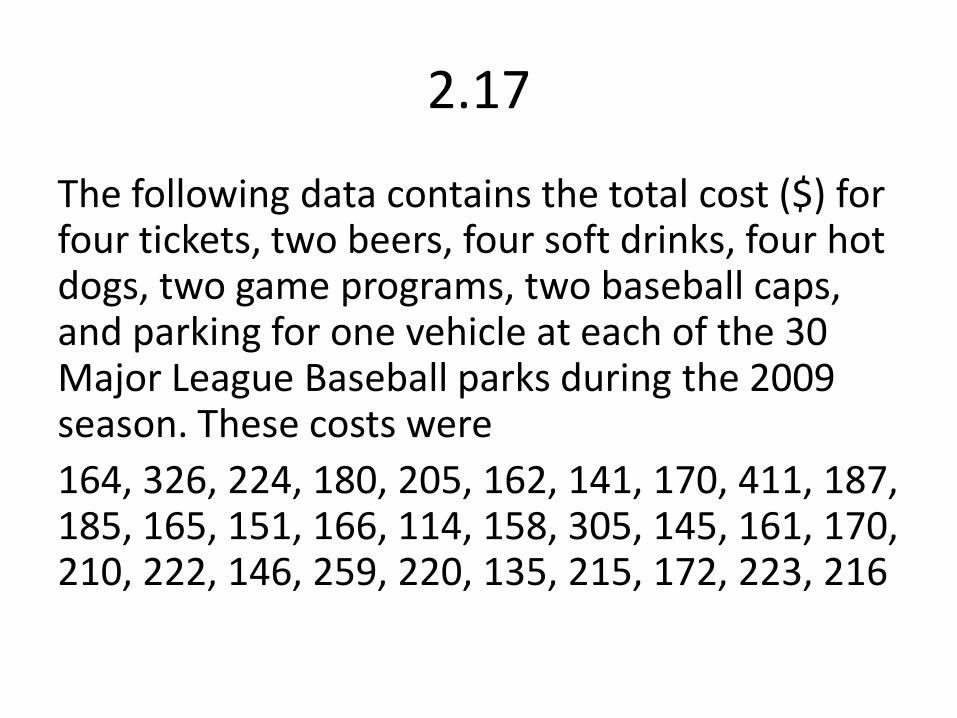
The following data contains the total cost ($) for four tickets, two beers, four soft drinks, four hot dogs, two game programs, two baseball caps, and parking for one vehicle at each of the 30 Major League Baseball parks during the 2009 season. These costs were
164, 326, 224, 180, 205, 162, 141, 170, 411, 187, 185, 165, 151, 166, 114, 158, 305, 145, 161, 170, 210, 222, 146, 259, 220, 135, 215, 172, 223, 216
2.17
a. Organize these costs as an ordered array.
b. Construct a frequency distribution and a percentage distribution for these costs.
c. Around which class grouping, if any, are the costs of attending a baseball game concentrated? Explain.
2.21
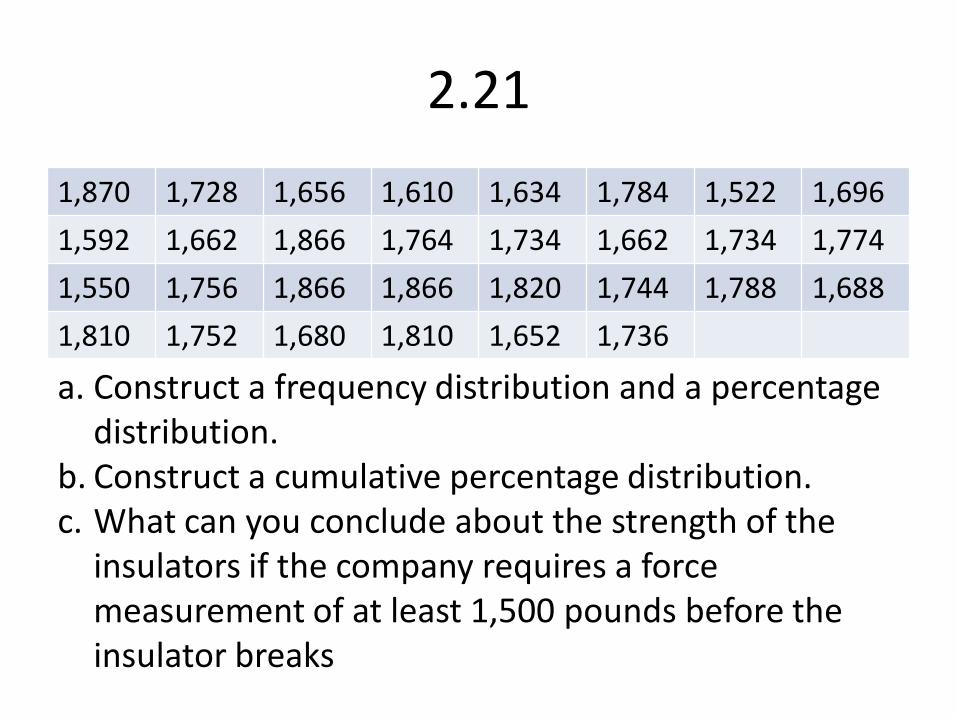
The manufacturing company is produces electric insulators. If the insulators break when in use, a short circuit is likely to occur. To test the strength of the insulators, destructive testing in high-powered labs is carried out to determine how much force is required to break the insulators. Force is measured by observing how many pound must be applied to the insulator before in breaks. Force measurements are collected from a sample of 30 insulators and shown here:
2.21
1,870 1,728 1,656 1,610 1,634 1,784 1,522 1,696
1,592 1,662 1,866 1,764 1,734 1,662 1,734 1,774
1,550 1,756 1,866 1,866 1,820 1,744 1,788 1,688
1,810 1,752 1,680 1,810 1,652 1,736
a. Construct a frequency distribution and a percentage distribution.
b. Construct a cumulative percentage distribution. c. What can you conclude about the strength of the
insulators if the company requires a force measurement of at least 1,500 pounds before the insulator breaks

THANK YOU