“status and challenges for desalination
TRANSCRIPT

“Status and Challenges for Desalination in the United States”
by Andrew L. Shea
USA Development Director Acciona Agua Corporation
Japan - U.S. Joint Conference On Drinking Water Quality
Management and Wastewater Control March 4, 2009
Introduction Reliable sources of clean water are fundamental to a sustainable future in the United States, and yet many water utilities serving major populations centers in water scarce regions delay critical investment in diversified water resources. As local climates change, populations grow, and source water quality slowly degrades, desalination of brackish water and seawater becomes an attractive source of “new” water to meet anticipated industrial, commercial, and municipal supply needs. Given the potentially limitless opportunity for desalination to mechanically transform vast amounts of ocean and inland brackish water bodies into usable potable and ultrapure water, we must ask ourselves why desalination in the United States has not kept pace with the advance of desalination technology around the world. This article and associated presentation looks at the current status of desalination in the US in comparison to advances in such countries as Spain and discusses the institutional barriers and challenges which limit desalination development and implementation in this country. Historical Perspective In the US, we revere the technical works of Drs. Srinivasa Sourirajan and Sydney Loeb for their early stage development of reverse osmosis (RO) membranes at UCLA in 1959, the deployment of the RO membrane in San Diego’s General Atomic Laboratories in the 1960’s, and the earliest applications of RO technology on brackish waters in Southern Florida (WDR Dec. 15, 2008); however, the longest standing full-scale commercial applications of seawater RO (SWRO) date back more than 40 years to Spain’s Canary Islands and along the Mediterranean coastal communities. Now in its their third generation of RO membranes, several of these SWRO plants have become the workhorse of potable water supply serving 100% of the resident and tourist population of the popular Canary Islands, while multiple large-scale facilities in the 30 to 60 mgd (110 to 220 million m3/d) size range populate the Spanish coastline . And yet in the US, we are only just starting to see our first large-scale seawater and brackish water plants come online. How did we get so far behind? Global Perspective: Capacity increases in Spain versus the United States Global desalination capacity has been increasing exponentially since the early 1960’s to its current production of 16,800 mgd (63.6 million m3/d), of which 14,000 MGD (53.0 million m3/d) has been commissioned and is currently operational (WDR Jan. 5, 2009). This capacity includes broad categories for seawater and brackish water desalination
-1-

plants serving municipal, commercial, industrial, agricultural, power, military, and demonstration applications. According to the 21st edition of the IDA Worldwide Desalting Plant Inventory, the contracted desalination capacity has been growing at a compounded annual growth rate of 16.8 percent since 1997. During 2007 alone, contracted capacity grew 24.5 percent over 2006 for a total of 1,770 MGD (6.7 million m3/d). With a total of 13,869 plants reported for 2008 (WDR, Jan. 5, 2009), the total contracted global desalination capacity is predominantly RO (59%) with thermal desalination (36%), EDR (4%), and other (1%) making up the balance. While almost half (47%) of the current online global desalination capacity is located in the Middle East and predominantly thermal desalination, we see some of the largest forecasted capacity in the US, Spain, North Africa, and Australia being RO. (GWI, Desal Database Oct. 2006).
Spanish Supply Offsetting Interbasin Transfers Similar to Southern California, the regions of central and southern Spain are characterized as some of the driest areas in Europe, with the Spanish coastal plain receiving approximately 300 – 400 litres per cubic meter per year of rain (11 – 15 inches/year). In response to tourism and industrial demands, coastal water supplies have become heavily exploited with municipal demands often conflicting with agricultural interests. Since the Spanish government has not subsidized the interbasin transfer of Ebro River water from the north to the south, Spain has, out of shear necessity, become the largest producer of SWRO desalination within Europe, the Middle East, and Asia. As reported in 2006 by MIT’s Technology Review, Spain has established itself as the pioneer in the use of RO with more than 700 desalination facilities producing approximately 534 mgd (2 billion m3/d) for approximately 8 million inhabitants. Additionally, Spain has been on the technology forefront in the implementation of new energy recovery devices in RO facilities as well as the integration of wind power systems driving offshore desalination. From a recent accounting in the DesalData.com database for Spain, we see the above figures updated for 2009 with 51 projects in the planning or construction stage comprising 698 mgd ( 2.642 billion m3/d) and 737 projects online or presumed online producing 1019 mgd (3.857 billion m3/d) of capacity (DesalData.com, Jan, 2009) . While public-private partnerships using the design-build-operate delivery method have been the predominant procurement method in Spain, there is still a strong nationwide policy position taken by the Spanish Central Government in favor of financing major water infrastructure projects with either public or quasi-public ownership. Correspondingly, local governments have been responsible for determining water tariffs in support of desalination development to protect local water supplies and reflect the higher cost of reliability and delivered water quality. In just the last two years, eight large SWRO have been awarded in Spain to avert a coastal water crisis facing coastal communities. United States Catching Up In sharp contrast to Spain, the US has benefited from a strong federal presence and sponsorship of water conveyance and pipeline infrastructure along with direct and indirect subsidies of imported water: In the case of Florida, the US Army Corps of
-2-

Engineers has been responsible for the diversion of non-saline waters through the Florida Everglades for water supply to urban centers, while the Bureau of Reclamation and the Federal Government have dominated the Western States water supply with the control and allocation of the Colorado River Aqueduct and the interbasin transfer to Central Arizona and Southern California . As coastal and inland communities start to deplete water supplies and environmental restrictions limit the continued extraction of these resources in such places as California’s Central Valley or South Florida, we are starting to see a doubling of the US installed desalination capacity over the last decade. Whereas the installed capacity in 2005 for plants larger than 0.3 mgd was greater than 2000 units producing approximately 1,600 mgd (6 billion m3/d) of desalinated water, this capacity is still less than 0.5% of the total water use in the US (Wangnick/WDR 2005). From recent plant data produced from the GWI’s DesalData.com plant inventory for the US, we see a total of 1432 plants online or presumed online producing 2132 mgd (8.07 billion m3/d) with 47 plants in various stages of planning (811 mgd, 3.07 billion m3/d ) and 29 plants in construction ( 205 mgd, 779 million m3/d). For reference purposes, 797 plants have been decommissioned or presumed offline (252 mgd, 955 m3/d). Of the 2008 capacity, 11% is SWRO, 75% is brackish water, and 14% is industrial high purity water supply (DesalData.com, Jan, 2009). SWRO enjoys an approximate 10% increase per annum while Brackish RO escalates at 3-5 % and industrial/other increase at approximately 4%. Current Desalination Examples in the US A review of the most recent desalination installations for the US highlights the remediated Tampa Bay Seawater Desalination Facility in late 2007 (25 – 28 mgd/ 108 million m3/d) and El Paso (Texas) Water Utility’s Kay Bailey Hutchison brackish groundwater plant (27.5 mgd, 103 million m3/d) in August 2007. Presented in Appendix A are representative SWRO and brackish plants by region which characterize new capacity additions or plants in immediate planning stages. Seawater Desalination in California There are over a dozen projects in various stages of development throughout the State of California with medium-scale facilities (<1 mgd) serving smaller communities and large-scale facilities ( >10 mgd) serving major population centers such as the San Francisco Bay area, Monterey County, and Los Angeles through San Diego Counties.. Current projections anticipate at least 10 projects online and producing water by 2020, though permitting challenges may significantly lengthen this time horizon. There is strong support by State of California through the $50 million Proposition 50 grant program. Additionally, within the Metropolitan Water District of Southern California system serving 18 million people, MWD offers a $250 subsidy for qualified desalination projects (Yamada/AMTA 3/08). Even after mothballing its SWRO plant in 1992, the City of Santa Barbara has hired a consultant to evaluate the feasibility of reactivating the 6.7 MGD (25,360 m3/d) SWRO facility using its still–valid intake and discharge permits (WDR: July 21, 2008).
-3-

Texas Brackish Surface and Groundwater Desalination Texas has long benefited from the experience of desalting the brackish surface water within the Brazos River Basin at the 15.5 mgd (58,652 m3/d) Lake Granbury brackish desalination project as well as the 5 mgd (18,924 m3/d) Southmost brackish groundwater desalination plant in the Rio Grande Valley. Recently, the Texas State Water Development Board recommended funding a $28.2 million demonstration plant based on the success of its earlier pilot study in Brownsville. The 2.5 mgd (9,462 m3/d) demonstration project is the next step with the objective of constructing a 25 mgd (94,625 m3/d) SWRO facility (WDR December 8, 2008). The San Antonio 20 mgd (75,696 m3/d) brackish groundwater project still remains in the study phase pending final feasibility studies and resolution of ground water rights issues with neighboring counties. Florida Back on Track With Acciona Agua and American Water having remediated the 25-28 mgd (108,000 m3/d) Tampa Bay SWRO plan, the luster of SWRO has been restored to the state and to the US. A similar procurement for design-build-operate project is scheduled for the 17.5 mgd City of Hialeah brackish desalter using brackish groundwater from the Upper Floridian Aquifer. Separately, numerous studies are proposed in Palm Coast, Port St. Lucie, and the Tampa region for additional supply from brackish and SWRO desalination. Other Areas While much emphasis is placed on the coastal states of California, Texas, and Florida, we are starting to see requests for desalination and membrane separation projects from such places as New England as well as the inland Southwest. The 5 mgd Taunton River Desalination Plant in Brockton, Massachusetts was commissioned in 2007 and uses the changing salinity conditions of a tidal river to reduce energy costs and mitigate environmental impacts (WDR, March 31, 2008). Similarly, groundwater supplies in Rockland County are running short north of New York City, and United Water is exploring the possibility of a 7 mgd brackish water desalter near the Hudson River. Institutional Barriers to Development and Permitting Within California, the primary impediment to SWRO desalination development is clearly permitting, while available funding and limited developable land along the coast are a close second and third. The perception that desalination is a pro-supply option rather than demand-side or conservation-oriented option becomes problematic within certain communities which prefer to fully exhaust all conservation measures and water reuse opportunities before committing to desalination. This conflict runs the risk of significant shortfall of adequate water supply and may necessitate radical supply cutbacks to industry and commerce in the event of prolonged droughts. As large-scale SWRO plants primarily co-locate at existing coastal power plants with once-through cooling systems, we see certain members of the environmental community attacking desalination as a rationale for extending the life of the power generation stations along the California coast. Secondarily, there is a concern that “new” water from desalination may be growth inducing, a concept which must be fully presented and
-4-

evaluated within the context a project’s environmental impact reporting in relationship to available water resources and the local municipal land use approval processes. This concern over “built it and they will come” belies the fact that Southern California is already experiencing a million acre-foot per year shortfall due to drought and over allocation of the Colorado River. Seawater Desalination Permitting Issues - A Case Study For the Carlsbad Seawater Desalination Project, the only large-scale SWRO project to receive a California Coastal Commission Coastal Development Permit authorization as of this date, we see a number of important policy and administrative actions being taken by the State of California. In advance of regulations contemplated under California’s Green House Gas (GHG) legislation - AB 32, the Global Warming Solutions Act, the State Lands Commission has required that the 50 mgd Carlsbad project be “carbon neutral” with offsets for the net power required to produce potable water over that which the Metropolitan Water District of Southern California would typically consume to transport water through the Central Valley, over the Tehachapi’s, and into Southern California. While SWRO is a more energy intensive than conventional treatment, the power consumed for desalination is incrementally more than conventional surface water supplies with conveyance by approximately 20 – 30%. A cogent discussion of the basis for air offsets and mitigation can be found at on the California Coastal Commission’s website for the project’s permitting (CCC August 8, 2009). Similarly, the State Lands Commission has stated their acceptance of the air offsets and wetlands mitigation process (SLC, August 22). A detailed explanation of the portfolio of alternative technologies and measures, including CO2 sequestration in water production, LEED green building design, and energy recovery devices under a Carbon Action Plan is presented in the International Desalination Association’s Quarterly Report (IDA, Nov./Dev. 2008). As the Clean Water Act Section 316b once-through cooling permitting for power and industrial plants goes to the Supreme Court with subsequent modification by the Obama Administration, we can expect the State of California to set a trend: the SLC and CCC have endeavored to seek mitigation measures from the Carlsbad developer for potential entrainment and impingement by the power plant for cooling water flows associated with the processing of seawater. In this permitting case, the developer has voluntarily committed to obtaining or remediating 57 acres of new or manufactured wetlands to nurture desired marine species and offset the indirect impacts on the marine environment. For new SWRO facilities not co-locating at coastal power plants, either newly permitted open ocean intakes with wedge wire screens or beach filtration gallery systems similar to those in Spain and Japan will be needed to avoid these requirements. Technical Challenges in the US Separate from permitting battles, we see numerous technical challenges facing the desalination vendor, engineering, constructor, and financing community in the US. In order to stay in close proximity to the urban demand centers and minimize pipeline conveyance infrastructure, facility siting will need to take into account increasingly compromised seawater and brackish source water quality from storm water runoff, industrial and municipal discharges, and limited access to outfall infrastructure. As such,
-5-

biofouling of membranes and the impact of red tides will be a constant challenge to technologists and plant operators. As more pre-treatment is required, more chemicals and electric power will similarly be required to handle suspended solids and organic material, a direction inconsistent with achieving the Holy Grail of the SWRO and brackish community – i.e., reduced power consumption from greater efficiency. Additionally, with the push for “greening” desalination projects, we can see that solar photovoltaic power for direct power supply at coastal desalination facilities may be problematic as developable land becomes limited. We also anticipate stakeholders raising concerns over aesthetics and visual impacts of solar panels, coastal wind farms, and power plants using air-cooled condensers instead of once-through cooling systems. Desalination Cost as a Stumbling Block The average family in the US will spend close to a $1000 per year in sodas and beverages and pay more than $100 per month on TV cable/internet service, yet Americans squawk at the thought of paying $50 - $100 per month for their monthly water and wastewater services. Taking into account salinity, source water temperature, and cost of power, plant size and intake/outfall instrastrure, SWRO desalination typically costs $900 - $1500 per acre-foot in current dollars ($2.80 – $4.60/kgal). Typically, brackish water desalination will be half to two-thirds the cost of SWRO and comparable with conservation and conventional surface water supplies. A more exhaustive discussion can be found in the National Research Council’s Committee on Advancing Desalination Technology report, Desalination: A National Perspective. Additionally, the Water Desalination Report confirms recent SWRO prices in the $2.50 – 4.00/kgal range ($0.66/m3 - $1.05/m3) for SWRO facilities internationally (WDR Sept 15, 2008). As the cost of desalination becomes the marginal or “avoided cost” in power utility parlance, there becomes a clearer picture of the fully burdened cost of water and the opportunity to turn down the facilities when not needed on a daily or seasonal basis. Commitment to Research in the US While large federal dollars in support of US desalination have been elusive in the past decade, we see that members of the academic, regulatory, engineering, water utility and environmental stakeholder community have created a comprehensive and valuable road map for desalination research. Within the highly acclaimed National Research Council’s report, Desalination: A National Perspective, we see a comprehensive summary of research priorities for intake evaluations, concentrate management, entrainment/ impingement issues, water quality constituent impacts, energy efficiency, and methods for cost reduction. A summary of the report’s A Strategic Desalination Research Agenda is presented in Appendix B. Concluding Comments As low cost alternatives to seawater and brackish water desalination diminish in the US, we will see desalination properly valued not just for its timely supply and delivery, but also for its water quality meeting and exceeding primary and secondary health standards. We can also anticipate a continued struggle to accept desalination into the portfolio of supply options until stakeholders realize that proper pricing of treated and desalinated water complements water conservation and water reuse strategies. While we should not
-6-

expect US cities to completely embrace desalination in the near term, we can expect seawater desalination to become 10% to 20% of regional supplies in such places as Tampa or El Paso. As with incrementally more expensive “green power” supply options using solar and wind, we can expect the marginally more expensive desalination supply costs to be amortized across a larger supply base using either direct subsidy from regional suppliers and or directly reflected in the rate payers bills. Looking forward, we should anticipate some nominal improvements in RO technology and energy efficiency through energy recovery while also seeing lower delivered costs through alternative procurement delivery methods. Unfortunately, many of those potential savings will be over shadowed by increasing costs of process equipment, stainless steel, labor and energy costs well into the future. As good planners and stewards of the environment, we should continue to strive for properly integrated desalination facilities to complement existing resources and avoid the crisis management decision making which has plagued our water infrastructure industry in the past.
References Water Desalination Report (www.waterdesalreport.com) December 15, 2008, Media Analytics. Published in cooperation with Global Water Intelligence.
The 2006 IDA Worldwide Desalination Plants Inventory Report, October 2006. Garber, Cynthia “Desalination in Spain,” Technology Review, MIT Publishers, (http://www.technologyreview.com/microsites/spain/water/docs/Spain_desalination.pdf ) DesalData.com as provided by the WDR and GWI publications. www.DesalData.com (January, 2009) Yamada, Robert/San Diego County Water Authority, “Overview of Desalination Planning and Permitting in California,” AMTA Technology Transfer Workshop, Santa Rosa, CA – March 13, 2008 ( http://www.membranes-amta.org ) California Coastal Commission, August 6, 2008, Board Hearing, Oceanside CA Agenda Item: http://documents.coastal.ca.gov/reports/2008/8/W5a-8-2008.pdf California State Lands Commission, August 22, 2008 Board Hearing, Los Angeles, CA. Item:http://archives.slc.ca.gov/Meeting_Summaries/2008_Documents/08-22-08/ITEMS_AND_EXHIBITS/R55.pdf Voutchkov, Voutchkov, “Carlsbad Project Plan for Green SWRO,”, The International Desalination & Water Reuse Quarterly, November/December 2008, Vol. 18/No. 3 pp.30-36.( http://www.idadesal.org/t-dwr.aspx ) Committee on Advancing Desalination Technology, National Research Council, “Desalination: A National Perspective” (2008) (http://www.nap.edu/catalog/12184.html)
-7-

Appendix A
Representative Planned or Installed SWRO and Brackish Projects in the US Proposing Entity Location Water Type Cap. mgd California Marin Municipal WD SF Bay Area SWRO 5-15 SF Bay Area Regional SF Bay Area Brackish/SWRO 71 Santa Cruz/Soquel Creek Santa Cruz SWRO 2.5 California American Monterey SWRO 10 Sand City Monterey SWRO 0.3 City of Santa Barbara Barbara County SWRO 5-10 Los Angeles DWP Los Angeles SWRO 25 West Basin MWD Los Angeles SWRO 20 Long Beach Water Dept Haynes P. Plant Nano/Nano 9 Poseidon Huntington Beach SWRO 50 MWD Orange County Dana Point SWRO 15 Poseidon Carlsbad/ Encina SWRO 50 Texas El Paso Utilities/Fort Bliss El Paso Brackish RO 27.4 Brownsville PUB Brownsville SWRO 2.5 / 25 San Antonio Water Syst. San Antonio Brackish RO 20 Brazos River Authority Lake Granbury Surface BRO 15.5 Florida Tampa Bay Water Big Bend/Tampa SWRO 25 – 28 City of Tarpon Springs Tarpon Springs Brackish RO 6 City of Hialeah/Miami Miami Dade Cty. Brackish RO 17.5 Coquina Coast Palm Coast SWRO 50 Other Areas United Water of NY Rocklin County Brackish RO 4 Taunton Mass Taunton River Brackish RO 5 Source: CA State Lands Commission, Exhibit D, August 22, 2008 DesalData.com / WDR/GWI
-8-
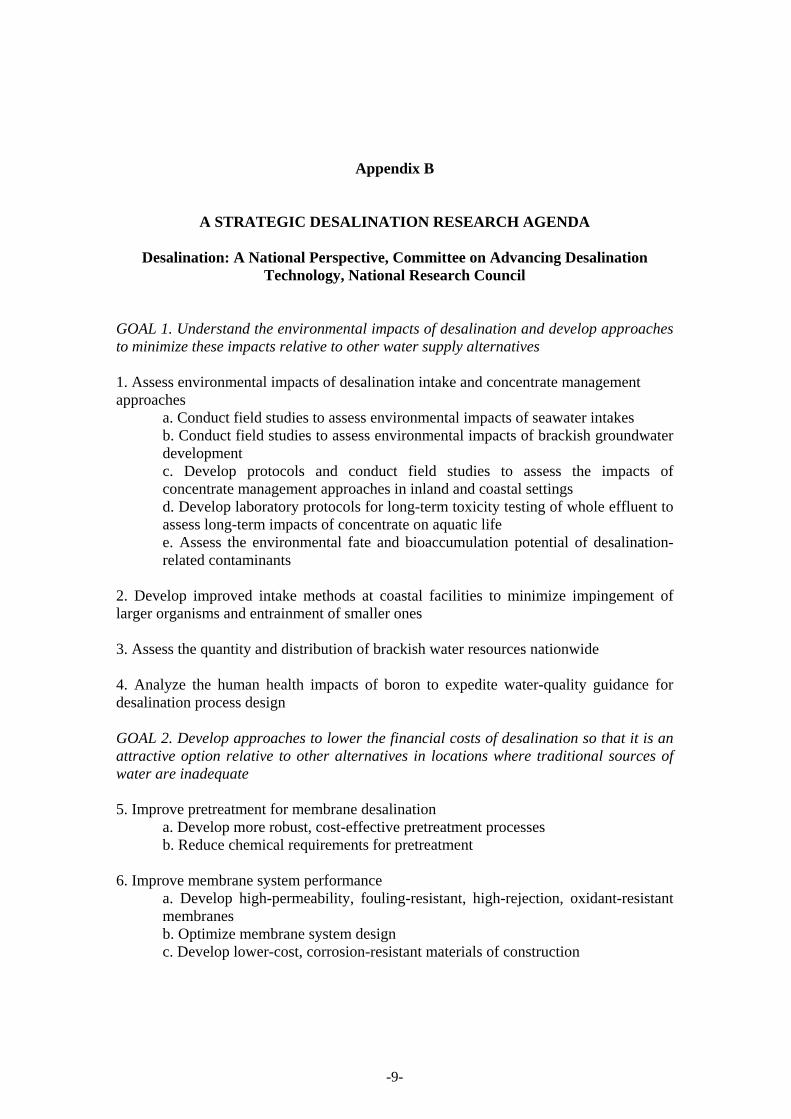
Appendix B
A STRATEGIC DESALINATION RESEARCH AGENDA
Desalination: A National Perspective, Committee on Advancing Desalination Technology, National Research Council
GOAL 1. Understand the environmental impacts of desalination and develop approaches to minimize these impacts relative to other water supply alternatives 1. Assess environmental impacts of desalination intake and concentrate management approaches
a. Conduct field studies to assess environmental impacts of seawater intakes b. Conduct field studies to assess environmental impacts of brackish groundwater development c. Develop protocols and conduct field studies to assess the impacts of concentrate management approaches in inland and coastal settings d. Develop laboratory protocols for long-term toxicity testing of whole effluent to assess long-term impacts of concentrate on aquatic life e. Assess the environmental fate and bioaccumulation potential of desalination-related contaminants
2. Develop improved intake methods at coastal facilities to minimize impingement of larger organisms and entrainment of smaller ones 3. Assess the quantity and distribution of brackish water resources nationwide 4. Analyze the human health impacts of boron to expedite water-quality guidance for desalination process design GOAL 2. Develop approaches to lower the financial costs of desalination so that it is an attractive option relative to other alternatives in locations where traditional sources of water are inadequate 5. Improve pretreatment for membrane desalination
a. Develop more robust, cost-effective pretreatment processes b. Reduce chemical requirements for pretreatment
6. Improve membrane system performance a. Develop high-permeability, fouling-resistant, high-rejection, oxidant-resistant membranes b. Optimize membrane system design c. Develop lower-cost, corrosion-resistant materials of construction
-9-

d. Develop ion-selective processes for brackish water e. Develop hybrid desalination processes to increase recovery
7. Improve existing desalination approaches to reduce primary energy use a. Develop improved energy recovery technologies and techniques for desalination b. Research configurations and applications for desalination to utilize waste heat c. Understand the impact of energy pricing on desalination technology over time d. Investigate approaches for integrating renewable energy with desalination
8. Develop novel approaches and/or processes to desalinate water in a way that reduces primary energy use GOAL 1 and 2 Cross Cuts. 9. Develop cost-effective approaches for concentrate management that minimize potential environmental impacts Source: Desalination: A National Perspective, Committee on Advancing Desalination Technology, National Research Council, ISBN: 0-309-11924-3, 316 pages, (2008) http://www.nap.edu/catalog/12184.html
-10-

Appendix C Andrew L. Shea serves as the USA Development Director for Acciona Agua, a world leader in seawater desalination and water purification. He brings twenty-five years experience in business and project development of water and power infrastructure projects in North and South America. His primary area of focus is on large-scale seawater and brackish water projects in California, Texas, and Florida. Previously, Mr. Shea was Vice President - Development for Poseidon Resources developing desalination and wastewater reclamation projects in California and Texas. Mr. Shea was also a Regional Vice President of Business Development for United Water Resources-Lyonnaise des Eaux as well as a Venture Management Director for LG&E Power in the US and Latin America. Mr. Shea started his career in GE’s Power Systems Venture Operation and Cogeneration Applications Department. He holds a Bachelor's degree in Human Biology and a Master's degree in Civil Engineering, both from Stanford University. ([email protected] ) With over 38,000 employees worldwide, Acciona is a publicly-traded international firm based in Spain with a corporate commitment to sustainable development and renewable energy. With its 2,000 employees, Acciona Agua constructs, manages and operates desalination plants and services which meet the water supply needs of more than 50 million people in 20 countries across 5 continents. Acciona Agua has designed and delivered nearly 70 seawater and brackish water reverse osmosis plants with a total capacity of 420 mgd (1,600MLD) and a portfolio which includes the largest SWRO plant in Spain (63 mgd, 240MLD) and the largest brackish RO pant in the UK (43 mgd,150MLD). With its US partners at American Water, Acciona Agua has successfully remediated and now operates the 25 mgd (108 MLD) Tampa Bay Seawater Desalination Facility. From the first desalination plant in Las Palmas, Canary Islands to the solar panel supplied Torrevieja facility along the Mediterranean, Acciona Agua’s record of successful delivery of reverse osmosis desalination facilities spans three decades. (www.acciona-agua.com)
-11-

Status and Challenges for Desalination
in the United States
Andrew L. SheaUSA Development DirectorMarch 4, 2008Japan - U.S. Joint Conference On Drinking Water QualityManagement and Wastewater Control
Topics for Discussion
• US Desalination Historical Perspective
• Global and US Desal Capacity
• A Tale of Two Countries- US and Spain
• Representative Existing and New Projects
• Institutional Barriers to Development
• Stakeholder Commitment to Research
• Concluding Comments
-12-

• Design and build water treatment plantsDesalination by reverse osmosisDrinking water treatment plantWastewater treatment plantSludge treatment plant
• Operation and maintenance• Integrated water supply & sanitation services
ACCIONA Agua
70 RO desalination plants1.6 million m3/d fresh water
230 wastewater treatment plants100 potable water treatment plants
100 treatment plants operated + maintained by acciona agua30 cities/towns managed by acciona aguaover 11 million people served
US Desalination Historical Perspective
• Federal Office of Saline Water Demonstrates 1 MGD Thermal Desal in Freeport, TX - 1960
• Plant Operated at Dow Chemical until Critical Maintenance Issues Occurred
• Program Confirmed Role of Public and Private Sector using MSF Thermal Desal Technology
Source: Saline Water Conversion/DOI
-13-

US Desalination Historical Perspective
• RO Membrane invented at UCLA - 1959
• RO Membranes Commercialized at General Atomic Labs in San Diego – 1960’s
• Early Use on Brackish Waters in South Florida
• Primary RO market was DOD and Industry
How Did the US Get So Far Behind?
WDR 15 Dec. 08
Global Desalination Capacity
63.6 m3/d - 16,800 mgd
WDR vol. 44. no. 33 - Sept 08
More than Doubled in the Last 10 years!
-14-

Global Desalination Capacity by Technology
WDR vol.44. no. 33 - Sept 08
A majority of recent capacity additions have been RO systems, including hybrid RO/Thermal systems
Worldwide Installed and Forecasted Capacity by Significant Country
2006 2010 2025
2,65,2
14,5
2006 2010 2025
5,6
11,6
56,8
2006 2010 2025
1,13,5
7,5
2006 2010 20250,7
2,6
8,2
2006 2010 2025
2,1
4,2
6,6
USAAlgeria
Spain
MiddleEast
Australia
China??
India??
(capacity in million m3/day)
Source: GWI Desal Database 10/06
-15-

Hydrologic Profile of Spain
Available water reserves overexploted in Spain and in US
Source: Global Water Intelligence 10/06
Use of Water Reserves in Different Regions
A Tale of Two Countries - Hydrologic Profile of Spain
Spain is one of the driest European Countries
Litres / m2
<300300-400400-600600-800>800
Source: INM Spain
Costal Zones Receive 11 –15 inches per year of Rain
-16-

A Tale of Two Countries – Hydraulic Profile of the US
Spanish Desalination Market – General Overview
• Spain is one of the largest users of SWRO in the world
• First desalination plant commissioned more than 40 years ago in Canary Islands
• Demographic concentration in coastal areas and tourism have contributed to RO market growth with a large resistance to interbasin water transfers
• More than 50 projects in the planning or construction stage with 700 mgd ( 2.6 billion m3/d) proposed
• Almost 740 projects online or presumed online producing 1020 mgd (3.8 billion m3/d) of desal capacity. (www.DesalData.com )
• Spain has become a pioneer in the use of Reverse Osmosis and in the implementation of new energy recovery technologies in RO facilities
• Most contracts awarded through Design-Build-Operate procurement approach
• Central Government responsible for establishing country’s water policy and financing major water infrastructure projects but local governments responsible for determining water tariffs
-17-

Spanish Desalination Market – A Doubling of Capacity
2008 Planning and construction stage - 700 mgd (2.6 billion m3/d)
Online Capacity 1019 mgd
(3.8 billion m3/d)
MIT Technology Review 2006
US Desalination Market – General Overview
• Large Federal Government presence in water allocation and pricing
• Strong focus on low cost water withdrawals and imported water supply
• 47 projects in the planning stage with 811 mgd ( 3.07 billion m3/d) proposed
• 29 plants in construction with 205 mgd (779 million m3/d)
• 1432 plants online or presumed online with 2132 mgd (8.07 billion) production
• Of the 2008 capacity, 11% is SWRO, 75% is brackish water, and 14% is industrial high purity water supply.
• SWRO has increased 10% per annum while Brackish RO increased 3-5% and Industrial/other has increased 4%
• Most contracts awarded through Design-Bid-Build procurement approach rather than DBO
Source: www.DesalData.com/WDR
-18-

Cumulative U.S. Desalting Capacity Has Doubled in Last Decade
- 47 projects in the planning stage with 811 mgd (3.07 billion m3/d) proposed
2008 Data
- 29 plants in construction with 205 mgd (779 million m3/d) under contract
- 1432 plants online with 2132 mgd (8.07 billion) production
Source: GWI 10/06 and DesalData 1/09
Proposing Entity Location Water Type Cap. mgd
California
Marin Municipal WD SF Bay Area SWRO 5-15
SF Bay Area Regional SF Bay Area Brackish/SWRO 71
Santa Cruz/Soquel Creek Santa Cruz SWRO 2.5
California American Monterey SWRO 10
Sand City Monterey SWRO 0.3
City of Santa Barbara Barbara County SWRO 5-10
Los Angeles DWP Los Angeles SWRO 25
West Basin MWD Los Angeles SWRO 20
Long Beach Water Dept Haynes P. Plant Nano/Nano 9
Poseidon Huntington Beach SWRO 50
MWD Orange County Dana Point SWRO 15
Poseidon Carlsbad/ Encina SWRO 50
Representative Existing and Proposed US Desal Projects
-19-

Representative Existing and Proposed US Desal Projects
Texas
El Paso Utilities/Fort Bliss El Paso Brackish RO 27.4
Brownsville PUB Brownsville SWRO 2.5 / 25
San Antonio Water Siystem. San Antonio Brackish RO 20
Brazos River Authority Lake Granbury Surface BRO 15.5
Florida
Tampa Bay Water Big Bend/Tampa SWRO 25 – 28
City of Tarpon Springs Tarpon Springs Brackish RO 6
City of Hialeah/Miami Miami Dade County. Brackish RO 17.5
Coquina Coast Palm Coast SWRO 50
Other Areas
United Water of NY Rocklin County Brackish RO 4
Taunton Mass Taunton River Brackish RO 5
Representative BRO and SWRO Projects
ProposedProjects
Florida leads existing capacity over CA, AZ, and TX
California proposes 400 – 500 mgd from 20 Projects
-20-

Proposed Seawater Desalination Projects in CA
Yamada/AMTA 3/08
CA - Bay Area Regional Desalination Project
• Joint effort among:– East Bay Municipal Utility
District– San Francisco Public Utilities – Commission. Contra Costa– WD Santa Clara Valley WD
• Pilot Study at Mallard Slough– 100 gpm– Testing to have started July
2008• Feasibility Study leading to
permitting of 71 mgd (270,000 m3/d BRO/SWRO facility
• Expected construction in 2012
-21-

CA - Moss Landing Seawater Desalination Project
• Coastal Water Project need based on groundwater overdrafts off Carmel River
• Cal-Am Water developing 12 mgd facility at Moss Landing Power Plant site
• Solves SWRCB 95-10 Order to Reduce Carmel River Withdrawals
• Pilot study using existing power plant cooling water system
• CPUC regulated permitting process for water utility
• Allows for River Restoration of 11370 AFY
CA - MWDOC – Dana Point
• State Sponsored Study found 15 mgd capacity is feasible
• Slant well subsurface intake
• Supply ~13% of South Orange County demands
• CEQA/NEPA and permitting expected to begin this year
• Project anticipated online date of 2015
-22-

CA - Camp Pendleton/San Diego County
• Northern San Diego County U.S. Marine Corps Base Camp Pendleton
• Possible Subsurface or open intake options
• Potential integration with• existing Camp Pendleton
utilities• Proposed capacity
between 50 and 150 mgd (189 – 567,000 m3/d)
• Study completion in 2009
CA - Carlsbad Seawater Desalination Project
• 50 mgd (189,000 m3/d) desalination project being developed by Poseidon Resources at the Encina Power Station in Carlsbad
• Water purchase agreements with nine Water Authority member agencies
• Major Project Permits Completed Project – EIR certified– NPDES Discharge permit with
Regional Water Quality Control Board
– Coastal development permit with Coastal Commission approved w/ conditions and mitigation
– Lease amendment application approved by State Lands Commission with mitigation measures
• Lawsuits Pending by Surfrider and Planning & Conservation League challenging the Coastal Development Permit, NPDES Conditions
-23-

Brackish Groundwater Projects in CA
Yamada/AMTA 3/08
CA - Chino Basin Brackish Desalter
• JPA with seven agencies manages Chino Basin
• Total production of Chino Basin -134 mgd (507,000 m3/d)
• Chino I Desalter and Chino II Desalter produce 22 mgd (83,280 m3/d)
• Treatment process RO and ion exchange
• Expand production 22 mgd (83,280 m3/d) by 2015
• Regional Brine line to Ocean outfall in Orange County
-24-

TX - San Antonio BRO
• 20 mgd (75,700 m3/d) proposed capacity Brackish RO with well field and disposal
• Well testing from Wilcox Aquifer
• Feasibility Study 2008• RFQ/RFP in 2009• Supply to supplement
Edwards Aquifer and conservation
TX - El Paso Water Utilities/Ft. Bliss
• 27.5 mgd output from brackish Hueco Bolson
• Joint Fort Bliss strategic supply
• Increased recovery strategies to limit discharge to disposal wells
• 15.5 mgd (58,670 m3/d) permeate blended with 12 mgd (45,424 m3/d) new groundwater wells
• Complements water reuse and conservation program
• Integrated Community and R&D Center
-25-

TX - Brownsville Seawater Desalination
• One of three sites selected for feasibility studies Funded by TWDB and Brownsville PUB
• One acre plant site in Port of Brownsville -Ship channel intake
• Pilot plant Operated for 12 months with varied water conditions
• Current request for 2.5 mgd (9463 m3/d) demonstration at $29 million public funds
• Target 25 mgd (94,630 m3/d) full scale plant
FL - Tampa Seawater Desalination Facility
• 25 - 28 mgd (108 million m3/d) co-located at power plant
• 10% of regional supply• Remediated process
with long-term operations under DBO contract
• Total Environmental compliance in sensitive eco system
-26-

FL - City of Hialeah BRO
• 17.5 mgd brackish RO in 3 phases
• 3 DBO consortia selected for RFP Phase in 2009
• Groundwater wells, RO plant, Disposal wells in Miami-Dade County
• Pilot Testing by mid-2009
• Completion by end of 2011
MA - Taunton Brackish River Water Desal
• Initial withdrawal from the coastal basin to produce 5 mgd (18,927 m3/d), expandable to 10 mgd (37,854 m3/d)
• Plant process: ultra-filtration followed by reserve osmosis
• Tidal intake with 16 mile, 20 inch diameter transmission pipeline
• Entrainment and impingement control
• Discharge concentrate during high tides
-27-

Institutional Barriers to Desalination in the US
• Within California, the primary impediment is Permitting, Permitting, Permitting
• Project Development Phase Funding and Locating Developable Land are also Stumbling Blocks
• “New” Desal Water seen as Growth Inducing
• Large-scale Projects at Power Plant sites inherit Power Plant Baggage and CWA 316b entrainment and impingement issues
CA - Seawater Desalination Permitting Issues
• The 50 mgd Carlsbad Project has set a Precedent for most, if not all, California Coastal Desalination
• Carbon Footprint - The State Lands Commission has required the net power consumed to be “Carbon Neutral”
• CA Coastal Commission also requiring mitigation for potential impact on marine environment due to power plant once-through cooling system – CWA 316b issues
• Greenhouse Gas Mitigation– Lower energy consumption from better membranes and
Improved energy recovery devices– High efficiency pumps– Renewable energy sources - wind energy, solar– Carbon credits– Reforestation– CO2 Sequestration in Product Water– LEED “Green Building” Design
• Commitment to 57 acres of wetlands as Marine Mitigation
-28-

Commitment to Research
• Desalination stakeholder community has proposed a substantive road map for desalination research
• National Research Council’s report, Desalination – A National Perspective, delineates a summary research Agenda:– Intake and discharge evaluations– Concentrate management and disposal– Entrainment and impingement issues– Water Quality Constituent Impacts– Energy Efficiency/Energy Recovery– Methods for Cost Reduction
Concluding Remarks
• As low cost alternatives to seawater and brackish water desalination diminish in the US, we will see desalination properly valued –reflecting supply, delivery, and water quality.
• We can anticipate a continued struggle to accept desalination into the portfolio of supply options until stakeholders realize that proper pricing of treated and desalinated water complements water conservation and water reuse strategies.
• We can expect SWRO and Brackish RO to become 10% to 20% of the Regional Supply as desal starts to take hold in areas such as Tampa and in El Paso
-29-

Concluding Remarks
• Similar to incrementally more expensive “green power” supply options, we can expect the marginally more expensive desalination supply costs to be amortized across a larger supply base using either direct subsidy from regional suppliers and or directly reflected in user rates.
• We can anticipate nominal technical improvements offset by continued increases in materials, component, and energy costs
• As good planners, we should strive to properly integrate desalination to complement existing water resources and conservation rather than waiting for a crisis to make decisions
Where Can I Find More Desal Information?
• Water Desalination Report www.waterdesalreport.com• Global Water Intelligence www.globalwaterintel.com• AEDYR (Spanish Desalination and Water Reuse
Association) www.aedyr.com• IDA http://www.idadesal.org/t-dwr.aspx• AMTA www.membranes-amta.org• California Coastal Commission
http://documents.coastal.ca.gov/reports• California State Lands Commission,
http://archives.slc.ca.gov/• National Academies Press
– http://www.nap.edu/catalog.php?record_id=12184
-30-

Pioneers in development and sustainability
-31-