status of important native chinook salmon stocks in southeast alaska
TRANSCRIPT
VOLUME 27 AFS-4 1-13
STATE OF ALASKA
Bill Sheffield, Governor
Annual Performance Report for
A STUDY OF CHINOOK SALMON IN SOUTHEAST ALASKA
bY Paul D. Kissner
and Dennis J. Hubartt
ALASKA DEPARTMENT OF FISH AND GAME Don W. Collinsworth, Commissioner
DIVISION OF SPORT FISH E. Richard Logan, Director
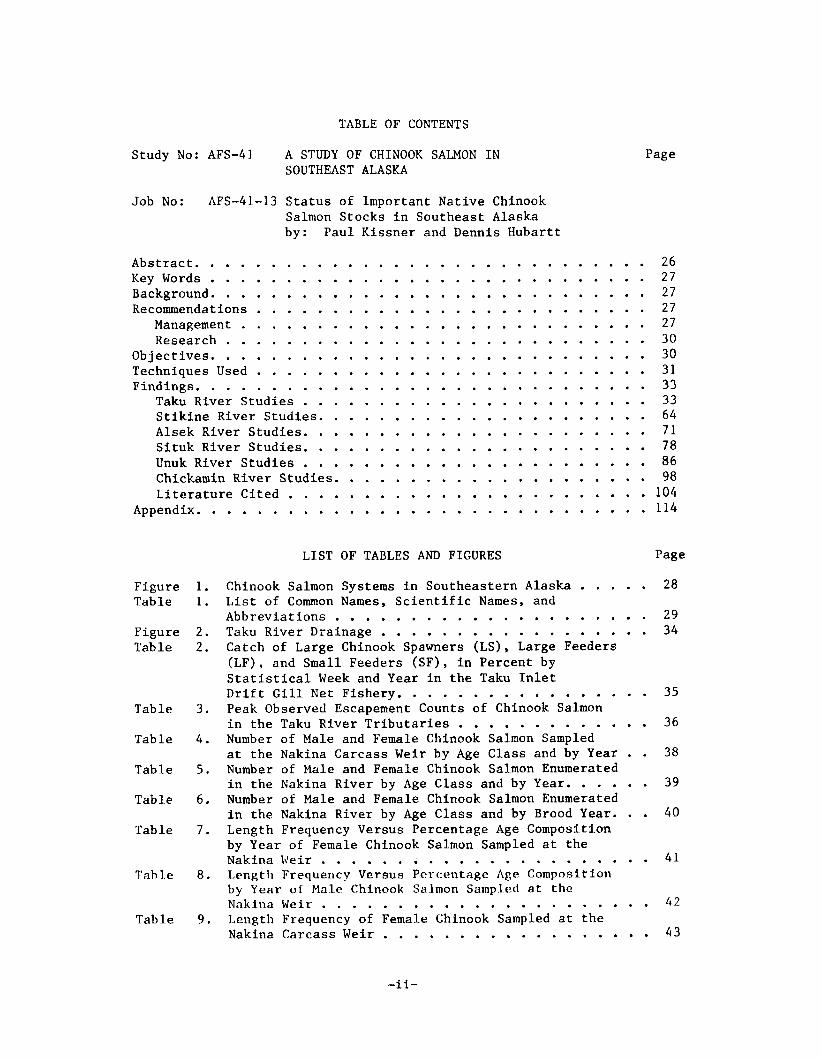
TABLE OF CONTENTS
Study NO: AFS-41 A STUDY OF CHINOOK SALMON IN PageSOUTHEAST ALASKA
Job No: AFS-41-13 Status of Important Native Chinook Salmon Stocks in Southeast Alaska by: Paul Kissner and Dennis Ihbartt
Abstract. . . . . . . . . . . . . . . . . . . . . . . . . . . . . . 26 Key Words . . . . . . . . . . . . . . . . . . . . . . . . . . . . . 27 Background. . . . . . . . . . . . . . . . . . . . . . . . . . . . . 27 Recommendations . . . . . . . . . . . . . . . . . . . . . . . . . . 27
Management . . . . . . . . . . . . . . . . . . . . . . . . . . . 27 Research . . . . . . . . . . . . . . . . . . . . . . . . . . . . 30
Objectives. . . . . . . . . . . . . . . . . . . . . . . . . . . . . 30 Techniques Used . . . . . . . . . . . . . . . . . . . . . . . . . . 31 Findings. . . . . . . . . . . . . . . . . . . . . . . . . . . . . . 33
Taku River Studies . . . . . . . . . . . . . . . . . . . . . . . 33 Stikine River Studies . . . . . . . . . . . . . . . . . . . . . . 64 Alsek River Studies . . . . . . . . . . . . . . . . . . . . . . . 71 Situk River Studies . . . . . . . . . . . . . . . . . . . . . . . 78 Unuk River Studies . . . . . . . . . . . . . . . . . . . . . . . a6 Chickamin River Studies . . . . . . . . . . . . . . . . . . . . . 98 Literature Cited . . . . . . . . . . . . . . . . . . . . . . . . 104
Appendix. . . . . . . . . . . . . . . . . . . . . . . . . . . . . . 114
LIST OF TABLES AND FIGURES Page
Figure 1. Chinook Salmon Systems in Southeastern Alaska . . . . . 28 Table 1. List of Common Names. Scientific Names. and
Abbreviations . . . . . . . . . . . . . . . . . . . . . 29 Figure 2. Taku River Drainage . . . . . . . . . . . . . . . . . . 34
Table 5 . Number of Male and Female Chinook Salmon Enumerated
Table 6. Number of Male and Female Chinook Salmon Enumerated
Table 7. Length Frequency Versus Percentage Age Composition
Table 2 . Catch of Large Chinook Spawners (LS). Large Feeders (LF). and Small Feeders (SF). in Percent by Statistical Week and Year in the Taku Inlet Drift Gill Net Fishery . . . . . . . . . . . . . . . . . 35
Table 3. Peak Observed Escapement Counts of Chinook Salmon in the Taku River Tributaries . . . . . . . . . . . . . 36
Table 4 . Number of Male and Female Chinook Salmon Sampled at the Nakina Carcass Weir by Age Class and by Year . . 38
in the Nakina River by Age Class and by Year . . . . . . 39
in the Nakina River by Age Class and by Brood Year . . . 40
by Year of Female Chinook Salmon Sampled at the NakinaWeir . . . . . . . . . . . . . . . . . . . . . . 41
Tah7.e 8. Length Frequency Versus Pcrcentage Age Composition by Year or Male Chinook Salmon Sampled a t the Nnkina Weir . . . . . . . . . . . . . . . . . . . . . . 4 2
Table 9. Length Frequency of Female Chinook Sampled at the Nakina Carcass Weir . . . . . . . . . . . . . . . . . . 4 3
-ii-

TABLE OF CONTENTS (CONT'D)
Table
Table
Table
Table
Table
Table
Figure Table
Table
Table Table
Table
Table
Table
Table
Table Tab1.e
Table
Table
Table Table
Table
Figure Table
Table
Table
Table
10,
11.
1 2 .
13.
14.
15.
3. 16.
1 7 .
18. 19.
20.
21.
22 .
23.
24. 25.
26.
27.
28. 29.
3 0 .
4 . 3 1 .
32.
33.
34.
Length Frequency of Male Chinook Sampled a t t h e Nakina Carcass Weir . . . . . . . . . . . . . . . . . . Timing of Die-off of Male Chinook Salmon a~ t h e Nakina Weir . . . . . . . . . . . . . . . . . . . . . . Timing of Die-off of Female Chinook Salmon a t t h e Nakina Weir . . . . . . . . . . . . . . . . . . . . . . A Summary of Coded Wire Tag Release of Taku River Chinook Salmon, 1977 t o Date. . . . . . . . . . . . . . A Summary of Coded Wire Tag Recovery of Taku River Chinook Salmon, 1978 t o Date. . . . . . . . . . . . . . J u v e n i l e Chinook Salmon Coded Wire Tagged i n Various T r i b u t a r i e s of Taku River by Code, Brood Year and Fork Length and Unexpanded Recoveries i n Various F i s h e r i e s and on t h e Spawning Grounds, 1977-1985. . . . S t i k i n e River Drainage. . . . . . . . . . . . . . . . . Peak Escapement Counts of Chinook Salmon i n t h e Tahl tan and L i t t l e Tah l t an R ive r s , 1956-1985. . . . . . . . . . Peak Escapement Counts of Chinook Salmon i n t h e Tahl tan River , 1965-1985. . . . . . . . . . . . . . . . . . . . Andrew Creek Chinook Escapement, 1976-1985. . . . . . . Minimum T o t a l Run of Chinook Salmon i n t h e S t i k i n e River Drainage. . . . . . . . . . . . . . . . . . . . . A Summary of Coded Wire Tag Releases of S t i k i n e River Chinook Salmon, 1978 t o Date. . . . . . . . . . . . . . A Summary of Coded Wire Tag Recovery of S t i k i n e River Chinook Salmon, 1978 t o Date. . . . . . . . . . . . . . S e t N e t Catch of Chinook Salmon i n t h e Alsek River , 1908-1985. . . . . . . . . . . . . . . . . . . . . . . G i l l Net Harvest and Peak Escapement Counts of Chinook Salmon i n the Alsek River 1962-1985 . . . . . . . . . . Summary of Da i ly Sampling on t h e Alsek River , 1985. . . Summary of Chinook Sampling and Tagging on t h e Alsek '
Rive r , 1985 . . . . . , . . . . . . . . . . . . . . . . Summary of Sockeye Sampling and Tagging on t h e Alsek R ive r , 1985 . . . . . . . . . . . . . . . . . . . . . . Summary of Coho Sampling and Tagging on t h e Alsek Rive r , 1985 . . . . . . . . . . . . . . . . . . . . . . S i t u k River Catch, Escapement, and Minimum T o t a l Run. . Escapement by Week of Chinook Salmon Through t h e S i t u k River Weir ( Inc lud ing J a c k s ) . . . . . . . . . . . A Summary of Coded Wire Tag Releases of S i t u k River Chinook, Sockeye and Coho Salmon, 1984. . . . . . . . . Unuk River System t o t h e U.S./C~nada Border . . . . . . D r i f t G i l l N e t Harvest of Chinook Salmon i n Burroughs Bay, Alaska . . . . . . . . . . . . . . . . . . . . . . Chinook Escapement I n t o Various T r i b u t a r i e s of t h e Unuk River System . . . . . . . . . . . . . . . . . . . Chinook Trapping and Tagging on t h e Unuk River , S p r i n g , 1 9 8 5 . . . . . . . . . . . . . . . . . . . . . . Summary of Coho Trapping and Tagging on t h e Unuk River , S p r i n g , 1 9 8 5 . . . . . . . . . . . . . . . . . . . . . .
44
45
46
47
51
62 65
66
67 68
69
70
72
74
75 76
79
80
81 82
84
85 8 7
88
89
91
92

TABLE OF CONTENTS (CONT'D) Page
Table 35. A Summary of Coded Wire Tag Releases of Unuk River Chinook Salmon, 1983 t o Date. . . . . . . . . . . . . . 93
Table 36. A Summary of Coded Wire Tag Releases of Unuk River Coho Salmon, 1983 t o Date. . . . . . . . . . . . . . . . . . 94
Table 37. Summary of Minnow Traps S e t , Catch P e r Trap, Sample S i z e , and Mean Fork Length of J u v e n i l e Chinook Captured i n Various Areas o f t h e Unuk River . . . . . . 95
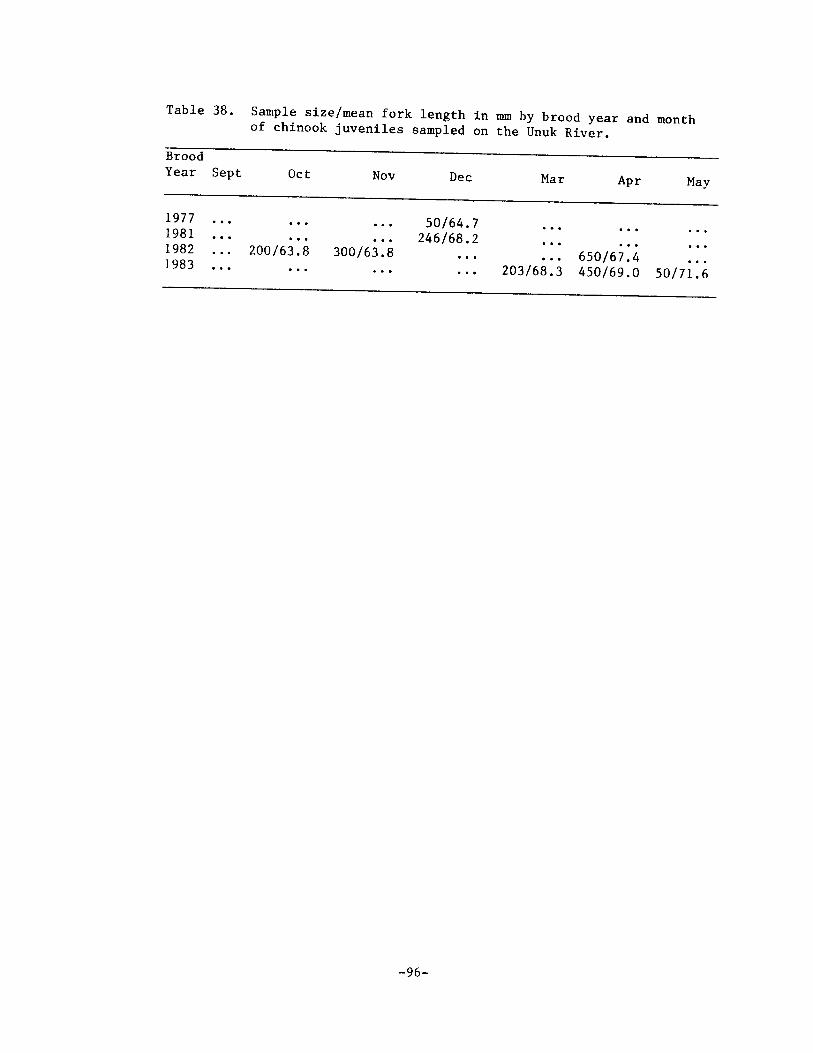
Table 38. Sample Size/Mean Fork Length i n MM by Brood Year and Month of Chinook J u v e n i l e s sampled on t h e Unuk River. . 96
Table 39. Summary of Coded Wire Tag Recoveries of Chinook Salmon Unuk River . . . . . . . . . . . . . . . . . . . 97
Figure 5 . The Chickamin River Watershed . . . . . . . . . . . . . 99 Table 40. Chinook Escapement i n t o Various T r i b u t a r i e s of t h e
Chickamin River . . . . . . . . . . . . . . . . . . . . 100 Table 41. Summary of Chinook Trapping and Tagging on t h e
Chickamin River , Spring, 1985 . . . . . . . . . . . . . 101 Table 42. Summary of Coho Trapping and Tagging on t h e Chickamin
River, Spring, 1985 . . . . . . . . . . . . . . . . . . 102 Table 43. Summary of Minnow Traps S e t , Catch P e r Trap, Sample
S i z e and Mean Fork Length of J u v e n i l e Chinook Captured i n Various Areas of t h e Chickamin River. . . . 103
Table 44. A Summary of Coded Wire Tag Releases of Chickamin River Chinook Salmon, 1983 t o Date. . . . . . . . . . . 105
Table 45. Sample Size/Mean Fork Length i n MM by Brood Year and Month of Chinook J u v e n i l e s Sampled on t h e Chickamin River . . . . . . . . . . . . . . . . . . . . 106
Table 46. A Summary of Coded Wire Tag Releases of Chickamin River Coho Salmon, 1983 t o Date . . . . . . . . . . . . . . . 107
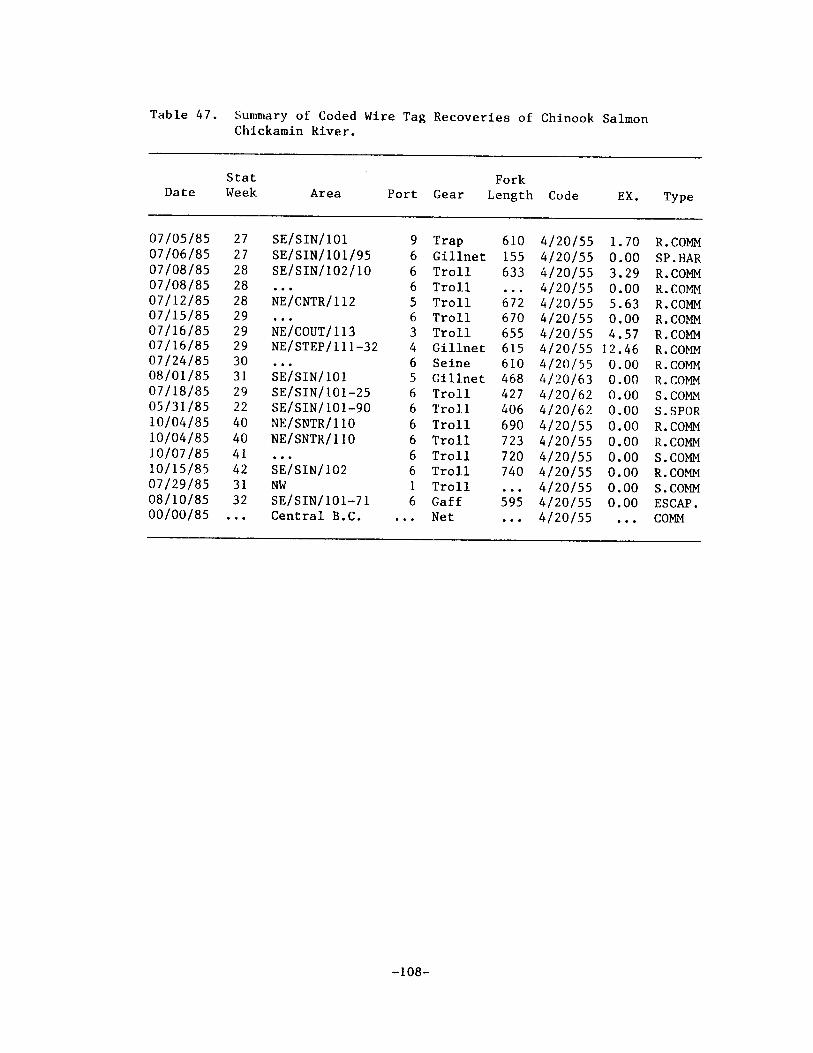
Table 4 7 . Summary of Coded Wire Tag Recoveries of Chinook Salmon Chickamin River . . . . . . . . . . . . . . . . . . . . 108
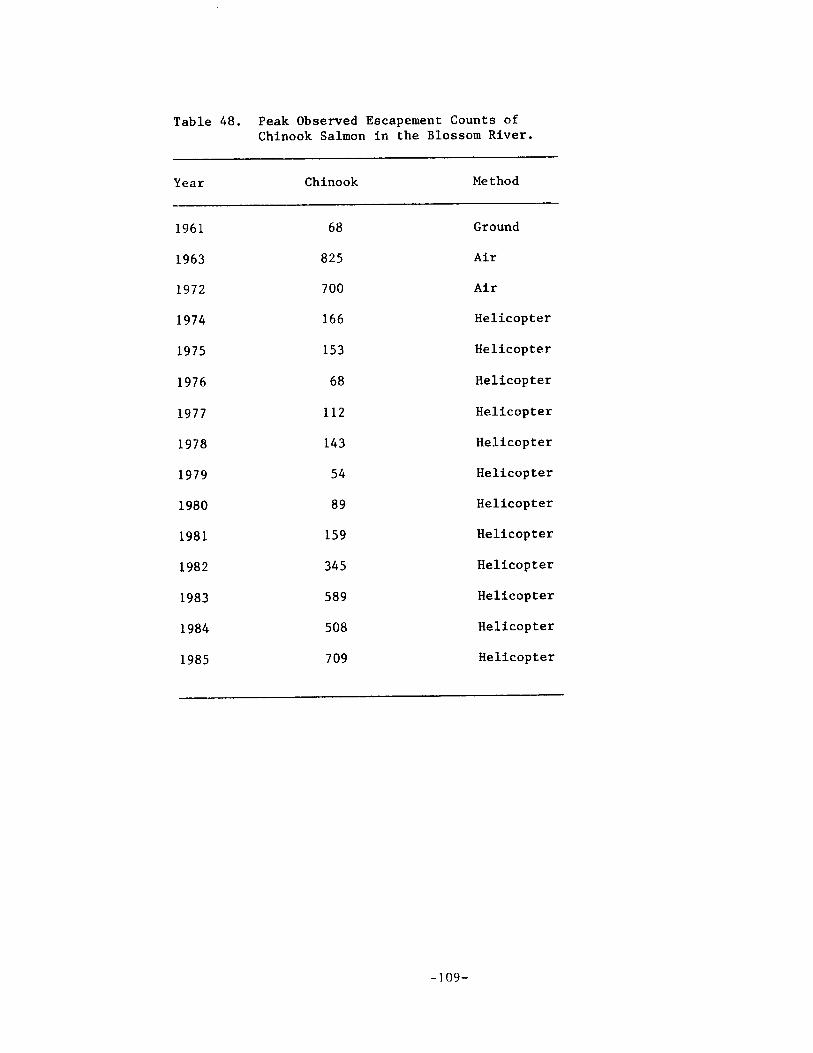
Table 48. Peak Observed Escapement Counts of Chinook Salmon i n t h e Blossom River . . . . . . . . . . . . . . . . . . . 109
Table 49. Peak Observed Escapement Counts of Chinook Salmon i n t h e K e t a R i v e r . . . . . . . . . . . . . . . . . . . . . 110
Table 50. Peak Observed Escapement Counts of Chinook Salmon i n t h e Ch i lka t River . . . . . . . . . . . . . . . . . . . 111
Table 51. Peak Escapement Counts of Chinook Salmon i n t h e King Salmon River (Admiral i ty I s l a n d ) . . . . . . . . . . . . 112
LIST OF APPENDICES
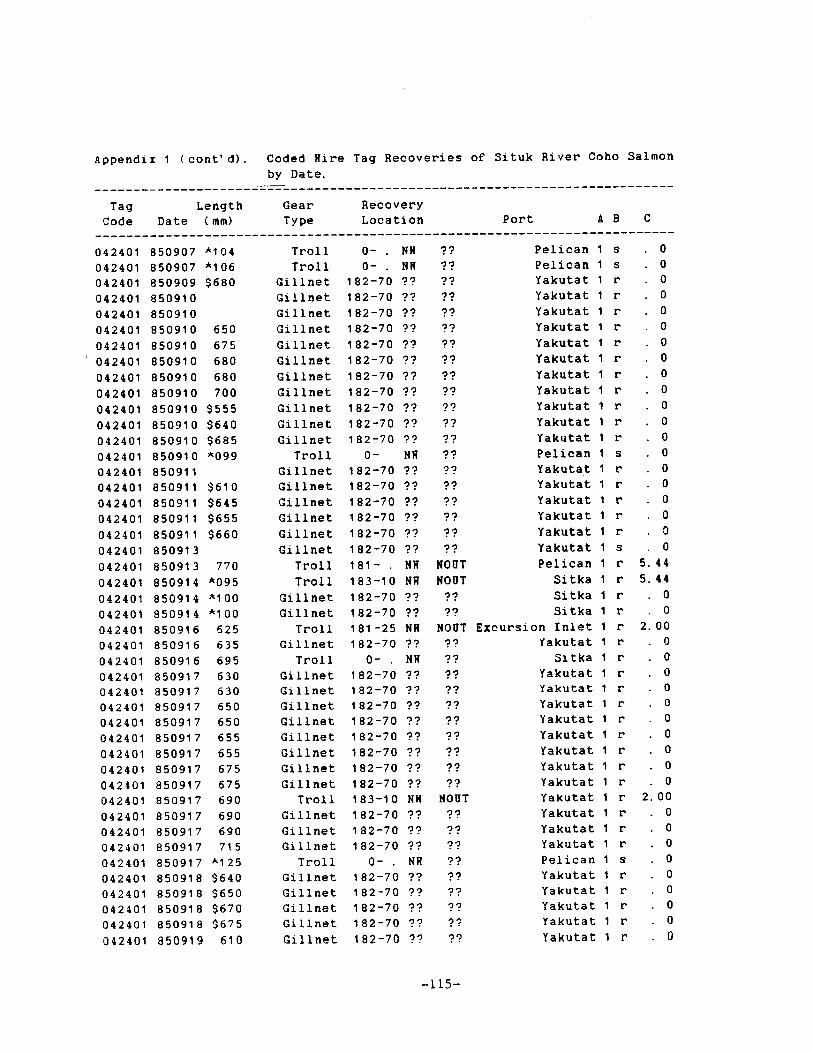
Appendix 1. Coded Wire Tag Recoveries of S i t u k River Coho Salmon by Date . . . . . . . . . . . . . . . . . . . 114
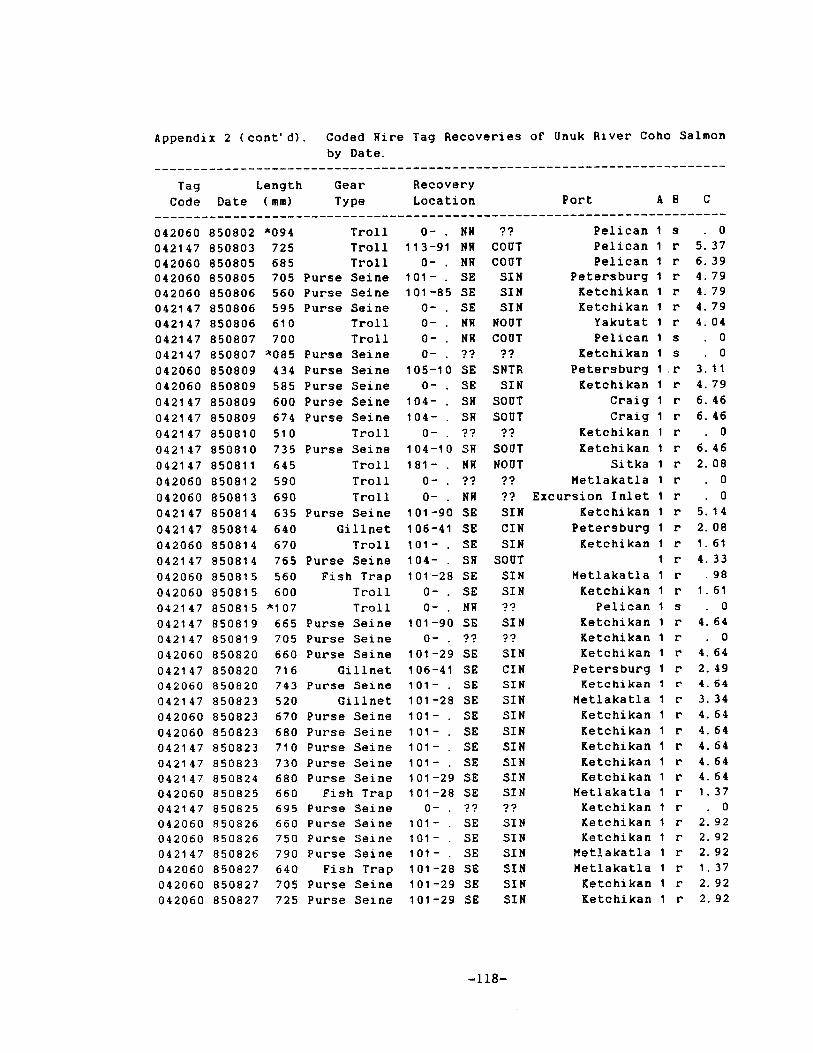
Appendix 2 . Coded Wire Tag Recoveries of Unuk River Coho Salmon by Date . . . . . . . . . . . . . . . . . . . 117
Appendix 3 . Coded Wire Tag Recoveries of Chickamin River Coho Salmon by Date, 1984 and 1985. . . . . . . . . . . . 120
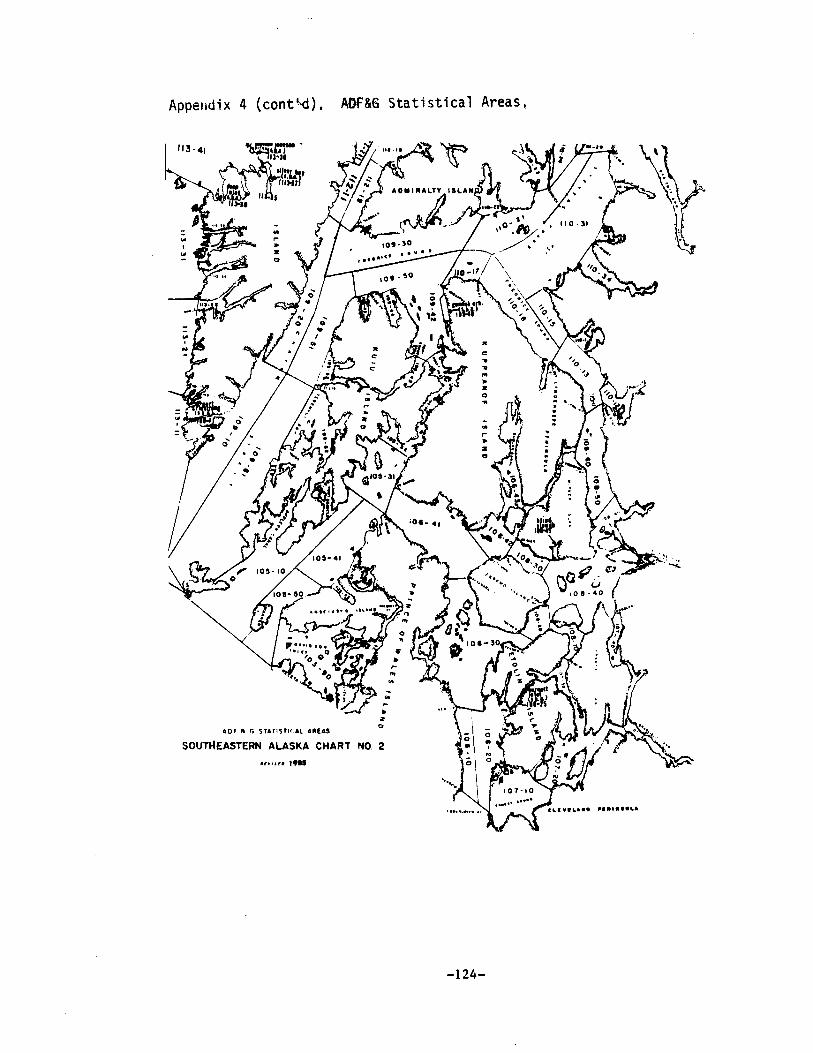
Appendix 4 . ADF&G S t a t i s t i c a l Areas. . . . . . . . . . . . . . . 122
-iv-
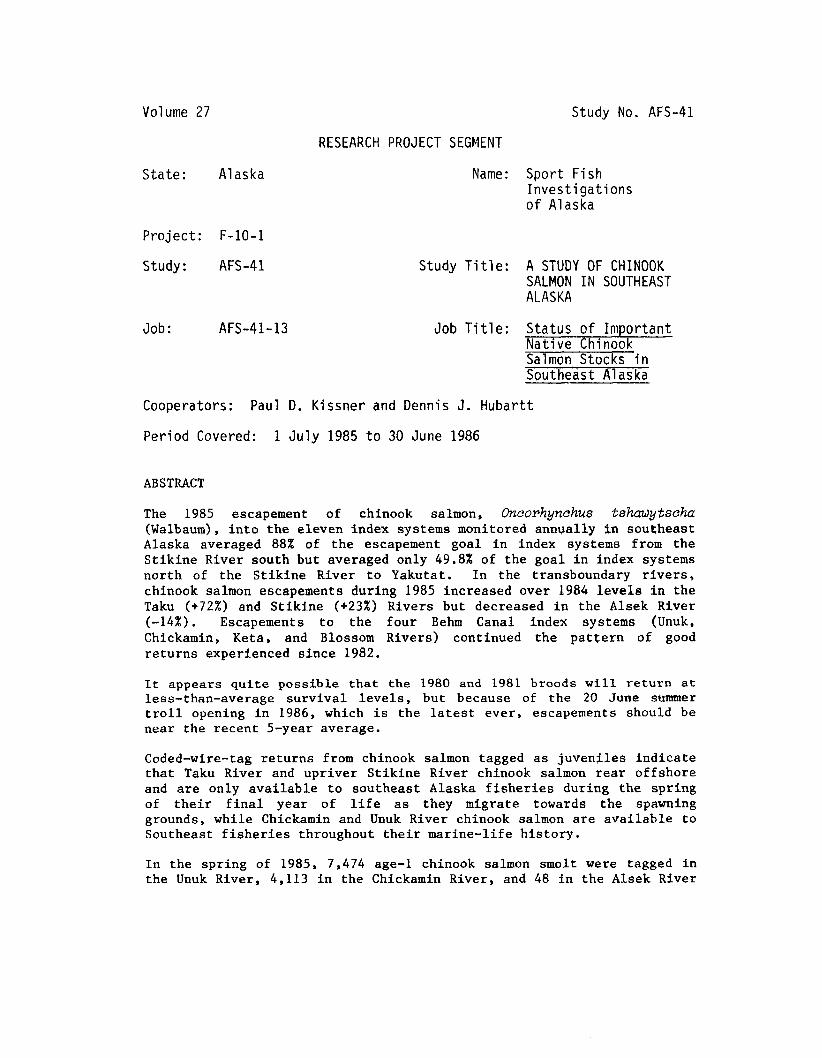
Volume 27 Study NO. AFS-41
RESEARCH PROJECT SEGMENT
S ta te : Alaska Name: Spor t Fish I n v e s tig a t ions o f Alaska
P r o j e c t : F-10-1
Study: AFS-41 Study T i t l e : A STUDY OF CHINOOK SALMON I N SOUTHEAST ALASKA
Job: AFS-41-13 Job T i t l e : S ta tus o f Impor tan t N a t i v e Chinook Salmon Stocks i n Southeast 'A1 aska
Cooperators: Paul D. K i s s n e r and Dennis J. H u b a r t t
P e r i o d Covered: 1 J u l y 1985 t o 30 June 1986
ABSTRACT
The 1985 escapement of chinook salmon, Oncorhynchus tshawytscha (Walbaum), into the eleven index systems monitored annvally in southeast Alaska averaged 88% of the escapement goal in index systems from the Stikine River south but averaged only 49.8% of the goal in index systems north of the Stikine River to Yakutat. In the transboundary rivers, chinook salmon escapements during 1985 increased over 1984 levels in the Taku (+72%) and Stikine (+23%) Rivers but decreased in the Alsek River ( -14%) . Escapements to the four Behm Canal index systems (Unuk, Chickamin, Keta, and Blossom Rivers) continued the pattern of good returns experienced since 1982.
It appears quite possible that the 1980 and 1981 broods will return at less-than-average survival levels, but because of the 20 June summer troll opening in 1986, which is the latest ever, escapements should be near the recent 5-year average.
Coded-wire-tag returns from chinook salmon tagged as juven;iles indicate that Taku River and upriver Stikine River chinook salmon rear offshore and are only available to southeast Alaska fisheries during the spring of their final year of life as they migrate towards the spawning grounds, while Chickamin and Unuk River chinook salmon are available to Southeast fisheries throughout their marine-life history.
In the spring of 1985, 7,474 age-1 chinook salmon smolt were tagged in the Unuk River, 4,113 in the Chickamin River, and 48 in the Alsek River

to determine their migration patterns, areas and timing of harvest, exploitation rates, and other general life-history information. An additional 643 sockeye salmon smolts, Oncorhynchus nerka (Walbaum), and 19,279 coho smolts, Oncorhynchus k i su tch (Walbaum), were captured incidentally, adipose clipped, and micro-wire tagged.
KEYWORDS
Chinook, Oncorhynchus tshawytscha (Walbaum), escapement, juveniles, coded-wire tagging, migration, status, log salvage, Taku, Stikine, Alsek, Unuk, Chickamin, Situk, Chilkat, southeast Alaska.
BACKGROUND
The chinook salmon research project commenced in 1971 to determine the status of southeast Alaska's wild chinook salmon stocks. Major emphasis has been placed on monitoring population dynamics (i.e., terminal gill- net harvests, escapement enumeration, coded-wire tagging, and fishery and spawning ground tag recoveries) in major and medium producing chinook salmon systems.
By the mid-l970s, it was apparent that chinook salmon populations were generally depressed throughout Southeast and, during subsequent years, terminal gill-net fisheries had been either severely restricted or eliminated on the Taku, Stikine, and Alsek Rivers. Additional sport and commercial trolling restrictions have been made to protect mature chinook salmon during their spring spawning migration. These restrictive regulations have aided the rebuilding process, and in general, escapement levels have shown dramatic improvement. Eleven chinook salmon systems are surveyed annually to determine escapement trends; i.e., index systems (Figure 1).
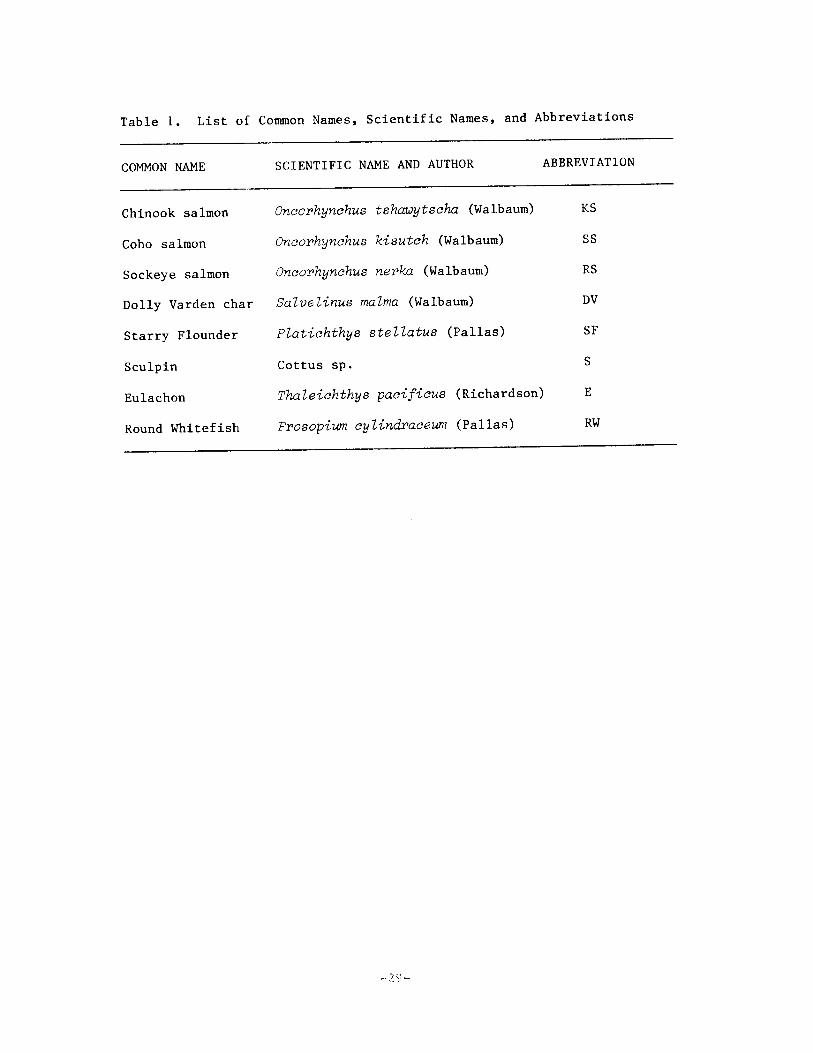
A list of common names, scientific names, and abbreviations of all species discussed in this report is presented in Table 1.
RECOMMENDATIONS
Management
1. The restrictive troll and gill-net regulations designed to protect mature southeast Alaska chinook salmon returning to their rivers of origin should be continued. Southeast Alaska chinook salmon stocks are in the process of rebuilding, but continued restrictions are necessary.
2. Drift gill-net fisheries throughout Southeast should be monitored to determine the harvest of immature and mature chinook salmon taken incidentally to the target species. Night closures should be made in areas where high incidental catches of immature chinook salmon occur. Because of the early gill-net opening in 1986 (June
-27-
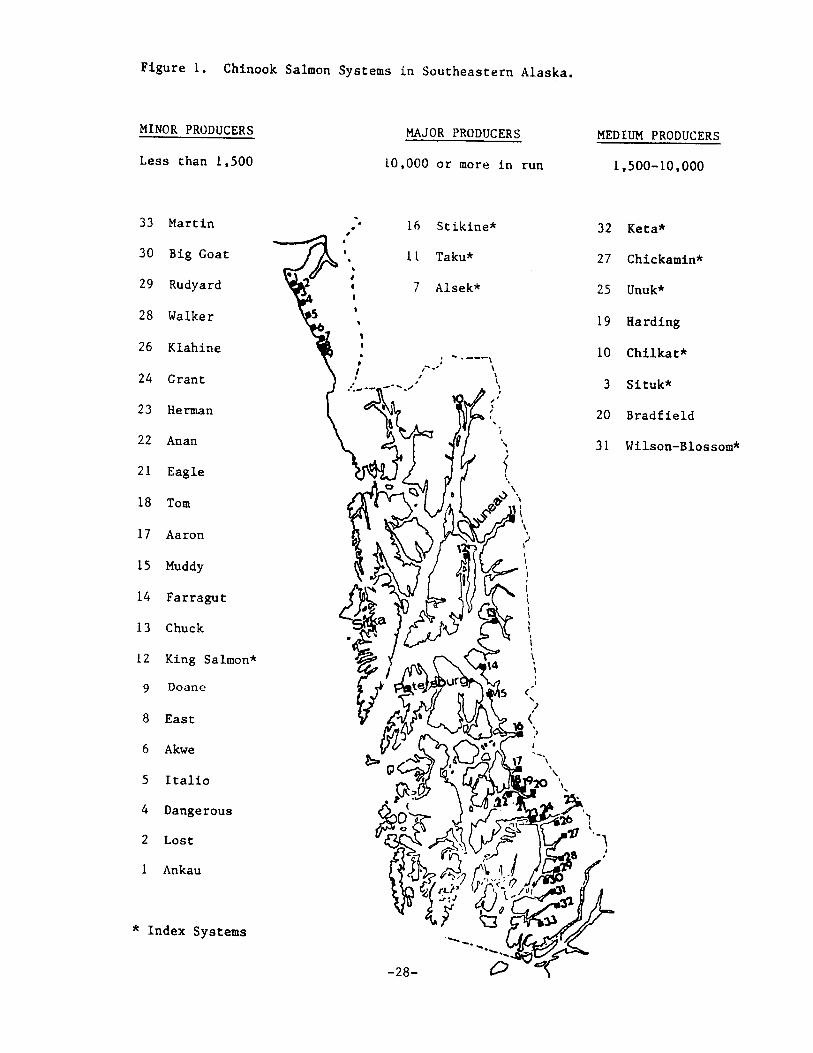
Figure 1. Chinook Salmon Systems i n S o u t h e a s t e r n Alaska.
MINOR PRODUCERS MAJOR PRODUCERS MEDIUM PRODUCERS
Less than I , 500 10,000 o r more i n run 1,500-10,000
33 Mar t in 16 S t i k i n e * 32 Keta*
30 Big Goat 11 Taku* 27 Chickamin*
29 Rudyard 7 Alsek* 25 Unuk*
28 Walker 19 Harding
26 Klahine 10 C h i l k a t *
24 Grant 3 S i tuk*
23 Herman 20 B r a d f i e l d
22 Anan 31 Wilson-Blossom*
2 1 Eagle
18 Tom
1 7 Aaron
15 Muddy
14 F a r r a g u t
13 Chuck
1 2 King Salmon*
9 Doane
8 East
6 Akwe
5 I t a l i o
4 Dangerous
2 Los t
1 Ankau
* Index Systems

15), additional area closures should occur near the mouths of the Taku, Stikine, and Chilkat Rivers.
3 . Operations designed to remove large organic debris should not be permitted in Southeast's chinook salmon producing rivers. Chinook salmon populations are in the process of rebuilding, and it is essential to maximize their rearing habitat in order to maximize chinook production.
Research
1. Sampling the commercial and sport harvests of chinook salmon and the spawning grounds should continue in order to recover coded-wire tags. Recovery of chinook salmon tagged in the Taku, Stikine, Alsek, Unuk, Chickamin, and Situk Rivers will permit determination of their marine migration patterns, areas and timing of harvest at various life history stages, and rates of harvest.
2. Sampling for age, length, and sex-ratio data of spawning chinook salmon in the major and medium producing rivers should be conducted to determine the quality of the various escapements and to forecast future returns.
3 . Determine the current status of chinook salmon in the major and medium chinook producing systems in Southeast by monitoring their escapements by aerial, ground, and/or weir enumeration. This is necessary to determine if the various closures designed to aid depressed Southeast chinook salmon are effective.
4 . Continue to determine the percentage of the total escapement of 3-and 4-ocean age chinook salmon observed during the peak low level helicopter and/or ground surveys by comparison with known escapements through various weirs.
OBJECTIVES
1 . Determine the catch and escapement of Taku River chinook salmon.
2. Determine the catch and escapement o f Stikine River chinook salmon.
3 . Determine the escapement of Alsek River chinook salmon.
4 . Determine the catch and escapement of Chickamin River chinook salmon and inject juvenile chinook salmon with coded micro-wire tags to determine their areas of harvest, exploitation rates, stock contribution to various fisheries, migration routes, and run timing.
5 . Determine the catch and escapement of Unuk River chinook salmon and inject juvenile chinook salmon with coded
-30-

micro-wire tags to determine their areas of harvest, exploitation rates, stock contribution to various fisheries, migration routes, and run timing.
6 . Determine the catch and escapement of Situk River chinook salmon and inject juvenile chinook salmon with coded micro-wire tags to determine their areas of harvest, exploitation rates, stock contribution to various fisheries, migration routes, and run timing.
7. Determine the chinook escapement in six other systems in southeast Alaska.
TECHNIQUES USED
Escapement surveys were conducted on foot or from a Bell 206 or Hughes 500D helicopter during peak spawning. The helicopter flew 6 to 15 meters above the river bed at 8 to 16 kilometers per hour. The observer's door was removed, and the helicopter hovered sideways; observations were made from the open space.
Wherever possible, the sun was kept behind the helicopter, and the observer wore Polaroid sunglasses to eliminate severe reflection. Only 3- and 4-ocean chinook salmon (> 660 mm in total length) were enumerated during aerial and foot surveys. Additional surveys were conducted if conditions were not rated excellent or good.
Only dead or near-dead fish were sampled during foot surveys on the spawning grounds to collect age, length, and sex data and to recover coded-wire tagged chinook. Chinook salmon of all sizes and ages were sampled.
Chinook salmon were measured from mid-eye to fork of tail and scales were collected for age determination. Scales were taken from the preferred area at the posterior edge of the dorsal fin, two rows above the lateral line. Because of the high occurrence of regeneration in chinook salmon scales, several additional scales were removed from the preferred area on the other side of the fish and placed in numbered coin envelopes.
From August 2 to August 26, a tripod weir was operated by the Canadian Department of Fisheries and Oceans on the Nakina River, approximately 137 meters above its junction with the Silver Salmon River. Chinook salmon spawning above the weir were enumerated after they could no longer maintain station in the river and floated against the weir face. The structure was cleaned of carcasses at 8:OO a.m. and 7:OO p.m. daily. All species were enumerated, and all chinook salmon were measured from mid-eye to fork of tail in nun and the sex and flesh color determined. In addition, 50 scale samples were collected f o r both sexes for each 25- mi length increment. The percentage age composition by sex by 25-mm length increment of the scale samples was used t o apportion the age of the remainder of the samples, where only a length measurement was secured. Chinook salmon were also examined for missing adipose fins,
-31-

which indicated tbe presence of a coded-wire tag. Surveys of the upper river were conducfed daily to enumerate and sample spawned-out chinook salmon that had not floated downstream to the weir. The survey area extended approximately 2.4 kilometers above the Nakina weir.
The length-frequency, age, and sex data from the 3- and 4-ocean adults sampled at the weir were used to apportion the age and sex of the large chinook salmon observed during the peak helicopter survey of the Nakina River index area. The total number of 1- and 2-ocean jacks spawning with the 3- and 4-ocean chinook salmon adults observed during the peak helicopter survey were derived by utilizing the ratio of 1- and 2-ocean jacks per large-spawner data collected at the carcass weir.
Gee minnow traps, baited with clusters of salrnoq roe, were used to capture juvenile salmonids in the Unuk and Chickamln Rivers. Fifty to 100 traps were checked, the juveniles removed, and the traps rebaited and reset on a daily basis. Salmon roe was disinfected prior to use by immersion in diluted betadyne at a ratio of 1 part betadyne per 90 partsyater for 15 minutes.
Various length small-mesh seines and minnow traps baited with salmon roe were utilized to capture juvenile salmonids from the "Baain" downriver to the narrow outlet of the Alsek River. Small-mesh seines from approximately 10 to 30 meters in length, 2.5 meters in depth, and with 9.4-m-square mesh were utilized to capture chinook salmon i n back eddies, sloughs, and other slack-water areas. Several 9.4 mm mesh seines, approximately 67 meters and 91 meters in length and 3 meters in depth, were utilized to block off several small bays in the intertidal area near the outlet of Dry Bay. Because of strong currents near the mouth at most tidal stages, there were only a few areas wheTe the large seines could be utilized.
Juvenile chinook salmon tagged in the rivers were transported from various capture sites to the tagging locations in live-boxes and, after tagging, were usually released above or below the trapping areas to reduce the number of recaptures.
Chinook salmon smolt and rearing juveniles were anesthetized with tricaine methanesulfonate (MS-222), marked by removal of the adipose fin, and micro-wire tagged with a Northwest Marine Technology, Inc. (NMT) tag injector. The tagging unit was modified to function under remote conditions by conversion to a 24-volt battery system.
The micro-wire tags were made of type 302 stainless steel wire and were 0.25 mm in diameter and 1.0 mm in length. A code, based on the binary system, was etched into the surface of each wire to identify the agency tagging and the specific treatment of the individual.
The micro-wire tags must be implanted in the cartilaginous wedge of the fish's snout to obtain maximum retention. Thus several fish were sampled daily to ensure proper tag placement. The fish's skull was bisected by a vertical incision through the dorsal median plane to the oral cavity. The tag was then readily observed in the snout. 15 the tag was improperly placed, adjustments in the depth of the head mold
-32-

were made, and several more fish were checked to ensure proper placement of the tag.
The micro-wire tags were magnetized by dropping the tagged fish head first through a ring magnet into a bucket of water. The fish were then passed through a NMT field sampling detector to check for the presence of a magnetized tag.
All juvenile salmonids recaptured without an adipose fin during tagging projects were sampled to determine the percentage that had retained a coded-wire tag. The total number of chinook salmon tagged was then adjusted to account for this in-river tag-loss percentage.
Chinook and coho salmon smolt and rearing juveniles were sampled for age and growth determination. Fish were measured from the tip of the snout to the fork of the tail (to the nearest millimeter), and several scales were taken from the preferred area and mounted between glass slides.
Adult scales were examined under a binocular microscope, and the first complete scale was cleansed in detergent and mounted on a numbered gum card. The scales were pressed in cellulose acetate and analyzed on a 3-M Consultant 114 microfiche reader.
FINDINGS
Taku River Studies
Introduction:
The Taku River (Figure 2), which discharges its flow into the Pacific Ocean approximately 48 kilometers east of Juneau, Alaska, originates in the high-plateau country of northwestern British Columbia and drains an area of approximately 16,576 square kilometers. The drainage above the abandoned community of Tulsequah, British Columbia, remains in pristine condition as mining, logging, or other land-use activities have never been permitted. The area is among the most remote in British Columbia, with no highway access and no year-around residents.
Two major clear-water tributaries, the Nakina and Nahlin Rivers, contribute less than 25% of the total discharge, with most of the remainder originating from ice fields on the eastern slope of the Coast Range.
Drift Gill Net Fishery:
Concern for the large incidental harvest of immature chinook salmon during the 1973 sockeye salmon fishery, which occurs after mid-June, led to the annual monitoring of the Taku drift gill-net fishery. Chinook salmon landed are categorized as large or small spawners and large or small feeders (Table 2).
Escapement:
The observed escapement of 3- and 4- ocean chinook salmon into index tributaries of the Taku River was the third largest observed since 1958.
-33-


Escapements t o index t r i b u t a r i e s i n t h e I n k l i n R ive r d r a i n a g e were much b e t t e r t h a n t o t h e Nakina River (Table 3 ) . A s expec ted , t h e escapement of a g e 4 chinook salmon (1979 brood) was s t r o n g and t h e r e t u r n o f age-5 chinook salmon (1980 brood) average .
Based on length- f requency and age d a t a c o l l e c t e d a t t h e Nakina w e i r by the Alaska Department of F i s h e r i e s from 1956 u n t i l 1959 by t h e Alaska Department of F i s h and Game (ADF&G) from 1973 through 1983, and by t h e Canadian Department of F i s h e r i e s and Oceans i n 1984 and 1985, t h e 1986 r e t u r n of a g e 4 chinook salmon (1980 brood) should be average and t h e r e t u r n of age-5 chinook salmon (1981 brood) v e r y weak (Tab les 4-10).
The d a i l y d ie -of f of spawned-out chinook salmon a t t h e Nakina weir i s p r e s e n t e d i n Tab les 11 and 12.
The l a t e opening of t h e commercial t r o l l f i s h e r y ( June 20) w i l l permi t t h e Taku River spawning r e t u r n t o m i g r a t e t o t h e t e r m i n a l a r e a w i t h v e r y low f i s h e r y e x p l o i t a t i o n i n s o u t h e a s t Alaska.
Coded Wire Tag Recovery:
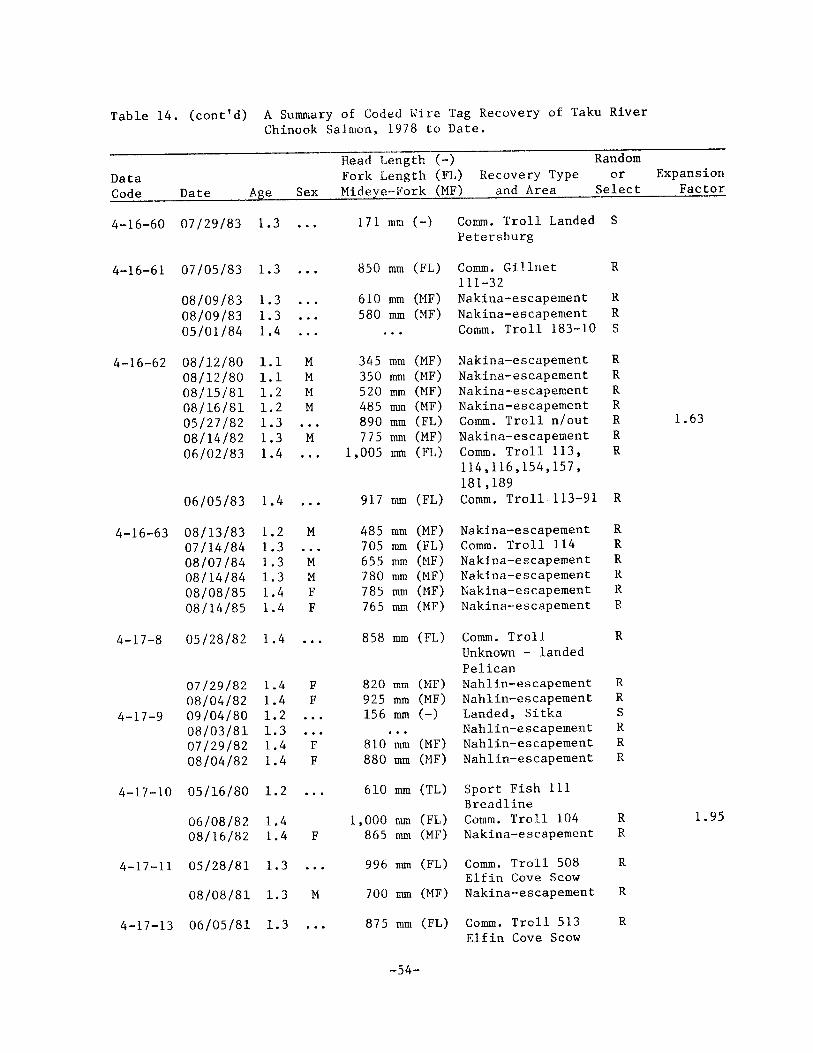
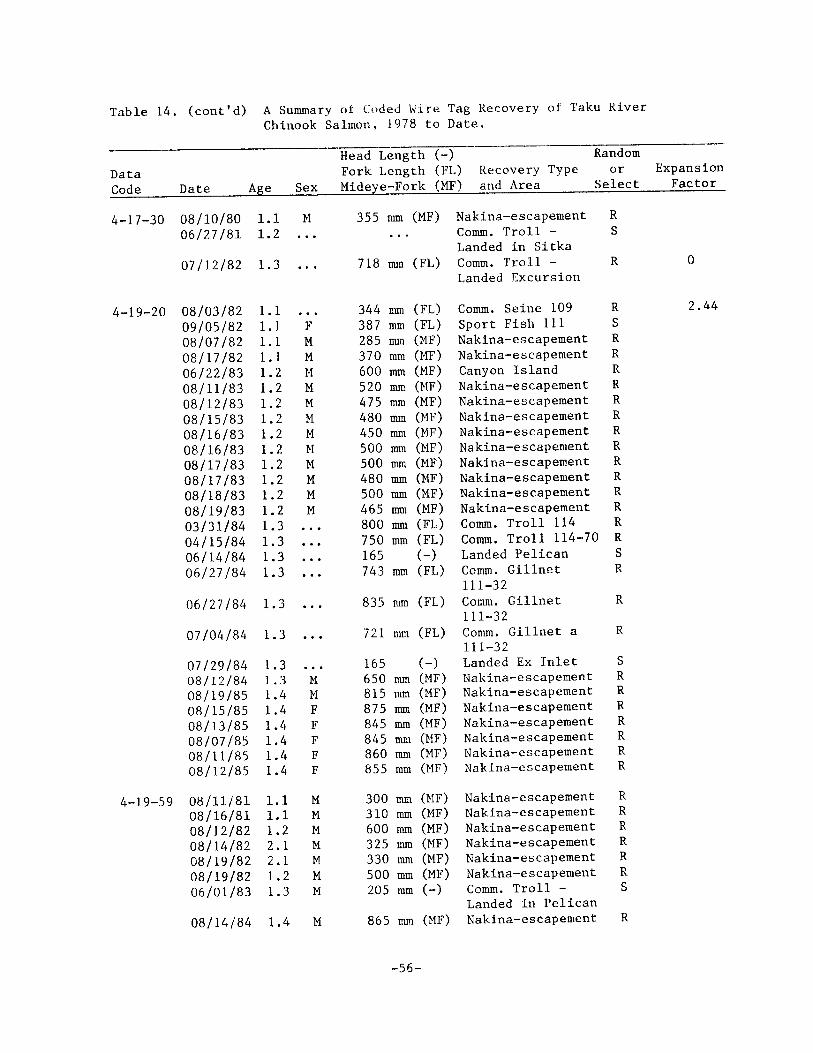
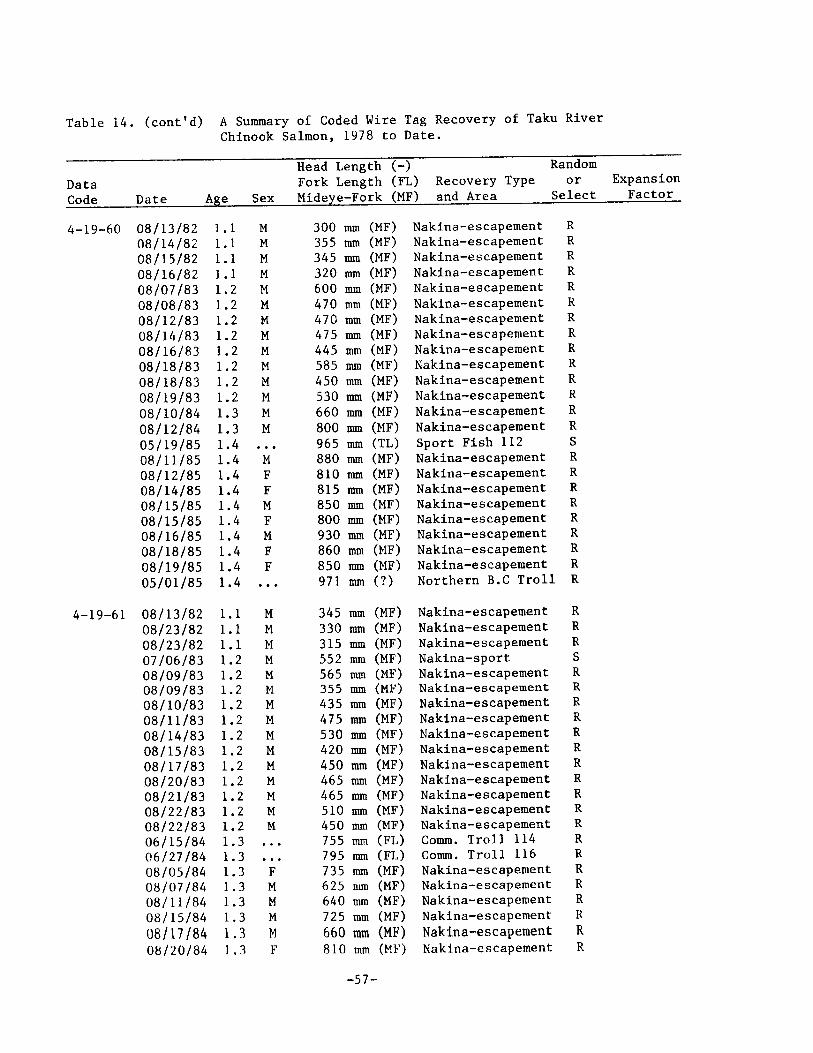
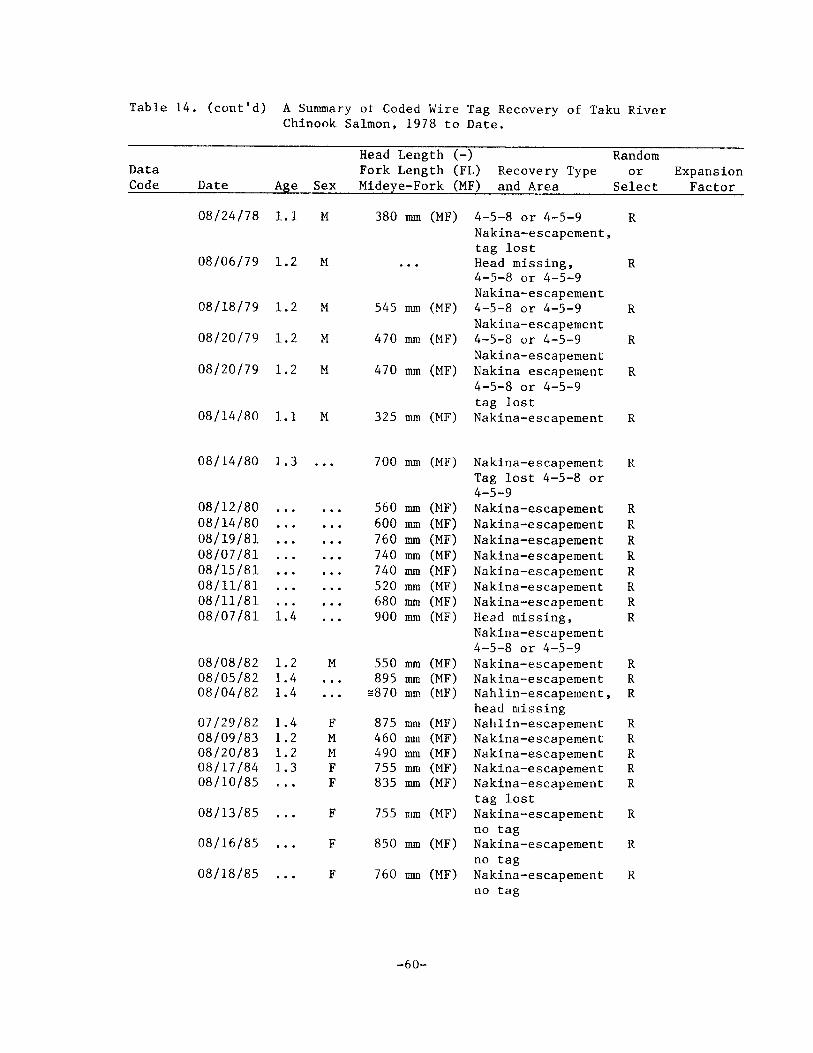
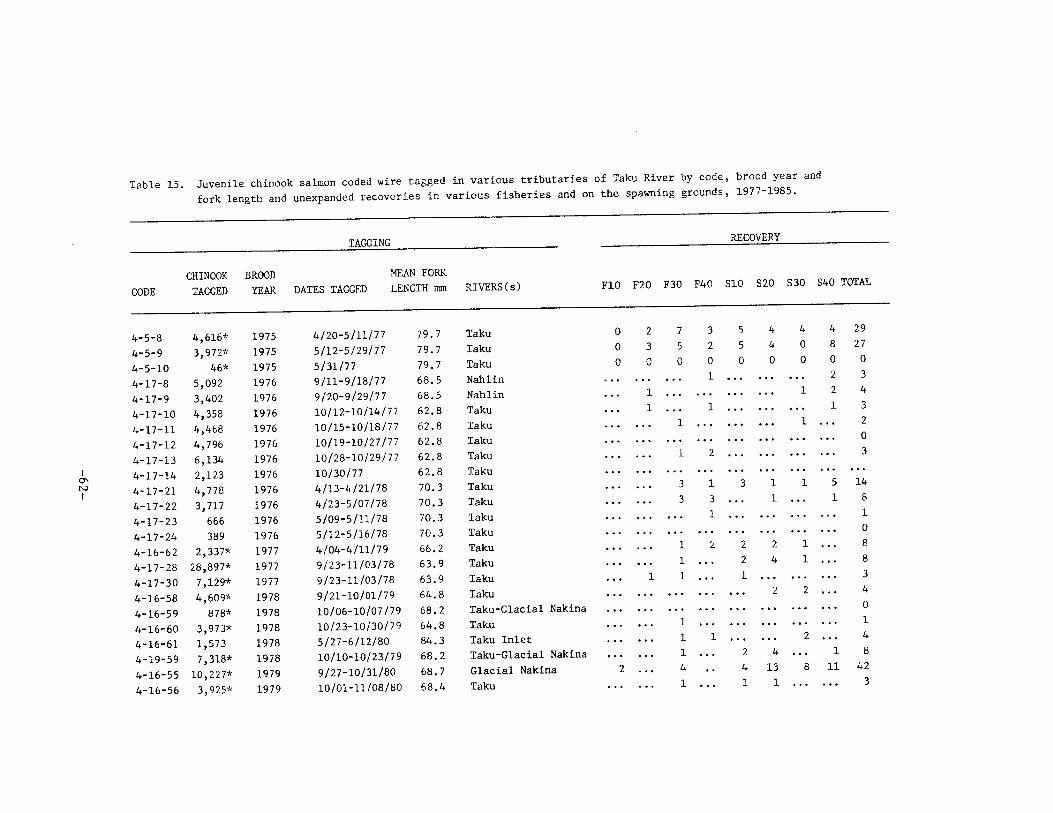
Coded-wire t a g g i n g was conducted on Taku R ive r chinook salmon from 1977 through 1983 (1975 through 1981 b roods ) . A t o t a l of 35,765 chinook salmon smolts and 162,513 young-of-the-year were marked by removal of t h e ad ipose f i n and coded-wire tagged (Table 13). A t o t a l of 12 Taku River chinook salmon t h a t were coded-wire tagged a s j u v e n i l e s were recovered i n v a r i o u s s p o r t and commercial f i s h e r i e s d u r i n g 1985, and 47 t a g s were recovered on t h e spawning grounds (Table 14 ) . To d a t e , 90 coded-wire tagged Taku R ive r chinook salmon have been r ecove red i n v a r i o u s s o u t h e a s t Alaska commercial and s p o r t f i s h e r i e s , and 247 coded-wire t a g s have been recovered on t h e spawning grounds (Table 15 ) .
S p o r t and commercial coded-wire t a g r e c o v e r i e s have shown t h a t Taku Kiver chinook salmon a r e o n l y a v a i l a b l e t o s o u t h e a s t Alaska f i s h e r i e s d u r i n g t h e s p r i n g of t h e i r f i n a l y e a r of l i f e a s t hey m i g r a t e back through t h e w a t e r s of s o u t h e a s t Alaska t o r e t u r n t o t h e i r spawning grounds. O f a l l coded-wire t a g r e c o v e r i e s i n v a r i o u s s p o r t and commercial t r o l l f i she r i e s , 87.9% occurred in commercial f i s h i n g d i s t r i c t s 111, 113, 114, o r 116. These d i s t r i c t s a r e t h e approaches t o I c y S t r a i t , I c y S t r a i t , and t h e Juneau a r e a . S p r i n g t r o l l c l o s u r e s of t h e s e a r e a s d u r i n g 1981 through 1985 have k e p t t h e e x p l o i t a t i o n r a t e a t low l e v e l s .
Smal l numbers of r e t u r n i n g Taku R ive r chinook salmon appear t o m i g r a t e by Cape Ommaney, n o r t h through F r e d e r i c k Sound, and n o r t h through Stephens Passage t o t h e Taku R ive r .
The f i r s t recovery of a Taku R ive r chinook salmon (age-6) i n t h e n o r t h e r n B r i t i s h Columbia t r o l l f i s h e r y occur red i n 1985. I n a d d i t i o n , one r ecove ry of an age-6 chinook salmon h a s occur red i n commercial f i s h i n g d i s t r i c t 104, which i s o f f t h e w e s t c o a s t of P r i n c e of Wales I s l a n d . There have been no coded-wire t a g r e c o v e r i e s of Taku River chinook salmon from o t h e r age c l a s s e s i n t h i s a r e a ; t h u s , i t i s p robab le th ' i t t h e s e matur ing f i s h had migra ted t a r o f f s h o r e and, a f t e r a p p r o a c h i ~ ~ gtlrc outstdc? c o a s t , were m i g r a t i rig n o r t h towards t h e Taku Kiver .
-37-

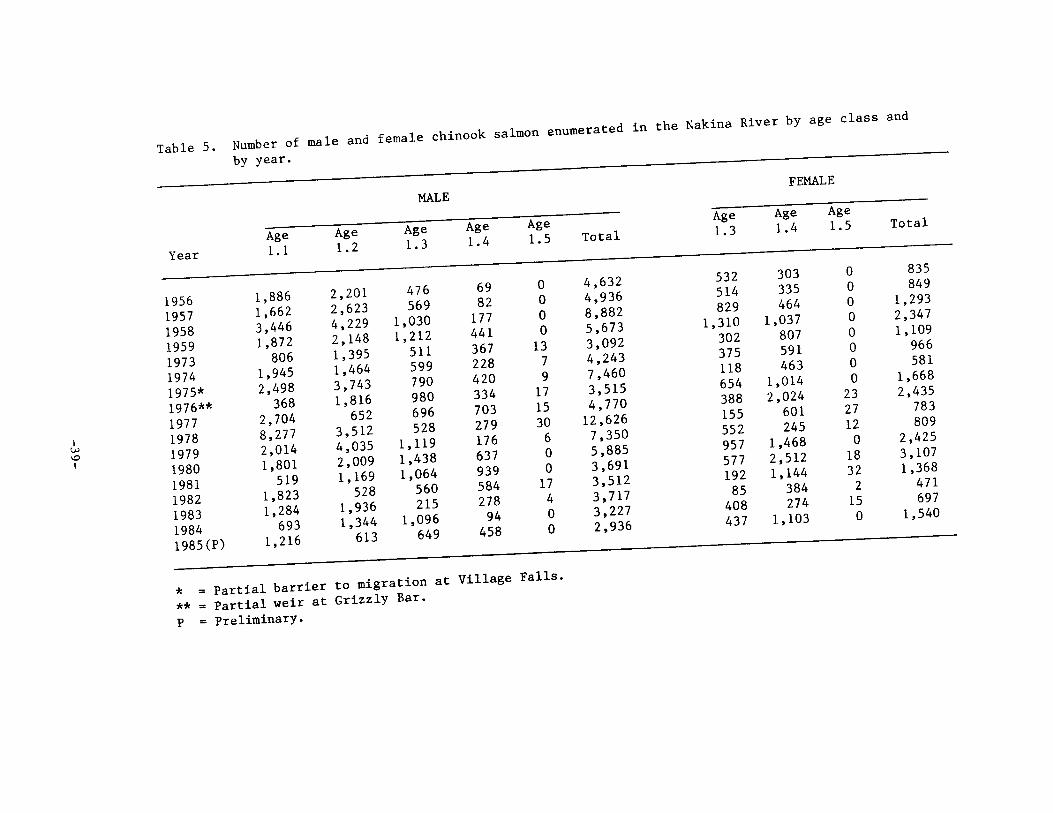


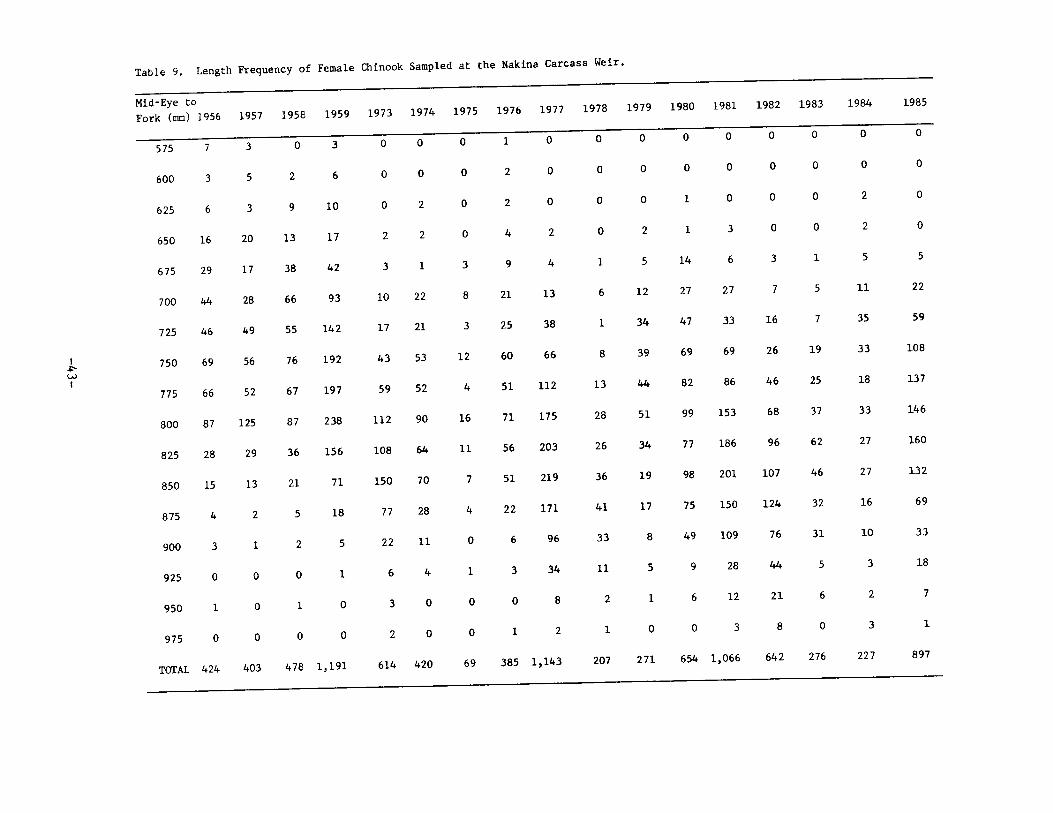


Table 13. A Summary of Coded Hire Tag Releases of Taku R i v e r Chinook Salmon, 1 9 7 7 t o Date. ........................................................................
Young-o f- Mean Data the-Year Smolts Brood S i z e Capture % Tag Code Released Released Year i n m m Locat ion Re ten t ion ........................................................................ 040508 4, 61 6** 1975 79. 7
040509 3,9?2** 1 9 7 5 7 9 . 7
04051 0 46** 1975 79. 7
041 655 1 0 , 2 2 7 * 1 9 7 9 68. 7
041 656 3,925* 1979 68. 4
041 657 1, 4 3 4 * 1 9 7 9 68. 7
041 658 4, 60gA 1978 64. 8
041 659 878* 1978 68. 2
041660 3 , 9 7 3 ” 1978 64. 8
Hai nstem Taku, Tagged April-May, 1977 a t Taku Lodge
87. 2
Mainstem Taku, Tagged May, 1 9 7 7 a t Taku Lodge
87. 2
Mainstem Taku, Tagged May, 1 9 7 7 a t Taku Lodge
87. 2
G l a c i a l Nakina River, Tagged a t I n k l i n J c t . , O c t . 1 9 8 0
95. 7
Taku R i v e r , Tagged a t I n k l i n J c t . , Oct. 1 9 8 0
95. 7
G l a c i a l Nakina R i v e r , Tagged a t I n k l i n Jc t . , Nov. 1980
95. 7
Mainstem Taku, Tagged a t Tulsequah, Sept. 1979
82. 4
G l a c i a l Nakina R i v e r , Tagged a t I n k l i n J c t . , O c t . 1 9 7 9
82. 4
Hainstem Taku & 82 . 4 G l a c i a l Nakina Tagged a t I n k l i n J c t . 8 Tulsequah, Oct. 1 9 7 9
-47-’

Tab le 1 3 ( c o n t ' d ) . A Summary o f Coded Wire Tag Releases of Taku R i v e r C h i n o o k Salmon, 1 9 7 7 t o Date.
Young-of - Mean D a t a t h e - Y e a r Smolts Brood S i z e C a p t u r e % Tag Code Re1eased Re1eased Year i n mm L o c a t i o n R e t e n t i o n ......................................................................... 041 661 1,573 1978 84. 3
041 662 2 ,337* 1977 66. 2
041 663 3 ,366* 1 9 7 9 68. 4
041 708 5 ,092 1976 68. 5
041 709 3, 402 1976 68. 5'
041 71 0 4, 358 1976 62. 9
041 71 1 4, 468 1976 62. 9
041712 4 ,796 1976 62. 9
041 71 3 6 , 1 3 4 1976 62. 9
041 71 4 2 ,123 1976 62. 9
Taku I n l e t . . . Tagged a t J u n e a u , May 1 9 8 0
H a i n s t e m Taku, 9 1 . 7 Tagged a t T u l s e q u a h , A p r i l 1 9 7 9
Glacia l N a k i n a 95. 7 R i v e r Tagged a t I n k l i n J c t . , S e p t . 1 9 8 0
N a h l i n R i v e r , . . . Tagged S e p t . 1977
N a h l i n R i v e r , Tagged S e p t . 1977
H a i n s t e m Taku, Tagged a t T u l s e q u a h , Oct. 1977
H a i n s t e m Taku, Tagged a t T u l s e q u a h , O c t . 1977
M a i n s t e m Taku, Tagged a t T u l s e q u a h , O c t . 1977
H a i n s t e m Taku, . . . Tagged a t T u l s e q u a h , Oct. 1977
H a i n s t e m Taku, . . . Tagged a t T u l s e q u a h , Oct. 1977
-48-


042001 1, 553* 1 9 7 9 73. 5 T u l s e q u a h , May 9 5 . 1 1981
042003 4 ,011" 1 9 7 9 67. 7 T u l s e q u a h , March 95. 1 t h r o u g h Hay 1 9 8 1
042056 4, 7 1 0 1981 87. 9 Taku I n l e t , May . . and J u n e , 1 9 8 3
0421 1 5 5, 01 6" 1 9 8 0 63. 2 Glacia l Nak ina 95. 5 R i v e r , S e p t . 1 9 8 1
0421 1 6 9 ,545" 1 9 8 0 59. 8 Hains tem Taku, 95. 5 S e p t . 8 Oct. 1981
0421 1 7 1 0 , 0 9 1 * 1 9 8 0 59. 8 Hainstem Taku, 95. 5 O c t . 1 9 8 1
0421 1 8 5, 978" 1 9 8 0 59. 8 H a i n s t e m Taku, 95. 5 Oct. 8 Nov. 1 9 8 1
-50-


Stikine River Studies
Introduction:
The Stikine River (Figure 3 ) , which is approximately 643 kilometers long and drains an area of about 50,246 square kilometers, discharges its flow into the Pacific Ocean 20 kilometers northeast of Wrangell, Alaska. This large transboundary river, with only the lower 64 kilometers in Alaska, has waterfalls, rock slides, and velocity blocks that prevent anadromous fish migration into well over 50% of the watershed.
The fourth salmon cannery in southeastern Alaska was constructed 13 kilometers above the mouth of the Stikine River in 1887 , but it soon became evident that this large glacial system did not support sizable runs of salmon. Thus the cannery was moved to Wrangell Island in 1889.
Escapement:
The observed escapement of 3- and 4-ocean chinook salmon into the Little Tahltan River , the major clear-water index tributary of the Stikine River, was 22% below the recent 5-year average escapement and 76.1% of the escapement goal (Table 1 6 ) .
The Canadian Department of Fisheries and Ocean operated a weir near the mouth of the Little Tahltan River from 4 July through 24 August 1985 . A total of 3,146 adult and 316 jack chinook salmon were enumerated through the weir.
During low-level helicopter surveys to enumerate the spawning population, the number of chinook salmon that passed the weir was not known. On 2 August the average count of two biologists enumerating chinook salmon in the Little Tahltan River index area was 51.1% of the weir count of large chinook salmon for the same date. On 6 August a biologist counted chinook salmon in the same index area and observed 55.8% of the chinook salmon enumerated through the weir by that date. A comparison of this peak count to the total escapement of 3- and 4-ocean chinook through the Little Tahltan weir indicated that 50.8% of the known chinook escapement was observed in the Little Tahltan River index area during the peak survey. This is somewhat lower than the percentage of the total run enumerated from a low-flying helicopter, compared to a weir count on King Salmon River (Admiralty Island). During the past 3 years, 64.4% to 84.3% of the total chinook escapements into the King Salmon River were observed during the peak aerial surveys.
The observed chinook salmon escapements in other Stikine River tributaries monitored annually are presented in Tables 17-18. The minimal run of chinook salmon to the Stikine River is presented in Table 19.
Coded Wire Tag Recovery:
Coded-wire tagging has been conducted on Stikine River chinook salmon from 1978 through 1981 (1976-1980 broods). A total of 1,284 chinook
-64-

Figure 3 , Stikine Rlvet Drainage
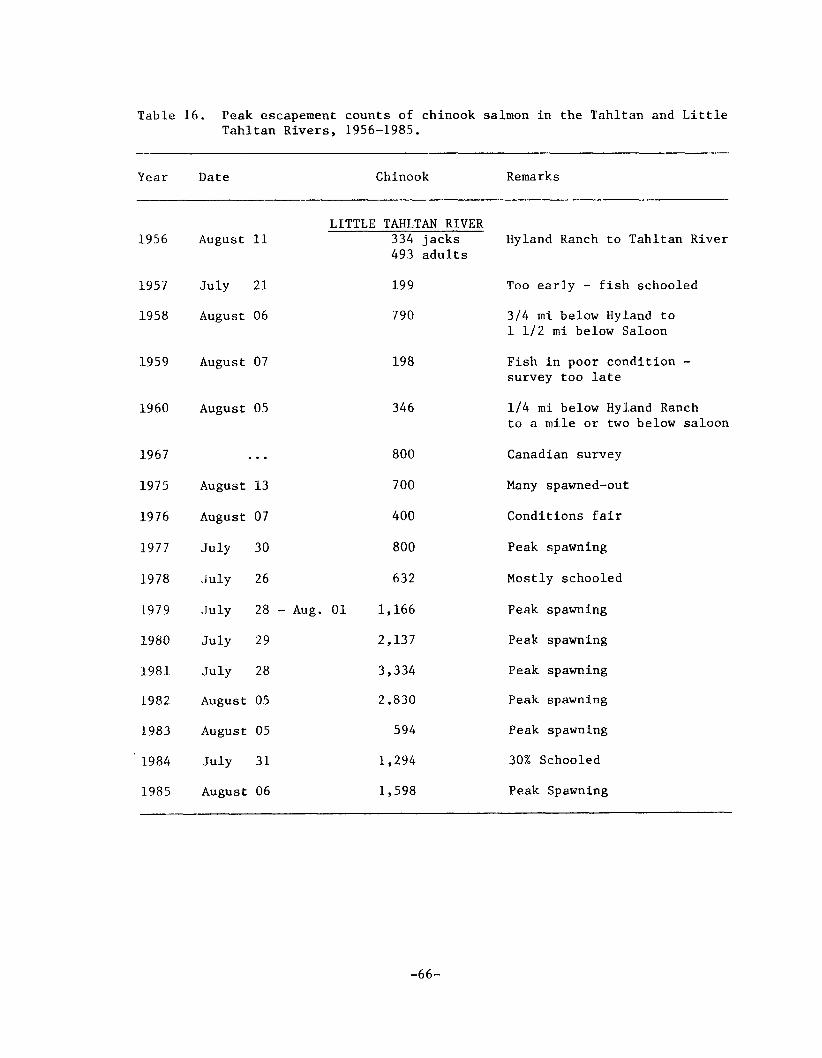
Table 16. Peak escapement counts of chinook salmon i n t h e Tah l t an and L i t t l e Tah l t an R ive r s , 1956-1985.
Year
1956
1957
1958
1959
19 60
1967
1975
1976
1977
1978
1979
1980
1981
1982
1983
1984
1985
Date
August 11
J u l y 2 1
August 06
August 07
August 05
... August 13
August 07
J u l y 30
J u l y 26
J u l y 28
J u l y 29
J u l y 28
August 05
August 05
J u l y 31
August 06
Chinook
LITTLE TAHLTAN RIVER 334 j a c k s 493 a d u l t s
19 9
790
198
346
800
700
400
800
632
- Aug. 0 1 1 ,166
2 , 1 3 7
3,334
2,830
594
1,294
1,598
Remarks
Hyland Ranch t o Tah l t an River
Too ea r ly - f i s h schooled
314 m i below Hyland t o 1 112 m i below Saloon
F i s h i n poor c o n d i t i o n -survey too l a t e
114 m i below Hyland Ranch t o a m i l e o r two below saloon
Canadian survey
Many spawned-out
Condi t ions f a i r
Peak spawning
Mostly schooled
Peak spawning
Peak spawning
Peak spawning
Peak spawning
Peak spawning
30% Schooled
Peak Spawning
-66-

Table 1 7 . Peak escapement coun t s of chinook salmon i n t h e Tah l t an River , 1965-1985.
Year Date Chinook Remarks
MAINSTEM TAHLTAN RIVER
1965 ... 85 A i r l i f t e d over s l i d e
1966 ... 318 A i r l i f t e d over s l i d e
1975 August 13 2,908 Clear
1976 August 20 120 Late
1977 J u l y 30 i3 Aug. 18 0 G l a c i a l
1978 August 08 756 G l a c i a l
1979 August 10 2 ,118 P a r t l y g l a c i a l
1980 J u l y 29 960 Very g l a c i a l
1981 August 04 1,852 P a r t l y g l a c i a l
1982 August 05 1,690 P a r t l y g l a c i a l
1983 August 05 453 P a r t l y g l a c i a l
1984 ... No Survey
1985 August 06 1,490 P a r t l y g l a c i a l
BEATTY CREEK
1980 J u l y 29 122 Peak spawning
1981 August 04 558 Peak spawning
1982 J u l y 28 567 P a r t l y schooled
1983 August 05 83 Peak spawning
1984 J u l y 31 126 Condit ions poor
1985 August 02 147 Peak Spawning
-67-

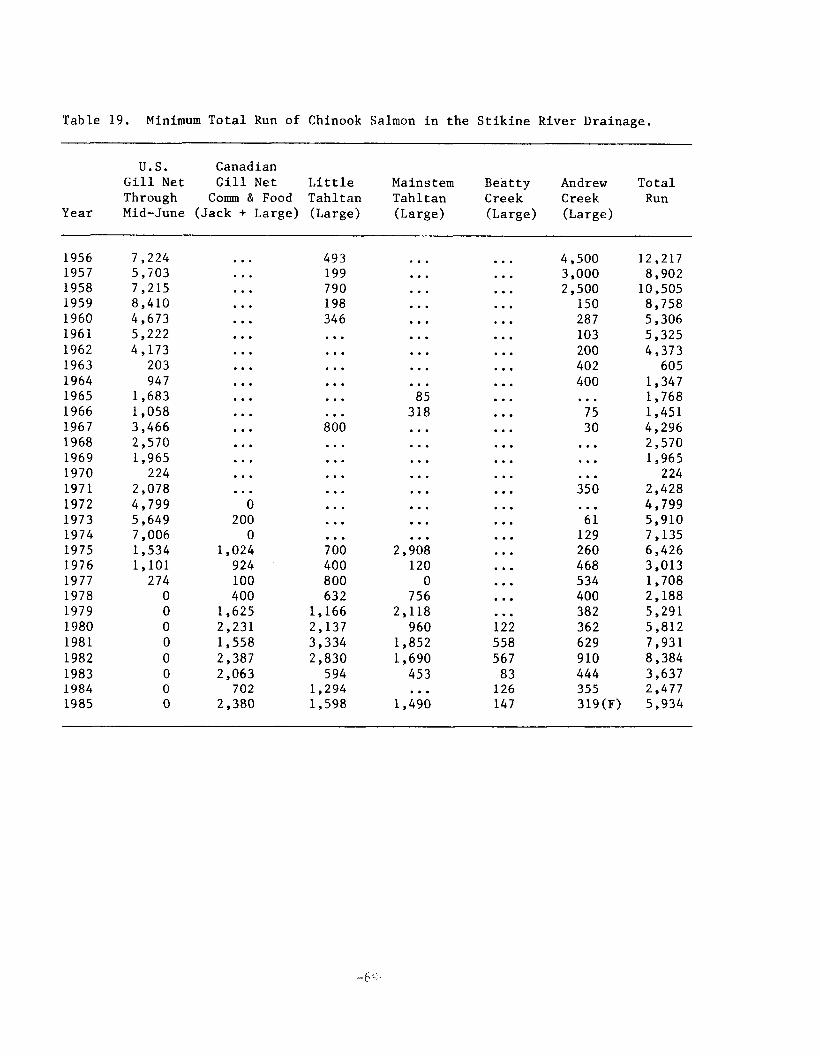
Table 19. Minimum T o t a l Run of Chinook Salmon i n t h e S t i k i n e River Drainage .
U.S. Canadian G i l l Net G i l l Net L i t t l e Mainstem Bea t ty Andrew T o t a l Through Corn & Food Tah l t an Tah l t an Creek Creek Run
Year Mid-June ( Jack + Large) (Large) (Large) (Large) (Large)
1956 7 . 224 ... 493 ... ... 4. 500 12. 217 1957 1958 1959
5. 703 7 . 215 8. 410
... ... ... 199 790 198
... ... ... ... ... ...
3. 000 2 .500
150
8. 902 10. 505 8.758
1960 4. 673 ... 346 ... ... 287 5. 306 1961 5. 222 ... ... ... ... 103 5. 325 1962 4 . 173 ... ... ... ... 200 4. 373 1963 203 ... ... ... ... 402 605 1964 1965
947 1.683
... ... ... ... ... 85
... ... 400 ... 1. 347 1.768
1966 1. 058 ... ... 318 ... 75 1.451 1967 3. 466 ... 800 ... ... 30 4. 296 1968 2 . 570 ... ... ... ... ... 2 . 570 1969 1. 965 ... ... ... ... ... 1.965 1970 224 ... ... ... ... ... 224 1971 1972
2 . 078 4 .799
... 0
... ... ... ... ... ... 350 ... 2. 428 4. 799
1973 5. 649 200 ... ... ... 61 5. 910 1974 7 . 006 0 ... ... ... 129 7 . 135 1975 1976
1. 534 1.101
1. 024 924
700 400
2 . 908 120
... ... 260 468
6. 426 3. 013
1977 274 100 800 0 ... 534 1.708 1978 0 400 632 756 ... 400 2 . 188 1979 0 1.625 1. 166 2. 118 ... 382 5. 291 1980 0 2 . 231 2. 137 960 122 362 5. 812 1981 1982
0 0
1.558 2. 387
3. 334 2. 830
1.852 1. 690
558 567
629 9 10
7 . 931 8.384
1983 0 2. 063 594 453 83 444 3. 637 1984 0 702 1. 294 ... 126 355 2 . 477 1985 0 2. 380 1. 598 1.490 147 319(F) 5. 934

0 4 1 6 3 3 -
0 4 1 6 3 5
0 4 1 6 5 4
0 4 1 7 1 6 0 4 1 7 1 7
0 4 1 7 2 0 0 4 1 7 2 5
0 4 1 7 2 6
0417’27
0 4 1 9 6 2
0 4 1 9 6 3
0 4 2 0 0 2
1 1 1 6 2 5 A ”
0 4 2 1 1 1
0 4 2 1 1 2
0 4 2 1 1 3
0 4 2 1 1 4
0 4 2 1 4 6
5 0 7 1 9 7 6
1 9 7 6
6 , 6 7 7 1 9 7 8
3 5 7 1 9 7 6
4 2 0 1 9 7 6
5, 2 2 3 1 9 7 7 2, 8 1 9 1 9 7 7
4, 2 6 5 ” 1 9 7 9
4 , 3 7 7 * 1 9 7 9
4, 8 2 6 “ 1 9 7 9 8, 5 5 5 ” 1 9 7 9
7 , 1 7 0 * 1 9 7 9
1 7 , 4 8 7 1 9 7 8
8 , 0 3 8 * 1 9 8 0
9 , 3 7 7 * 1 9 8 0
9 , 9 8 4 * 1 9 8 0
9, 4 6 3 * 1 9 8 0
3, 2 0 9 * 1 9 8 0
7 3 . 9
. . .
64 . 4
73 . 9 73. 9
6 3 . 6 63. 6
63 . 1
63 . 1
63. 1 63. 1
63. 1
64 . 4
57. 8
57. 8
57. 8 57. 8
57. 8
Mainstem S t i k i n e , Tagged a t Mouth by Coho R e s e a r c h , May, 1 9 7 8
Mains tem S t i k i n e , ( a t l e a s t o n e j u v e n i l e c h i n o o k t a g g e d w i t h c o h o c o d e )
Mains tem S t i k i n e , n e a r P o r c u p i n e Mouth, O c t . 1 9 7 9
Mains tem S t i k i n e , n e a r I s k u t Mouth, May 1 9 7 8
L i t t l e T a h l t a n , S e p t . 1 9 7 8
f l a i n s t e m S t i k i n e , n e a r P o r c u p i n e Mouth, S e p t . 1 9 8 0
Same a s above , O c t . 1 9 8 0
Same a s above , S e p t . 1 9 8 0
Same a s above , Nov. 1 9 8 0
Same a s above , S e p t . 8 O c t . 1 9 7 9
Same as above , S e p t . 1 9 8 1
Same a s above , S e p t . 8 Oct. 1 9 8 1
Same a s above , O c t . 1 9 8 1
Same a s above , O c t . 8 Nov. 1 9 8 1
. . .
. . .
. . .
. . .
. . .
. . .
. . .
96. 5
96 . 5
96. 5 96. 5
96. 5
. . .
93. 0
93 . 0 93. 0
93. 0
it C o r r e c t e d f o r j u v e n i l e i n r i v e r t a g loss ** T h i s c o d e was u s e d i n p l a c e of codes 0 4 2 0 0 4 and 0 4 2 0 0 5
-70-
9 3 . 0

salmon smolts and 101,470 young-of-the-year were marked by removal of adipose fins and coded-wire tagged (Table 20).
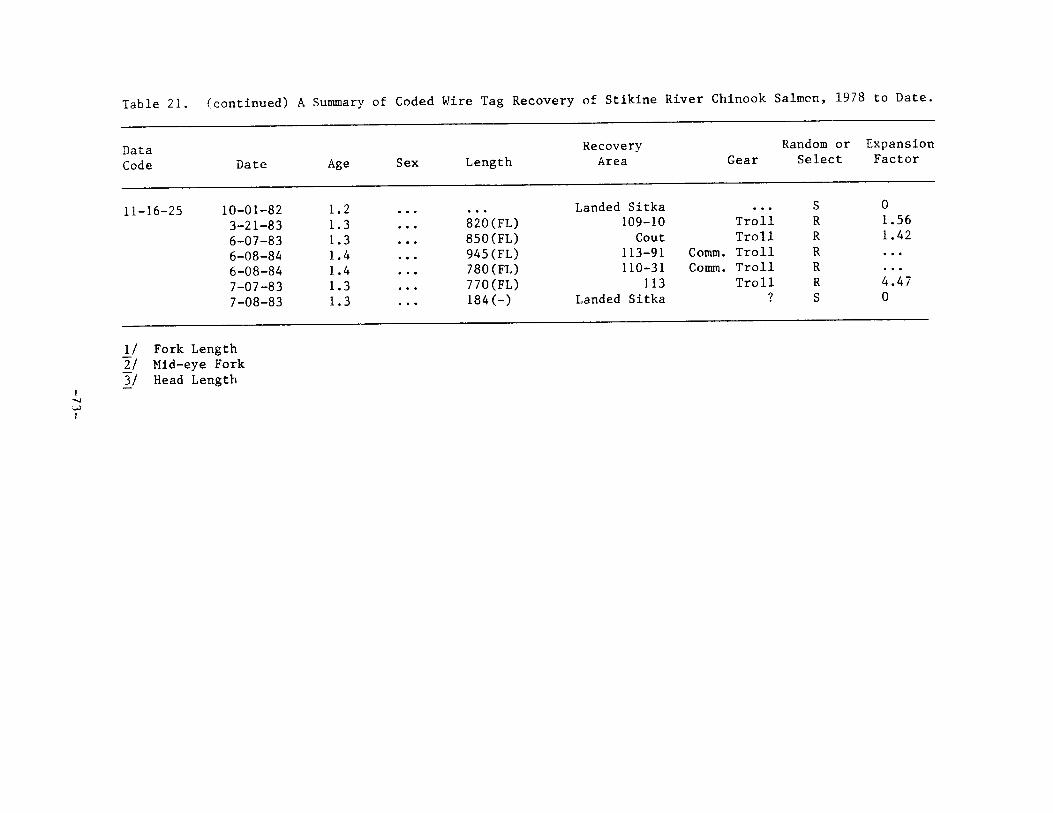
Rased on 30 fishery recoveries of coded-wire tagged Stikine River chinook salmon (Table 21) , the major areas of harvest in southeast Alaska are commercial fishing districts 109, 110 (37% of the harvest) and 113 (33% of the harvest). Based on these coded-wire tag recoveries, it appears that the majority of the upriver Stikine chinook salmon rear offshore beyond southeast Alaska's fisheries and return by passing Cape Ommaney as they migrate towards the Stikine River at maturity. The farthest north recovery of a Stikine River coded-wire tagged chinook salmon occurred in 1984 in the Bering Sea.
Alsck River Studies
Iiit roduct ion:
The Alsek River is a large, glacial river system with headwaters in the Yukon Territory. It flows soutli through British Columbia before flowing into the Gulf of Alaska, about 96 kilometers southeast of Yakutat. Lowell Glacier, which has at times completely blocked the mainstem Alsek River, has been the major barrier to anadromous fish migration to over 50% of the drainage. Kokanee salmon have been documented in areas above Lowell Glacier, thus suggesting that the area was open to anadromous salmonids in the past. The three major activities in the lower river are commercial fishing, which presently occurs from mid-June through early October, hunting during the spring and fall, and recreational float trips during July and August that usually originate in the Yukon Territory.
Drift Gill Net Fishery:
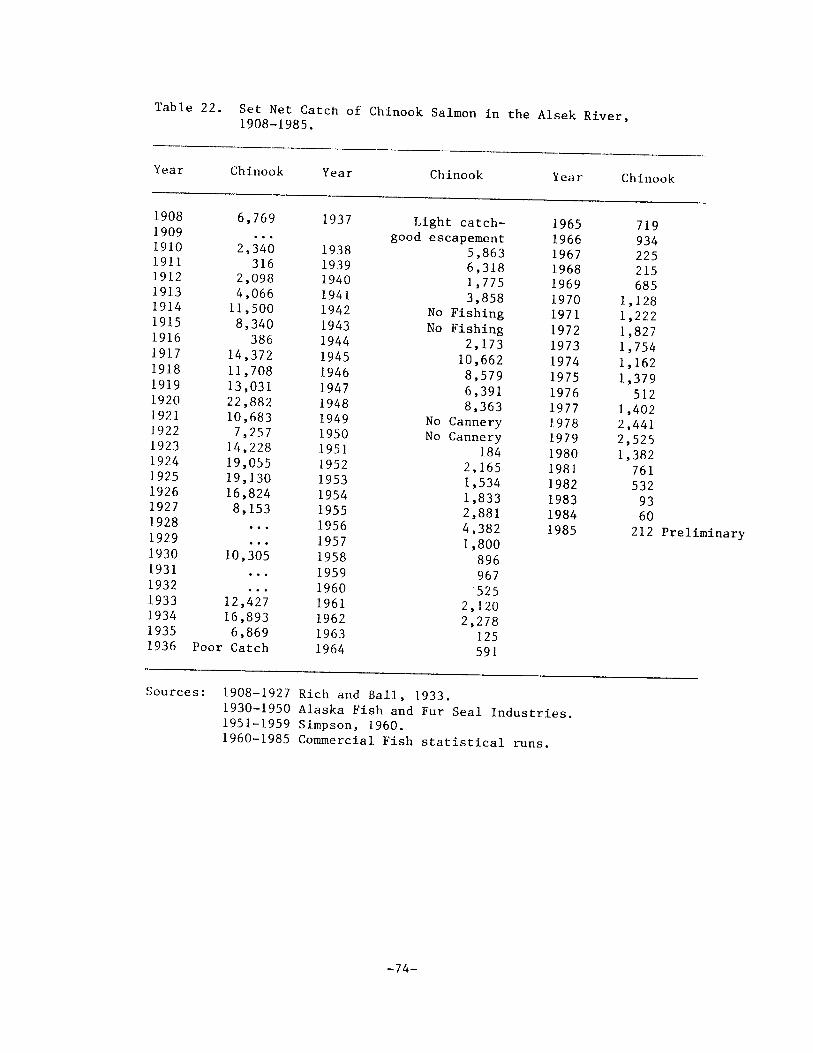
A commercial gill-net fishery for chinook salmon began about 1901 (Moser 1902) and catch records are available from 1908 to the present. The Alsek River gill-net fishery is conducted almost entirely in-river; thus, most of the chinook salmon caught are maturing Alsek fish.
The chinook salmon catch has been extremely variable in the last 77 years, ranging from 60 to 22,882 fish (Table 22). Part of the variability was caused by the lack of or the difficulty in transporting the fish to market and partly by regulatory changes.
The fishery was first regulated in 1924 when fishing was closed from 11 August through 31 August. This did not affect the gill-net fishery for chinook salmon, but the closure of the "Basin" in 1925 did have an impact on the catch. The amount of gear was first limited in 1926 when a maximum of 200 fathoms of gill-net could be fished; it was increased to 250 fathoms in 1927, and a 60-hours per week closure was imposed. Also in 1927, Dry Bay was closed to fishing before 15 May which permitted passage of part of the escapement before the fishery opened. The opening date was changed in 1950 from 15 May to 1 June to further increase stock protection.
-71-


To determine if the chinook salmon stock had rebuilt, experimental early openings (15 May) were conducted during 1961 and 1962. The catches during those 2 years were still low, and it was concluded that the Alsek River chinook salmon stock was still at a low level of abundance.
Chinook salmon catches have been very low during the past 3 years because of closures of the upper fishing area to protect late entering and milling chinook salmon. In December 1985 the Alaska Board of Fisheries gave managers the emergency-order authority to restrict "king gear" till the stock is rebuilt.
Escapement:
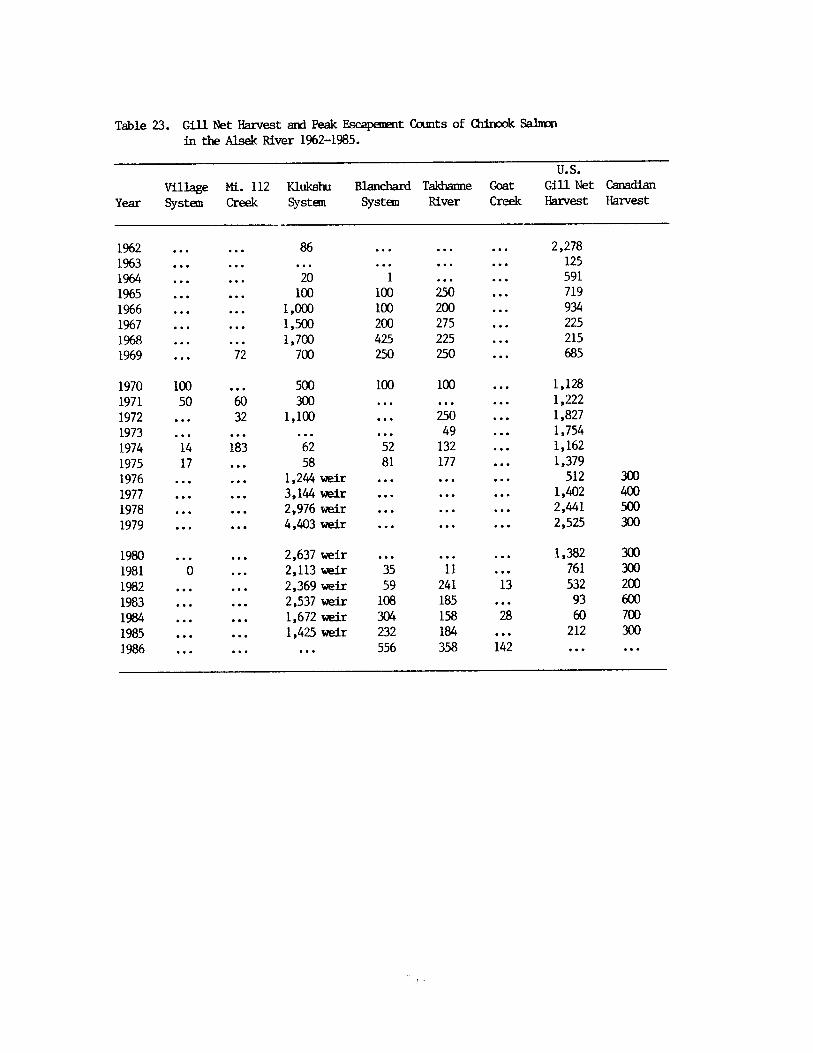
Limited escapement data have been collected on various tributaries of the Alsek River since 1962 (Table 23). Before 1976 escapement estimates were usually made utilizing fixed wing aircraft. Since that time, the Canadian Department of Fisheries and Oceans has operated a weir at the junction of the Kluckshu and Tatshenshini Rivers to enumerate chinook and sockeye salmon into the Kluckshu drainage. In addition, the ADF&G began enumerating chinook salmon in several index tributaries by helicopter in 1981.
Despite nearly complete protection of Alsek River maturing chinook salmon in the terminal area, the 1985 escapement through the Klukshu weir was the lowest since 1976. The escapement was only 55.5% of the 9-year average and 44.5% of the escapement goal.
Juvenile Chinook Studies:
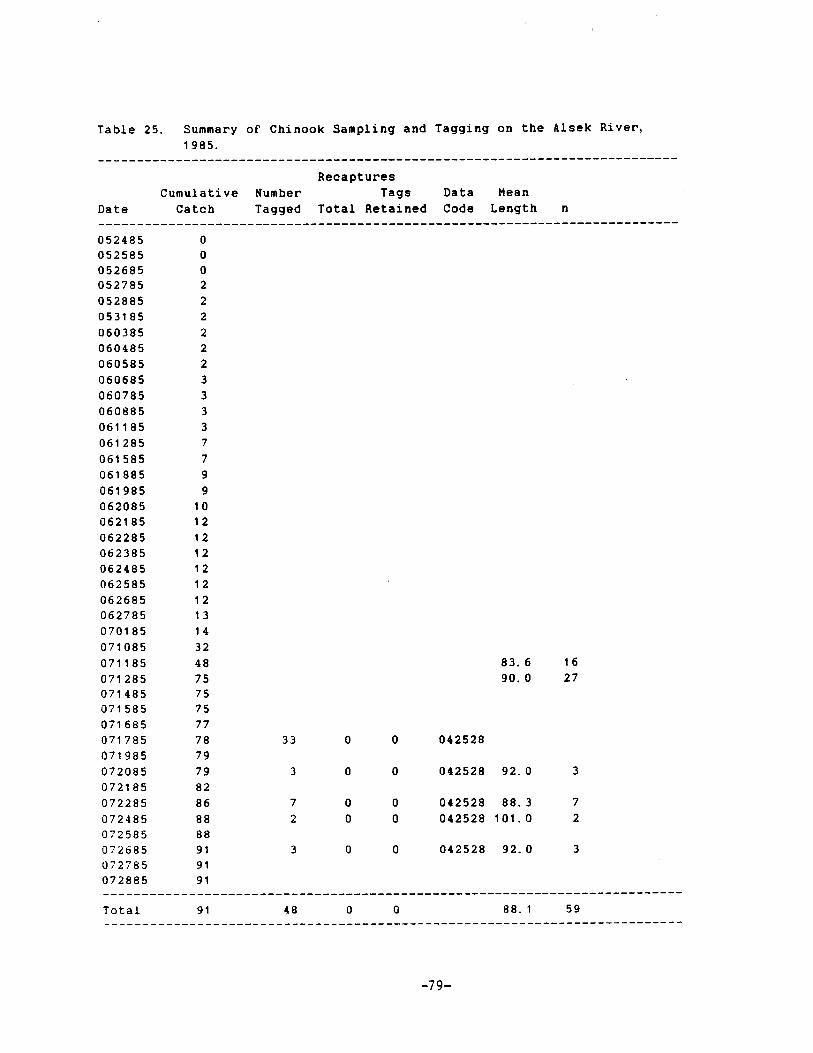
To determine migration routes, areas and timing of exploitation, exploitation rates, and contributions to various fisheries, attempts were made to capture and coded wire tag Alsek River chinook salmon smolt in the lower river from May 24 through July 28, 1985.
A total of 9 1 chinook salmon smolts, 275 juvenile coho salmon, 1,202 juvenile sockeye salmon, 1,047 Dolly Varden char, Salvelinus mazma (Walbaum), of various age classes (Table 24) and numerous starry flounder, PZatichthys s t e l l u t u s (Pallas), cottids, Cottus sp., eulachon, Thuleichthys pacificus (Richardson), and round whitefish, Prosopiwn cylindracewn (Pallas), were captured.
Since scales from Alsek River adult chinook salmon often display several circuli of plus-growth after the freshwater annulus, it was felt that juvenile chinook salmon would mill and feed in the lower river €or a period of time before migrating out to sea. However, based on the 1985 study, it appears that chinook salmon smolts migrate out of the lower river very rapidly. With the amount of effort conducted seining, more juveniles should have been captured if juvenile chinook rearing densities were very high,
Another possibility was that the outmigration occurred before we conducted operations in the lower river. Because of deep snow and late breakup, we were unable to begin work until 22 May. Future efforts should focus on sampling the lower river from approximately 20 April to
-77-

1 June and the upper rivers (Kiukshu and Tatshenshini) in late September and October.
During operations on the Alsek River, 48 chinook salmon smolts averaging 88.1 nun were ad-lposc? clipped, coded wire tagged, and released (Table 25). A totnl of 643 juvenile sockeyc salmon averaging 71.9 rmn (Table 26) and 105 juvenile coho salmon averaging 87.1 mm (Table 27) were incidentally captured and coded wire tagged.
Situk River Studies
Introduction:
The Situk River system, which is located about 16 kilometers east of Yakutat, includes Mountain and Situk Lakes. The system has a combined area o f approximately 485 surface hectares and approximately 40 kilometers of river. The Situk River produces five species of Pacific salmon. It is classified as a medium-producing chinook salmon system; the annual total return is estimated to be from 1,500 to 10,000 adults.
Set Gill Net Fishery:
A set gill-net fishery is concentrated at the mouth of the Situk River along the Mainland and Blacksand Spit. Most of the chinook salmon harvested are maturing Situk River fish. The chinook salmon are taken incidentally to the much larger returns of sockeye salmon. The chinook salmon catch has varied between 164 and 2,499 f i s h . The recent 10-year average harvest is 672 chinook. A total of 472 chinook salmon were caught during the 1985 commercial fishing season.
A small but increasingly popular sport fishery for chinook salmon occurs in the Situk River. During 1985 an estimated 529 chinook salmon of all age classes were harvested.
Escapement:
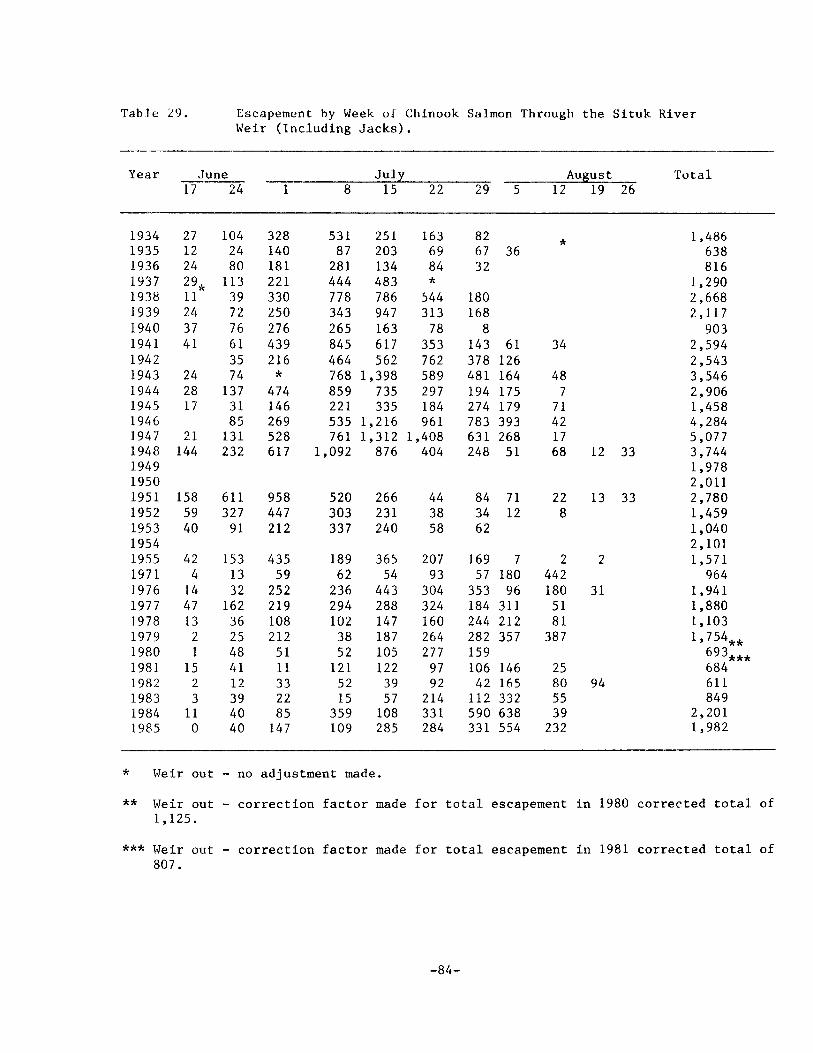
A weir was operated in the lower Situk River at the upper limit of the intertidal area from 1928 until 1955 to enumerate all five species of Pacific salmon. Another weir, located below the 9-mile highway bridge, was operated during 1971 and from 1976 through 1985. Estimates of the minimal total return of chinook salmon (including sport and commercial harvest in the terminal area) have varied between 916 and 5,962 chinook salmon (Table 2 8 ) . Chinook salmon escapement data by week through the Situk River weir are presented in Table 29 .
Juvenile Chinook Studies:
Because of the continued depressed returns of Situk River chinook salmon, coded-wire tagging o f smolt was conducted during 1984 in an attempt to determine the areas of exploitation and harvest rates of adult chinook in various fisheries (Table 30). A total of 11,297 juvenile chinook salmon were captured and tagged from 14 June through 6 July 1984 (Kissner 1 9 8 5 ) .
-78-


Studies conducted during 1984 indicated that large numbers of young-of-the-year chinook salmon were available for coded-wire tagging in the lower kilometer of the Situk River in late June through July. However, probably as the result of a very late spring, cold-water temperatures, and later emergence of fry than normal, outmigration timing was delayed during 1985. Sampling of the lower river on 21 June, 1 July, and 3 July produced only coho smolts and fry. Juvenile chinook salmon were first observed in the lower kilometer of the river on 8 July. By 20 July, juvenile chinook had moved into the lower river in increased numbers, but they were still quite small (mean fork length = 67.6 mm). Because of other project commitments, the Situk River was not sampled again until late August. Good numbers of juvenile chinook salmon (averaging 88.3 mm fork length) were utilizing the lower river at that time.
Because of the late timing of movement into the lower river and other program commitments, it was not possible to coded wire tag juvenile chinook in the Situk River during 1985.
Coded Wire Tag Recovery:
Preliminary data on coded-wire tagged coho salmon recovered in various sport and commercial fisheries in 1985 are presented in Appendix 1. These fish were incidentally tagged during chinook coded-wire tagging during 1984.
Unuk River Studies
Introduction:
The Unuk River (Figure 4) is the largest chinook salmon system in Behm Canal, and only three major transboundary rivers, the Taku, Stikine, and Alsek, have larger chinook runs in southeastern Alaska. The 129-kilometer Unuk River drains an area of about 3,885 square kilometers of a very glaciated region of northern British Columbia, and only the lower 39 kilometers are in Alaska. The river discharges its flow into Burroughs Bay, 85 kilometers northeast of Ketchikan.
Drift Gill Net Fishery:
A drift gillnet fishery operated in Burroughs Bay from 1952 to 1956. During 1954-1956, an average of 1,668 chinook salmon were caught annually, with most of the harvest occurring during July (Table 31). The fishery was eliminated in 1957 because the runs of salmon to the Unuk River were not large enough to support a drift gill-net fishery.
Escapement:
Chinook salmon are enumerated annually in index tributaries (Kissnei- 1984) by foot andlor helicopter surveys during the peak of spawning activity. The 1985 observed chinook escapement of 1,164 in the Unuk River was 35.3% below the escapement goal of 2,880 and 5% above the ‘-year mean of 1,109 (Table 32).
-86-


Tab le 31. D r i f t G i l l Net Harves t of Chinook Salmon i n Burroughs Bay, Alaska.
Date 1954 1955 1956
J u l 12-16 782 373 889 J u l 17-21 427 240 768 JuI 22-26 160 478 113 . J U l 27-31 242 204 20 Aug 01-05 54 188 6 Aug 06-10 23 1 7 16 AUg 11-13 2 3 0
Total. 1,690 1,503 1,812
-88-

Juvenile Chinook Studies:
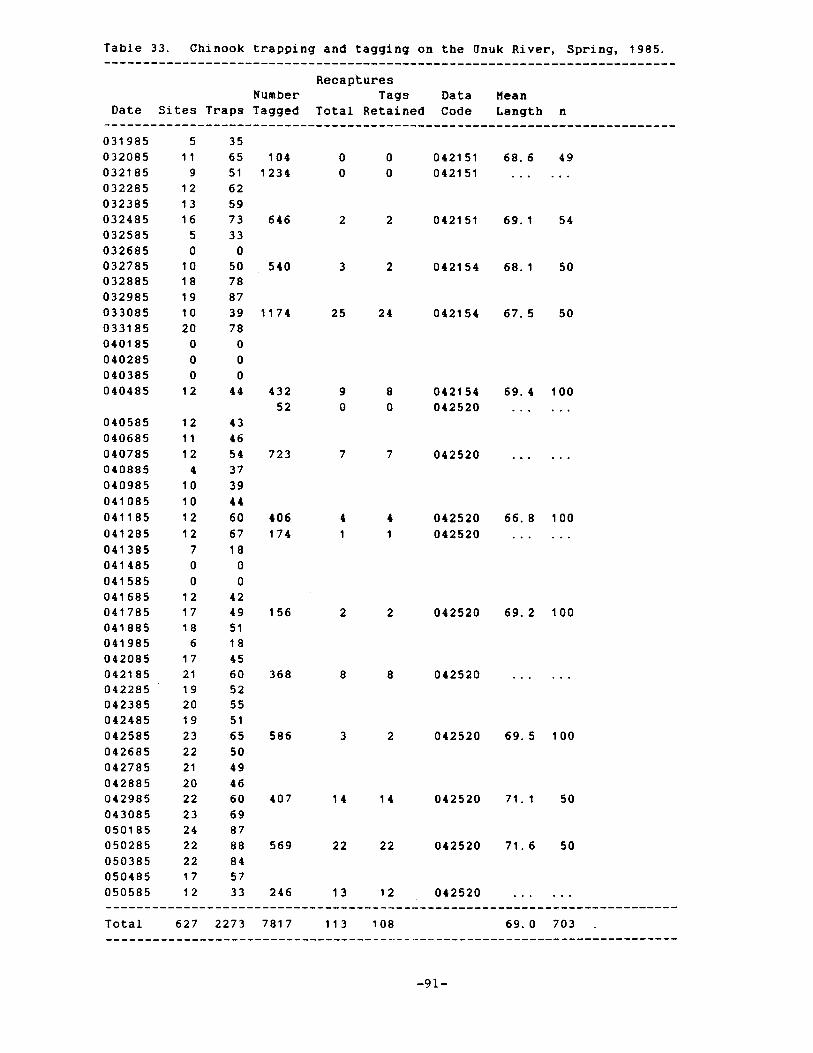
Minnow trapping and coded-wire tagging of chinook salmon smolts from the 1983 brood year were conducted on the mainstem Unuk River from 19 March through 5 May 1985. A total of 7,817 chinook salmon smolts averaging 69.0 nun (fork Length) were captured and tagged (Tables 33). In-river tag l o s s , as measured by recaptures, was estimated to be 4.4%. Applyingthis estimated l o s s to the total number of fish tagged yields an adjusted number of tagged juvenile chinook released of 7,473. An additional 11,350 juvenile coho salmon were incidentally captured and coded wire tagged (Table 34). The in-river tag l o s s was estimated to be 2.2%. Therefore, the adjusted number of tagged juvenile coho salmon released was 11,100. Summaries of coded-wire tag releases of Unuk River chinook and coho salmon are presented in Tables 35 and 36 .
All capturing of juvenile chinook salmon occurred below First Canyon, as previous distribution studies indicated that the density of juvenile chinook salmon above First Canyon was low. Additionally, Lava Falls, which is just below First Canyon, is unnavigable at most water stages. Tables 37 and 38 summarize sampling efforts to date.
Coded Wire Tag Recovery:
Recoveries of 13 coded-wire tagged chinook salmon during 1985 indicate that Unuk River chinook salmon are contributing to various southeast Alaska fisheries as immature fish (Table 39). Over 50% of the recoveries were made after the time that the spawning run would have entered the Unuk River. There were more fishery recoveries of l-ocean chinook salmon from the Unuk River's 1982 brood (29,443 were tagged) than from all fishery recoveries of l-ocean chinook salmon from all brood years from the Taku and Stikine River's tagging efforts (301,032 juveniles were tagged).
A summary of recoveries of coho salmon coded wire tagged on the Unuk River is presented in Appendix 2. A total of 44% of the observed recoveries occurred in commercial statistical area 101 (Appendix 4).
Log Salvage:
Salvage logging was not conducted in the Unuk River during 1985, although a Title-16 permit was issued to permit salvage of downed timber that had not been marked as critical chinook salmon habitat by the ADF&G in the Unuk River above the intertidal area. Salvage was also permitted in the intertidal areas of both the Chickamin and Unuk Rivers.
The major reason that salvage logging was probably not conducted during the spring of 1985 was that only 34 new downed trees greater than 10 inches in diameter were observed in the mainstem above Gene's Lake Creek to the intertidal area. This was represented 606 trees less than the average annual recruitment estimated by the Division of Forestry.
Seven new trees greater than 10 inches in diameter were observed in the Chickamin River from the spring of 1984 to May 1985 in the area from the Leduc-Chickamin junction down river to the intertidal area. Again this
-90-


was 443 trees less than the average annual recruitment estimated by the Division of Forestry.
It is felt that the 41 new trees that were observed in the Unuk and Chickamin Rivers comprised most of the recruitment between the spring of 1984 and 1985. It is also felt that few trees washed out of either river, as most of the habitat minnow trapped for juvenile chinook salmon has remained in place. Most of the habitat in these rivers has remained nearly the same since 1983.
Major sacrifices have been made by commercial and sport fishermen t o assist in the 15-year rebuilding program for southeast Alaska chinook salmon stocks. In addition, millions of dollars are being spent by the Federal and State governments and regional aquaculture associations to enhance chinook salmon production. Therefore, salvage logging should be eliminated in order to maximize production of chinook salmon in the Unuk and Chickamin Rivers.
Chickamin River Studies
Introduction:
The Chickamin River, a glacial mainland river that discharges its flow into Behm Canal (about 32 kilometers southeast of Burroughs Bay), is the second largest chinook salmon system in Behm Canal (Figure 5). It ranks fifth in chinook salmon production in Southeast, behind the Stikine, Taku, Alsek, and Unuk Rivers.
Escapement:
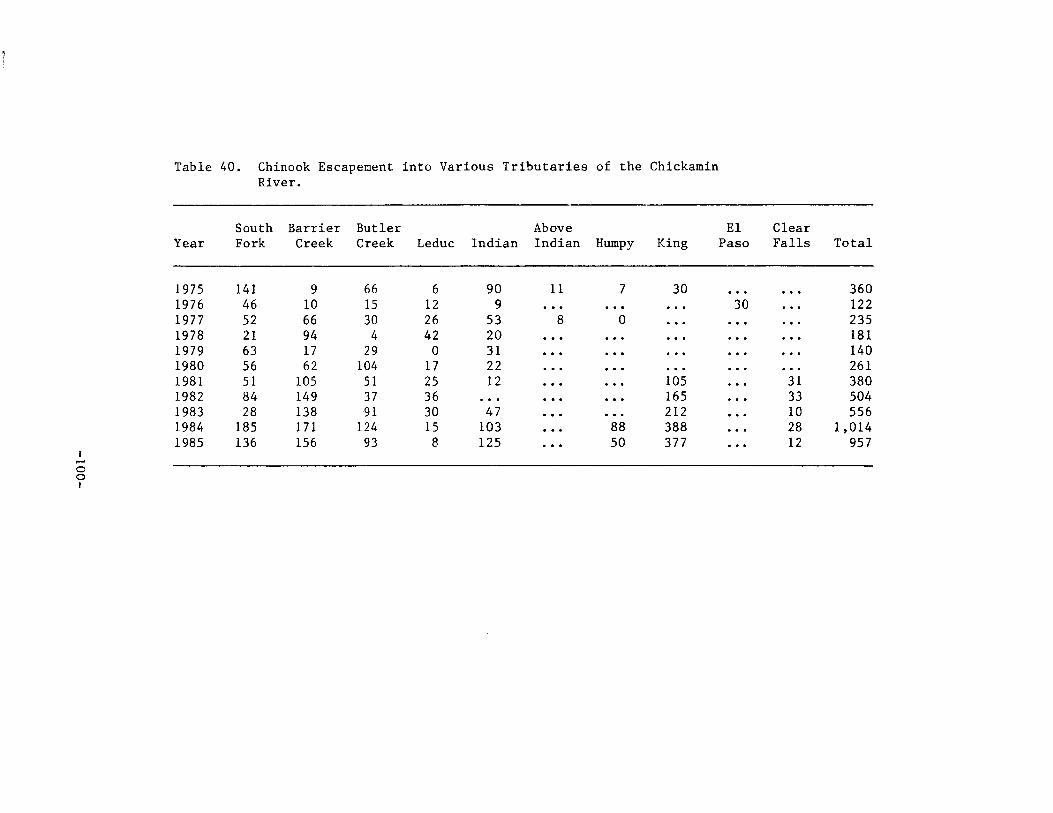
Chinook salmon are enumerated annually in the Chickamin River index tributaries (Kissner 1984) by foot and/or helicopter surveys during the peak of spawning. The 1985 observed escapement of 957 chinook salmon was 6.3% above the escapement goal of 900 and 124% above the 10-year mean escapement of 375 (Table 4 0 ) .
Juvenile Chinook Studies:
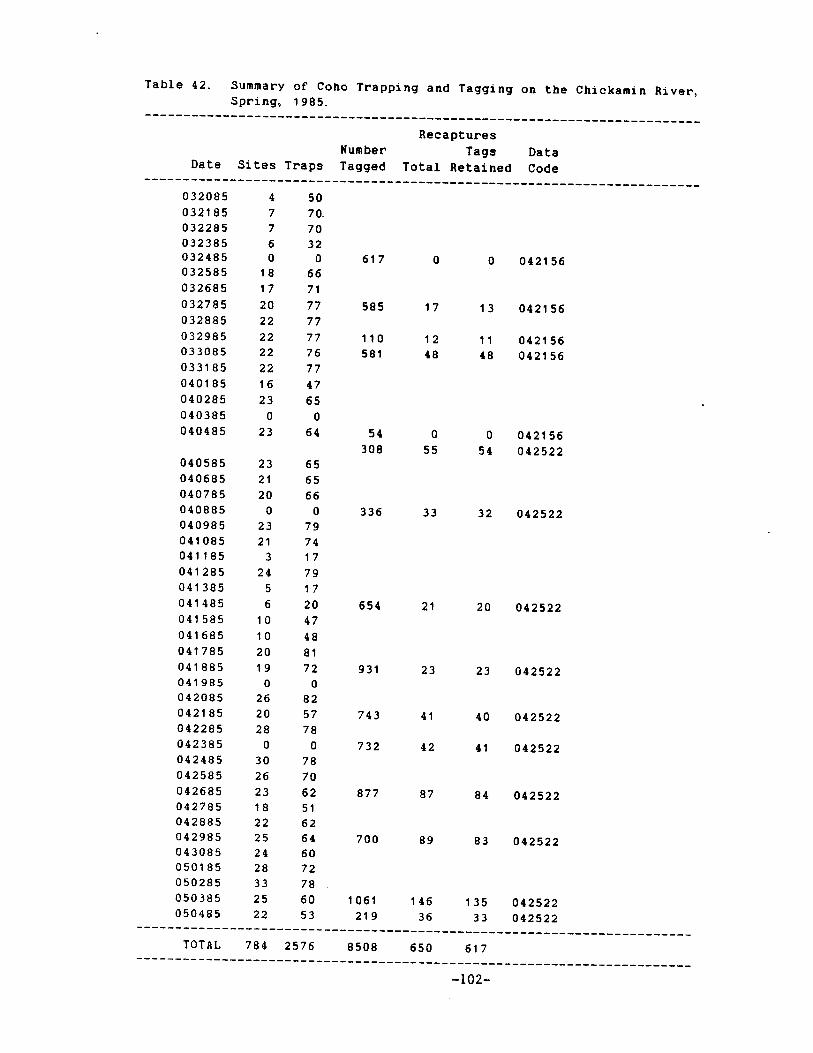
Trapping and coded-wire tagging of chinook salmon smolt from the 1983 brood was conducted on the mainstem Chickamin River from 19 March through 5 May 1985. A total of 4,293 chinook salmon smolt, averaging 77.6 mm (fork length), were captured and tagged (Table 41). In-river tag loss was estimated at 4 .2%. Applying this tag loss yields an adjusted number of 4,113 tagged chinook salmon smolts released. An additional 8,508 juvenile coho salmon were incidentally captured and coded wire tagged (Table 42). The in-river tag loss was estimated at 5.1%. Thus the adjusted number of coho salmon juveniles released was 8,074.
The capturing of juvenile chinook salmon in the Chickamin system occurred from about 1 kilometer above the junction of the mainstem and South Fork and downriver for approximately 15 kilometers. The highest densities of rearing chinook salmon were observed in the first 2.4 kilometers below the Leduc and South Fork junction, based on distribution studies conducted to date (Table 43).
-98-


A summary of chinook and coho salmon coded w i r e tagged i n t h e Chickamin River t o d a t e i s p resen ted i n Tables 44 through 46.
Coded Wire Tag Recovery:
Based on 15 coded-wire t a g r e c o v e r i e s of t h e 1981 brood and t h r e e from t h e 1982 brood ( a l l recovered du r ing t h e 1985 f i s h e r y ) , Chickamin River chinook salmon are c o n t r i b u t i n g t o Southeast f i s h e r i e s a t v a r i o u s l i f e h i s t o r y s t a g e s (Table 47 ) . Four f i s h e r y r e c o v e r i e s occurred du r ing October, confirming t h a t Chickamin chinook salmon are c o n t r i b u t i n g as immatures, u n l i k e t h e Taku and S t i k i n e River chinook salmon s tocks . There were more f i s h e r y r e c o v e r i e s du r ing 1985 of t h e 1981 brood (age-1.2) Chickamin chinook salmon from 2,352 tagged smolts t han from a l l age-1.2 f i s h e r y r e c o v e r i e s of Taku and S t i k i n e chinook salmon from the 301,032 juveniles tagged.
A summary of r e c o v e r i e s of coho salmon coded w i r e tagged on t h e Chickamin River i s p resen ted i n Appendix 3. A t o t a l of 42.3% of t h e observed r e c o v e r i e s occurred i n commercial s t a t i s t i c a l area 101.
Escapement i n Other Areas
Peak observed escapement coun t s of chinook salmon i n o t h e r index t r i b u t a r i e s monitored annua l ly are p resen ted i n Tables 48 through 51.
LITERATURE CITED:
K i s sne r , Paul D . , Jr. 1974. A s tudy of chinook salmon i n Southeast Alaska. Alaska Department of F i sh and Game , Annual r e p o r t 1973-1974, P r o j e c t F-9-6, 15(AFS-41).
. 1975. A s tudy of chinook salmon i n Southeast Alaska. Alaska Department of F i s h and Game , Annual r e p o r t 1974-1975, P r o j e c t F-9-7, 16(AFS-41).
. 1976. A s tudy of chinook salmon i n Southeast Alaska. Alaska Department of F i sh and Game, Annual r e p o r t 1975-1976, P r o j e c t F-9-8, 17(AFS-41).
. 1977. A s tudy of chinook salmon i n Southeast Alaska. Alaska Department of F i sh and Game, Annual r e p o r t 1976-1977, P r o j e c t F-9-9, 18(AFS-41).
. 1978. A s tudy of chinook salmon i n Southeast Alaska. Alaska Department of F i sh and G a m e , Annual r e p o r t 1977-1978, P r o j e c t F-9-10, 19(AFS-41).
. 1979. A s tudy of chinook salmon i n Southeast Alaska. Alaska Department of F i sh and G a m e , Annual r e p o r t 1978-1979, P r o j e c t F-9-11, 20(AFS-41).
. 1980. A s tudy of chinook salmon i n Southeast Alaska. Alaska Department of F i s h and Game , Annual r e p o r t 1979-1980, Project F-9-12, 21(AFS-41).
-104-


. 1982. A study of chinook salmon in Southeast Alaska. Alaska Department of Fish and Game, Annual report 1981-1982, Project F-9-14, 23(AFS-41).
. 1984. A study of chinook salmon in Southeast Alaska. Alaska Department of Fish and Game, Annual report 1983-1984, Project F-9-16, 25(AFS-41).
. 1985. A study of chinook salmon in Southeast Alaska. Alaska Department of Fish and Game, Annual report 1984-1985, Project F-9-17, 26(AFS-41).
Kissner, Paul D., Jr. and Michael R. Bethers. 1981. A study of chinook salmon in southeast Alaska. Alaska Department of Fish and Game, Annual report 1980-1981, Project F-9-13, 22(AFS-41).
Moser, J.F. 1902. Alaska salmon investigations in 1901. U.S. Fish. Comm. Bull. for 1901.
Prepared by: Approved by:
Paul D. Kissner E. Richard Logan, Ph.D, Director Fishery Biologist Division of Sport Fish
Dennis J. Hubartt Louis S. Bandirola, Deputy Director Fishery Biologist Division of Sport Fish
-1 13-