status of remote/off-grid communities in canada
TRANSCRIPT


Remote Communities in Canada FINAL
Table of Content
1. Context of Study ......................................................................................................................3
2. Overview of Canada’s Remote Communities .......................................................................4 General Information .............................................................................................................4 Electricity Infrastructure of Canadian Remote Communities ............................................6 Electricity Demand in Canadian Remote Communities ......................................................9 Why focus on Renewables in Remote Communities of Canada........................................11
3. Provincial/Territorial Information Details .........................................................................14 British Columbia .................................................................................................................14 Prairies ................................................................................................................................. 18 Ontario ................................................................................................................................. 20 Quebec ................................................................................................................................. 23 Newfoundland & Labrador .................................................................................................27 Yukon ................................................................................................................................... 29 Northwest Territories ..........................................................................................................32 Nunavut ............................................................................................................................... 36
4. Conclusions ............................................................................................................................39
Annex A: Collected Data by Provinces and Territories ..........................................................41 Annex B: Presentation of the Remote Communities Energy Database .................................42
Disclaimer
Aboriginal Affairs and Northern Development Canada (AANDC) and Natural Resources Canada (NRCan) accepts no responsibility or liability for any errors, inaccuracies and/or omissions in this report. The content of this report is a compilation of data obtained from many sources and the data is subject to change without notice. Neither AANDC nor NRCan warrant or guarantee that the information is accurate, complete or current at all times.
In no event will AANDC, NRCan or the Government of Canada and its employees be liable or responsible for any damages resulting from any such errors, inaccuracies or omissions nor will they be liable or responsible for any lost profits, loss of revenue or earnings, claims by third parties or for any economic, indirect, special, incidental, consequential or exemplary damage including but not limited to any demands or causes of action in contract, tort or otherwise including any liability for negligence.
August 2011 2/44
Remote Communities in Canada FINAL
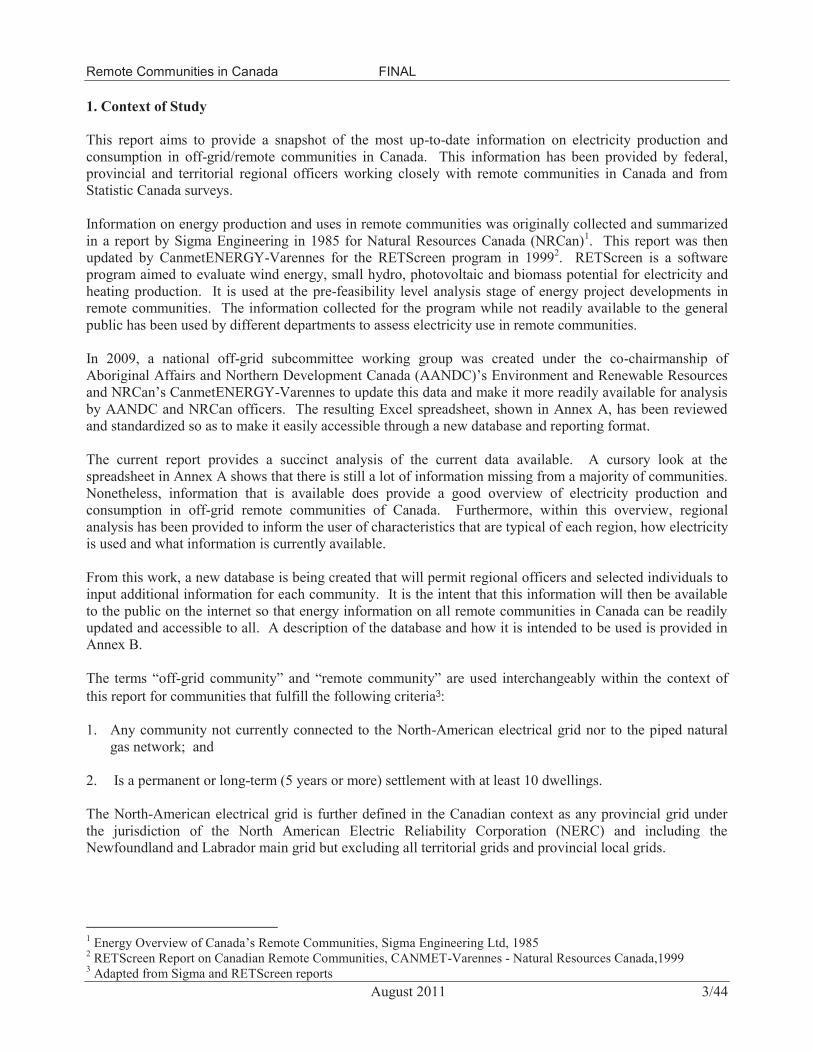
1. Context of Study
This report aims to provide a snapshot of the most up-to-date information on electricity production and consumption in off-grid/remote communities in Canada. This information has been provided by federal, provincial and territorial regional officers working closely with remote communities in Canada and from Statistic Canada surveys.
Information on energy production and uses in remote communities was originally collected and summarized in a report by Sigma Engineering in 1985 for Natural Resources Canada (NRCan)1 . This report was then updated by CanmetENERGY-Varennes for the RETScreen program in 19992 . RETScreen is a software program aimed to evaluate wind energy, small hydro, photovoltaic and biomass potential for electricity and heating production. It is used at the pre-feasibility level analysis stage of energy project developments in remote communities. The information collected for the program while not readily available to the general public has been used by different departments to assess electricity use in remote communities.
In 2009, a national off-grid subcommittee working group was created under the co-chairmanship of Aboriginal Affairs and Northern Development Canada (AANDC)’s Environment and Renewable Resources and NRCan’s CanmetENERGY-Varennes to update this data and make it more readily available for analysis by AANDC and NRCan officers. The resulting Excel spreadsheet, shown in Annex A, has been reviewed and standardized so as to make it easily accessible through a new database and reporting format.
The current report provides a succinct analysis of the current data available. A cursory look at the spreadsheet in Annex A shows that there is still a lot of information missing from a majority of communities. Nonetheless, information that is available does provide a good overview of electricity production and consumption in off-grid remote communities of Canada. Furthermore, within this overview, regional analysis has been provided to inform the user of characteristics that are typical of each region, how electricity is used and what information is currently available.
From this work, a new database is being created that will permit regional officers and selected individuals to input additional information for each community. It is the intent that this information will then be available to the public on the internet so that energy information on all remote communities in Canada can be readily updated and accessible to all. A description of the database and how it is intended to be used is provided in Annex B.
The terms “off-grid community” and “remote community” are used interchangeably within the context of this report for communities that fulfill the following criteria3:
1. Any community not currently connected to the North-American electrical grid nor to the piped natural gas network; and
2. Is a permanent or long-term (5 years or more) settlement with at least 10 dwellings.
The North-American electrical grid is further defined in the Canadian context as any provincial grid under the jurisdiction of the North American Electric Reliability Corporation (NERC) and including the Newfoundland and Labrador main grid but excluding all territorial grids and provincial local grids.
1 Energy Overview of Canada’s Remote Communities, Sigma Engineering Ltd, 1985 2 RETScreen Report on Canadian Remote Communities, CANMET-Varennes - Natural Resources Canada,1999 3 Adapted from Sigma and RETScreen reports
August 2011 3/44

Remote Communities in Canada FINAL
2. Overview of Canada’s Remote Communities
General Information
Using the above defined criteria, there are currently 292 Canadian remote communities with a total population of approximately 194,281 people (2006 Statistics Canada Census) in Canada. These communities include Aboriginal and non-Aboriginal settlements, villages or cities as well as long-term commercial outposts and camps for mining, fishing and forestry activities.
Of these, 170 sites are identified as Aboriginal communities (First Nations, Innu, Inuit or Métis) with approximately 126,861 people living in these sites. The remaining 122 communities are cities, villages or commercial outposts that are predominately non-Aboriginals or under non-Aboriginal governments, with approximately 67,420 people living in them.
Table 2.1: Number of Remote Communities in Canada and Population4
Province or Territory Type # Sites Population
British Columbia (BC) 86 24 068 Aboriginal 25 7 619 Non-Aboriginal 61 16 449
Alberta (AB) 2 533 Aboriginal 0 0 Non-Aboriginal 2 533
Manitoba (MB) 7 3 063 Aboriginal 4 2 160 Non-Aboriginal 3 903
Saskatchewan (SK) 1 57 Aboriginal 1 57 Non-Aboriginal 0 0
Ontario (ON) 38 21 342 Aboriginal 25 14 236 Non-Aboriginal 13 7 106
Quebec (QC) 44 34 729 Aboriginal 19 15 452 Non-Aboriginal 25 19 277
Newfoundland and Labrador (NL) 28 8,910 Aboriginal 16 5 634 Non-Aboriginal 12 3 276
Yukon (YT) 22 30 176 Aboriginal 21 29 840 Non-Aboriginal 1 336
Northwest Territories (NT) 38 41 950 Aboriginal 33 22 410 Non-Aboriginal 5 19 540
Nunavut (NU) 26 29 453 Aboriginal 26 29 453 Non-Aboriginal 0 0
Grand Total 292 194 281
4 Population figures were obtained from Statistics Canada 2006 Census as reported by the off-grid subcommittee working group.: http://www12.statcan.gc.ca/census-recensement/2006/rt-td/ap-pa-eng.cfm
August 2011 4/44

Remote Communities in Canada FINAL Province or Territory Type # Sites Population
Aboriginal 170 126 861 Non-Aboriginal 122 67 420
Over the past twenty-five years5, the number of remote communities has decreased from 380 to 292, primarily as a result of grid extension and abandonment of communities due to relocation to larger villages or cities.
The overall population from 2006 census shows that there are just over 195,335 people living in these communities, which is practically the same as the 196,255 estimated in 1985. This shows that even when the number of communities has decreased, the populations have actually increased.
It is noteworthy that these estimates include those people living in three large communities of more than 10,000 people. The communities of Yellowknife (18,700), Whitehorse (22,900) and Magdalene Islands (13,180), represent about 28% of all people living in remote communities.
The remaining 141,500 inhabitants are scattered over the majority of Canada’s land-mass, along the Atlantic, Arctic and Pacific coasts, throughout the interior boreal forest and tundra of the three territories and northern areas of most provinces and in the interior mountain regions of British Columbia. It is also to be noted that Prince Edward Island, New Brunswick and Nova Scotia do not have any off-grid communities.
The following map shows where these remote communities are located. Green dots show Aboriginal communities while yellow dots show non-Aboriginal sites. The map also provides the extent of the electrical grid above 65 kV (sub-transmission and transmission grids).
Figure 2.1: Remote communities and 65 kV grid lines and above Green: Aboriginal communities / Yellow: Non-Aboriginal communities
5 The first major energy report on Remote Communities was made by Sigma Engineering Ltd for NRCan in 1985, followed by an update by CANMET-Varennes’ RETScreen group in 1999.
August 2011 5/44

Remote Communities in Canada FINAL
Electricity Infrastructure of Canadian Remote Communities
The electricity infrastructures of Canadian off-grid remote communities are diverse and vary depending on access to energy resources, remoteness of location and impact of climate. However, with the exception of a few local hydro grid-tied communities in Yukon, Northwest Territories and Quebec, the vast majority of remote communities across Canada rely on diesel generation for the production of electricity. Thus, most of these communities are characterised by a high degree of dependence on imported fuel and high energy costs.
The communities’ power plants are operated by a number of bodies that range from provincial or territorial utilities, independent service providers, regional governmental organisations, and, in some cases, to Aboriginal bands themselves. In most cases these are subsidised by organisations such as electric utilities, regional governments or Aboriginal Affairs and Northern Development Canada (AANDC). Because of this, they are subsidised at very different rates and levels and it is often very difficult to perceive what is the real cost of electricity or energy service delivered to the community because of the many different parties involved.
A total of 251 communities have their own fossil fuel power plants totalling 453.3 MW. Of these, 176 are diesel fuelled, two are natural gas powered and 73 are from unknown sources but most likely diesel power plants or gasoline gensets in smaller settlements. A breakdown of these power plants is provided in the table below.
Table 2.2: Total Capacity of Fossil Fuel Power Plants in Remote Communities Province or
Territory Main Power Source Fossil Fuel Generation
Type FF Capacity
kW Number of Sites
AB Fossil Fuel (FF) Diesel 1450 1 AB Total 1450 1 BC FF Diesel
Diesel Restricted* Unknown
63894 26 20 1
3838 35 Hybrid (both FF and Renewable sources) Diesel 305 1 Hydro Diesel
Diesel backup 250 1
2650 1 Unknown Unknown 0 15
BC Total 70957 80 MB FF Diesel
Diesel Restricted Unknown
1775 2 5400 4
0 1 MB Total 7175 7 NL FF Diesel
Unknown 20993 24
525 2 Hybrid Diesel 2775 1 Unknown Unknown 0 1
NL Total 24293 28 NT FF Diesel
Natural gas Natural Gas/Diesel
49559 22 2120 1
12380 1 Hydro Diesel
Diesel backup 27660 1
6150 1 Local Grid Diesel backup 16812 5 Unknown Unknown 0 3
NT Total 114681 34
August 2011 6/44

Remote Communities in Canada FINAL Province or
Territory Main Power Source Fossil Fuel Generation
Type FF Capacity
kW Number of Sites
NU FF Diesel 50295 25 Unknown Unknown 0 1
NU Total 50295 26 ON FF Diesel
Diesel Restricted Unknown
21040 2400 1305
21 3 7
Hybrid Diesel 825 1 Unknown Unknown 0 6
ON Total 25570 38 QC FF Diesel
Unknown 106395
530 21 3
QC Total 106925 24 SK FF Diesel 350 1 SK Total 350 1 YT FF Diesel 8900 6
Hydro Diesel backup 27000 2 Local Grid Diesel backup 15700 5
YT Total 51600 13 Grand Total 453296 251
*Diesel generation is restricted to a few hours during the day Note: FF = fossil fuels and RE = renewable energy
Eleven power plants are hydro based (see below) with a total generating capacity of 153.1 MW. Seven out of these eleven hydro sites also serve other communities than their own through local grids as shown in the next table.
Table 2.3: Capacity of Renewable Power Plants in Remote Communities Province or
Territory Community/Site/Settlement Name Main Power
Source Renewable
Project: Type Capacity
kW Hydro Comm.
BC Atlin Renewable Energy (RE) Hydro 2100
1
Iskut/Eddontenajon RE Hydro 2200 1
Kitasoo RE Hydro 1700 1
BC Total 6000 3
NT Fort Providence (Deh Gah Gotie Dene Council ) RE Hydro 1480
1
Fort Simpson (Lidii Kue First Nation) FF Hydro 25 1 Fort Smith (Salt River First Nation #195) RE Hydro 18000
6
Yellowknife RE Hydro 30300 4
NT Total 49780 11
ON Deer Lake Hybrid Hydro 490 1
ON Total 490 1
QC La Tabatiere RE Hydro 21000 13
QC Total 21000 13
YT Mayo RE Hydro 5000 4
Whitehorse RE Hydro 70810 11
YT Total 75810 15 Grand Total (11 hydro sites, 46 communities) 11 153105 46
Note: FF = fossil fuels and RE = renewable energy
August 2011 7/44

Remote Communities in Canada FINAL A total of 63 sites are connected to 14 local grids (either hydro or diesel based) with some using diesel generators as backup power should the line fail or when hydro power cannot respond to the full demand. This may happen especially in winter when power failure can be critical.
Table 2.4: Capacity of Power Plants Connected to Local Grids Province
or Territory
Local Grid Power Plant Name
FF Capacity
kW
RE Capacity
kW
Total Communities
AB Trout Lake 1450 n/a 1 n/a n/a 1
AB Total 2
BC
Bella Bella 8750 n/a 1 n/a n/a 1
Bella Coola 7630 n/a 1 n/a n/a 1
Masset 11524 n/a 1 n/a n/a 1
Sandspit 13600 n/a 1 n/a n/a 3
BC Total 10
NL Mary's Harbour 1300 n/a 1 n/a n/a 1
NL Total 2
NT
Taltson 302 n/a 1 950 n/a 1
6150 18000 1 7100 n/a 1
n/a n/a 2 Yellowknife Snare System 1100 750 1
7360 n/a 1 27660 30300 1
n/a 69 1 NT Total 10
QC
Cap aux Meules 67200 n/a 1 n/a n/a 6
Kuujjuarapik 3405 n/a 1 n/a n/a 1
Lac Robertson n/a n/a
21000 1 12
QC Total 22
YT
Destruction Bay 700 n/a 1 n/a n/a 1
Mayo 2000 5000 1 6000 n/a 1
n/a n/a 2 Whitehorse-Aishihik-Faro (WAF) grid 1000 n/a 1
1500 n/a 1 1800 n/a 1 5400 n/a 1
25000 70810 1 n/a n/a 6
August 2011 8/44
Remote Communities in Canada FINAL Province
or Territory
Local Grid Power Plant Name
FF Capacity
kW
RE Capacity
kW
Total Communities
YT Total 17 Grand Total 14 208 881 145 929 63
NA: Not Applicable. Sites connected to local grid with no back-up power. Renewable (RE) plants are currently all hydro plants except for small wood pellet generation in Yellowknife.
Electricity Demand in Canadian Remote Communities
It is difficult to assess the current electricity production and uses for remote communities. These communities are scattered over vast regions comprising seven provinces and three territories and while regional bodies in charge of a group of communities might have good knowledge about a particular aspect of energy uses in these communities, this information is not readily shared and is often difficult to collate in a common format.
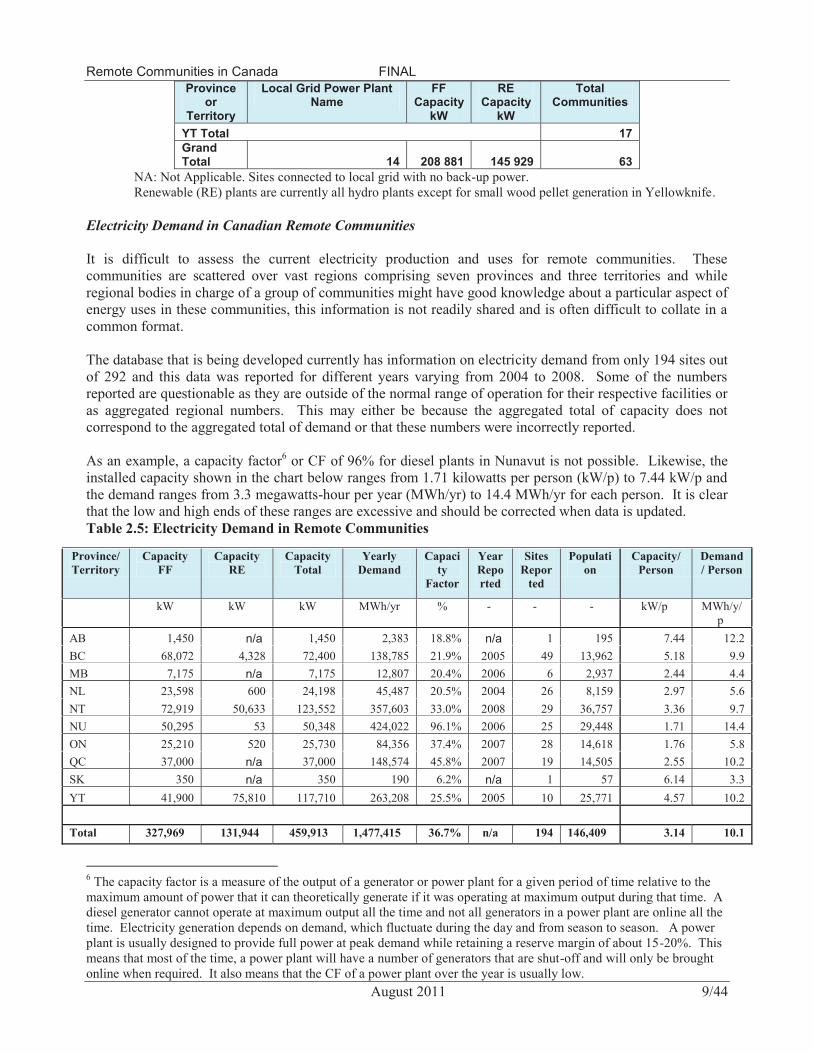
The database that is being developed currently has information on electricity demand from only 194 sites out of 292 and this data was reported for different years varying from 2004 to 2008. Some of the numbers reported are questionable as they are outside of the normal range of operation for their respective facilities or as aggregated regional numbers. This may either be because the aggregated total of capacity does not correspond to the aggregated total of demand or that these numbers were incorrectly reported.
As an example, a capacity factor6 or CF of 96% for diesel plants in Nunavut is not possible. Likewise, the installed capacity shown in the chart below ranges from 1.71 kilowatts per person (kW/p) to 7.44 kW/p and the demand ranges from 3.3 megawatts-hour per year (MWh/yr) to 14.4 MWh/yr for each person. It is clear that the low and high ends of these ranges are excessive and should be corrected when data is updated. Table 2.5: Electricity Demand in Remote Communities
Province/ Capacity Capacity Capacity Yearly Capaci Territory FF RE Total Demand ty
Factor
kW kW kW MWh/yr %
Year Repo rted
-
Sites Repor
ted
-
Populati Capacity/ Demand on Person / Person
- kW/p MWh/y/ p
AB BC MB
1,450 68,072 7,175
n/a4,328
n/a
1,450 72,400
7,175
2,383 138,785
12,807
18.8% 21.9% 20.4%
n/a 2005 2006
1 49 6
195 13,962 2,937
7.44 5.18 2.44
12.2 9.9 4.4
NL 23,598 600 24,198 45,487 20.5% 2004 26 8,159 2.97 5.6 NT 72,919 50,633 123,552 357,603 33.0% 2008 29 36,757 3.36 9.7 NU 50,295 53 50,348 424,022 96.1% 2006 25 29,448 1.71 14.4 ON 25,210 520 25,730 84,356 37.4% 2007 28 14,618 1.76 5.8 QC 37,000 n/a 37,000 148,574 45.8% 2007 19 14,505 2.55 10.2 SK 350 n/a 350 190 6.2% n/a 1 57 6.14 3.3 YT 41,900 75,810 117,710 263,208 25.5% 2005 10 25,771 4.57 10.2
Total 327,969 131,944 459,913 1,477,415 36.7% n/a 194 146,409 3.14 10.1
6 The capacity factor is a measure of the output of a generator or power plant for a given period of time relative to the maximum amount of power that it can theoretically generate if it was operating at maximum output during that time. A diesel generator cannot operate at maximum output all the time and not all generators in a power plant are online all the time. Electricity generation depends on demand, which fluctuate during the day and from season to season. A power plant is usually designed to provide full power at peak demand while retaining a reserve margin of about 15 -20%. This means that most of the time, a power plant will have a number of generators that are shut-off and will only be brought online when required. It also means that the CF of a power plant over the year is usually low.
August 2011 9/44

Remote Communities in Canada FINAL
Still, the aggregated numbers do give an indication about average capacity and demand for all of the remote communities of Canada and for individual provinces and territories.
As was stated above, the majority of off-grid communities rely on diesel generators for their electricity and on heating fuel for their heat. However, information on electricity generation and fuel consumption of diesel power plants is incomplete with only 100 sites reporting production out of a possible 257 sites that are diesel powered. The same can be said for electricity rates to consumers where only 114 sites with diesel generation have reported numbers.
The following table provides a breakdown of fuel purchased, diesel costs to utilities or service providers and electricity rates for sites where data was reported. Note that the table shows only a simplified electricity rate level based on average price paid. Besides an electricity rate, electrical utilities typically have monthly and demand charges that vary depending on the service providers.
Table 2.6: Fuel Purchased, Fuel Cost and Electricity Rate in Remote Communities Province/ Yearly Fuel Sites Perform- Diesel Last Electricity Sites Territory Demand Purchased with FP ance Cost to Year Rate to with ERC
(FP) Reported Utility Reported Consumer Reported
MW h/yr litre/yr litre/MWh $/litre $/kWh
AB n/a n/a n/a n/a n/a n/a n/a 0
BC 10,351 3,117,100 15 301.0 $ 0.37 2005 $ 0.37 15
MB n/a n/a n/a n/a n/a n/a $ 0.36 4
NL 7,206 2,373,206 2 329.3 $ 0.34 2004 $ 0.14 5
NT 83,225 14,218,794 25 170.8 $ 0.46 2008 $ 0.26 34
NU 424,022 40,280,886 25 95.0 $ 0.51 2006 $ 0.60 25
ON 77,423 20,186,525 24 260.7 $ 0.80 2007 $ 0.17 8
QC 17,200 4,314,593 2 250.8 $ 0.38 2007 $ 0.40 19
SK n/a n/a n/a n/a n/a n/a n/a n/a
YT 15,296 5,391,000 4 352.4 $ 0.36 2005 $ 0.26 1
Total 635,556 90,232,104 97 142.0 $ 0.46 n/a $ 0.32 111
The Performance column in the chart above provides an indication of how much fuel is used to produce electricity in a province or territory. While this would be a good indicator of the performance of power plants in a province or territory, this number must be used with caution because data provided for production and fuel purchase may not correspond to the same units or reported for the same years as there are large gaps in reporting. Still, the numbers provided do give an indication on the overall performance of diesel power plants in producing electricity.
Estimates for bulk delivered diesel fuel prices are highly dependent on the mode of transportation to the delivery site. In fact, fuel prices in communities that are accessible only by air can be up to twice the amount paid in communities accessible by barge or road. Thus, air access communities generally have higher fuel costs and often higher electricity rates.
For example, many of Ontario’s remote communities are serviced by plane and hence they are shown to pay the highest for diesel fuel while Newfoundland communities where fuel is barged in pay the lowest. However, both have low electricity rates, showing that electricity rates are not just dependent on fuel costs.
August 2011 10/44

Remote Communities in Canada FINAL While electricity costs is mostly dependent on fuel costs for grid-tied fossil fuel power plants, in small communities these costs are also greatly affected by the size of the generators, their running points, their performance and efficiency, their higher operation costs and the need for the utility to maintain power at all time. The cost of producing off-grid electricity from diesel generators can be up to 10 times higher than electricity generated on the main grid.
Electricity rates to end users on the other hand, are dependent on what customers can pay and the amount of subsidy that can be provided. In provincial jurisdiction, electricity rates are sometimes set by the on-grid residential average rates and applied to all residential clients. This is the case for Ontario and Newfoundland and Labrador sites and it is partially true for the Quebec sites. Remote communities under Hydro-Quebec’s jurisdiction have the same average rate of 10 cents/kWh as on-grid residential clients but these numbers were not reported and have not been used in the average Quebec rate for off-grid communities. The 19 sites with electrical rate data are under the responsibility of the Makivik Corporation, which has its own rate structure that reflects better the real costs of electricity produced.
Residential retail rates are generally subsidized in remote communities at varying degrees in all jurisdictions by:
absorbing the cost into the rate base; charging higher rates to commercial and governmental customers; and charging a higher rate for consumption in excess of a set limit per month.
In Nunavut, electricity rate is shown the highest, averaging around 60 cents/kWh while in Newfoundland and Labrador, remote communities pay the same rate as on-grid residents, or around 14 cents/kWh. Still one can see that on average, the electricity rate paid by consumers is about 32 cents/kWh, which is around three times what is paid by on-grid customers.
Why focus on Renewables in Remote Communities of Canada
The standard electricity production method in remote communities, using diesel-fuelled generators, has proven generally stable and reliable when properly maintained. However, the high cost of electricity in offgrid communities is a significant deterrent to economic development opportunities for any industry consuming even a moderate amount of electricity and adds to the cost of living for populations often living at a subsistence level. Further, this technology is also known to cause air pollution through greenhouse gas emissions and criteria air contaminants, as well as soil pollution through diesel fuel spills and leaks.
The following list is an assessment of the concerns raised by diesel generation that remote communities face in terms of environmental, social and economic sustainability. These were identified by AANDC in their ecoENERGY for Aboriginal and Northern Communities Program7 Overview in 2010:
Environmental Concerns Burning large amounts of diesel produces substantial greenhouse gas emissions. This contributes to climate change which negatively affects Northern communities. Fuel must be transported long distances by airplane, truck or barge, leading to a greater risk of fuel spills. The transportation of fuel by trucks on winter roads impacts the environment negatively through high greenhouse gas emissions from the vehicles. Fuel spills may take place while the fuel is being transported and stored, posing environmental risks. Fuel tank leaks contaminate soil and groundwater.
7 For additional information on the program please check : http://www.ecoaction.gc.ca/ecoenergyecoenergie/aborignorth-autochnord-eng.cfm
August 2011 11/44

Remote Communities in Canada FINAL
Social Concerns Generators can be noisy and disruptive, especially in quiet, remote communities. Emissions from diesel generators could contribute to health problems in community members. Black-outs can occur if diesel generators break down or are not properly maintained. This can be dangerous in cold, remote locations.
Economic Concerns Cold, northern locations have a high demand for diesel and heating fuel which contributes to high energy expenditures. Diesel fuel must be flown in, shipped in, or driven in on winter roads which leads to high transportation costs, which contributes to high energy expenditures. Diesel is a non-renewable resource; therefore the price of diesel fuel will likely continue to fluctuate in the future, based on overall supply and demand. The high cost of energy and energy supply issues in off-grid communities can deter new businesses, thus limiting future economic opportunities in off-grid communities.
In a recent report8 Lumos Energy identified the following range of positive attributes for the development of clean power in remote communities of Canada.
Table 2.7: Summary of Clean Power Valuation Features Features Valuation Attributes
Energy Security Being more decentralized and closer to power users, clean energy enhances the stability of power systems and reduces demand on transmission capacity. Clean power also adds diversity to the power system.
Reduced Environmental Impacts
By reducing Criteria Air Contaminants (CAC) and Greenhouse Gas (GHG), waste products and air toxic emissions, clean energy offers a dramatically less impact environmental footprint than fossil fuel and nuclear energy.
Health Benefits Clean energy reduces risk factors to human health which results in lower morbidity and mortality, and costs borne by the health care system.
New Clean Industry Clean energy is a source of economic development for local economies offering job and wealth creation multipliers.
Price Hedging & Reducing Natural Gas Pressures
By diversifying power sources, clean energy reduces pressures on fossil fuel consumption, notably the marginal fuel source of natural gas. Thus, clean energy acts as a price hedge against higher natural gas prices.
Shorter Development Timelines
Clean energy projects, such as small hydro, medium-scale biomass and solar are subject to faster project timelines of development which represents a potential cost advantage and have an ability to respond to market needs faster.
Many of the remote communities of Canada have access to adequate renewable energy resources which, if properly managed, could help contribute to the communities’ sustainable development. In fact, costeffective deployment opportunities of renewable technologies exist in many remote communities for both power generation and space heating applications. The retention of such savings in the communities could lead to several benefits such as job creation, local skill development and increased community self reliance.
There are four main renewable energy alternatives to diesel generation in off-grid communities that could generate substantial economic development benefits for these communities. These are small hydro, biomass,
8 An Analysis of Aboriginal Clean Energy Projects & Ventures Across Canada: Identifying Potential Clean Energy ‘Clusters’ for Consideration by the Strategic Partnerships Initiative (SPI), Lumos Energy, March 2010
August 2011 12/44

Remote Communities in Canada FINAL wind and solar energy (photovoltaic (PV) and heat). In some cases, connection to local grids can provide added benefits by clustering the demand of a number of communities around a common resource.
One of the tasks of AANDC’s ecoENERGY for Aboriginal and Northern Communities Program has been to identify opportunities in using renewable energy in Aboriginal remote communities. By extension, the information gathered by the program can be applied to other remote communities with the added benefit that having more communities in an area or region adopting a given solution may actually make these more costeffective through economies of scale or from clustering of actions.
August 2011 13/44

Remote Communities in Canada FINAL
3. Provincial/Territorial Information Details
The following sections provide a brief analysis of each province and territory’s remote communities. The intent of this review is to provide general characteristics about remote communities in each region and show extent of information currently available for each.
The three provinces of Alberta, Saskatchewan and Manitoba have been grouped under the same region because there are only a few communities that are off-grid in each province. Provinces of Nova Scotia, New Brunswick and PEI are not shown because they have no communities that are off the grid.
Note that in each table shown below, remote communities were attributed temporary site numbers for the purpose of this report. AANDC uses another set of numbers for Aboriginal-only communities. The numbering of communities will be reviewed within the new database. Note also that some of the temporary site numbers are missing. Sites that were abandoned or were connected within the last 10 years have been numbered but are not reported in the various tables.
Missing data are highlighted to show the extent of information that needs to be gathered. The development of the new database should greatly facilitate this process.
British Columbia
There are currently 86 remote communities in British Columbia (BC) with a total population of 24,068, of which 25 communities are Aboriginal with 7,619 people and 61 communities are non-Aboriginal with 16,449 inhabitants.
Figure 3.1: Map of British Columbia’s Remote Communities
Green: Aboriginal communities / Yellow: Non-Aboriginal communities
August 2011 14/44

Table 3.1: BC Remote Communities
Temp #
Community/Site/ Settlement Name
First Nation/ Band Name Type
Name Name --1 Acteon Sound n/a Non-
Aboriginal 2 Anahim Lake Ulkatcho Aboriginal 3 Atlin Taku River Tlingit Aboriginal
First Nation
4 Baker Mine n/a Non-Camp Aboriginal
6 Barr Creek n/a Non-Aboriginal
7 Bella Bella Heiltsuk Aboriginal
8 Bella Coola Nuxalk Nation Aboriginal
9 Big Bar/Jesmond n/a Non-Creek Aboriginal
10 Bob Quinn Lake n/a Non-Aboriginal
11 Boulder Bay n/a Non-Aboriginal
12 Christian Valley n/a Non-Aboriginal
13 Cleagh Creek n/a Non-Aboriginal
14 Da'nawda'xw Da'naxda'xw First Aboriginal First Nation (Sim Nation
Creek) (Dead Point 5)
15 Dease Lake n/a Non-Aboriginal
16 Dome Creek/Crescent
n/a Non-Aboriginal
Spur 17 Drury Inlet n/a Non-
Aboriginal 18 Earl Creek n/a Non-
Aboriginal 19 Eastgate n/a Non-
Aboriginal 20 Ehattesaht Ehattesaht Aboriginal
(Chenahkint) 21 Erickson Gold
Mine Village n/a Non-
Aboriginal 22 Field n/a Non-
Aboriginal 23 Fort Ware Kwadacha Aboriginal 24 Germansen n/a Non-
Landing Aboriginal 25 Gilford Island n/a Non-
Aboriginal 26 Good Hope Lake Good Hope Lake Aboriginal
(Dease River) (Dease River)
27 Greenwood Camp
n/a Non-Aboriginal
28 Gwawaenuk Gwawaenuk Aboriginal Tribe/Kwa-wa
aineuk Tr be/
Kwa-wa-aineuk (Hopetown)
29 Hagensborg n/a Non-Aboriginal
30 Hartley Bay Hartley Bay Aboriginal (Kulkayu 4)
Remote Communities in Canada FINAL
Populatio n Census
2006
Fossil Electri Renew Main Local Renew Annual Fuel c able Power Grid able Energy Generatio Capaci Capaci Source Name Type Demand n Type ty (FF) ty (#) - Name - (kW) - (kW) (MW h)
25 FF n/a n/a 125 n/a n/a 657
252 FF n/a Diesel 2650 n/a n/a 4,990 322 RE n/a Diesel 2650 Hydro 2100 4,400
backup
30 FF n/a Diesel 1500 n/a n/a 7,008
25 n/a n/a n/a n/a n/a n/a n/a
1104 FF Bella Diesel 8750 n/a n/a 10,147 Bella
2139 FF Bella Diesel 7630 n/a n/a 17,147 Coola
133 FF n/a n/a n/a n/a n/a n/a
17 FF n/a n/a 250 n/a n/a 613
45 FF n/a n/a 75 n/a n/a 324
1850 FF n/a n/a n/a n/a n/a n/a
23 FF n/a n/a 125 n/a n/a 1,086
20 FF n/a Diesel n/a n/a n/a n/a
394 FF n/a Diesel 3550 n/a n/a 6,473
475 FF n/a n/a n/a n/a n/a n/a
45 FF n/a n/a 125 n/a n/a 1,086
25 n/a n/a n/a n/a n/a n/a n/a
50 FF n/a n/a 50 n/a n/a 263
10 FF n/a Diesel 50 n/a n/a n/a
130 FF n/a Diesel 2100 n/a n/a 7,884
352 FF n/a Diesel 600 n/a n/a 1,883
239 FF n/a Diesel 755 n/a n/a n/a 77 n/a n/a n/a n/a n/a n/a n/a
541 FF n/a n/a 45 n/a n/a 114
32 FF n/a Diesel 1230 n/a n/a 613
64 n/a n/a n/a n/a n/a n/a n/a
10 FF n/a Diesel 40 n/a n/a n/a
1000 Local Bella n/a n/a n/a n/a n/a Grid Coola
157 FF n/a Diesel 1000 n/a n/a 1,344
August 2011 15/44

Remote Communities in Canada FINAL
Temp #
Community/Site/ Settlement Name
First Nation/ Band Name Type
Populatio n Census
2006
Main Power Source
Local Grid
Name
Fossil Fuel
Generatio n Type
Electri c
Capaci ty (FF)
Renew able Type
Renew able
Capaci ty
Annual Energy
Demand
-Name Name - (#) - Name - (kW) - (kW) (MW h)
31 Hesquiant (Refuge Cove 6)
Hesquiaht Aboriginal 113 FF n/a Diesel 150 n/a n/a 438
32 Hornet n/a Non-Aboriginal
30 n/a n/a n/a n/a n/a n/a n/a
33 Iskut/Eddontenaj on
Iskut First Nation Aboriginal 511 RE n/a n/a n/a Hydro 2200 2,468
34 Kingcome Inlet n/a Non-Aboriginal
148 FF n/a n/a 75 n/a n/a 175
35 Kitasoo Kitasoo Aboriginal 282 RE n/a Diesel 250 Hydro 1700 n/a 36 Kitkatla n/a Non-
Aboriginal 1391 FF n/a Diesel 850 n/a n/a 1,007
37 Klemtu n/a Non-Aboriginal
447 FF n/a n/a 250 n/a n/a 88
38 Kluskus (Sundayman's
Meadow)
Kluskus Aboriginal 32 FF n/a Diesel Restricte
d
20 n/a n/a 260
39 Knight Inlet n/a Non-Aboriginal
45 FF n/a n/a 125 n/a n/a 657
40 Kwicksutaineukah-kwaw-ah-mish
(Gwayasdums)
Kwicksutaineukah-kwaw-ah-mish
Aboriginal 40 FF n/a Diesel 225 n/a n/a n/a
42 Lasqueti Island n/a Non-Aboriginal
457 FF n/a n/a n/a n/a n/a n/a
43 Liard First Nation (Lower Post 3)
Liard First Nation Aboriginal 102 FF n/a Diesel 995 n/a n/a n/a
44 Longworth n/a Non-Aboriginal
53 n/a n/a n/a n/a n/a n/a n/a
45 Lower Post n/a Non-Aboriginal
180 FF n/a n/a n/a n/a n/a n/a
46 Machmell n/a Non-Aboriginal
45 FF n/a n/a 125 n/a n/a 657
47 Manning Provincial Park
n/a Non-Aboriginal
57 n/a n/a n/a n/a n/a n/a n/a
48 Masset (Old Masset)
Haida Nation/Haida
Gwaii 4
Aboriginal 607 FF Masset Diesel 11524 n/a n/a 24,275
49 McNab Camp n/a Non-Aboriginal
24 FF n/a n/a 50 n/a n/a 350
50 Meziadin Lake -Highways
n/a Non-Aboriginal
193 FF n/a n/a 500 n/a n/a 631
51 Mooya Bay (Nootka)
n/a Non-Aboriginal
45 FF n/a n/a 125 n/a n/a 657
52 Moses Inlet n/a Non-Aboriginal
70 FF n/a n/a 100 n/a n/a 613
53 Nancut n/a Non-Aboriginal
1275 FF n/a n/a n/a n/a n/a n/a
54 Narrows Inlet Logging Div
n/a Non-Aboriginal
45 FF n/a n/a 125 n/a n/a 657
56 Nemaiah Valley (Chilco Lake and
Lohbiee)
Xeni Gwet'in First Nation
Aboriginal 148 Hybrid n/a Diesel 305 PV 28 1,279
57 Nuchatlaht n/a Non-Aboriginal
122 FF n/a n/a 8 n/a n/a 70
58 Owikeno (Katit 1) Oweekeno/ Wuikinuxv Nation
Aboriginal 85 FF n/a Diesel 1050 n/a n/a 1,168
59 Penny n/a Non-Aboriginal
74 n/a n/a n/a n/a n/a n/a n/a
60 Phillips Arm n/a Non-Aboriginal
45 FF n/a n/a 125 n/a n/a 657
61 Pitt Lake n/a Non-Aboriginal
45 FF n/a n/a 125 n/a n/a 657
62 Port Clements n/a Non-Aboriginal
483 Local Grid
Masset n/a n/a n/a n/a 657
August 2011 16/44

Remote Communities in Canada FINAL
Populatio Temp Community/Site/ First Nation/ Band Type n Census # Settlement Name Name 2006
Name Name - (#)-
64 Quatam River n/a Non 45
65 Queen Charlotte n/a Non 1079
66 Queen's Cove n/a Non 10
68 Sandspit n/a Non 3000
69 Savary Island n/a Non 31
70 Scott Cove n/a Non 45
71 Scotty Gold n/a Non 80
72 Sechell Creek n/a Non 45
73 Seymour Arm n/a Non 95
74 Seymour Inlet n/a Non 45
75 Shearwater n/a Non 100
76 Sheemahant n/a Non 47
77 Simoon Sound n/a Non 32
79 Skidegate Haida Aboriginal 781
80 Stave Lake n/a Non 55
82 Takla n/a Non 538
84 Telegraph Creek Tahltan Aboriginal 216 85 Tide Lake n/a Non 125
86 Timfor n/a Non 45
88 Tlatlasikwala Tlatlasikwala Aboriginal 5
89 Tlell n/a Non 282
90 Toad River Area n/a Non 80
92 Trout Lake BC n/a Non 65
93 Tsawataineuk Tsawataineuk (or Aboriginal 60
94 Tsay Keh Dene Tsay Keh Dene Aboriginal 325
95 Uchucklesaht Uchucklesaht Aboriginal 27
96 Western Mines n/a Non 30
Total 86 25 24,068
Fossil Electri Renew Main Local Renew Annual Fuel c able Power Grid able Energy Generatio Capaci Capaci Source Name Type Demand n Type ty (FF) ty - Name - (kW) - (kW) (MW h)
FF n/a n/a 125 n/a n/a 657 Aboriginal
Local Sandspit n/a n/a n/a n/a n/a City Aboriginal Grid
n/a n/a n/a n/a n/a n/a n/a Aboriginal
FF Sandspit Diesel 13600 n/a n/a 22,948 Aboriginal
n/a n/a n/a n/a n/a n/a n/a Aboriginal
FF n/a n/a 125 n/a n/a 1,086 Aboriginal
n/a n/a n/a n/a n/a n/a n/a Aboriginal
FF n/a n/a 125 n/a n/a 657 Aboriginal
n/a n/a n/a n/a n/a n/a n/a Aboriginal
FF n/a n/a 125 n/a n/a 1,086 Aboriginal
Local Bella n/a n/a n/a n/a n/a Aboriginal Grid Bella
FF n/a n/a 575 n/a n/a 569 Aboriginal
n/a n/a n/a n/a n/a n/a n/a Aboriginal
Local Sandspit n/a NA n/a n/a n/a Landing Nation/Haida Grid
Gwaii 4 FF n/a n/a 110 n/a n/a 219
Aboriginal FF n/a n/a n/a n/a n/a n/a
Aboriginal FF n/a Diesel 2050 n/a n/a 1,960 FF n/a n/a n/a n/a n/a n/a
Aboriginal FF n/a n/a 125 n/a n/a 657
Aboriginal FF n/a Diesel 70 n/a n/a n/a
(Hope Island 1)
Local Sandspit n/a n/a n/a n/a n/a Aboriginal Grid
n/a n/a n/a n/a n/a n/a n/a Aboriginal
n/a n/a n/a n/a n/a n/a n/a Aboriginal
FF n/a Diesel 900 n/a n/a 1,208 (Quaee 7) Dzawada'enuxw)
FF n/a Diesel 500 n/a n/a n/a (Finlay River)
FF n/a Diesel 125 n/a n/a 255 (Elhlateese 2)
FF n/a Diesel 2000 n/a n/a 4,030 (Myra Falls) Aboriginal
10 70,957 6,028 138,785 Local TotalSites Aboriginal Sites 76,985 CF 20.6%Grid FF+RE
FF: Fossil Fuel – RE: Renewable Energy – NA: Not Applicable
For the 86 communities with available power plant data, total electric capacity from all sources is approximately 77 MW.
August 2011 17/44

Remote Communities in Canada FINAL
The total fossil fuel generation capacity is 71.0 MW with the following breakdown: Diesel Generation: 67.1 MW Unknown (either diesel or gasoline powered gensets): 3.8 MW
The total renewable generation is mainly hydro-based with three sites totalling 6.0 MW and one PV site totalling 28 kW.
Included in the above production total are four local grids that connect 10 communities with the following breakdown:
Bella Bella: 8.75 MW Diesel power plant serving Bella Bella and Shearwater on the northern coast of BC. Bella Coola: 7.6 MW Diesel power plant serving Bella Coola and Hagensborg, at the western extremity of the Queen Charlotte Sound. Masset: 11.5 MW Diesel power plant serving Masset and Port Clements, in the northern part of the archipelago of Haida Gwaii. Sandspit: 13.6 MW Diesel power plant serving Sandspit, Queen Charlotte City, Skidegate Landing and Tiell, in the archipelago of Haida Gwaii.
Out of these 86 communities, only 49 have production data. These 49 communities have a combined diesel and hydro capacity of 72.4 MW producing an estimated 138,785 MWh giving a capacity factor of 21.9%.
From the BC sites, 47 communities report bulk diesel fuel price with an average of 37 cents/litre. However, only 15 diesel communities show actual purchase of fuel with corresponding electricity production. These 15 sites have a total capacity of 7.8 MW from fossil fuel and 2.1 MW from renewable and a total production of 10 351 MWh of electricity for a capacity factor of about 11.9% and consume about 3,117,100 litres of diesel fuel per year. However, the small amount of data warrants cautious use of these numbers as the level of error can be significant.
From the data collected, communities in BC can also be segmented in two main groups based on their electricity suppliers. B.C. Hydro services 29% of the remote communities and about 40% of the population. The rest is serviced by Independent Power Producers or IPPs. Most Aboriginal communities (98% or 24 communities) are serviced by BC Hydro. 13 of these communities are funded directly by AANDC to pay for their electricity.
Prairies
Alberta, Saskatchewan and Manitoba have been grouped in a single region, named Prairies, because of the limited number of remote communities in these provinces.
In the past twenty-five years the number of remote communities has decreased from 34 to 10 sites. Grid extension has and will likely continue to be the main reason of this decrease. Manitoba Hydro, which currently services seven remote communities in Manitoba, has tied six communities to its electric grid within the last few years. Alberta has only two remote communities and Saskatchewan has one.
The total installed capacity in remote communities in the Prairies is estimated at 9 MW, supplying energy to 3,653 people.
Five communities are Aboriginal settlements in northern Manitoba and Saskatchewan, with a total of 5.75 MW of diesel capacity supplying electricity to 2,217 people.
August 2011 18/44

Remote Communities in Canada FINAL The two communities in Alberta are non-Aboriginal settlements that are inter-tied together and are powered by a 1.45 MW diesel power plant supplying 533 persons.
The three other non-Aboriginal communities are scattered in mid-northern Manitoba and use about 1.8 MW of diesel capacity providing power to 903 persons. They are generally very close to a grid and could well be connected in the near to medium-term future.
Figure 3.2: Map of Prairies’ Remote Communities
Green: Aboriginal communities / Yellow: Non-Aboriginal communities
Table 3.2: Remote Communities of Alberta, Saskatchewan and Manitoba
Pro v.
Te mp #
Community/Site/ Settlement Name
First Nation/ Band Name
Type Populati
on Census
2006
Main Power Source
Local Grid
Name
Fossil Fuel
Generati on Type
FF Capa city
Rene wable Type
RE Capac
ity
Annual Energy
Demand
--
Name name - (#) - Name - (kW) - (kW) (MWh)
AB 101 Peerless Lake n/a Non-Aboriginal
338 Local Grid
Trout Lake
n/a n/a n/a n/a n/a
AB 102 Trout Lake n/a Non-Aboriginal
195 FF Trout Lake
Diesel 1450 n/a n/a 2,383
SK 103 Peter Ballantyne Cree Nation (Kinoosao -
Thomas Clark 204)
Peter Ballantyne
Cree Nation
Aboriginal 57 FF n/a Diesel 350 n/a n/a 190
MB 104 Barren Lands (Brochet 197)
Barren Lands
Aboriginal 306 FF n/a Diesel Restricte
d
1175 Waste Heat
Recov ery
n/a 2,368
MB 108 Granville Lake n/a Non-Aboriginal
126 FF n/a n/a n/a n/a n/a n/a
August 2011 19/44

Remote Communities in Canada FINAL
Pro v.
Te mp #
Community/Site/ Settlement Name
First Nation/ Band Name
Type Populati
on Census
2006
Main Power Source
Local Grid
Name
Fossil Fuel
Generati on Type
FF Capa city
Rene wable Type
RE Capac
ity
Annual Energy
Demand
MB 109 Northlands (Lac Brochet)
Northlands Aboriginal 604 FF n/a Diesel Restricte
d
1450 Waste Heat
Recov ery
n/a 2,505
MB 112 Red Sucker Lake n/a Non-Aboriginal
585 FF n/a Diesel 1250 n/a n/a 1,842
MB 113 Shamattawa (1) Shamattaw a First Nation
Aboriginal 920 FF n/a Diesel Restricte
d
1325 Waste Heat
Recov ery
n/a 3,169
MB 115 Sayisi Dene First Nation
(Churchill Indian Reserve) Tadoule
Lake
Sayisi Dene First Nation
Aboriginal 330 FF n/a Diesel Restricte
d
1450 Waste Heat
Recov ery
n/a 2,459
MB 116 Thicket Portage Non-Aboriginal
192 FF n/a Diesel 525 n/a n/a 464
Total - 10 5 - 3,653 - 0 - 8,975 - n/a 15,380
Sites Aboriginal Sites
Local Grid
Total FF+RE 8,975 kW CF 19.6%
FF: Fossil Fuel – RE: Renewable Energy – NA: Not Applicable
Most of the southern regions of these three provinces are covered by an extensive grid network and Aboriginal communities in this area are grid connected.
Alberta Power, Sask Power and Manitoba Hydro are the main power suppliers to the remote communities in Alberta, Saskatchewan and Manitoba respectively. AANDC funds power for the five Aboriginal communities.
Average diesel fuel price for electricity generation is 35 cents/litre in Manitoba’s remote communities and 52 cent/litre in Saskatchewan. Prices are not available for Alberta’s remote communities.
Ontario
According to the Sigma study of 1985, there were at that time 43 remote communities in Ontario with a total population of around 15,000 persons. Today, there are 38 remote communities with a population of 21,342 (2006 Census). Of these communities, 25 are Aboriginal communities with a total of 14,236 peoples or twothird of the remote communities’ population.
The installed fossil fuel plant capacity at these 38 remote sites totals 25.57 MW with only one hydro site at Deer Lake with a capacity of 490 kW, using a backup of 825 kW of diesel capacity and a 30 kW wind turbine at Kasabonika that complements a diesel plant of 825 kW.
From the 28 sites that report production data, their fossil fuel capacity is 25.21 MW and renewable capacity is 0.5 MW. These sites produce an estimated 84,356 MWh/yr (mainly 2007 numbers), giving a capacity factor of 37.4 % for a population of 14,618 persons.
Independent Power Producers service 12 of these 28 sites with a total population of 6,107. The fossil fuel capacity is estimated at 9.87 MW and produces 31,070 MWh giving a capacity factor of 36%.
August 2011 20/44

Remote Communities in Canada FINAL
Figure 3.3: Map of Ontario’s Remote Communities
Green: Aboriginal communities / Yellow: Non-Aboriginal communities
Only 10 of these sites report fuel price paid by the service providers. These 10 sites are all Aboriginal sites serviced by IPPs. The diesel plants have a total capacity of 8 MW. The sites reportedly purchased 5,128,865 litres per year for their electricity consumptions with an average fuel price of 80 cents/litre between 2004 and 2007.
Eight of these sites report an average retail electricity price of 17 cents/kWh and nine sites report a service rate (non-subsidised) of 94 cents/kWh. This would tend to indicate that a subsidy of about 77 cents/kWh is provided to retail consumers, however it is not possible to assess realistically because of the low numbers of data.
Table 3.3 Remote Communities of Ontario
Temp #
Community/Site/ Settlement Name
First Nation/ Band Name Type
Populatio n Census
2006
Main Power Source
Local Grid
Name
Fossil Fuel
Generatio n Type
FF Capaci
ty Renewable
Type RE Cap acity
Annual Energy Demand
-Name Name - (#) - Name (kW) - (kW) (MW h)
119 Armstrong (Whitesand)
Whitesand Aboriginal 247 FF n/a Diesel 1400 n/a n/a 4,139
121 Auden n/a Non-Aboriginal
85 n/a n/a n/a n/a n/a n/a n/a
122 Bearskin Lake Bearskin Lake Aboriginal 459 FF n/a Diesel 825 n/a n/a 2,894
August 2011 21/44

Remote Communities in Canada FINAL
134
136
137
138
139
140
141
Temp #
Community/Site/ Settlement Name
First Nation/ Band Name Type
123 Big Trout Lake (Kitchenuhmaykoosi
b Aaki 84)
Kitchenuhmay koosib
Inninuwug
Aboriginal
124 Biscotasing n/a Non-Aboriginal
126 Collins n/a Non-Aboriginal
127 Deer Lake Deer Lake Aboriginal 128 Ebanetoong (Fort
Hope 64) Eabametoong Aboriginal
129 Ferland n/a Non-Aboriginal
130 Fort Severn (89) Fort Severn Aboriginal
131 Graham n/a Non-Aboriginal
132 Gull Bay (Gull River 55)
Gull Bay Aboriginal
133 Hillsport n/a Non-Aboriginal
Kasabonika
Kee Way Win (Keewaywin (Niska))
Kingfisher Lake 1
Lac Seul
Lansdowne House (Neskantaga)
MacDowell
Moose River Crossing
142 Muskrat Dam
143 North Car bou Lake (Weagamow Lake
87) 144 North Spirit Lake
145 Oba
146 Ogoki/Marten Falls 65
147 Peawanuck (Winisk 90)
148 Pikangikum (14)
149 Ponask
150 Poplar Hill
Kasabonika Lake
Kee-Way-Win
Kingfisher
n/a
Neskantaga First Nation
n/a
n/a
Muskrat Dam Lake
North Caribou Lake
North Spirit Lake n/a
Marten Falls
Weenusk (Peawanuck)
Pikangikum
n/a
Poplar Hill
Aboriginal
Aboriginal
Aboriginal
Non-Aboriginal
Aboriginal
Non-Aboriginal
Non-Aboriginal
Aboriginal
Aboriginal
Aboriginal
Non-Aboriginal
Aboriginal
Aboriginal
Aboriginal
Non-Aboriginal
Aboriginal
681
318
415
2160
265
22
90
Populatio n Census
2006
Main Power Source
Local Grid
Name
Fossil Fuel
Generatio n Type
FF Capaci
ty Renewable
Type
916 FF n/a Diesel 2600 n/a
135 FF n/a n/a 325 n/a
100 FF n/a n/a n/a n/a
681 Hybrid n/a Diesel 825 Hydro 1144 FF n/a Diesel 1565 n/a
81 n/a n/a n/a n/a n/a
567 FF n/a Diesel 550 Waste Heat Recovery
90 n/a n/a n/a n/a n/a
206 FF n/a Diesel 550 n/a
68 FF n/a n/a 170 n/a
FF
FF
FF
FF
FF
n/a
n/a
252 FF
700 FF
259 FF
75 FF
221 FF
221 FF
2100 FF
10 n/a
457 FF
n/a
n/a
n/a
n/a
n/a
n/a
n/a
n/a
n/a
n/a
n/a
n/a
n/a
n/a
n/a
n/a
Diesel
Diesel
Diesel
n/a
Diesel
n/a
n/a
Diesel
Diesel
Diesel
n/a
Diesel
Diesel Restricte
d Diesel
Restricte d
n/a
Diesel
825
590
825
n/a
705
n/a
n/a
825
825
100
360
610
1010
1250
n/a
185
Wind
n/a
n/a
n/a
n/a
n/a
n/a
n/a
n/a
n/a
n/a
n/a
n/a
n/a
n/a
n/a
30
n/a
n/a
n/a
n/a
n/a
n/a
RE Cap acity
Annual Energy Demand
n/a 5,756
n/a 961
n/a n/a
490 4,391 n/a 3,400
n/a n/a
n/a 2,626
n/a n/a
n/a 981
n/a 503
4,037
2,364
2,053
n/a
1,878
n/a
n/a
n/a 2,116
n/a 4,305
n/a 2,085
n/a n/a
n/a 2,190
n/a 2,249
n/a 5,033
n/a n/a
n/a 2,189
August 2011 22/44
Remote Communities in Canada FINAL
Temp #
151
152 153 154
155 156
157
158 159
Total
Community/Site/ Settlement Name
Ramsey
Sachigo Lake 1 Sandy Lake
Sultan
Summer Beaver Wapekeka 1 (2) (Angling Lake)
Wawakapewin (Long Dog Lake)
Webequie Wunnummin Lake 1
&2
38
Sites
First Nation/ Band Name
n/a
Sachigo Lake Sandy Lake
n/a
N binamik Wapekeka
Wawakapewin
Webequi Wunnumin
25 Aboriginal
Sites
Type
Non-Aboriginal
Aboriginal Aboriginal
Non-Aboriginal
Aboriginal Aboriginal
Aboriginal
Aboriginal Aboriginal
-
Populatio n Census
2006
4011
450 1843 179
362 350
21
614 487
21,342
Main Power Source
FF
FF FF FF
FF FF
FF
FF FF
-
Local Grid
Name
n/a
n/a n/a n/a
n/a n/a
n/a
n/a n/a
0 Local Grid
Fossil Fuel
Generatio n Type
n/a
Diesel Diesel
n/a
Diesel Diesel
Diesel Restricte
d Diesel Diesel
-Total
FF+RE
FF Capaci
ty
n/a
550 3250 450
1760 550
140
825 1125
25,570
26,090
Renewable Type
n/a
n/a n/a n/a
n/a n/a
n/a
n/a n/a
-
RE Cap acity
Annual Energy Demand
n/a n/a
n/a 2,874 n/a 11,025 n/a 1,330
n/a 1,996 n/a 2,346
n/a 3,357
n/a 3,067 n/a 2,213
520 84,356
CF 36.9%
FF: Fossil Fuel – RE: Renewable Energy – NA: Not Applicable
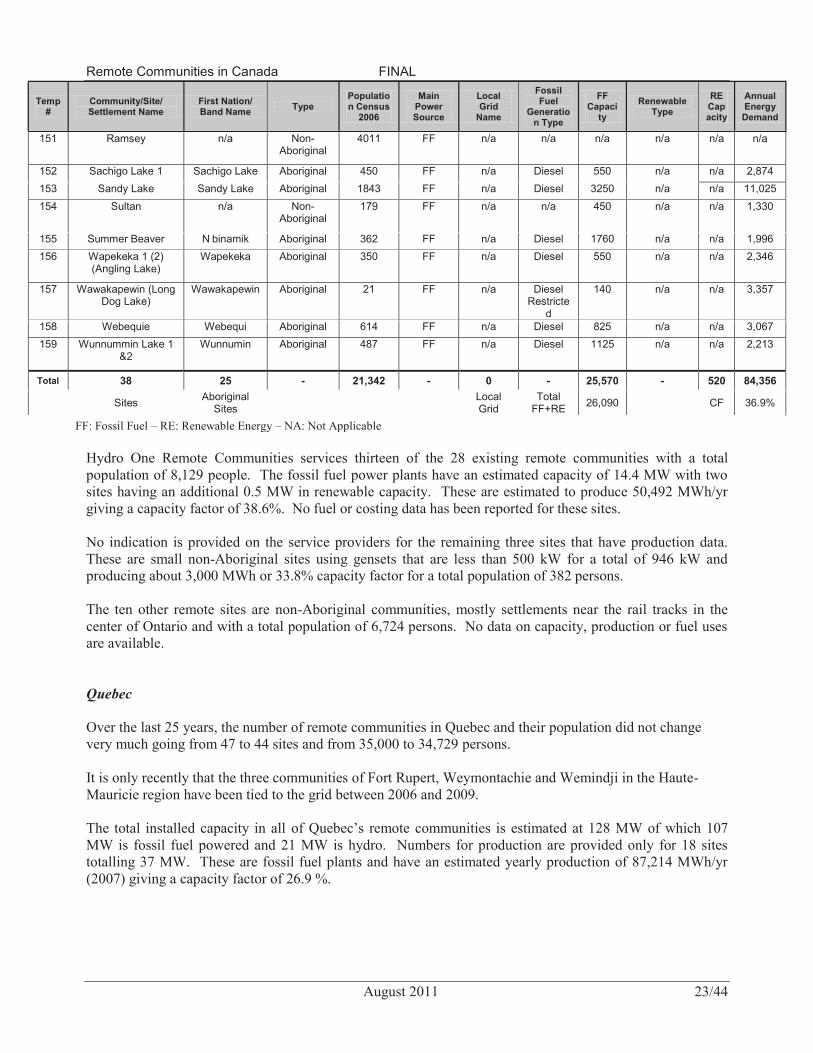
Hydro One Remote Communities services thirteen of the 28 existing remote communities with a total population of 8,129 people. The fossil fuel power plants have an estimated capacity of 14.4 MW with two sites having an additional 0.5 MW in renewable capacity. These are estimated to produce 50,492 MWh/yr giving a capacity factor of 38.6%. No fuel or costing data has been reported for these sites.
No indication is provided on the service providers for the remaining three sites that have production data. These are small non-Aboriginal sites using gensets that are less than 500 kW for a total of 946 kW and producing about 3,000 MWh or 33.8% capacity factor for a total population of 382 persons.
The ten other remote sites are non-Aboriginal communities, mostly settlements near the rail tracks in the center of Ontario and with a total population of 6,724 persons. No data on capacity, production or fuel uses are available.
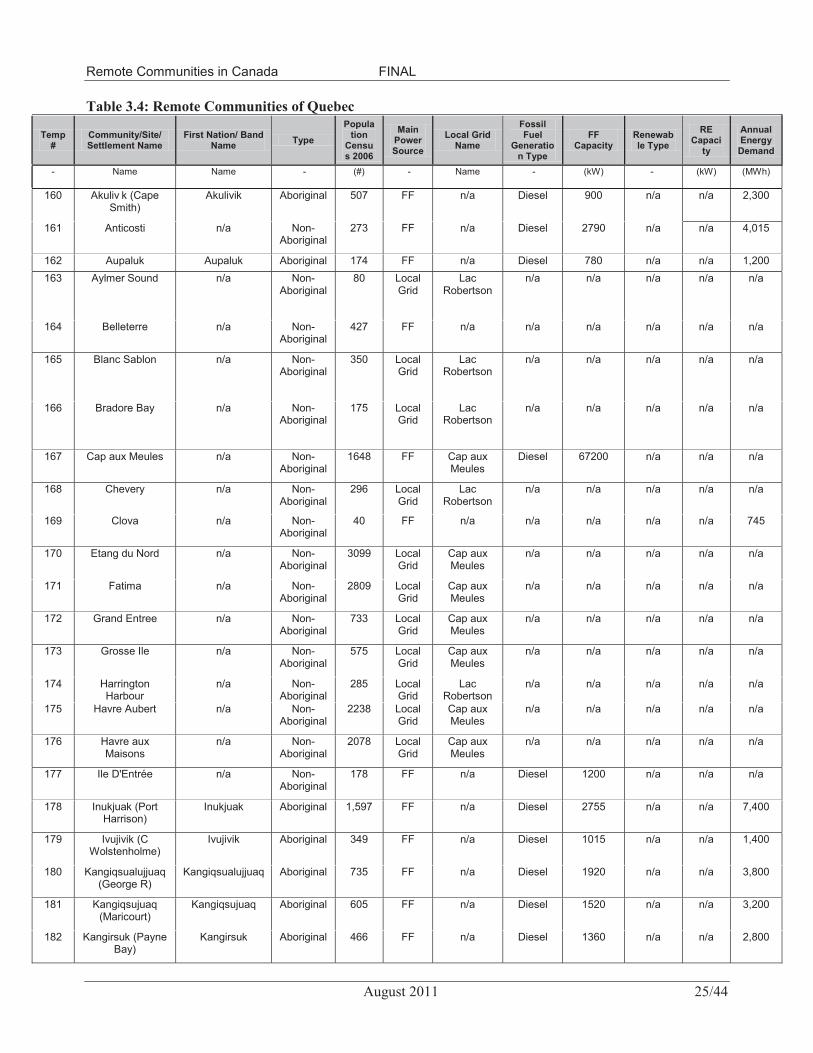
Quebec
Over the last 25 years, the number of remote communities in Quebec and their population did not change very much going from 47 to 44 sites and from 35,000 to 34,729 persons.
It is only recently that the three communities of Fort Rupert, Weymontachie and Wemindji in the Haute-Mauricie region have been tied to the grid between 2006 and 2009.
The total installed capacity in all of Quebec’s remote communities is estimated at 128 MW of which 107 MW is fossil fuel powered and 21 MW is hydro. Numbers for production are provided only for 18 sites totalling 37 MW. These are fossil fuel plants and have an estimated yearly production of 87,214 MWh/yr (2007) giving a capacity factor of 26.9 %.
August 2011 23/44
Remote Communities in Canada FINAL
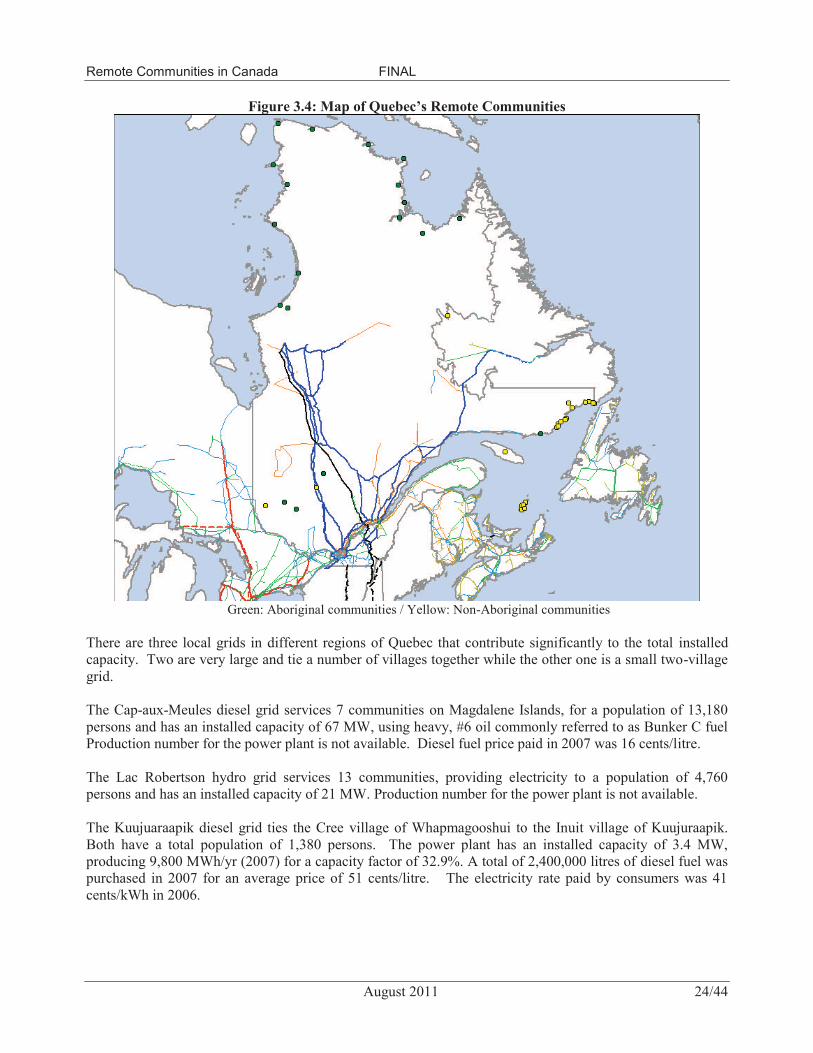
Figure 3.4: Map of Quebec’s Remote Communities
Green: Aboriginal communities / Yellow: Non-Aboriginal communities
There are three local grids in different regions of Quebec that contribute significantly to the total installed capacity. Two are very large and tie a number of villages together while the other one is a small two-village grid.
The Cap-aux-Meules diesel grid services 7 communities on Magdalene Islands, for a population of 13,180 persons and has an installed capacity of 67 MW, using heavy, #6 oil commonly referred to as Bunker C fuel Production number for the power plant is not available. Diesel fuel price paid in 2007 was 16 cents/litre.
The Lac Robertson hydro grid services 13 communities, providing electricity to a population of 4,760 persons and has an installed capacity of 21 MW. Production number for the power plant is not available.
The Kuujuaraapik diesel grid ties the Cree village of Whapmagooshui to the Inuit village of Kuujuraapik. Both have a total population of 1,380 persons. The power plant has an installed capacity of 3.4 MW, producing 9,800 MWh/yr (2007) for a capacity factor of 32.9%. A total of 2,400,000 litres of diesel fuel was purchased in 2007 for an average price of 51 cents/litre. The electricity rate paid by consumers was 41 cents/kWh in 2006.
August 2011 24/44
Remote Communities in Canada FINAL
Table 3.4: Remote Communities of Quebec
- Name Name -
160 Akuliv k (Cape Akulivik Aboriginal Smith)
161 Anticosti n/a Non-Aboriginal
162 Aupaluk Aupaluk Aboriginal 163 Aylmer Sound n/a Non-
Aboriginal
164 Belleterre n/a Non-Aboriginal
165 Blanc Sablon n/a Non-Aboriginal
166 Bradore Bay n/a Non-Aboriginal
167 Cap aux Meules n/a Non-Aboriginal
168 Chevery n/a Non-Aboriginal
169 Clova n/a Non-Aboriginal
170 Etang du Nord n/a Non-Aboriginal
171 Fatima n/a Non-Aboriginal
172 Grand Entree n/a Non-Aboriginal
173 Grosse Ile n/a Non-Aboriginal
174 Harrington n/a Non-Harbour Aboriginal
175 Havre Aubert n/a Non-Aboriginal
176 Havre aux n/a Non-Maisons Aboriginal
177 Ile D'Entrée n/a Non-Aboriginal
178 Inukjuak (Port Inukjuak Aboriginal Harrison)
179 Ivujivik (C Ivujivik Aboriginal Wolstenholme)
180 Kangiqsualujjuaq Kangiqsualujjuaq Aboriginal (George R)
181 Kangiqsujuaq Kangiqsujuaq Aboriginal (Maricourt)
182 Kangirsuk (Payne Kangirsuk Aboriginal Bay)
Temp #
Community/Site/ Settlement Name
First Nation/ Band Name Type
Popula tion
Censu s 2006
Main Power Source
Fossil RE Annual Local Grid Fuel FF Renewab Capaci Energy Name Generatio Capacity le Type ty Demand n Type (#) - Name - (kW) - (kW) (MW h)
507 FF n/a Diesel 900 n/a n/a 2,300
273 FF n/a Diesel 2790 n/a n/a 4,015
174 FF n/a Diesel 780 n/a n/a 1,200 80 Local Lac n/a n/a n/a n/a n/a
Grid Robertson
427 FF n/a n/a n/a n/a n/a n/a
350 Local Lac n/a n/a n/a n/a n/a Grid Robertson
175 Local Lac n/a n/a n/a n/a n/a Grid Robertson
1648 FF Cap aux Diesel 67200 n/a n/a n/a Meules
296 Local Lac n/a n/a n/a n/a n/a Grid Robertson
40 FF n/a n/a n/a n/a n/a
3099 Local Cap aux n/a n/a n/a n/a n/a Grid Meules
2809 Local Cap aux n/a n/a n/a n/a n/a Grid Meules
733 Local Cap aux n/a n/a n/a n/a n/a Grid Meules
575 Local Cap aux n/a n/a n/a n/a n/a Grid Meules
285 Local Lac n/a n/a n/a n/a n/a Grid Robertson
2238 Local Cap aux n/a n/a n/a n/a n/a Grid Meules
2078 Local Cap aux n/a n/a n/a n/a n/a Grid Meules
178 FF n/a Diesel 1200 n/a n/a n/a
1,597 FF n/a Diesel 2755 n/a n/a 7,400
349 FF n/a Diesel 1015 n/a n/a 1,400
735 FF n/a Diesel 1920 n/a n/a 3,800
605 FF n/a Diesel 1520 n/a n/a 3,200
466 FF n/a Diesel 1360 n/a n/a 2,800
August 2011 25/44
745

Remote Communities in Canada FINAL
Temp #
Community/Site/ Settlement Name
First Nation/ Band Name Type
Popula tion
Censu s 2006
Main Power Source
Local Grid Name
Fossil Fuel
Generatio n Type
FF Capacity
Renewab le Type
RE Capaci
ty
Annual Energy Demand
183 Kawawach kamac h
n/a Non-Aboriginal
419 FF n/a n/a n/a n/a n/a n/a
184 Kitcisakic (Grand Lac Victoria)
Communauté anicinape de
Kitcisakik
Aboriginal 294 FF n/a Diesel n/a PV 3 n/a
185 Kuujjuak (Fort Chimo)
Kuujjuaq Aboriginal 2132 FF n/a Diesel 4335 Solar Thermal System
n/a 15,100
186 Kuujjuaraapik (P Baleine)
Kuujjuaraap k Aboriginal 568 FF Kuujjuarapi k
Diesel 3405 n/a n/a 9,800
187 La Romaine (2) Montagnais de Unamen Shipu
Aboriginal 926 FF n/a Diesel 4935 n/a n/a 12,100
188 La Tabatiere Non-Aboriginal
500 RE Lac Robertson
n/a n/a Hydro 21000 n/a
189 Lac Rapide Algonquins of Barriere Lake
Aboriginal 854 FF n/a Diesel 1525 n/a n/a n/a
190 Lourdes de Blanc Sablon
n/a Non-Aboriginal
700 Local Grid
Lac Robertson
n/a n/a n/a n/a 61,360
191 Middle Bay n/a Non-Aboriginal
97 Local Grid
Lac Robertson
n/a n/a n/a n/a n/a
192 Mutton Bay n/a Non-Aboriginal
200 Local Grid
Lac Robertson
n/a n/a n/a n/a n/a
193 Obedjiwan (28) Atikamekw d'Opitciwan
Aboriginal 1782 FF n/a Diesel 2900 n/a n/a 5,054
194 Old Fort Bay n/a Non-Aboriginal
367 Local Grid
Lac Robertson
n/a n/a n/a n/a n/a
195 Puvirnituk Puvirnituq Aboriginal 1457 FF n/a Diesel 2870 n/a n/a 7,400 196 Quaqtaq Quaqtaq Aboriginal 315 FF n/a Diesel 1085 n/a n/a 1,900 197 Salluit Salluit Aboriginal 1241 FF n/a Diesel 2000 n/a n/a 5,500 198 St Paul's River n/a Non-
Aboriginal 456 Local
Grid Lac
Robertson n/a n/a n/a n/a n/a
199 St. Augustin n/a Non-Aboriginal
980 Local Grid
Lac Robertson
n/a n/a n/a n/a n/a
200 Tasiujak (Leaf Bay)
Tasiujaq Aboriginal 248 FF n/a Diesel 850 n/a n/a 1,600
201 Tete a la Baleine n/a Non-Aboriginal
274 Local Grid
Lac Robertson
n/a n/a n/a n/a n/a
202 Umiujaq Umiujaq Aboriginal 390 FF n/a Diesel 1050 n/a n/a 1,900 206 Whapmagoostui Première nation
de Whapmagoostui
Aboriginal 812 Local Grid
Kuujjuarapi k
n/a n/a n/a n/a n/a
Total 44 19 - 34,729 - 22 - 106,925 - 21,003 148,574
Sites Aboriginal Sites Local Grid Total FF+RE 127,928 kW CF 13.3%
FF: Fossil Fuel – RE: Renewable Energy – NA: Not Applicable
Hydro-Québec is the main electricity supplier in all of Quebec’s remote communities but has transferred management of the 14 Nunavik sites to the Makivik Corporation. These 14 sites are Inuit villages in northern Quebec with a total population of 10,784 persons. These sites are all powered by diesel power plants. Their total capacity is 25.85 MW, producing an estimated 65,300 MWh/year (2007) giving an average capacity factor of 28.8%. The diesel fuel price averaged 53 cents/litre in 2007. The electricity rate paid by consumers in 2006 was 41 cents/kWh.
August 2011 26/44

Remote Communities in Canada FINAL
Newfoundland & Labrador
With the exception of Churchill Falls, Newfoundland Island and the Labrador Peninsula are not connected to the North American electric grid. However, since the grid on the island is large, and uses a large diesel fuel power plant providing electricity to most of Newfoundland island cities and villages; these are considered "non-remote" for this database. This situation could be further validated in the near future with the connection of the province to the North American grid through a submarine cable from Newfoundland to Nova Scotia.
Newfoundland & Labrador is one of the provinces where remote communities have undergone substantial changes in the past twenty-five years. The number of remote communities has decreased from 74 to 29 and the population in these communities has decreased from 30,000 to 9,964. Grid extension was the main reason for the decrease in the number of remote communities and migration also contributed to the population decrease in the remaining communities.
Figure 3.5: Map of Newfoundland and Labrador’s Remote Communities
Green: Aboriginal communities / Yellow: Non-Aboriginal communities
The total installed capacity in these remote communities is estimated at 24.9 MW of which 600 kW is from wind generation and the remaining is fossil fuel powered, mainly from diesel generators.
August 2011 27/44

Remote Communities in Canada FINAL From the 26 sites that report production data with an estimated capacity of 24.2 MW, the total yearly production is about 43,485 MWh/yr for a capacity factor of 20.5%.
As can be seen on the map, there are 11 remote communities on the island. These are all non-Aboriginal sites. There are 17 communities in Labrador. 16 are Aboriginal settlements, and 1 is a non-Aboriginal settlement.
The communities on the island are scattered along its coasts or are on small islands of the coast and are difficult to access by the grid. The sites are diesel powered and have a total capacity of 9 MW with one site supplemented by 600 kW of wind generation and servicing 3,152 people. Total production is about 14,873 MWh/yr, for a capacity factor of 17.6%. The average diesel price is about 36 cents/litres (no year given). Retail price of electricity is not provided but N&L Hydro reports a high-tier rate of 15 cents/kWh (2011).
Table 3.5: Remote Communities of Newfoundland and Labrador
Tem p #
Community/Sit e/ Settlement
Name First Nation/ Band Name Type
Populat ion
Census 2006
Main Power Source
Local Grid
Name
Fossil Fuel Generation
Type FF
Capacity Renewable
Type RE
Capacity Annual Energy
Demand
-Name name - (#) Name - (kW) - (kW) (MW h)
207 Black Tickle Black Tickle Aboriginal 220 FF n/a Diesel 765 n/a n/a 1,080 208 Cartwright
(Métis) Cartwright Aboriginal 552 FF n/a Diesel 1485 n/a n/a 3,933
209 Charlottetown Charlottetown Aboriginal 366 FF n/a Diesel 620 n/a n/a 1,496 211 Francois n/a Non-
Aboriginal 211 FF n/a Diesel 550 n/a n/a 751
212 Grey River n/a Non-Aboriginal
233 FF n/a Diesel 522 n/a n/a 715
213 Harbour Deep
n/a Non-Aboriginal
203 FF n/a Diesel 658 n/a n/a 873
214 Hopedale Hopedale Aboriginal 530 FF n/a Diesel 1840 n/a n/a 2,673 215 La Poile n/a Non-
Aboriginal 7 FF n/a Diesel 408 n/a n/a 577
216 Little Bay Islands
n/a Non-Aboriginal
261 FF n/a Diesel 1350 n/a n/a 1,830
217 Lodge Bay n/a Non-Aboriginal
124 Local Grid
Mary's Harbour
n/a n/a n/a n/a 465
218 Makkovik Makkovik Aboriginal 362 FF n/a Diesel 1300 n/a n/a 2,422 219 Mary's
Harbour Mary's
Harbour Aboriginal 417 FF Mary's
Harbour Diesel 1300 n/a n/a 3,110
220 McCallum n/a Non-Aboriginal
206 FF n/a Diesel 522 n/a n/a 545
221 Mud Lake Mud Lake Aboriginal 60 FF n/a Diesel 180 n/a n/a 221 222 Mushuau
Innu First Nation
(Natuashish 2) (formaly located at
Davis Inlet)
Mushuau Innu First Nation
Aboriginal 706 FF n/a Diesel 695 n/a n/a n/a
223 Nain Nain Aboriginal 1034 FF n/a Diesel 2920 n/a n/a 5,142 224 Norman Bay Norman Bay Aboriginal 45 n/a n/a n/a n/a n/a n/a n/a
225 Paradise River
Paradise River
Aboriginal 14 FF n/a n/a 145 n/a n/a 186
226 Petites n/a Non-Aboriginal
102 FF n/a n/a 380 n/a n/a 272
August 2011 28/44

Remote Communities in Canada FINAL
Tem p #
Community/Sit e/ Settlement
Name First Nation/ Band Name Type
Populat ion
Census 2006
Main Power Source
Local Grid
Name
Fossil Fuel Generation
Type FF
Capacity Renewable
Type RE
Capacity Annual Energy
Demand
227 Port Hope Simpson
Port Hope Simpson
Aboriginal 529 FF n/a Diesel 1390 n/a n/a 2,187
228 Postville Postville Aboriginal 219 FF n/a Diesel 735 n/a n/a 1,293 229 Ramea n/a Non-
Aboriginal 1224 Hybrid n/a Diesel 2775 Wind 600 6,686
230 Rencontre East
n/a Non-Aboriginal
212 FF n/a Diesel 686 n/a n/a 934
231 Rigolet Rigolet Aboriginal 269 FF n/a Diesel 870 n/a n/a 2,064 233 South East
Bight n/a Non-
Aboriginal 115 FF n/a Diesel 327 n/a n/a 482
234 St Lewis St. Lewis Aboriginal 252 FF n/a Diesel 695 n/a n/a 1,923 235 St. Brendan's n/a Non-
Aboriginal 378 FF n/a Diesel 850 n/a n/a 1,208
236 William's Harbour
Williams Harbour
Aboriginal 59 FF n/a Diesel 325 n/a n/a 419
Total 28 16 - 8,910 - 2 - 24,293 - 600 43,433
Sites Aboriginal Sites
Local Grid
Total FF+RE 25,588 CF 20.3%
FF: Fossil Fuel – RE: Renewable Energy – NA: Not Applicable
The remote communities of Labrador are along the eastern coast and are mainly Inuit or Inuit-Métis villages except for two that are Innu First Nations sites and one that is a non-Aboriginal community. This last one, Lodge Bay, is a community of both non-Aboriginal and Inuit-Métis people and is connected to Mary’s Harbour power plant.
The 17 remote communities of Labrador are diesel powered and have a total capacity of 16 MW, servicing 7,277 people. Of these sites, 16 report production numbers. These have a total capacity of 15.3 MW producing about 28,614 MWh/yr for a capacity factor of 21.4%. The average diesel price is about 32 cents/litres. Only five sites maintained by the Nunatsiavut regional government report retail electricity price of 14 cents/kWh (no year given).
Newfoundland & Labrador Hydro services all the diesel plants on the island and in Labrador. The Nunatsiavut regional government operates five of the Labrador Inuit communities.
Yukon
There are 22 remote communities in the Yukon with a total population of 30,176 people up from 22,828 from the Sigma report of 1985 for the same number of sites. High birth rates and resettling have been two of the main reasons for the increase in population. All the communities except one are shown as Aboriginal, the exception being an old commercial mining town, Elsa, which is connected to a local grid.
Yukon Energy Corporation, a publicly owned electrical utility and Yukon Electrical Company Ltd., a private power company, are the electricity suppliers and operators of all power plants in the Yukon. While the territory has a few extensive grid lines, these grids are considered local because they are not part of the North American grid and all their communities are deemed as off-grid remote communities.
The total capacity of all power plants in the Yukon is 51.6 MW from diesel fuel generation and 75.8 MW from hydro for a total of 127.4 MW.
August 2011 29/44

Remote Communities in Canada FINAL
Figure 3.6: Map of Yukon’s Remote Communities
Green: Aboriginal communities / Yellow: Non-Aboriginal communities
The largest grid system is called the Whitehorse-Aishihik-Faro Lake (WAF) and constitutes the bulk of this capacity. Hydro stations in the WAF system account for 70 MW, wind for 0.8 MW and diesel stations for 34.7 MW of capacity, for a total of 105.5 MW. This system provides power to 11 communities including Whitehorse, the capital of Yukon for a total population of 26,952 people (22,998 in Whitehorse alone). The WAF generates about 216,072 MWh/yr, for a capacity factor of 23.4%. Diesel fuel quantity is not reported although utility price is given at an average cost of 33 cents/litre.
Two other local grids (the Mayo and Destruction Bay grids) serve 4 and 2 communities respectively.
The Mayo grid is composed of a 5 MW hydro facility with a diesel backup plant of 2 MW near Mayo and another diesel plant of 6 MW in Dawson City that is used only as backup since it was connected to the Mayo grid in 2004. While the total capacity on this grid is large at 13 MW, power is mainly supplied by the hydro facility. It serves a total of 1,926 people. Total production is estimated at 28,121 MWh/yr, giving a capacity factor of 24.7% for the total capacity, or 64.2% using only the hydro facility.
The Destruction Bay grid is composed of one 700 kW diesel power plant powering electricity to a total of 128 persons. It produces an estimated 3,069 MWh/yr for a capacity factor of 50%. Utility fuel rate is 37 cents/litre in these northern locations.
Five other communities are not connected to any local grid. These are powered from individual diesel fuel power plants for a total of 8.2 MW, serving 2,270 people. They produce an estimated 15,946 MWh/yr for a
August 2011 30/44

Remote Communities in Canada FINAL capacity factor of 22.2%. Average cost of diesel fuel at the utility level is around 47 cents/litre including Old Crow, the most northern site paying an estimated 80 cents/litre. Data for three of the site shows that a total capacity of 7 MW, producing 13,996 MWh/yr (22.8% CF) and consuming 4,881,000 litre/yr (2008 data).
The Yukon Electrical Company Ltd. is the power supplier and operator of all power plants in the Yukon.
Table 3.6: Remote Communities of Yukon
Tem p #
Community/ Site/
Settlement Name
First Nation/ Band Name Type
Popula tion
Censu s 2006
Main Power Source
Local Grid Name
Fossil Fuel
Generati on Type
FF Capacity
Renewable Type
RE Capacity
Annual Energy Demand
-Name Name - (#) - Name - (kW) - (kW) (MW h)
302 Beaver Creek
White River First Nation
Aboriginal 112 FF n/a Diesel 900 n/a n/a 2,069
303 Burwash Landing
Kluane First Nation
Aboriginal 73 Local Grid
Destruction Bay
n/a n/a Biomass district heating system
n/a 1,769
304 Carcross Carcross/Tagish First Nation
Aboriginal 331 Local Grid
Whitehorse-Aishih k-Faro (WAF) grid
n/a n/a n/a n/a n/a
305 Carmacks Little Salmon/ Carmacks First
Nation
Aboriginal 425 Local Grid
WAF grid n/a n/a Biomass district heating system
n/a n/a
306 Champagn e
Champagne and Aishihik First Nations (?)
Aboriginal 24 Local Grid
WAF grid n/a n/a Biomass district heating system
n/a n/a
307 Dawson City
Tr'ondëk Hwëch'in
(part of larger Han nation)
Aboriginal 1327 Local Grid
Mayo Diesel Backup
6000 n/a n/a 11,748
308 Destruction Bay
Kluane First Nation
Aboriginal 55 FF Destruction Bay
Diesel 700 n/a n/a 1,300
309 Elsa n/a Non-Aboriginal
336 Local Grid
Mayo n/a n/a n/a n/a n/a
310 Faro Kaska Dena people of Ross
River, Ross River Dena
Council
Aboriginal 341 Local Grid
WAF grid Diesel Backup
5400 n/a n/a n/a
311 Haines Junction
Champagne and Aishihik First
Nations
Aboriginal 589 Local Grid
WAF grid Diesel Backup
1800 Biomass district heating system
n/a n/a
312 Johnsons Crossing
Johnson's Crossing
(tied to WAF grid)
Aboriginal 15 Local Grid
WAF grid n/a n/a n/a n/a n/a
313 Keno Keno (tied to Mayo grid)
Aboriginal 15 Local Grid
Mayo n/a n/a n/a n/a n/a
314 Marsh Lake
Carcross/Tagish First Nation
Aboriginal 1653 Local Grid
WAF grid n/a n/a n/a n/a n/a
315 Mayo First Nation of Nacho Nyak Dun
(affiliated with the Northern
Tutchone Council)
Aboriginal 248 RE Mayo Diesel Backup
2000 Hydro 5000 16,373
316 Old Crow Vuntut Gwitchin First Nation
Aboriginal 253 FF n/a Diesel 1100 n/a n/a 1,300
August 2011 31/44

Remote Communities in Canada FINAL
Tem p #
Community/ Site/
Settlement Name
First Nation/ Band Name Type
Popula tion
Censu s 2006
Main Power Source
Local Grid Name
Fossil Fuel
Generati on Type
FF Capacity
Renewable Type
RE Capacity
Annual Energy Demand
-Name Name - (#) - Name - (kW) - (kW) (MW h)
317 Pelly Crossing
Selkirk First Nation
Aboriginal 296 FF n/a Diesel 1000 n/a n/a 1,600
318 Ross River Kaska Dena people of Ross
River, Ross River Dena
Council
Aboriginal 313 Local Grid
WAF grid Diesel Backup
1000 n/a n/a n/a
319 Stewart Crossing
Stewart Crossing (tied to Mayo
grid)
Aboriginal 35 FF n/a Diesel 200 n/a n/a 350
321 Tagish and Marsh Lake
Carcross/Tagish First Nation
Aboriginal 222 Local Grid
WAF grid n/a n/a n/a n/a n/a
322 Teslin Dakh-ka Tlingit First Nation
Aboriginal 141 Local Grid
WAF grid Diesel Backup
1500 n/a n/a n/a
324 Watson Lake/Upper
Liard
Liard First Nation Aboriginal 474 FF n/a Diesel 5000 n/a n/a 10,627
325 Whitehorse Kwanlin Dun First Nation,
Ta'an Kwach'an Council
Aboriginal 22898 RE WAF grid Diesel Backup
25000 Hydro 70810 216,072
Total 22 21 - 30,176 17 - 51,600 - 75,810 263,208
Sites Aboriginal Sites Local Grid Total FF+RE 127,410 kW CF 23.6%
FF: Fossil Fuel – RE: Renewable Energy – NA: Not Applicable
Northwest Territories
The Northwest Territories (NWT) were divided in 1999 to form another territory called Nunavut, on the eastern side of NWT. Both territories have a total of 64 remote communities, which is one more than what was reported in the Sigma report twenty-five years ago. Population has increased significantly, going from 46,041 in 1985, to 71,403 today for both regions. High birth rates has been one of the main reason for the increase in population as well as the creation of Nunavut, which has attracted many people to come back and live there.
More specifically, the NWT currently has 38 remote communities for a total population of 41,950 people. 33 sites are Aboriginal communities for a total of 22,410 people, 5 sites are non-Aboriginal, for a total of 19,540 people, including Yellowknife with a population of 18,700 people. The remote communities in the NWT are shown in Figure 7.
The total installed capacity in the NWT is estimated at 186.3 MW of which, 114.7 MW is fossil fuel powered and 71.6 MW is renewable power. Of this, most is hydro, with a total of 49.8 MW; the remaining is from waste heat (21 MW), wood pellet, PV and solar heaters (less than 1 MW). Total production is estimated to be around 357,603 MW (2008), giving a capacity factor of 21.9%. In 2008, diesel fuel purchases totalled 14,218,794 litres for 25 sites producing 83,225 MWh/yr. Utility diesel price averaged 46 cents/litre (2008). Consumer rates averaged 26 cents/kWh.
The Northwest Territories Power Corporation (NTPC) is the main power supplier in the Northwest Territories. NTPC states that 75% of all NWT electricity is generated from hydroelectricity.
August 2011 32/44

Remote Communities in Canada FINAL
Figure 3.7: Map of Northwest Territories’ Remote Communities
Green: Aboriginal communities / Yellow: Non-Aboriginal communities
There are two local grids in the NWT near Yellowstone, located in the mid-southern area of NWT, having a total installed capacity of 99.7 MW of which, 49.1 MW is from hydro and 50.6 MW is from diesel fuel power plants and servicing 27,795 people.
The Snare Transmission System comprises the City of Yellowknife and three adjoining Aboriginal villages totalling 18,700 people for the city and 2,141 people for the villages. It has a total installed capacity of 67.2 MW of which, 30.3 MW is from hydro, 0.8 MW is from wood pellet and 36.1 MW is from diesel powered plants. Annual production is estimated at 292,710 MWh/yr for a capacity factor of 49.7%. Diesel purchased in 2008 amounted to 394,464 litres with a utility cost of 26 cents litres.
The Taltson Hydro System is located to the northeast of Fort Smith and serves 5 additional communities with a total population of 6,954 people. The power system has a total installed capacity of 32.5 MW of which 18 MW is hydro and 14.5 MW are diesel backup stations. Production numbers provided were not consistent to be valid.
August 2011 33/44

Remote Communities in Canada FINAL There are 28 remote communities that are not connected to a local grid of which 24 sites are Aboriginal communities, 2 are active mining sites and 2 are old mining towns. The total population for these sites is 14,155 people. Total installed capacity is 86.5 MW, with 64 MW from fossil fuel plants powered with diesel or natural gas, 21 MW is from waste heat and 1.5 MW is from hydro. Small PV and solar hot water systems have also been installed on public buildings.
Table 3.7: Remote Communities of Northwest Territories
Te mp #
Community/Site/ Settlement
Name First Nation/ Band Name Type
Popul ation Cens
us 2006
Main Power Sourc
e
Local Grid
Name
Fossil Fuel Generation
Type
FF Capac
ity Renewable
Type RE
Capacity Annual Energy
Demand
-Name Name - (#) - Name - (kW) - (kW) (MWh)
237 Aklavik Aklavik Aboriginal 594 FF n/a Diesel 1800 n/a n/a 2,817 238 Colville Lake
(Behdzi Ahda" First Nation )
Behdzi Ahda" First Nation
Aboriginal 126 FF n/a Diesel 240 n/a n/a 310
239 Deline (Fort Franklin)
Deline Aboriginal 525 FF n/a Diesel 1250 n/a n/a 2,610
240 Detah (Dene) Yellowknives Dene First
Nation
Aboriginal 247 Local Grid
Yellowkni fe Snare System
Diesel Backup
7360 n/a n/a n/a
241 Echo Bay (Port Radium)
Non-Aboriginal
10 n/a n/a n/a n/a n/a n/a n/a
242 Enterprise Enterprise Aboriginal 97 Local Grid
Taltson n/a n/a n/a n/a n/a
243 Fort Good Hope ( Community of K'asho Got'ine)
Charter Community of K'asho Got'ine
Aboriginal 557 FF n/a Diesel 1230 n/a n/a 2,864
244 Fort Liard (Acho Dene Koe)
Acho Dene Koe
Aboriginal 583 FF n/a Diesel 1320 n/a n/a 2,658
245 Fort McPherson (Tetlit Gwich'in )
Tetlit Gwich'in Aboriginal 776 FF n/a Diesel 1825 Waste Heat Recovery
n/a 3,453
246 Fort Providence (Deh Gah Gotie Dene Council )
Deh Gah Gotie Dene
Council
Aboriginal 727 RE n/a n/a n/a Hydro 1480 3,324
247 Fort Resolution (Deninu K'ue First Nation)
Deninu K'ue First Nation
Aboriginal 484 Local Grid
Taltson Diesel Backup
950 n/a n/a 6,000
x Diavik Diamond Mine
n/a Non-Aboriginal
810 FF n/a Diesel 27000 Waste Heat Recovery
21000 n/a
248 Fort Simpson (Liidlii Kue First
Nation )
Liidlii Kue First Nation
Aboriginal 1216 FF n/a Diesel 3210 Hydro 25 8,274
249 Fort Smith (Salt River First
Nation #195)
Salt River First Nation
#195
Aboriginal 2364 RE Taltson Diesel Backup
6150 Hydro 18000 466
250 Hay River / West Point
Town of Hay River/West Point First
Nation
Aboriginal 3648 Local Grid
Taltson Diesel Backup
7100 Solar Thermal System
n/a n/a
251 Hay River Reserve
(K'atlodeeche First Nation)
K'atlodeeche First Nation
Aboriginal 309 Local Grid
Taltson n/a n/a n/a n/a n/a
252 Holman Ulukhaktok Aboriginal 398 FF n/a Diesel 1140 n/a n/a 1,977 253 Inuvik Inuv k Aboriginal 3484 FF n/a Natural
Gas/Diesel 12380 PV 7.2 7,906
254 Jean Marie River Jean Marie River First
Nation
Aboriginal 81 FF n/a Diesel 230 PV 1.32 277
August 2011 34/44
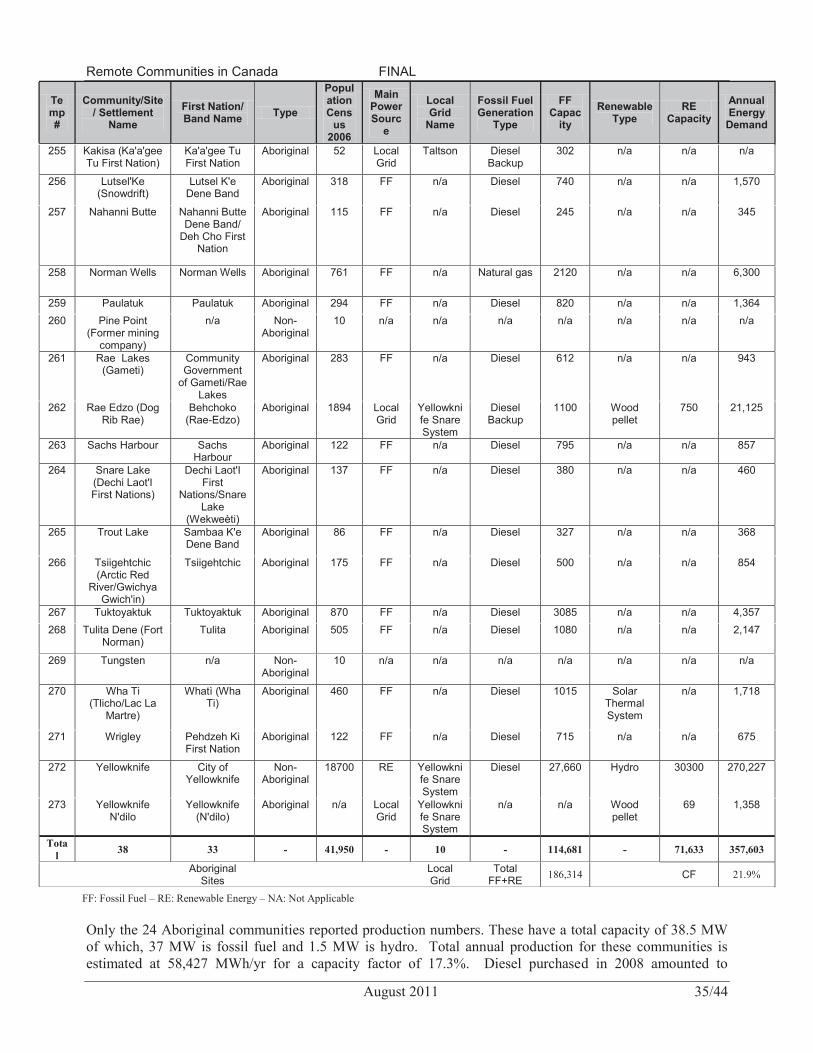
Remote Communities in Canada FINAL
Te mp#
Community/Site / Settlement
Name First Nation/ Band Name Type
Popul ation Cens
us 2006
Main Power Sourc
e
Local Grid
Name
Fossil Fuel Generation
Type
FF Capac
ity Renewable
Type RE
Capacity Annual Energy
Demand
255 Kakisa (Ka'a'gee Tu First Nation)
Ka'a'gee Tu First Nation
Aboriginal 52 Local Grid
Taltson Diesel Backup
302 n/a n/a n/a
256 Lutsel'Ke (Snowdrift)
Lutsel K'e Dene Band
Aboriginal 318 FF n/a Diesel 740 n/a n/a 1,570
257 Nahanni Butte Nahanni Butte Dene Band/
Deh Cho First Nation
Aboriginal 115 FF n/a Diesel 245 n/a n/a 345
258 Norman Wells Norman Wells Aboriginal 761 FF n/a Natural gas 2120 n/a n/a 6,300
259 Paulatuk Paulatuk Aboriginal 294 FF n/a Diesel 820 n/a n/a 1,364 260 Pine Point
(Former mining company)
n/a Non-Aboriginal
10 n/a n/a n/a n/a n/a n/a n/a
261 Rae Lakes (Gameti)
Community Government
of Gameti/Rae Lakes
Aboriginal 283 FF n/a Diesel 612 n/a n/a 943
262 Rae Edzo (Dog Rib Rae)
Behchoko (Rae-Edzo)
Aboriginal 1894 Local Grid
Yellowkni fe Snare System
Diesel Backup
1100 Wood pellet
750 21,125
263 Sachs Harbour Sachs Harbour
Aboriginal 122 FF n/a Diesel 795 n/a n/a 857
264 Snare Lake (Dechi Laot'I First Nations)
Dechi Laot'I First
Nations/Snare Lake
(Wekweèti)
Aboriginal 137 FF n/a Diesel 380 n/a n/a 460
265 Trout Lake Sambaa K'e Dene Band
Aboriginal 86 FF n/a Diesel 327 n/a n/a 368
266 Tsiigehtchic (Arctic Red
River/Gwichya Gwich'in)
Tsiigehtchic Aboriginal 175 FF n/a Diesel 500 n/a n/a 854
267 Tuktoyaktuk Tuktoyaktuk Aboriginal 870 FF n/a Diesel 3085 n/a n/a 4,357 268 Tulita Dene (Fort
Norman) Tulita Aboriginal 505 FF n/a Diesel 1080 n/a n/a 2,147
269 Tungsten n/a Non-Aboriginal
10 n/a n/a n/a n/a n/a n/a n/a
270 Wha Ti (Tlicho/Lac La
Martre)
Whatì (Wha Ti)
Aboriginal 460 FF n/a Diesel 1015 Solar Thermal System
n/a 1,718
271 Wrigley Pehdzeh Ki First Nation
Aboriginal 122 FF n/a Diesel 715 n/a n/a 675
272 Yellowknife City of Yellowknife
Non-Aboriginal
18700 RE Yellowkni fe Snare System
Diesel 27,660 Hydro 30300 270,227
273 Yellowknife N'dilo
Yellowknife (N'dilo)
Aboriginal n/a Local Grid
Yellowkni fe Snare System
n/a n/a Wood pellet
69 1,358
Tota l 38 33 - 41,950 - 10 - 114,681 - 71,633 357,603
Aboriginal Sites
Local Grid
Total FF+RE 186,314 CF 21.9%
FF: Fossil Fuel – RE: Renewable Energy – NA: Not Applicable
Only the 24 Aboriginal communities reported production numbers. These have a total capacity of 38.5 MW of which, 37 MW is fossil fuel and 1.5 MW is hydro. Total annual production for these communities is estimated at 58,427 MWh/yr for a capacity factor of 17.3%. Diesel purchased in 2008 amounted to
August 2011 35/44

Remote Communities in Canada FINAL 1,05411,603,542 litres with a utility cost averaging 47 cents litres (2008). Electricity rate to consumers averages 27 cents/kWh.
Nunavut
The Nunavut territory was officially created from the Northwest Territories in 1999. It comprises a major portion of northern Canada, and most of the Canadian Arctic Archipelago. The capital, Iqaluit, is on Baffin Island. The territory is also home of the most northern community of Canada called Alert.
Nunavut has 26 remote communities for a total population of 29,453 people. All are Inuit communities.
Figure 3.8: Map of Nunavut’s Remote Communities
Green: Aboriginal communities / Yellow: Non-Aboriginal communities
There are no local grids in Nunavut as all the communities are of great distance from one another. All 26 sites are fossil fuel powered by diesel power plants for a total of 50.3 MW. Two sites have small PV and wind power systems totalling less than 100 kW. There are currently no hydro power stations in Nunavut, though one is being considered in Iqaluit.
August 2011 36/44

Table 3.8: Remote Communities of Nunavut Remote Communities in Canada FINAL
Popul Main Community/Sit Tem First Nation/ ation Power e/ Settlement Type p # Band Name Censu SourcName s 2006 e
Name Name - (#) --
274 Arctic Bay Ikpiarjuk Aboriginal 690 FF (Ikpiarjuk)
275 Arviat (Eskimo Arviat Aboriginal 2,060 FF Point)
276 Baker Lake Qamanittuaq Aboriginal 1,728 FF 277 Bathurst Inlet Kingoak Aboriginal 5 n/a 278 Broughton Qikiqtarjuaq Aboriginal 473 FF
Island 279 Cambridge Bay Ikaluktutiak (or Aboriginal 1,477 FF
Iqaluktuuttiaq)
280 Cape Dorset Kinngait Aboriginal 1,236 FF 281 Chesterfield Igluligaarjuk Aboriginal 332 FF
Inlet 282 Clyde River Kangiqtugaapik Aboriginal 820 FF 283 Coral Harbour Sallit Aboriginal 769 FF 284 Gjoa Haven Uqsuqtuuq Aboriginal 1,064 FF 285 Grise Fiord Aujuittut Aboriginal 141 FF 286 Hall Beach Sanirajak Aboriginal 654 FF 287 Igloolik Iglulik Aboriginal 1538 FF
288 Iqaluit Iqaluit Aboriginal 6184 FF (Frobisher Bay)
289 Kimmirut (Lake Kimmirut Aboriginal 411 FF Harbour)
290 Kugluktuk Qurluqtuq Aboriginal 1302 FF (Coppermine)
292 Pangnirtung Pangniqtuuq Aboriginal 1325 FF
293 Pelly Bay Kugaaruk Aboriginal 688 FF
294 Pond Inlet Mittimatal k Aboriginal 1315 FF 295 Rankin Inlet Kangiqiniq (or Aboriginal 2,358 FF
Kangirliniq)
296 Repulse Bay Naujaat Aboriginal 748 FF 297 Resolute Qausuittuq Aboriginal 229 FF
(Resolute Bay)
298 Sanikiluaq Sanikiluaq Aboriginal 744 FF
299 Taloyoak Talurjuaq Aboriginal 809 FF (Spence Bay)
301 Whale Cove T kirarjuaq Aboriginal 353 FF
Total 26 26 - 29,453 -
Sites Aboriginal Sites
FF: Fossil Fuel – RE: Renewable Energy – NA: Not Applicable
Fossil RE Annual Local Grid Fuel FF Renewa Capac EnergyName Generati Capacity ble Type ity Demand on Type
Name - (kW) - (kW) (MWh)
n/a Diesel 1130 n/a n/a 7,652
n/a Diesel 2220 Waste n/a 18,810 Heat
Recovery n/a Diesel 2165 n/a n/a 17,724 n/a n/a n/a n/a n/a n/a n/a Diesel 1110 n/a n/a 23,196
n/a Diesel 3125 District n/a 23,359 Heating System
n/a Diesel 1805 n/a n/a 14,786 n/a Diesel 810 n/a n/a 5,631
n/a Diesel 1020 n/a n/a 7,867 n/a Diesel 1290 n/a n/a 8,493 n/a Diesel 1535 n/a n/a 10,576 n/a Diesel 465 n/a n/a 3,194 n/a Diesel 1195 n/a n/a 7,259 n/a Diesel 1705 District n/a 14,545
Heating System
n/a Diesel 11740 PV 3.2 128,732
n/a Diesel 840 n/a n/a 5,005
n/a Diesel 1665 District n/a 13,334 Heating System
n/a Diesel 2225 District n/a 16,093 Heating System
n/a Diesel 750 Waste n/a 6,000 Heat
Recovery n/a Diesel 2255 n/a n/a 15,114 n/a Diesel 4280 Wind 50 39,164
n/a Diesel 720 n/a n/a 7,112 n/a Diesel 3000 n/a n/a 10,827
n/a Diesel 990 District n/a 7,081 heating system
n/a Diesel 1505 District n/a 7,671 Heating System
n/a Diesel 750 n/a n/a 4,797
0 - 50,295 - 53 424,022 TotalLocal Grid 50,348 CF 96.1% FF+RE
August 2011 37/44

Remote Communities in Canada FINAL
Numbers for annual production for these communities are not reliable as they show a total annual production of 424,020 MWh/yr (2006) for about 30 MW of total capacity. This would give a capacity factor of 96.1%, which is unrealistic. Diesel purchased in 2006 amounted to 40,280,886 litres with a utility cost averaging 50 cents per litre (2006). However, because production numbers are questionable, diesel purchase numbers may also not be accurate. Electricity rate to consumers averages 60 cents/kWh.
Power plants are all operated by Nunavut Power. Electricity rates are regulated by the Quilliq Power Corporation, a subsidiary of the Nunavut government.
August 2011 38/44

Remote Communities in Canada FINAL
4. Conclusions
As can be seen from the information gathered by the off-grid working group of AANDC-NRCan, it is difficult to have factual and up-to-date data for energy production and uses in remote communities of Canada. This overview report provides the best information available to AANDC and NRCan at the time of writing. This does not mean to suggest that better information does not exist or that it is not collected. It is simply that it is not available in a centralised database and a uniform format. Furthermore, the number of remote communities and their population changes with time and without a proper methodology for reporting data in a common format and an organisation dedicated to managing this information, it will continue to be difficult to collect and rely on this information.
Despite this, information that is available today shows that remote communities in Canada are numerous and face serious energy issues related to their remoteness and reliance on technologies that were developed and installed many years ago. Very few remote communities use other technologies to produce electricity apart from true-and-tried diesel powered generators.
Remote communities of Canada are diverse in many aspects. They extend from over 20 degrees of latitude and 90 degrees of longitude and from arctic dry climate to sea-coast humid forestry climate and from mountainous to plain regions. Their population ranges from 10 to 15,000 with some communities that are completely independent while others are connected by local grids.
It is difficult to make comparison between communities considering the diversity of physical and climate conditions, as well as the diversity of energy supply methods in use and diversity of responsible agencies supervising these communities. However, the aggregation of this data, even if incomplete, provides significant insights in terms of community energy planning and points to areas that could be strategically targeted for future sustainable development programs.
One important element to understand is the impact that energy has on these communities and how expensive it is to provide reliable electricity to their population. Another element is to realise how little has been done to integrate local resources to the energy mix of these communities. Only Quebec, NWT and the Yukon use hydroelectricity on a large scale to provide electricity to a number of communities. BC has a few communities relying on hydroelectricity on an individual basis. Very little solar, wind and biomass projects have been installed successfully in Canada. There were many attempts from year to year but these have failed for a number of reasons. While it is not the scope of this report to discuss on these, failures, it is important to note that there have been successes and we can learn from past attempts The fact is that remot e communities must find ways to become more self-sufficient and environmentally sustainable.
The economies of remote communities have traditionally been based on local resources such as fishing, hunting and trapping but with modernisation, electricity, heat and mechanical transportation have been brought to these communities using technology and fuel imported from the south. It is clear that in the near term, these communities will continue to rely on fossil fuels; however it is possible to reduce their dependence and increase their reliance on local energy resources. This would decrease pollution and could contribute to their economic development and security of energy supply.
The ecoENERGY for Aboriginal and Northern Communities Program is a good first step in this direction. The aim of the program is to work with all remote Aboriginal communities that rely on diesel power generation to improve energy efficiency and adopt alternative energy sources to reduce dependence on diesel fuel. This also has the added consequence of reducing greenhouse gas emissions in these regions and should stabilize, to some degree, the cost of energy in the communities.
This report and the database that it aims to build complement this effort by reporting factual information on all remote communities, whether they are Aboriginal or not, so that the most practical and cost-effective
August 2011 39/44

Remote Communities in Canada FINAL solutions may be implemented for communities in a specific region. Clustering of greater numbers of communities may in turn attract outside investors with innovative solutions.
August 2011 40/44
Remote Communities in Canada FINAL
Annex A: Collected Data by Provinces and Territories
Excel tables showing remote communities data by provinces and territories have been compiled for use by government officials.
This data has been collected by the Off-Grid Sub-Committee Working Group up until September 2010 and has been reviewed and updated by NRCan between January and March 2011. The information is presented in a format that is common for each provinces and territories and is summarized in the Canada tab. This Canada table cannot be modified but it is possible to select a field in line 8 and show only these selected fields with subtotals of these fields shown in line 345.
As can be seen by the light red shading marker, there are still a number of important data that are missing. The aim of the database is to provide a tool to complete this information automatically by people who are in the field and have the information.
Please note that data shown in this report and in the accompanying Excel tables were originally obtained from a variety of sources that were verified for accuracy or consistency only up to a certain level. It is the best information available collectively but should be used with caution and verified individually for specific communities.
Note also that transcription errors might have occurred and are the sole responsibility of the author.
August 2011 41/44

Remote Communities in Canada FINAL
Annex B: Presentation of the Remote Communities Energy Database
The Remote Communities Energy Database is a tool that aims to collect and show pertinent factual information about the generation and use of electricity and other energy sources for all remote communities of Canada. It uses a web driven application so this information can be viewed by anyone with a web access and be updated by selected persons.
Most of the information collected in the database will be available to all. Only selected notes and information deemed sensitive by a community will be password protected and will be available only to authorized persons. Information that will be shown is public information that is normally available from Statistics Canada, from remote communities themselves, from publicly available reports or from public web sites. Its availability in one site where data can be collected and searched is what makes it a powerful tool.
The web application will be accessible from the Government of Canada’s ecoAction web page. It will open on a map of Canada where users will be able to select a province or territory and then select the community to be shown. From this, the user will be able to download specific selected information in an Excel table. The information will be searchable and comparison between different communities will be possible.
The database will first be available only to selected persons so that it can be tested and its information updated by key stakeholders working with remote communities in Canada. It will initially be populated from data stored in the Excel file used within the current report. This information will automatically be updated by authorized officers from AANDC, NRCan and concerned provincial/territorial departments. Once the application will have been tested and updated to a public version, it will officially be released to the public.
Both NRCan and AANDC will be administrators of the database and will provide authorization for selected persons to do the changes to the application and provide updates on the data itself.
Figure A1 shows a mock-up of the home page of the database. Form this page, users will be able to navigate down to a province/territory page or search for selected fields or for a specific remote community. A summary table of key information on remote communities will be shown on this first page.
A listing of each remote community with key selected information will be shown on the province and territory pages (mock-up not shown). From this page, it will be possible to select the community itself, which will open the remote community page.
The remote community page will show a small map of the selected site and provide general information on the community as well as specific electricity and energy related information. Figure A2 shows a mock-up of this remote community page. Note that because this is a web base application, information will not be presented as condensed in this figure but will be spread out on a number of sub-pages. This information will be searchable and will be downloadable to an Excel spreadsheet for further analysis.
August 2011 42/44

Remote Communities in Canada FINAL
Figure A1: Mock-up of Home Page of Remote Communities Energy Database
August 2011 43/44

Remote Communities in Canada FINAL
Figure A2: Mock-up of Remote Community Information Page Remote Community Information Sheet Name Community Province/territory
Latitude
Region (description)
Type
INAC Community Number
Aboriginal Denomination
PopulationAccess (Road/Boat/Plane)
Electricity Service Provider
Main Power Source
Fossil Fuel Power Plant Total Capacity
Annual Generation (Aver.)
Yearly Fuel Consumption
Fuel Price (at site)
Mean Transportation of fuel Storage Capacity
Renewable Power Plant Total Capacity Number Gensets
Other Renewable Energy Sources Total Capacity
Annual RE Generation (Aver.)
Local Grid Lenght Grid (Plant to Subst.) Nominal Size
Yearly Electricity Budget Funding Body
Demand Summary (details in supp. sheet) Average Annual Demand Peak Load Number households Commercial/Institutional Main Substation/Transformers
Energy Prices Electricity Price (Household) Electricity Price (General Service) Heating Oil Price
Community Energy Plan Conducted: INAC Funding Notes
Notes Show potential of Renewable Information updated by:
Status (Active/NonActive)
Longitude
Abor/Non-Abor First Nation/Inuit/Innu/Me is Commercial/Settlement
NRCan Community Number
Date of last census:
Fossil Fuel/RE/Hybrid/Local Grid
Diesel #2/ #6 /NG/Prop kW Year
MWh/yr Year
L or m3 (Power Plant O Year
$/L or m3
L or m3
If available Purchase Price Transportation
Distance from supply Minimal Reserve (winter)
$/L or m3 $/L or m3 km L or m3
Hydro/W ind/Biomass/PV Show main only kW Quant.
kW (write in)
MWh/yr Year
Name power plant km V MW
$ Year dYbud1
Year Measured MW h/yr kW
MW KV/KV
Year Measured $/L $/kWh $/kW h
Date Note:
Date
Ph
Ph
DB No.
Map Locator
Date Inst.
Date Inst.
August 2011 44/44