stay connected web and social media resources
TRANSCRIPT

IFC Financial Highlights
Dollars in millions, as of and for the years ended June 30*
2013 2012 2011 2010 2009
Net income (loss) attributable to IFC $ 1,018 $ 1,328 $ 1,579 $ 1,746 $ (151)
Grants to IDA $ 340 $ 330 $ 600 $ 200 $ 450
Income before grants to IDA $ 1,350 $ 1,658 $ 2,179 $ 1,946 $ 299
Total assets $ 77,525 $ 75,761 $ 68,490 $ 61,075 $ 51,483
Loans, equity investments and debt securities, net $ 34,677 $ 31,438 $ 29,934 $ 25,944 $ 22,214
Estimated fair value of equity investments $ 13,309 $ 11,977 $ 13,126 $ 10,146 $ 7,932
KEY RATIOS
Return on average assets (GAAP basis) 1.3% 1.8% 2.4% 3.1% -0.3%
Return on average capital (GAAP basis) 4.8% 6.5% 8.2% 10.1% -0.9%
Cash and liquid investments as a percentage of next three years’ estimated net cash requirements 77% 77% 83% 71% 75%
Debt- to-equity ratio 2.6:1 2.7:1 2.6:1 2.2:1 2.1:1
Total resources required ($ billions) $ 16.8 $ 15.5 $ 14.4 $ 12.8 $ 10.9
Total resources available ($ billions) $ 20.5 $ 19.2 $ 17.9 $ 16.8 $ 14.8
Total reserve against losses on loans to total disbursed loan portfolio 7.20% 6.60% 6.6% 7.4% 7.4%
* See Management’s Discussion and Analysis and Consolidated Financial Statements for details on the calculation of these numbers:
http://www.ifc.org/ifcext/annualreport.nsf/Content/AR2013_Financial_Reporting
IFC Operational Highlights
Dollars in millions, for the year ended June 30
2013 2012 2011 2010 2009
NEW INVESTMENT COMMITMENTS
Number of projects 612 576 518 528 447
Number of countries 113 103 102 103 103
For IFC’s own account $ 18,349 $ 15,462 $ 12,186 $ 12,664 $ 10,547
CORE MOBILIZATION*
Syndicated loans1 $ 3,098 $ 2,691 $ 4,680 $ 1,986 $ 1,858
Structured fi nance – – – $ 797 $ 169
IFC initiatives & other $ 1,696 $ 1,727 $ 1,340 $ 2,358 $ 1,927
Asset Management Company (AMC) Funds $ 768 $ 437 $ 454 $ 236 $ 8
Public- Private Partnership (PPP)2 $ 942 $ 41 – – –
Total core mobilization $ 6,504 $ 4,896 $ 6,474 $ 5,377 $ 3,962
INVESTMENT DISBURSEMENTS
For IFC’s own account $ 9,971 $ 7,981 $ 6,715 $ 6,793 $ 5,640
Syndicated loans3 $ 2,142 $ 2,587 $ 2,029 $ 2,855 $ 1,958
COMMITTED PORTFOLIO
Number of fi rms 1,948 1,825 1,737 1,656 1,579
For IFC’s own account $ 49,617 $ 45,279 $ 42,828 $ 38,864 $ 34,502
Syndicated loans4 $ 13,633 $ 11,166 $ 12,387 $ 9,302 $ 8,299
ADVISORY SERVICES
Advisory Services program expenditures $ 232.0 $ 197.0 $ 181.7 $ 166.4 $ 157.8
Share of program in IDA countries5 65% 65% 64% 62% 52%
*Financing from entities other than IFC that becomes available to client due to IFC’s direct involvement in raising resources.
1. Includes B- Loans, Parallel Loans and A- Loan Participation Sales (ALPS).
2. Third- party financing made available for public-private partnership projects due to IFC’s mandated lead advisor role to national, local, or other government entity.
3. Includes B- Loans and Agented Parallel Loans.
4. Includes B- Loans, A- Loan Participation Sales (ALPS), Agented Parallel Loans, and Unfunded Risk Participations (URPs).
5. All references in this report to percentages of advisory program expenditures in IDA countries and fragile and conflict- affected areas exclude global projects.
In FY13, our investments climbed to an all- time high of nearly $25 billion, leveraging the power of the private sector to create jobs and tackle the world’s most pressing development challenges.
1,500
500
1,000
–500
0
2,000
Net Income (Loss) Attributable to IFCDollars in millions
12 131109 10
60,000
40,000
20,000
0
80,000
Total AssetsDollars in millions
12 131109 10
PhotographyPage 4: Ray Rayburn/WB Photolab Page 6: Iwan BagusPage 8–9: Iwan BagusPage 18–19: Margie Politzer/Getty Page 20–21: Eightfi sh/GettyPage 22–23: Commerce and
Culture Agency/GettyPage 24–25: Dan Josephson/Getty Page 34: Vaner Cassaes Page 35: Sonata DkharPage 36: AbengoaPage 37: Gerardo Salazar (top);
Abengoa (bottom) Page 38: Tom Cockrem/Getty Page 39: Johannes Wiebus-O’HeronPage 42: Manas Ranjan Ojha Page 43: Etileno XXIPage 44: Jamie Marshall–Tribaleye
Images/Getty Page 45: Mohamed Essa (left);
Kushang Singh (right) Page 46: Tran Thiet DungPage 47: Mackenzie KellerPage 50: Rebecca PostPage 51: Azito Energie (left);
Abhay (right) Page 52: Lisa DadlaniPage 53: Apollo Tyres Page 54: loveguli/Getty Page 58: Andrew Testa/PanosPage 59: Roshan (top);
Eric Dufl os (bottom) Page 60: Joseph Montezinos Page 61: Sirli BenarolyaPage 62: Ric Francis Page 63: Evgeniya Shatunova (top);
Ric Francis (bottom)Page 65: Eudes Santana Page 70: Anam AbbasPage 78: Pallon Daruwala
IFC ONLINE
IFC websiteifc.org
Annual Reportifc.org/AnnualReport
Social Media Indexifc.org/SocialMediaIndex
Facebookfacebook.com/IFCwbg
Twittertwitter.com/IFC_org
LinkedInon.ifc.org/ifcLinkedIn
Google+gplus.to/IFCwbg
Scribdscribd.com/IFCpublications
YouTubeyoutube.com/IFCvideocasts
CREDITS
IFC Annual Report TeamBruce MoatsDirector, External and Corporate Relations, World Bank Group
Lisa Kopp Chief of Brand Marketing and Production
Joseph RebelloChief Editor
Aaron RosenbergChief of Public Affairs
Inae RiverasEditorial Consultant
Katherine KlabenConsultant
DesignAddisonwww.addison.com
IllustrationPage 12–13: Thomas PorostockyPage 14–15: James TaylorPage 16–17: James Taylor
PrintingUNIMACunimacgraphics.com
IFC’s website, www.ifc.org, provides comprehensive information on every aspect of our activities. It includes con-tact information for offi ces worldwide, news releases and feature stories, data on results measurement, disclosure documents for proposed investments, and key policies and guidelines aff ect-ing IFC and our client companies.
The online version of IFC’s Annual Report 2013 provides downloadable PDFs of all materials in this volume and translations as they become available. It is available at www.ifc .org/ annualreport. The website also provides more information on sustain-ability, including a Global Reporting Initiative index.
STAY CONNECTEDWEB AND SOCIAL MEDIA RESOURCES
_ 111THE POWER OF PARTNERSHIPS
IFC Year in Review

IFC, a member of the World Bank Group, is the largest global development institution focused exclusively on the private sector in developing countries.
Established in 1956, IFC is owned by 184 member countries, a group that collectively determines our policies. Our work in more than 100 developing countries allows companies and fi nancial institutions in emerging markets to create jobs, generate tax revenues, improve corporate governance and environmental performance, and contribute to their local communities.
IFC’s vision is that people should have the opportunity to escape poverty and improve their lives.
ABOUT IFC
IFC Annual Report 2013
THE POWER OF PARTNERSHIPS _ 1

This report summarizes IFC’s role in helping the private sector create jobs and opportunity in developing countries. It highlights how we spur innovation (pages 32–39), infl uence policy (pages 40–47), provide a demonstration eff ect for others (pages 48–55), and strive to maximize our development impact (pages 56–63).
2 _
4 to 9
Leadership Perspectives
30 to 63
How IFC Creates Opportunity
111
Stay Connected
65 to 69
Measuring Up
70 to 77
Our Businessand Expertise
78 to 110
Our Peopleand Practices
10 to 25
The Powerof Partnerships
26 to 29
IFC’s Global Results
30 65
70 78
_ 3THE POWER OF PARTNERSHIPS

Leadership Perspectives
A Letter fromWORLD BANK GROUP PRESIDENT JIM YONG KIM
We are at an auspicious moment in history. Thanks to the successes of the past few decades and a favorable economic outlook, developing countries now have an unprecedented opportunity: the chance to end extreme poverty within a generation. This opportunity must not be squandered.
Earlier this year, we in the World Bank Group set two specifi c and measurable goals for ourselves and our partners in the development community: eff ectively ending extreme poverty by shrinking the share of people living on less than $1.25 a day to 3 percent by 2030, and promoting shared prosperity by raising the incomes of the poorest 40 percent of the population in every developing country.
These are ambitious goals, and success is far from inevitable. Nearly fi ve years after the global fi nancial crisis began, in 2008, the world’s economic recovery remains fragile. Developed countries struggle with high unemployment and weak economic growth. Developing countries are growing more slowly than before the crisis. Moreover, the fi ght against poverty will become increasingly diffi cult as we push toward our target, since those who remain poor will be the hardest to reach.
Other challenges could pose new threats to poverty reduction. Confl ict and political instability present major risks, because they increase poverty and create long- term obstacles to development. Moreover, a warming planet could increase the prevalence and size of drought- aff ected areas, and make extreme weather events more frequent, with unpredictable costs in terms of lives and fi nancial resources.
Yet, I remain optimistic that achieving the goals is within our reach. Doing so will require systemic and relentless collaboration from the World Bank Group, our 188 member countries, and other partners.
IFC will play an important role by mobilizing the power of the private sector to create jobs and opportunity where they are needed most.
4 _ IFC ANNUAL REPORT 2013

This year, IFC provided a record of nearly $25 billion in fi nancing for private sector development, $6.5 billion of which was mobilized from investment partners. Nearly half of IFC’s 612 investment projects took place in the poor-est countries served by the International Development Association. More than $5 billion went to support private sector development in Sub- Saharan Africa, and more than $2 billion went to South Asia.
IFC Asset Management Company, an IFC subsidiary that mobilizes capital from third- party investors for invest-ment in developing countries, increased its assets under management to $5.5 billion. This represents a signifi cant milestone for a company set up just four years ago. In addition, IFC mobilized more than $3 billion from other investors in the form of syndicated loans.
This Annual Report shows the crucial role IFC has played in providing support for small and medium entrepre-neurs, expanding access to fi nance for the poor, creating jobs, and generating opportunities for women.
In Côte d’Ivoire, for example, IFC arranged a fi nancing package that will allow the Azito power plant to increase energy production by 50 percent without using additional gas. This will help reduce power shortages in the country and support its economic recovery. In Latin America, IFC is extending quality healthcare to poor communities in the Brazilian state of Bahia with a highly innovative public- private partnership model. And, working under a joint strategy with the World Bank, IFC is bringing new opportunity to Myanmar, a country whose economic development has lagged signifi -cantly behind that of its East Asian counterparts.
IFC is also making important strides in helping the private sector address climate change. Earlier in 2013, IFC issued the world’s largest “green” bond, raising $1 billion that will be directed to climate- related projects across the globe. In addition, IFC helped over 10 building developers in Asia, Latin America, and other regions adopt more energy- effi cient designs. These are the types of steps we must take to ensure that climate change does not wipe out the hard- won develop-ment gains the world has achieved in recent decades.
—JIM YONG KIMWorld Bank Group President
This year, IFC provided a record of nearly $25 billion in fi nancing for private sector development, $6.5 billion of which was mobilized from investment partners.
_ 5THE POWER OF PARTNERSHIPS

Leadership Perspectives
A Letter from IFC EXECUTIVE VICE PRESIDENT AND CHIEF EXECUTIVE OFFICER JIN- YONG CAI
Across the world, the challenges of development are vast — and growing. So are the needs of entrepreneurs, investors, and businesses in developing countries, which struggle to overcome constraints in finance, infrastructure, employee skills, and the regulatory environment.
For IFC, this represents a tremendous opportunity: to engage the creativity and resources of the business community to change the world for the better. By helping companies overcome obstacles to sustainable growth, we help them create opportunity and improve lives. We enlist them as partners in the global effort to end extreme poverty and promote shared prosperity.
We believe strongly in the power of partnerships to make a transformational difference. As the world’s largest global development institution focused on the private sector, we worked this year with nearly 2,000 private sector clients and a wide array of governments, donors, and other stakeholders. The result was another record year for IFC — we invested and mobilized more money for private sector development than ever before, helping sustain development in more than 100 countries.
Our new investments climbed to an all time high of nearly $25 billion in FY13, including funds mobilized from other investors, providing capital to more than 600 projects and companies across the world. We invested $18.3 billion for our own account and mobilized $6.5 billion from other investors. In a time of declining official aid flows to developing countries, these investments had an impact in every region of the world.
We now have an investment portfolio of nearly $50 billion in nearly 2,000 companies in 126 countries. This diversification has contributed to our strong risk adjusted returns — and to our development impact.
At the end of 2012, our investments provided jobs for 2.7 million people in developing countries. With our support, our clients treated 17.2 million patients, educated 1 million students, and improved opportunities for 3.1 million farmers. They generated power for 52.2 million customers, and distributed water to 42 million.
6 _ IFC ANNUAL REPORT 2013
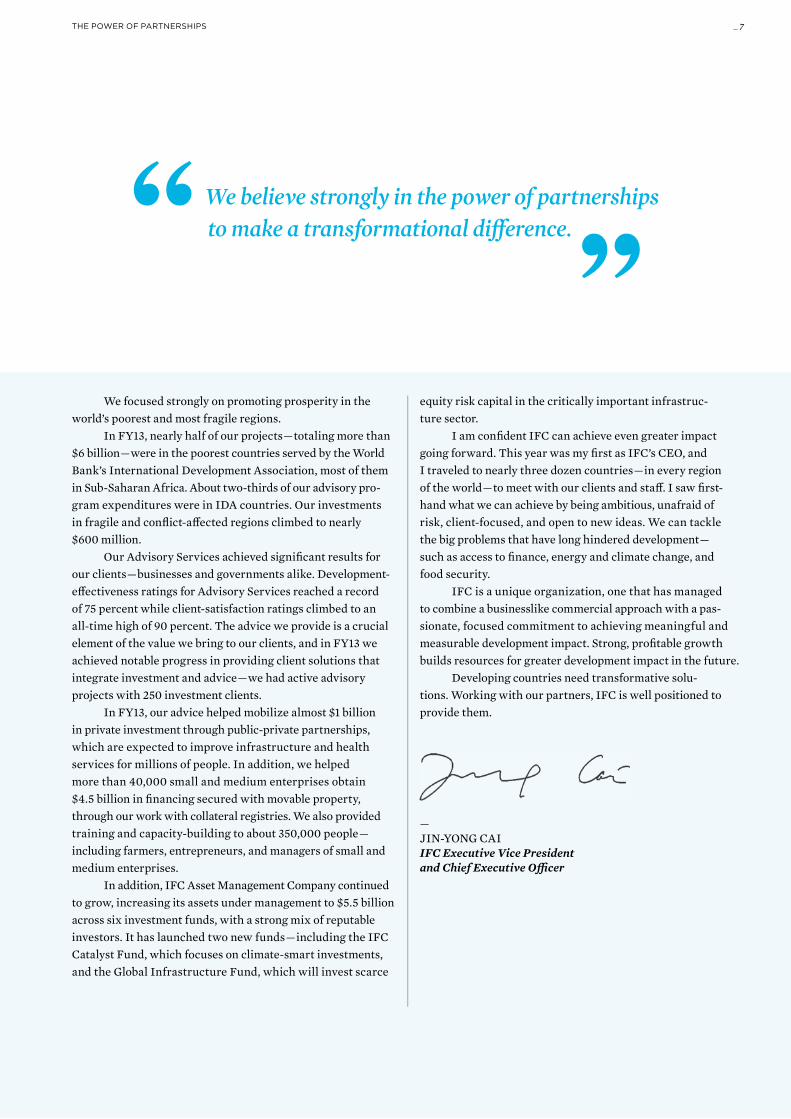
We focused strongly on promoting prosperity in the world’s poorest and most fragile regions.
In FY13, nearly half of our projects�—� totaling more than $6 billion�—� were in the poorest countries served by the World Bank’s International Development Association, most of them in Sub- Saharan Africa. About two- thirds of our advisory pro-gram expenditures were in IDA countries. Our investments in fragile and confl ict- aff ected regions climbed to nearly $600 million.
Our Advisory Services achieved signifi cant results for our clients�—� businesses and governments alike. Development- eff ectiveness ratings for Advisory Services reached a record of 75 percent while client- satisfaction ratings climbed to an all- time high of 90 percent. The advice we provide is a crucial element of the value we bring to our clients, and in FY13 we achieved notable progress in providing client solutions that integrate investment and advice�—� we had active advisory projects with 250 investment clients.
In FY13, our advice helped mobilize almost $1 billion in private investment through public- private partnerships, which are expected to improve infrastructure and health services for millions of people. In addition, we helped more than 40,000 small and medium enterprises obtain $4.5 billion in fi nancing secured with movable property, through our work with collateral registries. We also provided training and capacity- building to about 350,000 people�—� including farmers, entrepreneurs, and managers of small and medium enterprises.
In addition, IFC Asset Management Company continued to grow, increasing its assets under management to $5.5 billion across six investment funds, with a strong mix of reputable investors. It has launched two new funds�—� including the IFC Catalyst Fund, which focuses on climate- smart investments, and the Global Infrastructure Fund, which will invest scarce
equity risk capital in the critically important infrastruc-ture sector.
I am confi dent IFC can achieve even greater impact going forward. This year was my fi rst as IFC’s CEO, and I traveled to nearly three dozen countries�—� in every region of the world�—� to meet with our clients and staff . I saw fi rst-hand what we can achieve by being ambitious, unafraid of risk, client- focused, and open to new ideas. We can tackle the big problems that have long hindered development�—� such as access to fi nance, energy and climate change, and food security.
IFC is a unique organization, one that has managed to combine a businesslike commercial approach with a pas-sionate, focused commitment to achieving meaningful and measurable development impact. Strong, profi table growth builds resources for greater development impact in the future.
Developing countries need transformative solu-tions. Working with our partners, IFC is well positioned to provide them.
—JIN- YONG CAIIFC Executive Vice Presidentand Chief Executive Offi cer
We believe strongly in the power of partnerships to make a transformational diff erence.
_ 7THE POWER OF PARTNERSHIPS

MANAGEMENT TEAMOur seasoned team of executives ensures that IFC’s resources are deployed eff ectively, with a focus on maximizing development impact and meeting the needs of our clients. IFC’s Management Team benefi ts from years of development experience, a diversity of knowledge, and distinct cultural perspectives�—�qualities that
enhance IFC’s uniqueness. The team shapes our strategies and policies, positioning IFC to help improve the lives of more poor people in the developing world. Our executives are vital in maintaining IFC’s corporate culture of performance, accountability, and engagement.
Jingdong Hua
Vice President, Treasury and Syndications
Janamitra Devan
Vice President, Financial and Private Sector Development
Jean Philippe Prosper
Vice President, Sub-Saharan Africa, Latin America and the Caribbean
Saadia Khairi
Vice President, Risk Management and Portfolio
Karin Finkelston
Vice President, Asia-Pacifi c
Dorothy Berry
Vice President, Human Resources, Communications, and Administration
8 _ IFC ANNUAL REPORT 2013

Ethiopis Tafara
Vice President, General Counsel
Dimitris Tsitsiragos
Vice President, Europe, Central Asia, Middle East and North Africa
Jin-Yong Cai
IFC Executive Vice President and CEO
Nena Stoiljkovic
Vice President, Business Advisory Services
Gavin Wilson
CEO, IFC Asset Management Company
Rashad Kaldany
Vice President and Chief Operating Offi cer
Jorge Familiar Calderon
Vice President and Corporate Secretary(not pictured)
_ 9THE POWER OF PARTNERSHIPS
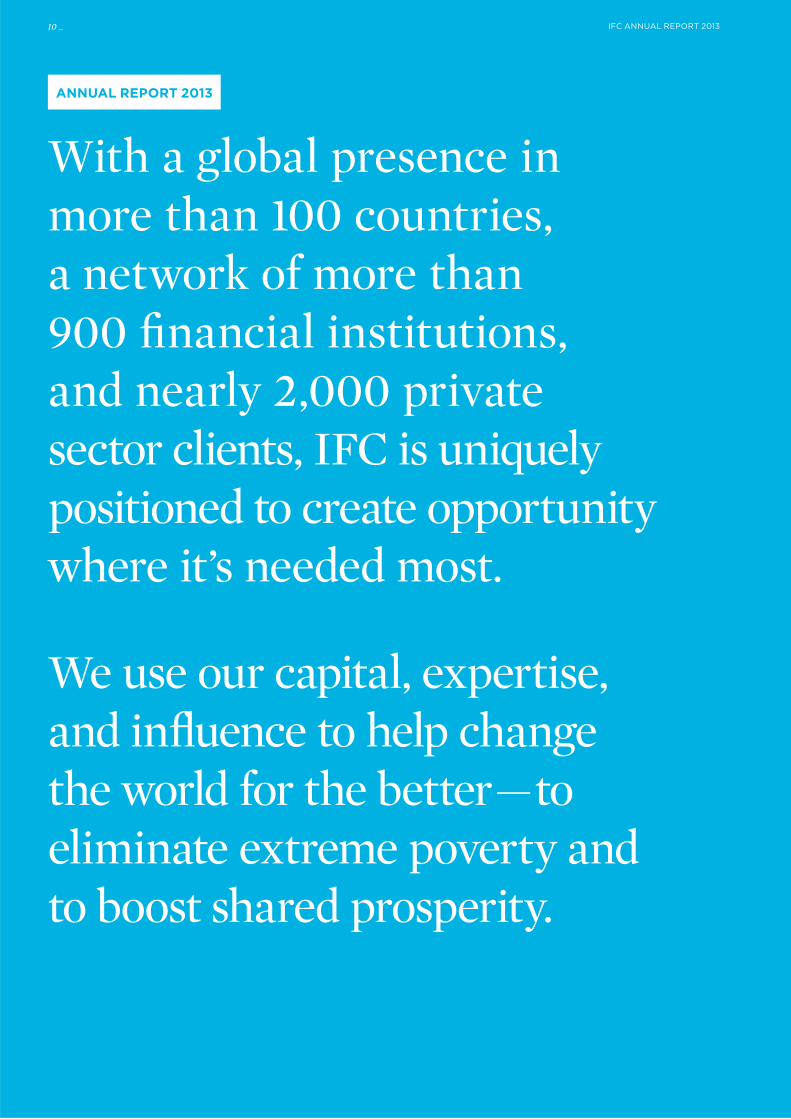
With a global presence inmore than 100 countries,a network of more than 900 fi nancial institutions, and nearly 2,000 privatesector clients, IFC is uniquely positioned to create opportunity where it’s needed most.
We use our capital, expertise, and infl uence to help change the world for the better�—� to eliminate extreme poverty and to boost shared prosperity.
ANNUAL REPORT 2013
10 _ IFC ANNUAL REPORT 2013

That’s the power of partnerships.
THE POWER OF PARTNERSHIPS _ 11

Partnerships take connectionsNo institution can solve the challenges of development on
its own. But IFC has a distinctive power to bring together
a variety of players to address the challenges collectively.
We work with our network of partners to craft innovative
solutions that make good things happen in diffi cult places.
12 _ IFC ANNUAL REPORT 2013

We can end extreme poverty in a generation and
boost shared prosperity.
_ 13THE POWER OF PARTNERSHIPS
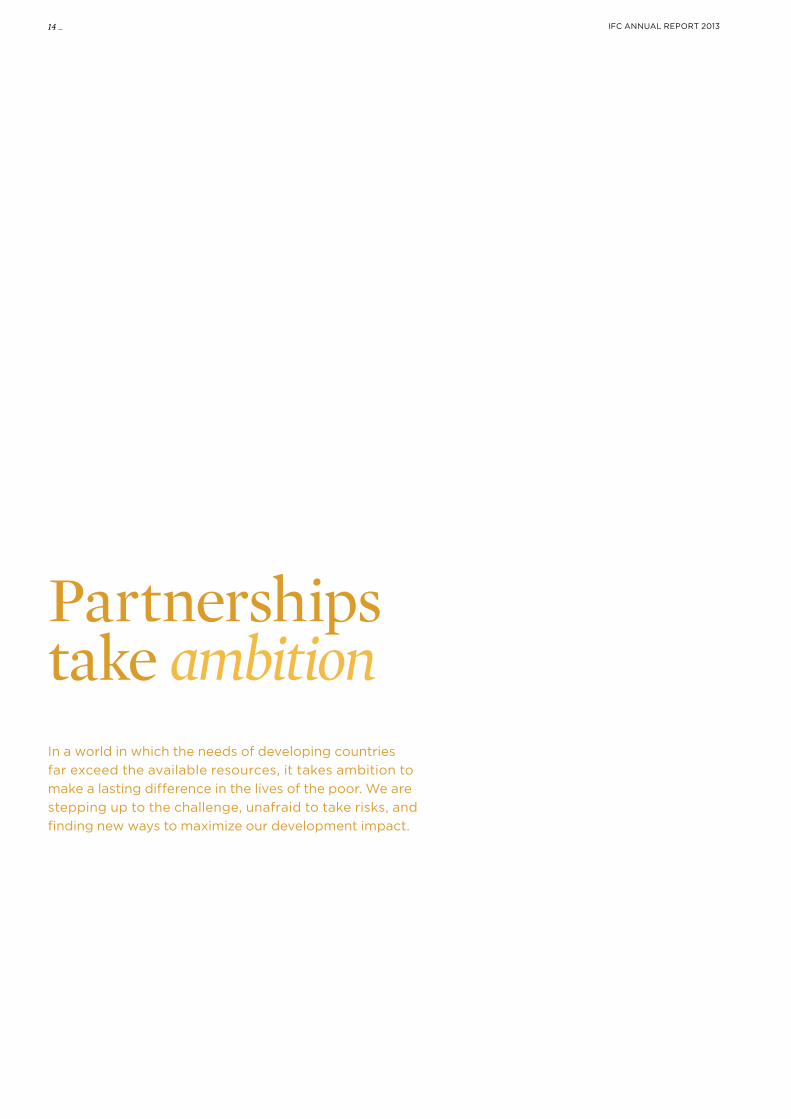
Partnerships take ambitionIn a world in which the needs of developing countries
far exceed the available resources, it takes ambition to
make a lasting difference in the lives of the poor. We are
stepping up to the challenge, unafraid to take risks, and
fi nding new ways to maximize our development impact.
14 _ IFC ANNUAL REPORT 2013
We can end extreme poverty in a generation and
boost shared prosperity.
_ 15THE POWER OF PARTNERSHIPS
Partnerships take focusOur clients hold the key to sustainable private sector
development in the poorest countries and regions of
the world. We use our distinctive combination of broad
global knowledge and deep local expertise to align
their needs with the opportunities for transformational
development in emerging markets.
16 _ IFC ANNUAL REPORT 2013

We can end extreme poverty in a generation and
boost shared prosperity.
_ 17THE POWER OF PARTNERSHIPS

In all our projects, we aim to do the things that no one else is able or inclined to. We seek to achieve maximum impact�—� profi tably and effi ciently, while ensuring we have the funds required to continue our growth.
18 _ IFC ANNUAL REPORT 2013
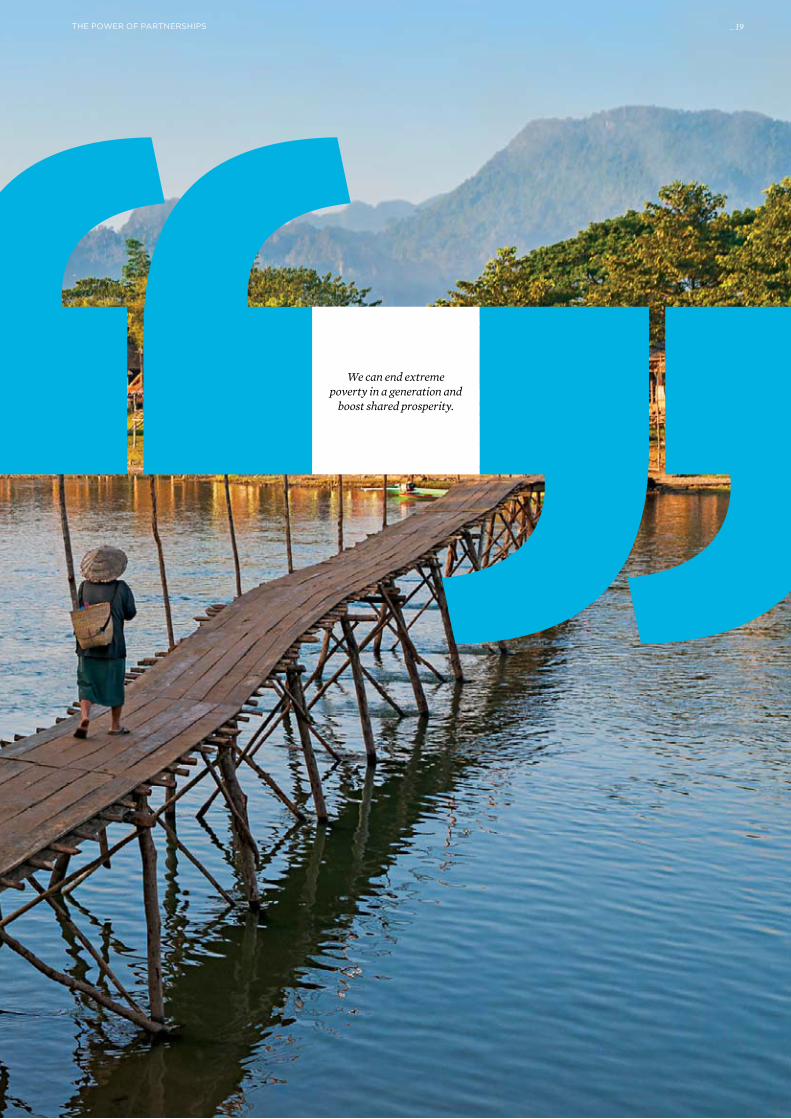
We can end extreme poverty in a generation and
boost shared prosperity.
THE POWER OF PARTNERSHIPS _ 19

20 _ IFC ANNUAL REPORT 2013

Partnerships canimprove livesOur work helps expand employment, improve health
and education, and broaden access to fi nance for
those who need it most. In 2012, our clients supported
2.7 million jobs, treated 17.2 million patients, and
expanded opportunities for more than 3 million farmers.
2.7million jobs were supported by IFC clients in 2012.
17.2million patients were treated by IFC clients.
3.1million farmers benefi ted from our work with clients.
_ 21THE POWER OF PARTNERSHIPS

22 _ IFC ANNUAL REPORT 2013
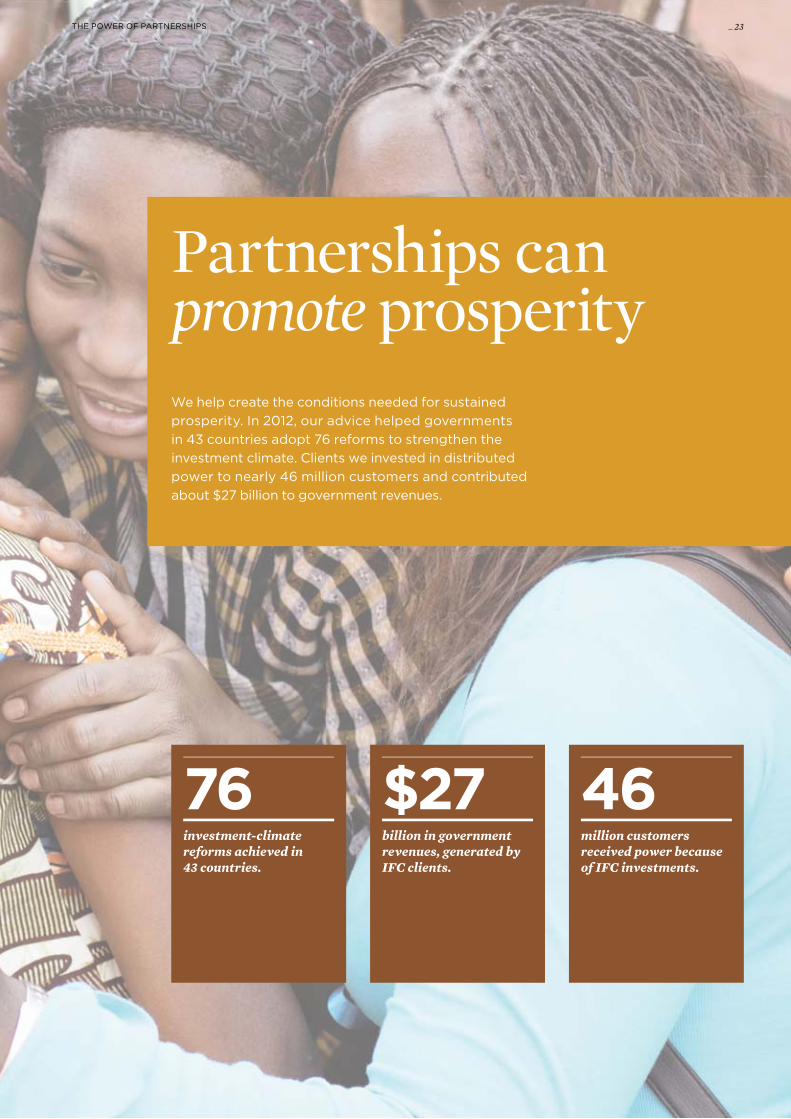
Partnerships canpromote prosperityWe help create the conditions needed for sustained
prosperity. In 2012, our advice helped governments
in 43 countries adopt 76 reforms to strengthen the
investment climate. Clients we invested in distributed
power to nearly 46 million customers and contributed
about $27 billion to government revenues.
$27billion in government revenues, generated by IFC clients.
46million customers received power because of IFC investments.
76investment-climate reforms achieved in 43 countries.
_ 23THE POWER OF PARTNERSHIPS

24 _ IFC ANNUAL REPORT 2013

Partnerships can transform the worldHarnessing the creativity of the private sector, we
can help end extreme poverty — within a generation.
We can help lift the incomes of the poorest 40 per-
cent of the population — in every developing country.
Achieving these goals would change the world.
THE POWER OF PARTNERSHIPS _ 25
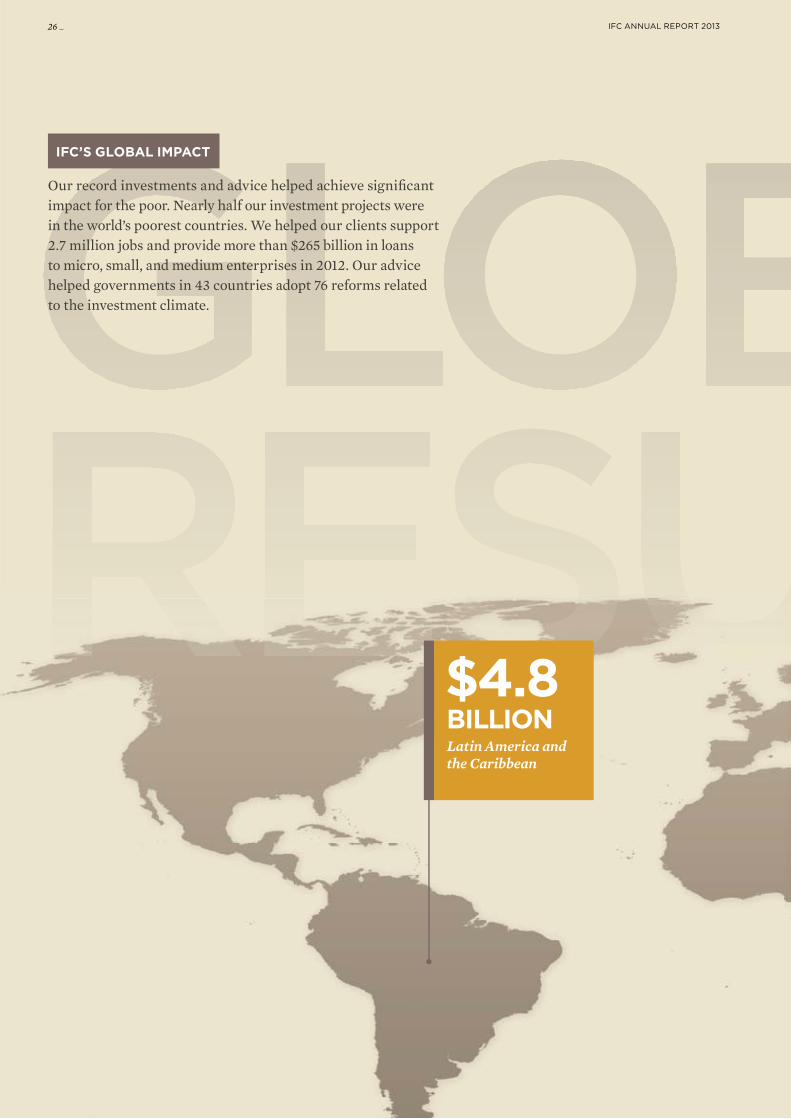
Our record investments and advice helped achieve signifi cant impact for the poor. Nearly half our investment projects were in the world’s poorest countries. We helped our clients support 2.7 million jobs and provide more than $265 billion in loans to micro, small, and medium enterprises in 2012. Our advice helped governments in 43 countries adopt 76 reforms related to the investment climate.
IFC’S GLOBAL IMPACT
$4.8BILLIONLatin America and the Caribbean
26 _ IFC ANNUAL REPORT 2013
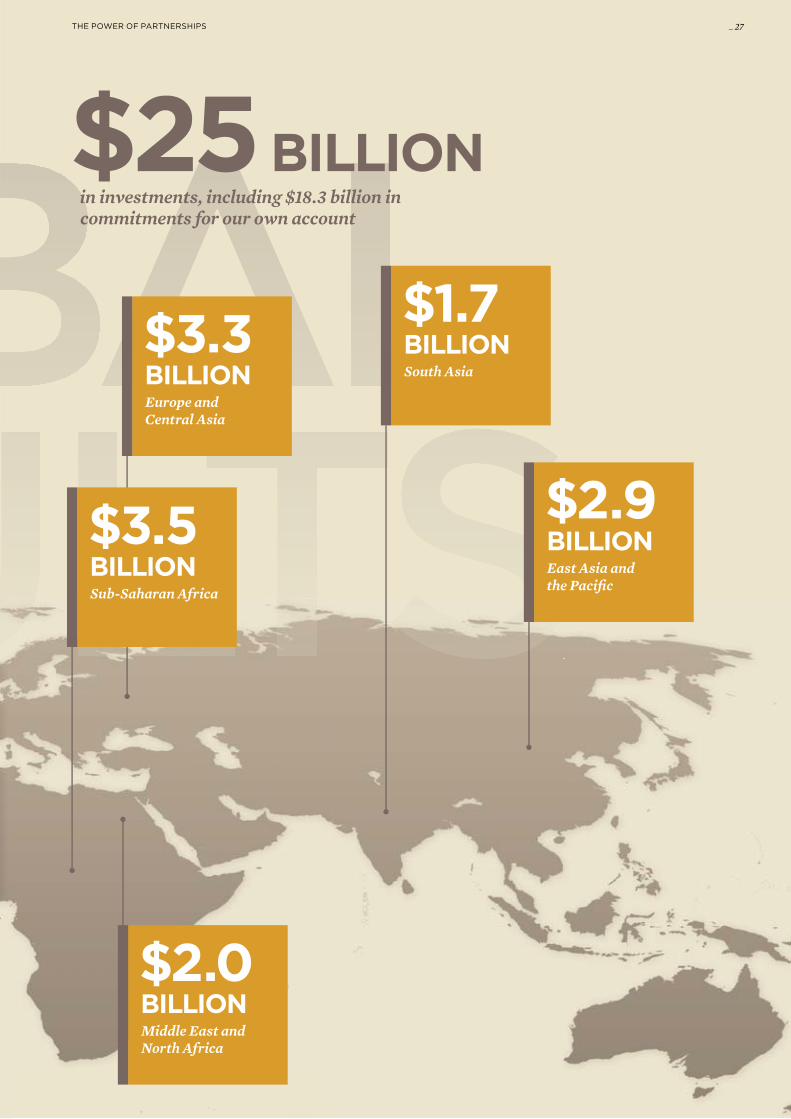
$25 BILLION in investments, including $18.3 billion in commitments for our own account
$3.3BILLIONEurope andCentral Asia
$1.7BILLIONSouth Asia
$3.5BILLIONSub-Saharan Africa
$2.9BILLIONEast Asia andthe Pacifi c
$2.0BILLIONMiddle East andNorth Africa
_ 27THE POWER OF PARTNERSHIPS

FY13 COMMITMENTS BY ENVIRONMENTAL AND SOCIAL CATEGORY
Commitments Number of Category ($ millions) Projects
A $884 17
B $5,490 167
C $6,764 269
FI $1,751 48
FI-1 $450 14
FI-2 $2,203 59
FI-3 $807 38
Total $18,349 612
IFC’S LARGEST COUNTRY EXPOSURES1
June 30, 2013 (Based on IFC’s Account)
Committed % of Country Portfolio Global(Global Rank) ($ millions) Portfolio
India (1) $4,453 9%
China (2) $3,002 6%
Turkey (3) $2,856 6%
Brazil (4) $2,690 5%
Russian Federation (5) $2,145 4%
Mexico (6) $1,584 3%
Nigeria (7) $1,334 3%
Egypt, Arab Republic of (8) $1,130 2%
Ukraine (9) $963 2%
Colombia (10) $947 2%
1. Excludes individual country shares of regional and global
projects.
FY13 COMMITMENTSDollar amounts in millions
Total $18,349 (100%)
BY INDUSTRY
Trade Finance $6,477 (35.3%)
Financial Markets $3,647 (19.9%)
Infrastructure $2,247 (12.2%)
Consumer & Social Services $1,635 (8.9%)
Manufacturing $1,314 (7.2%)
Agribusiness & Forestry $1,278 (7.0%)
Funds $890 (4.9%)
Telecommunications & Information Technology $472 (2.6%)
Oil, Gas & Mining $389 (2.1%)
BY REGION
Latin America and the Caribbean $4,822 (26.28%)
Sub-Saharan Africa $3,501 (19.08%)
Europe and Central Asia $3,261 (17.77%)
East Asia and the Pacific $2,873 (15.66%)
Middle East and North Africa $2,038 (11.11%)
South Asia $1,697 (9.25%)
Global $156 (0.85%)
Some amounts include regional shares of investments that are officially classified
as global projects.
BY PRODUCT
Loans1 $8,519 (46.43%)
Guarantees2 $6,959 (37.93%)
Equity3 $2,732 (14.89%)
Risk-management products $138 (0.75%)
1. Includes loan-type, quasi-equity products.
2. Includes trade finance.
3. Includes equity-type, quasi-equity products.
COMMITTED PORTFOLIOFor IFC’s own account as of June 30, 2013
Total $49,617 (100%)
BY INDUSTRY
Financial Markets $14,563 (29%)
Infrastructure $9,358 (19%)
Manufacturing $6,385 (13%)
Agribusiness & Forestry $4,251 (9%)
Consumer & Social Services $4,215 (8%)
Funds $3,733 (8%)
Trade Finance $3,081 (6%)
Oil, Gas & Mining $2,359 (5%)
Telecommunications & Information Technology $1,667 (3%)
Other $5 (0%)
BY REGION
Europe and Central Asia $10,994 (22%)
Latin America and the Caribbean $10,993 (22%)
Sub-Saharan Africa $7,833 (16%)
East Asia and the Pacific $7,726 (16%)
Middle East and North Africa $5,793 (12%)
South Asia $5,582 (11%)
Global $696 (1%)
Amounts include regional shares of investments that are officially classified as global projects.
28 _ IFC ANNUAL REPORT 2013

WEIGHTED AND UNWEIGHTED INVESTMENT SERVICES DOTS SCORES
FY11 582
$21,181
FY12 668
$26,610
FY13 716
$29,674
FY13 INVESTMENT SERVICES DOTS SCORE BY INDUSTRY
IFC Total 716 (29,674)
Funds 84 (1,199)
Infrastructure 101 (4,805)
Financial Markets 219 (11,813)
Agribusiness & Forestry 79 (3,215)
Oil, Gas & Mining 28 (2,200)
Consumer & Social Services 94 (2,045)
Telecommunications & Information Technology 31 (1,067)
Manufacturing 80 (3,329)
Numbers at the left end of each bar are the total number of companies rated.
Numbers in parentheses represent total IFC investment ($ millions) in those projects.
FY13 INVESTMENT SERVICES DOTS SCORE BY REGION
IFC Total 716 (29,674)
Latin America and the Caribbean 159 (8,007)
East Asia and the Pacific 98 (3,922)
Middle East and North Africa 80 (3,283)
Europe and Central Asia 168 (8,477)
Sub-Saharan Africa 121 (3,094)
South Asia 81 (2,707)
Numbers at the left end of each bar are the total number of companies rated.
Numbers in parentheses represent total IFC investment ($ millions) in those projects.
FY13 ADVISORY SERVICES PROGRAM EXPENDITURESDollar amounts in millions
Total 231.9 (100%)
BY REGION
Sub-Saharan Africa 65.4 (28%)
East Asia and the Pacific 38.5 (17%)
Europe and Central Asia 36.4 (16%)
South Asia 33.6 (14%)
Latin America and the Caribbean 25.5 (11%)
Middle East and North Africa 20.4 (9%)
Global 12.2 (5%)
BY BUSINESS LINE
Investment Climate 74.8 (32%)
Access to Finance 62.6 (27%)
Sustainable Business 55.0 (24%)
Public-Private Partnerships 39.5 (17%)
67%
76%
68%
75%
66%
FY11
FY12
FY13
73%
Unweighted Weighted
79%
73%
70%
68%
64%
56%
55%
49%
66%
74%
70%
65%
64%
61%
60%
66%
IFC’S CLIENT LEADERSHIP AWARDEvery year, IFC recognizes an organ-ization that refl ects our values and symbolizes our shared commitment to sustainable development. We present our Client Leadership Award to a corporate client that best demonstrates leadership, innovation, and operational excellence.
This year, the award went to Vegpro Group, a dynamic agribusiness company in Kenya. It has been an IFC client for nearly two decades.
Vegpro is engaged in a tricky market: supplying fresh food to supermarkets in the European Union. As shoppers demand high- quality, ready- to-eat vegetables, growers must assure year- round supply and quick delivery while complying with strict environmental and safety standards.
But the company’s creative approach has transformed it into Kenya’s largest vegetable producer, with an annual turnover of $100 million. All of the fresh produce it supplies to the retail market is certifi ed, which usually means higher income for suppliers�—� 4,000 of whom are small- scale farmers.
Vegpro is one of Kenya’s largest private employers, with 7,000 employees. About three- quarters of them are women�—� who enjoy starting wages that are almost 50 percent higher than the average daily minimum, in addition to benefi ts such as free primary healthcare and counseling.
Numbers at the left end of each bar for unweighted DOTS score are the total number of
companies rated. Numbers at the left end of each bar for weighted DOTS score represent
total IFC investment ($ millions) in those projects. FY11 and FY12 weighted scores have
been restated to reflect methodology changes (see page 82).
_ 29THE POWER OF PARTNERSHIPS