steam digest 2002 - nrel · steam digest 2002 compiled for the industrial technologies ... this is...
TRANSCRIPT

U.S. Department of EnergyEnergy Efficiency and Renewable Energy
STEAM DIGEST
2002Compiled for the
INDUSTRIAL TECHNOLOGIES PROGRAMBy the
ALLIANCE TO SAVE ENERGY
Bringing you a prosperous future where energy is clean,abundant, reliable, and affordable
A compendium of articles
on the technical and
financial benefits of steam
efficiency, presented
by stakeholders in the
U.S. Department of Energy’s
BestPractices Steam efforts.

AcknowledgementsThe Steam Digest 2002 is the third annual compilation of articles dedicated to steam system effi-ciency. The U.S. Department of Energy’s (DOE) Office of Energy Efficiency and Renewable Energysponsors the BestPractices Steam program, which either directly or indirectly facilitated the creationof all the articles contained in this volume.
Since its inception, the BestPractices Steam program has been led by Mr. Fred Hart of DOE.Dr. Anthony Wright continues to direct the evolution of the program’s technical content, notablyincluding the development of software such as the Steam System Scoping Tool and the SteamSystem Assessment Tool. Mr. Christopher Russell of the Alliance to Save Energy conducts out-reach on behalf of the program, making sure that program materials are properly distributedamong state energy programs, utilities, trade associations, industry media, and the Internet.Ms. Kristin Lohfeld continues in this capacity as of March 2003. Mr. Carlo LaPorta of Future-Tec covers too many tasks to mention, and now is duly recognized.
Mr. Fred Fendt of Rohm & Haas now serves as Chair of the BestPractices Steam Steering Commit-tee. Ms. Debbie Bloom of ONDEO-Nalco continues as Vice-Chair. These individuals participateon the BestPractices Steam Steering Committee:
Bob BessetteCouncil of Industrial Boiler OwnersVictor BogosianNational Board of Boiler andPressure Vessel InspectorsCharles CottrellNorth American Insulation Manufacturers AssociationBeverly FranceIndustrial InteractionsElodie Geoffroy-MichaelsTurbosteamRobert GriffinEnbridge Consumers GasGlen HahnSpirax SarcoBill HamanIowa Energy CenterTom HenryArmstrong Services, Inc.Walter JohnsonAssociation of Energy Engineers
Michele JonesNational Insulation AssociationSandra KhalilConsultantAnthony MartocciBethlehem SteelJim MooreTA EngineeringChristina MuddMaryland Energy AdministrationKelly PaffelPlant Evaluations & SupportMiriam PyeNew York State Energy Research & Development AuthorityDoug RileyMillennium ChemicalsMike SandersSunocoThomas ScheetzBASFJohn ToddYarway Corp.
We offer grateful recognition to each author for his or her contribution to this compendium. Specialthanks go to Ms. Sharon Sniffen of ORC Macro for assisting with the publication of this volume.


TABLE OF CONTENTS
INTRODUCTIONChristopher Russell, Alliance to Save EnergyFred Hart, U.S. Department of EnergyDr. Anthony L. Wright, Oak Ridge National Laboratory 3ENERGY EFFICIENCY AND INDUSTRIAL BOILER EFFICIENCY: AN INDUSTRY PERSPECTIVERobert Bessette, Council of Industrial Boiler Owners
Consideration of energy efficiency for industrial boilers, more often than not, is simplified and categorized to a one-size-fits-all approach. This article addresses the four factors most critical for assessing energy efficiency in the industrialpowerhouse supplying energy to make products for the benefit of customers in a highly competitive international mar-ketplace. 5
DECISION CLIMATE FOR STEAM EFFICIENCY: UPDATE DECEMBER 31, 2002Carlo La Porta, Future-Tec
The Performance Evaluation and Policy Subcommittee of the BestPractices Steam Steering Committee issues a periodiccompilation of data that the Energy Information Administration, U.S. Department of Energy, reports in its Short-TermEnergy Outlook. The author selected data relevant to industrial decision makers concerned with supply and price ofenergy purchased for industrial fuel. The ulterior purpose is to help frame decisions that will encourage more invest-ment to improve efficiency of industrial steam systems. 17
AN ANALYSIS OF STEAM PROCESS HEATER CONDENSATE DRAINAGE OPTIONSJames R. Risko, TLV Corporation
The production and reliability performance of steam process heaters can be significantly affected by the condensatedrainage design that is employed. The current variety of drainage options can be confusing to a system designer who isunaware of the reasons for each specific design. This paper provides us an understanding of the various types and whythey may be used. 23
COMBUSTION CONTROL STRATEGIES FOR SINGLE AND DUAL ELEMENT POWER BURNERS
David C. Farthing, Federal CorporationToday’s economic and environmental demands dictate that we get the greatest practical efficiencies from our plants. Theuse of more advanced automatic control systems for combustion control has proven to be an excellent example ofsystems and process automation success. 29
REDUCE FUEL COSTS - USE THE PROPER AIR-TO-FUEL RATIO IN BOILER COMBUSTIONChristopher Russell, Alliance to Save EnergyTony Tubiolo, Alliance to Save Energy
Opportunities for combustion improvement projects involve any or all of the following: boiler tune-ups, combustioncontrol repair, burner repair, and repairs to existing oxygen trim systems. With an average payback period of less thanhalf a year, optimizing steam system combustion is a proven and effective way to reduce operating costs. 37
INSULATION IMPROVES ECONOMIC RETURNS IN MANUFACTURING
Christopher Russell, Alliance to Save EnergyMechanical insulation plays a role in optimizing a plant’s valuable energy resources. Two tip sheets, part of a series ofBestPractices Steam tip sheets that currently numbers 19, discuss the benefits of mechanical insulation and demonstratethe calculation of energy savings that it provides. 35

SAFETY ISSUES IN FOSSIL UTILITY AND INDUSTRIAL STEAM SYSTEMSOtakar Jonas, Ph.D., P.E., Jonas, Inc.
The U.S. National Board of Boiler and Pressure Vessel Inspectors reports that 296 power plant boiler-related accidents(including 56 injuries and 7 deaths) occurred in 2001. This report presents results of recent surveys of safety issues infossil utility and industrial steam systems. 39
THE HUMAN SIDE OF ENERGY EFFICIENCY: THE VALUE OF TRAININGRachel Madan, Alliance to Save Energy
Many plant managers concentrate their efforts solely on technical improvements, ignoring the tremendous savings thatcan arise through low-risk, low-tech solutions such as training for proper maintenance and operation. 43
PRELIMINARY RESULTS FROM THE INDUSTRIAL STEAM MARKET ASSESSMENTGlenn P. McGrath, P.E., CEM, Resource DynamicsDr. Anthony L. Wright, Oak Ridge National Laboratory
This paper discusses fuel use and potential energy savings in the steam systems of three steam-intensive industries: pulpand paper, chemical manufacturing, and petroleum refining. The results indicate that to generate steam, the pulp andpaper industry used 2,221 trillion Btu, the chemical manufacturing industry used 1,548 trillion Btu, and the petroleumrefining industry use 1,676 trillion Btu. Preliminary results from the effort to determine potential steam system fuelsavings are discussed. 45
RESULTS FROM THE INDUSTRIAL ASSESSMENT CENTER (IAC) STEAM TOOL
BENCHMARKING SUPPORT PROJECTDr. Anthony L. Wright, Oak Ridge National LaboratoryDr. Kurt Bassett, South Dakota State UniversityDr. Herbert Eckerlin, North Carolina State UniversityDr. Ahmad Ganji, San Francisco State UniversityDerek Hengeveld, South Dakota State UniversityDr. Richard Jendrucko, University of Tennessee, KnoxvilleDr. Dragoljub Kosanovic, University of Massachusetts, AmherstDr. Wayne Turner, Oklahoma State University
The U.S. Department of Energy’s (DOE) Office of Industrial Technology (OIT) BestPractices effort is developing anumber of software tools to assist industrial energy users to improve the efficiency of their operations. One of thesoftware tools developed is the “Steam System Scoping Tool.” Based on actual plant assessment experience, several DOEIndustrial Assessment Centers (IACs) evaluate the Steam System Scoping Tool in this paper. 53
PROSTEAM - A STRUCTURED APPROACH TO STEAM SYSTEM IMPROVEMENTAlan Eastwood, Linnhoff March Ltd.
A spreadsheet-based steam cost model gives plant managers a clear and reliable understanding of their system and of anyoperational constraints. Models allow managers to identify and prioritize improvement opportunties before capital andother scarce resources are committed. ProSteam is one such analytical tool. 59
STEAM SYSTEM IMPROVEMENTS AT DUPONT AUTOMOTIVE MARSHALL LABORATORYAndrew Larkin, P.E., C.E.M., Trigen-Philadelphia Energy Corporation
Modifications to increase energy efficiency, reduce steam system maintenance costs, and implement small scale cogen-eration are all cited in a Trigen-Philadelphia Energy Corporation recommendation for a campus composed of severalbuildings that are served by a district stream loop. 69

CLOSED-LOOP ENERGY MANAGEMENT CONTROL OF LARGE INDUSTRIAL FACILITIESRonald L. Childress, Jr., Automation Applications, Inc.
This is a case study of a closed-loop control system installed and running at a pulp and paper facility in the southeast. Afuzzy logic, rule-based control system optimally loads multiple steam turbines for maximum electrical generation, whileproviding steam to the process. A Sell Advisor calculates Make-Buy decisions based on real-time electrical prices, fuelprices, and boiler loads. 75
AN INTRODUCTION TO STEAM OUTSOURCINGTom Henry, Armstrong Service Inc.
One evolving trend in the boiler replacement business is the movement to outsource the equipment, installation, andoperation and maintenance--called the build, own, operate, and maintain (BOOM) market. Energy service companies(ESCOs) and lending institutions are developing services that respond to this emerging need. 85


Steam Digest 2002
3
IntroductionChristopher Russell, Alliance to Save EnergyFred Hart, U.S. Department of EnergyDr. Anthony L. Wright, Oak Ridge National Laboratory
Why steam?
Steam—or more specifically the heat that steamprovides—played a role in the production of vir-tually everything in the room around you. Thatincludes the paper and ink in this document. Ittempered the adhesives and fibers in wood-prod-uct desks and cabinets. Steam helped to manu-facture your chair: plastics in the handles, foamcushioning in the seat, and the fabric covering aswell as the pigments that color each of those items.Nuts, bolts, screws, and other metal fixtures werepre-heated with steam so that corrosion-retardingchemicals could be applied to them. The wallsthat surround you are probably made of eithersheetrock or paneling, both of which were pressedfrom a steam-heated slurry of raw materials. Paintson your walls, pencils, and filing cabinets includepolymers with a molecular structure that couldonly be assembled by high-temperature chemicalreactions (again, facilitated by steam). The elec-tric light by which you read was almost certainlyproduced by a steam turbine, fired by coal, natu-ral gas, oil, or nuclear energy. And that bag ofpotato chips? The potatoes were “peeled” in alarge, pressurized vat that accepted steam injec-tion for 62 seconds, at which point the pressurewas removed and the liquid content of the pota-toes literally blew the skin off, leaving the potatowhole.
That was only a short list of steam products.
Steam use in manufacturing can, and should, bepart of any attempt by policy makers to addressresource conservation, industrial competitiveness,energy market structure, and climate change. Thefollowing are facts that will substantiate1 :
Thirty-five percent of all fuel consumed byindustry for energy purposes is devoted to rais-ing steam.Fuels consumed by steam systems (industrial,commercial and institutional) are roughly ninequadrillion Btu, or about one tenth of nationalprimary fuel demand for everything, includ-ing transportation.
A one percent improvement in industrialenergy efficiency—which is technically easyto accomplish—would return to energymarkets a volume of fuel sufficient to satisfythe non-transportation energy needs of 3.2million households.
BestPractices Steam is a U.S. DOE program thatpromotes steam efficiency. The program does notregulate or compel action on anyone’s part. In-stead, it simply identifies, documents, and com-municates best-in-class steam management tech-nologies and practices. These findings are madefreely available in a series of reference documents,tip sheets, case studies, diagnostic software, andmore—either printed or available for Internetdownload.
The articles in Steam Digest 2002 represent a vari-ety of operational, design, marketing, and programassessment observations. Readers are encouragedto also consult the 2000 and 2001 editions foradditional reference. Please contact:
U.S. DOE Office of Energy Efficiency &Renewable Energy Resource Room:(202) 586-2090;EERE Clearinghouse:[email protected](800) 862-2086;http://www.oit.doe.gov/bestpractices/steam; orhttp://www.steamingahead.org.
1 All data from U.S. DOE Energy Information Administra-
tion


Steam Digest 2002Energy Efficiency and Industrial Boiler Efficiency: An Industry Perspective
5
Energy Efficiency andIndustrial Boiler Efficiency:An Industry PerspectiveRobert Bessette, Council of Industrial Boiler Owners
Energy efficiency for industrial boilers is a highlyboiler-specific characteristic. No two boilers arealike. There are two identically designed, con-structed side by side, stoker fired boilers in Indi-ana burning the same fuel that have very differentperformance characteristics. Like twin teenagers,they are not the same. Consideration of energyefficiency for industrial boilers, more often thannot, is simplified and categorized to a one-size-fits-all approach. Just as when considering teen-agers, this does not work. While parents wouldlike to believe their teenager is gifted and talentedand in the 80th percentile of the population, weknow that is not necessarily the case. We alsoknow, as for boilers, the average teenager is notrepresentative of a widely diversified population.If you think it is, ask any parent with teenagers oran industrial boiler operator. While the variablesassociated with energy efficiency are more limitedthan those associated with a teenager, they are inno way any less complicated.
Four factors are critical for assessing energy effi-ciency in the industrial powerhouse supplying en-ergy to make products for the benefit of custom-ers in a highly competitive international market-place. These are:
1. fuel type,2. combustion system limitations,3. equipment design, and4. steam system operation requirements.
Furthermore, the industrial facility’s complexity,location, and objective complicate them. It isimportant for the industrial company to remem-ber, unlike the utility, that energy is a smaller por-tion of the final product price. However, withoutenergy there is no final product or service. Need-less to say, without products or services there is noneed for people to do the work.
This white paper will address the efficiency-relatedaspects of the four primary factors affecting theindustrial boiler and the factors affecting applica-tion of combined heat and power systems to in-dustrial facilities. A copy of the Background Paper
on the Differences Between Industrial and UtilityBoilers is included as an appendix to help un-derstand the diversity of the industrial boilerpopulation. From the EPA Boiler MACT Da-tabase, there are about 22,000 industrial-com-mercial and institutional boilers with greaterthan ten million Btus per hour heat input.
NEW VS. EXISTING UNITS
Before investigating specifics of industrial boilerefficiency considerations, it is important to un-derstand that once a boiler is designed, con-structed, and installed, it can be difficult and costlyto improve its efficiency above the design. Onthe other hand, as will be discussed below, changesin fuel, load, and operation can easily impact over-all efficiency. Because of the high cost of the en-ergy plant, boilers and associated systems usuallyare purchased for the life of a facility with amplemargin for future growth and process variability.With proper maintenance, boiler life is indefinite.In most cases, it will outlive the process it origi-nally was designed for but not the facility. Forexample, a facility that was producing eight tracktapes changed to produce cassette tapes and is nowproducing CDs and DVDs. The boiler will stillbe there meeting new demands.
With today’s technologies it is possible to designboilers to handle a wide range of requirements andpossibilities. However, in most cases this is eco-nomically impossible if a process is to survive in acompetitive world. It could be like building a newhome with a heat pump and a furnace capable ofburning natural gas and a furnace capable of burn-ing oil to cover the heating, air conditioning, hotwater, and other household needs. The cost of allof this equipment would break the budget. It isevident that an average person probably could af-ford only one of these devices. If the person triedto buy all three, they would not be able to affordthe house.
New units are purchased with a guaranteed effi-ciency at a Maximum Continuous Rating (MCR)for a specific design fuel producing a specifiedquantity of steam or hot water at a specified tem-perature and pressure. Any changes in these char-acteristics change the operating efficiency. A guar-antee over a wider range of fuel, capacity, and tem-perature and pressure is technically possible. How-ever, as mentioned, it may not be economicallyjustifiable for a given facility. In the end, a newunit may be defined only as one that is designed,

Steam Digest 2002Energy Efficiency and Industrial Boiler Efficiency: An Industry Perspective
6
purchased and installed, but never run at theguarantee conditions other than to pass accep-tance tests. In the real world almost nothingoperates at the design specifications.
ANNUAL AVERAGE VS. MCR DESIGN
If you start from cold water have you ever watchedhow long it takes to get it boiling? I believe it wasBen Franklin who said, “A watched pot neverboils.” It does, but it takes the addition of 1,000Btu per pound of water before it does. After that,considering losses from the teapot or boiler, Btufor Btu, is converted to steam where you use it orlose it. In systems that have a heavy cyclic load,the operator can either start up or shut down theboiler as needed (for a period lasting 2 to 5 hourseach way) without the loss of much of the initialenergy. However, for periods longer than this,much if not all of the initial 1,000 Btus are lost.On the other hand, the operator can keep it atpressure to ensure rapid response by supplyingenough heat to compensate for losses in the sys-tem. Here, efficiency is zero, but the initial 1,000Btus are maintained. In both cases there is in-creased energy loss and the inability to meet ormaintain MCR efficiency. In facilities like a col-lege campus, with a heating load, where heat isneeded every morning so the students will havewarm classes to go to, hot showers to wake upwith, and hot food in the cafeteria serving lines, itis better to keep the boiler hot, lose the efficiency,and keep the students, their professors and theirparents happy. In a large hospital performingmany major surgeries per day using autoclaves tosterilize surgical instruments, should a system bedesigned to handle the maximum number of sur-geries expected or a smaller number thus limitingthe number of people that can be helped in anyone day? Obviously, the system must be designedto meet the maximum capacity of the hospital.Here it is impossible to deliver both MCR effi-ciency conditions and optimum patient service.There also are losses associated with low load op-eration that will be discussed in greater detail un-der the Systems Operation section below.
Each facility’s needs will be different. Steam loadrequirements will change for different facilities.Departures from MCR conditions will vary widelydepending upon facility process needs. Subse-quently, the annual average efficiency, and forsome, the hourly average efficiency will be less thanthe MCR efficiency of the design. Differences
between actual efficiency, an annual average, andMCR can be as much as 40 percent or moredepending upon the facility. Any considerationof industrial boiler efficiency must consider dif-ferences between real, actual, and design effi-ciencies.
The ability of a particular process to use steamefficiently complicates this factor. With steam af-ter it is produced you use it or loose it. Inefficien-cies inherent for various process factors can be asimportant as the inefficiencies associated with theboiler.
FUEL TYPE
Mother Nature is miraculous. Naturally occur-ring fuel (gas, oil, wood, coal and biomass) is vari-able. The plants, animals, bugs and other crittersthat formed the fuel underwent tremendouschange at different locations and over differenttime periods. Elemental compositions of fuel[moisture (H
2O), carbon (C), hydrogen (H), ni-
trogen (N), chlorine (Cl), sulfur (S), oxygen (O)and ash] can vary as much as 30 percent or morefrom an annual average basis depending upon theirinherent composition and degree of fuel refiningor preparation. Any variations in fuel composi-tion from the original design of the system willdirectly affect boiler efficiency. In most cases withboiler design these days, variations of less than oneor two percent from the design fuel compositionwill have virtually no perceptible impact on effi-ciency. For this discussion, the Btu per pound,gallon, or cubic foot of the coal, oil, or gas respec-tively may be a better, however over simplified,way of looking at it.
Even natural gas can vary between 900 and 1,100Btu/cu. ft. depending upon the methane content.Over the years technology has allowed gas com-panies to blend gas and control its Btu and com-position to a level of around 1,000 Btu/cu. ft. (+or – one or two percent) on an annual averageand hourly average basis. This, along with itsdeliverability, ignitability and controllability is agood reason why natural gas is used as a primaryfuel for home heating, hospitals and commercialinstallations. The very high hydrogen content(high hydrogen to carbon ratio) of natural gas thatburns to form water removes a significant amountof heat from the process and can seriously impactthe overall efficiency of the boiler as comparedwith other fuels.

Steam Digest 2002Energy Efficiency and Industrial Boiler Efficiency: An Industry Perspective
7
Crude oil is refined to remove the highly valu-able portion for industrial feedstocks for plas-tics and other products, for gasoline, aviationfuel and diesel fuel for transportation, and forhome heating oil with very low variability. Thevariability of each of these premium productscan be equal to or better than that of naturalgas. Industrial fuel products are the leftoversfrom refining and can have increasing variabil-ity as the quality goes from a No. 2 oil to a No.6 or high asphaltene Bunker C grade oil or roadgrade asphalt or petroleum coke. In such cases,variation in viscosity (burning something like“black strap molasses” or hot maple syrup forthe liquids – coke is a solid more like coal) canhave a serious impact on combustion efficiencyand overall boiler efficiency. Variation in fuelcharacteristics on an hourly average basis maybe better or equal to that of natural gas. How-ever, variations in fuel characteristics betweenshipments over the year may increase the an-nual average variation to somewhere in the rangeof five percent. Because oil has a lower hydro-gen content (decreasing with increasing grade)than natural gas, the overall boiler efficiency as-sociated with burning fuel oils usually is higherboth at MCR and annual average. Oils are verygood boiler fuels.
Coal, our most abundant fuel, can be mined withnew technologies and coal preparation plants toremove rock (contaminants) captured in the pro-cess to a plus or minus 10 percent natural vari-ability within a given seam. However, differentcoal seams vary tremendously from lignite at 4,000Btu per pound with seven percent hydrogen and35 percent moisture to anthracite with 14,000 Btuper pound with two percent hydrogen and threepercent moisture. With low hydrogen contents(low hydrogen to carbon ratio), coal is the mostefficient energy source for conversion of Btus intousable energy.
Blends of various coal seams and the inability toremove contaminants, if there is no preparationplant, can lead to fuel quality variations of 10 per-cent or more on an hourly basis and 20 to 30 per-cent on an annual basis. Coal fired systems nor-mally are designed to handle up to a plus or mi-nus 10 percent variability without visible degra-dation of performance. Because of the diversityof coal types, locations, and characteristics, dif-ferent types of combustion systems are used toburn fuel and generate energy. The following sec-tions will look at this aspect in more detail.
Wood and biomass are solid fuels with both highhydrogen to carbon and high moisture content(greater than 40 percent). Because of energyloss due to moisture from the combustion ofhydrogen and conversion of moisture to vapor(1,000 Btu per pound), it is very difficult toobtain efficiencies, either MCR or annual aver-age, equal to or approaching those of naturalgas, never mind oil or coal. A very good annualaverage efficiency for a wood or biomass unitmay be in the 60 percent range. While fuelproperty variations may be better than coal, thesevariations usually occur in the moisture contentwith a direct and major impact on boiler effi-ciency.
Fuel characteristics determine the design of a par-ticular unit. Fuel changes, especially in hydrogenand moisture content outside the range of one ortwo percent for natural gas, three to five percentfor oil and 10 percent for coal and other solidfuels, will have an impact on efficiency, both MCRand annual average. When fuels are switched, theinteraction of the new fuel and the boiler oftenproduces negative impacts on either the load orthe boiler efficiency. These effects often are am-plified because of limitations encountered in spe-cific areas of the boiler where these adverse inter-actions occur. A good analogy would be a truckthat comes onto a superhighway that has bridgeclearances more suitable for cars. When the truckapproaches a bridge, it has to slow down to en-sure that it can pass under a place where the clear-ance is adequate. This causes traffic to move slowerbecause the highway was not designed with thetruck in mind.
COMBUSTION SYSTEMS
Efficient fuel burning (combustion) requires at-tention to the entire combustion apparatus. Be-cause some problem areas are common to all typesof combustion systems, those areas will be dis-cussed before reviewing specific system problems.
Good combustion is the ability to mix air and fuel,with as little excess air as possible, at a high enoughtemperature to sustain the process and completelyburn the fuel (complete carbon conversion) withminimum environmental emissions. Good com-bustion also includes the ability to generate maxi-mum usable energy consistent with process needs,safety, and economics. This is a complex processof matching fuel combustion characteristics, ig-nition, including pyrolysis, and char burn outfor heavy liquid and solid fuels, with the time,

Steam Digest 2002Energy Efficiency and Industrial Boiler Efficiency: An Industry Perspective
8
temperature and turbulence available from thefurnace absorption profile and combustion sys-tem capabilities design. All this has to be ac-complished with the safety of operators and fa-cility personnel in mind.
Each year, the news media inform us of boiler ex-plosions that kill people – be it a steam tractor ata county fair or an industrial or utility powerhousein the center of a city. A typical 100,000 poundsper hour steam boiler requires about 125 millionBtus (MMBtu) of fuel input each hour. That isequivalent to approximately 1,100 gallons of gaso-line, 125,000 cu. ft. of natural gas, and a littlemore than 900 gallons of kerosene. What we haveis a controlled explosion where we take energy outand use it for beneficial purposes. There can beproblems with this. Safety must always be ournumber one priority.
Combustion systems, while they may seem simple,are very complex. Included in Appendix B isChapter 3, “Combustion,” of the CIBO EnergyEfficiency Handbook. Here additional details ofday to day concerns for optimizing and maintain-ing combustion efficiency are presented.
EQUIPMENT DESIGN
Industrial boiler equipment is as varied as the prod-ucts and processes it serves. A better understand-ing of this is given in Appendix A, “DifferencesBetween Industrial and Utility Boilers.” Boilersare one means of extracting energy from controlledfuel combustion. There are watertube, firetube,field-erected, and packaged shop-assembled unitsfrom very small to very large. The concept issimple, like a teapot. Boil water to make steam.However, the actual process is complex. Turning100,000 pounds of water (that’s 12,500 gallons,1,250 fish tanks or a swimming pool) to steameach hour brings with it many complications.
It is impossible to capture each and every Btu fromcombustion in the boiler. For example, some getaway to the atmosphere. Industry has devised waysto capture most of the Btu’s economically. As anold farmer might say, they capture everything butthe squeal. Of course, today it could be possibleto capture that on a CD if it had a use. It is notdone and probably will not be done because itwould cost more to buy a CD recorder and takemore energy to run the CD recorder than the valueof the squeal. The same thing happens withenergy. Some of it gets away and that varieswith the boiler, the fuel, and the plant require-ments. If it can be used cost effectively, it is.
A discussion of some of these losses is includedin Appendix C, Chapter 4: “Boilers” of the CIBOEnergy Efficiency Handbook.
SYSTEM OPERATIONS
The ideal situation would be to be able to operatethe boiler or energy device at the design MCR. Ifeverything were perfect, one could design a unitthat would have a relatively flat efficiency curveacross the load range. A tangentially fired boilerwith tilting burners could adjust tilts to achievethe same exit gas temperature with the same levelof excess air and the same combustion efficiencyat all operating loads (the three main determi-nants of boiler efficiency). However, this typeunit is used primarily in the utility industry onlarger boilers.
CIBO’s Energy Efficiency Handbook points out(at the bottom left of page 26 in Chapter 5, “Con-trols” under Oxygen Loop), that most burners re-quire more excess air at low loads than at highbecause there is less effective fuel to air mixing. This is due to mixing characteristics of flowstreams and the fact that less total reacting gas isnow filling the furnace volume. Air infiltrationaggravates this condition because infiltrated airdoes not mix with the fuel at all. These factorscause mixing problems and also lower the bulkflame temperature, which, in turn, slows downcombustion reactions. As a result, the higher ex-cess air at lower loads causes a decrease in boilerefficiency due to the additional air that must bewarmed up to stack temperature and exhaustedto the atmosphere. For natural gas firing, thisimpact is not too bad. An estimate of a five per-cent efficiency drop from full load to 25 percentload probably is reasonable for a modern, tight,package boiler with full combustion controls. Onthe other hand, an old stoker with no air controlsleaves the airflow fixed and drops load by reduc-ing fuel input. In such cases there could be morethan 200 percent excess air at low loads causingboiler efficiency to drop from about 85 percent athigh load to around 60 percent at low load.
The problem with generalizations is that there areso many factors including fuel type, as-receivedcondition of the fuel, boiler type, control system,amount of air leakage, maintenance status of theunit, and more. Larger units tend to suffer lessthan smaller units because they have multipleburner sets that can be turned off completely atlow loads leaving remaining burners to run as ifthey were at full load. Also, larger units tend

Steam Digest 2002Energy Efficiency and Industrial Boiler Efficiency: An Industry Perspective
9
to be newer and have better control systems toadjust the operation thus reducing losses in ef-ficiency associated with lower loads.
At the risk of oversimplifying the problem, ifwe assume a relatively new unit, firing coal, oil,or gas we can use the following ranges:
It is sufficient to say that under normal opera-tion, efficiency is lower than guaranteed effi-ciency of the new unit operating at MCR. How-ever, for comparative reasons, design modifica-tions or operational and fuel changes that im-pact MCR efficiency should have a proportionalimpact on actual efficiency the facility is achiev-ing on an annual average basis.
COMBINED HEAT AND POWER
Ideally, energy is used most efficiently when fuelis combusted at a high temperature and high tem-perature Btus are converted to electricity or me-chanical energy in a gas turbine, internal combus-tion engine, or back pressure steam turbine fol-lowed by the use of the lower temperature Btus tomeet process needs through heat transfer.
Electricity, mechanical energy, and heat are dif-ferent forms of energy. Scientists have shown thatdifferent forms of energy have different qualitiesbased upon the ability to perform useful work.Scientists tell us that electricity and mechanicalenergy produce work more effectively than heatenergy. In other words, a Btu worth of electricalor mechanical energy has more value than a Btuworth of heat energy (similar to money where aU.S. dollar is worth more than a Canadian dol-lar). Furthermore, a higher temperature Btu hasmore value than a lower temperature Btu becauseit can be converted more efficiently into more valu-able electrical and mechanical energy. However,both electrical and mechanical energy must be pro-duced from some other energy source.
Starting with fuels, industry accomplishes con-version by burning the fuel and releasing heat.An engine then converts heat energy into me-chanical or electrical energy. If combustion oc-
curs inside an engine, it converts heat energy tomechanical energy that can be used to drive apump, fan, compressor, or electrical generator.Exhaust leaving the engine is hot. This exhaustcontains over half of the Btus released duringinitial combustion of the fuel and it can exceed1,000 oF. If none of the exhaust heat is used,the device is known as a simple cycle. If heat isrecovered from the exhaust for the additionalutilization, the combination of the engine andother devices is known as a cogeneration systemor a combined cycle system.
Efficiencies for simple cycles vary dependingupon the design, size, and location of the en-gine (gas turbine, internal combustion engine).This also translates into a range of efficienciesfor combined cycles. As with boiler efficienciesone size does not fit all. Example efficiencies forconversion to electricity in simple and combinedcycles are as follows:
An examination of the electricity generation ef-ficiency table shows that when electricity is theonly product, maximum Btus recovered areabout 40 percent for simple cycles and 54 per-cent for combined cycles. The increased effi-ciency for the combined cycle shows that onlyabout 25 percent of the exhaust heat can be con-verted to electricity with modern technology.The difference between 40 percent conversionfor the simple cycle and 25 percent additionalconversion illustrates the difference in value be-tween low temperature heat and high tempera-ture heat.
The concept of combined heat and power pro-vides further efficiency improvements over pro-ducing only electricity using exhaust heat di-rectly in the manufacturing process. Manymanufacturing processes require heat at tempera-tures between 250oF and 700oF. The Btus pro-
laoC %58-ycneiciffedaollluF %57-ycneiciffedaolwoL
liO %08-ycneiciffedaollluF %27-ycneiciffedaolwoL
saG %57-ycneiciffedaollluF %07-ycneiciffedaolwoL
ssamoiB %07-ycneiciffedaollluF %06-ycneiciffedaolwoL
Table 1: Typical Efficiency For New Boilers
seicneiciffEnoitareneGcirtcelElacipyT
elcyCelpmiSsnoitacilppA
egnaRwoL egnaRhgiH
senibruTsaG VHHteN%52 VHHteN%83tuobA
senignEECI VHHteN%02 VHHteN%14
/srelioBlaoCsenibruTmaetS
VHHteN%52 VHHteN%04tuobA
/srelioBdooWsenibruTmaetS
VHHteN%51 VHHteN%52
elcyCdenibmoCnoitacilppA
/senibruTsaGenibruTmaetSGSRH
VHHteN%04 VHHteN%75
HHV = 1

Steam Digest 2002Energy Efficiency and Industrial Boiler Efficiency: An Industry Perspective
10
vided by the exhaust from the above applica-tions are at temperatures that match these tem-perature requirements well. Hence, by convert-ing high temperature, high quality Btus to me-chanical or electrical energy and taking the lowertemperature, lower quality Btus to meet pro-cess temperature needs, the energy in fuel canbe used most effectively and efficiently. Withthis combination, from 60 percent to 85 per-cent of the Btus in the fuel can be recovered andused effectively.
After comparing these efficiencies with boiler ef-ficiencies listed in Table 1, on the surface nothingseems to have been gained. However, the gaincomes when one considers that for electricity gen-erated at a central plant or for mechanical energyto run a compressor, fan, or pump, from 60 per-cent to 75 percent of the Btus are lost. Under aconventional system, a boiler or other combus-tion device is still required to provide heat for thefacility or manufacturing process. For those thatmay want a more technical discussion of combinedheat and power and efficiency, the followingshould help provide additional insight.
COMBINED HEAT AND POWER EFFICIENCY
The most common expression of efficiency is acomparison of the desired output of a process tothe input. Electrical power generation efficiencyis a relatively simple concept because electricalpower is the only desired output and fuel energyis the only input.
Equation 1:
Efficiency = electrical generation
= Electrical Power Produced / Fuel Energy Input =Energy Desired / Purchased Energy
A very common type of electrical generation sys-tem consists of a boiler and a steam turbine ar-rangement. In this arrangement the boiler servesto input fuel energy into water to produce steam.The steam exits the boiler with a very high energycontent. As an example, the boiler may add 1,450Btu of fuel energy to every pound of water pass-ing through the component. The steam turbineserves to convert this thermal steam energy intomechanical or shaft energy. The turbine is veryeffective at this conversion process; in fact, nearly100 percent of the steam energy extracted by theturbine is converted into shaft energy. However,this excellent efficiency only applies to the ther-mal energy extracted by the turbine. The turbine
actually leaves the vast majority of thermal en-ergy in the exhaust steam. As an example, a steamturbine may extract 450 Btus of thermal energyfor every pound of steam passing through theturbine. This energy is readily converted intoelectrical energy with excellent efficiency, nearly100 percent. However, recall the boiler input1,450 Btus of thermal energy into every poundof steam. Therefore, 1,000 Btus remain in eachpound of steam exiting the turbine. This steamexiting the turbine is not useful to the powergeneration system and is discarded from the sys-tem. The steam energy is discarded by coolingor condensing the steam. This gives rise to thedescription of this system as a “condensing tur-bine” system. The desired output of this sys-tem is the 450 Btus of electrical energy and theinput is the fuel-input energy (1,450 Btus offuel energy). The efficiency of this system wouldbe as follows.
Equation 2:
electrical generation = 450 Btu / 1,450 Btu = 31%
Industrial systems utilizing combined heat andpower arrangements have a need for the thermalenergy discharged from the turbine. This providesthe basis for the advantage of combining heat andpower generation systems. If the 1,000 Btus inevery pound of steam can be used in a productivemanner the fuel utilization efficiency can dramati-cally increase. In a combined heat and power sys-tem there are two desired products, electricity andthermal energy. The fuel utilization efficiencyequation will take the following form.
Equation 3:
CHP = Electrical Power Produced +
Useful Thermal Energy / Fuel Energy Input
In theory, this efficiency could reach 100 percent,in reality, inefficiencies result in maximum effi-ciencies approaching 70 percent. Note that thisefficiency considers thermal energy equal in valueto power. This may not be the case because poweris normally more valuable (easily usable) than ther-mal energy, but thermal energy is valuable. Somecommon examples where steam could be morevaluable than electricity are sterilizing hospital in-struments, making paper and steam tracing chemi-cal lines. Other mechanisms are utilized to pro-duce electrical power; however, current conven-tional mechanisms consuming fuel (combustionturbines and reciprocating internal combustionengines) result in very similar arrangements.

Steam Digest 2002Energy Efficiency and Industrial Boiler Efficiency: An Industry Perspective
11
Condensing steam turbines with the ability tocondense unneeded steam are often incorporatedinto industrial combined heat and power sys-tems to allow the system to be balanced. In otherwords, if the demand for thermal energy dimin-ishes and the demand for electrical energy in-creases, steam can be passed through a condens-ing steam turbine to produce the additionalpower while maintaining a more uniform andefficient load and without venting the steam.The fuel energy utilization efficiency of operat-ing the condensing turbine returns to the lowvalue described above (31 percent and evenmuch less) for that portion of the steam con-densed. In order for condensing power to becost effective, the fuel cost must be significantlyless than the electricity cost. In fact, becausethe industrial facility will generate condensingpower less efficiently than the large utility, inthe evaluation, to produce electricity throughcondensing, efficiency losses must balanceagainst process needs, availability requirements,and alternative electricity purchasing costs orsales revenues.
Example:Consider an industrial facility requiring both ther-mal energy and electricity. The facility currentlypurchases electricity from the local power genera-tor and fuel from the fuel supplier. The local powergenerator purchases fuel from the same fuel sup-plier as the industrial customer. The local powergenerator purchases 100 units of fuel and con-verts this into 31 units of electrical energy. Thiselectrical energy is consumed in the industrial fa-cility. The industrial facility purchases 100 unitsof fuel and converts it into 80 units of thermalenergy. A combined heat and power system couldbe operated at the industrial complex to supplythe same amount of electrical and thermal energy.The combined heat and power system might re-quire 143 units of fuel energy to supply the samethermal and electrical demands as the 200 unitsof fuel originally required. This is a 28 percentreduction in fuel consumption.
To give you an idea of relative cost, comparisonof the use of natural gas and electricity for homeheating may be beneficial. Assuming the sameamount of energy is needed to keep the homewarm on a very cold day (some temperature lessthan freezing outside), a simple calculation canhelp understand the differences. We can look atthe energy costs in dollars per MMBtu delivered.
Natural gas is normally sold in cents per therm(100,000 Btu). Multiply this by 10 and we have$/MMBtu.
For natural gas, if you pay 62 cents per therm,you pay $0.62/therm x 10 therm/MMBtu =$6.20/MMBtu.
Electricity is normally sold in cents per Kilowatt(kW). Multiply this as dollars by 293 kW/MMBtugives dollars per MMBtu, something that is di-rectly comparable to the cost of other energysources.
For electricity, if you pay 10 cents per kW, youpay $0.10/kW x 293 kW/MMBtu = $29.30/MMBtu.
Thank goodness for heat pumps when the tem-perature is in the proper range. Here they are about300 percent efficient and that lowers the heatingcost to about $9.80 per MMBtu.
APPLICATION OF COMBINED HEAT AND
POWER SYSTEMS
The discussion above explained advantages ofcombined heat and power systems using gas tur-bines, internal combustion (IC) engines, com-bined with boilers to show how these systems useBtus released from fuel combustion more effi-ciently. A common combined heat and powersystem (perhaps the oldest for industrial applica-tions) consists of generating high temperature,high-pressure steam and running it through a backpressure steam turbine to produce electricity. Hotexhaust from the turbine goes to the process touse the lower temperature Btus. This section cov-ers applications of various combined heat andpower systems to show that selection of the opti-mum system depends upon the resources andneeds of the facility.
The main factors that determine the type of en-ergy supply system for a given facility are:
Fuel availability;Proportion of plant energy needed in the formof electrical, mechanical and heat;Extent and frequency in supply requirementsfor steam; andMarket for surplus electricity.

Steam Digest 2002Energy Efficiency and Industrial Boiler Efficiency: An Industry Perspective
12
Fuel availabilityFuel availability depends upon the geographi-cal location of the facility, products produced,cost of various fuels, and compatibility of vari-ous fuels with plant processes. Some exampleindustries that demonstrate this relationship are:pulp and paper, cane sugar processing, refiner-ies, ammonia plants, and batch chemical plants.Contrary to popular opinion, there are areas inthis country where natural gas is not availablebut where there are abundant supplies of coalor other fuels.
Pulp and paper and cane sugar processing are ex-amples of industries that produce a fuel byproductused for some or all of their energy supply. Thepulp and paper industry burns bark and woodfrom trees that provide feedstock for making pulpand paper. It also burns pulp residue that other-wise would be wasted. The sugar industry burnsbagasse, which is leftover material after sugar hasbeen squeezed out of sugar cane. These fuels aresolid biomass. The paper industry supplementsfuels with coal, another solid fuel that is burnedeasily with biomass. Other biomass fuels includepalm fronds, peanut shells, rice hulls, hog manure,and poultry litter. If it has Btu value, someonecan use it, and probably is using it for a fuel togenerate valuable energy and eliminating a poten-tially serious waste disposal problem.
Refineries process crude oil, and use fuelbyproducts (gas, heavy oil, and coke) for most oftheir energy requirements. These fuels are supple-mented with small quantities of natural gas.
Ammonia plants use natural gas with some of theirbyproduct purge gas. Natural gas is both a fueland the feedstock.
Batch chemical plants use a variety of fuels (natu-ral gas, oil and coal) mainly depending upon thegeographical location of the plant.
Need for electrical, mechanical, andheat energyThe proportion of energy in the forms of electric-ity, mechanical energy, and heat energy is impor-tant in determining the extent to which a com-bined heat and power system can be applied at agiven facility. When there is little need for electri-cal or mechanical energy, a combined heat andpower system may not be practical. Using theindustrial examples, the following observations arepertinent. If there is no need for thermal (heat)
or mechanical energy at a location, there is nopossibility for a combined heat and power sys-tem.
The pulp and paper industry needs heat in theform of steam to operate digesters that makepulp and to provide heat for drying paper. Theindustry needs electrical energy to run papermachines and mechanical or electrical energy torun debarking machines, pumps, and compres-sors. Due to these requirements, a pulp andpaper mill often uses combined heat and power.Steam from boilers goes through backpressureturbines to make electricity; then exhaust steamgoes to digesters and paper dryers to provideprocess heat.
Due to fuel availability and steam and electric pro-cess requirements, use of gas turbines is not nor-mally practical in a combined heat and power ap-plication in this industry where energy efficiencymaximization is of prime importance. Becausethe fuels contain high moisture levels, the ther-mal efficiency of the combined heat and powersystem within these facilities is inherently lowerthan in other applications.
Refineries require both electricity and heat energy.Recently, many refineries have added gas turbineswith heat recovery steam generators (waste heatboilers). Electricity runs pumps, fans, and com-pressors inside the refinery, and steam from thewaste heat boilers provide heat for refinery opera-tions such as distillation units, reboilers, and othermachinery that demand electricity and steam.Surplus electricity not used within the plant is soldto the electrical power grid. With available fuels,the combined heat and power system can attainvery high efficiencies for refinery applications.
Another form of cogeneration involves the use ofpetroleum coke that is burned in a circulating flu-idized bed boiler to generate steam. Steam goes toa backpressure turbine to make electricity and ex-haust steam goes to the refinery to provide heatfor refinery operations.
When discussing combined heat and power regu-lators, plant managers often concentrate on elec-tricity generation followed by the use of the re-sidual heat to produce steam. Although this is atypical combined heat and power scenario, it isnot always the most efficient or effective use oftechnology at a given facility. For example, am-monia plants require a lot of mechanical energyto compress gases to very high pressure. For

Steam Digest 2002Energy Efficiency and Industrial Boiler Efficiency: An Industry Perspective
13
this case, it is better to use a gas turbine to drivethe compressor(s) rather than use a large elec-tric motor. The exhaust from the gas turbinecontains high levels of oxygen as well as hightemperature. This exhaust can be used to firemore fuel in a furnace that produces hydrogenfor the ammonia process. In this case, the“power” is mechanical energy and the residualheat is converted directly to chemical energy andsteam in the furnace. Due to process require-ments it is not wise to make electricity with thegas turbine and send it to an electric motor todrive the compressor.
Batch chemical plants have varying needs for elec-tricity, mechanical energy, and heat dependingupon the product produced. The suitability andselection of various combined power and heat andpower systems may vary widely depending uponprocess needs.
Extent and frequency in supplyrequirements for steamCombined heat and power systems are less likelyto be practical in small plants where steam require-ments change rapidly. Many batch chemical plantshave this characteristic. It is counterproductiveto run a gas turbine or IC engine to produce elec-tricity and to throw Btus into the atmosphere inthe form of vented surplus steam.
Market for surplus electricityIn some cases, the need for electricity or heat isout of balance. Electricity must be generated insurplus quantities to produce enough steam forprocess use. In these cases, electricity must be sal-able at a price that exceeds the money needed tobuild the combined heat and power unit at thefacility. Industry operates at low profit marginsand cannot afford to give free electricity to otherusers. However, there is one thing for certain, ifthere is a need for steam there is a possibility forcombined heat and power.
INTERNAL COMBUSTION ENGINES AND
TURBINE CONSIDERATIONS WITH WASTE
HEAT BOILERS OR HEAT RECOVERY STEAM
GENERATORS
Modern internal combustion (IC) engines usedto generate electricity with either fired or unfiredheat recovery boilers maintain their simple cycleefficiency, which is the highest efficiency of com-mercial technologies under real-world ambient
temperatures and elevations above sea level. Co-generation applications that recover the maximumamount of waste heat created by the generation ofthe electrical component of the plant achieve over-all efficiencies in excess of 80 percent on a highheating value (HHV) basis. Simple cycle ther-mal efficiencies can exceed 41 percent on a HHVbasis, i.e., those when only electricity is beinggenerated and no waste heat recovery is occur-ring.
Cogeneration applications favor gas turbine tech-nology when the process requires a massive amountof high temperature steam. Gas turbines createlarge quantities of high temperature exhaust gas,resulting in the need to generate large quantitiesof high temperature steam in order to achieve ac-ceptable overall plant thermal efficiencies. If usesfor the large quantity of high quality steam areavailable, then gas turbine technology usually isused.
In the other on-site situations requiring smalleramounts of steam and higher quantities of pro-cess hot water, modern IC engine technology pro-vides the best economic returns for the owner andis the technology of choice.
As discussed previously, the reason that gas andoil have lower boiler efficiencies than coal is be-cause these fuels have progressively higher hydro-gen contents that generate water during combus-tion. This water is boiled and heated up to stacktemperature where it is emitted into theatmosphere. (The water in this instance is formedas a vapor, as it contains the latent heat but doesnot pass through the boiling process in the com-bustion process). That moisture loss takes heataway from the energy available to boil the waterinside the tubes to make steam for productive use. If there is moisture present with the fuel, such assurface water or humidity, that water also is lostto the stack and causes an efficiency loss. (Yes, theefficiency varies with the time of year and theweather.) Recognizing this loss, boilers are ratedbased on a higher heating value of the fuel. Thisefficiency includes unrecovered heat from allow-ing water vapor to exit the boiler.
Gas turbine advocates attempt to avoid this com-plexity by referring to the lower heating value ofthe fuel and doing all of their calculations at ISOconditions (59°F and one bar and constant rela-tive humidity). In the real world, gas turbineslose efficiency faster than steam turbines as loadis decreased, and lose output particularly fast as

Steam Digest 2002Energy Efficiency and Industrial Boiler Efficiency: An Industry Perspective
14
ambient temperatures and altitudes increase.Efficiencies presented in this white paper are allbased on the higher heating value to provideadequate comparisons.
SUMMARY AND CONCLUSIONS
Owners and operators of industrial facilities striveto operate at optimum efficiencies. However, un-like the utility industry that produces a single prod-uct, industrial facilities are more complex. Boil-ers designed for such facilities are much more di-versified in order to meet widely differing require-ments. These different requirements naturallycreate optimal efficiencies that vary widely fromindustry to industry and from facility to facility.The one-size-fits-all approach often used by regu-lators to encourage increased energy efficiency sim-ply does not work because this approach does notconsider the many specific factors that affect en-ergy efficiency.
This white paper has discussed major factors thatsignificantly affect achievable energy efficiencieswithin various industrial facilities. Fuel type andavailability, combustion system limitations, equip-ment design, steam system operation require-ments, energy requirement mix, and outside mar-ket forces all affect the achievable efficiency of anindustrial facility.
Fuel type and availability has a major effect. Fu-els with high heating values, high carbon to hy-drogen ratios, and low moisture content can yieldefficiencies up to 25 percent higher than fuels thathave low heating values, low carbon to hydrogenratios, and high moisture contents. A rule ofthumb for the efficiency hierarchy in descendingorder is coal, heavy fuel oil, light fuel oil, naturalgas, and biomass. From these rankings, it is obvi-ous that fuel availability plays a major role.
Factors such as combustion system limitations andequipment design limit the types of fuels that rea-sonably can be used within a given boiler. Be-cause the design of older boilers is fixed, switch-ing fuels often leads to significant losses in effi-ciency or capacity. In some cases changing fromone fuel to another, such as natural gas to fuel oil,may improve efficiency.
Steam system requirements often have signifi-cant adverse impacts on achievable efficienciesespecially for potential combined heat and power
applications. Widely different steam demandscan lead to periods where the boiler is kept run-ning on “idle” in certain industries. Becausethe boiler produces little or no steam under theseconditions, its operating efficiency is close tozero. The alternative of shutting the boiler downto conserve energy in fact wastes energy and of-ten is not practical.
When possible, the application of combined heatand power produces large improvements in effi-cient energy usage. Use of high temperature en-ergy to produce electrical or mechanical energyfollowed by the use of remaining lower tempera-ture energy to meet process heat requirements isthe ideal. Industries such as the paper industryhave utilized combined heat and power for morethan a half century. The highest efficiencies areachieved by systems combining IC engines or gasturbines with boilers or process heaters. How-ever, these systems are not suitable for every facil-ity. Factors such as fuel availability, the facility’srelative needs for electrical, mechanical, and heatenergy, steam demand and demand cycles and themarket for surplus power have major effects onwhether or how combined heat and power maybe applied at a given facility. Even where com-bined heat and power is applied, one size does notfit all, and various applications can have widelydifferent efficiencies.

Steam Digest 2002Energy Efficiency and Industrial Boiler Efficiency: An Industry Perspective
15
Appendix AAppendix AAppendix AAppendix AAppendix A
SizeThe average new industrial boiler is a dwarf com-pared to the giant utility boiler. Today’s typicalutility unit produces 3,500,000 pounds of steaman hour; the industrial boiler 100,000. In fact,most industrial boilers range in size from 10,000to 1,200,000 pounds of steam per hour.
The size of the utility boiler allows it to enjoy sig-nificant economies of scale, especially in the con-trol of emissions that simply are not available tothe industrial unit.
Smaller industrial boilers are more numerous andtailored to meet the unique needs and constraintsof widely varying industrial processes. There areabout 70,000 industrial boilers in use today com-pared to approximately 4,000 utility boilers. Yet,all the small industrial units combined produceonly a fraction of the steam compared with largeutility boilers. In addition, the nation’s utility boil-ers consume over 10 timeOs as much coal as theindustrial boilers.
Industrial units produce less than 10 percent ofthe emissions from the nation’s boiler population,but because of their smaller size and uniquenessmust pay more than utilities to remove a givenamount of emissions.
Steam ApplicationA utility boiler has one purpose—to generate steamat a constant rate to power turbines that produceelectricity. Industrial boilers, on the other hand,have markedly different purposes in different in-
DIFFERENCES BETWEEN INDUSTRIAL AND
UTILITY BOILERS
dustries. Even at a single installation, applica-tion of steam from an industrial boiler can changedramatically with the seasons, when steam orhot water is used for heating, as well as fromday to day and hour to hour, depending uponindustrial activities and processes underway at agiven moment and their demand for steam. Thepossibility of such widely fluctuating demandfor steam in most industrial processes means thatthe industrial boiler does not, in the great ma-jority of cases, operate steadily at maximum ca-pacity. In general, the industrial boiler will havea much lower annual operating load or capacityfactor than a typical utility boiler. As a result,any added control costs have a much greater af-fect on the final output steam cost.
In contrast, a typical utility boiler, because of aconstant demand for steam, operates continuouslyat a steady-state rate close to maximum capacity.This basic difference in operation is reflected inproportionately lower operating costs than is thecase for similarly equipped industrial boilers. Evenwhen peaking units operate to meet utility loadswings during the days or for seasonal peak de-mands, the utility units’ load swings are more con-trolled and can be balanced over the complete elec-tric production and distribution grid.
In the event of unscheduled downtime for a givenunit, utility electrical generating facilities have avariety of backup alternatives. Industry, on theother hand, rarely has a backup system for steamgeneration. Because of the desire to keep costs forsteam production as low as possible, industry re-quires a high level of reliability from its boilers.Industrial boilers routinely operate with reliabil-ity factors of 98 percent. Any drop in reliabilityfor an industrial system causes loss in productionand related revenues. Combustion and add-oncontrol technologies can interfere with system re-liability.
DesignUtility boilers primarily are large field erected pul-verized coal, No. 6 oil or natural gas fired highpressure high temperature boilers with relativelyuniform design and similar fuel combustion tech-nologies. Industrial boilers, on the other hand,incorporate combustion systems including highpressure and low pressure, large and small, fielderected and shop assembled package boilers de-signed to burn just about anything that can beburned alone or along with conventional fuels. In-dustrial boilers use many different types of com-bustion systems. Some of these different designs
Industrial and utility boilers are significantlydifferent. Yet, because both generate steam,legislators and requlators tend to treat themthe same.
Major differences between industrial andutility boilers are in three principal areas:
% boiler size% boiler steam application% boiler design

Steam Digest 2002Energy Efficiency and Industrial Boiler Efficiency: An Industry Perspective
16
include many different types of stokers, bub-bling and circulating fluidized bed combustionsystems, and conventional coal, oil and gas com-bustion systems. In fact, the designs of indi-vidual industrial boilers regardless of fuel or com-bustion type can vary greatly, depending uponapplication of steam and space limitations in aparticular plant. On the other hand, facilities ata utility plant are designed around the boilersand turbine(s) making application of emissioncontrols significantly more cost effective.
CONCLUSION
Differences between industrial and utility boilersare major. These differences warrant separate de-velopment of laws and regulations that apply toeach. Treating them both in the same fashion,simply because they both generate steam, inevita-bly results in unfair and inappropriate standards.
Accordingly, the Council of Industrial BoilerOwners believes that government should recog-nize the basic differences between industrial andutility boilers and should tailor requirements totheir individual natures and to the unique situa-tions within which each operates.
COUNCIL OF INDUSTRIAL BOILER OWNERS
The Council of Industrial Boiler Owners(CIBO) is a broad-based association of in-dustrial boiler owners, architect-engineers,related equipment manufacturers, and uni-versity affiliates consisting of over 100 mem-bers representing 20 major industrial sec-tors. CIBO members have facilities locatedin every region and state of the country;and, have a representative distribution ofalmost every type boiler and fuel combina-tion currently in operation. CIBO wasformed in 1978 to promote the exchangeof information within industry and betweenindustry and government relating to energyand environmental equipment, technology,operations, policies, laws and regulations af-fecting industrial boilers. Since its for-mation, CIBO has taken an active interestand been very successful in the developmentof technically sound, reasonable, cost-effec-tive energy and environmental regulationsfor industrial boilers.

Steam Digest 2002Decision Climate for Steam Efficiency: Update December 31, 2002
17
Decision Climate for SteamEfficiency: UpdateDecember 31, 2002Carlo La Porta, Future-Tec
ABSTRACT
The Performance Evaluation and Policy Subcom-mittee of the BestPractices Steam Steering Com-mittee issues a periodic compilation of data thatthe Energy Information Administration, U.S.Department of Energy, reports in its Short-TermEnergy Outlook. The author selected data rel-evant to industrial decision makers concerned withsupply and price of energy purchased for indus-trial fuel. The ulterior purpose is to help framedecisions that will encourage more investment toimprove the efficiency of industrial steam systems.
DATA FROM U.S. DEPARTMENT OF
ENERGY SHORT-TERM ENERGY OUTLOOK
Weather ImpactsDespite an 11 percent increase in cooling degreedays during summer 2002, high utility demandfor fuel to make electricity did not create a spikein natural gas prices. Natural gas spot prices did,however, exceed $3.00 per thousand cubic feet inAugust and rose to $3.90 in November. Popula-tion-weighted heating degree days for October andNovember were 16 percent higher compared tonormal in the Northeast United States and wereeight percent higher than normal nationally. Thewinter after January is projected to be warmer thannormal. A 12 percent colder winter of 2002-2003will increase demand for heating oil, gas and elec-tricity, and hold or pressure fuel prices upwardand EIA has predicted that natural gas will be$1.50 more per 1,000 cubic feet than last winter.
Industrial ProductionU.S. GDP is projected to be 2.3 percent higher in2002 compared to 2001 and grow 2.6 percent in2003. Manufacturing production fell in 2001 by4.3 percent, was projected to fall another 0.4 per-cent in 2002, then rise 3.4 percent in 2003. U.S.business inventory dropped $36.2 billion ($1996)in 2001, and another $14.8 billion ($1996) is theprojected drop for 2002. A gain of $6.7 billion isforecast for 2003.
Petroleum The benchmark West Texas Intermediate oil spotprice rose by $1.40 per barrel in August comparedto July, averaging $28.40 per barrel (bbl) for themonth. At that time OPEC was producing 1.8million barrels per day over its quota and the Oc-tober average price for OPEC oil was $27.60 perbarrel. Iraqi production had fallen by 1.2 millionbarrels per day in August compared to August2001. A political crisis in Venezuela cut its oilexports severely in December, which increasedmarket uncertainty and put more upward pres-sure on oil prices. These conditions pushed oilprices above $30 per barrel by the end of 2002.The New York Mercantile Exchange price on De-cember 31, 2002, for light sweet crude deliveriesin February 2003 was $31.37/bbl. The Februarydelivery price actually had dropped $1.35 per bar-rel based on news that an OPEC country had in-dicated OPEC production might increase to bringprices down. The EIA forecast has assumed thatOPEC will increase production to keep the pricein its desired range between $22-$28/bbl. Econo-mists are concerned about continued slow recov-ery in U.S. economic growth and EIA has droppedits U.S. GDP growth rate projection from 4.1per-cent in 2003 to 3.0 percent. Still, EIA expectsU.S. demand for petroleum products to rise 3.9percent in 2003.
lautcA detcejorP
1002 2002 3002
%0.0 %4.0 %8.1
Table 1: World Oil Demand Growth(italics signify forecast)
In 2002, average daily U.S. oil production willhave fallen one tenth of one percent (0.10 %) to5.8 million barrels per day. In 2003 domestic pro-duction is projected to fall by 3.5percent to a levelof 5.6 million barrels per day. With oil importsprojected to average 10.5 million barrels per dayin 2002, the U.S. will have depended on foreignoil for 64.4 percent of its supply.
Distillate Fuel OilLast winter, due to mild weather, the industrialdownturn and expanded reliance on natural gas,distillate demand fell 230,000 barrels per day, orsix percent, and inventories rose. By late Novem-ber 2002, the distillate inventory fell below theminimum average amount for the last five years,
All data: U.S. DOE-EIA

Steam Digest 2002Decision Climate for Steam Efficiency: Update December 31, 2002
18
due to the colder October and November.Tightened supply with predicted higher oilprices and recovering industrial demand shouldpush the price for distillate up about 10 centsper gallon.
Natural GasIn March 2002, EIA predicted that during sum-mer 2002, natural gas wellhead spot prices perthousand cubic feet would fall below $2.00. In-stead, the wellhead price averaged $2.83 in thethird quarter and for all of 2002, the average willbe close to $3.00 per thousand cubic feet. Spotprices hit $4.00 per thousand cubic feet in No-vember, and rose significantly in December. Janu-ary and February delivery prices on December 18th
were $5.28 and $5.25 per million Btu. Thesehigher prices should continue throughout the win-ter months. The winter delivery prices contrastwith the average wellhead price EIA projects forall of 2003, which is $3.69 per thousand cubicfeet. Overall demand for gas in 2003 is projectedto rise 3.6 percent. Earlier in 2002, EIA projected
9991 0002 1002 2002 3002
detropmIliOedurC 62.71$ 27.72$ 10.22$ 37.32$ 49.32$
topS.retnIsaxeTtseW 52.91$ 92.03$ 59.52$ 39.52$ 69.52$
Table 2: Average Annual U.S. Energy Prices, EIA Base Case (Nominal Dollars per Barrel)(italics signify forecast)
All data: U.S. DOE-EIA
2002tsuguAfodneskcotS slerrabnoillim031
2002rebmevoNfodneskcotS slerrabnoillim021)2002yraunaJnahtrewolslerrabnoilim81~(
Table 3: Status of Distillate Oil Stocks Inventory, Late 2002
industrial demand for natural gas to rise by 9.6percent in 2002, and another 6.3 percent in 2003.Domestic dry gas production in 2002 shouldbe 1.6 percent lower than 2001. EIA projectsit to rebound by 2.7 percent in 2003 as de-mand rises and inventories fall to normal. Work-ing natural gas in storage was 2.95 trillion cu-bic feet in November, nine percent below thelevel at the same time in 2001. Through 2003,natural gas in storage is predicted to be abovethe five year average until the end of the year,when it will drop below it.
Active rigs drilling for natural gas were 43 percentlower in August 2002 than 12 months previously.
Although no gas price spike ($9.00/MCF) is fore-seen similar to the one that occurred in winter2001, the EIA projection range plotted for 2003now indicates that the base case wellhead priceshould be well over $4.00 per thousand cubic feetin early 2003, and the range shows that it couldpossibly reach a high of near $6.00 before falling
0002 1002 2002 3002
dnameD.S.UlatoT 44.32 14.22 12.22 11.32
dnameDlairtsudnIlaunnA .a.n 00.9 68.9 34.01
Table 4: Natural Gas Demand (trillion cubic feet) (italics signify forecast)
All data: U.S. DOE-EIA
1002 2002
htnomrepnoitcudorpcitsemodegarevA tfnoillirt26.1 3 tfnoillirt95.1 3
htnomrepstropmiteN tfnoillirt03.0 3 tfnoillirt82.0 3
Table 5: Summary of Natural Gas Production, 2001-2002
All data: U.S. DOE-EIA

Steam Digest 2002Decision Climate for Steam Efficiency: Update December 31, 2002
19
as summer approaches. The lower boundary ofthe predicted range for 2003, is about $2.50 dur-ing the summer months. In other words, gas priceuncertainty remains pretty high. The drilling rigcount remains low, and the gas industry is findingthat many wells dug from existing bore holes aredelivering gas for a shorter period of time thanhistorically. Some speculation about adequate gassupplies has begun to surface, but the gas indus-try appears confident that higher prices will en-sure adequate supply.
CoalIn the March 2002 DOE Short-Term EnergyOutlook, the only EIA statement regarding coalpredicted a continuing slow price decline through2003. The September report did not mention coal.Demand for coal is set by the utility sector, whichconsumes 87percent of U.S. coal production (56percent of electricity is generated by coal plants).Total U.S. coal supply, net of imports and exports,was 1,090.4 million short tons in 2001 and wasforecast to drop to 1,054.7 million short tons in2002, and drop again in 2003, to 1,052.6 millionshort tons. Demand for coal was projected to rise0.8 percent in 2002 and 1.1 percent in 2003.
Total industrial coal consumption for coke plantswas 26.1 million short tons in 2001 and shoulddecline to 23.5 million short tons in 2002. EIAexpects coke plant consumption to recover some-what to 24.3 million metric tons in 2003. Non-utility independent power producer demand forcoal, excluding cogeneration, was 150.6 millionshort tons in 2001, and is forecast to grow to 192.7million short tons in 2002 and 197.1 million shorttons in 2003. Retail and general industry use,which was 67.5 million short tons in 2001, is fore-cast to drop slightly to 65.3 million short tons in2002 and decline again in 2003 to 65.0 millionshort tons. Western low sulfur coal production is
1002enuJ-rpA 2002enuJ-rpA egnahC
repaP 39.14$ 88.34$ %6.4+
slacimehC 83.63$ 20.04$ %0.01+
*lateMyramirP 14.72$ 91.82$ %8.2+
seirtsudnIllA.gvA 98.13$ 34.33$ %8.4+
]utBMM/43.1$=34.33$laocsuonimutibnottrohsreputBMM52tA[ekocsedulcxE*
Table 6: Coal Receipt Prices ($/short ton) at Selected Manufacturing North American Indus-try Classficiation System Category
All data: U.S. DOE-EIA
forecast to rise 2.5 percent per year through thenext two decades while higher sulfur eastern coalproduction is projected to remain level. Con-trary to EIA’s expectation that coal prices willcontinue a decline, over the last 12 months, forall industries, they have actually risen 4.8 per-cent.
Restructuring of electric utilities is expected tokeep pressure on coal producers and railroads tocut costs. The coal industry may further consoli-date in response to a utility movement to negoti-ate shorter term contracts for coal. Coal produc-ers may need to take steps to manage a higher levelof risk and coal futures markets are being createdin some regions. In short, restructuring in theelectric power sector could have a spillover effecton the stable coal market.
IMPLICATIONS FOR MARKETING INDUSTRIAL
STEAM EFFICIENCY
The U.S. electric power sector, which reached arecord production high in August (source: EdisonElectric Institute), demonstrated its flexibility toadjust to fuel price changes. In 2002, total oil-fired generation is expected to be 30 percent lowerthan in 2001, while natural gas use is projected toincrease 7.2 percent compared to 2001. In theindustrial sector, unlike utilities, natural gas domi-nates energy consumption. EIA 1998 data for allmanufacturing industries show the following fuelconsumption figures, in trillion Btu, in Table 7.
Environmental emissions associated with conven-tional coal combustion remain a brake on fuelswitching, unless industry were to adopt coal gas-ification or best available technologies to controlair pollution.

Steam Digest 2002Decision Climate for Steam Efficiency: Update December 31, 2002
20
Industrial firms may be feeling somewhat se-cure about gas supply. The California utility“crisis” was partly created by trader manipula-tions and supply has met demand this year with-out strain. Furthermore, gas imports only ac-count for 15 percent of U.S. demand, almost allof which comes from Canada, which increasesconfidence in domestic supply stability. It isnot likely that industry is very aware of a debatenow being conducted about the timing of glo-bal peak oil and gas production, and the impactthat a two percent per year increase in naturalgas use in the U.S. will have on supply if thepeak in gas use occurs in 15 years rather than35. The gas industry believes it will be able todeliver 30 trillion cubic feet per year, but thereis more need to track trends at this time for de-cision makers.
Gas industry conditions in the U.S. have estab-lished a dynamic that promotes cyclical pricemovements. First, short-term supply and demandfor gas is relatively inelastic. In periods of scarcityor abundance of supply, prices move a great deal.Second, gas producers experience large fluctuationsin cash flows, investments and available suppliesat the wellhead due to the large price movements.This perpetuates the situation. Third, the gas in-dustry is likely to over-invest relative to gas de-mand when prices are high and under-invest whenthey are low. This is due to the significant amountof time between changes in price and changes inwellhead gas supply, typically 6 to 18 months. Fi-nally, some gas producers are now experiencingmore rapid dropoffs in production from new natu-ral gas wells. If production declines faster thananticipated in these new wells, producers may getcaught short if they have cut investment in devel-oping new capacity. The near-term outlook forindustrial users is to expect significant price fluc-tuations. It may be some time, if ever, before themarket sees $2.00 per thousand cubic feet gas.
Government policy is also likely to have a largerimpact on natural gas supply and therefore, de-mand. Estimated total undiscovered, technicallyrecoverable natural gas resources off the coasts ofthe mainland U.S. are about 235 trillion cubic
feet. Of this amount, about 60 trillion cubicfeet are currently inaccessible due to policy. TheRocky Mountain resources currently on federallands and inaccessible represents another 30 tril-lion cubic feet. A third factor will be importsof liquefied natural gas (LNG). They have beenrising rapidly and in the future could rise andfall to mitigate price swings related to domesticsupply. In short, there is more uncertainty aboutnatural gas supply now than in recent years andindustry decision makers should follow trendswith more attention when making decisionsabout energy-related investments in their plants.
Congress adjourned in 2002 without passing na-tional energy legislation. With the Republicansnow holding both Houses, an energy bill shouldemerge in this session. The Bush administrationhas also adjusted New Source Review EPA regula-tions that may make it easier for companies toinvest in equipment upgrades that will includemore efficiency. It should be noted that the sup-ply-oriented National Energy Strategy documentthe Bush administration produced had little to sayabout industrial efficiency, but the energy legisla-tion could include financial incentives for energyconservation investments that will pertain to in-dustry. The picture will not become clearer untilCongress organizes and the FY2003 appropria-tions bills are finally passed. In the meantime,potential to promote steam efficiency to reduceNO
X emissions and enhance compliance with
clean air requirements is growing stronger in cer-tain areas of the U.S.
Near-term gas price is another matter and EIAhas forecast a significant increase in gas prices in2003 as the economy recovers and colder weatherincreases demand this winter. Prices will also beaffected by the decline in U.S. gas production in2002 and the inevitable link with current oil prices,which at the end of 2002 have gone over $30 perbarrel. Will these higher prices stimulate invest-ment in steam efficiency? Probably not. Com-pany managers are contending with excess pro-duction capacity, lower sale prices for their prod-ucts and serious erosion of their stock value. Thiseconomic environment is more likely to stimu-
saGlarutaN LGN&GPL laoC)ezeerb&ekoc.lcxe(
liOleuFlaudiseR liOleuFetallitsiD
446,6 531 341,1 753 331
Table 7: U.S. Industrial Fuel Consumption (Trillion Btu), 1998
All data: U.S. DOE-EIA

Steam Digest 2002Decision Climate for Steam Efficiency: Update December 31, 2002
21
late quick and easy cost cutting. Given a thin-ning of staff capabilities in many companies, en-ergy conservation may have a hard time gettingon the “quick and easy” cost cutting list. In-deed, training companies have indicated thatcompanies are restricting travel, a sign that thegeneral environment for increasing efficiencyremains difficult. Conservation proponentsmight argue that low interest rates should jus-tify borrowing to invest in energy saving projectsthat would lower bottom-line costs and repaythe loans easily. Unfortunately cost cutting toretain profits on a smaller volume of sales prob-ably will not stimulate allocation of internal capi-tal for energy efficiency improvements.
Looking a little further ahead, an intervention inIraq might disrupt oil supply for a short time, butIraq’s one to two million barrels per day of oil salescan easily be made up by OPEC. Iraq has verylarge oil reserves, so if the S. Hussein governmentis replaced, Iraqi oil sales could double in a shorttime and prices would then drop. If high gasolineprices triggered, as usual, consumer action to con-serve energy, industry may respond for a shortwhile by deciding to give more priority to energyinvestments. The likelihood that oil price riseswould be short-lived suggests, however, that morestimulus to invest in steam efficiency will result ina true rebound from the downturn in the indus-trial sector.
REFERENCES
1. U.S. Department of Energy, Energy InformationAdministration: EIA Annual Energy Outlook 2002with Projections to 2020.
2. Web page: “Short Term Energy Outlook– March2002” www.eia.doe.gov/emeu/steo/pub/contents.html.


Steam Digest 2002 An Analysis of Steam Process Heater Condensate Drainage Options
23
An Analysis of SteamProcess Heater CondensateDrainage OptionsJames R. Risko, TLV Corporation
ABSTRACT
The production and reliability of performance ofsteam process heaters can be significantly affectedby the condensate drainage design that is em-ployed. The current variety of drainage optionscan be confusing to a system designer who is un-aware of the reasons for each specific design. Anunderstanding of the various types and why theymay be used follows.
BACKGROUND
For simplicity, the terminology “process heater”is intended to mean any steam heat exchanger,coil, or kettle which uses steam as the primaryfluid to transfer heat to a product. While gener-ally intended for production purposes, this ter-minology can also be used to refer to HVAC ap-plications. The reason that all of these heater typescan be grouped together is because even thoughthey incorporate different exchanger designs onthe product side, they all are intended to transfersteam heat in an efficient and cost effective heat-ing manner. In that sense, they all use the steamto provide a certain level of heat transfer and drainthe by-product, condensate, away from the heaterso that new steam can be introduced and con-trolled to heat additional product.
What is intriguing about this simple goal is thatthere are currently a variety of installation designsto accomplish the removal of that condensate, andthese provide various levels of production perfor-mance depending on the environmental condi-tions of the specific heater application. What canbe confounding is that some of these drainageoptions may work very well in one scenario, andyet fail miserably in another depending on theconditions. When successful in a previouslytroublesome application, a particular installationdesign may create a sense of comfort within anengineering department and later become a
standard practice for a facility. Later it can havedecidedly mixed results when used for an appli-cation for which it cannot perform well enoughto meet design expectations. This situation mayhave tremendous energy and production impli-cations and can usually be easily identified inadvance.
IDENTIFYING THE SYMPTOMS
Telltale signs for those installations with unsuit-able condensate drainage include:
Condensate being visibly wasted from the heatexchanger discharge side, either from a hoseconnection at the strainer, or an opened unionor drain valve on the steam trap’s outlet pip-ing. In this case, the condensate is no longeravailable to be returned through the returnline, and its valuable energy is needlessly sac-rificed to grade so that required productionperformance levels can be achieved.The presence of severe hammering in the ex-changer itself or in the return piping down-stream of the heater. There are a variety ofcauses for this type of hammering, but in theworst case its cause can be attributed to sig-nificant amounts of preventable steam loss.Product variance much greater than expecta-tions.Dramatic temperature stratification of theheater’s exterior surface where steam is shell-side.A higher than average maintenance require-ment for head gasket or tube bundle failure.
COURSE OF ACTION
The optimum solution is to specify a condensatedrainage design that removes all condensate fromthe heater rapidly. This is where confusion overthe best design has traditionally occurred. Whilethe target of high performance heat exchanger in-stallation design prevails, a full understanding ofthe options and when their use is indicated is of-ten not clear.
Therefore, the purpose of this presentation is toexamine the common types of heat exchangerdrainage designs, and describe the instances whereeach can perform suitably. Those installationdesigns are slightly different when steam is tube-side versus shell-side, and the piping optionsfor both instances follow:
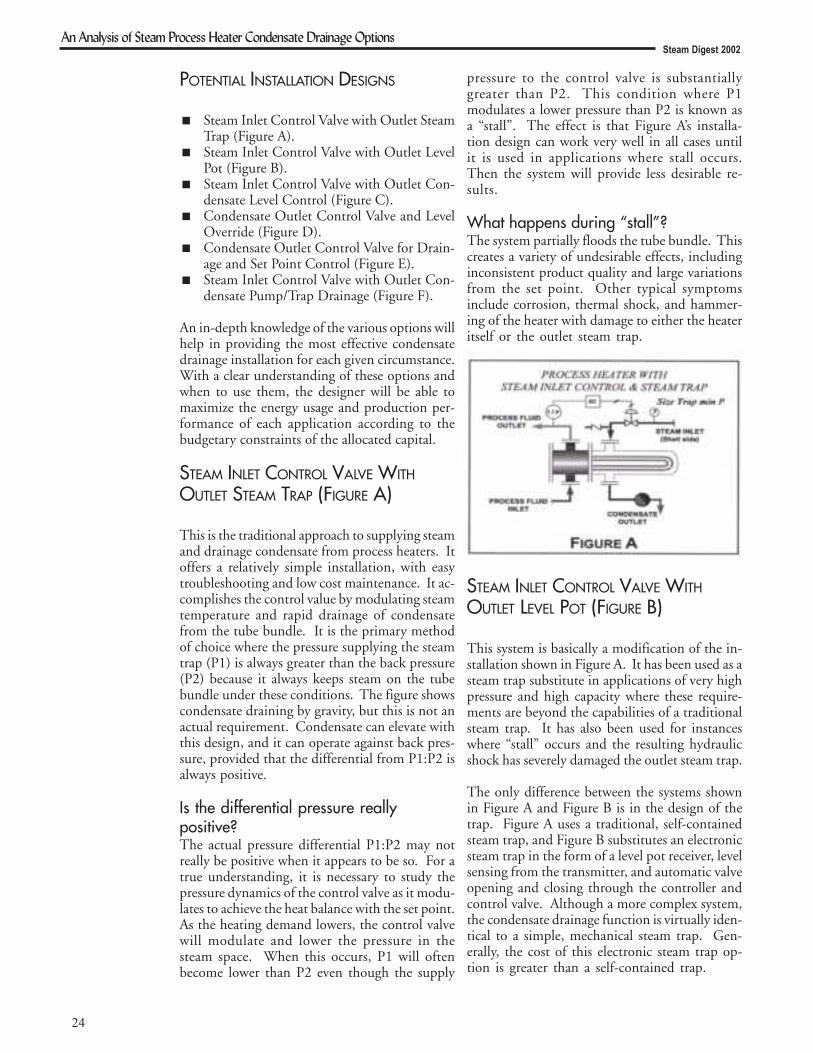
Steam Digest 2002An Analysis of Steam Process Heater Condensate Drainage Options
24
STEAM INLET CONTROL VALVE WITH
OUTLET LEVEL POT (FIGURE B)
This system is basically a modification of the in-stallation shown in Figure A. It has been used as asteam trap substitute in applications of very highpressure and high capacity where these require-ments are beyond the capabilities of a traditionalsteam trap. It has also been used for instanceswhere “stall” occurs and the resulting hydraulicshock has severely damaged the outlet steam trap.
The only difference between the systems shownin Figure A and Figure B is in the design of thetrap. Figure A uses a traditional, self-containedsteam trap, and Figure B substitutes an electronicsteam trap in the form of a level pot receiver, levelsensing from the transmitter, and automatic valveopening and closing through the controller andcontrol valve. Although a more complex system,the condensate drainage function is virtually iden-tical to a simple, mechanical steam trap. Gen-erally, the cost of this electronic steam trap op-tion is greater than a self-contained trap.
POTENTIAL INSTALLATION DESIGNS
Steam Inlet Control Valve with Outlet SteamTrap (Figure A).Steam Inlet Control Valve with Outlet LevelPot (Figure B).Steam Inlet Control Valve with Outlet Con-densate Level Control (Figure C).Condensate Outlet Control Valve and LevelOverride (Figure D).Condensate Outlet Control Valve for Drain-age and Set Point Control (Figure E).Steam Inlet Control Valve with Outlet Con-densate Pump/Trap Drainage (Figure F).
An in-depth knowledge of the various options willhelp in providing the most effective condensatedrainage installation for each given circumstance.With a clear understanding of these options andwhen to use them, the designer will be able tomaximize the energy usage and production per-formance of each application according to thebudgetary constraints of the allocated capital.
STEAM INLET CONTROL VALVE WITH
OUTLET STEAM TRAP (FIGURE A)
This is the traditional approach to supplying steamand drainage condensate from process heaters. Itoffers a relatively simple installation, with easytroubleshooting and low cost maintenance. It ac-complishes the control value by modulating steamtemperature and rapid drainage of condensatefrom the tube bundle. It is the primary methodof choice where the pressure supplying the steamtrap (P1) is always greater than the back pressure(P2) because it always keeps steam on the tubebundle under these conditions. The figure showscondensate draining by gravity, but this is not anactual requirement. Condensate can elevate withthis design, and it can operate against back pres-sure, provided that the differential from P1:P2 isalways positive.
Is the differential pressure reallypositive?The actual pressure differential P1:P2 may notreally be positive when it appears to be so. For atrue understanding, it is necessary to study thepressure dynamics of the control valve as it modu-lates to achieve the heat balance with the set point.As the heating demand lowers, the control valvewill modulate and lower the pressure in thesteam space. When this occurs, P1 will oftenbecome lower than P2 even though the supply
pressure to the control valve is substantiallygreater than P2. This condition where P1modulates a lower pressure than P2 is known asa “stall”. The effect is that Figure A’s installa-tion design can work very well in all cases untilit is used in applications where stall occurs.Then the system will provide less desirable re-sults.
What happens during “stall”?The system partially floods the tube bundle. Thiscreates a variety of undesirable effects, includinginconsistent product quality and large variationsfrom the set point. Other typical symptomsinclude corrosion, thermal shock, and hammer-ing of the heater with damage to either the heateritself or the outlet steam trap.

Steam Digest 2002An Analysis of Steam Process Heater Condensate Drainage Options
25
STEAM INLET CONTROL VALVE WITH
OUTLET CONDENSATE LEVEL CONTROL
(FIGURE C)
This solution has been used in some cases to com-bat stall conditions. In this case, a sufficientlyhigh steam pressure is used on the control valveinlet to ensure a positive pressure differentialP1:P2. Because of the possibility of large pressureand temperature changes, some heater surface areais removed by intentional flooding. Limiting theeffective surface area in this manner can lower therange of the control swing.
This insulation will provide positive pressure dif-ferential for P1:P2, but causes increased foulingon the tube bundle which is usually exposed tohigh pressure steam. Troubleshooting this instal-lation will be complex, and corrosion, head gas-ket failure, and thermal shock can be expectedmaintenance issues because the tube bundle isstratified with condensate and steam.
Because of the durability of the components,this system can improve the symptom where aself-contained steam trap has been regularlydamaged from severe water hammer, but it doesnot correct the cause. In this sense, it is only aband-aid, and additional symptoms of corro-sion and production variance from the controlvalue will not be corrected by this option.
CONDENSATE OUTLET CONTROL VALVE
AND LEVEL OVERRIDE (FIGURE D)
A common alternative used by some design engi-neers is to completely eliminate inlet steam con-trol and select outlet condensate control instead.In this design, the outlet control serves as bothcontrol valve and steam trap. The installation doesnot stall because the steam pressure does notmodulate. The result is that the pressure on thetube bundle is always greater than the back pres-sure. The level pot is used to reduce the possibil-ity of live steam loss, and the tube bundle is inten-tionally flooded to remove excess surface area.Then the available tube bundle area becomes thecontrol variable.
Under stall conditions, this system can be a lowercost alternative than the steam inlet control andoutlet level pot design of Figure B. The outletcontrol and level pot are actually sized similarlyto Figure B, but this system completely eliminatesthe cost of the inlet control valve. Additionally,the heater is exposed to higher pressure steam atall times, so its required surface area may be re-duced due to the expected higher temperature ofthe unmodulated steam.
This system can provide acceptable process con-trol in instances of limited demand variation.However, the more the demand changes, there maybe instances of significant deviation from the con-trol value. This is due to at least two factors.Changing water level on a tube bundle is a muchslower process than adjusting steam pressure.Therefore, the process to adapt to demand changesin an outlet control design by moving a water levelis significantly slower than when moving steamthat occurs in steam inlet control installations. Theresult is a greater lag in response to demandchanges. Also, once the water level is moved, thenewly exposed or covered heat transfer area en-counters a drastically changed “U” value. This isbecause of the substantially different heat transferrates between hot condensate and steam. The ef-fects of this difference will be in proportion to theamount of new surface area exposure. The morethe demand change and subsequent tube expo-sure, the more dramatic the change in “U” andthe resultant variation from the control value. Inshort, wider temperature or pressure swings aretypical of this control method.
An additional issue with this design is that theheater’s life begins with intentional flooding, thenexposes increasingly more area as the tube surface

Steam Digest 2002An Analysis of Steam Process Heater Condensate Drainage Options
26
becomes fouled. Eventually, the entire surfacecan become exposed and still not satisfy the pro-cess demand due to fouling. Then, such sys-tems programmed with a level override prioritycan actually blow live steam through the con-trol valve, thereby pressurizing the return line.This leads to a high energy cost and detractsfrom the production rate of all other heatersdraining into the increased back pressure of thesame return heater.
Additionally, without any special provisions, theheater will remain flooded at shutdown and tubecorrosion will be exceptionally high in thesecases.
CONDENSATE OUTLET CONTROL VALVE
FOR DRAINAGE AND SET POINT CONTROL
(FIGURE E)
This installation is virtually identical to Figure D,except that the cost and leak protection of the levelpot is eliminated. The installed cost is lower bythis elimination, but the energy consumption canbe significantly higher due to live steam lossthroughout the heater life. All other character-istics of Figure D remain.
STEAM INLET CONTROL VALVE WITH
OUTLET CONDENSATE PUMP/TRAP
DRAINAGE (FIGURE F)
The installation in Figure A is a perfect design inwhich stall and hydraulic shock conditions do notoccur. However, for those severe conditions, Fig-ure A cannot be used, and the other designs ofFigures B through E were most likely developedto deal with them. Unfortunately and for the rea-sons explained above, those other designs are notalways optimal when dealing with stall. Figure Fprovides a suitable maximum benefit design forstall conditions.
The system utilizes a piece of equipment knownas pump/trap combination. This can be either asingle combined pump/trap unit, or employ twoseparate products in an engineered package. Usu-ally suitable for pressures up to 150 psig steam,pump/traps allow the system to adapt quickly todemand changes and drain condensate under allpressure conditions.
The design requires that inlet steam control is used.This is to provide for the most rapid adjustmentto demand changes possible. In an inlet steamvalve installation, the control valve adjusts thesteam pressure and temperature rapidly, as soonas the sensor detects a variance against the controlvalue. Condensate is always drained from the sys-tem by the pump/trap, so the exposed surface areais constant allowing the modulated steam pres-sure to equalize to the required load. The pump/trap has a multi-functional capability.
As a Trap. When the pressure differential of P1:P2is positive, the steam space pressure drives con-densate through the unit, and steam is containedby the included trap. Operation under these con-ditions is similar to Figure A.
As a Pump. When the pressure differential ofP1:P2 is negative, then the condensate fills thepump cavity and is pumped downstream beforethe process heater can be flooded. The result isthat the heater tubes are always exposed only tosteam and not to flooded condensate. The mainpoint is that only the small pump body receiveshigh pressure steam, not the entire process heateras occurs in Figures C, D, and E.
Where suitable to be employed, Figure F systemsof steam inlet control and pump/trap drainageminimize energy waste, high control variance,

Steam Digest 2002An Analysis of Steam Process Heater Condensate Drainage Options
27
corrosion, thermal shock, and stratification dur-ing production. When properly designed, theyalso drain the equipment during shutdown toavoid the high corrosion that occurs from stag-nant condensate. They can minimize fouling asthe steam temperature used is always the lowestpossible to achieve equilibrium with the de-mand. The motive steam used to pump thecondensate in the system is returned to the pro-cess heater to utilize its heat in the process. Thisguarantees an extremely low cost pumping so-lution while maximizing the production ratesof steam process heaters.
CONCLUSIONS
The author’s preference is for the drainage meth-ods of Figure A and Figure F as primary solutions,and then Figure B when neither of the first twoalternatives will meet the application requirements.In cases where neither Figures A, F, or B will meetthe application demands, then Figure D may beconsidered provided that the user accepts the limi-tations of this design.
ACKNOWLEDGMENTS
The PowerPoint graphics included with this pa-per were drawn by Mr. Tracy Snow and Mr. SteveKortheuer, both Sr. Engineers in TLV’s Consult-ing and Engineering Services Department.
REFERENCES
1. Mathur, Jimmy, 1973. “Performance of Steam Heat-Exchangers”, Chemical Engineering, September 3, pp.101-106.
2. McCarthy, Alfred J. & Smith, Brian, R., 1995. “ReboilerSystem Design: The Tricks of the Trade”, ChemicalEngineering Progress, May, pp. 33-47.
3. Mehra, Davinder K., 1985. “Troubleshooting Prob-lems With Heat Exchangers”, Chemical Processing, Au-gust, pp.36-38.
4. Pathak, Vijay K. & Rattan, Inder S., 1988. “TurndownLimit Sets Heater Control”, Chemical Engineering, July18, pp. 103-105.
5. Risko, James R., 1997. “Maximize Productivity FromSteam Process Heaters Through Proper CondensateDrainage”, TLV Design Guide.
6. Risko, James R., 1996. “Managing Steam Condensateis Key to Heater Efficiency”, Chemical Engineering, Julypp. 114-119.
7. Risko, James R., 1996. “Draining Condensate FromSteam Process Heaters”, Plant Engineering, March, pp.74-76.
8. Risko, James R., 1994. “Complete Condensate Drain-age From Equipment”, TLV Design Guide.
9. Risko, James R., 1988. “Handling Steam Conden-sate”, Plant Engineering, March 10, pp. 146-149.
10. Schwartz, Marvin P., 1982. “Four Types Of Heat Ex-changer Failures”, Plant Engineering, December 23, pp.45-50.


Steam Digest 2002Combustion Control Strategies for Single and Dual Element Power Burners
29
Combustion ControlStrategies For Single andDual Element PowerBurnersDavid C. Farthing, Federal Corporation
Today’s economic and environmental demandsdictate that we get the greatest practical efficien-cies from our plants. To do this we must have abasic understanding of what those efficiencies areand how we may implement them.
The use of more advanced automatic control sys-tems for combustion control has proven to be anexcellent example of systems and process automa-tion success. The new control systems availabletoday help improve overall combustion efficiencyand burner stability over varying loads and de-mands. The most sophisticated systems can elimi-nate the need for operator input during loadchanges while maintaining safe and reliable fuel-air ratio control.
THE COMBUSTION PROCESS
The most common fuels used in single burnercommercial and industrial boilers are natural gasand No. 2 oil. Both of these fuels consist of car-bon and hydrogen. Combustion is the rapid oxi-dation of the fuel to release the chemical heat en-ergy in the carbon and hydrogen. Stoichiomet-ric, or perfect, combustion occurs when the exactproportions of fuel and oxygen are mixed to ob-tain complete conversion of the chemical energyin the carbon and hydrogen to yield maximumheat energy. These ideal proportions of fuel andoxygen vary directly with the Btu content of thefuel. Too much excess oxygen cools the flame andincreases NO
X pollutants while too little oxygen
results in incomplete combustion and sooting ofthe furnace or delayed combustion, which can re-sult in a furnace explosion.
Because of the specific design restrictions or lagtimes inherent in current burner design, a certainamount of excess air (oxygen) is always requiredto insure complete combustion in the furnacechamber. These restrictions take the form of de-lays in fuel and air flow due to friction losses inpiping or lag times in the control elements. Ad-ditional influences may be in the form of site lo-cation elevation, the effects of combustion air tem-perature, humidity and availability, or fuel pres-sure and Btu content.
These design restrictions dictate some form of fuel-air metering control for safe and efficient com-bustion control. The systems available for thistask vary in sophistication from the simplest fixedposition control system to the elegant metered-cross limited fuel-air ratio control systems. Thispaper discusses the benefits of several of these sys-tems as they apply to single burner packaged boil-ers.
COMBUSTION STRATEGIES
Fixed Position Parallel ControlFixed position parallel control (FPC), also knownas direct of jack-shaft control, is perhaps the sim-plest form of combustion control found on power-burner boilers. This control strategy incorporatesa single positioning motor, which drives both thefuel and air positioning devices via an intercon-nected single mechanical linkage, the jack-shaft.
The simplicity of the FPC strategy makes it a veryeconomical choice for small burners with modestfiring rate changes. However, the fact that thefuel and air are fixed means that the fuel-air ratiois also fixed. Because of this fixed position ar-rangement the burner has no way to compensatefor environmental changes such as combustion airtemperature or fuel pressure. Additionally, theFPC strategy has no feedback to the control ele-ment to insure that the fuel and air end devicesare actually functioning and in the correct posi-tion. This could lead to a crossover condition inwhich the fuel crosses over the air flow and resultsin a fuel rich furnace or other burner efficiencyloses.
To help prevent a fuel rich furnace the FPC sys-tem is setup to allow additional excess oxygen tothe furnace, in the range of 4.5 to 8 percent. Inpractice the excess oxygen is normally set at 6-7percent to compensate for seasonal air tempera-ture changes. This excess air results in lower ther-
leuF cirolaCeulaV
/riAcirtemuloVlaedIoitaRleuF
saGlarutaN 0501-009.tFuC/utB
otriA.tFuC17.9leuF.tFuC1
liOleuF2.oN 000,041-831nollaG/utB
otriA.tFuC5531leuFnollaG1

Steam Digest 2002Combustion Control Strategies for Single and Dual Element Power Burners
30
Figure 1: Fixed Position Parallel Jack-Shaft combustion system with fuel-air ratio establishedthrough fixed mechanical linkages
Figure 2: Parallel Position

Steam Digest 2002Combustion Control Strategies for Single and Dual Element Power Burners
31
mal efficiency by burdening the burner withunnecessary air, which only serves to cool thefurnace and increase NO
Xproduction.
Parallel Positioning Control SystemsParallel positioning control (PPC) systems func-tion very much like a Fixed Position Parallel sys-tem except that the fuel and air end devices areseparated and driven by their individualpositioners. Modern electronic PPC systems in-corporate an end-device-positioning signal, whichensures the fuel and air positioners have moved totheir pre-specified positions for a specific firingrate. This signal, while not actually proving finalend device position and true fuel-air ratio flow, isa market improvement over FPC systems.
The new systems are gaining wide acceptance withmany users who have traditionally used FPC sys-tems and are seeking an economic means to im-prove overall combustion efficiency. The modernPPC system is suitable for boilers ranging from100 through 900 boiler horsepower operating withrelatively stable loads. Larger systems are also be-coming more prevalent.
Modern electronic positioning PPC systems canhold excess oxygen levels to within 3-4 percent onmany applications. It should be noted however,that when holding excess oxygen levels to theseminimums the PPC control strategy should beused with caution in applications with extremelyfast load swings. Controllers and positioners,which might be set too tight may not properly
respond and still maintain a safe fuel-air ratio onlarge and very fast upsets. This is due in part tothe lack of process variable feedback in the fuel-air system.
And like the FPC system, it is impossible for thePPC system to compensate for any changes in fuelor combustion air characteristics. Thus, issuessuch as fluctuations in fuel pressure, air tempera-ture or humidity will have adverse effects on com-bustion processing using this system.
Series Metered Control SystemThe series metered control (SMC) is common onlarger boilers (above 750 Bhp) where load changesare neither large nor frequent. In this applicationboth the fuel and the air are metered. The BoilerMaster regulates combustion air flow by settingthe air flow setpoint. The air flow controller thencascades the air flow signal to the fuel controlleras its remote setpoint. A ratio algorithm is ap-plied to the remote setpoint signal sent to the fuelcontroller to adjust the fuel-air ratio. The ratioalgorithm compares the remote setpoint cascadedto the fuel controller by the air flow and positionsthe fuel flow control valve to maintain the speci-fied ratio between the two.
This ratio algorithm has an inherent lag in it dueto the fact that the air controller is always direct-ing the fuel controller’s function; air always leadsfuel. This lag provides a desirable lean furnace ondemand rise, as the air controller must respond tothe Boiler Master before sending a remote setpoint
Figure 3: Series Metered Fuel-Air Ratio Control

Steam Digest 2002Combustion Control Strategies for Single and Dual Element Power Burners
32
to the fuel controller. However on a fast-fallingdemand the lag between the air controller and fuelcontroller can result in the air flow overshootingthe fuel flow resulting in a crossover-fuel rich fur-nace.
Because of this lag characteristic, the series con-trol system is only adequate for near steady stateconditions due to its inability to react to fast fall-ing load swings. To compensate for these pos-sible overshoots and lag times, excess oxygen lev-els in series control systems are normally set at 5-8 percent. The use of an oxygen trim system isthen incorporated to adjust the excess oxygen lev-els down to 3-4 percent during steady state opera-tion.
Significant improvements in the accuracy of theflowing process variables fuel and air, may be madeusing SMART temperature and pressure compen-sated transmitters, thus improving the overall ac-curacy of this and subsequent metered systems.
Figure 4: Metered Parallel Fuel-Air Ratio Control
Metered Parallel Positioning ControlBoilers operating at 1,000 boiler horsepower andabove commonly incorporate the metered paral-lel positioning control system. The metered par-allel positioning control (MPPC) operates the fueland air control loops in parallel (as opposed toseries) from a single setpoint generated by theboiler master controller. The combustion airsetpoint is ratioed which establishes the fuel-airproportions.
By allowing for customization of the fuel-air ratiothe amount of excess oxygen in the exhaust gasesmay be reduced to about 3-4 percent as opposedto the 5-8 percent normally found in the seriesmetered control strategy. In practice however, theexcess air is set at about 4.5-5 percent to compen-sate for barometric changes in air density. Theuse of an oxygen trim system is then incorporatedto adjust the excess oxygen levels down to 2.5-3percent during steady state operation.

Steam Digest 2002Combustion Control Strategies for Single and Dual Element Power Burners
33
The MPPC system relies on near identical re-sponse from both the air and fuel control loopsto prevent fuel rich or air rich mixtutres in thefurnace. The difficulty in maintaining this nearidentical response limits the application of theMPPC system to applications with modest de-mand swings.
Like the Series system, the traditional MPPC sys-tem does not have any feedback to the opposingflow controllers, i.e., fuel does not recognize airand air does not recognize fuel. This absence offeedback can result in a combustion imbalance onlarge or very fast load swings, resulting in either afuel-rich or lean furnace. To compensate for thelack of feedback found in the MPPC, these sys-tems are normally set-up with additional excessair to over compensate for fuel flow during setpointexcursions, thus maintaining an air-rich furnaceon transition.
Cross-Limited Metered ControlCross-limited metered parallel positioning con-trol, (a.k.a. cross-limited control (CLC) or lead-lag control (LLC)), improves on the MPPC strat-egy by interlocking the fuel-air ratio control
through high and low selectors. This interlockfunction prevents a fuel-rich furnace by forcingthe fuel to follow air flow on a rising demand,and forcing air to follow fuel on a falling de-mand.
The CLC system is a dynamic system, which eas-ily compensates for differences in response timesof the fuel and air end devices. This flexibilityallows its use in systems that experience suddenand large load swings, as well as very precise con-trol at steady state operation.
The CLC operates as follows. In steady state, thesteam demand signal, fuel flow and air flow sig-nals to the high and low selectors are equal. Upona demand increase the low selector applied to thefuel loop forces the fuel flow to follow the lowerof either the air flow or steam demand setpoint.Conversely on a falling demand the high selectorapplied to the air controller forces the air flow tofollow the higher or either the fuel flow or de-mand setpoint. This high/low selector functioninsures that the burner transitions are always airrich/fuel lean thus preventing a fuel rich furnaceenvironment.
Figure 5: Cross Limiting or Lead-Lag Fuel-Air Ratio Control

Steam Digest 2002Combustion Control Strategies for Single and Dual Element Power Burners
34
The cross-limited control system can easily main-tain excess oxygen levels in gas burners to 3-4 per-cent and 2.5-3 percent in No. 2 oil systems. Ad-ditionally, since fuel flow cannot increase (cross-limited) until air flow has begun to increase, fuelcannot overshoot air flow. The use of an oxygentrim system is then incorporated to adjust the ex-cess oxygen levels down to 2-2.5 percent duringsteady state operation.
Because of the CLC system’s capability for close tol-erance control, it is suited for all sizes of boilers,which can support the systems cost economically.Additionally the CLC system is readily adapted tooxygen trim control as well as being suited for lowNO
X burner applications.
REFERENCES
1. Mark’s Engineering Handbook, 7th Edition.2. American Gas Association Research Report 1509.3. Honeywell Industrial Controls.4. David. C. Fathing’s, “TechStuff”, www.federalcorp.com.5. Jack Schilling, Honeywell Peer-Review.

Steam Digest 2002Insulation Improves Economic Returns in Manufacturing
35
Insulation ImprovesEconomic Returns inManufacturingChristopher Russell, Alliance to Save Energy
If purchased fuel is the “currency” of an industrialplant’s energy budget, then mechanical insulationis one of its “savings” components. Just as savingshave a specific place in a financial plan for creat-ing wealth, so does insulation play a role in opti-mizing a plant’s valuable energy resources.
According to the U.S. Department of Energy’sBestPractices Steam program, mechanical insula-tion should be used on any surface over 120°F.Boiler surfaces, distribution mains, condensatereturn pipes and vessels, and hardware fittingsshould all be properly insulated to conserve ther-mal resources. Two tip sheets, part of a series ofBestPractices Steam tip sheets that currently num-bers 19, discuss the benefits of mechanical insula-tion and demonstrate the calculation of energysavings that it provides (see sidebar).
The value proposition is not the steam itself, butthe heat that steam provides. Steam can efficientlyand safely dispatch thermal resources from theboiler to multiple locations within a plant, usu-ally to locations appreciably distant from the steamsource. Plant managers depend on insulation notonly to conserve thermal resources throughout asteam system, but to enhance process stability,ensure personnel safety and to attenuate noise.
Two prime considerations are “whether the insu-lation is dry and snugly fitted, and whether thereis enough of it,” suggests Don Wulfinghoff, au-thor of the Energy Efficiency Manual. Moisturedrastically reduces the heat retention capabilitiesof insulation. But if the insulation system (insu-lation and protective jacketing) is properly speci-fied and installed for the steam application, mois-ture penetration will be reduced and the insula-tion system will remain effective indefinitely.
The performance of the insulation system is maxi-mized when the correct thickness is specified forthe application. Energy savings justify insulationup to a certain thickness, beyond which any addi-tional economic or energy savings may not beworth the cost. (See sidebar discussion.)
Sidebar DiscussionSidebar DiscussionSidebar DiscussionSidebar DiscussionSidebar Discussion
BestPractices Steam, a U.S. DOE initiative,generates references, diagnostic software, casestudies, and industry outreach events for thebenefit of the industrial steam community. Aseries of 19 steam tip sheets is available. Eachis one page, providing an overview of a steamimprovement opportunity and an example forcalculating its economic impact.
Two steam tip sheets are devoted to insulationuse: (1) Insulate Steam Distribution and Con-densate Return Lines and (2) Install RemovableInsulation on Uninsulated Valves and Fittings.
Determining the appropriate thickness for agiven mechanical component is addressed by3E Plus®, a free software tool developed bythe North American Insulation ManufacturersAssociation, and distributed by BestPracticesSteam.
An insulation energy appraisal performed by acertified insulation energy appraiser can pro-vide an energy user with a comprehensive as-sessment of the piping and equipment in a fa-cility and provide recommendations that willhelp save energy, and reduce fuel costs andgreenhouse emissions. The DOE has embracedthe insulation energy appraisal certificationtraining program available from the NationalInsulation Association.See www.insulation.org.
Readers are encouraged to visit the BestPracticeswebsite at www.oit.doe.gov/bestpractices.
Steam tip sheets and most other resources arefree of charge and may be downloaded fromwww.steamingahead.org/resources.htm ormay be requested from the BestPracticesClearinghouse:(800) 862-2086 [email protected].

Steam Digest 2002Insulation Improves Economic Returns in Manufacturing
36
Potential savings from insulation application andupgrades may reduce fuel consumption anywherefrom 3 to 13 percent, according to the U.S. DOE’sIndustrial Assessment Center program. Resultsare sometimes dramatic: a Georgia-Pacific ply-wood plant in Madison, Georgia upgraded theinsulation on steam lines to its dryers. This al-lowed the plant to reduce its steam load by 6,000pounds per hour and cut its fuel bill. The invest-ment paid for itself in six months.
A recent insulation energy appraisal was performedon a chemical plant in Kentucky. They had a nag-ging maintenance issue, and over the past five yearshad discussed and re-discussed the cost and valueof fixing and upgrading the insulation on theirdistribution lines. A $300,000 investment in in-sulation upgrades yielded a $700,000 savings infuel costs. Payback for the investment: three years.An added benefit was reduced emissions. (Seesidebar discussion on previous page).
By conserving thermal resources, insulation notonly saves money but also improves plant produc-tivity. In this sense, insulation makes money forthe plant. In addition, the expense relief that itprovides becomes a new source of cash that canbe applied to other processes in the plant, or tomarketing and administration. All of these ben-efits make insulation a priority for manufacturersin a competitive marketplace.

Steam Digest 2002Reduce Fuel Costs - Use the Proper Air-to-Fuel Ratio in Boiler Combustion
37
Reduce Fuel Costs - Use theProper Air-to-Fuel Ratio inBoiler CombustionChristopher Russell, Alliance to Save EnergyTony Tubiolo, Alliance to Save Energy
Do you know what the most common energy andcost saving opportunity in a steam system is? Ac-cording to the results of 41 steam plant audits per-formed by Enbridge Consumers Gas of Toronto,Canada, the answer is combustion improvement.The 41 audits, which frequently involved mul-tiple boilers in one plant, revealed a total of 45opportunities for combustion improvementprojects involving any or all of the following: boilertune-ups, combustion control repair, burner re-pair, and repairs to existing oxygen trim systems.With an average payback period of less than half ayear, optimizing steam system combustion is aproven and effective way to reduce operating costs.Combustion efficiency is also a subject addressedby one of a series of BestPractices Steam Tip Sheetsproduced by the U.S. Department of Energy(DOE) (see sidebar).
A simple, low-cost way of optimizing combustionis to maintain the proper air-to-fuel ratio in yourboiler operations. To completely combust the fuel,there needs to be a slight excess of oxygen, sincereal-life combustion conditions are never capableof achieving the perfect stoichiometric air-to-fuelratio. Too little air causes incomplete combus-tion of fuel resulting in excessive soot and firesidefouling, as well as an explosion hazard. Excess aircreates fireside fouling and sends thermal resourcesup the stack. Extremes in either direction createair pollution and costly inefficiency by wastingfuel.
Combustion improvements “are almost universallyrequired,” according to Bob Griffin, who leadsthe Enbridge Consumers auditing effort. A gen-eral rule of thumb is that boiler efficiency can beincreased by one percent for each 15 percent re-duction in excess air or 40°F reduction in stackgas temperature. The appropriate amount of ex-cess air for optimal combustion varies with thetype of fuel and burner in a system. The U.S.DOE’s BestPractices Steam program asserts thatfor well-designed natural gas fired systems, an ex-cess air level of 10 percent is attainable.
BestPractices Steam, a U.S. DOE initiative,generates references, diagnostic software, casestudies, and industry outreach events for thebenefit of the industrial steam community. Aseries of 19 steam tip sheets is available. Eachis one page, providing an overview and an ex-ample for calculating its economic impact.
The tip sheet entitled Improve Your Boiler’s Com-bustion Efficiency provides further details andan example of the savings realized by optimiz-ing a boiler’s air-to-fuel ratio.
An article that details the Enbridge Consum-ers steam audit findings is included in SteamDigest 2001, available for free by calling theBestPractices Clearinghouse (contact info be-low). Alternatively, the article may be down-loaded from http://www.oit.doe.gov/bestpractices/steam/pdfs/ecreport.pdf.
Readers are encouraged to download SteamTip Sheets and other resources, free of charge,from www.oit.doe.gov/bestpractices and fromwww.steamingahead.org/resources.htm.Printed copies may also be requested from theBestPractices Clearinghouse: (800) 862-2086or [email protected].
The first step in determining the proper amountof excess air is to measure the current amount ofoxygen in the flue gas. This can be done with agas absorbing test kit or an electronic flue gas ana-lyzer. Two additional measurements required arethe temperature of the flue gas and the tempera-ture of the air going into the boiler. Unless youhave an electronic tester that calculates the com-bustion efficiency based on these measurements,you will need to reference an efficiency table orgraph for the specific fuel being combusted. Com-bustion efficiency tables or graphs come with testequipment, are available in reference books, andare included in the BestPractices’ Steam SystemSurvey Guide, found online at:http://www.oit.doe.gov/bestpractices/steam/pdfs/steam_survey_guide.pdf.

Steam Digest 2002Reduce Fuel Costs - Use the Proper Air-to-Fuel Ratio in Boiler Combustion
38
CALCULATING THE OPERATING COST
SAVINGS
You can demonstrate the amount of money yourfacility will save by instituting a regular air-to-fuelratio measurement and adjustment practice foryour boiler(s). The general formula for show-ing the savings associated with optimized boilercombustion efficiency is as follows:
Cost Savings = Fuel Consumption x (1- E1/E2) x Steam Cost
…where E1 is the existing combustion efficiencypercentage and E2 is the optimized combustionefficiency percentage. A sample calculation canbe found on the BestPractices steam tip sheet en-titled Improve Your Boiler’s Combustion Efficiency(see sidebar for website and contact information).

Steam Digest 2002Safety Issues in Fossil Utility and Industrial Steam Systems
39
Safety Issues in FossilUtility and IndustrialSteam SystemsOtakar Jonas, Ph.D., P.E., Jonas, Inc.
This report presents results of recent surveys ofsafety issues in the fossil utility and industrial steamsystems. The boiler problem statistics are fromthe recent publications by the National Board [1,2] and the problems with other components aresummarized, based on our experience.
The U.S. National Board of Boiler and PressureVessel Inspectors reports that 296 power plantboiler-related accidents (including 56 injuries andseven deaths) occurred in 2001 [1]. Over a ten-year period (1992 – 2001), there was a combinedtotal of 23,338 accidents, including 127 fatalitiesand 720 injuries, reported for all power boilers,water and steam heating boilers, and unfired pres-sure vessels. The highest number of accidents oc-curred in 2000 (2,334) and the lowest number(2,011) occurred in 1998. However, the greatestnumber of both fatalities and injuries occurred in1999. The total number of deaths increased 40percent during the time period from 1997 to 2001as compared to 1992 to 1996 [2].
While the numbers may fluctuate each year, onemeasure of how the industry is faring can be foundin the injury-per-accident ratio. Since 1992, thisratio has ranged from one injury for every 99 ac-cidents in 2000 (the safest year) to one injury forevery 19 accidents in 1999 (the most dangerous).
The average ratio of injuries to accidents from1992 to 2001 is one injury for every 32 accidents[2].
Of the 23,338 incidents reported to the NationalBoard from 1992 to 2001, 83 percent were a di-rect result of human oversight or lack of knowl-edge (low water condition, improper installation,improper repair, operator error, or poor mainte-nance). Human oversight and lack of knowledgewere responsible for 69 percent of the injuries and60 percent of the recorded deaths [2].
Table 1 summarizes all of the accidents reportedto the National Board in 2001 for several types ofpressure vessels [1] and Table 2 gives details onthe causes of the power boiler incidents. Thesefigures underscore the importance of safety issuesin fossil utility and industrial steam cycles as wellas addressing damage mechanisms such as fatigueand corrosion, furnace explosions, fire hazards,handling coal and other fuels, electrical systems,lifting, transportation, and human errors.
What makes a damage mechanism a safety issue isa combination of an undetected slow-acting dam-age mechanism with a critical load (stress or stressintensity) that leads to a break before leak, a breakbefore vibration, or some other warning. Theproblems considered in this paper can be charac-terized as low frequency, high impact events. Ex-cept for the deaerator weld corrosion fatigue crack-ing, for which root causes are not known, the prob-lems are well understood and the engineering so-lutions and inspection and monitoring methodsare available [3 to 17]. It is mostly a question ofthe application of this knowledge.
lesseVfoepyT stnediccA seirujnI seitilataF
srelioBrewoP 692 65 7
maetS:srelioBgnitaeH 1901 0 1
)ylppusretawtohsedulcni(retaW:srelioBgnitaeH 136 01 0
slesseVerusserPderifnU 102 81 4
:slatoT 9122 48 21
Table 1: Summary of accidents occurring in 2001 for various types of pressure vessels [1]
Note: National Board survey based on a 75% response rate for National Board jurisdictional authorities and a 41% responserate from authorized inspection agencies. The total number of surveys mailed was 89, with a 64% response rate overall.

Steam Digest 2002Safety Issues in Fossil Utility and Industrial Steam Systems
40
Table 3 lists critical steam cycle components, theirdamage mechanisms, and influences. It also givesinformation on the experience with destructivefailures and their dollar impact [18, 19].
WEAKNESSES IN THE SAFETY CONTROL
An example of good safety control is the nuclearpower industry where there have been extensiveefforts in cycle and component design, develop-ment of material properties, component testing,field monitoring, and information exchange. Sev-eral organizations, including the Nuclear Regula-tory Commission, Institute for Nuclear PowerOperation, and Electric Power Research Institute,helped to achieve the current state of nuclear safety.
Such extensive research and organizational sup-port does not exist for the fossil utility and indus-trial steam cycles. Based on our experience withroot cause and failure analysis, the following weak-nesses in the industry’s handling of the safety is-sues can be identified:
Lack of knowledge and/or its application bydesigners, operators, and inspectors; particu-larly in industrial steam systemsOnly artificial determination of the rootcauses. An estimated 40% of the root causesare not correctly determinedMissing material data, particularly on creep –fatigue and fatigue – corrosion interactions
Table 2: Summary of incidents occurring in power boilers in 2001 [1]
tnedicnIfoesuaC stnediccA seirujnI shtaeD
evlaVytefaS 4 0 0
noitidnoCretaW-woL 161 3 0
slortnoCtimiL 8 0 0
noitallatsnIreporpmI 2 0 0
riapeRreporpmI 1 0 0
noitacirbaFrongiseDytluaF 2 0 0
ecnanetniaMrooPrororrErotarepO 28 05 7
eruliaFrenruB 92 2 0
noitagitsevnIrednU/nwonknU 7 1 0
latotbuS 692 65 7
Poor understanding of the effects of waterand steam chemistry and operation of equip-ment (cycling, transients, etc.) by investi-gators and operators
Examples of the deficiencies include a lack of in-formation exchange on safety issues in industrialsystems, unknown root causes of deaerator weldcracking, insufficient inspection requirements(only visual inspection of some critical piping,etc.), unknown fundamental mechanisms for fa-tigue, corrosion fatigue, and stress corrosion.
RECOMMENDATIONS
1. Equipment operators, inspectors, insurancecompanies, and designers should all addressthe safety issues.
2. The most effective safety control improvementwould be through a similar system used innuclear safety. A distinguished organizationsuch as ASME and API should assume theresponsibility.
3. An effective approach to achieve safety in asteam system includes training and a safety orcondition assessment audit (seew w w. m i n d s p r i n g . c o m / ~ j o n a s i n c /condition_assessment.htm).

Steam Digest 2002Safety Issues in Fossil Utility and Industrial Steam Systems
41
4. A “Safety Expert System”—a software pack-age, which could be customized for each steamcycle, should be developed.
5. ASME Boiler and Pressure Vessel Code sec-tions dealing with boiler and piping inspec-tions and defect evaluations need to be up-dated and more specific guidance for NDTand fitness for service evaluations should beprovided.
tnenopmoC 1 egamaDmsinahceM 2
secneulfnIrojaM 3 evitcurtseDseruliaF 4
tcapmI$ 5
]8ot6[gnipiPmaetS
peerC emit,erutarepmet,sdleW seY
01 7FCCL,FCL segnahcerutarepmeT
leetsnobraCnoitazitihparg
emitdnaerutarepmeT seY
ot6[sredaeHdnasmurD]8
,FCCL,FCLCCS
yrtsimehcretaw,ngised,gnilcycerutarepmeT oN 01 7
]01[sebuTrelioB 02(FCCL)srehto
.cte,xulftaeh,gnilcyc,yrtsimehcretaW seY 01 6
teWdnaretawdeeFot41,9[gnipiPmaetS
]61
CAF yrtsimehcretaw,ngiseD seY
01 7
noitativaC noitarepo,ngiseD seY
CCS yrtsimehc,ssertslaudiseR oN
FCCL,FC erutarepmet,yrtsimehcretaw,ytilauqdleWsegnahc
oN
,knaThsalF,rotareaeDmaetSdnaretaWtoH
]71,9[sdleW-slesseV
CCS,FC gnidlewlaudiser,)notsipretaw(ngiseDyrtsimehcretaw,noitarepo,sserts
seY 01 7
dnasretoRenibruTPL]31ot11,9[sksiD
CCS erutarepmet,sessertsngiseD n htgnerts-hgih,yrtsimehcmaets,leets
seY01 7
FC noitarbiv,ngised,yrtsimehcmaetS oN
11,9[sedalBenibruTPL]31ot
FCCCS
,gnittip,noitarbivngised,yrtsimehcmaetSleetshtgnerts-hgih,noisore
oN 01 6
,8[srotoRenibruTPI/PH]31ot11
FCL ngisedeugitaf,snoisulcni,gnilcyC seY 01 7
]31ot11[enibruT evitcurtseDdeepsrevO
gnikcits,)revoyrracreliob(yrtsimehcmaetSsevlav
seY 01 7 01- 8
]31ot11[enibruT gnibbuR ,gniraebtsurht,stisoped,yrtsimehcmaetSnoisnapxe
seY 01 7
Table 3: Critical steam components, their damage mechanisms, and influences
REFERENCES
1. 2001 National Board Incident Report. U.S. NationalBoard of Boiler and Pressure Vessel Inspectors.
2. “The Numbers are in … Ten Years of Incident ReportsUnderscore Human Error as Primary Cause of Acci-dents.” National Board Bulletin. Summer 2002.
3. G. Celedonia, et al. “Make Safety Performance Part of‘Business as Usual’.” Power, January/February 2001.
4. Fitness for Service. API Recommended Practice 579,January 2000.
1. Numbers in [ ] are References2. CF - Corrosion Fatigue, LCF - Low Cycle Fatigue, LCCF - Low Cycle Corrosion Fatigue, SCC - Stress Corrosion
Cracking, FAC - Flow-Accelerated Corrosion3. Age influences the degree of damage for all issues except the last two4. At least one destructive failure during the last 30 years5. Lost production and repairs per one event. The cost of lost production is typically much higher than the loss from
repairs with a ratio up to 10:1

Steam Digest 2002Safety Issues in Fossil Utility and Industrial Steam Systems
42
5. Handbook of Loss Prevention. Allianz Versicherungs-AG,Berlin/Munchen 1978.
6. Corrosion in Power Generating Equipment. EditorsMarkus O. Speidel and Andrejs Atrens. Plenum Press,New York, 1984.
7. Fatigue and Fracture, Volume 19. ASM Handbook, ASMInternational, Materials Park, OH, 1996.
8. R. Viswanathan. Damage Mechanisms and Life Assess-ment of High-Temperature Components. ASM Interna-tional, Metals Park, OH, 1989.
9. Low Temperature Corrosion Problems in Fossil Power Plants– State of Knowledge. EPRI, Palo Alto, CA. To be pub-lished.
10. B. Dooley and W. McNaughton. Boiler Tube Failures:Theory and Practice, Vol. 2: Water-Touched Tubes. Elec-tric Power Research Institute, Palo Alto, CA, 1996.
11. T. McCloskey, R. Dooley, and W. McNaughton. Tur-bine Steam Path Damage: Theory and Practice, Vol. 2:Damage Mechanisms. Electric Power Research Institute,Palo Alto, CA, 1999.
12. O. Jonas. “Corrosion and Deposition Problems in SteamCycle.” Power Station Chemistry 2000 Conference. May15-16, Queensland, Australia.
13. O. Jonas and B. Dooley. “Major Turbine Problems Re-lated to Steam Chemistry: R&D, Root Causes, and So-lutions.” Paper presented at 5th International Confer-ence on Cycle Chemistry in Fossil Plants, EPRI, Char-lotte, NC, June 10-12, 1997.
14. B. Chexal, et al. Flow-Accelerated Corrosion in PowerPlants. Electric Power Research Institute, Palo Alto, CA,1996. TR-106611.
15. O. Jonas. “Alert: Erosion-Corrosion of Feedwater andWet Steam Piping.” Power, February 1996.
16. O. Jonas. “Erosion-Corrosion of PWR Feedwater Pip-ing - Survey of Experience, Design, Water Chemistry,and Materials.” Report for U.S. Nuclear Regulatory Com-mission, NUREG/CR-5149, ANL-88-23, March 1988.
17. O. Jonas. “Deaerators: An Overview of Design, Opera-tion, Experience, and R&D.” Proc. of the American PowerConference, Vol. 49, A. 979, Ill. Institute of Technology,1987.
18. Cost of Corrosion in the Electric Power Industry. EPRI.Palo Alto, CA. October 2001. Report 1004662.
19. B. Syrett, et al. “Cost of Corrosion in the Electric PowerIndustry.” Materials Performance. Vol. 41, No. 3. March
2002.

Steam Digest 2002The Human Side of Energy Efficiency: The Value of Training
43
The Human Side of EnergyEfficiency: The Value ofTrainingRachel Madan, Alliance to Save Energy
When pursuing energy-efficiency projects, whatis the best way to proceed? It is fairly easy to dem-onstrate payback times for technical solutions suchas installing heat economizers, back-pressure tur-bines, or efficient motors. Is this technical over-haul sufficient? Perhaps changes in the manage-ment structure would be a better approach? Theanswer is that neither is effective without the other.Unfortunately, many plant managers concentratetheir efforts solely on technical improvements, ig-noring the tremendous savings that can arisethrough low-risk, low-tech solutions such as train-ing for proper maintenance and operation.
Plant managers may concentrate their efforts ontechnical innovations because these innovationshave greatly improved the energy-efficiency po-tential of industrial processes since the 1973 oilembargo. In fact, energy intensity (energy use perunit of production) in the manufacturing sectorfell steadily from 1973 to 1985, when it stabi-lized. Reductions in energy intensity increasedagain in 1993. Even so, facility managers cannotlook to technical solutions for all energy use prob-lems. In fact, many problems stem from lack oftraining related to system optimization or inef-fective training programs. Establishing an effec-tive, low-cost, low-tech training and maintenanceprogram within a plant can prevent the seeminglyendless cycle of fighting recurring problems. Bydevoting resources to solving the problems at hand,management investments in training can have afast payback and lasting results.
Unfortunately, the value of training, not only toimproving energy efficiency, but also to the bot-tom line, is often greatly underestimated. Train-ing is often perceived as a cost, not an investment.The value of training beyond its contribution toplant safety is often undervalued. Investing in atraining program will minimize costs, increaseprofit, and improve productivity and reliability.In fact, training is one of the most valuable in-vestments a company can make. A study con-ducted by the American Society for Training andDevelopment found that training investments
across all sectors could yield favorable financialreturns for firms and their investors. This studyfound that an increase of $680 in a firm’s train-ing expenditure per employee generates, on av-erage, a six percentage point improvement inTSR (total shareholder return) in the followingyear, even after controlling for many other im-portant factors.
Although there exists a general awareness of thebenefits of training to energy efficiency, this aware-ness does not seem to break through the barriersmanagers face when trying to implement trainingprograms. Why is this so? In many companies,energy efficiency is simply not a great concern ofthose controlling the funds for training. One ofthe largest barriers to implementing training is theunderestimation of its importance, both by man-agement and staff alike. Although training willgreatly help to improve the energy efficiency of aplant, perhaps a better way to express its value isto stress the other benefits of training: safety, reli-ability, productivity, and the financial bottom line.All of these cost-saving measures will help to curbenergy usage, even though their benefits go far be-yond the immediate benefits of energy efficiency.
Perhaps the most obvious and important benefitof training is improving the safety record of a plant.For example, Weirton Steel Corp. undertook a se-ries of training initiatives beginning in 1998, in-cluding safety-awareness training, hands-on work-station training, and certifying all plant supervi-sors in OSHA’s General Industry Standards. As aresult, recordable incidents fell 63 percent from1997 to 2000. In addition, other intangible fac-tors, such as attitude, improved. In 1997, only15 percent of Weirton Steel Corp. employees sur-veyed believed that their own actions could pro-tect their co-workers. In 2000, 60 percent be-lieved this to be true.
In addition, a properly trained staff is a large partof maintaining reliable equipment, which also in-creases productivity. For example, in 1990, U.S.Steel embarked on a comprehensive predictivemaintenance program to improve maintenancepractices and lower maintenance costs. The pro-gram focused on employee involvement, training,and team activity. Misalignments of rotatingequipment dropped from 15 percent in 1990 toonly one percent in 1996. Success such as this ledto the 1993 and 1995 National Maintenance Ex-cellence Award for maintenance and equipmentreliability.

Steam Digest 2002The Human Side of Energy Efficiency: The Value of Training
44
Such an increase in reliability will no doubt leadto improvements in productivity. An example ofthis is the predictive maintenance program at theFletcher Challenge Canada’s Crofton (British Co-lumbia) pulp mill. The Crofton mill embarkedon a preventative maintenance program by creat-ing a full-time maintenance systems specialist po-sition and a team of hourly employees to buildthe preventative maintenance process. This teamwas trained through both classroom and field ses-sions. The sessions covered the tools and tech-niques necessary to perform the inspections, aswell as why the inspections were necessary andwhat the benefits were from doing them. In justtwo years, the team met its goal of a 30 percentreduction in lost production due to breakdownsfrom the base year, translating into $3.54 million(Canadian) per year.
Lastly, training greatly impacts the bottom line.For instance, ICI, a British chemicals company,invested £100,000 (1992 prices) for direct train-ing costs, including training, employment of a full-time energy manager, and revenue expenditure onrepairs and minor improvements. The result wasa savings of over £500,000 (1992 prices) per year,an astounding ten-week payback period. In an-other example, a recently trained Hallmark Canadaemployee used his knowledge to develop an en-ergy efficiency project resulting in $32,000 (Ca-nadian) savings per year—a 1.6 year payback forthe cost of the project.
Obviously, there are many benefits to training –increased safety, reliability, productivity, and cost-savings for companies. Unfortunately, the mes-sage of training for energy efficiency is often over-looked when implementing a training program.It is important to extrapolate the benefits of anyenergy efficiency improvements to other areas ofthe company. For instance, training staff to imple-ment a steam trap maintenance program will in-crease the efficiency of a steam system—but moreimportantly, it will save the company moneythrough increased reliability and productivity ofthe system.
In order to implement a successful training pro-gram, managers must be committed, proactive,and supportive, both attitudinally and financially.The rewards are great for this kind of support.Successful training reduces accidents, improvesreliability, and improves efficiency, productivity,and the bottom line. Training must be treated asa fundamental requirement of comprehensivemanagement.

Steam Digest 2002Preliminary Results from the Industrial Steam Market Assessment
45
Preliminary Results fromthe Industrial SteamMarket AssessmentGlenn P. McGrath, P.E., CEM, Resource DynamicsDr. Anthony L. Wright, Oak Ridge National Laboratory
ABSTRACT
This paper discusses fuel use and potential energysavings in the steam systems of three steam inten-sive industries: pulp and paper, chemical manu-facturing, and petroleum refining. To determinethe energy consumption to generate steam in theseindustries, a combined top-down and bottom-upapproach was used. The top-down approach re-lied on data from the Manufacturing Consump-tion of Energy Survey (MECS) while the bottom-up approach assessed energy intensities of key pro-cesses and/or products in each industry. The re-sults of the top-down approach indicate that togenerate steam the pulp and paper industry used2,221 trillion Btu, the chemical manufacturingindustry used 1,548 trillion Btu, and the petro-leum refining industry used 1,676 trillion Btu.The results of the bottom-up assessments indicatethat these energy use estimates are reasonable. Todetermine the fuel savings available to each in-dustry from steam system improvements, expertjudgment was elicited. Preliminary results fromthe effort to determine potential steam system fuelsavings are discussed.
INTRODUCTION
The U.S. Department of Energy (DOE) Officeof Energy Efficiency and Renewable Energy(EERE) BestPractices efforts aim to assist U.S. in-dustry in adopting near-term energy-efficient tech-nologies and practices through voluntary techni-cal-assistance programs on improved system effi-ciency. There are nine industry groups—desig-nated Industries of the Future (IOFs)—that arethe focus of the OIT efforts. These IOFs includeAgriculture, Aluminum, Chemicals, Forest Prod-ucts, Glass, Metal Casting, Mining, Petroleum,and Steel. BestPractice efforts cover motor-drivensystems such as pumps and fans, compressed air,steam, and process heating systems.
The overall goal of the BestPractices Steam effortis to assist steam users in adopting a systems ap-
proach to designing, installing, and operatingboilers, distribution systems, and steam appli-cations. In June 2000, Resource DynamicsCorp., under contract with the Oak Ridge Na-tional Laboratory (ORNL) with funding fromDOE-OIT, initiated an Industrial Steam Sys-tem Market Assessment. Two of the major goalsof this Steam System Market Assessment effortwere: 1) to develop baseline data on steam gen-eration and use by the pulp and paper, petro-leum refining, and chemical manufacturing in-dustries; and 2) to develop baseline data on po-tential opportunities available for improving theenergy efficiency of industrial steam systems forthese three industries. This paper presents pre-liminary results from the steam market assess-ment effort.
STEAM GENERATION, USE IN THE PULP
AND PAPER, PETROLEUM REFINING, AND
CHEMICAL MANUFACTURING INDUSTRIES
Steam GenerationTo estimate the amount of fuel used to generatesteam for the pulp and paper, petroleum refining,and chemical manufacturing industries, we as-sessed data from Manufacturing Consumption ofEnergy Survey 1994 (MECS)[1]. MECS providesthe most comprehensive data for fuel use in theseindustries, reporting fuel use data at the 4-digitSIC level. However, many of the data are missingor are omitted due to several possible reasons, in-cluding disclosure of competitive information,insufficient statistical confidence, and inadequaterepresentation of data. Fortunately, in many in-stances, this data can be inferred using other tablesand/or applying assumptions about industry pro-cesses. We inferred this missing data, then assessedhow much fuel is used to generate steam.
MECS reports fuel use in three principal catego-ries: “Indirect Uses—Boiler Fuel”, “End use notreported” (EUNR), and “Conventional electric-ity generation.” EUNR data primarily consist of“Other” fuels, which account for energy that isnot included in the major energy source catego-ries. Common examples of other fuel are coke,refinery gas, and wood chips. We allocated thefuel use data from these principal categories basedon process characteristics of the pulp and paper,chemical manufacturing, and petroleum refiningindustries. For example, for the pulp and paperindustry, EUNR data is allocated entirely to boilerfuels due to the steam intensive nature of the ther-mal processes in that industry. In the chemical

Steam Digest 2002Preliminary Results from the Industrial Steam Market Assessment
46
industry, many production processes are direct-fired. For example, ethylene and propylene pro-duction require large amounts of fuel to fir py-rolysis furnaces. Similarly, in the petroleum in-dustry, there are several processes that use wastefuels both to generate steam and to provide directheating for other processes. To allocate the ap-propriate amount of “Other” fuel to steam gen-eration for the chemical manufacturing and pe-troleum refining industries, we determined theamount of fuel used in direct-fired applicationsin these industries [2]. We then subtracted thisfuel use from the “Other” fuel data.
Another component of fuel use that is includedin the industry total for generating steam is con-ventional electricity generation. MECS providesdata that indicate the amount of all on-site elec-tric generation that is cogenerated for each indus-try. Combining this data with the assumptionthat the energy available to generate steam is 65percent of the fuel used to generate electricity, pro-vides an estimate of the fuel allocated to steamfrom “Conventional Electricity Generation.” Theresults for these three fuel components are shownin Table 1.
To convert the fuel energy data into steam us-age, estimates of the conversion efficiencies arerequired. The average boiler efficiencies for eachindustry were determined based on the distribu-tion of fuel types [3] as indicated by MECS. Forexample, the combustion efficiency of boilers thatuse fuels such as bark and black liquor was esti-mated at 65 percent, while the combustion effi-ciency of boilers that burn coal was estimated at81 percent. Table 2 provides the result of thisconversion for these three industries.
Pulp and Paper Industry Steam UseEstimates of the process steam requirements of thepulp and paper industry are determined by a bot-tom up approach that evaluates the manufactur-ing processes. The basis for this approach usesthe typical energy requirements for integrated fa-cilities. Integrated facilities include all three ma-jor process steps—preparation, pulping, and pa-per or paperboard manufacturing—that are re-quired to manufacture finished paper and paper-board products from logs. Preparation is the pro-cess of converting logs into wood chips that aresmall enough to be sent into the pulping process.
Table 1: Energy Consumed to Generate Steam by Industry
CIS-sesUtceridnI
leuFrelioBtoNesUdnE
detropeR
lanoitnevnoCyticirtcelEnoitareneG latoT
repaPdnapluP 62 948 153,1 02 122,2
slliMpluP 1162 04 191 0 132
slliMrepaP 1262 954 116 51 580,1
slliMdraobrepaP 1362 882 335 6 728
stnemgeSrepaPdnapluPrehtO 26 61 0 87
slacimehC 82 922,1 481 721 045,1
enirolhCdnaseilaklA 2182 15 03 0 18
stnemgiPcinagronI 6182 01 01 0 02
slacimehCcinagronI 9182 101 32 1 621
sniseRdnascitsalP 1282 731 05 0 781
rebbuRcitehtnyS 2282 32 9 0 23
cisolullecnoN,srebiFcinagrO 4282 27 8 0 08
setaidemretnIdnasedurCcilcyC 5682 18 72 3 111
slacimehCcinagrO 9682 983 11 88 884
srezilitreFsuonegortiN 3782 27 31 1 68
stnemgeSlacimehCrehtO 392 3 43 033
muelorteP 92 403 323,1 74 576,1
gninifeRmuelorteP 1192 592 313,1 74 556,1
stnemgeSgninifeRmuelortePrehtO 9 11 0 02
Units are trillion Btus

Steam Digest 2002Preliminary Results from the Industrial Steam Market Assessment
47
Pulping is the process of obtaining fibers fromthe wood. Paper or paperboard manufacturingforms these fibers into final products. Table 3shows the range of thermal and electric energyuse for integrated plants [3].
Most paper and paperboard products can begrouped into 14 categories. Production processescan be allocated to these product categories. As-signing production processes—and the energy us-age associated with them—to these product classesprovides one way of estimating thermal energy usefor each product class [4].
In pulp and paper manufacturing, thermal energyis provided almost entirely by steam. Conse-quently, multiplying the thermal energy requiredfor each ton of product by the tons of productproduced determines the total amount of steamrequired by the industry. To determine the amountof fuel needed to generate this steam, a conver-sion factor must be applied. This conversion ac-counts for losses in burning the fuel, generatingthe steam, and distributing it to the end uses. Forthis report, a fuel to steam conversion efficiencyof 75 percent was assumed. As indicated in Table4, the total thermal energy requirement for the
Table 2: Estimated Steam Generation by Industry
CIS-sesUtceridnI
leuFrelioBtoNesUdnE
detropeR
lanoitnevnoCyticirtcelEnoitareneG latoT
repaPdnapluP 62 758,725 490,048 351,41 301,283,1
slliMpluP 1162 716,32 198,211 0 905,631
slliMrepaP 1262 299,872 283,173 004,01 477,066
slliMdraobrepaP 1362 803,771 341,823 070,4 025,905
stnemgeSrepaPdnapluPrehtO 939,74 876,72 0 103,57
slacimehC 82 772,148 259,521 843,88 775,550,1
enirolhCdnaseilaklA 2182 693,43 332,02 0 926,45
stnemgiPcinagronI 6182 078,6 839,6 0 808,31
slacimehCcinagronI 9182 298,96 450,61 409 158,68
sniseRdnascitsalP 1282 505,29 167,33 54 113,621
rebbuRcitehtnyS 2282 627,51 451,6 0 088,12
cisolullecnoN,srebiFcinagrO 4282 054,05 707,5 0 751,65
setaidemretnIdnasedurCcilcyC 5682 346,55 845,81 908,1 000,67
slacimehCcinagrO 9682 786,752 782,7 712,16 191,623
srezilitreFsuonegortiN 3782 598,05 981,9 409 889,06
stnemgeSlacimehCrehtO 312,702 180,2 864,32 267,232
muelorteP 92 250,702 360,109 696,23 118,041,1
gninifeRmuelorteP 1192 758,002 907,398 696,23 262,721,1
stnemgeSgninifeRmuelortePrehtO 691,6 353,7 0 945,31
Units are million lbs. of steam
slliMdetargetnIrofygrenEssecorPlamrehT lacirtcelE latoT
niM xaM niM xaM niM xaM
)etifluSdnatfarK(lacimehC 000,61 000,33 004,2 005,5 004,81 005,83
lacinahceM 000,8 000,52 005,6 002,71 005,41 000,24
lacimehc-imesetifluS 000,71 000,53 001,4 008,6 000,12 008,14
lacinahcemlamreht-imehC 000,9 000,52 005,7 004,61 005,61 004,14
Table 3: Thermal and Electric Energy Use for Integrated Pulp and Paper Plants
Thousand Btus/ton

Steam Digest 2002Preliminary Results from the Industrial Steam Market Assessment
48
pulp and paper industry was 1,980 trillion Btu.Applying a 75 percent conversion factor results inan estimated boiler fuel use of 2,640 (= 1,980/0.75) trillion Btu.
MECS indicates that the fuel used to generatesteam in the pulp and paper industry was 2,221trillion Btu (refer to Table 1), which is about 16percent less than the 2,640 trillion Btu estimate.Although many assumptions are built into thismodel, the relative agreement between these dataindicates that these assumptions are reasonable.
Petroleum Refining Industry Steam UseThe petroleum refining industry uses energy toconvert crude oil into many different products,some of which are used directly by consumers,while others are feedstocks for other industries.Petroleum refining uses a series of processes to pro-duce these products. Combining the energy re-quired by each process and the amount of prod-uct that was produced by each process providesan estimate of the total amount of energy used bythe industry. Additionally, the component en-ergy types, including direct-fired, electric, andsteam, can be disaggregated from the energy datafor each refining process [2]. This allocation al-
lows the total steam use within the industry tobe evaluated against the amount of fuel used togenerate steam as indicated by MECS.
Table 5 describes the average energy requirementsof the key refining processes by technology andcombines production estimates to calculate over-all industry energy use [5,6]. The total steam en-ergy use is estimated to be 1,071 trillion Btu. Ifthe steam system efficiency is 75 percent, then thefuel use that corresponds to this energy estimateis 1,428 trillion Btu.
To evaluate the accuracy of the “energy use by pro-cess” approach, recall that the MECS estimate forthe amount of fuel used to generate steam in thepetroleum refining industry was 1,676 trillion Btu.The resulting difference is 248 trillion Btu or about15 percent. In relative terms the “energy use byprocess” approach indicates that steam represents46 percent (= 1,071/2,333) of the total energy use,while MECS indicates that the fuel used to gener-ate steam represents about 53 percent of the in-dustry fuel use.
tcudorPybnoitpmusnoCygrenEnoitcudorP noitpmusnoCygrenElamrehT
)snottrohsdnasuohT( )sutBnoillirT(
tcudorP niM xaM evA
stcudorPrepaP
tnirpsweN 489,6 45 371 311
gnitrevnoc&gnitnirpdoowdnuorG 519,1 51 74 13
repapdetaoC 408,8 141 192 612
steehseerfdetaocnU 403,31 312 934 623
slotsirbdehcaelB 383,1 22 64 43
rebifnottoC 951 3 5 4
srepapnihT 941 2 5 4
eussiT 890,6 89 102 941
tfarkdehcaelbnU 803,2 03 96 05
gnigakcapytlaiceps,dehcaelB 714,2 93 08 95
draoBrepaP
draobrepaptfarkdehcaelbnU 864,22 292 476 384
draobrepapdehcaelbdiloS 920,5 08 661 321
draobrepaplacimehcimeS 349,5 101 802 551
draobrepapdelcyceR 382,21 321 233 722
latoT 212,1 537,2 479,1
Table 4: Pulp and Paper Thermal Energy Requirements by Product Type

Steam Digest 2002Preliminary Results from the Industrial Steam Market Assessment
49
Chemical Manufacturing Industry Steam UseThe chemical manufacturing industry uses en-ergy to manufacture over 70,000 products forconsumer and industrial markets. Although thechemical industry manufactures a wide range ofproducts, a relatively small number of them ac-count for most of the industry energy use. As aresult, evaluating the processes for manufacturingthese high energy-use chemical products can pro-vide a reasonable assessment of how much energy,specifically steam energy, is used [7,8].
As shown in Table 6, there are 20 chemical prod-ucts whose process steam energy requirements ac-count for 824 trillion Btu of steam.
This study used a 75 percent conversion efficiencyto account for losses in converting fuel to thermalenergy, generating steam and delivering it to theend uses. This conversion factor produces a fueluse estimate of 1,099 trillion Btu. Since MECSindicates that the chemical industry used about3,273 trillion Btu of energy [2], of which steamenergy accounts for roughly 1,548 trillion Btu,evaluating the process energy requirements ofthese 20 chemical products accounts for about71 percent of the total chemical manufacturingindustry steam use.
)sutBnoillirT(ygolonhceTybesUygrenE
ssecorPesUygrenEtinUegarevA
)lbb/sutBdnasuohT(
noitcudorPdnasuohT()yad/slbb deriFtceriD cirtcelE maetS latoT
noitallitsiDcirehpsomtA 411 485,41 383 3.21 1.642 7.146
noitallitsiDmuucaV 29 334,6 311 8.2 3.321 8.832
gnikaerbsiV 78 56 3 7.0 )3.1( 1.2
snoitarepOgnikoC 071 177,1 011 1.41 )4.9( 1.511
gnikcarCcitylataCdiulF 001 150,5 661 4.32 4.411 8.981
gnikcarcordyHcitylataC 042 162,1 26 2.81 6.33 9.311
gnitaertordyHcitylataC 021 219,7 202 6.45 0.212 7.864
gnimrofeRcitylataC 482 296,3 342 5.31 2.711 2.373
noitalyklA 573 751,1 - 9.01 5.931 4.051
noitaziremosI - - - -
enatubosI 953 101 - 4.0 4.21 8.21
enaxehosI/enatneposI 571 434 - 9.0 9.52 8.62
latoT 382,1 251 410,1 333,2
Table 5: Energy Use Requirements of Common Refinery Processes
DEVELOPING BASELINE STEAM
PERFORMANCE IMPROVEMENT
OPPORTUNITY DATA
To determine the potential savings from improv-ing steam system efficiency and performance, wedetermined that expert elicitation would be themost effective approach. Experts with experiencein the steam systems at multiple industrial facili-ties are able to provide data that is representativeof industry conditions. An optional approach isto survey a representative sample of industrial fa-cilities in the subject industries. However, steamsystems are often very expansive. Gatheringenough data to assess each system adequately—even in a representative sample of facilities—wouldbe prohibitively costly.
Effective expert elicitation requires asking the rightpeople the right questions. To find the rightpeople, we sought a set of qualified experts. Thesecontacts were made through:
The BestPractices Steam program,Referrals by other industry stakeholders, andIndustry research.

Steam Digest 2002Preliminary Results from the Industrial Steam Market Assessment
50
Prospective participants were contacted to de-termine their level of knowledge and experiencein the steam systems of the subject industries.After describing the objectives of this projectand assessing the qualifications of the prospec-tive participants, we requested qualified expertsto provide responses regarding estimates of steamsystem energy savings.
To ask the right questions regarding these savings,we developed a list of 30 performance improve-ment opportunities, which are listed below:
Minimize Boiler Combustion Loss byOptimizing Excess AirImprove Boiler Operating PracticesRepair or Replace Burner PartsInstall Feedwater EconomizersInstall Combustion Air PreheatersImprove Water TreatmentClean Boiler Heat Transfer SurfacesImprove Blowdown PracticesInstall Continuous Blowdown HeatRecoveryAdd/Restore Boiler RefractoryEstablish the Correct Vent Rate forDeaeratorReduce Steam System Generating PressureImprove Quality of Delivered SteamImplement an Effective Steam Trap Mainte-nance Program
Ensure Steam System Piping, Valves,Fittings, and Vessels are Well InsulatedMinimize Vented SteamRepair Steam LeaksIsolate Steam from Unused LinesImprove System BalanceImprove Plant Wide Testing and MaintenancePracticesOptimize Steam Use in Pulp and Paper Dry-ing ApplicationsOptimize Steam Use in Pulp and Paper AirHeating ApplicationsOptimize Steam Use in Pulp and Paper Wa-ter Heating ApplicationsOptimize Steam Use in Chemical ProductHeating ApplicationsOptimize Steam Use in Chemical VacuumProduction ApplicationsOptimize Steam Use in Petroleum RefiningDistillation ApplicationsOptimize Steam Use in Petroleum RefiningVacuum Production ApplicationsImproved Condensate RecoveryUse High Pressure Condensate to GenerateLow Pressure SteamImplement a Combined Heat and Power(Cogeneration) Project
The principal data that are necessary for assessingeach improvement opportunity are:
Table 6: Steam Energy to Make Selected Chemical Products
lacimehC CISnoitcudorP
)sblnoilliM(ygrenEmaetStinU
)bl/utB(
maetSlatoTygrenE
)utBnoillirT(ygrenElatoT)utBnoillirT(
enelyhtE 9682 435,44 596,7 343 604
ainommA 3782 887,51 260,5 08 472
enerytS/enezneblyhtE 5682 072,11 000,51 961 091
enerytsyloP 1282 026,7 321,2 61 71
edixordyHmuidoS/enirolhC 2182 870,52 909,2 37 791
lynivyloP/edirolhciDenelyhtEedirolhC
1282 818,41 846,1 42 43
enotecA/lonehP 5682 450,4 954,7 03 23
enelyXdna,eneuloT,enezneB 5682 811,82 243 01 21
mutcalorpaC 4282 805,1 196,9 6.41 81
etanobraCmuidoS 2182 255,02 386,2 55 97
rebbuReneidatubyloP 2282 055 485,1 9.0 01
rebbuReneidatuBenerytS 2282 794,2 940,2 5 7
rebbuRlytuB 2282 134 836 3.0 7
enaxeholcyC 5682 801,2 395,1 3 4
slatoT 428 782,1

Steam Digest 2002Preliminary Results from the Industrial Steam Market Assessment
51
Fuel savings,Percentage of facilities for which each op-portunity is feasible,Payback period, andReasons for implementing the opportunity.This response provides insight into why theimprovement opportunity is usually imple-mented.
We determined that the best tool to elicit expertknowledge regarding these opportunities was aquestionnaire. A questionnaire provides severaladvantages, including flexibility in devoting timeto complete it, allowing research, and permittingwrite-in comments. Before sending the question-naire to the experts, it was reviewed by a separategroup of industry stakeholders. The questionnairewas reviewed and modified until it met three im-portant objectives:
Is it user friendly?Are the questions unambiguously worded?Do the responses gather accurate and repre-sentative data?
The questionnaire was sent to 34 people whoagreed to participate. Nineteen of the participantsreturned the questionnaire with useful data. Af-ter the questionnaires were returned and the dataextracted, several different approaches were con-sidered to statistically evaluate the collected data.
There were also several approaches considered inpresenting the data. One method groups the databy industry; another presents combined data forall three industries. Although most of the expertsindicated that they have more experience in someindustries than others, there was little distinctionamong the estimates of the fuel savings, feasibilitypercentages, and paybacks for each industry.
Lower and upper uncertainty values characterizethe range of differences among the experts’ re-sponses. Lower and upper certainty values of 2.5and 97.5 percentile respectively were selected. Alarge difference between the upper and lower un-certainty estimates indicates that there was a widerange among responses of the experts. Conversely,a small difference indicated a relatively close agree-ment among the experts.
At the time this paper was prepared, the resultshave not received sufficient industry review to al-low presentation of the final data. However, wecan note the following, based on evaluation of theresults from the experts who participated:
Estimated fuel savings for the 30 identifiedperformance improvement opportunitiesranged from 0.6 percent to 5.2 percent;Percent of facilities for which the performanceopportunities are feasible ranged from threepercent to 31percent; andEstimated payback periods for the perfor-mance improvement opportunities rangedfrom three to 36 months.
CONCLUSIONS AND FUTURE EFFORTS
Once the full results of this effort have receivedsufficient industry review, a Steam System Mar-ket Assessment report will be prepared. This re-port will include the detailed results on steam gen-eration and use and steam system performance op-portunities available for the pulp and paper, pe-troleum refining, and chemical manufacturingindustries. These results will provide baseline datafor the key opportunities available for improvingindustrial steam system energy efficiency.
ACKNOWLEDGEMENTS
The authors acknowledge the financial supportprovided by the DOE EERE for this effort. Theyalso acknowledge the guidance and support of theBestPractices Steam Steering Committee and theBestPractices Steam Technical Subcommittee. Fi-nally, the authors acknowledge the efforts of theexperts who provided the data on industrial steamsystem performance improvement opportunities.
REFERENCES
1. Manufacturing Consumption of Energy 1994, EnergyInformation Administration, U. S. Department of En-ergy, December 1997.
2. 1992 Industrial Process Heat Energy Analysis, FinalReport no. GRI 96/0353, Gas Research Institute, Sep-tember 1996.
3. Scoping Study Pulp and Paper Industry, EPRI, Preparedby Giese & Associates, December 1988.
4. Directory of the Pulp, Paper, and Allied Trades,Lockwood Post, 1996.
5. 1992 Industrial Process Heat Energy Analysis, FinalReport no. GRI 96/0353, Gas Research Institute, Sep-tember 1996.
6. Oil and Gas Journal Online, http://ogj.pennnet.com/home.cfm, U.S. Refineries – State capacities for 1995 –2000.
7. Energy and Environmental Profile of the U.S. Chemi-cal Industry, U.S. Department of Energy, Office of In-dustrial Technologies, May 2000.
8. U.S. Chemical Industry Statistical Handbook 1999,Chemical Manufacturers Association, 1999.


Steam Digest 2002Results from the Industrial Assessment Center (IAC) Steam Tool Benchmarking Support Project
53
Results from the IndustrialAssessment Center (IAC)Steam Tool BechmarkingSupport ProjectDr. Anthony L. Wright, Oak Ridge National LaboratoryDr. Kurt Bassett, South Dakota State UniversityDr. Herbert Eckerlin, North Carolina State UniversityDr. Ahmad Ganji, San Francisco State UniversityDerek Hengeveld, South Dakota State UniversityDr. Richard Jendrucko, University of Tennessee, KnoxvilleDr. Dragoljub Kosanovic, University of Massachusetts, AmherstDr. Wayne Turner, Oklahoma State University
INTRODUCTION
The U. S. Department of Energy’s (DOE) Officeof Energy Efficiency and Renewable Energy(EERE) BestPractices effort is developing a num-ber of software tools to assist industrial energy us-ers to improve the efficiency of their operations.One of the software tools that have been devel-oped is the “Steam System Scoping Tool.” TheSteam Scoping Tool is an Excel spreadsheet thatcan be applied by industrial steam users to:a) evaluate their steam system operations againstidentified best practices; and b) develop a greaterawareness of opportunities to improve their steamsystems.
The Steam Scoping Tool was developed byBestPractices Steam (the Best Practices and Tech-nical subcommittee of BestPractices Steam); thetool was initially released in August 2000.
In June 2000, the Industrial Assessment Center(IAC) Steam Tool Benchmarking Support projectwas started. DOE IACs provide energy, waste,and productivity assessments at no charge to smallto mid-sized manufacturers. These assessmentshelp manufacturers maximize energy efficiency, re-duce waste, and improve productivity. The as-sessments are performed by teams of engineeringfaculty and students from participating universi-ties/IACs across the United States.
The IAC Steam Tool Benchmarking Supportproject had three main tasks:
Task 1: Compile steam system benchmarkingdata from past IAC steam assessments;
Task 2: Perform one-day focused steam systemassessments to test new steam assessmenttools and to develop new steambenchmarking data; and
Task 3: Document the results of the Task 2 ef-forts.
Six IACs participated in this project:
University of Massachusetts, Amherst;North Carolina State University;Oklahoma State University;San Francisco State University;South Dakota State University; andUniversity of Tennessee, Knoxville.
This paper summarizes the results for the key ef-forts of the project—the results from the 18 steamsystem assessments, and the results of the evalua-tions of the Steam System Scoping Tool.
RESULTS FROM THE 18 IAC STEAM
SYSTEM ASSESSMENTS
Each of the six IACs performed three one-daysteam system assessments in industrial plants. Aspart of the effort to perform these assessments,two BestPractices Steam assessment tools were uti-lized:
a. The Steam System Scoping Tool; andb. The Steam System Survey Guide. This guide
(presently in draft form) has been developedby Dr. Greg Harrell from the University ofTennessee, Knoxville. It is a reference docu-ment that provides a technical basis for iden-tifying and assessing many potential steamsystem improvement opportunities. Althoughthe Survey Guide was provided to the IACsto use as a resource, the main focus of thisproject was to evaluate the usefulness of theSteam Scoping Tool.
Table 1 lists the industrial plant types for the one-day steam assessments. The IACs obtained an-nual data on the fuel cost to produce steam for 15of the assessed plants. These annual fuel billsranged from about $79,000 to $14,800,000 peryear; the average for the 15 plants was about$1,600,000 per year.
The key activities associated with each of the 18steam assessments were the following:
a. Working with the plant staff to obtain answersto questions in the Steam Scoping Tool;

Steam Digest 2002Results from the Industrial Assessment Center (IAC) Steam Tool Benchmarking Support Project
54
b. Performing the individual steam assess-ments;
c. Documenting the results of each of the in-dividual steam assessments in summary re-ports; and
d. Documenting the results of each of the com-pleted Steam Scoping Tool evaluations.
Individual summary reports were prepared for eachof the 18 steam assessments. In addition, com-pleted Steam Scoping Tool spreadsheets for eachof the plant assessments were prepared.
Steam improvement opportunities, cost savings,implementation costs, and anticipated paybackswere identified for each of the 18 steam assess-ments. Eighty-nine improvement opportunitieswere identified. Sixty-eight of the identified im-provements had yearly savings less than $20,000per year; 21 of the identified improvements hadyearly savings greater than $20,000 per year.
The total identified annual energy savings fromthese assessments was $2,800,000; the averageyearly savings for each of the identified 89 im-provements was about $31,500 per year. The to-tal identified implementation cost for the 89was about $1,600,000; the average overall pay-back for the 89 improvements was about sevenmonths.
Table 2 shows data for annual fuel costs to pro-duce steam and annual identified savings, as a per-cent of annual fuel costs, for the 18 steam assess-ments. For eight of the assessments, annual iden-tified savings were greater than nine percent ofthe annual fuel costs. The average identified en-ergy savings for the 18 steam assessments was 12.5percent of the individual plant energy bills.
The Steam System Scoping Tool [1] includes sevenworksheets associated with identifying steam sys-tem improvement opportunities:
a. Introduction;b. Steam System Basic Data;c. Steam System Profiling;d. Steam System Operating Practices – Total
Steam System;e. Steam System Operating Practices – Boiler
Plant;f. Steam System Operating Practices – Distri-
bution, End Use, and Recovery; andg. Summary Results.
stcudorPyehWdnaeseehC
slacimehC
)2(sreniatnoCdetagurroC
ytilicaFgniyDcirbaF
recudorPdooFnezorF
sgnidluoMdoowdraH
srezitinaSdnasdnuopmoCgninaelClairtsudnI
setaidemretnIlacimehCcinagronI
)3(stnalPrepaPdnapluP
rebmuLdoowdeR
seriTrebbuR
rerutcafunaMtraCgnippohS
spuCmaoforytS
selitxeT
gniroolFlyniV
Table 1: Plant types for the 18 IAC steambenchmarking support steam assessments
tnalP ottsoCleuFlaunnA)$(maetSecudorP
sgnivaSygrenElaunnAlaunnAfotnecrePsa
tsoCleuFmaetS
1 049,235$ %8.1
2 132,975,1$ %6.2
3 268,751$ %4.3
4 855,162$ %3.4
5 193,166$ %6.4
6 222,371$ %6.5
7 000,097,41$ %0.6
8 421,442$ %2.6
9 040,131,3$ %7.6
01 799,422,1$ %0.7
11 000,000,1$ %4.9
21 439,87$ %3.01
31 197,631$ %9.31
41 733,514$ %4.51
51 086,447,1$ %2.02
61 988,381$ %3.52
71 610,916$ %5.33
81 000,654,1$ %2.94
Table 2: Annual fuel cost to make steam andidentified annual energy savings as percent ofannual steam fuel cost, for the 18 IAC steamassessments.

Steam Digest 2002Results from the Industrial Assessment Center (IAC) Steam Tool Benchmarking Support Project
55
A steam user has to answer 26 questions to com-plete the Steam Scoping Tool; the maximum scorethat can be achieved in completing the Steam Tool(100 percent) is 340 points. Figure 1 illustratesthe individual plant scores achieved for the IACsteam assessments. The individual plant scoresranged from a low of 37.1 percent to a high of85.9 percent.
Table 3 shows average question responses and stan-dard deviations of question responses for the IACsteam assessments. The results shown in Table 3illustrate the following:
a. For three of the general areas—Steam SystemProfiling, Boiler Plant Operating Practices,and Steam Distribution, End Use, and Re-covery Operating Practices—the average over-all score was about 50 percent. For example,out of 90 points available for Steam SystemProfiling, the average score for the 18 IACsteam assessments was 44 points;
b. The highest scores were achieved in the areaof Steam System Operating Practices—out of140 available points the average score was 102points (about 73 percent);
c. The scores varied the most (highest relativestandard deviation) for the Steam System Pro-filing area—for this area, the standard devia-tion of responses was 28 points out of theavailable 90 points. This suggests that theplants differed the most in their responsesto the Steam Profiling questions.
STEAM SCOPING TOOL EVALUATION
RESULTS
The IACs prepared an individual summary re-port for each of the 18 steam system assessments.In addition, each participating IAC prepared aseparate report summarizing the overall resultsof each of their efforts.
A key part of the Steam Scoping Tool evaluationreports was to identify the following types of in-formation:
a. How useful was the Steam Scoping Tool tothe plant personnel?
b. How can the Steam Scoping Tool be im-proved?
c. How can the usefulness of the Steam ScopingTool to plant personnel be improved?
All of the individual evaluation comments on theSteam Scoping Tool have been reviewed, and manyof the suggested improvements will be includedin the next release of the Steam Scoping Tool.Some of the key comments made by the IACs aresummarized below:
a. A number of the IACs indicated that the ques-tion on Options for Reducing Steam Pressure(PR1) needs to be improved. Many facilitieswill not have the option of reducing pressureusing backpressure turbines, and the SteamTool should reflect this.
Figure 1: Steam System Scoping Tool total scores from IAC steam assessments
0%10%20%30%40%50%60%70%80%90%
100%
Individual Plant Scores
Tot
al s
core
(%)

Steam Digest 2002Results from the Industrial Assessment Center (IAC) Steam Tool Benchmarking Support Project
56
SNOITSEUQDNASAERALOOTGNIPOCS ELBISSOPEROCS
CAI,EGAREVASESNOPSER
,NOITAIVED.DTSSESNOPSERCAI
GNILIFORPMETSYSMAETS.1
STSOCMAETS
maetSetareneGottsoCleuFerusaeM:1CS 01 7 5
maetSetareneGottsoCleuFdnerT:2CS 01 6 5
SKRAMHCNEBTCUDORP/MAETS
skramhcneBtcudorP/maetSerusaeM:1MB 01 4 5
skramhcneBtcudorP/maetSdnerT:2MB 01 4 5
STNEMERUSAEMMETSYSMAETS
ygrenElacitirCmetsySmaetSdroceR/erusaeM:1SMsretemaraP
03 81 9
swolFmaetSgnirusaeMfoytisnetnI:2SM 02 5 7
EROCSGNILIFORPMETSYSMAETS 09 44 82
SECITCARPGNITAREPOMETSYSMAETS.2
ECNANETNIAMPARTMAETS
secitcarPecnanetniaMparTmaetS:1TS 04 42 7
MARGORPTNEMTAERTRETAW
nemtaerTretaW:1TW — noitcnuFgnirusnE 01 8 3
stisopeDedisretaW/ediseriFrelioBgninaelC:2TW 01 9 3
setaRnwodwolBmottoB/poT,SDTrelioBerusaeM:3TW 01 8 4
NOITALUSNIMETSYS
tnalPrelioB—noitalusnI:1NI 01 9 3
yrevoceR/esUdnE/noitubirtsiD—noitalusnI:2NI 02 41 8
SKAELMAETS
netfOwoH—skaeLmaetS:1KL 01 6 5
REMMAHRETAW
netfOwoH—emmaHretaW:1HW 01 8 3
.SPOMETSYSMAETSEVITCEFFEGNINIATNIAM
tnempiuqEtnalPmaetStnatropmIgnitcepsnI:1NM 02 61 6
EROCSSECITCARPGNITAREPOMETSYSMAETS 041 201 81
SECITCARPGNITAREPOTNALPRELIOB.3
YCNEICIFFERELIOB
netfOwoH--ycneiciffErelioBgnirusaeM:1EB 01 6 4
O,erutarepmeTsaGeulF:2EB 2 tnemerusaeMOC, 51 9 6
riAssecxErelioBgnillortnoC:3EB 01 6 4
TNEMPIUQEYREVOCERTAEH
tnempiuqEyrevoceRtaeHrelioB:1RH 51 6 6
MAETSYRDGNITARENEG
ytilauQmaetSrelioBgnikcehC:1SD 01 3 4
NOITAREPORELIOB
lortnoCnwodwolBrelioBcitamotuA:1BG 5 3 3
smralAleveLwoL/hgiHrelioBfoycneuqerF:2BG 01 9 2
snoitautculFerusserPmaetSrelioBfoycneuqerF:3BG 5 4 2
EROCSSECITCARPGNITAREPOTNALPRELIOB 08 54 31
SECITCARPGNITAREPOYREVOCER,ESUDNE,NOITUBIRTSIDMAETS.4
sVRPHGUORHTWOLFMAETSEZIMINIM
erusserPmaetSgnicudeRrofsnoitpO:1RP 01 5 3
ETASNEDNOCELBALIAVAEZILITUDNAREVOCER
etasnednoCelbaliavAgnizilitUdnagnirevoceR:1RC 01 8 3
ETASNEDNOCERUSSERP-WOLEKAMOTMAETSERUSSERP-HGIHESU
maetShsalFelbaliavAgnizilitUdnagnirevoceR:1SF 01 1 3
SECITCARPYREVOCER,ESUDNE,NOITUBIRTSIDEROCS
03 41 6
EROCSLOOTGNIPOCSMAETSLATOT 043 502 74
)%(EROCSLOOTGNIPOCSMAETSLATOT %06 %41

Steam Digest 2002Results from the Industrial Assessment Center (IAC) Steam Tool Benchmarking Support Project
57
b. Many of the plant personnel who com-pleted the Steam Scoping Tool felt that ithelped them to understand areas where theycould improve their steam systems.
c. A number of the plant personnel indicatedthat they would not have completed the SteamScoping Tool if they had not been selected tohave a free steam system assessment. The re-sponses from the IACs suggest a number ofways to enhance the usefulness of the soft-ware tool; for example: 1) provide informa-tion on cost savings associated with differentimprovement opportunities; 2) provide feed-back to steam users, after they complete theTool, providing more details on how improve-ments can be made; and 3) provide plants withcorresponding summary results from otherplants to illustrate how their scores comparewith other similar plants.
d. A number of the IACs suggested that somemeasure of comparison be provided on therelative merits of different scoring ranges, e.g.300-340: excellent, 250-299: very good, etc.
e. Finally, a number of the IACs suggested thatimproving the overall formatting of the soft-ware tool would improve its usefulness.
SUMMARY AND CONCLUSIONS
In summary, this was a successful project. Whenthe project was started, the Steam System ScopingTool was about to be released, and there was nomeasure of how useful the software tool would befor assessing steam systems or where the softwaretool could be improved. As a result of the project,a number of areas for improving the Tool and theusefulness of the software tool to steam users havebeen identified.
The results from the 18 steam system assessmentswill also prove valuable to the overall BestPracticesSteam effort.
ACKNOWLEDGEMENTS
The authors acknowledge the DOE EERE for pro-viding financial support for this effort.
REFERENCES
1. The Steam System Scoping Tool: Benchmarking Your SteamSystem Through Best Practices, Dr. Anthony L. Wright(Oak Ridge National Laboratory) and Glenn Hahn(Spirax Sarco Inc.), 23rd National Industrial EnergyTechnology Conference, Houston, TX, May 2001.


Steam Digest 2002ProSteam - A Structured Approach to Steam System Improvement
59
ProSteam - A StructuredApproach to Steam SystemImprovementAlan Eastwood, Linnhoff March Ltd.
ABSTRACT
Optimal operation of site utility systems is becom-ing an increasingly important part of any success-ful business strategy as environmental, legislativeand commercial pressures grow. A reliable steammodel allows a clear understanding of the systemand of any operational constraints. It can also beused to determine the true cost of improvementprojects, relating any changes in steam demandback to purchased utilities (fuel, power, and make-up water) at the site boundary. Example projectscould include improved insulation, better conden-sate return, increased process integration, newsteam turbines or even the installation of gas-tur-bine based cogeneration. This approach allowssites to develop a staged implementation plan forboth operational and capital investment projectsin the utility system.
Steam system models can be taken one step fur-ther and linked to the site distributed control sys-tem (DCS) data to provide real-time balances andimprove the operation of the system, providingan inexpensive but very effective optimizer. Sucha model ensures that the steam system is set in theoptimum manner to react to current utility de-mands, emissions regulations, equipment availabil-ity, fuel and power costs, etc. This optimizationapproach typically reduces day-to-day utility sys-tem operating costs by between 1-5 percent at nocapital cost.
WHY BUILD A STEAM SYSTEM MODEL?
On many operating sites, maybe even the major-ity of sites, production is king and the steam sys-tem is regarded merely as a service that is far lessimportant than the manufacturing processes them-selves. Consequently, even companies that investheavily in process modeling and simulation payfar less attention to the modeling of the steam sys-tem and, consequently, do not have the same un-derstanding of the key players, the sensitivities andthe interdependencies in this area.
Often, steam is assigned a unit value (dollarsper thousand pounds) that serves to cover theperceived costs of operating the utility systemwhen this value is apportioned across the vari-ous manufacturing cost centers. This value will,at best, represent an average cost of steam over aperiod of time and will often be inappropriateor downright misleading if used for evaluatingpotential projects.
A simple example would be a site that has a veryclose balance between suppliers and users at thelow-pressure steam level. Site management is per-haps considering a new project to reduce the low-pressure steam demand. If the project is evalu-ated at the accountant’s transfer figure of, say, $5per thousand pounds it may appear that the projectwill pay back handsomely. In reality, however, the“saved” steam may simply be vented as it has no-where else to go. The project will therefore savenothing at all and will even lead to the additionalcost of lost water and heat in the vent.
A reliable model that reflects what actually hap-pens within the steam system would identify thereal cost of the project and avoid this inappropri-ate capital spend.
The above example is rather simplistic but no lessvalid for all its simplicity. In real life, the actualcost of low-pressure steam is likely to be variable.It may take on a finite value initially as the firstamounts of steam are saved and then, at somepoint, the above situation applies and the value oflow-pressure steam reverts to zero or even a nega-tive value, as described. There may therefore be aspecific limit to the amount of steam that can besaved and further investment would be fruitless.It is obviously good to know what this limit is! Ifa proper understanding of the real marginal steamand power costs is obtained, then the present in-efficiencies in the system can be clearly identifiedand the correct investment decisions taken withconfidence.
The true marginal cost of steam at any time andplace in the system will depend on the actual paththrough which the steam passes on its way fromgenerator to consumer. Medium- or low-pressuresteam that is simply produced via letdown fromthe high-pressure boilers will have the same costas the high-pressure steam. On the other hand, ifthe medium- or low-pressure steam is exhaustedfrom a steam turbine, then the unit cost of thatsteam will be less than that of high-pressure steambecause of the credit associated with the genera-tion of shaftwork in the turbine.

Steam Digest 2002ProSteam - A Structured Approach to Steam System Improvement
60
Also, live steam for process use will have a highervalue than the same steam used indirectly in heatexchangers because the latter can obtain credit forthe condensate returned to the boilers.
Finally, the time of day is increasingly affectingthe cost of steam as power tariffs become increas-ingly complex following deregulation of the elec-trical power industry.
Initial reasons for building a model of the steamsystem could, therefore, be:
To calculate the real cost of steam under vari-ous operational scenariosTo identify current energy lossesTo accurately evaluate project savingsTo forecast future steam demand versus pro-ductionTo identify the critical areas, sensitivities andbottlenecks within the systemTo identify no-cost operational improvementsTo evaluate tariffs and energy contract man-agementTo target and report emissionsTo form the basis of a consistent investmentplan for the site
This paper will go on to show that many otherbenefits, including the optimization of steam sys-tem operation, can be obtained from such a model.
WHAT TYPE OF MODEL IS AVAILABLE?
Many companies have made a good attempt atspreadsheet-based steam system modeling. Al-though these in-house models are invariably re-stricted to mass flow balances and flowrate-basedpower generation formulae, they represent a sig-nificant advance on nothing at all. They have theadvantages of spreadsheet operation (flexibility,transparency) but are often limited by the spread-sheet skills of the utility engineer. Also, they can-not simultaneously reconcile mass and heat bal-ances such as those required around deaerators.Perhaps their biggest drawback is that they are of-ten only understood by the engineer who builtthem in the first place.
At the other end of the range is the full-blownprocess simulator, which is perfectly capable ofmodeling the utility system. The drawbacks inthis case are the cost (large annual license fee) andthe lack of transparency of the model. This is par-ticularly important when changes and upgrades
are required to be made to the model. The struc-ture of the model may also be too rigid to allowrapid evaluation of a number of possible futurescenarios.
A third type of model is that which looks and feelslike a spreadsheet but, at the same time, has directaccess to the whole range of steam and water prop-erties through an add-in physical properties data-base. As well as taking advantage of all the ben-efits of spreadsheet operation, it yields a true si-multaneous balance of mass, heat and power inthe system. It also offers consistency between dif-ferent users company-wide, and can be linked eas-ily to the site’s data historian for real-time calcula-tions.
Good software packages in this category shouldalso include drag and drop options for creatingthe utility flow diagram initially and pre-pro-grammed equipment models to ensure that ap-propriate and consistent data are inputted andoutputted around each equipment item and eachheader. Figure 1 illustrates a simplified model ofa large site steam system including boilers, gas andsteam turbines and three pressure levels of steam.
HOW CAN I USE THE MODEL?
There are essentially two distinct types of modelor model applications that are relevant to this pa-per; the planning model described earlier and anoptimizer, which is constructed and used some-what differently to the planning model. Theseare described below:
1. The planning model allows the engineer toevaluate potential projects, what-if scenariosand future production trends. Typically, thisinvolves building the model with the conven-tional spreadsheet logic functions, e.g. “IF”statements, to replicate the way in which theplant control system operates. In this way,the model will simulate the present behaviorof the system. This type of model can also belinked to the site data historian to producereal-time models and to flag up deviationsfrom an optimum template. Such a modelwill generally contain two worksheets. Thefirst is a top-down balance based upon plantreadings (which is usually more reliable at thehigh-pressure level) and the second is a bot-tom-up balance based upon the actual pro-cess demands. This allows the actual steambalance at any time (the top-down model) tobe compared to an ideal template (bottom-

Steam Digest 2002ProSteam - A Structured Approach to Steam System Improvement
61
up model) for that mode of process opera-tion/steam demand. Differences can behighlighted and the appropriate action takenby the operator.
2. An optimizer model which will identify theleast cost mode of utility plant operation un-der different scenarios (production rates,power tariffs, etc). This differs from the plan-ning model in that it automatically switchesequipment items on and off within the modelto arrive at the true optimum. Dependingon the number of degrees of freedom in oper-ating the system (alternate drives for rotatingequipment, choice of different equipmentitems, let-downs and vents), the model is ca-pable of saving between 1-5 percent of utilitycost at zero capital cost. Simple models canuse Microsoft Solver to identify the optimumsettings for the system whereas more power-ful, advanced solvers are needed for more com-plex problems. This type of model is oftenused on-line at the control room level to im-prove hour-by-hour operation. Equally, it canbe used off-line for management to pre-de-termine how best to operate the utility sys-tem under future planned conditions (for ex-ample, on a weekly basis tied to anticipatedproduction, time of year and time of daypower tariffs).
Figure 1: Typical Site Steam Model
Figure 2 illustrates the first option, for off-lineproject planning.
This is a simple, single level steam system withseveral potential projects already incorporated butdeactivated in the base case. It indicates that thebase case operation costs $600,000 per year interms of fuel and water. Potential projects thatcan quickly be investigated with this model in-clude:
Improved condensate return (from 50-80 per-cent);Increased allowable TDS through continuousblowdown control;Blowdown flash steam recovery;Boiler blowdown to pre-heat boiler feedwater;andBoiler efficiency improvement (from 80- 85percent).
The model allows any or all of these modifica-tions to be calculated by simply ticking the boxalongside the project in the table at the right handside of the spreadsheet. Figure 3 shows that in-corporating ALL of the potential projects will re-duce the annual operating cost to $483,900, a sav-ing of $116,100 per year, or almost 20 percent.

Steam Digest 2002ProSteam - A Structured Approach to Steam System Improvement
62
Base Case ParametersSteam Generation Pressure 10 barg
Header Pressure 1 bargSteam Demand 10000 kg/hBoiler Efficiency 80%Boiler TDS Level 2000 ppmCondensate Return 50%Condensate Temperature 80 °CMake-Up Water Temperature 10 °CMake-Up TDS Level 300 ppmFeed Tank Pressure 0 bargDosing TDS Increase 69 ppmOperation 6000 h/yFuel Cost 9.47 $/MWh
Potential Improvement ProjectsCondensate Return 80%Allowable TDS 3500 ppmBlowdown Flash 0 bargBlowdown HX 10 °C approachBoiler Efficiency 85%
Base Case ParametersSteam Generation Pressure 10 barg
Header Pressure 1 bargSteam Demand 10000 kg/hBoiler Efficiency 80%Boiler TDS Level 2000 ppm
Condensate Return 50%Condensate Temperature 80 °CMake-Up Water Temperature 10 °CMake-Up TDS Level 300 ppmFeed Tank Pressure 0 bargDosing TDS Increase 69 ppmOperation 6000 h/yFuel Cost 9.47 $/MWh
Potential Improvement ProjectsCondensate Return 80%Allowable TDS 3500 ppmBlowdown Flash 0 bargBlowdown HX 10 °C approachBoiler Efficiency 85%
Potential projects ticked
Figure 2: Base Case (Existing) Steam Balance
Figure 3: Steam Balance After Inclusion of Projects

Steam Digest 2002ProSteam - A Structured Approach to Steam System Improvement
63
The value of the model here is demonstrated bythe fact that it is assessing the interactions betweenthe projects to arrive at the true saving. If theproject savings were calculated individually foreach project, the sum of the savings would appearto be greater than $116,100 per year because someof these projects are competing for the same en-ergy saving. The model therefore allows us to cal-culate the true, cumulative savings and, impor-tantly, to draw up a plan of staged investment sothat the projects can be ranked in order of attrac-tiveness and form the basis of a coherent invest-ment plan.
The above use of a steam model is typical of theoff-line, planning application. It essentially tellsus how the system will react to certain future op-erational scenarios whether they are future projects,new process demands or new energy prices. Themodel is essentially operating as a simulator to re-flect the behavior of the system as it is presentlyconfigured.
If there are a number of degrees of freedom avail-able to the utility system operator (steam turbineor electric motor drive, variable load turbo-gen-erators, or even intentional steam venting), then amodel can be constructed that doesn’t simply pre-dict the behavior of the existing system in a par-ticular configuration but actually tells us which isthe optimum system configuration we should beemploying. This is referred to in this paper as theoptimizer model.
Figure 4 illustrates a simple system with somebasic degrees of operational freedom.
It shows a utility system that contains a processdrive (500kW) that can be either an electric mo-tor or condensing turbine, a variable extraction/condensing turbo-generator and the ability to ventlow-pressure steam. The base case operationshown here is for a power-to-heat ratio of 4:1. Inother words, a megawatt of purchased electricalpower costs four times as much as a megawatt offuel. Under these conditions, the optimum pro-cess drive is the electric motor and condensing inthe main turbo-generator should be zero. In real-ity, it may not be possible to reduce the condens-ing flow to zero for mechanical reasons—this issimply an illustration. Hourly cost of operationis calculated to be 54.2 cost units per hour.
Now consider the possibility of the power:heat costratio increasing to a value of 6:1, perhaps becauseof high electricity costs at particular times of day(time-of-day tariff ). Under these conditions, wecan input the figure of 6:1 and press the optimizerbutton in the model. Figure 5 illustrates the in-put/output screen of the model.
This immediately flags up operator instructionsto switch on the condensing section of the turbo-generator and to switch to the steam turbine pro-cess drive. We are presented with the flow dia-gram in Figure 6 which indicates an hourly cost
Figure 4: Base Case Operation

Steam Digest 2002ProSteam - A Structured Approach to Steam System Improvement
64
1. Enter Current Operating Parameters
Operate LP Boiler 0Main Turbine Condensing Section 0Process Drive using Steam 0 6 :1Deliberate Venting 0
(0=Off, 1=On)
2. Run Optimiser
3. View Optimisation Report
Operating CostsCurrent 42.69Optimised 36.24Saving 15.1%
Equipment Operation Current OptimisedOperate LP Boiler Off OffMain Turbine Condensing Section Off OnProcess Drive using Steam Off OnDeliberate Venting Off Off No Change
Cost RatioPower:Fuel
Change?
Change RequiredNo Change
MWe:MW firedNew Electricity Price
Potential Savings by Changing Operation
Operator Actions
Change Required
Figure 5: Operator’s Screen
of 36.2 cost units which compares favorably withthe value of 42.7 which would be the case if theoperator action were not taken, a saving of 15%.This simple example illustrates the additionalfunctionality of the optimizer model over theplanning model. Whereas the planning modelallows us to assess the effect of project and pro-cess changes on the existing configuration of the
Figure 6: Optimum Operations at an Increased Power Cost
steam system, the optimizer model allows us tobe proactive in determining the best configura-tion of the steam system under present or fu-ture operating scenarios.
A planning model in the above example wouldhave evaluated the savings we could obtain underthe base case configuration and this would be the

Steam Digest 2002ProSteam - A Structured Approach to Steam System Improvement
65
value shown in Figure 5 as “current operatingcosts” (42.7 cost units compared to the base casecost of 54.2 in Figure 4). The optimizer hastaken this a step further and identified evenlower operating costs (36.2 cost units) by sug-gesting changes to the configuration of the steamsystem as indicated.
INDUSTRIAL CASE STUDY
Linnhoff March has built more than 100 steamsystem models in recent years and all of them haveidentified ways in which a system can be improved,either operationally or through capital projects.Many of these models have been created for largeoil refineries of which the following is a typicalexample.
Figure 7 shows a simplified drawing of a UK oilrefinery steam system.
The refinery low-pressure steam system containstwo separate sections. Due to site expansions, oneelement of the low-pressure system was in deficitand pulling large amounts of steam down from amuch higher pressure. The other element of thelow-pressure system was in surplus with regularventing of excess steam to atmosphere.
The almost trivial (in retrospect) solution of con-necting the two elements of the low-pressure sys-tem considerably improved the overall steam bal-ance (Figure 8). The relatively short crossover con-nection paid back within a matter of weeks.
Figure 7: Existing Refinery Steam Balance
Because of the complexity of operations on thesite, plant personnel had not previously spottedthis opportunity and it probably is not an isolatedexample. Building a model of the overall steamsystem for the first time allowed a consistent analy-sis to be carried out of the whole system ratherthan simply rely on local, ad-hoc improvements.
This type of modeling has been applied byLinnhoff March in over 100 site applications andoperational savings of between 1-5 percent havebeen achieved. When added to the benefits ofcapital project savings identified by the planningmodel, total energy savings regularly amount to15 percent.
BENEFITS
Many of the benefits of an accurate site steammodel have already been described in this paper.
To summarize, off-line planning models providethe following benefits:
Improved utility cost accountingMore reliable project screeningEnhanced understanding of the steam systemthrough the identification of key controllableparametersBetter contract management of purchasedutilities (fuels, electricity)Identification of no-cost operational improve-mentsReliable reporting of emissionsUtilities configuration planning (daily, weekly,monthly)

Steam Digest 2002ProSteam - A Structured Approach to Steam System Improvement
66
Figure 8: Improved Refinery Steam Balance
Basis for strategic investment “RoadMaps”On-line (open loop) systems can offer furtherbenefits:
Data validation and reconciliationOptimized utility system operation(hourly or daily basis)Plant performance monitoring
Cumulatively, these benefits can save 15 percentof current utility costs. This figure, of course, issomewhat dependent on the starting point for im-provement, i.e., the current state of understand-ing of the system. Even from a relatively sophisti-cated starting point, we have seen no-cost savingsof five percent in systems with six or more degreesof operational freedom.
CONCLUSIONS
Spreadsheet-based steam system models with abuilt-in physical properties database are a very cost-effective way of reducing the operating cost ofsteam generation and distribution and forming aconsistent basis for future investment strategies.
The cost of building an off-line planning modelwill range from less than $10,000 for a simple,single steam level system up to $25,000 or morefor a typical oil refinery or petrochemical com-plex. Converting such a base model to an on-lineoptimizer will roughly double the cost of themodel. The cost of the actual software packageon which the model is based is only a tiny frac-tion of the above costs.
Since potential benefits can be several milliondollars per year on a large, complex site thesemodels will pay back in a matter of weeks, if notdays.
Such tools should be more widely adopted by in-dustry for improved energy cost accounting andreduced operating costs with attendant reductionin the emission of greenhouse gases to the envi-ronment.
REFERENCES
1. JD Kumana, “Use Spreadsheet-Based CHP Models toIdentify and Evaluate Energy Cost Reduction Oppor-tunities in Industrial Plants”, 23rd IETC, Houston, May2001.
APPENDIX
ProSteam™ by Linnhoff March provides a num-ber of pre-formatted plant equipment models forsetting up site utility simulations. The model func-tions currently available are:
Steam TurbinesTrbn_A Single-Stage Steam Turbine model
(Mass flowrate specified).Trbn_B Single-stage Steam Turbine model
(Power generation specified).Trbn_A2 Two-Stage Steam Turbine model
(Mass flowrate specified).Trbn_B2 Two-Stage Steam Turbine model
(Power generation specified)

Steam Digest 2002ProSteam - A Structured Approach to Steam System Improvement
67
Trbn_A3 Three-Stage Steam Turbine model(Mass flowrate specified)
Trbn_B3 Three-Stage Steam Turbine model(Power generation specified)
Heat ExchangersHtExchngr_A Water/Steam heat exchanger
based on fluid conditionsHtExchngr_B Water/Steam heat exchanger
based on dutyHX_Process To Process/Process heat exchangerProcess U, A, Nshells & Cp specifiedHX_UA_ UA based heat exchanger - U,A,Exchanger LMTD & Ft specifiedHX_BFW UA Boiler feed water heater (Pro-Heater cess/Water exchanger)HX_Steam Steam Generator (process/water-Generator steam heat exchanger)HX_Ft Exchanger Ft factorHX_LMTD Exchanger LMDTHX_NoShells Exchanger - Number of ShellsHX_UA Exchanger UA (also Ft and
LMTD)HX_FlowFactor Flow Adjustment Factor - for
heat transfer coefficientCalc_Cp Specific Heat Capacity calcula-
tionCalc_CpMean Specific Heat Capacity (Mean)
calculation
Gas TurbinesGTurb_A Gas turbine modelGTurb_B Gas Turbine with varying air tem-
perature or injection steam condi-tions
FuelsFuel LHV Fuel Lower Heating ValueFuel Name Fuel NameFuel Descr Fuel Description
Boilers Blr_A Simple Boiler model. (A) Blr_B Simple Boiler model. (B) with firing
efficiency. Blr_C Advanced Boiler model with emis-
sions calculations.
CompressorsThermoComp_A Thermocompressor – Rating
model.ThermoComp_B Thermocompressor – Design
model.Cmprssr_A Single-Stage Compressor
model (Mass flowrate speci-fied).
Cmprssr_B Single -Stage Compressormodel (Power specified).
Cmprssr_A2 Two-Stage Compressor model(Mass flowrate specified).
Cmprssr_B2 Two-Stage Compressor model(Power specified).
MiscellaneousDrtr_A Deaerator model.DSprHtr_A De-superheater model (Inlet
Steam Flowrate Specified).DSprHtr_B De-superheater model (Outlet
Steam Flowrate Specified).FlshVssl_A Flash Vessel model.WaterPump_A Water Pump ModelLtDwnVlv_A Let-down Valve model.


Steam Digest 2002Steam System Improvements at Dupont Automotive Marshall Laboratory
69
Steam SystemImprovements at DupontAutomotive MarshallLaboratoryAndrew Larkin, P.E., C.E.M., Trigen-Philadelphia Energy Corporation
ABSTRACT
Dupont’s Marshall Laboratory is an automotivepaint research and development facility in Phila-delphia, Pennsylvania. The campus is comprisedof several buildings that are served by Trigen-Phila-delphia Energy Corporation’s district steam loop.In 1996 Dupont management announced that itwas considering moving the facility out of Phila-delphia primarily due to the high operating costcompared to where they were considering relocat-ing. The city officials responded by bringing thelocal electric and gas utilities to the table to nego-tiate better rates for Dupont. Trigen also requestedthe opportunity to propose energy savings oppor-tunities, and dedicated a team of engineers to re-view Dupont’s steam system to determine if en-ergy savings could be realized within the steamsystem infrastructure.
As part of a proposal to help Dupont reduce en-ergy costs while continuing to use Trigen’s steam,Trigen recommended modifications to increaseenergy efficiency, reduce steam system mainte-nance costs and implement small scale cogenera-tion. These recommendations included reducingthe medium pressure steam distribution to lowpressure, eliminating the medium pressure to lowpressure reducing stations, installing a back pres-sure steam turbine generator, and preheating thedomestic hot water with the condensate. Dupontengineers evaluated these recommended modifi-cations and chose to implement most of them.
An analysis of Dupont’s past steam consumptionrevealed that the steam distribution system sizingwas acceptable if the steam pressure was reducedfrom medium to low. After a test of the systemand a few modifications, Dupont reduced thesteam distribution system to low pressure. En-ergy efficiency is improved since the heat transferlosses at the low pressure are less than at the me-dium pressure distribution. Additionally, steamsystem maintenance will be significantly reducedsince 12 pressure reducing stations are eliminated.
With the steam pressure reduction now occurringat one location, the opportunity existed to installa backpressure turbine generator adjacent to theprimary pressure reducing station. The analysisof Dupont’s steam and electric load profiles dem-onstrated that cost savings could be realized withthe installation of 150 kW of self-generation.There were a few obstacles, including meeting theutility’s parallel operation requirements, that madethis installation challenging.
Over two years have passed since the modifica-tions were implemented, and although cost sav-ings are difficult to quantify since process steamuse has increased, the comparison of steam con-sumption to heating degree days shows a reduc-ing trend. Dupont’s willingness to tackle energyconservation projects without adversely affectingtheir process conditions can be an example to otherindustrial steam users.
INTRODUCTION
Dupont’s Marshall Laboratory has been an auto-motive paint research and development facility inPhiladelphia, Pennsylvania since the early 1900s.The first building was built in 1901, before it wasa Dupont site. Dupont has developed several au-tomotive paint innovations at this Philadelphiasite. While their primary R&D focus is the de-velopment of better automotive paints, DupontMarshall Lab scientists and engineers also workon other projects such as developing improvedcomputer printer inks.
Several buildings receive steam from Dupont’saboveground and buried steam distribution pip-ing. The Trigen steam loop supplies steam underthe streets of Philadelphia to Dupont Marshal Laband over 300 other customers, including the Uni-versity of Pennsylvania, the U.S. Mint, the Phila-delphia Art Museum, and most of the center cityhospitals. The majority of the steam is generatedfrom the Grays Ferry Cogeneration Plant, whichis a combined cycle (brayton cycle and rankinecycle) cogeneration plant that includes a dual fuel(gas and oil) combustion turbine generator and asteam turbine generator. This plant provides 150MW to the local electric grid operated by PJMInterconnection LLC, and can produce up to 1.4million pounds of steam/hour.
When Dupont notified city officials in 1996 thatit was considering moving their research and de-velopment facility to the south due to the high

Steam Digest 2002Steam System Improvements at Dupont Automotive Marshall Laboratory
70
cost of operating in Philadelphia, and energycosts were a significant component of their op-erating costs. The city responded by bringingthe local electric and gas utilities to the table tonegotiate better rates for Dupont. Since Dupontwas one of Trigen’s largest and most valued steamcustomers, Trigen dedicated a team of engineersto review Dupont’s steam system to determineif energy savings could be realized within thesteam system infrastructure.
STEAM SYSTEM RECOMMENDATIONS
After walking down the Dupont steam system andlistening to Dupont engineers describe how thesteam is used in different areas, Trigen recom-mended modifications to reduce heat transfer en-ergy losses, reduce steam system maintenance costsand implement small-scale cogeneration. Specificrecommendations included reducing the mediumpressure steam distribution to low pressure, elimi-nating the medium pressure to low pressure re-ducing stations, installing a backpressure steamturbine generator, and recovering the heat fromthe condensate. Dupont engineers and an inde-pendent energy consultant evaluated the recom-mended steam system modifications and decidedto go forward with them, except for the recom-mendation to preheat the domestic hot water.
Steam Distribution Efficiency GainDupont received steam from Trigen at 210 psig,and reduced it all to 150 psig in a pressure reduc-ing station. Some of this steam was used at 150psig for process use, and the rest was reduced to120 psig in another pressure reducing station tobe distributed to several buildings. The steam pres-sure was further reduced to 15 psig at 12 separatepressure reducing stations where the steam wasused for heating, humidification and domestic hotwater.
Since Dupont had received steam from the steamloop for several years, historical hourly steam con-sumption was readily available. Trigen meteredthe steam with a vortex meter and an automaticdata acquisition system that downloading the datato Trigen via modem. An analysis of Dupont’spast steam consumption showed that the steamdistribution piping system sizing was acceptableif the steam pressure was reduced from 120 psigto 15 psig. The basis for this determination wasto keep the steam velocity below 6000 feet perminute (fpm) to avoid excessive noise, prematurewear, and significant pressure drop. In a pro-
cess steam environment, a steam velocity as highas 12,000 fpm would be acceptable if noise isnot a factor, but a significant portion of thisMarshall Lab facility is office or research areaswhere noise would be a distraction. The steamvelocity can be calculated simply by using thefollowing equation:
V = 2.4QVs/A Equation (1)
Where:V = Velocity in feet per minuteQ = Flow in lbs/hr steamVs = Sp. Vol. In cu. Ft/lb at the flowing pressureA = Internal area of the pipe in sq. in. [1]
Given a maximum velocity of 6,000 fpm, themaximum steam flow throughout each sectioncould then be calculated. Dupont provided pip-ing drawings showing the diameter of each pipesection. Unfortunately the exact steam flow toeach building was not known since there were nosubmeters. However, in all cases, the calculationof the maximum allowable steam flow in each sec-tion was greater than the rule of thumb amountof steam/sq.ft. heating area needed for each build-ing. In order to ensure a successful transition tolow pressure distribution, a test of the system wasconducted using the manual bypasses around eachof the low-pressure pressure reducing valves (PRV)and adjusting the pilot at the main pressure re-ducing valve to slowly reduce pressure from 150psig to 15 psig. Fortunately, with only one excep-tion, the bypasses around the PRV stations werealso properly sized for low-pressure steam. Aftera successful test of the system and a few minormodifications, Dupont reduced the steam distri-bution system to low pressure.
This modification improved energy efficiencysince the heat transfer losses through the pipe andinsulation at a lower temperature are less than theheat transfer losses at a higher temperature. Anestimate of reduced condensate losses was esti-mated using the following equation at 125 psigand at 15 psig:
C = (A * U * (t1 – t
2) * E)/H Equation (2)
Where:C = Condensate in lbs/hr-footA = External area of pipe in square feetU = Btu/sq ft/degree temperature difference/hrT
1 = Steam temperature in °F
T2 = Air temperature in °F
E = 1 minus efficiency of insulationH = Latent heat of steam [2]

Steam Digest 2002Steam System Improvements at Dupont Automotive Marshall Laboratory
71
Since all of this condensate is disposed of ratherthan sent to a condensate return system, minimiz-ing condensate losses directly minimizes steamconsumption.
Steam System Maintenance SavingsAdditional cost savings are realized by the signifi-cantly reduced maintenance required since 12 pres-sure reducing stations are eliminated. Each pres-sure reducing station typically includes isolationgate valves, a bypass globe valve to enable manualthrottling of the steam, a strainer, a steam trapand a pressure relief safety valve, in addition tothe PRV. Properly selected PRVs need to haveseats replaced about every five years, while incor-rectly sized PRVs may need new seats as frequentlyas each year. Additionally, steam losses due toweeping safety valves and leaking flanged orscrewed connections could be reduced. Althoughit is difficult to exactly quantify these costs, a sav-ings of $25,000/year due to eliminating these pres-sure reducing stations is realistic.
Backpressure Turbine GeneratorInstallationSince Trigen’s steam pressure supplied to Dupontis nominally 210 psig, and all of the pressure re-duction could now take place at one location, theopportunity existed to consider the installation ofa backpressure turbine generator. As illustratedin Figure 1, a backpressure turbine generator takesthe place of a PRV by reducing the pressure fromhigh pressure to low pressure.
While the steam is losing pressure, it is rotating aturbine that rotates a generator and generates elec-tricity. The PRV parallel to the turbine is set about2 psig below the turbine output to enable the PRVto automatically pick up the steam flow if the tur-bine trips for any reason.
In addition to needing an acceptable pressure re-duction, an analysis of the electric usage is nec-essary to determine if installing a backpressure
Low Pressure Steam
High Pressure Steam
Electricity
turbine generator is viable. Dupont was on ahigh-tension service electric tariff that includedan electric demand ratchet payment. Basically,the billed monthly demand is the greater of themaximum registered demand during the month,or 80 percent of the peak demand during theprevious June through September months. For-tunately, Dupont’s annual electric load profilewas flat enough such that the actual demandduring the winter months was more than 80percent of the peak demand during the sum-mer months. Accordingly, the billed demandeach month was the actual billed demand setduring that month.
An analysis of Dupont’s annual steam and electricloads was done to determine the optimum sizefor the backpressure turbine generator. Since therewere no steam submeters after the main meter,the amount of steam used at low pressure was notexactly known. However, since the summer steamload was nearly all process load used at high pres-sure, it was safe to assume that this process loadwas fairly constant throughout the year. Based onthe remaining load after the estimated high-pres-sure process load was removed, a 150 kWbackpressure turbine generator was selected. Sincethe 150 kW output of this generator is far lessthan the electric capacity Dupont needed, this unitwould be operating parallel to the electric servicesupplied by the local electric utility. The local util-ity required the review and approval of an appli-cation for parallel operation before the turbinegenerator could be installed. This is necessary toverify that the installation will operate safely inparallel to the grid, and to verify that the powerquality of the grid is not reduced such that it wouldaffect other utility customers in the vicinity. Sincethis generator is an induction generator, the unitis automatically synchronized by the utility elec-tric service, and would instantly shut down if theutility service is interrupted. Ultimately, the elec-tric utility approved the installation after a satis-factory test of the relay protection system.
The turbine generator was installed adjacent tothe primary pressure reducing station. Since thispressure reducing station was located in a sepa-rate steam metering building, the electric from theturbine generator was tied into a motor controlcenter in the adjacent building.
Preheating Domestic Hot WaterIn addition to the energy conservation recommen-dations that Dupont implemented, preheatingthe domestic hot water with condensate was alsorecommended. Since the district steam loop in

Steam Digest 2002Steam System Improvements at Dupont Automotive Marshall Laboratory
72
Philadelphia was installed during a time whenwater and energy were relatively inexpensive, thesteam loop was not installed with condensatereturn piping. Accordingly, after the energy isremoved from the steam, the remaining con-densate is sent to the sewer. However, this con-densate often has useful energy remaining. Also,since the local code requires the water to be140°F before it goes to the sewer, often watermust be added to it to quench the condensateas needed. Therefore, instead of wasting usefulenergy and potentially useful water, Trigen rec-ommended adding a heat exchanger to transferthe useful heat from the condensate to waterused for domestic hot water heating.
The amount of energy available from the conden-sate can easily be determined. Assuming that thecondensate is saturated at 200°F, the enthalpywould be 168 Btu/lb. If the heat exchanger isdesigned to reduce the condensate to 100°F (basedon an adequate cold water flow), the leaving en-thalpy would be 68 Btu/lb. Therefore, 100 Btu/lb are available for preheating domestic hot water,which means that for every pound of steam that isused, 100 Btu can be used for preheating domes-tic hot water.
The amount of water used to quench the conden-sate to 140°F that can be avoided by preheatingdomestic hot water also can be easily estimated.Given the conservation of energy for a steady stateenergy balance, assuming the kinetic energychanges of the flow stream are negligible:
m1h
1 + m
2h
2 = m
3h
3 Equation (3)
Where:m
1 = mass of condensate, lbs.
h1
= enthalpy of condensate, Btu/lb.
m2 = mass of cooling water, lbs.
h2
= enthalpy of cooling water, Btu/lb.
m3
= mass of mixture, lbs.
h3 = enthalpy of mixture, Btu/lb. [3]
Since m1 + m
2 = m
3 (conservation of mass), and
all of the enthalpies are known assuming saturatedcondensate at 200°F, saturated cooling water at60°F, and a saturated mixture at 100°F, the massof the cooling water needed can be found for agiven amount of condensate. It is often surpris-ing to go through this exercise and find out theactual cost of water needed for quenching. Notethat since domestic hot water is typically an inter-mittent need, some water would still be needed toquench the condensate when preheating is notpossible.
At Dupont’s Marshall Laboratory, the amount ofcondensate available near the domestic hot waterheating is not centralized, making it difficult toassess the amount of condensate available near thedomestic hot water heaters. Accordingly, we couldnot assess the payback on the cost of installingheat exchangers and associated piping condensatepumps and valves as needed. Therefore, domestichot water preheating was not done to date.
Measured SavingsOver two years have passed since the modifica-tions were implemented, and although cost sav-ings are difficult to quantify, the comparison ofsteam consumption to heating degree days showsa reducing trend. Heating degree days (HDD) isbasically a measure of the amount of days thatheating is needed, and is calculated by subtract-ing the average ambient temperature from 65.Historical steam usage has shown that steam con-sumption is closely correlated to heating degreedays. In order to accurately determine if the steamsystem modifications have resulted in more effi-cient steam use, the annual comparisons need tobe relative to heating degree days. The graphshown in Figure 2 below of annual steam con-sumption in Mlbs (one thousand pounds) vsHDD clearly shows a trend of reduced steam con-sumption from the start of the modifications in1998 through 2000.
The increase in the Mlb/HDD ratio in 2001 likelyoccurred due to the combination of two factors:the process steam consumption has increased, andthe 2001 heating degree days were considerablylower than average, making the process load alarger percentage of the total consumption. In2001, Dupont modified some process reactors touse high-pressure steam as the heating source. Thisprocess change added steam load at high pressure,bypassing the backpressure turbine generator andthe low-pressure distribution. The heating degreedays in 2001 were 3,984 compared to an averageof 4,355 over the six years shown in the Figure2 graph.
Steam Digest 2002Steam System Improvements at Dupont Automotive Marshall Laboratory
73
LESSONS LEARNED
The following lessons from this case study can beapplied to other industrial steam systems:
1. Ensure steam distribution pressure is as lowas possible.
Since lower pressure steam correlates to lowertemperatures (assuming saturated steam), re-ducing the pressure as much as possible re-sults in a lower delta T between the steam tem-perature and the ambient temperature, whichresults in less heat transfer losses. Note thatthis case study is based on reducing the steampressure in a distribution system when thesteam pressure at the generating source can-not be reduced. If it is possible to reduce thesteam generation pressure, the efficiency gainsby distributing at a lower pressure must beweighed against the reduced efficiency result-ing from a steam generator operating at lessthan design pressure.
2. Consider backpressure steam turbine genera-tor if steam generation pressure is greater thanpressure needed at the point of use.
Packaged backpressure turbine generators areavailable as small as 50 kW. If at least 3,000lb/hr must be reduced from high pressure tolow pressure, and higher cost electricity canbe displaced, the opportunity exists to installa backpressure turbine generator.
3. Transparent improvements in steam systemscan make a significant impact on the bottomline.
By evaluating exactly what steam conditionsare needed at the point of use, the upstreamsteam system design should be made as effi-cient as possible. If steam usage has changedsince the steam system was started, there maybe an opportunity to improve the efficiency.
CONCLUSION
The steam system improvements made at Dupont’sMarshall Laboratory all involved basic conceptsthat were easily implemented without negativelyimpacting processes or building comfort. The keyto this case study is Dupont’s willingness to iden-tify all energy conservation possibilities and goforward with those that provide an acceptable
payback. All too often, the utility systems inindustrial facilities are seen as a necessary evil,and energy savings projects are ignored since thecapital that is saved is small compared to theoverall costs at industrial facilities. However, aslong as the energy savings project provides anacceptable pay back on its own merits, it shouldbe implemented.
If all industrial steam users evaluated their steamsystems and completed all modifications that pro-vided an acceptable payback, our country wouldbe taking a significant step toward reduced reli-ance on fossil fuel from other countries. Addi-tionally, by generating a portion of the electricitywithout any emissions whenever the opportunityexists, we are also taking a step toward cleaner air.
REFERENCES
1. Spirax Sarco, Design of Fluid Systems, 1997, p. 3
2. Armstrong International Inc., Steam ConservationGuidelines for Condensate Drainage, 1993, p. 17.
3. Wark, Kenneth Jr., Thermodynamics. 5th ed. NewYork:
McGraw-Hill, 1988.

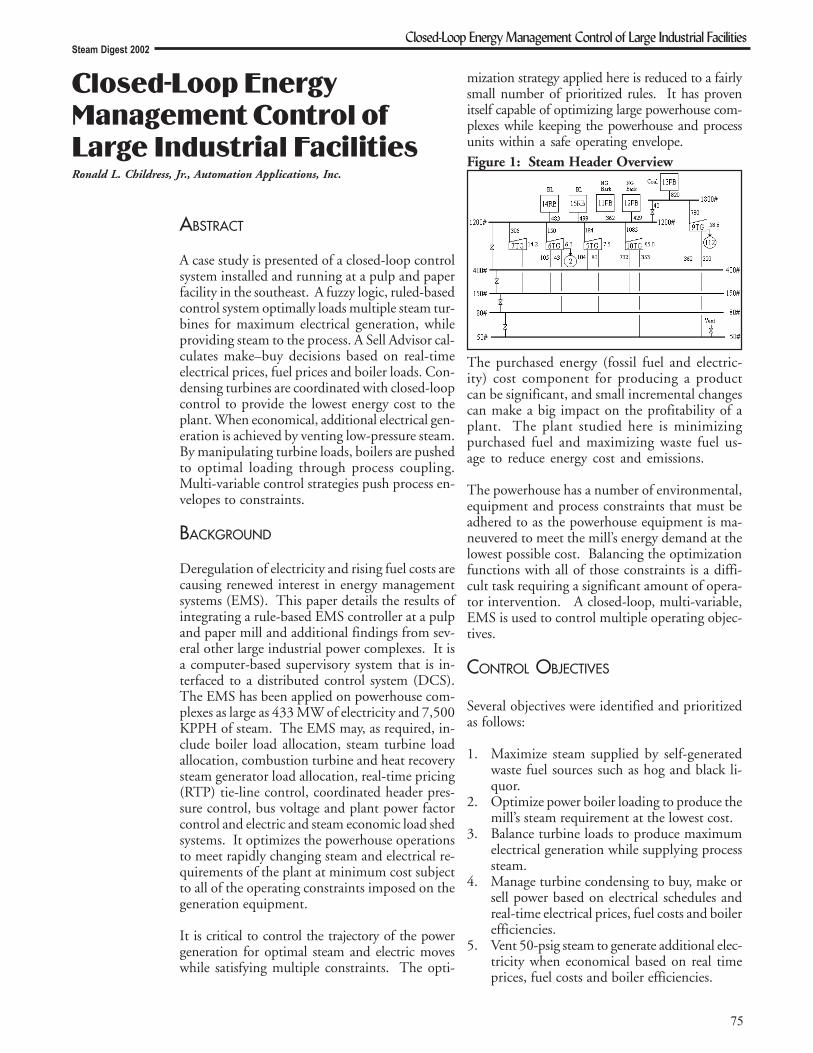
Steam Digest 2002Closed-Loop Energy Management Control of Large Industrial Facilities
75
Closed-Loop EnergyManagement Control ofLarge Industrial FacilitiesRonald L. Childress, Jr., Automation Applications, Inc.
ABSTRACT
A case study is presented of a closed-loop controlsystem installed and running at a pulp and paperfacility in the southeast. A fuzzy logic, ruled-basedcontrol system optimally loads multiple steam tur-bines for maximum electrical generation, whileproviding steam to the process. A Sell Advisor cal-culates make–buy decisions based on real-timeelectrical prices, fuel prices and boiler loads. Con-densing turbines are coordinated with closed-loopcontrol to provide the lowest energy cost to theplant. When economical, additional electrical gen-eration is achieved by venting low-pressure steam.By manipulating turbine loads, boilers are pushedto optimal loading through process coupling.Multi-variable control strategies push process en-velopes to constraints.
BACKGROUND
Deregulation of electricity and rising fuel costs arecausing renewed interest in energy managementsystems (EMS). This paper details the results ofintegrating a rule-based EMS controller at a pulpand paper mill and additional findings from sev-eral other large industrial power complexes. It isa computer-based supervisory system that is in-terfaced to a distributed control system (DCS).The EMS has been applied on powerhouse com-plexes as large as 433 MW of electricity and 7,500KPPH of steam. The EMS may, as required, in-clude boiler load allocation, steam turbine loadallocation, combustion turbine and heat recoverysteam generator load allocation, real-time pricing(RTP) tie-line control, coordinated header pres-sure control, bus voltage and plant power factorcontrol and electric and steam economic load shedsystems. It optimizes the powerhouse operationsto meet rapidly changing steam and electrical re-quirements of the plant at minimum cost subjectto all of the operating constraints imposed on thegeneration equipment.
It is critical to control the trajectory of the powergeneration for optimal steam and electric moveswhile satisfying multiple constraints. The opti-
mization strategy applied here is reduced to a fairlysmall number of prioritized rules. It has provenitself capable of optimizing large powerhouse com-plexes while keeping the powerhouse and processunits within a safe operating envelope.
The purchased energy (fossil fuel and electric-ity) cost component for producing a productcan be significant, and small incremental changescan make a big impact on the profitability of aplant. The plant studied here is minimizingpurchased fuel and maximizing waste fuel us-age to reduce energy cost and emissions.
The powerhouse has a number of environmental,equipment and process constraints that must beadhered to as the powerhouse equipment is ma-neuvered to meet the mill’s energy demand at thelowest possible cost. Balancing the optimizationfunctions with all of those constraints is a diffi-cult task requiring a significant amount of opera-tor intervention. A closed-loop, multi-variable,EMS is used to control multiple operating objec-tives.
CONTROL OBJECTIVES
Several objectives were identified and prioritizedas follows:
1. Maximize steam supplied by self-generatedwaste fuel sources such as hog and black li-quor.
2. Optimize power boiler loading to produce themill’s steam requirement at the lowest cost.
3. Balance turbine loads to produce maximumelectrical generation while supplying processsteam.
4. Manage turbine condensing to buy, make orsell power based on electrical schedules andreal-time electrical prices, fuel costs and boilerefficiencies.
5. Vent 50-psig steam to generate additional elec-tricity when economical based on real timeprices, fuel costs and boiler efficiencies.
Figure 1: Steam Header Overview

Closed-Loop Energy Management Control of Large Industrial Facilities
76
Steam Digest 2002
BUY/SELL ADVISOR
An operator sell advisor was developed for the fol-lowing reasons:
1. Show operators how to optimally load tur-bines.
2. Calculate global buy/make/sell purchase de-cisions based on incremental cost calculationsand risk assessment.
3. Provide performance indicators to track EMSperformance.
Optimal turbine loading is displayed to the op-erators both graphically and numerically. Eachline is color coded to represent a specific turbineextraction, exhaust or condensing flow. Incre-mental fuel costs, boiler efficiencies and turbinestage efficiencies contribute to changes in the over-all cost of energy.
Shown in Figure 2, the vertical axis represents po-tential $/hr. profit or loss. The horizontal axisrepresents electrical power export or import inMegawatts. Shown at the far right is the electricaldeficit. Electrical deficit is defined as the differ-ence between total plant electrical load minusmegawatts produced internally with minimumturbine condensing and no venting to the atmo-sphere. Profit or loss is compared against buyingall of the electrical deficit. Every 15 minutes, real-time electrical prices are downloaded automati-cally by EMS. Based on incremental cost calcula-tions, EMS continuously decides to make or buythe electrical deficit while observing multiple con-straints.
Figure 2: Advisor Graphical Display
The graph in Figure 2 indicates the optimumdecision is to maximize TG9 condensing loadand minimize TG6 condensing load. Increas-ing TG6 condensing load reduces $/hr. profit.The dashed, vertical line shows current tie-linepower import. In this case, TG9 condensingshould be maximized and TG6 condensingshould be minimized to maximize overall profit.On EMS control, TG9 and TG6 condensingloads are maneuvered automatically to maximizeprofit.
Sometimes, selling power to the grid may be prof-itable based on current electrical prices. As shownin Figure 2, a conflicting decision is often seenwhere it is better to buy the electrical deficit thanto make it, but possible to sell power at a profit.
In Figure 2, an equal profit point represents theminimum amount of power that must be sold tomatch profits obtained by optimally purchasingpower. Under these conditions, EMS decides tobuy or sell based on risk assessment calculations.Risk calculations are based on potential return oninvestment versus the potential loss trying to ob-tain the return. Risk factors include current equip-ment loading, process stability and real-time elec-trical prices. Risk factors are adjustable to matchOperations’ comfort level. Advice is summarized,as shown Figure 3.
Performance IndicatorsIn Figure 4, a performance display is provided toshow either Operator or EMS performance basedon current operating conditions and incrementalprofit calculations. The display indicates maxi-mum and actual $/hr. profit values and shows po-tential savings possible. A performance bar showsoverall economic header balance in degrees of goodor bad.
EMS BenefitsEMS has been in continuous automatic operationat this site since April 2001. Many significantbenefits have been achieved:
1. Substantial reduction in overall cost of energyReduced natural gas usageReduced overall steam productionReduced overall cost of electrical deficitReduced overall turbine condensingReduced selling of electrical powerIncreased turbine power from processsteamLess venting during transient upsets

Steam Digest 2002Closed-Loop Energy Management Control of Large Industrial Facilities
77
2. Greater power boiler operating stabilityReduced natural gas usageHigher percentage of steam from hog fuelConsiderable cost savings
3. Reduced power boiler steam productionReduced steam production overallConsiderable cost savingsReduced stack emissions
4. Stable operation identified bottlenecksUnits run consistently on the edge of op-timal performance
5. System indicators identify constraints6. Steam users report more stable header pres-
sures7. Accelerated Return on Investment (ROI)
Original ROI estimate was one yearActual ROI was less than six monthsContractual performance testing waswaived to maintain increase in profits!
The advantage of a rule-based system is to takethe best engineering and operational knowledgeand insert it into the control system to be opera-tional 24 hours a day, seven days a week. EMSperforms optimization functions while adheringto all constraints. Like the operator, EMS sacri-fices cost optimization whenever a constraint isreached. This results in robust process control.The control priorities are:
1. Meet all environmental constraints2. Avoid equipment damage3. Meet all process constraints4. Assure utility delivery to process units5. Meet energy requirements at minimum
costs
Figure 3: Advice
Figure 4: Performance Display
STEAM AND ELECTRICAL NETWORK
The powerhouse steam header overview is shownin Figure 1. More than half of the steam that isgenerated comes from burning process byproducts(black liquor and hog). Most of the process steamdemand is for low-pressure steam. Steam is gener-ated at higher pressures and throttled through theturbine-generators to lower pressure headers. Asignificant amount of electrical power, termed “ex-traction power” or “cogeneration”, is generated asa result of this throttling action. PRVs offer analternative way to throttle the steam to the lowerpressure headers. However, since no power is gen-erated, steam flows through PRVs should be mini-mized.
There is significant variability in the processsteam and electrical power demand. Batch di-

Closed-Loop Energy Management Control of Large Industrial Facilities
78
Steam Digest 2002
gester operation, wood yard log chippers, sootblowers, paper machine disturbances andpulping process upsets all contribute to this vari-ability. A “sheet break” on a large paper ma-chine and subsequent threading of the sheet canresult in large sudden steam demand swings ina period of less than a minute. Sometimes thepower boilers must go from maximum load tominimum load and back again to maximum loadwithin several minutes. Power boilers seldomoperate at steady state conditions unless theyare base loaded, i.e., the boiler master is placedin “manual”. It is this variability that makesreal-time optimization of the powerhouse op-erations so challenging. Steady state optimiza-tion methods simply do not provide the solu-tion when the process is rarely at steady state.
ENERGY MANAGEMENT SYSTEM
A new type of EMS has been developed and imple-mented to minimize the total cost of energy re-quired by an industrial facility. It coordinates andoptimizes the generation and distribution of steamas well as the generation and purchase of electric-ity. It also controls the main steam header pres-sure. The EMS is a supervisory control systemthat works in tandem with regulatory controls re-siding in the powerhouse DCS and PLCs.
The EMS subsystems include boiler load alloca-tion, turbine load allocation, hog optimization anddemand or real-time pricing tie-line control. Eachsubsystem can be operated independently. Theoperator selects the subsystem and places it onEMS control. For boiler load allocation, the op-erator selects which boilers and fuels are to be used.The EMS control software resides in a WindowsNT personal computer or can be installed directlyin the DCS. It has been designed specifically forimplementing fuzzy logic control. There are in-terfaces to the powerhouse DCS, turbine control-lers and various PLCs.
Boiler Load AllocationA schematic of a typical 1,200-psig header pres-sure control with an embedded boiler costoptimizer is shown in Figure 5.
The plant master is implemented with a fuzzymatrix controller that offers some significant ad-vantages over a PID version. Fuzzy matrix con-trollers can exhibit superior control performancecompared to a PID controller, especially for a non-linear, complex process. The tuning of fuzzy con-trollers is a trial and error procedure that involves
adjusting many parameters. A simple methodto help with the tuning of fuzzy controllers hasbeen developed. By overlaying a phase-planeplot on the rule matrix and analyzing the phase-plane trajectories, it becomes relatively easy toadjust membership functions and modify therules to obtain the desired trajectories.
The fuzzy controller executes once per second andsends a request to the boiler cost optimizer for anincremental steam change. The boiler loadoptimizer design involves integration of three dis-tinct functions. A safe operating envelope repre-senting prioritized environmental, equipment andprocess constraints are defined which the alloca-tor must respect. An optimization method is usedwhich adjusts multiple boilers and fuels to obtainthe most economical operating solution. The is-sue of header pressure control stability is addressedso power boilers with widely varying response ca-pabilities can work in concert. Balancing thesethree functions is key to a successful design.
The boiler load allocator observes all predefinedconstraints before adjusting boiler fuel flows.These constraints create a safe operating envelope.Observing constraints prevents boiler damage andkeeps the process out of undesirable operating re-
Figure 5: Typical Boiler Cost Optimization
Figure 6: Fuzzy Matrix Plant Master Controller

Steam Digest 2002Closed-Loop Energy Management Control of Large Industrial Facilities
79
gions. Constraints are prioritized in order of im-portance. Typical constraints for a boiler are (listedin order of priority):
1. Maintain opacity (6-minute average) belowmaximum.
2. Keep ID fan speed within control range.3. Prevent furnace draft from going positive.4. Maintain drum level in safe range.5. Prevent excess oxygen from going too low.6. Keep boiler steam generation within limits.
The boiler load allocation problem is analogousto the economic dispatching problem faced by anelectric utility company whenever transmissionlosses can be ignored. For optimal allocation, theutilities must operate the units at equal incremen-tal generating costs. Often the boiler load alloca-tion problem has been posed as a static optimiza-tion problem. But in reality, the allocation func-tion is embedded in the header pressure controlloop that transforms it into a dynamic controlproblem. Since there are continuous disturbancesto header pressure (caused by variations in steamdemand), boiler load allocation also takes placeon a continuous basis. Direct application of steadystate optimization methods does not work for aprocess that is never at steady state. Instead, adynamic boiler allocation method is used. In thissolution, the optimization method has been con-verted to an optimization rule set that is integratedinto the overall rule set.
An incremental steam generation cost (dollars perthousand pounds of steam) is continuously cal-culated for each boiler (fuel) based on the fuel cost(dollars per MMBtu), the selected swing fuel andincremental boiler efficiency for the selected fuel.This efficiency number is entered based on his-torical data or online calculations.
For incremental steam increase requests, boilersand fuels with lower incremental steam costs arefavored more than boilers and fuels that havehigher costs. All of the boilers move in concert toprevent one boiler from taking all of the loadswings. For incremental steam decrease requests,boilers and fuels with higher incremental steamcosts are favored. In the long run, the most eco-nomical boilers and fuels take most of the steamload. The more expensive steam producers arekept at a minimum value. In the short term, ifmore expensive steam is required for good headerpressure control, it is used. When properly tuned,the penalty for better header pressure control isusually not significant.
Hog OptimizationHog optimization is incorporated in the boilerload allocation function. The operator enters aminimum and maximum hog rate limit. It is de-sired to keep the hog rate for each boiler at itsmaximum value as much as possible.
In a multi-fuel boiler, each fuel is treated as if itwas a separate boiler by the boiler load allocator.The cost of hog ($/MMBtu) is entered as a verylow value.
There is a significant lag time (several minutes)associated with the transport of hog from the hogbin to the boilers. This lag time prevents hog frombeing an effective swing fuel. However, an opera-tor adjustable aggressiveness factor is used to al-low hog to be treated as a pseudo swing fuel andmaintain stable header pressure control.
Normally, hog flow will remain at the maximumlimit (entered by the operator) and header pres-sure control is accomplished by adjusting gas flows.However, there are periods of low steam demandwhen hog flow must be reduced to prevent excessventing of steam to the atmosphere. When thefossil fuel is at minimum limits and further steamgeneration reduction is needed, the boiler alloca-tor will reduce the hog flows of the power boiler.When the process demand increases, hog starts toincrease. Hog is considered somewhat base loaded,since it always works its way back to the maxi-mum limit.
Steam System ManagementThe next area of concentration is steam usagemanagement. The primary focus is the properallocation of the generated steam to satisfy steamheader and system electric generation require-ments. The steam system management compo-nents are described below.
Header Pressure Control StabilityOne of the major challenges of implementingboiler load allocation is to maintain stable headerpressure control for all combinations of boilers,fuels and equipment conditions. Boilers have dif-ferent response times. Variable fuel quality andmoisture content can effect the boiler’s responsetime. Mechanical problems can limit the rate ofload changes for a boiler.
Multi-fuel boilers, where hog is burned on a trav-eling grate, seem to create problems. Wet hog,long lag times in the hog feed system and hog pil-

Closed-Loop Energy Management Control of Large Industrial Facilities
80
Steam Digest 2002
ing on the grates can make using the boiler forheader pressure control quite challenging.
An aggressiveness factor is assigned to each boilerfuel. It determines how much a boiler fuel is askedto participate in header pressure control. The fac-tor varies from zero to one. When set to zero, thefuel does not participate in header pressure con-trol. It becomes base loaded. When set to one,the boiler fuel has full participation in header pres-sure control. For any value in between, there ispartial participation. Matching the aggressivenessfactor to the responsiveness of each boiler is im-portant for achieving stable header pressure con-trol. Reducing the participation of boiler fuelsthat have poor steaming response is essential.However, there must be at least one boiler fuel (inlarge plants, preferably two) that has a fast steamresponse if satisfactory header pressure control isto be obtained.
Sometimes boiler constraints reduce header pres-sure control effectiveness. Each boiler’s constraintsare checked once per second to insure process lim-its are not being violated. As a boiler approachesa limit, its participation in header pressure con-trol is reduced to zero. When some limits are ex-ceeded, such as boiler steam generation, constraintcontrollers may make counter control moves toplace the boiler back inside the safe operating en-velope. Counter control moves are usually to thedetriment of good header pressure control. This
means that the header pressure is not the high-est control priority. In fact, it is the lowest pri-ority.
Turbine Lead AllocationThis subsystem provides supervisory control for400, 150 and 50 psig extraction flows of all tur-bines to minimize PRV flows and maximize thetotal power that is generated. Turbines are as-signed primary responsibilities to control vari-ous header pressures. Turbine extraction andexhaust flows are balanced by adjusting pres-sure setpoints. RTP tie-line power is adjustedby adjusting the load to the turbine condens-ers. When economical, additional power is gen-erated by venting 50-psig steam by adjustingpressure setpoints.
A safe operating envelope for turbine loadallocation has been defined that will:
1. Maintain all TG parameters (V1, V2, V3,MWs ... etc.) within the minimum and maxi-mum limits.
2. Provide override control for 1,500 and 1,200psig header pressures (outside of minimumand maximum limits).
3. Provide override control for 400-psig headerpressure (outside of minimum and maximumlimits).
Figure 7: Electrical Deficit

Steam Digest 2002Closed-Loop Energy Management Control of Large Industrial Facilities
81
4. Provide override control for 150-psig headerpressure (outside of minimum and maximumlimits).
5. Provide override control for 80-psig headerpressure (outside of minimum and maximumlimits).
6. Provide override control for 50-psig headerpressure (outside of minimum and maximumlimits).
7. Maintain extraction flows on TG in controlrange for extraction pressure control.
8. Maintain sufficient swing range for TG’s con-densing flow to accommodate RTP tie-linecontrol.
EMS adjusts turbine pressure setpoints and con-densing load controls to achieve optimum turbineload balancing. Setpoints are “bumped” up ordown until constraints are reached.
ELECTRIC UTILITY RATE SCHEDULES
Most industrial customers purchase power froman electric utility company on a 15 or 30 minuteinterval. This type of rate schedule has a demandcomponent and fixed energy charges for on andoff-peak periods. The demand charge is usuallybased on the highest (peak) interval demand inthe last 11 or 12 months. Interval demand is theaverage purchased power over an interval. Exceed-ing a previously set peak demand may cost hun-dreds of thousands of dollars since this new peakdemand is usually ratcheted as the minimum de-mand charge for the following 12 months.
Real Time Pricing (RTP) is a new type of rateschedule offered to industrial customers by manyelectric utilities. The utility provides tomorrow’shourly prices based on the grid load and generat-ing capability. Under the RTP rate schedule thereis no demand charge or demand interval. Instead,the price of electricity varies on an hourly basis.Customers can purchase all of the power they needwithout worrying about setting a new peak de-mand. During summer periods, when the powerdemand becomes high, the midday hourly priceis usually quite expensive. On some days it mayeven exceed $1,000/megawatt hour. The customerobviously doesn’t want to buy any more of thisexpensive electricity than is absolutely necessary.
RTP TIE-LINE CONTROL
The ability to select the most attractive electricrate schedule is critical for today’s energy man-ager. In this application the Tie line control hasthree modes:1. RTP2. Demand MW3. Constant Purchase MW.
However, it is the RTP mode that is becomingmore important in the deregulated business envi-ronment. In some instances the utility faces util-ity generation or transmission constraints and willprovide attractive economic incentives for excesspower generation or demand side managementduring peak periods. The objective is to reducethe mill electric demand or at some mills, gener-ate power onto the grid during periods of highutility demand. This becomes a “Win-Win” forboth the plant and the utility. The primary con-trol objective for the mill is to adjust TG’s steamflow to the condenser or vent to minimize the costof providing the mill electrical deficit while stay-ing within a predefined safe operating envelope.
Mill Electrical DeficitTo implement an RTP or Demand tie line con-troller, it is necessary to focus on the Mill Electri-cal Deficit shown in Figure 7. The electrical defi-cit is defined as the mill’s total electrical powerdemand minus the power being generated due tothe turbine’s extraction flows and minimum flowto the condenser.
There are three sources of power that can be usedto meet the deficit:
1. Purchased power2. Forced condensing power3. Venting (50-psig steam) power
The function of the RTP control algorithm usesthe mill electrical deficit to select the proper oper-ating mode and to minimize utility cost.
RTP Control AlgorithmA schematic of the RTP tie-line control algorithmis shown in Figure 8.
The prioritized constraints are shown in the toppart. They define the safe operating envelope.Using this constraint boundary, the turbine is“herded” to stay within the envelope while thetie-line control function is performed. It doesnot allow condensing to increase when:

Closed-Loop Energy Management Control of Large Industrial Facilities
82
Steam Digest 2002
Figure 8: RTP Algorithm
1. Condensing flow is high.2. Condenser vacuum is low.3. Purchase power is at low limit.4. TG generated MWs is too high.5. TG 400-psig extraction flow is too high.6. TG condensing flow is maximized7. TG throttle flow is high.8. Total power boiler steam generation is very
high.9. 1,500-psig header pressure is very low.
It does not allow condensing to decrease when:
1. Condensing flow is at minimum.2. Purchased power is at a high limit.3. TG generated MWs is too low.4. TG 400-psig extraction flow is too low.5. TG condensing flow is too low.6. TG throttle flow is too low.7. Swing PB steam generation is very low.8. 1,500-psig header pressure is very high.
RTP Rate SchedulesEach day the utility provides tomorrow’s hourlyprices by electronic mail or Internet to each RTPcustomer. Around 5:00 p.m. each day, tie-linecontrol automatically downloads these prices (seeFigure 9). At midnight, prices are automaticallytransferred to EMS for cost calculations.
The control system continuously calculates theincremental cost to generate the next megawatthour by forced condensing. Cost is based on theincremental cost of steam generation and the quan-tity of steam to generate another megawatt withforced condensing. The price of condensingpower is compared to the cost of purchased power.When it is less expensive to buy power, EMS de-creases turbine condensing until a process con-straint is encountered.
When it is less expensive to make power, EMSincreases condensing until a process constraintis encountered. When the cost to buy versusgenerate is nearly the same, condensing is con-trolled to minimize consumption of fossil fuelby the power boilers. The control adjusts theturbine’s load to minimize electrical costs onlywhen all variables are within the safe operatingenvelope. The control sacrifices minimum costfor safe process performance.
Additional BenefitsOperations worked closely with engineering in thedevelopment of the EMS operator interfaces. Di-agnostic messages are presented in plain Englishlanguage. The resulting control system is very easyto understand, diagnose, tune and modify.
Figure 9: Downloaded RTP Rate Schedules
A reporting feature identifies process bottlenecksbased on frequency distribution of encounteredconstraints. Two characteristics of the EMS pro-vide this ability:
1. The process units are always operating on theedge of the optimizing envelope.
2. Encountered process constraints are high-lighted on the operating displays as the pro-cess moves between optimal operating points.

Steam Digest 2002Closed-Loop Energy Management Control of Large Industrial Facilities
83
Operations can identify both magnitude andfrequency of operating constraints and produc-tion bottlenecks.
CONCLUSIONS
The rule-based EMS described in this paper hasbeen customized and implemented in severalpowerhouses. All projects have demonstratedsubstantial savings. The savings attributed tothis powerhouse was a minimum reduction ingas purchase of 14 percent and a total reduc-tion in purchased energy of 13 percent whileimproving steam and electric generation qual-ity and reliability.
The design is based on fuzzy logic controls. A newinference engine and defuzzification method is em-ployed. It is the heart of this new supervisory soft-ware package. This methodology integrates onlineoptimization and a set of prioritized constraints.A list of process, equipment and environmentalconstraints is converted to a set of linguistic vari-ables (fuzzy variables), which are used to define asafe operating envelope. When the process is op-erating inside the envelope, the EMS optimizesthe powerhouse to provide process steam and elec-trical power at the lowest cost possible. The EMSusually operates the process on the boundary ofmultiple constraints.
This new control technology is applicable formany other online process optimizations in pulpand paper mills and other industrial facilities.Many proven applications include lime kiln opti-mization, CO and waste gas management in pet-rochemical complexes, multiple gas turbines,steam generation dispatch in large utilities andmining operations.
ACKNOWLEDGEMENT
The insights and efforts of Dr. FrederickThomasson are greatly appreciated in developmentof the original “Rule-Based Energy ManagementSystem.”
REFERENCES
1. Thomasson, F.Y. , 1979 Proceedings of the AmericanPower Conference, American Power Conference,Chicago. P. 853.
2. Thomasson, F.Y. , Rule-Based Energy Management
System, 2000 IETC


Steam Digest 2002An Introduction to Steam Outsourcing
85
An Introduction to SteamOutsourcingTom Henry, Armstrong Service Inc.
One evolving trend in the boiler replacement busi-ness is the movement to outsource the equipment,installation, and operation and maintenance—called the build, own, operate, and maintain(BOOM) market.
Increasingly, companies no longer desire to allo-cate capital to “non-core” assets. Since most cor-porations define utilities as “non-core,” theBOOM market is “booming” in certain sectors–particularly in large corporations with multi-plantoperations (and colleges and universities).
What is beginning to emerge, especially amongFortune 500 companies, is that utility and opera-tional people are realizing that capital will not beallocated for a boiler replacement despite beingbeyond its useful life. These people are being urgedby CEO’s and CFO’s to find solutions elsewhere.
As a result, energy service companies (ESCOs) andlending institutions are developing services thatsatisfy the requirements of these companies. Thisis building awareness and momentum for utilityasset outsourcing agreements.
Further, as companies continue to reduce staff,many of the people they have let go are those whohave the know-how and experience to efficientlyrun steam plants. This further motivates manage-ment to seek outside expertise who can effectivelymanage and operate a steam system.
Environmental concerns are driving this trend aswell. Those with coal systems are often concernedabout the changing emission standards and regu-lations in the near term. This creates another driverto outsource this responsibility to an ESCO. Theregulatory uncertainty and the continual capitalrequired to keep in compliance can be draining.With BOOM, companies can avoid this distrac-tion and accurately budget their steam energy ex-penses.
In a typical BOOM contract, the service provideris responsible for the design, engineering, procure-ment, construction, financing, and operation andmaintenance of the entire system. Ownership ofthe installed equipment does not necessarily trans-fer to the client at the end of the term. However,
the client user can purchase the system when theBOOM contract expires.
The client user pays the provider for the servicesby paying for the steam supplied from the ESCO’sboiler. In fact, with the structure of some arrange-ments, the steam costs can be lower then what theuser was incurring before the ESCO arrived.
This can make BOOM arrangements very appeal-ing. Certain ESCOs can provide capital for newboilers, design and install them, and own, oper-ate, and maintain them for steam costs less thanwhat the facility was originally incurring. Addi-tionally, the site now has on-site experts, with anentire organization behind them, to provide ser-vices that will drive down energy costs by con-stantly discovering and implementing energy ef-ficiency projects.
While strong economics is the main motivator forentering into a BOOM contract, there are someother factors beyond capital avoidance and lackof experience and manpower pushing these agree-ments. For example, a company desires to moth-ball an existing steam plant because of systemicinefficiency of the generating assets. It can makebetter economic sense to outsource the entire own-ership of the steam plant including the O&M.Similarly, a company may be having trouble con-trolling energy costs. Management has grown im-patient watching the steady increase in total util-ity operating costs and desire to reduce or controlthese costs by turning over the responsibility andrisk to an ESCO.
Other factors include:
Utility-supplied steam is no longer available.Due to market fluctuations, an existing co-generation plant becomes inefficient.Utility rates are high.Lack of system reliability is a growing con-cern.
Case in point:
A Fortune 500 food processing facility, whichmanufactures 5,000 products sold in 200 coun-tries, was exploring utility cost reduction optionsfor its Midwest facility because its boilers wereaged.
At this facility, it produces gravies, ketchup, saucesand soups. The facility has total annual combinedutility costs of more than $4 million. The plant’sthermal demand is 340 million pounds of steam

An Introduction to Steam Outsourcing
86
Steam Digest 2002
per year and it has an electric power demand of19.1 million kW per year.
The $9 billion per year corporation opted for aBOOM contract for its Midwest facility, sellingthe powerhouse assets to a technology basedESCO. The contract stipulates that the ESCOowns and operates the facility for 16 years in anagreement valued in excess of $64 million.
The ESCO installed two new 2,800 horsepowerwatertube steam boilers as the primary source forthermal energy requirements. The ESCO also in-stalled a new air compressor and sequencing con-trol package to manage the 718,000 thousandcubic feet annual demand.
The ESCO performed turnkey design and imple-mentation of steam, compressed air, electric, andwastewater projects to increase utility efficiencyand generate energy cost savings at the plant. Fur-ther, as part of its ownership responsibility, it pro-vides a continual sustaining engineering serviceto ensure continued benefits of the implementedprojects.
The ESCO agreement structure affords this com-pany numerous benefits:
It received an up-front capital payment for itspowerhouse assets.The overall utility cost has been reduced atthis facility.No capital from the company was requiredto produce savings.The ESCO will aggressively pursue utility andproject savings opportunities throughout theterm of this agreement.Operations and maintenance risk have beentransferred to the ESCO.The company is billed for all utility serviceson a variable basis correlated to product pro-duced.The ESCO reviews and pays all utility bills.Utility systems are continuously being up-graded and improved to achieve “Best inClass” condition.
Therefore, in reviewing how this ESCO installedthis new boiler for this food processing facility,one can see that the customer received a substan-tial cash payment, avoided having to provide mil-lions of the company’s own capital for upgrades,and had its overall utility expenses reduced. If thefood processor chose the conventional method, itwould have millions less in capital available to growtheir business.
If boiler upgrade/replacement is needed, a facilityowner/manager should not hesitate to determineif this new trend in boiler replacements could beeconomically attractive at the facility.

For additional information on BestPractices Steam, contact:
Fred HartIndustrial Technologies ProgramU.S. Department of Energy1000 Independence Avenue, N.W.Washington, DC 20585(202) 586-1496
Kristin LohfeldIndustrial Program ManagerAlliance to Save Energy1200 18th Street, N.W. Suite 900Washington, DC 20036(202) 530-4349
To order additional copies of this publication please call:
Industrial Technologies Program Information Clearinghouse at (800) 862-2086 or visitwww.eere.energy.gov/industry
Industrial Technologies ProgramEnergy Efficiency and Renewable EnergyU.S. Department of EnergyWashington, D.C. 20585
DOE/GO-102003-1805November 2003
About the Office of Energy Efficiency andRenewable Energy
A STRONG ENERGY PORTFOLIO FOR A STRONGAMERICA
Energy efficiency and clean, renewable energy will meana stronger economy, a cleaner environment, and greater energyindependence for America. By investing intechnology breakthroughs today, our nation can lookforward to a more resilient economy and secure future.
Far-reaching technology changes will be essential to America’senergy future. Working with a wide array of state, community,industry, and university partners, the U.S. Department of Energy’sOffice of Energy Efficiency and Renewable Energy invests in adiverse portfolio of energy technologies that will:
• Conserve energy in the residential, commercial,industrial, government, and transportation sectors
• Increase and diversify energy supply, with a focus onrenewable domestic sources
• Upgrade our national energy infrastructure• Facilitate the emergence of hydrogen technologiesas a vital new “energy carrier.”
The Opportunities
Biomass ProgramUsing domestic, plant-derived resources to meet our fuel, power,and chemical needs
Building Technologies ProgramHomes, schools, and businesses that use less energy, cost less tooperate, and ultimately, generate as much power as they use
Distributed Energy & Electric Reliability ProgramA more reliable energy infrastructure and reduced need for newpower plants
Federal Energy Management ProgramLeading by example, saving energy and taxpayer dollars in federalfacilities
FreedomCAR & Vehicle Technologies ProgramLess dependence on foreign oil, and eventual transition to anemissions-free, petroleum-free vehicle
Geothermal Technologies ProgramTapping the earth’s energy to meet our heat and power needs
Hydrogen, Fuel Cells & Infrastructure Technologies ProgramPaving the way toward a hydrogen economy and net-zero carbonenergy future
Industrial Technologies ProgramBoosting the productivity and competitiveness of U.S. industrythrough improvements in energy and environmental performance
Solar Energy Technology ProgramUtilizing the sun’s natural energy to generate electricity and providewater and space heating
Weatherization & Intergovernmental ProgramAccelerating the use of today’s best energy-efficient and renewabletechnologies in homes, communities, and businesses
Wind & Hydropower Technologies ProgramHarnessing America’s abundant natural resources for clean powergeneration
To learn more, visit www.eere.energy.gov