step 2: performing site directed mutagenesis
TRANSCRIPT

102
Site Directed Mutagenesis of ZsYellow
103
LAB OVERVIEW
ZsYellow is a yellow fluorescent protein from the sea anemone Anemonia majano. The goal of
the lab is to generate a mutant version of ZsYellow with different spectral properties than wild-type
ZsYellow. There are two main reasons this is a worthwhile goal. First, the new protein can be used as
another distinct biomarker by researchers in the life-sciences. Specifically, the new protein might have
spectral and/or structural properties that make it ideal for certain applications. Second, by mutating the
protein we can gain a better understanding of how the sequence of ZsYellow specifies function. The
understanding of how protein sequence specifies protein function is a fundamental question in
biochemistry. ZsYellow is an especially interesting protein because it undergoes an autocatalytic reaction
that generates the chromophore. Our strategy for achieving the goal involves designing, heterologously
expressing, isolating, and characterizing a form of ZsYellow that has a signal amino acid substitution. A
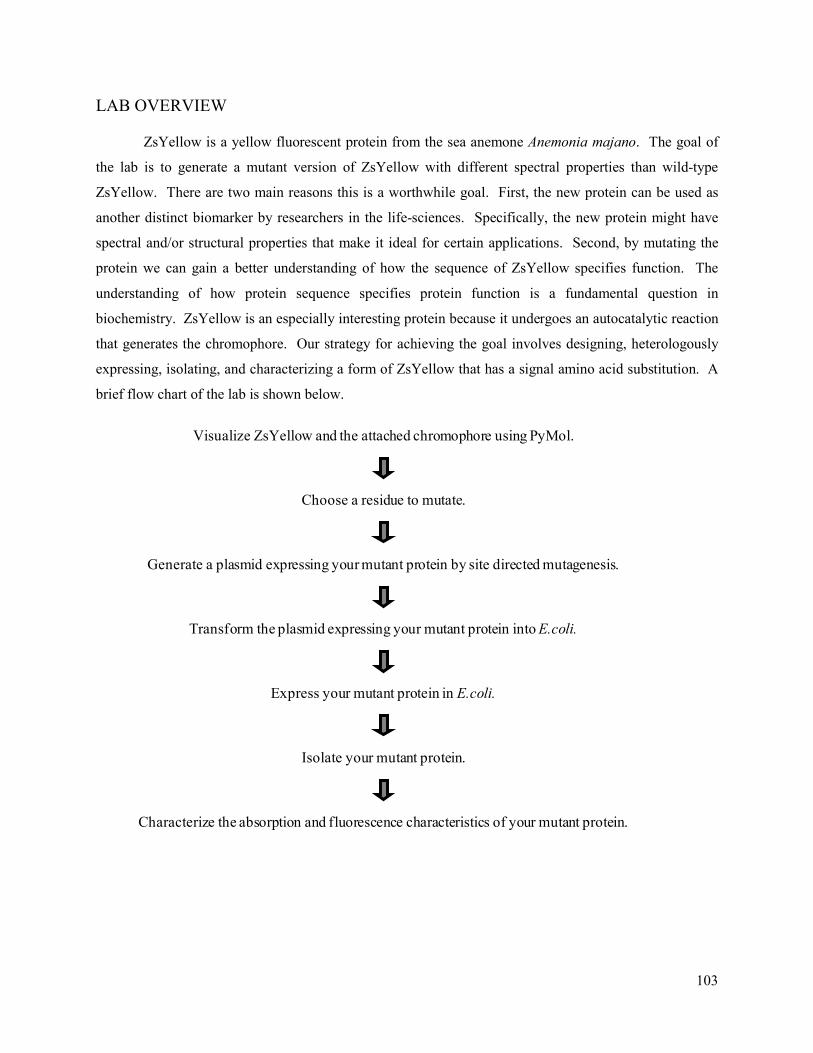
brief flow chart of the lab is shown below.
Visualize ZsYellow and the attached chromophore using PyMol.
Choose a residue to mutate.
Generate a plasmid expressing your mutant protein by site directed mutagenesis.
Transform the plasmid expressing your mutant protein into E.coli.
Express your mutant protein in E.coli.
Isolate your mutant protein.
Characterize the absorption and fluorescence characteristics of your mutant protein.

104
BACKGROUND
GFP and ZsYellow
Green fluorescent protein (GFP), the first fluorescent protein ever cloned, occurs naturally in the
luminescent jellyfish Aequorea Victoria, which is found off the coast of Washington State. Although the
protein was isolated and characterized by Osuma Shimomura in the 1970’s, it was not until the gene
encoding GFP was cloned (Prasher 1992) and heterologously expressed in E.coli and C. elegans (Chalfie
1994) that its great utility became evident. Heterologous expression is expression in any organism that is
not the original source of DNA. Since the mid 1990’s, these and other advances in GFP technology have
redefined microscopy. For example, GFP and other fluorescent proteins have been widely used as
markers for gene expression and protein localization in many different organisms. The utility of GFP is
due to the protein’s ability to express, fold properly, and undergo maturation in heterologous systems.
Maturation refers to the series of specific cyclicization reactions in the tripeptide Ser65-Tyr66-Gly67 that
lead to chromophore formation. The protein can undergo maturation in heterologous systems because the
reactions are auto-catalyzed. The structure of GFP was solved in 1996 (Remington 1996, Philips 1996).
The protein contains a two-ringed chromophore encased in a barrel consisting of β-sheets. The residues
of the chromophore are part of a single α-helix that runs through the center of the barrel.1
Because of the utility and limitations of GFP, there has been an active search for other fluorescent
proteins that can be used as biomarkers. ZsYellow was one of the proteins found in a recent search. It is
naturally found in the tentacle tips of Anemonia majano, a brightly fluorescent sea anemone from the
Indo-Pacific Area. The discovery was made in a search for naturally occurring GFP homologs in reef
1 Marc Zimmer, Glowing Genes: A Revolution in Biotechnology (Amerherst: Prometheus Books, 2005) contains more information on the history, structure, and uses of GFP.

105
corals. Although the protein sequence of ZsYellow and GFP share less than 30% sequence identity,
ZsYellow has an almost identical β-barrel structure. The tripeptide Lys66-Tyr67-Gly68 is the basis of the
ZsYellow chromophore. Unlike the chromophore of GFP, the chromophore of ZsYellow contains three
rings. This is one reason the colors emitted by the two proteins are different.
Heterologous Expression
As mentioned above one of the strength of GFP and ZsYellow is that they can be heterologously
expressed. To date GFP has been expressed in E.coli, other bacterial species, fungal species, plant
species, C.elegans, flies, mammalian tissue culture, and many mammals including mice, rabbits, and pigs.
In E.coli heterologous expression is achieved by encoding the gene expressing your protein of interest
(YPI) on a plasmid, which is transformed into a cell and maintained. The key to transformation and
maintenance is the presence of a selectable marker on the plasmid. These usually provide antibiotic
resistance. The plasmid we will be using provides resistance to ampicillin; in an E. coli culture grown in
the presence of ampicillin, only cells maintaining the plasmid will survive and reproduce.
Expression of YPI in E. coli is under the control of an inducible promoter, allowing the researcher to
control protein expression. Since the heterologous protein can account for over 50% of the cell’s protein,
it is deleterious to express it during routine maintenance. In this lab, you will begin with a plasmid that
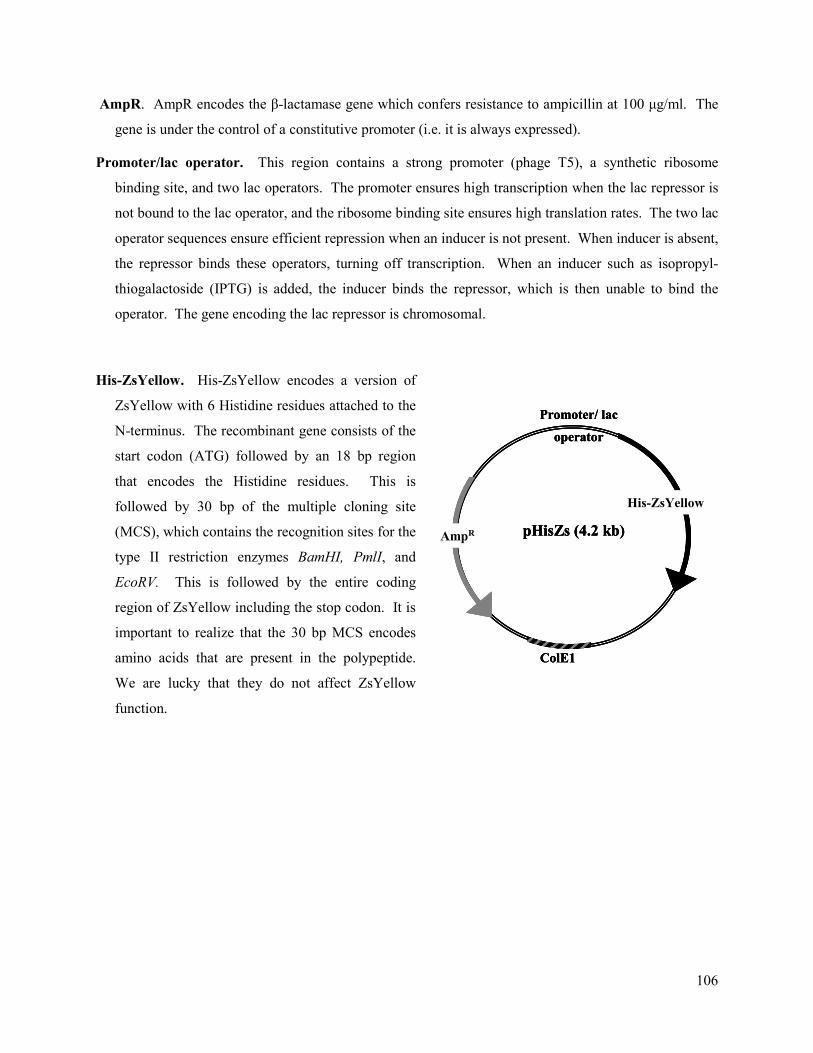
expresses a version of ZsYellow with 6 Histidine residues at the N-terminus under the control of the lac
promoter. A schematic of the 4200 base pair plasmid is shown below. Some of the important regions
include:
ColE1. ColE1 is the origin of replication. It allows the plasmid to be replicated and be maintained at a
copy number of 10-20 plasmids/cell.
106
AmpR. AmpR encodes the β-lactamase gene which confers resistance to ampicillin at 100 μg/ml. The
gene is under the control of a constitutive promoter (i.e. it is always expressed).
Promoter/lac operator. This region contains a strong promoter (phage T5), a synthetic ribosome
binding site, and two lac operators. The promoter ensures high transcription when the lac repressor is
not bound to the lac operator, and the ribosome binding site ensures high translation rates. The two lac
operator sequences ensure efficient repression when an inducer is not present. When inducer is absent,
the repressor binds these operators, turning off transcription. When an inducer such as isopropyl-
thiogalactoside (IPTG) is added, the inducer binds the repressor, which is then unable to bind the
operator. The gene encoding the lac repressor is chromosomal.
His-ZsYellow. His-ZsYellow encodes a version of
ZsYellow with 6 Histidine residues attached to the
N-terminus. The recombinant gene consists of the
start codon (ATG) followed by an 18 bp region
that encodes the Histidine residues. This is
followed by 30 bp of the multiple cloning site
(MCS), which contains the recognition sites for the
type II restriction enzymes BamHI, PmlI, and
EcoRV. This is followed by the entire coding
region of ZsYellow including the stop codon. It is
important to realize that the 30 bp MCS encodes
amino acids that are present in the polypeptide.
We are lucky that they do not affect ZsYellow
function.
Promoter/ lac
operator
ColE1
pHisZs (4.2 kb) AmpR
His-ZsYellow
Promoter/ lac
operator
ColE1
pHisZs (4.2 kb) AmpR
His-ZsYellow
Promoter/ lac
operator
ColE1
pHisZs (4.2 kb) AmpR
His-ZsYellow

107
SCHEDULE
Day 1. Design your mutant protein and order primers
You will look at the structure of ZsYellow using PyMOL, determine which amino acid you would like to replace, and design primers that will allow you to modify pHisZs so that it expresses your mutant protein. Make sure you email me your primer sequences before 10 AM the morning after Day 1.
Day 2. Perform site-directed mutagenesis
Read Matz et al. 1999 and think about the attached questions before class. In class, you will perform the site-directed mutagenesis and discuss the paper describing the isolation of ZsYellow.
Day 3. Transform the mutated plasmid into E.coli and characterize wild-type HisZs
On day 3, you will transform the plasmid generated on day 2 into XL1-Blue competent cells and characterize the spectral properties of wild-type His-ZsYellow. This will give you a chance to learn how to use the spectrophotometer and spectrofluorometer.
Day 4. Isolate your mutant protein and sequence plasmid DNA
You will have two tasks on day 4. (1) You will isolate your mutant protein from your transformed strain using a nickel-nitrotriacetic agarose column. And (2) you will isolate plasmid DNA from your transformed strain and prepare sequencing reaction. Sequencing will be performed at the Stanford PAN facility.
Day 5. Analyze protein isolation and characterize your mutant protein
You will have two tasks on day 5. (1) You will analyze how well Day 4’s isolation worked by running an SDS-PAGE gel. And (2) you will characterize the absorption and fluorescence characteristic of your mutant protein.
Day 6. Analyze protein stability
You will analyze protein stability by looking at the effects of pH, urea, and/or temperature on your protein. We will discuss exact protocols on day 5.

108
DAY 1: DESIGN YOUR MUTANT AND ORDER PRIMERS
Step 1. Look at ZsYellow with PyMol
Look at the three-dimensional structures of ZsYellow (1XAE.pdb, download at
http://www.rcsb.org
Step 2. Decide on a residue to mutate
). Show the protein in cartoon form and the chromophore as sticks. PyMol has
replaced Lys66, Tyr67, and Gly68 with CH7 in the sequence because of the autocatalytic reaction.
Notice that the chromophore is in a “barrel” generated by the polypeptide. The residues in the core create
the environment for the chromophore and thus affect the spectral properties of the protein. Also notice
that the molecule is a dimer. For GFP, oligemerization has been shown to affect spectral properties as
well as protein stability. It is therefore likely that the same is true for ZsYellow. Your goal is to generate
a mutant version of ZsYellow that is different from wild-type ZsYellow in its spectral properties and/or
stability. Basic PyMol commands can be found on coursework. The command for selecting amino acids
within x Å of a selection named selection1 is select NEARAA1, (byres selection1 expand x &
!selection1). The selection named NEARAA1 will contain the nearby amino acids.
Read through all of the following possible mutation types, choose one, and follow the analysis
instructions for your choice. Make sure to write out your thought process in your notebook. Do not
mutate the residues that form the chromophore (Lys66, Tyr67, and Gly68); these have been mutated and
the results have been published. Appendix 1 contains amino acid single letter codes, amino acid
structures, the genetic code, and the Blosum-62 substitution matrix.
1. Alter the chromophore environment – less interactions. Alter the chromophore environment by
mutating a residue within 4 Å of the chromophore to get rid of a hydrogen bond or electrostatic
interaction. Use PyMol to identify residues within 4 Å of the chromophore. Look for probable
hydrogen bonds and electrostatic interactions between the chromophore and the close residues.
Measure the distances between the interacting atoms for two or three of the above interaction.
Finally, pick one of these to mutate and decide on an amino acid with which to replace it (see below).
2. Alter the chromophore environment – more interactions. Alter the chromophore environment by
creating a new hydrogen bond or electrostatic interaction. Use PyMol to identify residues within 4 Å
of the chromophore. To create a new hydrogen bond, find a non-polar residue within 4 Å of a
hydrogen donor (or acceptor) in the chromophore and replace it with a hydrogen acceptor (or donor).
To create an electrostatic bond, mutate a nearby non-polar residue to a residue that is charged at
physiological pH (pH 8).

109
3. Decrease the binding affinity between the two subunits. Decrease the binding affinity between the
two subunits by mutating a residue at the interface between the two subunits. Start by identifying
residues from chain A which are within 4 Å of chain B and residues from chain B which are within 4
Å of chain A. Look for probable hydrogen bonds and electrostatic interactions between the two
chains. Measure the distances between the interacting atoms for two or three pairs of residues.
Finally, pick one of these to mutate and decide on an amino acid with which to replace it.
4. Alter access to the chromophore. The ends of the barrel act as gates controlling the ability of water
and/or ions to enter the barrel. Identify the residues at the ends of the barrel and choose a residue to
mutate.
5. Another idea? Think beyond the four ideas discussed above and come up with your own prediction
regarding which residues might be important.
6. Make a random mutation. When random mutations are made, the unexpected is often discovered.
Pick a number between 1 and 230 and mutate the corresponding residue to an amino acid with very
different chemical properties. The Blosum-62 substitution matrix shows the least conserved
substitution. If you decide to make a random mutation, go through the thought process for one of the
other suggestions as well.
Once you have picked a residue to mutate, you must decide with which amino acid you would
like to replace it. Amino acids can be divided into 4 categories according to their chemical properties:
hydrophobic, acidic, basic, and polar uncharged. In general, mutations that replace an amino acid from
one category with an amino acid from a different category are likely to affect protein structure and
function. Replacing small residues with very large residues is also likely to perturb the protein.
Step 3. Design Primers
Once you have decided on your residue substitution, you will mutate the plasmid pHisZs using
the QuikChange Site-Directed Mutagenesis kit from Stratagene.2
2 The full manual has been placed on coursework for those of you who would like more information.
The vector you will be mutating,
pHisZs, expresses a version of ZsYellow with a 6 X HIS tag (six histidine residues) fused to the N-
terminus. The QuikChange kit is used because it allows for mutagenesis in any double stranded vector
and because the protocol is simple and efficient. The starting materials are a double stranded vector
(dsDNA) containing your insert of interest and two synthetic oligonucleotides (primers). The primers are
complimentary to opposite strands of the vector, and both contain the desired mutation. Mutagenesis is
110
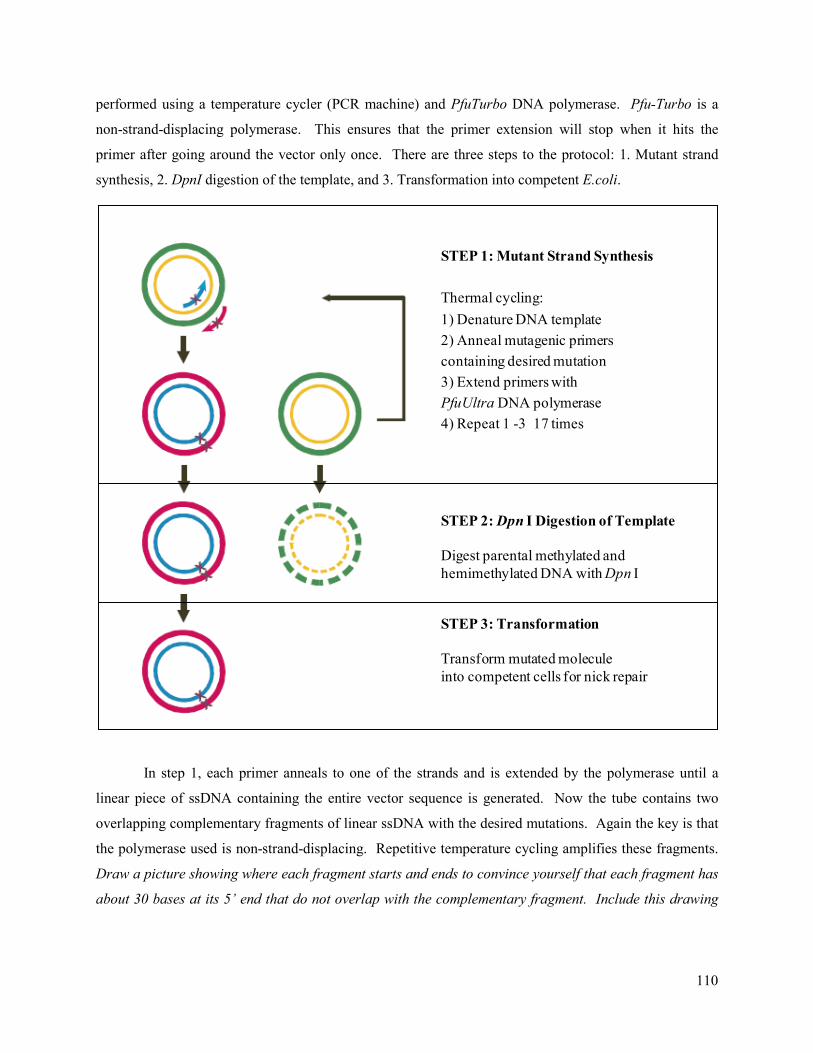
performed using a temperature cycler (PCR machine) and PfuTurbo DNA polymerase. Pfu-Turbo is a
non-strand-displacing polymerase. This ensures that the primer extension will stop when it hits the
primer after going around the vector only once. There are three steps to the protocol: 1. Mutant strand
synthesis, 2. DpnI digestion of the template, and 3. Transformation into competent E.coli.
In step 1, each primer anneals to one of the strands and is extended by the polymerase until a
linear piece of ssDNA containing the entire vector sequence is generated. Now the tube contains two
overlapping complementary fragments of linear ssDNA with the desired mutations. Again the key is that
the polymerase used is non-strand-displacing. Repetitive temperature cycling amplifies these fragments.
Draw a picture showing where each fragment starts and ends to convince yourself that each fragment has
about 30 bases at its 5’ end that do not overlap with the complementary fragment. Include this drawing
STEP 1: Mutant Strand Synthesis
Thermal cycling:1) Denature DNA template2) Anneal mutagenic primerscontaining desired mutation3) Extend primers withPfuUltra DNA polymerase4) Repeat 1 -3 17 times
STEP 2: Dpn I Digestion of Template
Digest parental methylated andhemimethylated DNA with Dpn I
STEP 3: Transformation
Transform mutated moleculeinto competent cells for nick repair

111
in your notebook. When the temperature cycling is complete, the two complementary strands anneal, and
the result is a mutated plasmid with staggered nicks.
In step 2, the vector is treated with DpnI endonucleases. DpnI digests methylated and
hemimethylated DNA with the target sequence 5’ Gm6ATC 3’ (Gm6 stands for guanidine with a methyl
group at carbon 6). Plasmid DNA isolated from E. coli strains that are dam+ (such as the XL1-Blue strain
we will be using) is methylated and therefore susceptible to DpnI endonucleases activity. In contrast, the
freshly synthesized DNA is not methylated.
In step 3, the nicked newly-synthesized DNA is transformed into supercompetent XL1-Blue cells.
When the cells take up the plasmid DNA they repair the nick. Once you have completed these steps, you
will have a cell line that expresses your mutant version of His-ZsYellow!
You will also perform a negative and positive control. For the negative control, the mutagenesis
reaction is performed without the primer. Almost no colonies should be observed after transformation.
What would you conclude if colonies were observed for the negative control? List all sources of possible
error in order of likelihood. Include your answers in your notebook. The kit comes with a positive
control. The pWhitescript 4.5-kb control plasmid is used to test the efficiency of mutant plasmid
generation. pWhitescript contains a stop codon (TAA) at the position where a glutamine codon (CAA)
would normally appear in the β-galactosidase gene of the pBluescript (residue 9). Cells transformed with
this control plasmid appear white on plates containing IPTG and X-gal because β-galactosidase activity
has been obliterated. The oligonucleotide control primers create a point mutation in pWhitescript that
reverts the T of the stop codon to a C, to reproduce the glutamine codon. Following transformation,
colonies can be screened for the β-galactosidase (β-gal+, blue) phenotype. What would you conclude if no
colonies were observed following transformation? What would you conclude if the majority of colonies
were Blue? Include your answers in your notebook.

112
The first step in mutagenesis is to order primers. Primers can be designed using Stratagene’s
web-based QuikChange Primer Design program available online at http://www.stratagene.com/
qcprimerdesign
1. By convention, primers are always listed as 5’ to 3’.
. A few of the considerations include:
2. Both primers must contain the desired mutation and anneal to the same sequence on opposite strands of the plasmid. Thus, the primers are complementary to one another. Remember the complement of 5’ AATCGCG 3’ is 5’ CGCGATT 3’.
3. The desired mutation should be in the middle of the primer with at least 12 bases of correct sequence on both sides.
4. The percent G + C should be at least 40%. Mathematically, (G+C)/ (G+C+A+T) > 0.40. This is important because GC bonds are stronger than AT bonds. There are 3 hydrogen bonds between G and C and only two between A and T.
5. It is ideal to have the primer terminate in one or two C or G nucleotides.
6. Primers should be between 28 and 40 bases in length and the melting temperature should be above 78°C. The melting temperature can be estimated using the equation below where N = primer length, and %mismatch = # of mismatching nucleotides / N. Make sure to calculate the Tm with this equation; do not trust the Tm from the website. Show this calculation in your notebook.
Tm= 81.5 + 0.41 * %GC – 675/N - %mismatch
Steps for using the website:
1. Go to http://www.stratagene.com/qcprimerdesign. You will have to register at Stratagene first.
2. Make sure “QuikChange II” is selected in the box 2.
3. Enter the nucleotide sequence (shown below) as plain text into the appropriate box.
4. Hit Upload Translated.
5. Check the box corresponding to the residues you plan to mutate.
6. Indicate the amino acid you plan to replace it with in the boxes marked “site 1.”
7. Hit design primers.
8. Calculate the Tm of the primers you designed and make sure they are above 78°C.
9. Email me ([email protected]) your final primers. Name them original residue # new residue and original residue # new residue_as (for antisense). For example, if you plan to replace residue 148, which is a serine, with an alanine, the primers would be S148A and S148A_as. Make sure to do this before 10 AM the morning after day 1. Once I have received all the emails, I will order the primers from the Stanford PAN facility.

113
Coding Region of ZsYellow with Encoded Amino Acids
1 atggctcattcaaagcacggtctaaaagaagaaatgacaatgaaataccacatggaaggg M A H S K H G L K E E M T M K Y H M E G 61 tgcgtcaacggacataaatttgtgatcacgggcgaaggcattggatatccgttcaaaggg C V N G H K F V I T G E G I G Y P F K G 121 aaacagactattaatctgtgtgtgatcgaagggggaccattgccattttccgaagacata K Q T I N L C V I E G G P L P F S E D I 181 ttgtcagctggctttaagtacggagacaggattttcactgaatatcctcaagacatagta L S A G F K Y G D R I F T E Y P Q D I V 241 gactatttcaagaactcgtgtcctgctggatatacatggggcaggtcttttctctttgag D Y F K N S C P A G Y T W G R S F L F E 301 gatggagcagtctgcatatgcaatgtagatataacagtgagtgtcaaagaaaactgcatt D G A V C I C N V D I T V S V K E N C I 361 tatcataagagcatatttaatggagtgaattttcctgctgatggacctgtgatgaaaaag Y H K S I F N G V N F P A D G P V M K K 421 atgacaactaactgggaagcatcctgcgagaagatcatgccagtacctaagcaggggata M T T N W E A S C E K I M P V P K Q G I 481 ctgaaaggggatgtctccatgtacctccttctgaaggatggtgggcgttaccggtgccag L K G D V S M Y L L L K D G G R Y R C Q 541 ttcgacacagtttacaaagcaaagtctgtgccaagtaagatgccggagtggcacttcatc F D T V Y K A K S V P S K M P E W H F I 601 cagcataagctcctccgtgaagaccgcagcgatgctaagaatcagaagtggcagctgaca Q H K L L R E D R S D A K N Q K W Q L T 661 gagcatgctattgcattcccttctgccttggcctga E H A I A F P S A L A .
Coding Region of ZsYellow (copy this into the QuikChange website)
atggctcattcaaagcacggtctaaaagaagaaatgacaatgaaataccacatggaagggtgcgtcaacg
gacataaatttgtgatcacgggcgaaggcattggatatccgttcaaagggaaacagactattaatctgtg
tgtgatcgaagggggaccattgccattttccgaagacatattgtcagctggctttaagtacggagacagg
attttcactgaatatcctcaagacatagtagactatttcaagaactcgtgtcctgctggatatacatggg
gcaggtcttttctctttgaggatggagcagtctgcatatgcaatgtagatataacagtgagtgtcaaaga
aaactgcatttatcataagagcatatttaatggagtgaattttcctgctgatggacctgtgatgaaaaag
atgacaactaactgggaagcatcctgcgagaagatcatgccagtacctaagcaggggatactgaaagggg
atgtctccatgtacctccttctgaaggatggtgggcgttaccggtgccagttcgacacagtttacaaagc
aaagtctgtgccaagtaagatgccggagtggcacttcatccagcataagctcctccgtgaagaccgcagc
gatgctaagaatcagaagtggcagctgacagagcatgctattgcattcccttctgccttggcctga.
114
DAY 2. PERFORM SITE -DIRECTED MUTAGENESIS
1. Primers come lyophilized (as a dry powder). How much powder do you have? Do you expect to see it? Spin the tubes briefly before opening them.
2. Reconstitute your primers to a concentration of 10 µg/µl using ddH2O (distilled deionized water). The information provided with the primer should give you the µmol of primer present (bottom right) and the molecular weight (MW). From this information, calculate how many µl of water you need to add to generate a solution with a primer concentration of 10 µg/µl.
3. Reconstituted the primers by shake the tube making sure every surface is washed, letting it sit 1 min, and spinning briefly.
4. In a separate Eppendorf tube, make a 100 fold dilution of the reconstituted primer using ddH2O. The final concentration will be 100 ng/ µl.
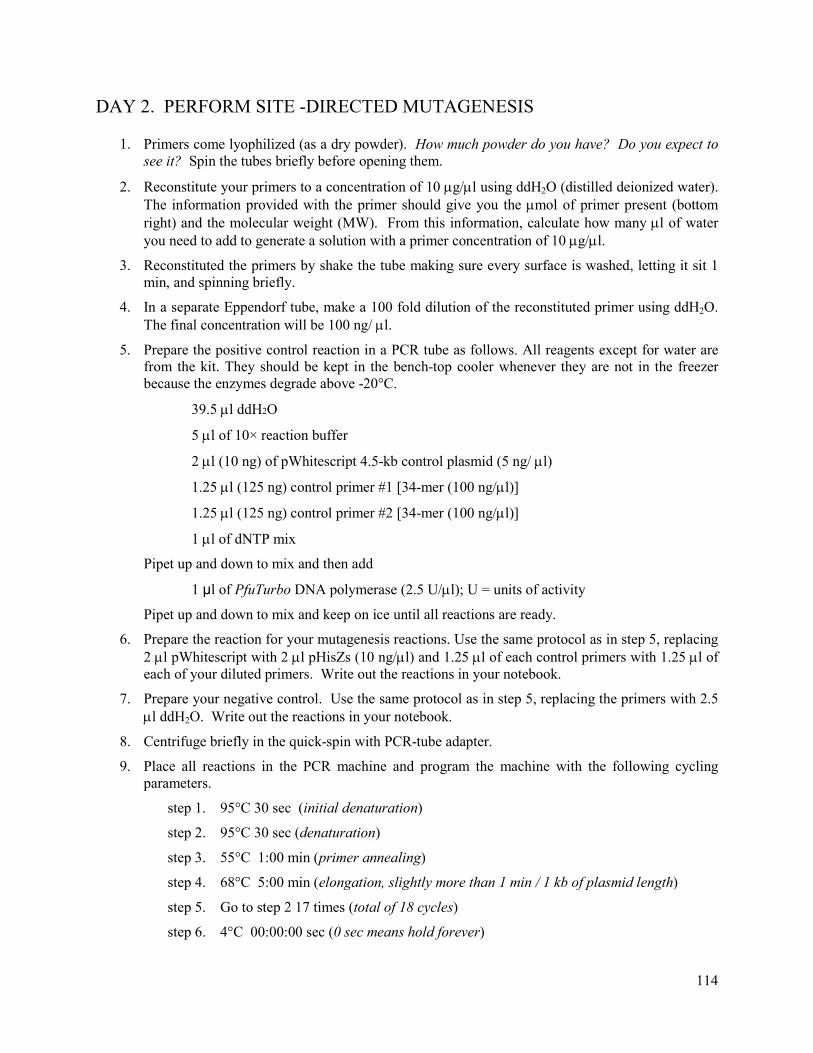
5. Prepare the positive control reaction in a PCR tube as follows. All reagents except for water are from the kit. They should be kept in the bench-top cooler whenever they are not in the freezer because the enzymes degrade above -20°C.
39.5 µl ddH2O
5 µl of 10× reaction buffer
2 µl (10 ng) of pWhitescript 4.5-kb control plasmid (5 ng/ µl)
1.25 µl (125 ng) control primer #1 [34-mer (100 ng/µl)]
1.25 µl (125 ng) control primer #2 [34-mer (100 ng/µl)]
1 µl of dNTP mix
Pipet up and down to mix and then add
1 μl of PfuTurbo DNA polymerase (2.5 U/µl); U = units of activity
Pipet up and down to mix and keep on ice until all reactions are ready.
6. Prepare the reaction for your mutagenesis reactions. Use the same protocol as in step 5, replacing 2 µl pWhitescript with 2 µl pHisZs (10 ng/µl) and 1.25 µl of each control primers with 1.25 µl of each of your diluted primers. Write out the reactions in your notebook.
7. Prepare your negative control. Use the same protocol as in step 5, replacing the primers with 2.5 µl ddH2O. Write out the reactions in your notebook.
8. Centrifuge briefly in the quick-spin with PCR-tube adapter.
9. Place all reactions in the PCR machine and program the machine with the following cycling parameters.
step 1. 95°C 30 sec (initial denaturation)
step 2. 95°C 30 sec (denaturation)
step 3. 55°C 1:00 min (primer annealing)
step 4. 68°C 5:00 min (elongation, slightly more than 1 min / 1 kb of plasmid length)
step 5. Go to step 2 17 times (total of 18 cycles)
step 6. 4°C 00:00:00 sec (0 sec means hold forever)

115
step 7. End
10. Make sure the reactions have completely cooled to 4°C before proceeding with the DpnI digestion. Complete digestion with DpnI is crucial to remove the parental DNA so follow the steps below exactly as written.
11. Centrifuge PCR tubes briefly (2 sec) in the quick-spin with PCR-tube adapter.
12. Add 1 µl DpnI (10 U/µl) directly to each amplification reaction below the level of the liquid.
13. Gently and thoroughly mix each reaction by pipetting the solution up and down several times. Centrifuge briefly, mix each reaction again (you might want to have your partner do it this time), and centrifuge briefly again.
14. Place back in PCR machine and program the machine to hold at 37°C for 1 hr and then hold forever at 4°C:
step 1. 37°C 1:00:00 hr
step 2. 4°C 00:00:00 sec
step 3. End

116
DAY 3. TRANSFORM MUTATED PLASMID INTO E.COLI AND
CHARACTERIZE WILD-TYPE ZSYELLOW
Transformation
Working quickly is essential for successful transformations, so read the protocol carefully before
beginning. You will perform 4 transformations: your mutagenesis, the pWhitescript control, your negative
control, and PUC18 plasmid (0.1 ng/µl). The PUC18 control is a positive control for the transformation
protocol that allows you to determine the transformation efficiency.
1. Make 10 ml NZY+ broth (See Appendix 7: Recipes).
2. Set heat block to 42 °C and preheat NZY+ broth.
3. Prechill one 14-ml Falcon polypropylene round-bottom tube (catalog #2059) per transformation. Label each tube appropriately.
4. Allow one tube of supercompetent cells to thaw on ice for 15 min. Each tube of cells is enough for 4 reactions.
5. Aliquot 50 µl of cells into each prechilled Falcon tube. Be gentle and always keep tubes on ice!
6. To each tube, add 1 µl of DpnI treated DNA from each mutagenesis reaction or 1 µl PUC18. Do this without removing the tubes from the ice bucket.
7. Swirl gently to mix while the tube is still on ice.
8. Incubate on ice for 30 min.
• During the incubation, prepare, label, and prewarm the LB plate w/ ampicillin (LB-amp plate) to 37°C in the incubator.
• For the pWhitescript control, spread 100 µl X-gal (20 mg/ml in dimethylformamide) and 100 µl IPTG (10 mM or 2.38 mg/ml in ddH2O) on an LB-amp plate. Spread the X-gal first. Mixing the two together will cause the X-gal to precipitate.
9. Heat shock at 42°C for 40 sec and then place on ice for 2 min.
10. Add 0.5 ml of preheated NZY+ broth to each Falcon tube.
11. Incubate at 37°C for 1 h with shaking at 225-250 rpm.
12. After the 1 h incubation, spread 250 µl of the pWhitescript control on the LB-amp + IPTG +X-GAL plate.
13. For your mutagenesis and negative control, spread 250 µl on each of two LB-Amp plates (4 plates total).
14. For the PUC18 control, add 5 µl of culture to 250 µl NZY+ broth, and plate the entire 255 µl on an LB-Amp plate.
The next morning we will look at your plates and post the results (# of colonies/plate) on coursework.
1. You can calculate the transformation efficiency (colonies per µg/ DNA) from the PUC18 control. Stratagene claims the efficiency is greater than 108 cfu / µg DNA. A cfu is a colony forming unit. What efficiency did you observe?

117
2. The pWhitescript control mutagenesis reaction is expected to yield 50 to 800 colonies. Over 80% of them should be blue. Is this what you see?
3. Your negative control should have less than 10 colonies while your mutagenesis reaction plates should have between 25 and 500. However, all you really need is one colony with a mutagenized plasmid.
Day 3. (2) Characterize wild-type His-ZsYellow
You will be given a tube with wild-type His-ZsYellow at 0.5 mg/ml. Your goals are to obtain an
absorbance spectrum, emission spectrum, and excitation spectrum and to calculate the extinction
coefficient at λmax. The instructions for using the spectrophotometer and spectrofluorometer are in
appendix x.
Absorbance
An absorbance spectra shows at what wavelength a chromophore (or fluorophore) absorbs light.
Obtain an absorbance spectrum between 260 nm and 600 nm and calculate the extinction coefficient from
the data you obtain using the equation lcA ⋅⋅ε= where A = absorbance, ε = extinction coefficient in
M-1 cm-1, c = concentration in M, and l = pathlength in cm (1 cm for all our cuvettes). Compare your
spectrum, λmax, and the extinction coefficient to that published in Matz et. al, 1999. Use elution buffer to
blank the spectrophotometer and use your sample at full concentration. Your sample is precious.
Recover the sample from the cuvette so that you can perform the Fluorescence analysis and return
any non-diluted sample to me at the end of class period.
Fluorescence
A spectrofluorometer measures fluorescence. Characterizing fluorescence involves obtaining both an
emission and excitation spectra. An emission spectrum measures the fluorescence over a range of
wavelength with the excitation beam kept at a single wavelength. An excitation spectrum measures the
fluorescence at a specific wavelength as the excitation beam scans through a range of wavelengths.
Obtain an emission spectrum first. You will need to consider three parameters before obtaining a good
emission spectrum:
1. The excitation wavelength (EXλ). When analyzing the emission spectra of a fluorophore choice of EXλ is extremely important. You want to choose a EXλ that is near the λmax of the fluorophore (which you can obtain from your absorbance spectra). The complicating factor is that you will see a large peak at EXλ in the emission spectrum because the molecules in the sample scatter the excitation beam; the scattered light is picked up as signal by the sensor. The scatter peak has a width of about 20 nm that is centered at EXλ. Therefore, if you want to look only at fluorescence and not at scattered light, you can only begin scanning about 20 nm above EXλ. Take 3-5 emission scans with different EXλ to optimize your scan.

118
2. The scanning range. As described above the starting wavelength of the scanning range should be ≥ EXλ + 20 nm. The ending wavelength should be at 700 nm (or until the fluorescence background is insignificant compared to noise). When presenting the data only show the interesting part of the graph.
3. Concentration. A spectrofluorometer is a lot more sensitive than a spectrophotometer. The concentration you will need for a good emission scan should be between 50
1 and 5001 of that you used
for absorption. You will need to try a couple concentrations before finding the ideal concentration. The cuvette holds 3 ml.
Once you have a good emission spectra, you should obtain an excitation spectra. Again, you will need to
consider three parameters before obtaining a good emission spectra:
1. Emission wavelength (EMλ). EMλ should be as close as possible to the emission maximum (which you can determine from the emission spectra). However, you will obtain scatter instead of true signal within about 20 nm of your EMλ. Again you will need to try a couple different EMλ.
2. The scanning range. The starting wavelength should be the machine’s limit (240 nm) and the ending wavelength of the scanning range should be ≤ EXλ - 20 nm. Again you might need to try a couple ending wavelengths.
3. Concentration. You should be able to use a concentration identical to the one you used to obtain an emission spectrum.

119
DAY 4: ISOLATING YOUR PROTEIN
HIS-Tagging
We are heterologously expressing your protein of interest (YPI) in E.coli, which enables
production of a large amount of protein from a small amount of culture. This is in sharp contrast to
purifying proteins from their native source, where large amounts of material are needed to obtain a small
amount of proteins. For example, the initial isolation of
GFP from jellyfish was a triumph that took years. To
further simplify our purification, we have added an
affinity tag to our protein. Tagging allows for protein
isolation using affinity chromatography where the tag
binds the affinity matrix with high efficiency and
specificity. Specifically, our recombinant protein
contains 6 histidine residues at the N-terminus of YPI.
The advantages of the HIS tag include the facts that it is small and neutrally charged at physiological pH
(pH = 8). Thus it is unlikely to interfere with protein folding and function. His-Zs and Zs have identical
spectroscopic properties. The separation method we are using is nickel-nitrilotriacetic acid (Ni-NTA)
metal-affinity chromatography. The side chain of histidine contains an imidazole group and the nitrogen
atom from this group binds the nickel ion (see figure below). The tagged protein is eluted from the
column using imidazole which will bind the column with an even higher affinity. The advantage of this
separation method is that we can isolate our protein under non-denaturing conditions.
Interaction between neighboring residues in the 6xHis tag and Ni-NTA matrix. NTA is a tetradentate chelating adsorbent (i.e. it has 4 donor atoms). Thus, NTA occupies four of the six ligand binding sites in the coordination sphere of the nickel ion, leaving two sites free to interact with the nitrogen atoms from the histidine side chains.
NTA
Agarosematrix
His 1
His 2
Interaction between neighboring residues in the 6xHis tag and Ni-NTA matrix. NTA is a tetradentate chelating adsorbent (i.e. it has 4 donor atoms). Thus, NTA occupies four of the six ligand binding sites in the coordination sphere of the nickel ion, leaving two sites free to interact with the nitrogen atoms from the histidine side chains.
Interaction between neighboring residues in the 6xHis tag and Ni-NTA matrix. NTA is a tetradentate chelating adsorbent (i.e. it has 4 donor atoms). Thus, NTA occupies four of the six ligand binding sites in the coordination sphere of the nickel ion, leaving two sites free to interact with the nitrogen atoms from the histidine side chains.
NTA
Agarosematrix
His 1
His 2
120
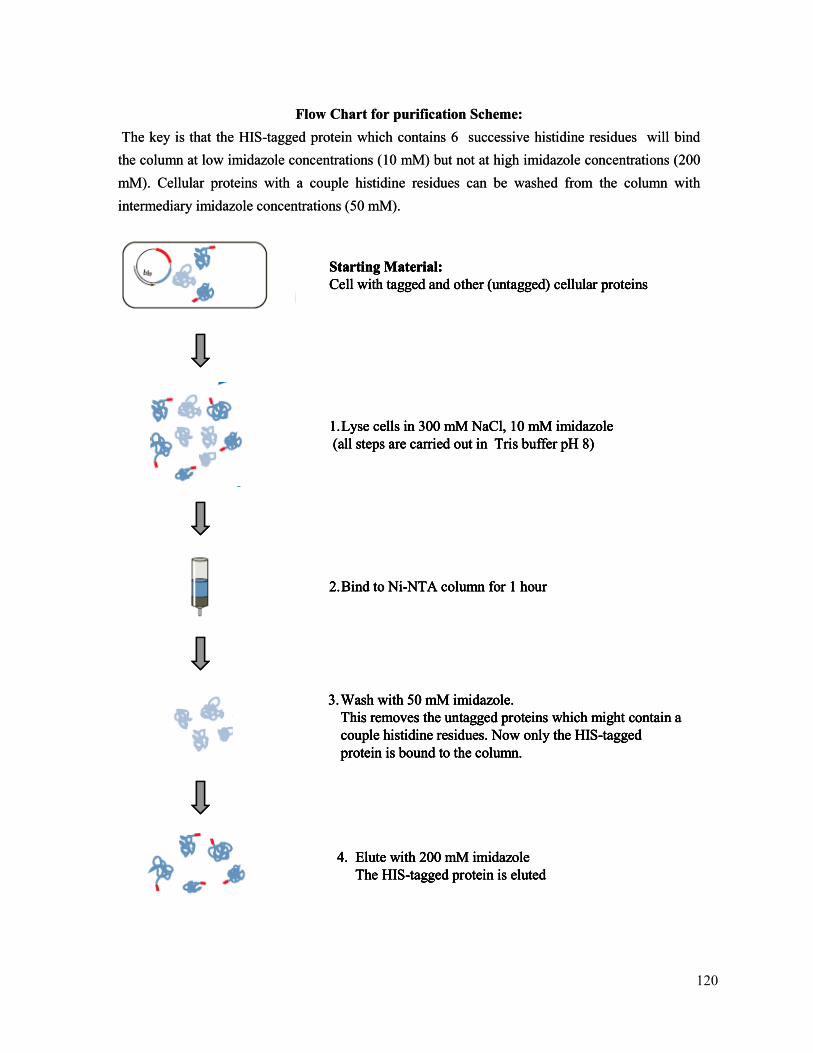
Starting Material: Cell with tagged and other (untagged) cellular proteins
1.Lyse cells in 300 mM NaCl, 10 mM imidazole(all steps are carried out in Tris buffer pH 8)
2.Bind to Ni-NTA column for 1 hour
3.Wash with 50 mM imidazole.This removes the untagged proteins which might contain a couple histidine residues. Now only the HIS-tagged protein is bound to the column.
4. Elute with 200 mM imidazoleThe HIS-tagged protein is eluted
Flow Chart for purification Scheme:The key is that the HIS-tagged protein which contains 6 successive histidine residues will bind the column at low imidazole concentrations (10 mM) but not at high imidazole concentrations (200 mM). Cellular proteins with a couple histidine residues can be washed from the column with intermediary imidazole concentrations (50 mM).
Starting Material: Cell with tagged and other (untagged) cellular proteins
1.Lyse cells in 300 mM NaCl, 10 mM imidazole(all steps are carried out in Tris buffer pH 8)
2.Bind to Ni-NTA column for 1 hour
3.Wash with 50 mM imidazole.This removes the untagged proteins which might contain a couple histidine residues. Now only the HIS-tagged protein is bound to the column.
4. Elute with 200 mM imidazoleThe HIS-tagged protein is eluted
Starting Material: Cell with tagged and other (untagged) cellular proteins Starting Material: Cell with tagged and other (untagged) cellular proteins
1.Lyse cells in 300 mM NaCl, 10 mM imidazole(all steps are carried out in Tris buffer pH 8) 1.Lyse cells in 300 mM NaCl, 10 mM imidazole(all steps are carried out in Tris buffer pH 8)
2.Bind to Ni-NTA column for 1 hour2.Bind to Ni-NTA column for 1 hour
3.Wash with 50 mM imidazole.This removes the untagged proteins which might contain a couple histidine residues. Now only the HIS-tagged protein is bound to the column.
3.Wash with 50 mM imidazole.This removes the untagged proteins which might contain a couple histidine residues. Now only the HIS-tagged protein is bound to the column.
4. Elute with 200 mM imidazoleThe HIS-tagged protein is eluted
4. Elute with 200 mM imidazoleThe HIS-tagged protein is eluted
Flow Chart for purification Scheme:The key is that the HIS-tagged protein which contains 6 successive histidine residues will bind the column at low imidazole concentrations (10 mM) but not at high imidazole concentrations (200 mM). Cellular proteins with a couple histidine residues can be washed from the column with intermediary imidazole concentrations (50 mM).

121
The morning after Day 3, two colonies were picked from your transformation plate and a 100 ml
culture in LB media with ampicillin was started from each. After 8 hours expression of your protein was
induced with IPTG. If the mutagenesis worked, both should contain your newly designed mutant
plasmid!3
Purification of His-tagged protein
The same was done with a strain expressing His-ZsYellow, which will serve as a positive
control for your protein purification. Before proceeding with the protein purification, remove 5 ml of
culture that you will use for DNA extraction. You will have three cultures: transformant1,
transformant2, and wild-type. You will follow the effectiveness of each step by running samples on an
SDS-PAGE gel. Throughout the protocol you will be told to save 15 µl of sample for the SDS-PAGE
analysis. Read through the protocol and prelabel Eppendorf tubes for these samples.
1. Harvest cells by centrifugation at 4000 x g for 20 min.
2. Look for fluorescence by holding next to the UV source; always wear protective goggles when using UV light. You will be given a culture of wild-type E.coli as a comparison.
3. Freeze the cells in liquid nitrogen; this will crack the cell membranes.
4. Thaw the cell pellet for 15 min on ice and resuspend the cells in 4 ml lysis buffer.
5. Add lysozyme to 1 mg/ml and incubate on ice for 30 min. The stock of lysozyme is 10 mg/ml.
6. Transfer to a 6 ml glass tube. Remove 15 µl to a prelabeled tube labeled lysis sample for SDS-PAGE analysis; this is your lysis sample.
7. Sonicate on ice. Use six 10 s bursts with a 15 s cooling period on ice between each burst. Sonication disrupts membranes. This step helps solubolize proteins. It is very important to always keep the tip well submerged in your sample and away from the tube walls. Failure to due this will result in cavitation (bubbles forming). This will result in protein coagulation and consequent decreased solubility. Practice with 4 ml lysis buffer before sonicating your sample. Always wear the hearing protecting ear muffs while sonicating and have everyone within a couple feet use earplugs.
8. Transfer the lysate to three 1.5 ml Eppendorf tubes. Centrifuge lysate at full speed for 20 min at 4°C to pellet the cellular debris.
9. Transfer the supernatant (cleared lysate) to a fresh 15 ml conical being careful not to disturb the pellet. Remove 15 µl to a prelabeled tube for SDS-PAGE analysis; this is your soluble sample.
10. Add 1 ml of lysis buffer to the cellular debris in one of your Eppendorf tubes. Vortex. You will have a suspension not a solution. Remove 15 µl to a prelabeled tube for SDS-PAGE analysis; this is your insoluble sample.
11. Add 1 ml of the 50% Ni-NTA slurry to the 4 ml of cleared lysate and mix gently by shaking (200 rpm on a rotary shaker) at 4°C for 60 min. Make sure to mix the slurry well before using.
3 In a real research situation, you would sequence the plasmid before proceeding with the protein isolation. Since we do not have time, we will do both simultaneously and pick two separate colonies with the hope that one of them expresses your mutagenized protein.

122
12. Load the lysate–Ni-NTA mixture into a column with the bottom outlet capped. Remove bottom cap and collect the liquid that flows through the column; this is termed the flow-through. Do not let the agarose dry out by being relatively quick with the next few steps.
13. Save the flow-through at 4°C. Remove 15 µl to a prelabeled tube for SDS-PAGE analysis; this is your flow-through sample.
14. Wash the column twice with 4 ml wash buffer by pipetting 4 ml of HIS wash buffer above the agarose and collecting the liquid that comes through. Combine wash and save at 4°C. Remove 15 µl for SDS-PAGE analysis. This is your wash sample.
15. Elute the protein 4 times with 0.5 ml elution buffer by pipetting 0.5 ml HIS elution buffer above the agarose and collecting the eluate in four separate tubes. Remove 15 µl to prelabeled tubes for SDS-PAGE analysis; these are eluate 1, eluate 2, eluate 3, and eluate 4 samples.
16. If time permits, look at the emission spectra of a 50 fold dilution of eluate 2 using the EXλ and scanning range you choose on day 3.
17. Store your eluate samples at 4°C. Freezing can lead to precipitation.
Isolate DNA and prepare for sequencing
You will isolate DNA using the Qiagen Miniprep Kit. The QIAprep Miniprep system provides a fast,
simple, and cost-effective plasmid preparation method. The procedure is based on alkaline lysis of
bacterial cells followed by adsorption of DNA onto silica in the presence of high salt concentrations. A
brief outline of the procedure is:
1. The cells are lysed in alkaline conditions while RNAase A in the buffer degrades cellular RNA.
2. The lysate is neutralized with a high-salt buffer.
3. The cell debris is precipitated by centrifuged.
4. The lysate (supernatant) is applied to the spin-column which contains a silica membrane that binds DNA under high salt conditions.
5. The column is washed to remove salts, carbohydrates, and RNA.
6. The DNA is eluted with water. Silica does not bind DNA under low salt conditions.
Detailed DNA isolation protocol:
You will have two cultures (transformant1 and transformant2). Preheat 200 µl ddH2O to 37°C before beginning and work efficiently to ensure good results. All solutions except for Buffer P1 are in the Qiagen Miniprep Kit box. Buffer P1 is kept in the cold room and should be kept on ice. Also make sure RNAase has been added to Buffer P1; a box on the lid should indicate this. All spins are performed at maximum speed (14000 RPM) in a tabletop microcentrifuge. Always be careful to not disturb the pellet when removing supernatant. Centrifuge briefly means hold down the button until the machine is up to speed.

123
1. Transfer 1.5 ml of culture to an Eppendorf tube.
2. Centrifuge 1 min to pellets the cells.
3. Remove the supernatant (growth media) by pipetting.
4. Add another 1.5 ml of culture and repeat steps 2 and 3. You should have a pellet containing cells from 3 ml of culture.
5. Centrifuge briefly and remove remaining media with a P200.
6. Resuspend pelleted cells in 250 μl Buffer P1. The bacteria should be resuspended completely by vortexing or pipetting up and down until no cell clumps remain.
7. Add 250 μl Buffer P2 and mix thoroughly but gently by inverting the tube 4–6 times. Buffer P2 contains NaOH. Do not pipette up and down or vortex; add Buffer N3 (step 8) immediately.
8. Add 350 μl Buffer N3 and mix immediately and thoroughly by inverting the tube 4–6 times. Again, do not pipette up and down or vortex. The solution should become cloudy and colorless.
9. Centrifuge 10 min. A compact white pellet will form, while the DNA remains in the supernatant.
10. Apply the supernatants from step 9 to QIAprep spin columns.
11. Centrifuge for 30–60 s and discard the liquid that flows through.
12. Wash the QIAprep spin column by adding 0.5 ml Buffer PB and centrifuging for 30–60 s. Discard the flow-through. This wash step removes carbohydrates.
13. Wash QIAprep spin column by adding 0.75 ml Buffer PE (make sure ethanol has been added to PE) and centrifuging for 30–60 s. This wash step removes salts.
14. Discard the flow-through, and centrifuge for an additional 1 min to remove residual wash buffer. Residual wash buffer will not be completely removed unless the flow-through is discarded before this additional centrifugation. Residual wash buffer will inhibit your sequencing reaction.
15. Place the QIAprep column in a clean 1.5 ml microcentrifuge tube. To elute DNA, add 30 μl water (preheated to 37°C) to the center of the QIAprep spin column, let stand for 2 min, and centrifuge for 1 min.
16. Quantify your DNA spectrophotometrically. Make 150 µl of a 1/50 dilution and use the DNA quantification function of the spectrophotometers.
Prepare sequencing reaction
We will have the Stanford PAN facility sequence your DNA. You can read about their protocols on their
website http://cmgm.stanford.edu/pan/. You will need to decide which sequencing primer to use. Each
primer is named based on its starting base. Determine which base pair your mutation is in (roughly amino
acid # * 3). Ideally the sequencing primer should be between 30 and 320 base pairs downstream of the
sequencing primer’s start site. Use the table below:

124
Sequencing Primer name
Sequence (5’ to 3’) Position
SQ_before CGGATAACAATTTCACACAG Starts 150 bp upstream of the first Methionine in ZsYellow; use if you mutated amino acid 1 – 60.
SQ_145 TCGAAGGGGGACCATTGCCA Starts at 145; use if you mutated amino acids 58 - 153.
SQ_420 ATGACAACTAACTGGGAAGC Starts at 420; use if you mutated amino acids 150 – 231.
Combine the following to prepare your sequencing samples:
1000 ng of DNA
1 µl sequencing primer (20 pmol/µl)
ddH2O to achieve a total volume of 12 µl
If your DNA concentration is below 90 ng/µl, use 11 µl of DNA. If it is below 50 ng/µl talk to us.
Go to the PAN facility website to order sequencing to be performed. Your sequences will be emailed to
you. Check to see if your plasmid has the mutation you wish. Congratulate yourself if it does, but do not
feel disheartened if it does not. We have mutant strains for you to analyze.
Analyze the protein isolation protocol
You will run a SDS-PAGE gel to analyze your protein isolation. Appendix 2 contains protocols for
running and staining SDS-PAGE gels. Each gel contains 10 lanes, 9 for the samples and 1 for the protein
ladder. You will run two gels, one to analyze the purification of transformant1 and another two visualize
the eluates from wild-type and transformant2. To ensure that you can determine which gel is which after
staining run the ladder in a different lane in each gel. Clearly list the contents of each lane for each gel in
your notebook. To each 15 µl sample that you saved, add 3 µl 5x protein sample buffer with added β-
mercaptoethanol. Boil all samples for 5 min, spin briefly, and keep on ice until you are ready to load your
gels. Load 16 µl sample in each lane. For the ladder, add 1 µl ladder stock to 3 µl sample buffer and 12
µl water, and spin briefly. Do not boil the ladder.
Characterize your mutant ZsYellow
Step 1: Quick characterization
For each of your three protein preps, perform an emission spectrum on each of the 4 eluates. You will be
running 12 spectra total. You are simple looking for the presence of a fluorescence protein.
1. Make 3 ml of a 100 fold dilution for each eluate.

125
2. Obtain an emission scan with the EXλ and scanning range from day 3.
3. Combine the 2 eluates with the highest fluorescence peaks. Label this tube with your mutant name (for example, S148A) and t1, t2 (transformant1, transformant2) or WT for wild-type. You will be performing future analyses on these three samples.
Step 2: Detailed characterization
Analyze the absorbance and fluorescence characteristics of your mutant and wild-type proteins as
described on day 3. The mutants might have different characteristics (that was our goal) so you will have
to reoptimize fluorescence measurement conditions. Every µl of your sample is precious; make sure to
recover your sample from the cuvette after measuring the absorption.
You will need to know the protein concentration in order to calculate the molar extinction coefficient.
Measure the protein concentration of your sample using the BCA (bicinchoninic acid) protein assay kit
from Pierce. The protocol is in appendix 4.
126
Notes for self: for appendices
PyMOL>select NEARAA, (byres chA expand 4 & !chA) ZsYellow PDB: 1XAE