stock assessment and management of multi-species fisheries
TRANSCRIPT

Universidade de Lisboa
Faculdade de Ciências
Departamento de Biologia Animal
Stock assessment and management of multi-species
fisheries: the case study of flatfish fisheries in the
Portuguese coast
Célia Maria Mascarenhas dos Santos Teixeira
Doutoramento em Biologia
Especialidade de Biologia Marinha e Aquacultura
2009

Universidade de Lisboa
Faculdade de Ciências
Departamento de Biologia Animal
Stock assessment and management of multi-species
fisheries: the case study of flatfish fisheries in the
Portuguese coast
Célia Maria Mascarenhas dos Santos Teixeira
Tese orientada por
Professor Doutor Henrique Nogueira Cabral
Doutoramento em Biologia
Especialidade de Biologia Marinha e Aquacultura
2009


To the memory of my Daddy,
and to my Mummy
À memória de meu Pai, e à
minha Mãe


TABLE OF CONTENTS
i
TABLE OF CONTENTS
Acknowledgements/Agradecimentos iii
Resumo vii
Summary xi
List of Papers xiii
Part I – General Introduction 1
Chapter 1 3
General Introduction 5
Fisheries stocks assessment and management 5
Multi-species fisheries 13
Flatfish fisheries in the Portuguese coast 16
Aims and importance of this study 17
Structure of the thesis 18
References 19
Part II – Biology and Ecology of Commercially Important
Flatfishes
33
Chapter 2 35
Comparative analysis of the diet, growth and reproduction of the
soles, Solea solea and Solea senegalensis, occurring in sympatry
along the Portuguese coast
37
Chapter 3 59
Feeding ecology, growth and sexual cycle of the sand sole, Solea
lascaris, along the Portuguese coast
61
Chapter 4 75
Diet, growth and reproduction of spotted flounder, four-spotted
megrim, flounder and bastard sole in the Portuguese coast
77
Chapter 5 101
Genetic diversity and population structure of Solea solea and Solea
senegalensis and its relationships with life history patterns
103
TABLE OF CONTENTS
ii
Part III – Stock Assessment and Fisheries Management 125
Chapter 6 127
Time series analysis of flatfish landings in the Portuguese coast 129
Chapter 7 147
Flatfish fisheries in the Portuguese coast 149
Chapter 8 171
Catches of target species and bycatches of an artisanal fishery: the case
study of a trammel net fishery in the Portuguese coast
173
Part IV – Main Conclusions and Final Remarks 197
Chapter 9 199
Main Conclusios and Final Remarks 201
References 203

ACKNOWLEDGEMENTS/AGRADECIMENTOS
iii
ACKNOWLEDGEMENTS/AGRADECIMENTOS
To all the people that have contributed to this work I hereby express my sincere
gratitude, especially to
A todos os que contribuiram para este trabalho, gostaria de expressar o meu sincero
agradecimento, especialmente a
Professor Henrique Cabral, for taking the supervision of this work, for always trusting
in me, for constant availability and extraordinary suggestions and, for the strong
friendship we have.
Thank you very, very much for always being present!
Professor Doutor Henrique Cabral por ter aceite a orientação deste trabalho, pela
confiança que sempre depositou em mim, pela constante disponibilidade e
extraordinárias sugestões e, pela nossa grande amizade.
Muito, muito obrigada por estares sempre presente!
Professor Maria José Costa, for the opportunity to join the Marine Zoology team at the
Oceanography Institute (FCUL), and for the friendship.
Professora Doutora Maria José Costa pela oportunidade de integrar a equipa de
Zoologia Marinha do Instituto de Oceanografia (FCUL), e pela amizade.
Professor Maria Manuela Coelho, for the opportunity to develop part of this work in the
laboratory of Molecular and Evolutionary Ecology at the Center for Environmental
Biology (FCUL).
Professora Doutora Maria Manuela Coelho pela oportunidade de puder desenvolver
parte deste trabalho no laboratório de Ecologia Evolutiva e Molecular, Centro de
Biologia Ambiental (FCUL).
Governmental Fisheries Bureau (Direcção Geral das Pescas e Aquicultura – DGPA),
especially to Dr. Cristina Ribeiro and Ana Maria Ferreira, for the commercial landings
data. Special thanks to Ana Maria, for the long hours passed in front of the computer
to "filter" the database to send me matrixes of more reasonable size, with more than
3 million lines!
ACKNOWLEDGEMENTS/AGRADECIMENTOS
iv
Direcção Geral das Pescas e Aquicultura (DGPA), em particular à Dr. Cristina Ribeiro e
Ana Maria Ferreira, pelos dados de desembarques comerciais. Um agradecimento
especial à Ana Maria, pelas longas horas que passou em frente ao computador a
“filtrar” a base de dados para me enviar matrizes de tamanho mais razoável, com
mais de 3 milhões de linhas!
DOCAPESCA S.A. (fish houses) for all facilities, but especially Mr. Júlio Seiça, from
Figueira da Foz, for the availability and high ability, and people from the fish markets
for their help with sampling.
DOCAPESCA S.A. por todas as facilidades concedidas, mas especialmente ao Sr. Júlio
Seiça, da Figueira da Foz, pela sua constante disponibilidade e grande competência, e
às pessoas dos mercados pela ajuda na amostragem.
All colleagues that
Todos os colegas que
i) contributed with samples for genetic analysis
i) contribuiram com amostras para a análise genética
Abdellahi Ould Samba, Deirdre Flanagan, Françoise Lagardère, Imane Tai, Jesper
Boje, Kostas Charalambous, Manuela Krakau, Maria Assunção Franco, Marie-Laure
Bégout, Matthew McHugh, Najoua Trigui El-Menif, Natasha Taylor, Pilar Drake and
Sencer Akalin.
b) helped during the process
b) ajudaram durante o processo
Belgin Hossucu, Celia Vassilopoulou, Karim Erzini, Luis Tito de Morais, Marina Busi,
Miguel Santos, Panos S. Economidis, Rachid Amara, Salah Ben Cherifi, Válter
Amaral and Yves Désaunay.
Tatiana Teixeira for helping in the genetic work.
Tatiana Teixeira pela ajuda no trabalho de genética.
Family Marques (Mr. Carlos, Mrs. Esmeralda and Bárbara) and to “cousins” Clô and
Paulo “Alexandre” for welcoming us into their houses in Algarve and Aveiro,
respectively, during the field work, in order to decrease the time of sample processing,
and for all funny moments we lived in these ocasions.
À Família Marques (Sr. Carlos, Sra. Esmeralda e Bárbara) e aos “primos” Clô e Paulo
“Alexandre” por nos emprestarem as casas no Algarve e em Aveiro, respectivamente,
reduzindo assim o tempo de processamento das amostras, e pelos momentos
divertidos que vivemos nestas ocasiões.

ACKNOWLEDGEMENTS/AGRADECIMENTOS
v
All colleagues of Oceanography Institute, especially to Gilda Silva for the identification
of macrobentonic organisms. To Elsa Cabral, Isabel Domingos, Lino Costa and Pedro
Raposo for all fun moments we live along all these years.
A todos os colegas do Instituto de Oceanografia, em especial à Gilda Silva pela
identificação de alguns exemplares de macrofauna. À Elsa Cabral, Isabel Domingos,
Lino Costa e Pedro Raposo por todos os momentos divertidos que vivemos ao longos
destes anos.
All colleagues of the laboratory of Molecular and Evolutionary Ecology, especially to
Anabel Perdices, Carina Cunha, Cristina Luis, Cristiane Bastos-Silveira and Maria Ana
Aboim for the constant availability to teaching everything I know about genetics and
for very, very fun moments we lived in the lab when the PCR run. Thanks girls!
A todos os colegas do laboratório de Ecologia Molecular e Evolução, especialmente a
Anabel Perdices, Carina Cunha, Cristina Luís, Cristiane Bastos-Silveira e Maria Ana
Aboim pela constante disponibilidade para me ensinarem tudo o que sei sobre
genética e pelos momentos muito divertidos que passamos enquanto “corriam” as
PCR. Obrigada Meninas!
All colleagues of our lab for all funny moments we lived, and to understanding my
smaller collaboration in the works of our group, in the end of this thesis. A especially
thanks to
A todos os colegas de laboratório, por todos os momentos divertidos que vivemos, e
por compreenderem a minha menor participação nos trabalhos do nosso grupo, nesta
fase da tese. Um agradecimento especial a
Joana Marques for the work field and the long times past in the lab, times were very,
very funny when we "lived" in the lab or on trip, thanks Jo!
Joana Marques pelas divertidas saídas de campo e pelas longas horas que passámos
no laboratório, foi uma fase muito, muito divertida em que “vivíamos” no laboratório
ou em constantes viagens, obrigada, Jo!
Susanne Tanner for the revisions and valuable suggestions on part of this thesis,
thanks Su!
Susanne Tanner pela revisão e valiosas sugestões a parte deste trabalho, obrigada
Su!
Catarina Vinagre for the revisions and valuable suggestions on this thesis and the
constant availability to help in the end of the work, thanks Cat!
Catarina Vinagre pela revisão e valiosas sugestões para este trabalho e constante
disponibilidade para ajudar na parte final do trabalho, obrigada Cat!

ACKNOWLEDGEMENTS/AGRADECIMENTOS
vi
Inês Cardoso for the help to identify macrobenthic organisms in the stomachs
contents, thanks Nês!
Inês Cardoso pela ajuda na identificação de macroinvertebrados bentónicos,
obrigada Nês!
Válter Amaral for the constant encouragement to concluding this work, thanks Pipo!
Válter Amaral pelo constante encorajamento para concluir este trabalho, obrigada
Pipo!
Marisa Batista for the constant availability for help in different components of this
thesis, thanks Marisita!
Marisa Batista pela constante disponibilidade para ajudar nas diversas componentes
deste trabalho, obrigada Marisita!
Noémie Wouters for your constant enthusiasm relative to my work, and for your
availability, thanks Noé!
Noémie Wouters pelo seu constante entusiasmo relativamente ao meu trabalho e
pela sua disponibilidade, obrigada Noé!
Maria Paula Serafim for hearing me in the stress moments, especially in the end of
this thesis, thanks Mipá!
Maria Paula Serafim por me ouvir nos momentos de stress, especialmente na fase
final desta tese, obrigada Mipá!
My family, especially to my Parents, that always believed in my work, and always
encouraged me, thanks Daddy and Mummy!
À minha família, em especial aos meus Pais, que sempre acreditaram no meu trabalho
e sempre me incentivaram, muito obrigada Pai e Mãe!
This thesis was financed by the Fundação para a Ciência e a Tecnologia, through the
PhD grant SFRH/BD/19319/2004, and the European Union through the FEDER–
Fisheries Programme (MARE).

RESUMO
vii
RESUMO
Nas últimas décadas têm sido intensificados os sinais de sobre-exploração de muitos
mananciais de recursos vivos marinhos. Neste contexto, uma gestão sustentável dos
ecossistemas marinhos reveste-se da maior importância e urgência. Tradicionalmente,
os modelos de gestão incidiam sobre uma única espécie-alvo ou pescaria, tendo-se
revelado pouco eficazes. Mais recentemente, tem-se assistido a uma mudança de
paradigma de gestão, segundo a qual os modelos integradores e holísticos tem sido
indicados como aqueles que poderão garantir a desejada sustentabilidade das
pescarias. As pescarias multi-específicas são um caso particularmente complexo em
termos de gestão, uma vez que capturam uma grande diversidade de espécies e
utilizam um conjunto alargado de artes e técnicas de pesca. A pesca de
Pleuronectiformes na costa portuguesa constitui um desses exemplos de pescarias
marcadamente multi-específicas. Esta pesca é uma actividade tradicional com grande
importância socio-económica nalgumas regiões da costa de Portugal. Embora os
quantitativos desembarcados das espécies de peixe-chatos representem apenas 4%
do total de peixes desembarcados, a sua importância a nível económico é bastante
superior, representando 11% do valor total de peixes.
No decurso do presente trabalho foram estudados alguns aspectos da biologia e
ecologia destes recursos, caracterizadas as suas pescarias e avaliado o estado de
exploração dos mananciais das espécies de Pleuronectiformes com interesse comercial
na costa portuguesa.
Este trabalho é constituído por nove capítulos organizados em quatro partes. Na
introdução geral (Capítulo 1) são abordadas a importância da avaliação e gestão dos
stocks de pesca, destacando as pescarias multi-específicas pela sua complexidade,
atribuindo particular destaque à pesca de Pleuronectiformes, que constitui uma
importante actividade socio-económica para algumas comunidades da costa
portuguesa para a qual não existem estudos de avaliação, sendo as medidas de
gestão incipientes.
No Capítulo 2 foi efectuado um estudo comparativo da dieta, crescimento e
reprodução do linguado legítimo, Solea solea (Linnaeus, 1758), e do linguado do

RESUMO
viii
Senegal, Solea senegalensis Kaup, 1858, que ocorrem em simpatria na costa
portuguesa. Ambas as espécies alimentaram-se principalmente de crustáceos,
poliquetas e bivalves. A dieta variou consoante a época do ano, com o tamanho e o
sexo dos indivíduos. O linguado legítimo consumiu uma maior diversidade de presas
comparativamente ao linguado do Senegal e durante o Outono-Inverno verificou-se
uma sobreposição trófica elevada entre as fêmeas das duas espécies. A actividade
alimentar foi mais elevada durante a Primavera-Verão, particularmente no caso das
fêmeas e dos indivíduos de menores dimensões. A idade e crescimento foi
determinada com base na leitura de otólitos, e os parâmetros de crescimento da
equação de von Bertalanffy permitiram verificar que fêmeas e machos apresentam
crescimento diferenciado, atingindo as fêmeas maiores dimensões. A análise
macroscópica das gónadas permitiu determinar que a época de postura ocorre
principalmente no Outono-Inverno, para ambas as espécies.
O estudo da ecologia alimentar, crescimento e ciclo sexual do linguado da areia, Solea
lascaris (Risso, 1810) (Capítulo 3), revelou que a dieta desta espécie é constituída,
principalmente, por misidáceos, anfípodes e poliquetas. A diversidade de presas
ingeridas apresentou variações sazonais e ontogénicas. O crescimento foi diferente
para fêmeas e machos, atingindo as fêmeas dimensões superiores às dos machos. A
época de postura estendeu-se do Inverno à Primavera.
No Capítulo 4 foi estudada a ecologia alimentar, o crescimento e a reprodução da
carta, Citharus linguatula (Linnaeus, 1758), do areeiro-de-quatro-pintas,
Lepidorhombus boscii (Risso, 1810), da solha, Platichthys flesus (Linnaeus, 1758), e
da azevia, Microchirus azevia (de Brito Capello, 1867). A carta e o areeiro-de-quatro-
pintas consumiram principalmente peixes, decápodes e misidáceos, e a solha
alimentou-se preferencialmente de equinodermes, crustáceos e bivalves. A azevia
alimentou-se principalmente de presas com pouca mobilidade, sendo os itens mais
importantes na dieta os poliquetas e alguns decápodes. A composição da dieta variou
com a época do ano, com o tamanho e com o sexo dos indivíduos. A actividade
alimentar foi mais intensa no caso das fêmeas e dos indivíduos de menores
dimensões, durante a Primavera-Verão. A azevia foi a espécie que apresentou um
maior espectro alimentar, particularmente os machos e os indivíduos de maiores
dimensões, durante o Outono-Inverno. Para as várias espécies estudadas, o
crescimento foi diferente consoante o sexo dos indivíduos, atingindo as fêmeas
maiores dimensões que os machos (excepto para C. linguatula). A época de postura
do areeiro-de-quatro-pintas e da solha ocorreu no Outono-Inverno, enquanto que para
a carta e a azevia verificou-se a existência de indivíduos maduros durante
praticamente todo o ano.

RESUMO
ix
A análise da diversidade genética e da estruturação populacional de S. solea e S.
senegalensis foi abordada no Capítulo 5. Este estudo foi baseado na análise da
sequência completa do citócromo b do ADN mitocondrial de amostras obtidas ao longo
da área de distribuição das espécies consideradas. Ambas as espécies apresentaram
baixa diversidade haplotípica e moderada a elevada diversidade nucleotídica. S. solea
apresentou estruturação populacional, ocorrendo divergência genética entre as
populações do Atlântico e do Mediterrâneo, e dentro do Mediterrâneo, entre as
populações do ocidente e do oriente. S. senegalensis apresentou um padrão de
heterogeneidade genética entre populações separadas geograficamente.
No Capítulo 6 foram analisados os desembarques mensais da pesca comercial de
várias espécies de Pleuronectiformes, efectuados ao longo da costa portuguesa, entre
os anos de 1992 e 2005. As espécies mais importantes em termos de desembarques
foram os linguados, a azevia, a solha, a carta, a língua (Dicologlossa cuneata (Moreau,
1881)), o pregado (Scophthalmus maximus (Linnaeus, 1758)), o rodovalho
(Scophthalmus rhombus (Linnaeus, 1758)) e os areeiros (Lepidorhombus boscii
(Risso, 1810) e Lepidorhombus whiffiagonis (Walbaum, 1792)). Com o objectivo de
identificar quais os factores que melhor explicavam as tendências verificadas nos
desembarques, foram aplicados modelos lineares generalizados aos desembarques
mensais das espécies consideradas sendo as variáveis explicativas o índice de
oscilação do Atlântico Norte, a temperatura da água à superficie, a componente
escalar do vento e a precipitação. Na série temporal considerada, os desembarques
não apresentaram uma tendência comum para os diferentes grupos de espécies
consideradas. Para a maioria dos grupos de espécies, foram encontradas relações
significativas entre o mês e a temperatura da água à superfície e os desembarques
por unidade de esforço. Para algumas espécies, o padrão de variação sazonal dos
desembarques por unidade de esforço reflectiu as migrações efectuadas aquando da
reprodução, período no qual se verifica a concentração de indivíduos nalgumas zonas
da plataforma continental, o que aumenta a sua vulnerabilidade à pesca.
No Capítulo 7 foi caracterizada a pesca de peixes-chatos na costa portuguesa. A frota
que captura Pleuronectiformes, apresentou grande heterogeneidade, sendo a grande
maioria constituída por pequenas embarcações, que utilizam várias artes de pesca.
Com recurso a uma análise canónica de correspondências foi possível identificar vários
segmentos de frota, que utilizam diferentes artes e/ou técnicas de pesca. A maioria
das espécies de peixes-chatos foi capturada conjuntamente com choco, polvos e raias,
principalmente por pequenas embarcações que operam junto à costa. Os areeiros e a
carta foram capturados conjuntamente com a pescada, pequenos peixes pelágicos e
tamboris, por embarcações que operam com rede de arrasto. Para investigar a
variação dos desembarques na série temporal considerada (1992-2005), foram

RESUMO
x
utilizados modelos lineares generalizados, sendo os preditores o ano, o mês, o porto
de desembarque e o comprimento da embarcação. Os preditores que melhor
explicaram a variação dos desembarques foram o porto de desembarque, o
comprimento da embarcação e o mês. Estes resultados sugerem que existe elevada
variabilidade espacio-temporal, mas que as características técnicas das embarcações
também têm um importante contributo na variação dos desembarques.
O Capítulo 8 teve como objectivo determinar quais as espécies-alvo e as capturas
acessórias da pesca com redes de emalhar na costa centro de Portugal, e assim
estimar a percentagem de rejeições associada a esta pescaria. Este estudo foi baseado
em campanhas de amostragem com observadores a bordo das embarcações da pesca
comercial na zona de Setúbal e Sesimbra. As espécies-alvo destas embarcações foram
o linguado legítimo, o linguado do Senegal e o choco. As capturas acessórias
corresponderam a cerca de 60% do total capturado, sendo rejeitadas cerca de 40%
das espécies acessórias. Foram várias as razões pelas quais as espécies foram
rejeitadas, nomeadamente por não terem valor comercial, por se encontrarem em
mau estado de conservação e por isso não poderem ser vendidas, ou porque os
indivíduos capturados se encontram abaixo do tamanho mínimo autorizado. Estimou-
se que as rejeições desta pescaria, cuja frota é constituída por cerca de 200
embarcações, totalizem 174 toneladas ano-1.
Finalmente, no Capítulo 9, é feita a síntese das principais conclusões e indicados
alguns tópicos que necessitariam de investigação futura.
Palavras-chave: Pleuronectiformes, pequena pesca, pesca multi-específica,
avaliação de stocks, gestão

SUMMARY
xi
SUMMARY
Multi-species and multi-gear fisheries present several problems to management.
Traditionally, marine resources stock assessment and fisheries management was
based in a single-species approach, which clearly proved to be ineffective. The present
work analysed the flatfish fisheries along the Portuguese coast as a case study of a
multi-species and multi-gear small-scale fisheries. Biological and ecological data
regarding the main flatfish species with commercial importance for these fisheries was
obtained. The diet, age and growth and spawning period of the common sole (Solea
solea), Senegalese sole (Solea senegalensis), sand sole (Solea lascaris), bastard sole
(Microchirus azevia), flounder (Platichthys flesus), spotted flounder (Citharus
linguatula) and four-spotted megrim (Lepidorhombus boscii) were characterized.
Common sole, Senegalese sole, sand sole and bastard sole fed mainly on crustaceans
(amphipods, decapods and mysids), polychaetes and molluscs, while the spotted
flounder and four-spotted megrim consumed mainly fishes, decapods and mysids, and
flounder fed preferentially echinoderms, crustaceans and bivalves. The estimates of
growth and asymptotic lengths obtained showed that females were larger than males,
for the same age, with the exception of the spotted flounder. Spawning occurred
mainly in autumn-winter for common sole, Senegalese sole, four-spotted megrim and
flounder, between winter and spring for sand sole, and throughout the year for
spotted flounder and bastard sole. Genetic analysis evidenced the existence of
population structure in the common sole and Senegalese sole, being evidenced an
Atlantic-Mediterranean differentiation and of Eastern and Western Mediterranean
populations for common sole and a isolation by distance model of population structure
for Senegalese sole. The analysis of fisheries landings revealed that flatfishes were
captured mainly during the spawning season, when fishes concentrate in areas near
the coast and are particularly vulnerable to fisheries. The fisheries fleet that catch
flatfish is mainly composed by small vessels. The capture of soles, flounder, bastard
sole, turbot and brill were associated with cuttlefish, octopus and rays. Megrims and
spotted flounder were caught with hake, small pelagic fishes and anglerfishes by
trawlers. Bycatches associated with flatfish fishery in the central coast of Portugal

SUMMARY
xii
represented near 60% of the total catches, being the amount of discards ca. 40%. The
management of these fisheries was discussed and some measures proposed.
Keywords: flatfish, small-scale fisheries, multi-species fisheries, stock
assessment, management
xiii
LIST OF PAPERS
This thesis comprises the papers listed below:
Teixeira, C.M., Cabral, H.N. (submitted). Comparative analysis of the diet, growth and
reproduction of the soles, Solea solea and Solea senegalensis, occurring in
sympatry along the Portuguese coast. Journal of the Marine Biological Association
of the United Kingdom.
Teixeira, C.M., Pinheiro, A., Cabral, H.N. (in press). Feeding ecology, growth and
sexual cycle of the sand sole, Solea lascaris, along the Portuguese coast. Journal of
the Marine Biological Association of the United Kingdom
doi:10.1017/S0025315409002562.
Teixeira, C.M., Batista, M.I., Cabral, H.N. (in revision). Diet, growth and reproduction
of spotted flounder, four-spotted megrim, flounder and bastard sole in the
Portuguese coast. Scientia Marina.
Teixeira, T., Teixeira, C.M., Marques, J.M., Coelho, M.M., Cabral, H.N. Genetic
diversity and population structure of Solea solea and Solea senegalensis its
relationships with life history patterns.
Teixeira, C.M., Cabral, H.N., 2009. Time series analysis of flatfish landings in the
Portuguese coast. Fisheries Research 96, 252–258.
Teixeira, C.M., Batista, M.I., Cabral, H.N. (submitted). Flatfish fisheries in the
Portuguese coast. Fisheries Research.
Batista, M.I., Teixeira, C.M., Cabral, H.N. (submitted). Catches of target species and
bycatches of an artisanal fishery: the case study of a trammel net fishery in the
Portuguese coast. Fisheries Research.
The author of the present thesis had a leading role in the conception, execution,
analysis and writing of all the articles listed. All articles published or in press were
included with the kind permission of the publisher.


PART I
General Introduction


CHAPTER 1

CHAPTER 1
5
General Introduction
Fisheries Stocks Assessment and Management
Fisheries are an important source of food, with a high economic value and social
significance. In the last decades, catches have increased, because a growing human
population requires more food and improved technology has simplified all processes
involved in fisheries (e.g. captures, processing, distribution). The world fisheries
production increased from 18.9 million tonnes, in 1951, to 141.6 million tonnes, in
2005 (source: FAO). Marine fisheries are the largest contributors to the world
production, but a decreasing trend has been noticed: marine landings accounted for
90.8% of the total fish production (18.1 million tonnes), in 1951, and this value was
reduced to 72.5%, in 2005 (102.7 million tonnes) (source: FAO).
The growing demand for marine products leads to a continuous increase in the
exploitation on most marine resources. Many authors (e.g. Jackson et al., 2001;
Hutchings and Reynolds, 2004; Caddy and Seijo, 2005; Beddington et al., 2007)
recognized problems in the current status of marine fisheries, especially in what
regards the collapse of many important fisheries stocks all around the world (Watson
and Pauly, 2001; Worm et al., 2006). Overfishing is recognized as the major
contributor to observed collapses, which is attributed mainly to technological
advancements among the fishermen community to increase the fishing efficiency (e.g.
Hall, 1999; Pauly et al., 2002). The present situation of the world fisheries is the
result of the interaction of different factors, like, climatic variations, bio-ecological
(e.g. natural oscillations), technological innovation, exponential development of fishing
capacity, geographic expansion, economic, socio-cultural, institutional and legal (e.g.
Garcia and Grainger, 1996; Haddon, 2001).

General Introduction
6
Fishing activity depends on the state of the resource, and the state of the resource
also influences the fishing activity. Thus, knowledge is needed on each of those two
components and on their interaction (Hilborn and Walters, 1992). Fisheries science
has tried to understand the processes governing the dynamics of fish stocks and to
predict sustainable yield levels of exploited marine resources. Fisheries data analysis is
useful for stock assessment purposes, for modelling harvested population dynamics
and for fisheries management. In fisheries, a quantitative model involves many steps,
being the first of all the collection of data from commercial fisheries and research
vessel surveys, which are required as input in the modelling (Shepherd, 1988; Hilborn
and Walters, 1992; Fournier et al., 1998). Mathematical models were developed based
on certain biological, ecological or economical theories to describe the information
collected from fisheries (Schnute and Richards, 2001).
Traditionally, fisheries models are based on estimates of parameters characteristics of
the population and/or fishing regime (e.g. productivity, growth, maturity, fecundity,
recruitment, mortality rate, fishing effort, catches, landings). All different data types
used in these models present some limitations:
Groundfish surveys indices – the stock distribution in relation to the survey area may
itself vary with abundance (Hutchings, 1996) or with changing environmental
conditions, leading to non-proportionality between abundance and catch-per-unit-of-
effort (CPUE), catchability of fish that may vary with season, location and other factors
(Godø, 1994; Hjellvik et al., 2002);
Landed quantities – the length and age distributions are properties of the total
landings, not of the actual fish stock (Hilborn, 1992; Fabrizio and Richards, 1996),
because these landings depends on the gear selectivity and discarding practices, and
represent a fraction of space and time;
LPUE – reflects changing markets, fisheries techniques, fishing tactics, discarding and
stock distribution (Fréon and Misund, 1999; Rose and Kulka, 1999);
Age-length keys – the variation of length-at-age generally is higher among fishing
vessels than within the catches of individual vessels (Sen, 1986);
Coefficient of natural mortality – sampling variability and costs are the major problems
for the estimation of this parameter. Pope (1979) outlined that the variation of this
coefficient with age may be confounded with the exploitation pattern with age, i.e.
with catchability, selectivity and discarding, while variation with time may be masked
by the variation of mortality due to fishing.
There are many types of assessment models/methods commonly used:
Integrative analysis (Fournier and Archibald, 1982) – including all data into a single
analysis. This methodology is usually applied to catch-at-age analysis. Because catch-

CHAPTER 1
7
at-age data are insufficient to produce reliably estimates of all the parameters of an
age-structured model (Doubleday, 1976), and it will be necessary auxiliary
information or additional assumptions (Deriso et al., 1985). The most common form of
auxiliary information used is an index of relative abundance. This abundance index is
usually based on CPUE or survey data;
Bayesian analysis (Gelman et al., 1995; Punt and Hilborn, 1997) – is a convenient
method to include prior information into an analysis and represent uncertainty. The
prior information can come from analyses of data from previous studies on the same
population, from studies on different populations of the same species, from studies on
different species, or from expert judgment. Prior information differs from traditional
data included in stock assessments, since is typically information relative to certain
parameters of the model, rather than observations that can be predicted from the
model;
Meta-analysis (Myers et al., 1999) – is a method used to share information among
multiple data sets. Data sets with little information about a parameter borrow
information from the other data sets. In addition, to provide improved estimates for
individual data sets, meta-analysis can be used to describe the distribution of the
parameter for all data sets, which can be used as a prior distribution in future
analyses. This analysis is a special case of integrated analysis in which each analysis is
the same, but each is applied to a different data set. In fisheries applications each
data set usually represents a different population or species;
Virtual Population Analysis (VPA) – is typically based in a cohort analysis (Pope, 1972;
Siddeek, 1982). VPA involves, for each age, in each year, for every year class,
estimation of the catch and the coefficient of instantaneous total mortality. This
method fails the basic requirement of an assessment to provide confidence limits for
its estimates. This is because the data and the equation are assume to be exact, a
subjective decision contrary to the one of the ideals of stock assessment – depend
upon the minimum of subjective decisions (Cotter et al., 2004). The main problem
with VPA is that it operates retrospectively and provides least information about stock
sizes and values of fishing mortality in the last year of the analysis, that is usually the
one of most interest for predicting future performance of the fishery.
These models differ greatly in their mathematical structure, assumptions, data
requirements, biological and ecological implications, and output. The choice of a model
for a given fishery is often decided by the quantity of information available for stock
assessment.
For a given model, error structure is assumed, and subsequently an objective function
can be established based on this error for the model (e.g. Collie and Sissenwine,
General Introduction
8
1983; Schnute and Hilborn, 1993; Chen and Paloheimo, 1998). Parameters of the
model can then be estimated by optimizing the objective function (Quinn and Deriso,
1999). A combination of the assumed model form and error structure determines the
objective function, which in turn dictates the parameter estimation. Therefore, a
realistic assumption of the model error structure is essential for reliable parameter
estimation in stock assessment. An unrealistic assumption of the model error structure
may lead to large errors or even biases in parameter estimation (e.g. Schnute and
Hilborn, 1993; Schnute and Richards, 1995; Chen and Andrew, 1998).
Errors in fisheries modelling come from different sources (Hilborn and Walters, 1992;
Schnute and Hilborn, 1993). Chen and Paloheimo (1998) referred that four different
types of errors have been identified in fisheries modelling:
Measurement errors are consequence from the inability to measure fisheries or
ecological variables accurately (Walters and Ludwig, 1981);
Process errors result from the inability to describe the dynamics of fisheries accurately
taking into account random variation in the environment (Rosenberg and Restrepo,
1994);
Model errors result from the selection of an inappropriate model to describe the
dynamics of fisheries (Schnute and Richards, 2001);
Operating errors are due to the measurement of a variable that is different from the
one we intended to measure (Rosenberg and Restrepo, 1994; Chen and Paloheimo,
1998).
All four types of errors are likely to exist in a fisheries model, but it is assumed that
model and operating errors are nonexistent to simplify modelling (Helser et al., 2001).
Thus, uncertainty considered in fisheries modelling mainly includes measurement and
process errors (Restrepo, 1999).
The quality of stock assessment is directly linked to the quality of the catch statistics
and negatively affected by illegal or misreported landings, as well as by discarding.
CPUE data are the most important data source in many stock assessments (e.g.
Maunder and Punt, 2004; Quirijns et al., 2008), where CPUE is usually assumed to be
linearly proportional to abundance. Therefore, CPUE is usually standardized to remove
these types of effects when constructing the index of abundance used in the stock
assessment (Maunder and Punt, 2004). Many factors other than abundance can
influence CPUE. These include environmental factors (e.g. temperature), fishing
methods (e.g. trawl versus longline), fishing equipment (e.g. the use of sonar),
fishermen behaviour (e.g. experience), management (e.g. the introduction of a quota
management system), and economic factors (e.g. the price of fuel) (e.g. Anderson,
CHAPTER 1
9
1994; Daan, 1997; Horwood and Millner, 1998; Rose and Kulka, 1999; Marchal et al.,
2002).
Stock identification is a basic component of modern fisheries stock assessments and
population dynamics, because most population models assume that the group of
individuals has homogeneous vital rates and a closed life cycle which young fish in
group were produced by previous generations in the same group. Stock structure and
delineation are uncertain, the reliability of stock assessments, and therefore the
effectiveness of fishery management, is severely limited for many fishery resources.
Several definitions of the stock concept have been described throughout the fisheries
literature (e.g. Royce, 1972; Booke, 1981; Ihssen et al., 1981; Hilborn and Walters,
1992). Any acceptable stock concept could be applied as long as the markers that are
used are inherited and can define a specific fish group associated to a habitat (Booke,
1999).
Fish stocks are identified on the basis of variation in characteristics between stocks,
with the strongest influences on stock structure drawn from a suite of complementary
techniques that cover multiple aspects of the biology and life history characteristics of
a fish species. A holistic approach to stock identification maximizes the likelihood of
correctly defining fish stocks (Begg and Waldman, 1999). Overlaying all available
information from a range of techniques would enable consistent and definitive patterns
of stock structure to be developed, relative to the needs of fisheries management.
Genetic variation is useful for determining evolutionary differences between stocks, in
contrast to phenotypic variation that is more applicable for studying short-term
environmentally induced differences between stocks.
Fisheries management is a broad term that describes the process of administering
control of fishing for exploited fish stocks. Fisheries management applies to numerous
different fish species that live in various ecosystems and involve different political
systems and user groups as well as local and cultural traditions.
Historically, fisheries management has focused on achieving objectives that relate to
the well-being of commercially harvested species. The adoption of the 200 nautical
miles limit for Exclusive Economic Zones, in 1977, brought nearly all fish stocks under
the control of national governments. Most countries currently use quota management
systems with an annual Total Allowable Catch (TAC) from a single-species as their
main management instrument. In determining the total permissible catch from each
stock, some countries follow the precautionary approach.
A commitment to apply a Precautionary Approach (PA) to sustainable use of resources
was made at Rio de Janeiro Summit, in 1992 (UN, 1992), and this commitment has
been brought into a large number of international policy instruments (Richards and

General Introduction
10
Maguire, 1998). The implementation details differs widely among jurisdictions, the
foundation of a functional PA is a set of explicit objectives and quantitative reference
points, as integrated in the Guidelines for a Code of Conduct for Responsible Fishing
(FAO, 1997).
Reference points can be defined in any biological currency, with fisheries science and
management agencies commonly using fishing mortality and mature biomass
(Restrepo et al., 1998; Anonymous, 2002).
The underlying notion of the precautionary principle is to manage the fish stock
“within safe biological limits”. These safety limits are established by International
Council for the Exploration of the Sea (ICES) and other organizations through an
assessment of the fish stock biomass. For species with less available data, decision
makers act conservatively, so that fewer data translate into more restrictive limits.
The precautionary references points are:
Limit reference points for spawning stock biomass (Blim) – the biomass level below
which the possibility of a total breakdown of the stock is very high and the
reproductive capacity reduced;
Precautionary level for stock biomass (Bpa) – a stock size level such that a short-term
reduction in fishing effort is expected to allow the stock to recover above this limit;
Limit reference point for fishing mortality (Flim) – the annual fishing level above which
the risk of a total breakdown of the stock is extremely high;
Precautionary level for fishing mortality (Fpa) – the annual fishing level above which
the risk that the stock size falls below Bpa is high.
Most scientific agencies worldwide, have traditionally given fishery management
advice on a stock-by-stock basis. In the Northeast Atlantic the principal form of
management is by annual TAC for a limited number of species. TAC is guided by a
single-species assessment. A long-term monitoring of fish communities has provided
unique insights into the effects of fishing and the environment on marine ecosystems
(e.g. Overholtz and Tyler, 1985; Duplisea and Kerr, 1995; Bianchi et al., 2000).
Management has been unsuccessful for multi-species fisheries (Holden, 1994;
European Commission, 2001), and several demersal stocks have declined to
historically low levels, while exploitation levels remain too high (ICES, 2004). The
main problem in managing multi-species fisheries by single-species TAC is that the
latter do not restrict the catch but only the landings, the over-quota catch of a species
perhaps being discarded or landed illegally (Holden, 1994; Daan, 1997). This occurs
because the TAC for different target species may not be depleted in synchrony, so
fishing continues when the TAC for one species has been depleted. This has two main
effects, fishing mortality is not constrained by the TAC and, deteriorating catch
CHAPTER 1
11
statistics lead to inaccurate assessments and uncertainty in the advice. Effort
management has been proposed as a possible means of resolving these problems and
improving the effectiveness of management (Daan, 1997; Ulrich et al., 2002;
Shepherd, 2003).
Facing the relative failure of TAC as the main tool for fisheries regulation, there is an
increasing interest in alternative management measures. Selective gears are
considered in many fisheries to reduce technical interactions (Murawski and Stewart,
1996; Commission of the European Communities, 2001). Marine protected areas
(MPA) are also more and more used to protect particular population stages and/or to
preserve habitat and food webs (Botsford et al., 1997; Holland, 2000). The
effectiveness of MPA is known to depend on the design of the closure (local, size,
time) (Sumaila et al., 2000; Jamieson and Levings, 2001) and on interactions with
other management measures (Holland, 2003). Evaluating the impact of such
alternative management options is essential for fisheries management (Gulland, 1983;
Hilborn and Walters, 1992).
Singles-species approach which ignores dependencies between species induced by
trophic relationships and by technical interactions in multi-species fisheries (Botsford
et al., 1997; Sumaila et al., 2000). The lack of consideration of spatial and seasonal
heterogeneities in models of populations and fishing activity dynamics (Pet et al.,
1996; Maury and Gascuel, 1999; Holland, 2000). This is particularly critical in a multi-
species fisheries context where the diversity of resources and fishing activities make it
difficult to estimate resulting fishing mortality (Murawski and Stewart, 1996). Given
the complexity of multi-species fisheries dynamics, simulation models are necessary to
evaluate the efficiency of alternative management measures.
Fisheries management showed an increasing and renewed interest in the last decade,
and have been addressed in may fora (e.g. Pauly et al., 1998; Caddy and Cochrane,
2001; Baum et al., 2003; Myers and Worm, 2003). Much of the stimulus for this has
come from stock collapses of fisheries, such as cod, haddock, halibut, yellowtail
flounder and capelin (e.g. Gjoesaeter, 1995; Hutchings, 2000; Fu et al., 2001),
increased awareness of uncertainty and the subsequent incorporation of the
precautionary approach into management decisions (e.g. Rosenberg and Brault, 1993;
Ward et al., 2000; Stergiou, 2002) and the negative impacts of fishing on marine
ecosystems (e.g. Dayton et al., 1995; Turner et al., 1999; Rochet et al., 2005).
Management approaches that actively incorporate the objective of reducing disruption
of ecosystems through fisheries are also referred as ecosystem-based management
systems. This approach focuses not only on maintaining strong stock levels of the
target species, but also on protecting biological diversity. The ecosystem-based
General Introduction
12
approach hence extends beyond the precautionary approach to fish stock
management as it incorporates species interactions with other components of the
ecosystem. This approach demands not only the sustainable use of fish stocks but also
the protection of the aquatic environment by requiring the use of non- or low-impact
fishing gear.
An ecosystem-based approach to fisheries management has become a key goal of
national and international institutions. A key objective of any ecosystem approach is
maintaining the productivity of fish communities, as well as harvests from those
communities, within a desired range. Multi-species models (e.g. Collie and Gislason,
2001), ecosystem models (Walters et al., 2005), and general ecosystem principles
suggest that the sum of single-species maximum sustainable yields (MSY) can be a
poor proxy for the MSY of a multi-species complex, because of ecological interactions
and fishing impacts. Simulations of exploited populations and management procedures
provide insight into the sensitivities of a system to different management regimes,
even if the ultimate management performance cannot be predicted (e.g. Harwood and
Stokes, 2003; Kell et al., 2005; Pastoors et al., 2007).
Marine ecosystems are very complex, and one of the major problems with ecosystem
approaches is the difficulty of defining operational objectives and performance
measures. The main objective of this approach should be to rebuild ecosystems,
rather than species-by-species sustainability (Pitcher and Pauly, 1998; Pitcher et al.,
1998). There is a need to integrate comprehensive models of key species of interest
with comprehensive model of the biological, physical and chemical environment in
which they live, while at the same time reducing the dimensions of complexity to
manageable levels.
Mace (2001) suggests there are three fundamental prerequisites for successful
ecosystem-based management:
Reduce fishing mortality overall – eliminating overfishing on individual target species;
Eliminate overcapacity – controlling the size of fishing fleets and limiting participation
levels by regulation, or implicitly by implementation a management system such as
Individual Transferable Quotas (ITQ);
Conduct adequate baseline monitoring of marine species and their environment –
recommend improved monitoring of all marine species in order to facilitate a
comprehensive ecosystem approach.
Trites et al. (1999) pointed out that the main criticism of ecosystem models is that
they may not be able to predict changes in community structure.
Portuguese fisheries management is guided by the Common Fisheries Policy (CFP) of
the European Union (EU), the present management system includes the establishment

CHAPTER 1
13
of annual TAC and quotas for some species, technical measures (minimum mesh size,
selective fishing gear, closed areas and seasons, minimum landing size for fish and
limits on by-or incidental catches) and limitation of fishing effort.
In Portugal, several species (sole, plaice, whiting, Norway lobster, pollack,
anglerfishes, hake, megrims, anchovy, blue whiting, mackerel, bluefin tuna, horse
mackerel and swordfish) have limitations in fishing (TAC, quotas, and minimum legal
size), although only some of them have been assessed (hake, horse mackerel,
megrim, anglerfish, sardine, anchovy and Norway lobster). The assessment has been
only based on spawning stock and fishing mortality (ICES, 2007).
However, the need to intervene in fisheries became more urgent and the aim of
regulatory measures put forward was to make fishers internalize social value of the
resource in such a way to as to nullify the external costs and stimulate efficient and
conservationist ways of treating the natural resource. Although the main point of
departure from the status quo in the fisheries took place on an international scale,
with redefinition of international maritime law in the 1960’s, these generalized needs
for regulations would be transferred to a local level (Garza-Gil et al., 2003). Effective
fisheries sustainable development requires a significant investment to collect the
needed information (Garcia and Staples, 2000; FAO, 2005).
Multi-species Fisheries
Multi-species fisheries are a complex system characterised by a high spatial and
temporal variation, and a high diversity of gears and techniques. The small size of
vessels may limit travel distances to areas surrounding homeports, especially in winter
when bad weather may put long fishing trips at risk. The target species for these
vessels occur mainly in coastal areas. The changing patterns of fishing tactics (fishing
location, fishing gear or target species) is based on the multitude of factors, like the
weather conditions, the knowledge of fishing grounds, the seasonal availability of
resources, the market demand, the recent fishing yield and income, the tradition as
well as information and rumours about the yield of other fishermen.
In multi-species fisheries modelling, technical interactions have traditionally been
promoted separately from biological interactions among species. The first stage
towards identification of technical interactions is a precise description of fishing
activity. The concept of the métier was introduced in order to categorise the activities
of the fishing fleets. Métier is usually defined by the use of a given fishing gear in a
given area and season, in order to target a single or group of species (e.g. Mesnil and
General Introduction
14
Shepherd, 1990; Laurec et al., 1991; Lewy and Vinther, 1994). The métier concept
brings more exact description of the fishing activity than the single term “gear”. This
concept is commonly used associated to measures of fishing effort (e.g. Biseau, 1998;
Ulrich et al., 2001; Alemany and Álvarez, 2003; Tzanatos et al., 2006), however it is
sometimes referred as “fishing tactic” or “trip type” (e.g. Pech et al., 2001; Jiménez et
al., 2004; Christensen and Raakjær, 2006; Tsitsika and Maravelias, 2008).
Identification of métiers, in the majority of cases, has been based on the analysis of
datasets on species composition from commercial fisheries or major projects for
collecting landings data, in terms of catch or CPUE (e.g. Pelletier and Ferraris, 2000;
Ulrich et al., 2001; Silva et al., 2002; Holley and Marchal, 2004).
Understanding the way fishermen select and change métiers is an important step for
the improvement of fisheries management. It can help to predict the outcome of
different management actions and select appropriate management strategies (Cabrera
and Defeo, 2001; Salas and Gaertner, 2004).
Fishing gears select catch by size and species (MacLennan, 1992; Dalzell, 1996) and a
well-managed fishery is expected to use gear that catch most of the available species
at sizes that do not undermine sustainability. Some gears, may take a wide variety of
sizes and species with only the smallest individuals avoiding capture (Dalzell, 1996;
Gell and Whittington, 2002), other gears, may also take a wide variety of species, but
may be very size selective, taking only a relatively narrow range of lengths, depending
on the size of the mesh (Acosta, 1994). Gear type and use can therefore affect the
efficiency of fish capture, the selectivity and composition of fish resources. The use of
gears and understanding the factors that influence use are also vital to determine the
interaction between social and ecological change (Stergiou et al., 1996; Glaesel,
2000).
The majority of fishing methods have low species selectivity and result in incidental
catches (bycatches) that include species that are unwanted and discarded (discards)
and species that are retained and sold (Stobutzki et al., 2003).
Discarding can be highly variable in space and time as a consequence of changing
economic, environmental, biological and sociological factors (Crean, 1994; Gillis et al.,
1995; Maynou and Sarda, 2001; Bergmann et al., 2002). Discarding usually occurs
due to market forces (non-commercial and low value species, low condition and small
size) and as a direct result of management measures (minimum landing size and
landings restrictions) (Vestergaard, 1996). Discarding patterns are initially influenced
by catch compositions, which are determined by environmental and social (regulations
and fishermen’s behaviour) factors, and are ultimately controlled at the discretion of
fishermen, who are influenced by landing constraints and economic forces.

CHAPTER 1
15
Fishermen discard when they catch the wrong species or the wrong sizes of target
species, the catch are damaged, the species quota is reached, or when high grading is
practised. These factors decide the fate of the catch; however, it is the processes that
occur before fishermen decide on what to land, that have led to the continued high
level of discarding. Two processes are identified here as the fundamental causes of
high discarding in the European demersal fisheries: the use of unselective fishing
techniques, leading to high discard rates, and the failure to restrict fishing effort,
leading to high volumes of discards.
Gill nets and trammel nets are fairly size selective but the type and quantity of
bycatch is largely dependent on the fishing area and the time of the year (Goñi,
1998). In what regards discards, the extent of this practice is unknown. However,
discards estimates are necessary not only for evaluating the impact of fishing on non-
commercial species but also on ecosystems as a whole (Alverson et al., 1994).
Systematic underestimation of fishing mortality increases the risk of overexploitation
(Goñi, 1998).
In addition to official fisheries landings and discards, catches can also include a certain
amount of illegal (e.g. such as time or area closures, species quotas, gear
restrictions), unreported and unregulated catches. This unknown fraction of catches
could profoundly affect estimates of stock abundance and safe removal rates
(Ainsworth and Pitcher, 2005). Discard estimations are essential for assessing the full
impact of fisheries upon fish populations and upon the ecosystem in which they
operate. As the survival of discarded organisms can be low (Evans et al., 1994),
discarding can be a substantial component of fishing mortality. Nevertheless,
discarding is usually unaccounted for in stock assessments. Furthermore, discards
may have an important indirect impact on other species communities, such as
seabirds and benthic organisms, by causing changes in prey and predator abundance
and species assemblages (e.g. Jennings and Kaiser, 1998; Votier et al., 2004).
Discards can also be used in fisheries management in other ways than as a data input
in stock assessments: for evaluating conservation measures (minimum landing size,
mesh sizes, close areas and seasons) and for identifying the characteristics and
behaviours of particular fishing fleets.
Several species are caught by the multi-species fisheries, some of them have been
subject of many studies, hake (e.g. Fonseca et al., 2005a; Merino et al., 2008),
Norway lobster (e.g. Catchpole et al., 2006; Bahamon et al., 2007), elasmobranchs
(e.g. Ellis et al., 2005; Figueiredo et al., 2007), anglerfish (e.g. Revill et al., 2006;
Graham et al., 2007), horse mackerel (e.g. Fonseca et al., 2005b; Campos et al.,
General Introduction
16
2007) and flatfishes (e.g. Vinther et al., 2004; Rijnsdorp et al., 2006, 2007; Kraak et
al., 2008).
Flatfish Fisheries in the Portuguese Coast
Fishing is a traditional and culturally important activity in Portugal, being dominated
by small and local fishing vessels (Baeta and Cabral, 2005). According to the 2001
population census, 13837 people are employed in the fisheries sector (source: INE).
Of these workers, 57% have between 35 and 54 years of age, often having a low
educational level, with 4% being illiterate, and 86% having only primary school
education (source: INE).
Between 1992 and 2005 the number of vessels has decreased 38%, but this has been
compensated by an increase in power per vessel (source: DGPA). Fishing vessels
operate out of 32 ports in Portugal, distributed along the coast.
Flatfish fisheries are widely spread over the Portuguese coast and traditionally have
played an important socio-economic role. The economic and social importance of this
fleet is evidenced by the contribution to the total landings and revenue, about 4% and
11% of fish landings, respectively, and the number of fishermen involved, nearly 85%
of the total (source: DGPA; INE).
A large number of flatfish species occur in the Portuguese coast (e.g. Nielsen,
1986a,b,c,d; Quéro et al., 1986a,b; Cabral, 2000a). This species richness is usually
higher than that found in North Europe and similar to that found in the Mediterranean,
since many flatfish species are at their southern and northern distribution limits,
respectively, along the Portuguese coast (e.g. Quéro et al., 1986a; Desoutter, 1997).
The zoogeographic importance of this latitudinal area has long been recognized,
representing the transition between northeastern Atlantic warm-temperate and cold-
temperate regions (Ekman, 1953; Briggs, 1974).
The water circulation in the Portuguese coast is characterized by a complex current
system subject to strong seasonality and mesoscale variability, showing reversing
patterns between summer and winter in the upper layers of the slope and outer shelf
(e.g. Barton, 1998; Peliz et al., 2005). Upwelling events are common in the
Portuguese coast, especially in summer (Fiúza et al., 1982). The occurrence of
upwelling pulses during summer is important, since the upwelling process injects
nutrients in the surface layer that fuel primary production.
The artisanal fleet is responsible for the largest share of flatfish landings. This fleet
consists of almost 6000 vessels, most of them between 5 and 17 m overall length,

CHAPTER 1
17
with open deck, and operating near the coastline (source: DGPA). The multi-gear fleet
is made up of vessels that are licensed to use several different gear types throughout
the year. The main fishing gears used in flatfish fisheries are trammel and gill nets and
bottom trawl. However, only a fraction of these vessels actively target flatfishes, since
many other species are caught in this multi-species fisheries.
The most important species, in terms of landings, are the soles, Solea solea (Linnaeus,
1758), Solea senegalensis Kaup, 1858, and Solea lascaris (Risso, 1810), the bastard
sole, Microchirus azevia (Capello, 1868), the flounder, Platichthys flesus (Linnaeus,
1758), the spotted flounder, Citharus linguatula (Linnaeus, 1758), the wedge sole,
Dicologlossa cuneata (Moreau, 1881), the turbot, Scophthalmus maximus (Linnaeus,
1758), the brill, Scophthalmus rhombus (Linnaeus, 1758), and the megrims,
Lepidorhombus boscii (Risso, 1810) and Lepidorhombus whiffiagonis (Walbaum,
1792). Flatfish landings present a decreasing trend between 1992 and 2005; soles
landings represented near 50% of the total landings of flatfishes; and Leixões is the
port with highest flatfish landings (about 20% of total flatfish landings).
Pleuronectiformes of the Portuguese coast have been subject of many studies, which
have investigated their feeding ecology (e.g. Cabral, 2000b; Sá et al., 2003; Vinagre
et al., 2005), age and growth (e.g. Andrade, 1990; Cabral, 1998, 2003), reproduction
(e.g. Santos, 1994; Gomes, 2002; Afonso-Dias et al., 2005), habitat use (e.g. Cabral,
2000a; Cabral et al., 2002; Vinagre, 2007), population genetic (Cabral et al. 2003;
Pinheiro et al. 2005; Teixeira, 2007), parasitosis (e.g. Barahona-Fernandes and Dinis
1992; Mateus 2001; Marques, 2006; Marques et al., 2006), as well as fishery (e.g.
Ribeiro et al., 1999; Batista, 2005, 2007; Alves, 2008). Despite the large volume of
literature, basic knowledge about the biology and ecology of the most important
flatfish fisheries resources, as well as detailed analyses of their fisheries, are
extremely scarce.
Aims and Importance of this Study
The present work aims to study the feeding ecology, growth, and reproduction of
seven flatfish species with commercially importance, define their population structure
based on genetic characters, characterize the fleet that catch these resources and
assess the state of their stocks.
Several species of Pleuronectiformes occurring off the Portuguese coast have a high
commercial value. The quantities landed are not particularly high, but their
commercial importance is considerable. Despite the economic importance of these
General Introduction
18
fisheries resources, knowledge about their biology and status of fish stocks is reduced.
In the Portuguese coast, the main studies on the ecology of species of
Pleuronectiformes have a limited scope and have focused mainly on the juvenile stage,
especially in lagoon and estuarine environments (e.g. Dinis, 1986; Andrade, 1990;
Cabral, 1998, 2000a, 2000b; Cabral and Costa, 1999; Cabral et al., 2002).
Many studies conducted in northern Europe refer a high pressure on these resources,
which caused a decrease of their populations, being some of the stocks outside safe
biological limits. Thus, it is extremely important to assess the state of the flatfish
stocks in the Portuguese coast.
The reform of the CFP includes a set of measures which aims to ensure the
ecologically, economically and socially sustainability of the main fisheries. The CFP
reform introduces substantial differences in the way of managing fisheries stocks,
emphasizing the role that multi-annual management plans can have and introducing
an ecosystem approach to fisheries management. These new approaches require
scientific information that is scarce for the majority of flatfish species and for several
fisheries in the Portuguese coast.
Structure of the Thesis
This work comprises nine chapters organized in four parts. The General Introduction
(Chapter 1) addresses the importance of the assessment and management of fisheries
stocks, highlighting the multi-specific fisheries for its complexity, and giving particular
attention to flatfish fisheries.
In Chapters 2 to 4 the diet, growth and reproduction of the sole, Solea solea
(Linnaeus, 1758), Senegalese sole, Solea senegalensis Kaup, 1858, sand sole, Solea
lascaris (Risso, 1810), spotted flounder, Citharus linguatula (Linnaeus, 1758), four-
spotted megrim, Lepidorhombus boscii (Risso, 1810), flounder, Platichthys flesus
(Linnaeus, 1758), and bastard sole Microchirus azevia (de Brito Capello, 1867) were
analysed. The analysis of the genetic diversity and population structure of S. solea and
S. senegalensis was addressed in Chapter 5, based on the analysis of the complete
sequence of the cytochrome b of mitochondrial DNA of samples collected along the
distribution area for the two species. In Chapter 6 is presented an analysis of the variation of monthly landings of
commercial fishing of several species of Pleuronectiformes (soles, bastard sole,
flounder, spotted flounder, wedge sole, turbot, brill and megrims) landed along the

CHAPTER 1
19
Portuguese coast, between 1992 and 2005. Generalized linear models were applied in
order to find out which factor influence landings of these species.
Chapter 7 include a characterization of the flatfish fisheries in the Portuguese coast
and Chapter 8 evaluate the catches and bycatches of the trammel net fishery
operating in the central coast of Portugal. Finally, in Chapter 9, is presented a
summary of the main findings and indicated some topics that require further research.
References
Acosta, A.R., 1994. Soak time and net length effects on catch rate of entangling nets in
coral reef areas. Fisheries Research 19, 105–119.
Afonso-Dias, I., Reis, C., Andrade, J.P., 2005. Reproductive aspects of Microchirus azevia
(Risso, 1810) (Pisces: Soleidae) from the south coast of Portugal. Scientia Marina
69(2), 275–283.
Ainsworth, C.H., Pitcher, T.J., 2005. Estimating illegal, unreported and unregulated catch
in British Columbia’s marine fisheries. Fisheries Research 75, 40–55.
Alemany, F., Álvarez, F., 2003. Determination of effective effort on hake Merluccius
merluccius in a Mediterranean trawl fishery. Scientia Marina 67(4), 491–499.
Alverson, D.L., Freeberg, M.H., Murawski, S.A., Pope, J.G., 1994. A global assessment of
fisheries bycatch and discards. FAO Fisheries Technical Paper 339. FAO, Rome.
Alves, A., 2008. Catch and by-catch of artisanal fisheries in the Arrábida Marine Protected
Area (Portugal). MSc Thesis, Universidade de Lisboa, Portugal.
Anderson, L.G., 1994. An economic analysis of highgrading in ITQ fisheries regulation
programs. Marine Resource Economics 9, 209–226.
Andrade, J.P.A.S., 1990. A importância da Ria Formosa no ciclo biológico de Solea
senegalensis Kaup 1858, Solea vulgaris Quensel 1806, Solea lascaris (Risso, 1810) e
Microchirus azevia (Capello, 1868). PhD Thesis, Universidade do Algarve, Portugal.
Anonymous, 2002. Collection of Working Papers for the Scientific Council precautionary
approach workshop. Northwest Atlantic Fisheries Organization SCS Doc. 02/21,
Dartmouth, NS.
Baeta, F., Cabral, H.N., 2005. Status of Portuguese Fisheries. Technical Report.
Oceanography Institute, School of Sciences of the University of Lisbon.
Bahamon, N., Sardà, F., Suuronen, P., 2007. Selectivity of flexible size-sorting grid in
Mediterranean multispecies trawl fishery. Fisheries Science 73(6), 1231–1240.
Barahona-Fernandes, M.H., Dinis, M.T., 1992. Leech control (Platybdella solea, Hirudinae)
on flatfishes in an aquaculture unit. Publicações do Instituto de Zoologia Dr. António
Nobre 226, 1–4.

General Introduction
20
Barton, E.D., 1998. Eastern boundary of the North Atlantic: Northwest Africa and Iberia
coastal segment. In: Robinson, A.R., Brink, K.H. (eds.). The Sea. John Wiley and Sons,
Inc., pp. 633–658.
Batista, M.I.S., 2005. A pesca dos linguados com redes de emalhar na região de Setúbal:
padrões de exploração dos recursos, pescas acessórias e rejeições. Graduation Thesis,
Universidade de Lisboa, Portugal.
Batista, M.I.S., 2007. Avaliação do Impacto do Plano de Ordenamento da Área Marinha do
Parque Natural da Arrábida na Pesca Comercial Local. MSc Thesis, Universidade de
Lisboa, Portugal.
Baum, J.K., Myers, R.A., Kehler, D.G., Worm, B., Harley, S.J., Doherty, P.A., 2003.
Collapse and conservation of shark populations in the Northwest Atlantic. Science 299,
389–392.
Beddington, J.R., Agnew, D.J., Clark, C.W., 2007. Current Problems in the Management of
Marine Fisheries. Science 316, 1713–1716.
Begg, G.A., Waldman, J.R., 1999. An holistic approach to fish stock identification. Fisheries
Research 43, 35–44.
Bergmann, M., Wieczore, S.K., Moore, P.G., Atkinson, R.J.A., 2002. Discards composition
of the Nephrops fishery in the Clyde Sea area, Scotland. Fisheries Research 57, 169–
183.
Bianchi, G., Gislason, H., Graham, K., Hill, L., Jin, X., Koranteng, K., Manickchand-
Heileman, S., Paya, I., Sainsbury, K., Sanchez, F., Zwanenburg, K., 2000. Impact of
fishing on size composition and diversity of demersal fish communities. ICES Journal of
Marine Science 57, 558–571.
Biseau, A., 1998. Definition of a directed fishing effort in a mixed species trawl fishery, and
its impact on stock assessments. Aquatic Living Resources 11, 119–136.
Booke, H.E., 1981. The conundrum of the stock concept – are nature and nurture definable
in fishery science? Canadian Journal of Fisheries and Aquatic Sciences 38, 1479–1480.
Booke, H.E., 1999. The stock concept revisited: perspectives on its history in fisheries.
Fisheries Research 43, 9–11.
Botsford, L., Castilla, J., Peterson, C., 1997. The management of fisheries and marine
ecosystems. Science 277, 509–515.
Briggs, J.C., 1974. Marine zoogeography. McGraw-Hill, London
Cabral, H.M.R.N., 1998. Utilização do estuário do Tejo como área de viveiro pelos
linguados, Solea solea (L., 1758) e Solea senegalensis Kaup, 1858, e robalo,
Dicentrarchus labrax (L., 1758). PhD Thesis, Universidade de Lisboa, Portugal.
Cabral, H.N., 2000a. Distribution and abundance patterns of flatfishes in the Sado estuary,
Portugal. Estuaries 53, 351–358.

CHAPTER 1
21
Cabral, H.N., 2000b. Comparative feeding ecology of two sympatric soles, Solea solea and
Solea senegalensis, within the nursery areas of the Tagus estuary. Journal of Fish
Biology 57, 1550–1562.
Cabral, H., 2003. Differences in growth rates of juvenile Solea solea and Solea
senegalensis in the Tagus estuary, Portugal. Journal of the Marine Biological
Association of the United Kingdom 83, 861–868.
Cabral, H.N., Costa, M.J., 1999. Differential use of the nursery areas within the Tagus
estuary by sympatric soles, Solea solea (Linnaeus, 1758) and Solea senegalensis Kaup,
1858. Environmental Biology of Fishes 56, 389–397.
Cabral, H.N., Lopes, M., Loeper, R., 2002. Trophic niche overlap between flatfishes in a
nursery area in the Portuguese coast. Scientia Marina 66, 293–300.
Cabral, H.N., Castro, F., Linhares, D., Alexandrino, P., 2003. Genetic differentiation of
Solea solea (Linnaeus, 1758) and Solea senegalensis Kaup, 1858, (Pisces:
Pleuronectiformes) from several estuarine systems of the Portuguese coast. Scientia
Marina 67, 43–52.
Cabrera, J.L., Defeo, O., 2001. Daily bioeconomic analysis in a multispecific artisanal
fishery in Yucatan, Mexico. Aquatic Living Resources 14, 19–28.
Caddy, J.F., Cochrane, K.L., 2001. A review of fisheries management past and present and
some future perspectives for the third millennium. Ocean and Coastal Management 44,
653–682.
Caddy, J., Seijo, J.C., 2005. This is more difficult than we thought! The responsibility of
scientists, managers and stakeholders to mitigate the unsustainability of marine
fisheries. Philosophical Transactions of the Royal Society of London Series B 360, 59–
75.
Campos, A., Fonseca, P., Fonseca, T., Parente, J., 2007. Definition of fleet components in
the Portuguese bottom trawl fishery. Fisheries Research 83, 185–191.
Catchpole, T.L., Frid, C.L.J., Gray, T.S., 2006. Importance of discards from the English
Nephrops norvegicus fishery in the North Sea to marine scavengers. Marine Ecology
Progress Series 313, 215–226.
Chen, Y., Andrew, N., 1998. Parameter estimation in modelling the dynamics of fish stock
biomass: are currently used observation-error estimator reliable? Canadian Journal of
Fisheries and Aquatic Sciences 55, 749–760.
Chen, Y., Paloheimo, J.E., 1998. Can a more realistic model error structure improve
parameter estimation in modelling the dynamics of fish populations? Fisheries Research
38, 9–17.
Christensen, A.-S., Raakjær, J., 2006. Fishermen’s tactical and strategic decisions. A case
study of Danish demersal fisheries. Fisheries Research 81, 258–267.

General Introduction
22
Collie, J.S., Sissenwine, M.P., 1983. Estimating population size from relative abundance
data measured with error. Canadian Journal of Fisheries and Aquatic Sciences 40,
1871–1879.
Collie, J.S., Gislason, H., 2001. Biological reference points for fish stocks in a multispecies
context. Canadian Journal of Fisheries and Aquatic Sciences 58, 2167–2176.
Commission of the European Communities, 2001. Selectivity and gear technology for
Northern hake stock. SEC (2001) 1195, CE.
Cotter, A.J.R., Burt, L., Paxton, C.G.M., Fernandez, C, Buckland, S.T., Pan, J.-X., 2004. Are
stock assessment methods too complicated? Fish and Fisheries 5, 235–254.
Crean, K.S.D., 1994. The discards problem: towards a European solution. Marine Policy 18,
422–430.
Daan, N., 1997. TAC management in North Sea flatfish fisheries. Journal of Sea Research
37, 321–341.
Dalzell, P., 1996. Catch rates, selectivity and yields of reef fishing. In: Polunin, N.V.C.,
Roberts, C.M. (eds). Reef Fisheries. Chapman and Hall, London, pp. 161–192.
Dayton, P.K., Thrush, S.F., Agardy, M.T., Hofman, R.J., 1995. Environmental effects of
marine fishing. Aquatic Conservation 5, 205–532.
Deriso, R.B., Quinn II, T.J., Neal, P.R., 1985. Catch-Age Analysis with Auxiliary
Information. Canadian Journal of Fisheries and Aquatic Sciences 42, 815–824.
Desoutter, M., 1997. Révision systématique des genres de la famille des Soleidae présents
sur les côtes de l’Est-Atlantique et de la Méditerranée. PhD Thesis, Muséum National
d’Histoire Naturelle, France.
Dinis, M.T., 1986. Quatre Soleidae de l’estuaire du Tage. Reproduction et croissance. Essai
d’élevage de Solea senegalensis Kaup. PhD Thesis, Université de Bretagne Occidentale,
France.
Doubleday, W.G., 1976. A Least Squares Approach to Analyzing Catch at Age Data.
Research Bulletin of the International Commission for the Northwest Atlantic Fisheries
12, 69–81.
Duplisea, D.E., Kerr, S.R., 1995. Application of a biomass size spectrum model to demersal
fish data from the Scotian shelf. Journal of Theoretical Biology 177, 263–269.
Ekman, S., 1953. Zoogeography of the sea. Sidgwick and Jackson, London
Ellis, J.R., Dulvy, N.K., Jennings, S., Parker-Humphreys, M., Rogers, S.I., 2005. Assessing
the status of demersal elasmobranchs in UK waters: a review. Journal of the Marine
Biological Association of the United Kingdom 85, 1025–1047.
European Commission, 2001. Green Paper – The Common Fisheries Policy after 2002.
European Commission, Luxemburg.
Evans, S.M., Hunter, J.E., Elizal, Wahju, R.I., 1994. Composition and fate of the catch and
bycatch in the Farne Deep (North Sea) Nephrops fishery. ICES Journal of Marine
Science 51, 155–168.

CHAPTER 1
23
Fabrizio, M.C., Richards, R.A., 1996. Commercial fisheries surveys. In: Murphy, B.R.,
Willis, D. (eds). Fisheries Techniques. American Fisheries Society, Bethesda, MD, pp.
625–650.
FAO, 1997. Fisheries Management. FAO Technical Guidelines for Responsible Fishing, vol.
4. Food and Agriculture Organization, Rome.
FAO, 2005. Increasing the contribution of small-scale fisheries to poverty alleviation and
food security. FAO Technical Guidelines for Responsible Fisheries, No. 10. Rome, FAO,
79 pp.
Figueiredo, I., Moura, T., Bordalo-Machado, P., Neves, A., Rosa, C., Gordo, L.S., 2007.
Evidence for temporal changes in ray and skate populations in the Portuguese coast
(1998-2003) - its implications in the ecosystem. Aquatic Living Resources 20, 85–93.
Fiúza, A.F.G., de Macedo, M.E., Guerreiro, M.R., 1982. Climatological space and time
variation of the Portuguese coastal upwelling. Oceanologica Acta 5, 31–40.
Fonseca, P., Campos, A., Mendes, B., Larsen, R.B., 2005a. Potential use of a Nordmøre
grid for by-catch reduction in a Portuguese bottom-trawl multispecies fishery. Fisheries
Research 73 (1-2), 49–66.
Fonseca, P., Martins, R., Campos, A., Sobral, P., 2005b. Gill-net selectivity off the
Portuguese western coast. Fisheries Research 73, 323–339.
Fournier, D., Archibald, C.P., 1982. A General Theory for Analyzing Catch at Age Data.
Canadian Journal of Fisheries and Aquatic Sciences 39, 1195–1207.
Fournier, D.A., Hampton, J., Sibert, J.R., 1998. MULTIFAN-CL: a length-based, age-
structured model for fisheries stock assessment, with application to South Pacific
albacore, Thunnus alalunga. Canadian Journal of Fisheries and Aquatic Sciences 55,
2105–2116.
Fréon, P., Misund, O.A., 1999. Dynamics of Pelagic Fish Distribution and Behaviour: Effects
on Fisheries and Stock Assessment. Fishing News Books, Blackwell Science Ltd, Oxford.
Fu, C., Mohn, R., Fanning, L.P., 2001. Whythe Atlantic cod (Gadus morhua) stock off
eastern Nova Scotia has not recovered. Canadian Journal of Fisheries and Aquatic
Sciences 58, 1613–1623.
Garcia, S.M., Grainger, R.J.R., 1996. Chronicles of marine fishery landings (1950–1994).
Trend analysis and fisheries potential. FAO Fish. Technical Paper No. 359, pp. 1–51.
Garcia, S.N., Staples, D.J., 2000. Sustainability indicators in marine capture species:
introduction to the species issue. Marine and Freshwater Research 51, 381–384.
Garza-Gil, M.D., Varela-Lafuente, M.M., Surís-Regueiro, J.C., 2003. European hake fishery
bioeconomic management (southern stock) applying an effort tax. Fisheries Research
60, 199–206.
Gell, F.R., Whittington M.W., 2002. Diversity of fishes in seagrass beds in the Quirimba
Archipelago, northern Mozambique. Journal of Marine and Freshwater Research 53,
115–21.

General Introduction
24
Gelman, A., Carlin, J.B., Stern, H.S., Rubin, D.B., 1995. Bayesian Data Analysis, Chapman
and Hall, London.
Gillis, D.M., Pikitch, E.K., Peterman, R.M., 1995. Dynamic discarding decisions: foraging
theory for high-grading in a trawl fishery. Behavioral Ecology 6, 146–154.
Gjoesaeter, H., 1995. Pelagic fish and the ecological impacts of the modern fishing industry
in the Barents Sea. Artic 48, 267–278.
Glaesel, H., 2000. State and local resistance to the expansion of two environmentally
harmful marine fishing techniques in Kenya. Society and Natural Resources 13, 321–
338.
Godø, O.R., 1994. Factors affecting the reliability of groundfish abundance estimates from
bottom trawl surveys. In: Ferro, A., Olsen S. (eds). Marine Fish Behaviour in Capture
and Abundance Estimation. Fishing News Books, Blackwell Science Ltd, Oxford, pp.
166–199.
Gomes, T.M.M.F., 2002. Reprodução e fecundidade de Solea lascaris (Risso, 1810) em
águas costeiras do Norte de Portugal. MSc Thesis, Universidade do Porto, Portugal.
Goñi, R., 1998. Ecosystem effects of marine fisheries: an overview. Ocean and Coast
Management 40, 37–64.
Graham, N., Ferro, R.S.T., Karp, W.A., MacMullen, P., 2007. Fishing practice, gear design,
and the ecosystem approach-three case studies demonstrating the effect of
management strategy on gear selectivity and discards. ICES Journal of Marine Science
64, 744–750.
Gulland, J.A., 1983. Fish stock assessment: A manual of basic methods. John Wiley, New
York.
Haddon, M., 2001. Modelling and quantitative methods in fisheries. Chapman and Hall,
Washington.
Hall, S.J., 1999. The Effects of Fishing on Marine Ecosystems and Communities. Blackwell
Science, Oxford.
Harwood, J., Stokes, K. 2003. Coping with uncertainty in ecological advice: lessons from
fisheries. Trends in Ecology and Evolution 18, 617–622.
Helser, T., Sharov, A., Kahn, D., 2001. A stochastic decision-based approach to assessing
the Delaware Bay blue crab (Callinectes sapidus) stock. In: Berkson, J.M., Kline, L.L.,
Orth, D.J. (eds). Incorporating Uncertainty into Fishery Models. American Fisheries
Society Publication, Bethesday, MD.
Hilborn, R., 1992. Current and future trends in fisheries stock assessment and
management. South African Journal of Marine Science 12, 975–988.
Hilborn, R., Walters, C., 1992. Quantitative Fisheries Stock Assessment: Choice, Dynamics,
and Uncertainty. Chapman and Hall, New York.

CHAPTER 1
25
Hjellvik, V., Godø, O.R., Jøstheim, D., 2002. Diurnal variation in bottom trawl survey
catches: does it pay to adjust? Canadian Journal of Fisheries and Aquatic Sciences 59,
33–48.
Holden, M., 1994. The Common Fisheries Policy. Origin, Evaluation and Future. The
Buckland Foundation, London.
Holland, D.S., 2000. A bioeconomic model of marine sanctuaries on Georges Bank.
Canadian Journal of Fisheries and Aquatic Sciences 57, 1307–1319.
Holland, D.S., 2003. Integrating spatial management measures into traditional fishery
management systems: the case of the Georges Bank multispecies groundfish fishery.
ICES Journal of Marine Science 60, 915–929.
Holley, J.-F., Marchal, P., 2004. Fishing strategy development under changing conditions:
examples from the French offshore fleet fishing in the North Atlantic. ICES Journal of
Marine Science 61, 1410–1431.
Horwood, J.W., Millner, R.S., 1998. Cold induced abnormal catches of sole. Journal of the
Marine Biological Association of the United Kingdom 78, 81–84.
Hutchings, J.A., 1996. Spatial and temporal variation in the density of northern cod and a
review of hypotheses for the stock’s collapse. Canadian Journal of Fisheries and Aquatic
Sciences 53, 943–962.
Hutchings, J.A., 2000. Collapse and recovery of marine fishes. Nature 406, 882–885.
Hutchings, J., Reynolds, J., 2004. Marine fish population collapses: consequences for
recovery and extinction risk. BioScience 54 (4), 297–309.
ICES, 2004. Report of the ICES Advisory Committee on Fishery Management and Advisory
Committee on Ecosystems. ICES Advice. Book 1. 1544 pp.
ICES, 2007. Report of the ICES Advisory Committee on Fishery Management, Advisory
Committee on the Marine Environment and Advisory Committee on Ecosystems. ICES
Advice. Book 7. 94 pp.
Ihssen, P.E., Booke, H.E., Casselman, J.M., McGlade, J.M., Payne, N.R., Utter, F.M., 1981.
Stock identification: material and methods. Canadian Journal of Fisheries and Aquatic
Sciences 38, 1838–1855.
Jackson, J.B.C., Kirby, M.X., Berger, W.H., Bjorndal, K.A., Botsford, L.W., Bourque, B.J.,
Bradbury, R.H., Cooke, R., Erlandson, J., Estes, J.A., Hughes, T.P., Kidwell, S., Lange,
C.B., Lenihan, H.S., Pandolfi, J.M., Peterson, C.H., Steneck, R.S., Tegner, M.J., Warner,
R.R., 2001. Historical overfishing and the recent collapse of coastal ecosystems.
Science 293, 629–638.
Jamieson, G.S., Levings, C.O., 2001. Marine protected areas in Canada – implications for
both conservation and fisheries management. Canadian Journal of Fisheries and
Aquatic Sciences 58, 138–156.
Jennings, S., Kaiser, M.J., 1998. The effect of fishing on marine ecosystems. Advances in
Marine Biology 34, 201–352.
General Introduction
26
Jiménez, M.P., Sobrino, I., Ramos, F., 2004. Objective methods for defining mixed-species
trawl fisheries in Spanish waters of the Gulf of Cádiz. Fisheries Research 67, 195–206.
Kell, L.T., Pilling, G.M., Kirkwood, G.P., Pastoors, M., Mesnil, B., Korsbrekke, K., Abaunza,
P., Aps, R., Biseau, A., Kunzlik, P., Needle, C., Roel, B.A., Ulrich-Rescan, C., 2005. An
evaluation of the implicit management procedure used for some ICES roundfish stocks.
ICES Journal of Marine Science 62, 750–759.
Kraak, S.B.M., Buisman, F.C., Dickey-Collas, M., Poos, J.J., Pastoors, M.A., Smit, J.G.P.,
van Oostenbrugge, J.A.E., Daan, N., 2008. The effect of management choices on the
sustainability and economic performance of a mixed fishery: a simulation study. ICES
Journal of Marine Science 65(4), 697–712.
Laurec, A., Biseau, A., Charuau, A., 1991. Modelling technical interactions. ICES Marine
Science Symposia 193, 225–236.
Lewy, P., Vinther, M. 1994. Identification of Danish North Sea trawl fisheries. ICES Journal
of Marine Science 51(3), 263–272.
Mace, P.M., 2001. A new role for MSY in single-species and ecosystem approaches to
fisheries stock assessment and management. Fish and Fisheries 2, 2–32.
MacLennan, D.N., 1992. Fishing gear selectivity: an overview. Fisheries Research 13, 201–
204.
Marchal, P., Ulrich, C., Korsbrekke, K., Pastoors, M.A., Rackham, B., 2002. A comparison
of three indices of fishing power on some demersal fisheries of the North Sea. ICES
Journal of Marine Science 59, 604–623.
Marques, J.I.F., 2006. Flatfish parasitoses in the Portuguese coast and their relationships
with host life-history, habitat, phylogeny and population structure. PhD Thesis,
Universidade de Lisboa, Portugal.
Marques, J.F., Teixeira, C.M., Cabral, H.N., 2006. Differentiation of commercially important
flatfish populations along the Portuguese coast: evidence from morphology and
parasitology. Fisheries Research 81, 293–305.
Mateus, S., 2001. Comunidade helmíntica do linguado (Solea senegalensis Kaup, 1858) na
costa Sul de Portugal. Graduation Thesis, Universidade do Algarve, Portugal.
Maunder, M.N., Punt, A.E., 2004. Standardizing catch and effort data: a review of recent
approaches. Fisheries Research 70, 141–159.
Maury O., Gascuel D., 1999. SHADYS (“Simulateur HAlieutique de DYnamiques Spatiales”),
a GIS based numerical model of fisheries. Example application: the study of a marine
protected area. Aquating Living Resources 12, 77–88.
Maynou, F., Sarda, F., 2001. Influence of environmental factors on commercial trawl
catches of Nephrops norvegicus (L). ICES Journal of Marine Science 58, 1318–1325.
Merino, G., Morales-Nin, B., Maynou, F., Grau, A.M., 2008. Assessment and bioeconomic
analysis of the Majorca (NW Mediterranean) trammel net fishery. Aquatic Living
Resources 21, 99–107.
CHAPTER 1
27
Mesnil, B., Shepherd, J.G., 1990. A hybrid age- and length-structured model for assessing
regulatory measures in multiple-species, multiple-fleet fisheries. ICES Journal of Marine
Science 47(2), 115–132.
Murawski, S.A., Stewart, P., 1996. Report of the symposium on gear selectivity and
technical interactions in mixed species fisheries. Journal of Northwest Atlantic Fishery
Science 19, 7–10.
Myers, R.A., Bowen, K.G., Barrowman, N.J., 1999. Maximum Reproductive Rate of Fish at
Low Population Sizes. Canadian Journal of Fisheries and Aquatic Sciences 56, 2404–
2419.
Myers, R.A., Worm, B., 2003. Rapid worldwide depletion of predatory fish communities.
Nature 423, 280–283.
Nielsen, J.G., 1986a. Citharidae. In: Whithead, P.J.P., Bauchot, M.L., Hureau, J.C., Nielsen,
J., Tortonese, E. (eds.). Fishes of the North-eastern Atlantic and the Mediterranean.
UNESCO, Vol III, pp. 1286.
Nielsen, J.G., 1986b. Scophthalmidae. In: Whithead, P.J.P., Bauchot, M.L., Hureau, J.C.,
Nielsen, J., Tortonese, E. (eds.). Fishes of the North-eastern Atlantic and the
Mediterranean. UNESCO, Vol III, pp. 1287–1293.
Nielsen, J.G., 1986c. Bothidae. In: Whithead, P.J.P., Bauchot, M.L., Hureau, J.C., Nielsen,
J., Tortonese, E. (eds.). Fishes of the North-eastern Atlantic and the Mediterranean.
UNESCO, Vol III, pp. 1294–1298.
Nielsen, J.G., 1986d. Pleuronectidae. In: Whithead, P.J.P., Bauchot, M.L., Hureau, J.C.,
Nielsen, J., Tortonese, E. (eds.). Fishes of the North-eastern Atlantic and the
Mediterranean. UNESCO, Vol III, pp. 1299–1307.
Overholtz, W.J., Tyler, A.V., 1985. Long term responses of the demersal fish assemblages
of Georges Bank. Fishery Bulletin 83, 507–520.
Pastoors, M.A., Poos, J.J., Kraak, S.B.M., Machiels, M.A.M., 2007. Validating management
simulation models and implications for communicating results to stakeholders. ICES
Journal of Marine Science 64, 818–824.
Pauly, D., Christensen, V., Dalsgaard, J., Froese, R., Torres Jr., F.C., 1998. Fishing down
the food webs. Science 279, 860–863.
Pauly, D., Christensen, V., Guĕınette, S., Pitcher, T.J., Sumaila, U.R., Walters, C.J., 2002.
Towards sustainability in world fisheries. Nature 418, 689–695.
Pech, N., Samba, A., Drapeau, L., Sabatier, R., Laloë, F., 2001. Fitting a model of flexible
multifleet-multispecies fisheries to Senegalese’s artisanal fishery data. Aquatic Living
Resources 14, 81–98.
Peliz, A., Dubert, J., Santos, A.M.P., Oliveira, P.B., Le Cann, B., 2005. Winter upper ocean
circulation in the Western Iberian Basin - Fronts, Eddies and Poleward Flows: an
overview. Deep-sea research, Part I, Oceanographic research papers 52(4), 621–646.

General Introduction
28
Pelletier, D., Ferraris, J., 2000. A multivariate approach for defining fishing tactics from
commercial catch and effort data. Canadian Journal of Fisheries and Aquatic Sciences
57, 51–65.
Pet, J.S., Machiels, M.A.M., Densen, W.L.T.V., 1996. A size-structured simulation model for
evaluating management strategies in gillnet fisheries exploiting spatially differentiated
populations. Ecological Modelling 88, 195–214.
Pinheiro, A., Teixeira, C.M., Rego, A.L., Marques, J.F., Cabral, H.N., 2005. Genetic and
morphological variation of Solea lascaris (Risso, 1810) along the Portuguese coast.
Fisheries Research 73, 67–78.
Pitcher, T.J., Pauly, D., 1998. Rebuilding ecosystems, not sustainability, as the proper goal
of fisheries management. In: Pitcher, T.J., Hart, P.J.B., Pauly, D. (eds). Reinventing
Fisheries Management. Chapman and Hall, London, pp. 311–329.
Pitcher, T.J., Gaggan, N., Preikshot, D., Pauly, D., 1998. “Back to the Future”: a method
employing ecosystem modelling to maximize the sustainable benefits from fisheries.
In: Ecosystem Approaches for Fisheries Management. Proceeding of the 16th Lowell
Wakefield Fishries Symposium AK-SG-99-01. University of Alaska Sea Grant Fairbanks,
Alaska, pp. 447–466.
Pope, J.G., 1972. An investigation of the accuracy of virtual population analysis using
cohort analysis. ICNAF Research Bulletin 9, 65–74.
Pope, J.G., 1979. Population dynamics and management: current status and future trends.
Investigación Pesquera 43, 199–221.
Punt, A.E., Hilborn, R., 1997. Fisheries Stock Assessment and Decision Analysis: The
Bayesian Approach. Reviews of Fish Biology and Fisheries 7, 35–63.
Quéro, J.C., Desoutter, M., Lagardère, F., 1986a. Soleidae. In: Whithead, P.J.P., Bauchot,
M.L., Hureau, J.C., Nielsen, J., Tortonese, E. (eds.). Fishes of the North-eastern
Atlantic and the Mediterranean. UNESCO, Vol III, pp.1308–1324.
Quéro, J.C., Desoutter, M., Lagardère, F., 1986b. Cynoglossidae. In: Whithead, P.J.P.,
Bauchot, M.L., Hureau, J.C., Nielsen, J., Tortonese, E. (eds.). Fishes of the North-
eastern Atlantic and the Mediterranean. UNESCO, Vol III, pp. 1325–1328.
Quinn, T.J., Deriso, R.B., 1999. Quantitative fish dynamics. Oxford University Press, New
York.
Quirijns, F.J., Poos, J.J., Rijnsdorp, A.D., 2008. Standardizing commercial CPUE data in
monitoring stock dynamics: Accounting for targeting behaviour in mixed fisheries.
Fisheries Research 89, 1–8.
Restrepo, V.R., 1999. Providing scientific advice to implement the precautionary approach
under the Magnuson-Steven Fishery Conservation and Management Act. In:
Proceedings of the Fifth National NMFS Stock Assessment Workshop. NOAA Technical
Memo, NMFS-F/SPO-40.

CHAPTER 1
29
Restrepo, V.R., Thompson, G.G., Mace, P.M., Gabriel, W.L., Low, L.L., MacCall, A.D.,
Methot, R.D., Powers, J.E., Taylor, B.L., Wade, P.R., Witzig, J.F., 1998. Technical
Guidance on the Use of Precautionary Approaches to Implementing National Standard 1
of the Magnuson-Stevens Fishery Conservation and Management Act. NOAA Tech.
Mem. NMFS-F/SPO.
Revill, A., Dunlin, G., Holst, R., 2006. Selective properties of the cutaway trawl and several
other commercial trawls used in the Farne Deeps North Sea Nephrops fishery. Fisheries
Research 81(2-3), 268–275.
Ribeiro, F., Ramos, S., Santos, P., 1999. Evaluation of the amount of undersized sand sole
Solea lascaris (Risso, 1810) caught in the Portuguese fisheries. ICES CM/Z:08 8pp.
Richards, L.J., Maguire, J.-J., 1998. Recent international agreements and the precautionary
approach: new directions for fisheries management science. Canadian Journal of
Fisheries and Aquatic Sciences 55, 1545–1552.
Rijnsdorp, A.D., Daan, N., Dekker, W. 2006. Partial fishing mortality per fishing trip: a
useful indicator of effective fishing effort in mixed demersal fisheries. ICES Journal of
Marine Science 63, 556–566.
Rijnsdorp, A.D., Daan, N., Dekker, W., Poos, J.J., Van Densen, W.L.T., 2007. Sustainable
use of flatfish resources: Addressing the credibility crisis in mixed fisheries
management. Journal of Sea Research 57, 114–125.
Rochet, M.-J., Trenkel, V.M., Bellail, R., Coppin, F., Le Pape, O., Mahé, J.-C., Morin, J.,
Poulard, J.-C., Schlaich, I., Souplet, A., Vérin, Y., Bertrand, J., 2005. Combining
indicator trends to assess ongoing changes in exploited fish communities: diagnostic of
communities off the coasts of France. ICES Journal of Marine Science 62, 1647–1664.
Rose, G.A., Kulka, D.W., 1999. Hyperaggregation of fish and fisheries: how catch-per-unit-
effort increased as the northern cod (Gadus morhua) declined. Canadian Journal of
Fisheries Aquatic Sciences 56, 118–127.
Rosenberg, A.A., Brault, S., 1993. Choosing a management strategy for stock rebuilding
when control is uncertain. Canadian Special Publication of Fisheries and Aquatic
Sciences 120, 243–249.
Rosenberg, A.A., Restrepo, V.R., 1994. Uncertainty and risk evaluation in stock
assessment advice for US Marine fisheries. Canadian Journal of Fisheries and Aquatic
Sciences 51, 2715–2720.
Royce, R., 1972. Introduction to the Fishery Sciences. Academic Press, New York.
Sá, R., Bexiga, C., Vieira, L., Veiga, P., Erzini, K., 2003. Diets of the sole Solea vulgaris
Quensel, 1806 and Solea senegalensis Kaup, 1858 in the lower estuary of the Guadiana
River (Algarve, southern Portugal): Preliminary results. Boletín Instituto Español de
Oceanografía 19(1-4), 505–508.
Salas, S., Gaertner, D., 2004. The behavioural dynamics of fishers: management
implications. Fish and Fisheries 5, 153–167.

General Introduction
30
Santos, P.T., 1994. Growth and reproduction of the population of the four-spot megrim
(Lepidorhombus boscii Risso) off the Portuguese coast. Netherlands Journal of Sea
Research 32(3-4), 379–383.
Schnute, J.T., Hilborn, R., 1993. Analysis of contradictory data sources in fish stock
assessments. Canadian Journal of Fisheries and Aquatic Sciences 50, 1916–1923.
Schnute, J.T., Richards, L.J., 1995. The influence of error on population estimates from
catch-age models. Canadian Journal of Fisheries and Aquatic Sciences 52, 2063–2077.
Schnute, J.T., Richards, L.J., 2001. Use and abuse of fishery models. Canadian Journal of
Fisheries and Aquatic Sciences 58, 10–17.
Sen, A.R., 1986. Methodological problems in sampling commercial rockfish landings.
Fishery Bulletin 84, 409–421.
Shepherd, J.G., 1988. Fish stock assessments and their data requirements. In: Gulland,
J.A. (ed.). Fish Population Dynamics. John Wiley and Sons Ltd, Chichester, pp.35–62.
Shepherd, J.G., 2003. Fishing effort control: could it work under the common fisheries
policy? Fisheries Research 63, 149–153.
Siddeek, M.S.M., 1982. A note on Pope’s cohort analysis. Journal du Conseil international
pour l’Exploration de la Mer 40, 209–210.
Silva, L., Gil, J., Sobrino, I., 2002. Definition of fleet components in the Spanish artisanal
fishery of the Gulf of Cadiz (SW Spain ICES division IXa). Fisheries Research 59, 117–
128.
Stergiou, K.I., 2002. Overfishing, tropicalization of fish stocks, uncertainty and ecosystem
management: resharpening Ockham’s razor. Fisheries Research 55, 1–9.
Stergiou, K.I., Petrakis, G., Politou, C.-Y., 1996. Small scale fisheries in the South
Euboikos Gulf (Greece): species composition and gear competition. Fisheries Research
26, 325–336.
Stobutzki, I., Jones, P., Miller, M., 2003. A comparison of fish bycatch communities
between areas open and closed to prawn trawling in an Australian tropical fishery. ICES
Journal of Marine Science 60, 951–966.
Sumaila, U.R., Guénette, S., Alder, J., Chuenpadgee, R., 2000. Addressing ecosystem
effects of fishing using marine protected areas. ICES Journal of Marine Science 57,
752–760.
Teixeira, T.F.A., 2007. Genetic diversity and population structure of Solea solea and Solea
senegalensis and its relationships with life history patterns. MSc Thesis, Universidade
de Lisboa, Portugal.
Trites, A.W., Livingston, P.A., Vasconcellos, M.C., Mackinson, S., Springer, A.M., 1999.
Ecosystem considerations and the limitations of ecosystem models in fisheries
management: insights from the Bering Sea. In: Ecosystem Approaches for Fisheries
Management. University of Alaska Sea Grant, Fairbanks.
CHAPTER 1
31
Tsitsika, E.V., Maravelias, C.D., 2008. Fishing strategy choices of purse seines in the
Mediterranean: implications for management. Fisheries Science 74(1), 19–27.
Turner, S.J., Thrush, S.F., Hewitt, J.E., Cummings, V.J., Funnell, G., 1999. Fishing impacts
and the degradation or loss of habitat structure. Fisheries Management and Ecology 6,
401–420.
Tzanatos, E., Somarakis, S., Tserpes, G., Koutsikopoulos, C., 2006. Identifying and
classifying small-scale fisheries métiers in the Mediterranean: A case study in the
Patraikos Gulf, Greece. Fisheries Research 81, 158–168.
Ulrich, C., Gascuel, D., Dunn, M.R., Le Gallic, B., Dintheer, C., 2001. Estimation of
technical interactions due to the competition for resource in a mixed-species fishery,
and the typology of fleets and métiers in the English Channel. Aquatic Living Resources
14, 267–281.
Ulrich, C., Pascoe, S., Sparre, P.J., de Wilde, J.W., Marchal, P., 2002. Influence of trends in
fishing power on bioeconomics in the North Sea flatfish fishery regulated by catches or
by effort quotas. Canadian Journal of Fisheries and Aquatic Sciences 59, 829–843.
UN, 1992. United Nations Convention on the Environment and Development.
http://www.unep.org/unep/partners/un/unced/home.htm.
Vestergaard, N., 1996. Discard behaviour, highgrading and regulation: the case of the
Greenland shrimp fishery. Marine Recource Economics 11, 247–266.
Vinagre, C.M.B., 2007. Ecology of the juveniles of the soles, Solea solea (Linnaeus, 1758)
and Solea senegalensis Kaup, 1858, in the Tagus estuary. PhD Thesis, Universidade de
Lisboa, Portugal.
Vinagre, C., França, S., Costa, M.J., Cabral, H.N., 2005. Niche overlap between juvenile
flatfishes, Platichthys flesus and Solea solea, in a southern European estuary and
adjacent coastal waters. Journal of Applied Ichthyology 21, 114–120.
Vinther, M., Reeves, S.A., Patterson, K.R., 2004. From single-species advice to mixed
species management: taking the next step. ICES Journal of Marine Science 61, 1398–
1409.
Votier, S.C., Furness, R.W., Bearhop, S., Crane, J.E., Caldow, R.W.G., Catry, P., Ensor, K.,
Hamer, K.C., Hudson, A.V., Kalmbach, E., Klomp, N.I., Pfeiffer, S., Phillips, R.A., Prieto,
I., Thompson, D.R., 2004. Changes in fisheries discard rates and seabird communities.
Nature 427, 727–730.
Walters, C.J., Christensen, V., Martell, S.J., Kitchell, J.F., 2005. Possible ecosystem
impacts of applying MSY policies from single-species assessment. ICES Journal of
Marine Science 62, 558–568.
Walters, C.J., Ludwig, D., 1981. Effects of measurement errors on the assessment of
stock-recruitment relationships. Canadian Journal of Fisheries and Aquatic Sciences 38,
704–710.

General Introduction
32
Ward, P., Porter, J.M., Elscot, S., 2000. Broadbill swordfish: status of established fisheries
and lessons for developing fisheries. Fish and Fisheries 1(4), 317–336.
Watson, R., Pauly, D., 2001. Systematic distortions in world fisheries catch trends. Nature
414, 534–536.
Worm, B., Barbier, E.B., Beaumont, N., Duffy, J.E., Folke, C., Halpern, B.S., Jackson,
J.B.C., Lotze, H.K., Micheli, F., Palumbi, S.R., Sala, E., Selkoe, K.A., Stachowicz, J.J.,
Watson, R., 2006. Impacts of biodiversity loss on ocean ecosystem services. Science
314, 787–90.

PART II
Biology and Ecology of
Commercially Important
Flatfishes


CHAPTER 2
Comparative analysis of the diet, growth and reproduction of the soles, Solea solea
and Solea senegalensis, occurring in sympatry along the Portuguese coast.
Journal of the Marine Biological Association of the United Kingdom (submitted)
By Teixeira, C.M., Cabral, H.N.


CHAPTER 2
37
Comparative analysis of the diet, growth and
reproduction of the soles, Solea solea and Solea
senegalensis, occurring in sympatry along the
Portuguese coast
ABSTRACT: Common sole, Solea solea and Senegalese sole, S. senegalensis, were collected between
January 2003 and June 2005 from commercial fishing vessels operating with gill nets and bottom trawls
along the Portuguese coast, to examine diet, age and growth and reproduction. Soles fed mainly on
crustaceans, polychaetes and bivalves. Feeding activity was highest in spring-summer, for females and for
the smallest individuals. Significant differences were found between the proportion of prey items according
to season, sex and size class. Common sole presented a wider dietary breadth compared to Senegalese
sole. Dietary overlap between the two species was higher for the autumn-winter period and for females. Age
of soles was determined from sagittae otoliths readings. The length of fish analysed varied between 187 mm
and 462 mm (oldest fish with 9 years), for S. solea, and between 199 mm and 472 mm (oldest fish with 8
years), for S. senegalensis. The von Bertalanffy growth equation coefficients differed between sexes. For
both species, the asymptotic length L∞ and growth coefficient k obtained for females were higher compared
to those estimated for males. The highest values of the gonadosomatic index were obtained for autumn-
winter period, when the highest proportion of individuals at spawning stage was recorded.
KEYWORDS:
feeding ecology, growth, reproduction, flatfish, Solea solea, Solea senegalensis,
Portuguese coast
INTRODUCTION
Two species of sole, the common sole Solea solea (Linnaeus, 1758) and the
Senegalese sole Solea senegalensis Kaup, 1858, have a wide geographic distribution
from the Eastern Atlantic to Mediterranean Sea, and, in Northeastern and
Southeastern Atlantic, respectively, inhabiting sandy and muddy bottoms at depths
near to 100 and 200 m (Quéro et al., 1986a). These species are very
Feeding, Growth and Reproduction of Two Sympatric Soles
38
similar, present a sympatric distribution from North Africa and western Mediterranean
up to the Bay of Biscay.
The Portuguese coast is a very important area for several flatfish species (e.g. Nielsen,
1986a,b,c,d; Quéro et al., 1986a,b; Cabral, 2000a), and, some of these species have
a high commercial interest. Flatfish fisheries represent 4% of all the fish biomass
landed in the Portuguese coast (source: Direcção Geral das Pescas (DGPA)). However,
the importance of flatfish fisheries is considerable higher due to the high commercial
value of flatfish species, accounting for near 11% of the economical value of the fish
landings (source: DGPA). According to official data, soles landings increased from
464.01 tonnes, in 1998, to 510.39 tonnes, in 2005 (source: DGPA).
Studies on the feeding ecology of S. solea has been carried in coastal areas of north-
western Europe (e.g. Rijnsdorp and Vingerhoed, 2001; Vinagre et al., 2005) and
western Mediterranean (e.g. Molinero et al., 1991; Darnaud et al., 2001). Unlike S.
solea, the diet of S. senegalensis is known only from the western Mediterranean
(Molinero et al., 1991; Garcia-Franquesa et al., 1996) and Portugal (Cabral, 2000b;
Sá et al., 2003). Most of these studies were focused mainly on juveniles.
Age and growth of S. solea has been studied by several authors, in western Europe
(e.g. Cabral, 2003; Henderson and Seaby, 2005) and in Mediterranean (e.g. Vianet et
al., 1989; Garcia et al., 1991; Türkman, 2003). Few studies were conducted for S.
senegalensis, and all are relative to the Portuguese coast (Dinis, 1986; Andrade,
1992; Cabral, 2003).
Reproduction study has been conducted on S. solea in western Europe (e.g. Baynes et
al., 1994; Bromley, 2003) and Mediterranean (e.g. Vallisneri et al., 2002; Türkmen,
2003). Reproduction of S. senegalensis has been studied in western Europe (e.g.
Dinis, 1986; Andrade, 1990) and in Mediterranean (Ramos, 1982).
Studies conducted along Portuguese coast, revealed that diet of S. solea was similar to
the diet of S. senegalensis, the soles fed a low variability of invertebrates, such as
Polychaeta and Amphipoda (Cabral, 2000b; Sá et al., 2003; Vinagre et al., 2005). A
longevity of S. solea was 15 years and a maximum total length of 500 mm (Dinis,
1986), and Andrade (1990) determined for S. senegalensis a maximum total length of
516 mm and a longevity of 11 years. S. senegalensis presented a long reproduction
period ranges from autumn to spring (Andrade, 1990), or for spring to summer (Dinis,
1986).
Studies on the ecology of these two species in sympatric areas (i.e. from Bay of Biscay
to North Africa and western Mediterranean) are scarce. The importance of

CHAPTER 2
39
these studies is crucial for management purposes. The aim of the present work was to
study the feeding ecology, age and growth, and reproduction of S. solea and S.
senegalensis in the Portuguese coast.
MATERIALS AND METHODS
Sampling Surveys and Samples Processing
Bimonthly samples were collected between January 2003 and June 2005 from
commercial fishing vessels operating with gill nets and bottom trawls along the
Portuguese coast (Figure 2.1). Samples were collected regularly throughout the year
and along the coast (a minimum of 40 individuals were obtained per season and
sampling area).
Figure 2.1. Location of sampling area.
Lisbon
ATLA
NTIC
OCEAN
41ºN
39ºN
37ºN 200 m
PORTU
GAL
200 m
10ºW 8ºW

Feeding, Growth and Reproduction of Two Sympatric Soles
40
All fish were measured (total length to nearest 1 mm) and weighed (total and
eviscerated wet weight with 0.01 g precision). Gut and gonads were removed and
frozen (-20ºC) for further analysis. Saggitae otoliths were removed, cleaned and kept
dry for later age determination.
Feeding Ecology
The stomach contents of 494 S. solea (total length between 187 mm and 465 mm)
and 533 S. senegalensis (total length between 191 mm and 494 mm) were analysed.
Each prey item was identified to the lowest taxonomic level possible, counted and
weighed (wet weight with 0.001 g precision).
The relative importance of each prey item in the diet was evaluated by the numerical
(NI), occurrence (OI) and gravimetric (GI) indices (Hyslop, 1980). Feeding activity
was evaluated by the vacuity index (VI) defined as the percentage of empty stomachs
(Hyslop, 1980).
Correspondence analyses (CA) were run to evaluate diet variation with season, sex
and fish length according to each of the three index values. Prey items were grouped
to a broader taxonomic level, two seasons (autumn-winter and spring-summer) and
two size classes (size class 1: <300 mm and size class 2: ≥300 mm total length) were
considered. These analyses were performed using CANOCO (CANOnical Community
Ordination) version 4.5 (ter Braack and Šmilauer, 2002).
Diet differences between season, sex and fish size were tested using the χ2–test (Zar,
1984) with a 0.05 significance level.
Diet overlap was measured using the Schoener index (IS), defined as
)pp0.5(- 1I sn
1iiBi A∑ -
== ,
where piA and piB and were the numerical frequencies of item i in the diet of species A
and B, respectively (Linton et al., 1981). Values of diet overlap vary from 0, when no
food is shared, to 1, when there is the same proportional use of all food resources.
Although there are no critical levels with which overlap values can be compared,
Wallace (1981) and Wallace and Ramsey (1983) suggested that values higher than
0.6 should be considered as biologically significant.
The degree of feeding specialization of each season, sex and size class of fish was
determined using the Shannon–Wiener diversity index H’ (Shannon and Weaver,
1949)
Pln PH' is
1ii∑-
== ,

CHAPTER 2
41
where Pi is the numerical proportion of the ith prey category in the diet and s is the
total number of different prey categories consumed by predator. This index
corresponds to the dietary breadth (Marshall and Elliott, 1997).
Growth
Age was evaluated using otoliths readings. For each specimen, two counts of otolith
annuli were made under a dissecting microscope. Whenever the two readings of the
same otolith resulted in different age estimates the data were not considered for
further analysis.
Estimates of theoretical growth in length were obtained by fitting length-at-age data
to the von Bertalanffy growth equation:
)1.( ).( 0ttkt eLL −−
∞ −= ,
where Lt is the total length, L∞ is the asymptotic length, k is the growth coefficient and
t0 is the theoretical age at zero length. The growth parameters of this model were
estimated iteratively using the least squares method in STATISTICA (Statsoft)
software. This analysis was performed separately for males and females.
Reproduction
Gonads were observed macroscopically and a maturation stage was assigned to each
individual, according to the scale: I – immature, II – development, III – spawning, IV
– post-spawning (Cabral, 1998). For each season (autumn-winter, spring-summer),
the percentage of fish in stages II, III and IV was determined.
In order to evaluate gonadal development throughout the year to determine the
spawning season, the gonadosomatic index (GSI) was calculated, per sex, for each
season. The GSI was expressed as the percentage of the weight of gonads in relation
to eviscerated weight of fish. Age and length at first maturity were determined.
RESULTS
Feeding Ecology
Crustacea, Polychaeta and Bivalvia were the most important itens in the diet of S.
solea and S. senegalensis (Table 2.1). Among Crustacea, Amphipoda presented the

Feeding, Growth and Reproduction of Two Sympatric Soles
42
highest contribution to the diet of both species, followed by Decapoda and Mysida, for
common sole and Senegalese sole, respectively. The most important Polychaeta prey
were Nephtyidae and Nereididae to S. solea and Nereididae and Cirratullidae to S.
senegalensis. Ensis spp. and Tellina distorta were the most important bivalves in the
diet of both species. Vacuity index was higher for Senegalese sole (45.4%) compared
to the value obtained for common sole (33.3%). The lowest values of vacuity occurred
in spring-summer, for females and for small size individuals (Table 2.2).
The correspondence analysis (CA) performed using data on the three indices for the
main prey groups, by season, sex and size class, explained a high percentage of the
variance in the first two axes (41.7%, 58.9% and 51.7% for NI, OI and GI,
respectively) (Figure 2.2).
When the numerical index was considered in the ordination analysis (Figure 2.2a), the
largest individuals of S. solea were associated with Decapoda and Paguridae. The diet
of small individuals was associated with Bivalvia and Gastropoda for females, and
Amphipoda for males. S. senegalensis diet was strongly associated with Polychaeta,
for small females, in autumn-winter, and for the largest males throughout the year.
The small females, in spring-summer, were associated with Gastropoda and the
largest females with Mysida. The small males’ diet, in autumn-winter, was composed
by Perciformes, and, spring-summer, was composed by Gastropoda.
When considering the occurrence data in the ordination diagram (Figure 2.2b) it can
be seen that: the size class I of S. solea was associated with Echinodermata,
Gastropoda and Bivalvia in spring-summer. The largest individuals’ diet was composed
by Paguridae for females in autumn-winter and for males in spring-summer. Decapoda
was associated with small females in autumn-winter and with largest females in
spring-summer. Small males were associated with Polychaeta in autumn-winter. S.
senegalensis was mostly associated with Amphipoda, Isopoda and Mysida. Diet of
small males was associated with Perciformes in autumn-winter and with Isopoda in
spring-summer.
In the ordination diagram obtained for gravimetrical data (Figure 2.2c), Amphipoda
was strongly associated with small females of S. solea in autumn-winter, and
throughout the year for small males. Females’ diet was composed by Bivalvia for class
size I in spring-summer, and class size II were associated with Echinodermata in
spring-summer, and Paguridae in autumn-winter. The diet of the largest males was
composed by Echinodermata in autumn-winter, and Paguridae in spring-summer. S.
senegalensis was chiefly associated with Polychaeta, Mysida and Crustacea.
Amphipoda was associated with females of both class size, and with largest males
spring-summer.

CHAPTER 2
43
For common sole and Senegalese sole, the numbers of each prey item differed
between seasons (χ2=34.3, d.f.=11, P<0.05 and χ2=520.4, d.f.=11, P<0.05,
respectively).
The diet of common sole and Senegalese sole was different between sexes (χ2=40.3,
d.f.=11, P<0.05 and χ2=449.2, d.f.=11, P<0.05, respectively).
S. solea and S. senegalesnis presented a different diet between the two size classes
(χ2=144.0, d.f.=11, P<0.05 and χ2=614.0, d.f.=11, P<0.05, respectively).

Feeding, Growth and Reproduction of Two Sympatric Soles
44
Table 2.1.
Numerical (NI), occurrence (OI) and gravimetric (GI) indices values of prey found
in guts of S. solea and S. senegalensis, in the Portuguese coast.
S. solea S. senegalensis Prey itens NI OI GI NI OI GI Foraminifera 2.7 1.7 <0.1 0.1 0.3 0.1 Polyplacophora 0.2 0.3 0.1 0.1 0.2 0.2 Bivalvia 18.2 13.6 9.6 8.1 11.1 4.6 Dosinia lupinus 0.9 1.0 0.3 0.2 0.6 0.2 Donax vittatus 0.1 0.2 0.2 Acanthocardia spp. 0.5 0.4 0.8 Ensis spp. 6.5 4.0 4.3 3.7 4.0 2.6 Tellina distorta 1.7 1.3 1.2 1.3 1.3 0.3 Tellina tenius 0.9 0.4 0.8 Corbula spp. 0.3 0.4 <0.1 Chlamys spp. 0.8 0.4 0.1 Bivalvia n.i. 6.6 5.6 2.1 2.8 5.0 1.3 Gastropoda 3.7 2.9 1.5 7.9 2.5 5.0 Gibbula spp. 0.4 0.4 0.1 0.1 0.2 0.2 Fusinus syracusanus 0.1 0.1 0.1 Muricopsis cristata 0.1 0.1 <0.1 Nucella fragilis 0.1 0.1 0.1 Nassarius spp. 0.2 0.1 0.1 0.1 0.2 1.4 Littorina spp. 0.1 0.1 <0.1 Hydrobia ulvae 0.1 0.2 0.2 Turritella spp. 0.1 0.1 <0.1 0.1 0.2 0.2 Velutina velutina 0.6 0.3 0.8 Ringicula auriculata 0.5 0.4 0.1 0.1 0.2 0.2 Scaphander lignarius 1.3 0.9 0.1 7.2 0.9 2.5 Gastropoda n.i. 0.2 0.3 0.1 0.2 0.6 0.3 Annelida 28.3 29.4 26.9 Polychaeta 28.2 29.2 25.5 36.5 37.7 43.8 Ampharetidae 0.2 0.1 <0.1 1.9 0.2 0.5 Cirratulidae 2.6 2.7 1.4 Flabelligeridae 0.3 0.2 0.2 Pectinariidae 1.7 0.6 2.4 Sternaspidae 0.1 0.1 0.3 Terebellidae 0.3 0.1 0.1 Trichobranchidae 0.6 0.6 0.8 Sabellariidae 0.1 0.1 <0.1 0.9 0.4 1.5 Lygdamis spp. 0.9 0.4 1.5 Aphroditidae 0.5 0.5 0.6 0.6 0.8 0.4 Aphrodita aculeata 0.4 0.4 0.6 0.2 0.4 0.2 Aphroditidae n.i. 0.1 0.1 <0.1 0.4 0.4 0.2 Polynoidae 0.5 0.6 0.3 Sigalionidae 1.5 1.3 1.6 0.4 0.4 0.6 Leanira spp. 0.1 0.1 <0.1 Sigalion spp. 0.6 0.3 0.2 Sigalionidae n.i. 0.8 0.9 1.4 Glyceridae 0.1 0.1 0.1 0.7 1.1 0.8 Goniadidae 0.1 0.1 0.9 Nephtyidae 3.1 3.6 4.4 1.8 1.7 0.9 Nereididae 3.0 0.9 0.6 5.8 2.8 5.5 Nereis spp. 2.2 0.6 0.7
(continue)
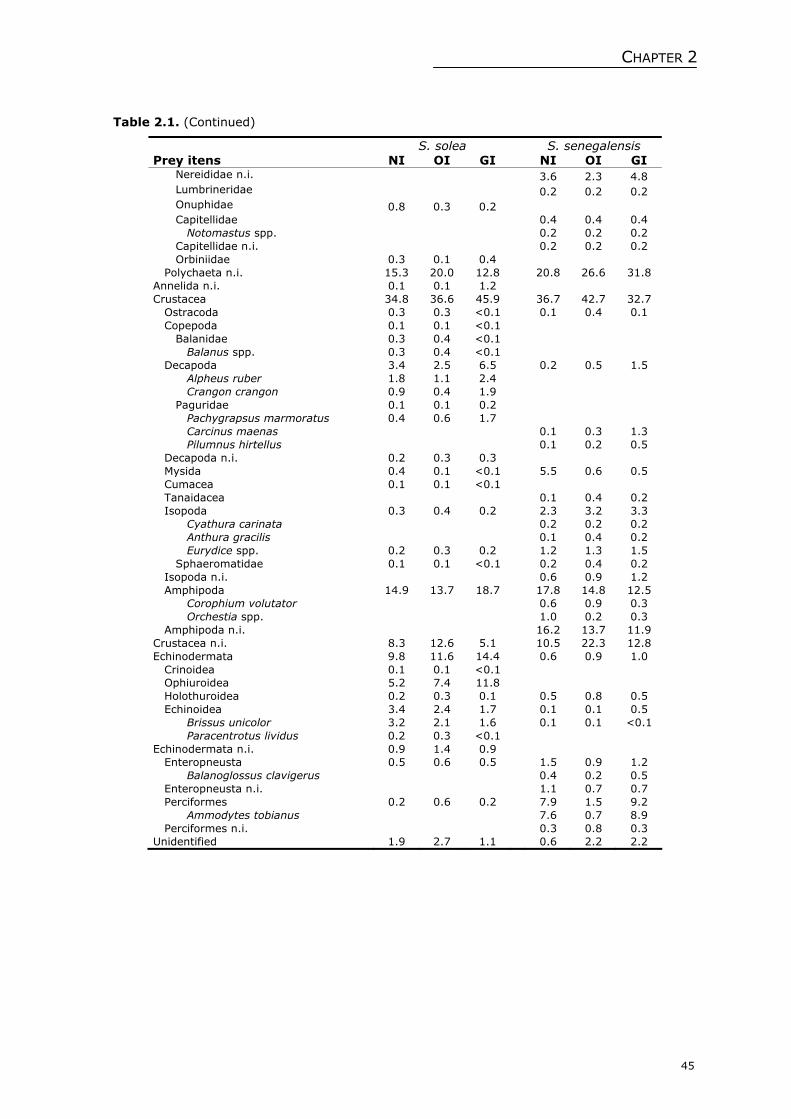
CHAPTER 2
45
Table 2.1. (Continued)
S. solea S. senegalensis Prey itens NI OI GI NI OI GI Nereididae n.i. 3.6 2.3 4.8 Lumbrineridae 0.2 0.2 0.2 Onuphidae 0.8 0.3 0.2 Capitellidae 0.4 0.4 0.4 Notomastus spp. 0.2 0.2 0.2 Capitellidae n.i. 0.2 0.2 0.2 Orbiniidae 0.3 0.1 0.4 Polychaeta n.i. 15.3 20.0 12.8 20.8 26.6 31.8 Annelida n.i. 0.1 0.1 1.2 Crustacea 34.8 36.6 45.9 36.7 42.7 32.7 Ostracoda 0.3 0.3 <0.1 0.1 0.4 0.1 Copepoda 0.1 0.1 <0.1 Balanidae 0.3 0.4 <0.1 Balanus spp. 0.3 0.4 <0.1 Decapoda 3.4 2.5 6.5 0.2 0.5 1.5 Alpheus ruber 1.8 1.1 2.4 Crangon crangon 0.9 0.4 1.9 Paguridae 0.1 0.1 0.2 Pachygrapsus marmoratus 0.4 0.6 1.7 Carcinus maenas 0.1 0.3 1.3 Pilumnus hirtellus 0.1 0.2 0.5 Decapoda n.i. 0.2 0.3 0.3 Mysida 0.4 0.1 <0.1 5.5 0.6 0.5 Cumacea 0.1 0.1 <0.1 Tanaidacea 0.1 0.4 0.2 Isopoda 0.3 0.4 0.2 2.3 3.2 3.3 Cyathura carinata 0.2 0.2 0.2 Anthura gracilis 0.1 0.4 0.2 Eurydice spp. 0.2 0.3 0.2 1.2 1.3 1.5 Sphaeromatidae 0.1 0.1 <0.1 0.2 0.4 0.2 Isopoda n.i. 0.6 0.9 1.2 Amphipoda 14.9 13.7 18.7 17.8 14.8 12.5 Corophium volutator 0.6 0.9 0.3 Orchestia spp. 1.0 0.2 0.3 Amphipoda n.i. 16.2 13.7 11.9 Crustacea n.i. 8.3 12.6 5.1 10.5 22.3 12.8 Echinodermata 9.8 11.6 14.4 0.6 0.9 1.0 Crinoidea 0.1 0.1 <0.1 Ophiuroidea 5.2 7.4 11.8 Holothuroidea 0.2 0.3 0.1 0.5 0.8 0.5 Echinoidea 3.4 2.4 1.7 0.1 0.1 0.5 Brissus unicolor 3.2 2.1 1.6 0.1 0.1 <0.1 Paracentrotus lividus 0.2 0.3 <0.1 Echinodermata n.i. 0.9 1.4 0.9 Enteropneusta 0.5 0.6 0.5 1.5 0.9 1.2 Balanoglossus clavigerus 0.4 0.2 0.5 Enteropneusta n.i. 1.1 0.7 0.7 Perciformes 0.2 0.6 0.2 7.9 1.5 9.2 Ammodytes tobianus 7.6 0.7 8.9 Perciformes n.i. 0.3 0.8 0.3 Unidentified 1.9 2.7 1.1 0.6 2.2 2.2

Feeding, Growth and Reproduction of Two Sympatric Soles
46
Table 2.2. Vacuity index (VI) for each season (aw – autumn/winter; sps – spring/summer),
sex (F – females; M – males) and size class (I – size class I; II – size class II),
for the S. solea and S. senegalensis.
Species S. solea S. senegalensis
Season (aw/sps) 40.9 26.2 47.3 43.0
Sexes (F/M) 29.2 37.2 34.8 55.0 Vacuity Index
Size class(I/II) 27.7 39.2
33.3
40.6 50.2
45.4
Both species showed highest dietary diversity in autumn-winter (H’=3.09 to common
sole, H’=2.63 to Senegalese sole). Females of common sole showed a higher dietary
breadth than males (H’=3.13 and H’=2.98, respectively), and the dietary diversity
increased with size (H’=3.13 to class II and H’=2.98 to class I). Senegalese sole
showed an opposite tendency relatively to common sole dietary breadth, males
Shannon-Wiener index was major than females Shannon-Wiener index (H’=2.63 and
H’=2.18), and the dietary breadth decreased with size (H’=2.63 and H’=2.18).
Judged by Schoener index values >0.6, a high diet overlap occurred only in the
autumn-winter period (0.61) and between females (0.66).

CHAPTER 2
47
(a)
(b)
(c)
Figure 2.2. Ordination diagrams of the correspondence analyses performed using
numerical (a), occurrence (b) and gravimetric (c) indices values of prey found
in guts of S. solea (SS) and S. senegalensis (SN) (f – females; m – males; aw
– autumn/winter; sps – spring/summer; I – size class I; II – size class II).
-0.6 0.6
-0.4
1.0
Amphipoda
Bivalvia
Crustacea
DecapodaEchinodermata
GastropodaIsopoda
Mysida
Others
Paguridae
Polychaeta
Perciformes
SSfawI
SSfawII
SSmawI
SSmawIISSfspsI
SSfspsII
SSmspsI
SSmspsII
SNfawISNfawII
SNmawI
SNmawIISNfspsI
SNfspsII
SNmspsI
SNmspsII
-1.0 1.0
-0.6
0.8
Amphipoda
BivalviaCrustacea
Decapoda
Echinodermata
Gastropoda
IsopodaMysida
Others
PaguridaeP
oly
chaeta
Perciformes
SSfaw1
SSfawII
SSmawI
SSmawII
SSfspsI
SSfspsII
SSm
spsI
SSmspsII
SN
faw
I
SNfawII
SNmawI
SN
maw
II
SN
fspsI
SNfspsII
SNmspsI
SN
msp
sII
-0.4 1.0
-0.4
0.6
Amphipoda
Bivalvia
Crustacea
Decapoda
Echinodermata Gastropoda
IsopodaMysida
Others
Paguridae
Polychaeta Perciformes
SSfawI
SSfawII
SSmawI
SSmawIISSfspsI
SSfspsII
SSmspsI
SSmsps II
SNfawI
SNfawII SNmspsI
SNmawII
SNfspsI
SNfspsII
SNmawI
SNmspsII
Feeding, Growth and Reproduction of Two Sympatric Soles
48
Age and Growth
Among the 267 individuals collected for age determination to S. solea, the otoliths
from 154 females and 113 males were used. The total length of fish analysed varied
from 224 mm to 462 mm from females and from 187 mm to 415 mm from males. The
ages of the samples ranges from 1 to 9 years. A total of 181 individuals were analysed
for age determination for S. senegalensis, the otoliths from 84 females and 97 males
were used. The length of the female specimens analysed varied from 215 mm to 472
mm and that of males from 199 mm to 412 mm. The age of S. senegalensis
specimens analysed ranged from 2 to 8 years.
The von Bertalanffy growth equation coefficients for common sole differed between
sexes (Figure 2.3a). The asymptotic length (L∞) obtained for females was higher
compared to males (521.5 mm and 466.9 mm, respectively), while the growth
coefficient (k) estimate of females (k=0.23) was higher than that determined for
males (k=0.21). The t0 estimates were -0.11 and 1.57 for females and males,
respectively.
Coefficients of von Bertalanffy growth equation for Senegalese sole showed a
difference between sexes (Figure 2.3b). The estimated asymptotic lengths were higher
for females (L∞=532.3) than for males (L∞=457.2), while growth coefficient was
higher to females compared to males (k=0.17 and k=0.15, respectively), and the t0
estimates were -1.17 to females and -2.91 to males.
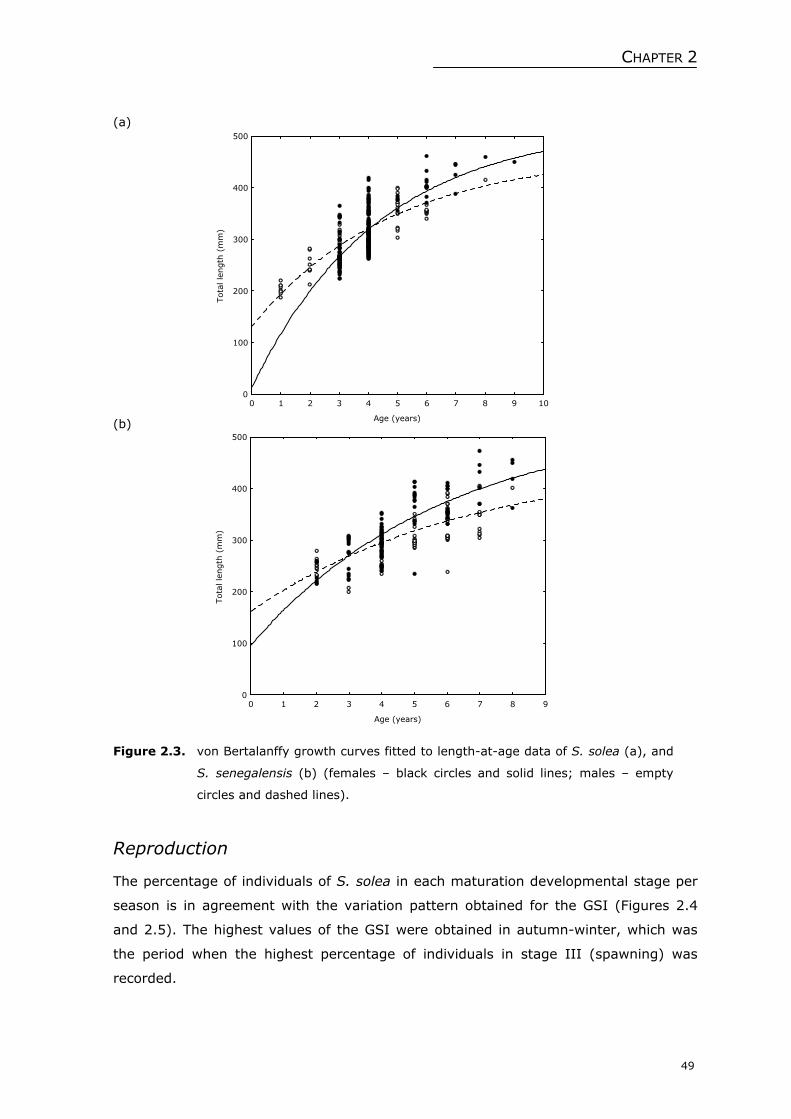
CHAPTER 2
49
(a)
(b)
Figure 2.3. von Bertalanffy growth curves fitted to length-at-age data of S. solea (a), and
S. senegalensis (b) (females – black circles and solid lines; males – empty
circles and dashed lines).
Reproduction
The percentage of individuals of S. solea in each maturation developmental stage per
season is in agreement with the variation pattern obtained for the GSI (Figures 2.4
and 2.5). The highest values of the GSI were obtained in autumn-winter, which was
the period when the highest percentage of individuals in stage III (spawning) was
recorded.
0 1 2 3 4 5 6 7 8 9 10
Age (years)
0
100
200
300
400
500
Tota
l le
ngth
(m
m)
0 1 2 3 4 5 6 7 8 9
Age (years)
0
100
200
300
400
500
Tota
l le
ngth
(m
m)

Feeding, Growth and Reproduction of Two Sympatric Soles
50
Comparing the GSI values of males and females, it can be noticed that the values
obtained for females (mean value from 0.79 to 4.52) were extremely high when
compared with those determined for males (mean value from 0.06 to 0.12).
(a)
(b)
Figure 2.4. Percentage of individuals of S. solea (a) and S. senegalensis (b) in each
maturation stage (I – immature; II – development; III – spawning; IV – post-
spawning), according to season (aw – autumn/winter; sps – spring/summer)
and sex (F – females; M – males).
( Immature; Development; Spawning; Post-spawning).
The proportion of individuals of S. senegalensis according to maturity stages was
found in agreement with GSI seasonal changes (Figures 2.4 and 2.5). The highest
values of the GSI were obtained in autumn-winter, which was the period when the
highest percentage of individuals in stage III (spawning) was recorded.
Comparing the GSI values of males and females, it can be noticed that the values
obtained for females (mean value from 2.62 to 3.08) were extremely high when
compared with those determined for males (mean value from 0.12 to 0.28).
The age of first maturity of common sole occurred at 4 years for females and males,
with the length at first maturity being 370 mm and 348 mm for females and males,
respectively. The maturation of Senegalese sole occurred at 3 years for both sexes,
females were largest (338 mm) than males (332 mm).
0%
20%
40%
60%
80%
100%
sps aw sps aw
F M
0%
20%
40%
60%
80%
100%
sps aw sps aw
F M

CHAPTER 2
51
(a) (b)
Figure 2.5. Gonadosomatic index mean values, determined for each season and sex for S.
solea (a) and S. senegalensis (b) (standard deviation is represented above
bars).
DISCUSSION
The present study shows that trophic profile of common sole is characterised by
Crustacea, Polychaeta and Mollusca. Our results were similar with the results obtained
in several studies made in the western Europe (e.g. Cabral, 2000b; Sá et al., 2003;
Vinagre et al., 2005) and in the Mediterranean (Molinero and Flos, 1992). Other
authors (e.g. Darnaud et al., 2001; Vallisneri et al., 2002) reported that this species
consumes mainly Polychaeta, Crustacea and Mollusca. The variety of habitats –
shallow coastal areas, continental shelf, estuarine ecosystems – and the range of fish
lengths analysed in these studies probably account for these slight dietary
dissimilarities.
The diet of S. senegalensis was similar to S. solea that of as outline by several authors
(e.g. Garcia-Franquesa et al., 1996; Cabral, 2000a; Sá et al., 2003).
The feeding activity of common sole and Senegalese sole varied throughout the year,
being highest in spring-summer but lowest in winter-autumn. This feeding behaviour
is consistent with the findings reported in several studies (e.g. Molinero and Flos,
1992; Cabral, 2000a), but disagrees with Gracia-Franquesa et al. (1996), Vallisneri et
al. (2002) and Sá et al. (2003) that pointed out, for both species, that vacuity was
higher in spring-summer. Females of both species presented lower vacuity values than
males, which is in agreement with previous studies (Molinero and Flos, 1991; Garcia-
Franquesa et al., 1996). Smallest individuals of these two soles species were more
0.0
1.0
2.0
3.0
4.0
5.0
6.0
7.0
8.0
Spring-Summer Autumn-Winter0.0
1.0
2.0
3.0
4.0
5.0
6.0
7.0
8.0
9.0
10.0
Spring-Summer Autumn-Winter

Feeding, Growth and Reproduction of Two Sympatric Soles
52
active for feeding than the largest ones (Molinero and Flos, 1991; Garcia-Franquesa et
al., 1996). Several factors may explain these differences. Firstly, in spring,
environmental conditions are favourable for an increase of prey availability. Secondly,
since the process of reproduction was completed, females must recover their energetic
resources, as it has been reported for other flatfishes (Pitt, 1973; Lozán, 1992).
Common sole and Senegalese sole presented variations in diet according to season,
sex and length, that may be due to many factors, such as changes in space and time
of benthic prey, shifts due to life-history patterns of prey and feeding activity of
predator (Wootton, 1998). The results relative to diet variation according to fish
length were similar to those obtained by other authors for other flatfish species,
showing an increase in the importance of larger prey with increasing size of fish (e.g.
Belghyti et al., 1993; Cabral, 2000a). This, is consistent with the optimum foraging
theory (Gerking, 1994), which states that larger predators tend to consume larger
prey in order to maximize the energetic gain relative to capture effort.
Common sole presented a larger dietary breadth compared to Senegalese sole. The
diet diversity of both sole species was higher when the vacuity reached a maximum
value, which could constitute a compensatory response to a possible decrease of prey
availability during those seasons. A study conducted in southern Portugal (Sá et al.,
2003) showed than both species presented low dietary variation.
Diet overlap values were high only in the autumn-winter period between the two
species and for females. Cabral (2000a) showed that interspecific diet overlap was low
for juveniles of the two sole species. Some authors (Moore and Moore, 1976; Poxton
et al., 1983; Burke, 1995) report the avoidance of interspecific competition by the
adoption of different strategies of resource, which may also be the case of adult soles.
The estimate of von Bertalanffy parameters for S. solea obtained in the present study
was similar to those reported by Dinis (1986) for the Tagus estuary. The asymptotic
length values reported for North Europe and Mediterranean (e.g. Deniel, 1981;
Türkman, 2003) were lower than the ones estimated in the present work. Growth
coefficient (k) estimates were lower for the Portuguese coast compared to those
determined for North Europe and Mediterranean; the highest values were obtained for
males by Vianet et al. (1989).
Growth studies for S. senegalensis are scarce and all developed in the Portuguese
coast. The estimates of von Bertalanffy parameters obtained in this study were similar
to those proposed by Andrade (1990), for the southern coast of Portugal.
Andrade (1990) point out that the highest values of total length were relative to
females and estimated that the largest individual analysed (516 mm) should have 11
CHAPTER 2
53
years. The estimates of L∞ reported by Dinis (1986), for the Tagus estuary, were
lower than our results and also the values determined by Andrade (1990).
Many factors could influence growth. According to Pauly (1994a) latitudinal variation
in growth is caused mainly by variations in maintenance metabolism due to latitudinal
differences in temperature. The differential growth according to sex, registered for
both species, may be due to the distinct maintenance metabolism of the two sexes by
different oxygen consumption (Pauly, 1994b), by the different share between
reproduction and somatic growth of surplus energy, as Rijnsdorp and Ibelings (1989)
and Rijnsdorp (1993a) found in plaice, and different food intake, as Lozán (1992)
found in other flatfish.
The results concerning the seasonal variation of gonadal indices suggest that the
spawning period of both species is autumn-winter. Previous studies reported that the
common sole reproduction period occurred mainly in winter, but it can occur in spring
(e.g. Koutsikopoulos et al., 1989; Zaki, 1989). Some authors reported reproduction
only in winter (Vallisneri et al., 2002) or in spring (Türkmen, 2003). Previous studies
(Ramos, 1982; Türkmen, 2003) reported lower values of length at first maturation
than the values obtained in the present work. Studies taking place in the Portuguese
coast have showed that the reproduction period of Senegalese sole ranges from
autumn to spring (Andrade, 1990), or for spring to summer (Dinis, 1986). Some
authors, on the north coast of France (Lagardère et al., 1979) and on the
Mediterranean (Ramos, 1982), suggested that reproduction occurs in the spring-
summer period. Length at first maturation obtained in the present study was similar to
values obtained by Andrade (1990), for the south coast of Portugal.
Natural variation in size and age at maturity within a population of a species can occur
in stable populations but is generally small. Several studies (e.g. Walsh, 1994;
Bowering et al., 1997; Rijnsdorp and Vethaak, 1997) showed that a large variability in
maturation could be related to the declining of populations. Variations in size and age
at maturity may be genetical, or associated with changes in environmental conditions
on the nursery grounds or later during the juvenile/adult stage (e.g. Stearns and
Crandall, 1984; Rijnsdorp, 1993b).
In conclusion, several aspects of S. solea and S. senegalensis biology remain to be
studied, namely the evaluation of prey availability and predation pressure, length-
frequency distribution analysis, the characterizion of the reproductive period and
gonadal modifications, as well as regarding larvae and juvenile stages.

Feeding, Growth and Reproduction of Two Sympatric Soles
54
ACKNOWLEDGEMENTS
This study was partially financed by the Fundação para a Ciência e a Tecnologia (FCT),
through the grant attributed to C.M. Teixeira (Grant SFRH/BD/19319/2004). This
study was also co-funded by the European Union through the FEDER–Fisheries
Programme (MARE).
REFERENCES
Andrade, J.P.A.S., 1990. A importância da Ria Formosa no ciclo biológico de Solea
senegalensis Kaup 1858, Solea vulgaris Quensel 1806, Solea lascaris (Risso, 1810) e
Microchirus azevia (Capello, 1868). PhD Thesis, Universidade do Algarve, Portugal.
Andrade, J.P., 1992. Age, growth and population structure of Solea senegalensis Kaup,
1858 (Pisces, Soleidae) in the Ria Formosa (Algarve, Portugal). Scientia Marina 56(1),
35–41.
Baynes, S.M., Howell, B.R., Beard, T.W., Hallam, J.D., 1994. A description of spawning
behaviour of captive Dover sole, Solea solea (L.). Netherlands Journal Sea Research 32
(3/4), 271–275.
Belghyti, D., Aguesse, P., Gabrion, C., 1993. Éthologie alimentaire de Citharus linguatula
et Dicologoglossa cuneata sur les côtes atlantiques du Maroc. Vie et Milieu 43, 95–108.
Bowering, W.R., Morgan, M.J., Brodie, W.B., 1997. Changes in the population of American
plaice (Hippoglossoides platessoides) off Labrador and northeastern Newfoundland: a
collapsing stock with low exploitation. Fisheries Research 30, 199–216.
Bromley, P J., 2003. The use of market sampling to generate maturity ogives and to
investigate growth, sexual dimorphism and reproductive strategy in central and south-
western North Sea sole (Solea solea L.). ICES Journal of Marine Science 60, 52–65.
Burke, J.S., 1995. Role of feeding and prey distribution of summer and southern flounder
in selection of estuarine nursery habitats. Journal of Fish Biology 47, 355–366.
Cabral, H.M.R.N., 1998. Utilização do estuário do Tejo como área de viveiro pelos
linguados, Solea solea (L., 1758) e Solea senegalensis Kaup, 1858, e robalo,
Dicentrarchus labrax (L., 1758). PhD Thesis, Universidade de Lisboa, Portugal.
Cabral, H.N., 2000a. Distribution and abundance patterns of flatfishes in the Sado estuary,
Portugal. Estuaries 53, 351–358.
Cabral, H.N., 2000b. Comparative feeding ecology of sympatric Solea solea and S.
senegalensis, within the nursery areas of the Tagus estuary, Portugal. Journal of Fish
Biology 57, 1550–1562.
CHAPTER 2
55
Cabral, H., 2003. Differences in growth rates of juvenile Solea solea and Solea
senegalensis in the Tagus estuary, Portugal. Journal of the Marine Biological
Association of the United Kingdom 83, 861–868.
Darnaude, A.M., Harmelin-Vivien, M.L., Salen-Picard C., 2001. Food partioning among
flatfish (Pisces: Pleuronectiformes) juveniles in a Mediterranean coastal shallow sandy
area. Journal of the Marine Biological Association of the United Kingdom 81, 119–127.
Deniel, C., 1981. Les poissons plats (Téléostéens-Pleuronectiformes) en Baie de
Douarnenez. Reproduction, croissance et migration des Bothidae, Scophthalmidae,
Pleuronectidae et Soleidae. PhD Thesis, Université de Bretagne Occidentale, France.
Dinis, M.T., 1986. Quatre Soleidae de l’estuaire du Tage reproduction et croissance essai
d’elevage de Solea senegalensis Kaup. PhD Thesis, Université de Bretagne Occidentale,
France.
Garcia, E., Molinero, A., Flos, R., 1991. Growth comparative study in two species of sole:
Solea solea and Solea senegalensis in the Mediterranean Sea. Aquaculture and the
Environment 14, 112–113.
Garcia-Franquesa, E., Molinero, A, Valero, V., Flos, R., 1996. Influence of sex, age and
season on the feeding habits of the flatfish Solea senegalensis. Environmental Biology
of Fish 47, 289–298.
Gerking, S.D., 1994. Feeding Ecology of Fish. Academic Press, San Diego.
Henderson, P.A., Seaby, R.M., 2005. The role of climate in determining the temporal
variation in abundance, recruitment and growth of sole Solea solea in the Bristol
Channel. Journal of the Marine Biological Association of the United Kingdom 85, 197–
204.
Hyslop, E.J., 1980. Stomach contents analysis: a review of methods and their application.
Journal of Fish Biology 17, 415–429.
Koutsikopoulos, C., Desaunay, Y., Dorel, D., Marchand, J., 1989. The role of coastal areas
in the life history sole (Solea solea L.) in the Bay of Biscay. Scientia Marina 53 (2-3),
567–575.
Lagardère, F., Decampes, P., Quero, J.-C., 1979. Découverte le long des côtes de la
Charente Maritime d’une population de Solea senegalensis Kaup 1858 (Soleidae,
Pleuronectiformes). Annales de la Société des Sciences Naturelles de la Charente-
Maritime 6(6), 563–572.
Linton, L.R., Davies, R.W., Wrona, F.J., 1981. Resource utilization indices: an assessment.
Journal of Animal Ecology 50, 283–293.
Lozán, J.L., 1992. Sexual differences in food intake, digestive tract size, and growth
performance of the dab, Limanda limanda L. Netherlands Journal Sea Research 29,
223–227.

Feeding, Growth and Reproduction of Two Sympatric Soles
56
Marshall, S., Elliott, M., 1997. A comparison of univariate and multivariate numerical and
graphical techniques for determining inter- and intraspecific feeding relationships in
estuarine fish. Journal of Fish Biology 51, 526–545.
Molinero, A., Flos, R., 1991. Influence of sex and age on the feeding habits of the common
sole Solea solea. Marine Biology 111, 493–501.
Molinero, A., Flos, R., 1992. Influence of season on the feeding habits of the common sole
Solea solea. Marine Biology 113, 499–507.
Molinero, A., Garcia, E., Flos, R., 1991. Comparative study of the feeding habits for two
species of sole: Solea vulgaris and Solea senegalensis. Special Publications of the
European Society of the European Society Society of Aquaculture 14, 219–220.
Moore, J.W., Moore, I.A., 1976. The basis of food selection in flounders, Platichthys flesus
(L.), in the Severn estuary. Journal of Fish Biology 9, 139–156.
Nielsen, J.G., 1986a. Citharidae. In: Whithead, P.J.P., Bauchot, M.L., Hureau, J.C., Nielsen,
J., Tortonese, E. (eds.). Fishes of the North-eastern Atlantic and the Mediterranean.
UNESCO, Vol III, pp. 1286.
Nielsen, J.G., 1986b. Scophthalmidae. In: Whithead, P.J.P., Bauchot, M.L., Hureau, J.C.,
Nielsen, J., Tortonese, E. (eds.). Fishes of the North-eastern Atlantic and the
Mediterranean. UNESCO, Vol III, pp. 1287–1293.
Nielsen, J.G., 1986c. Bothidae. In: Whithead, P.J.P., Bauchot, M.L., Hureau, J.C., Nielsen,
J., Tortonese, E. (eds.). Fishes of the North-eastern Atlantic and the Mediterranean.
UNESCO, Vol III, pp. 1294–1298.
Nielsen, J.G., 1986d. Pleuronectidae. In: Whithead, P.J.P., Bauchot, M.L., Hureau, J.C.,
Nielsen, J., Tortonese, E. (eds.). Fishes of the North-eastern Atlantic and the
Mediterranean. UNESCO, Vol III, pp. 1299–1307.
Pauly, D., 1994a. A framework for latitudinal comparisons of flatfish recruitment.
Netherlands Journal Sea Research 32 (2), 107–118.
Pauly, D., 1994b. On the Sex of Fish and the Gender of Scientists: Essays in Fisheries
Science. Fish and Fisheries Series. Chapman and Hall, London.
Pitt, T.K., 1973. Food of the American plaice (Hippoglossoides platessoides) from the
Grand Bank, Newfoundland. Journal of the Fisheries Research Board of Canada 30,
1261–1273.
Poxton, M.G., Eleftheriou, A., McIntyre, A.D., 1983. The food and growth of 0-group
flatfish on nursery grounds in the Clyde Sea area. Estuarine, Coast and Shelf Science
17, 319–337.
Quéro, J.C., Desoutter, M., Lagardère, F., 1986a. Soleidae. In: Whithead, P.J.P., Bauchot,
M.L., Hureau, J.C., Nielsen, J., Tortonese, E. (eds.). Fishes of the North-eastern
Atlantic and the Mediterranean. UNESCO, Vol III, pp. 1308–1324.
CHAPTER 2
57
Quéro, J.C., Desoutter, M., Lagardère, F., 1986b. Cynoglossidae. In: Whithead, P.J.P.,
Bauchot, M.L., Hureau, J.C., Nielsen, J., Tortonese, E. (eds.). Fishes of the North-
eastern Atlantic and the Mediterranean. UNESCO, Vol III, pp. 1325–1328.
Ramos, J., 1982. Contribuición al estudio de la sexualidad del lenguado, Solea solea
(Linneo, 1758) (Pisces, Soleidae). Investigacion Pesquera 46(2), 275–286.
Rijnsdorp, A.D., 1993a. Selection differentials in male and female North Sea plaice and
changes in maturation and fecundity. In: Stokes, T.K., McGlade, J.M., Law, R. (eds.).
The Exploitation of Evolving Resources. Springer, 19–36.
Rijnsdorp, A.D., 1993b. Relationship between juvenile growth and the onset of sexual
maturity of female North Sea plaice, Pleuronectes platessa. Canadian Journal of
Fisheries and Aquatic Sciences 50, 1617–1631.
Rijnsdorp, A.D., Ibelings, B., 1989. Sexual dimorphism in the energetics of reproduction
and growth of North Sea plaice, Pleuronectes platessa L. Journal of Fish Biololy 35,
401–415.
Rijnsdorp, A.D., Vethaak, A.D., 1997. Changes in reproductive parameters of North Sea
plaice and sole between 1960–1995. ICES C.M. Doc., No. U:14, 31 pp.
Rijnsdorp, A.D., Vingerhoed, B., 2001. Feeding of plaice Pleuronectes platessa L. and sole
Solea solea in relation to the effects of bottom trawling. Journal of Sea Research 45,
219–229.
Sá, R., Bexiga, C., Vieira, L., Veiga, P., Erzini, K., 2003. Diets of the sole Solea vulgaris
Quensel, 1806 and Solea senegalensis Kaup, 1858 in the lower estuary of the Guadiana
River (Algarve, southern Portugal): Preliminary results. Boletín Instituto Español de
Oceanografía 19(1-4), 505–508.
Shannon, C.E., Weaver, W., 1949. The Mathematical Theory of Communication. University
of Illinois Press.
Stearns, S.C., Crandall, R.E., 1984. Plasticity for age and size at sexual maturity: a life
history response to unavoidable stress. In: Potts, G.W., Wootton, R.J. (eds.). Fish
Reproduction: Strategies and Tactics. Academic Press, pp. 2–33.
ter Braak, C.J.F., Šmilauer P., 2002. Canoco for Windows Version 4.5. Biometris – Plant
Research International, Wageningen.
Türkman, M., 2003. Investigation of Some Population Parameters of Common Sole, Solea
solea (L., 1758) from Üskenderun Bay. Turkisk Journal of Veterinary and Animal
Sciences 27, 317–323.
Vallisneri, M., Tinti, F., Tommasini, S., Piccinetti, C., 2002. Reproductive cycle of the
Common sole Solea vulgaris Quensel, 1806, in the northern Adriatic Sea. Acta Adriatica
42 (2), 59–63.
Vianet, R., Quignard, J.P., Tomasini, J.A., 1989. Age et croissance de quatre poissons
pleuronectiformes (flet, turbot, barbue, sole) du Golf du Lion. Evolution de la struture
de la sagitta. Cymbium 13(3), 247–258.

Feeding, Growth and Reproduction of Two Sympatric Soles
58
Vinagre, C., França, S., Costa, M.J., Cabral, H.N., 2005. Niche overlap between juvenile
flatfishes, Platichthys flesus and Solea solea, in a southern European estuary and
adjacent coastal waters. Journal of Applied Ichthyology 21, 114–120.
Wallace, H., 1981. An assessment of diet overlap indexes. Transactions of the American
Fisheries Society 110, 72–76.
Wallace, H., Ramsay, J.S., 1983. Reliability in measuring diet overlap. Canadian Journal of
Fisheries and Aquatic Sciences 40, 347–351.
Walsh, S.J., 1994. Life history traits and spawning characteristics in populations of long
rough dab (American plaice) Hippoglossoides platessoides (Fabricius) in the north
Atlantic. Netherlands Journal Sea Research 32, 241–254.
Wootton, R.J., 1998. Feeding. In: Wootton, R.J. (eds). Ecology of Teleost Fishes. Kluwer
Academic Publishers, pp. 27–62.
Zaki, M.I., 1989. Gametogenesis and sexual cycles of the sole, Solea solea, in Lake Karun
(Egypt). Vaprosy Ikhtiologii 4, 582–588.
Zar, J.H., 1984. Biostatistical Analysis. Prentice-Hall, New Jersey.

CHAPTER 3
Feeding ecology, growth and sexual cycle of the sand sole, Solea lascaris, along the
Portuguese coast
Journal of the Marine Biological Association of the United Kingdom (in press)
doi: 10.1017/S0025315409002562
By Teixeira, C.M., Pinheiro, A., Cabral, H.N.

CHAPTER 3
61
Feeding ecology, growth and sexual cycle of the
sand sole, Solea lascaris, along the Portuguese
coast
ABSTRACT: Sand sole, Solea lascaris (Risso, 1810), were collected along the Portuguese coast, between
October 2002 and July 2003, to examine feeding habits, age and growth and sexual cycle. The most
important prey items were Mysidacea, Amphipoda and Polychaeta. Differences in diet according to season
and length size were found: Amphipoda were very important in diet during winter, while Echinodermata
were consumed mostly in summer; smaller individuals feed on Amphipoda while larger feed on Decapoda.
Age of S. lascaris was determined from sagittae otoliths. The length of fish analysed ranged from 61 mm to
340 mm. The von Bertalanffy growth equation parameters differed significantly between sexes (L∞=342.3
mm, k=0.50, t0=-0.87 and L∞=264.5 mm, k=0.82, t0=0.13, females and males, respectively). The highest
values of the gonadosomatic index were obtained in winter and spring, when the highest proportion of
individuals at spawning stage was recorded.
KEYWORDS:
feeding ecology, growth, reproduction, flatfish, Solea lascaris, Portuguese coast
INTRODUCTION
A large number of flatfish species have been reported for the Portuguese coast (e.g.
Nielsen, 1986a,b,c,d; Quéro et al., 1986a,b; Cabral, 2000a) and though many of them
have a high commercial interest, few studies have been conducted on
Pleuronectiformes biology in Portuguese waters (e.g. Dinis, 1986; Andrade, 1990;
Cabral, 1998, 2000a,b; Cabral and Costa, 1999; Cabral et al., 2002).
The sand sole, Solea lascaris (Risso, 1810) is a Soleidae with a wide geographic
distribution, from the southern North Sea to the Gulf of Guinea and the
Mediterranean, inhabiting sandy and muddy bottoms at depths of 5 to 350 m (Quéro
et al., 1986a).
Despite its broad distribution, most studies on S. lascaris biology were conducted
along the west coast of Brittany (France) and the Portuguese coast and have

Feeding Ecology, Growth and Sexual Cycle of the Sand Sole
62
considered essentially its growth and reproduction (e.g. Deniel, 1981; Dinis, 1986;
Deniel et al., 1989; Andrade, 1990). The diet of S. lascaris was previously studied
along the west Brittany (France) and Algerian coasts (Marinaro and Bouabid, 1983;
Rodriguez, 1996).
The studies conducted along the Portuguese coast, reported that S. lascaris spawns
from January to June, southerly populations having an earlier spawning season (Dinis,
1986; Andrade, 1990; Gomes, 2002). A similar latitudinal gradient has been reported
for growth parameters with specimens of the central coastal area showing a lower
growth coefficient than those collected in Algarve (Andrade, 1990). Dinis (1986)
determined a longevity of 11 years and a maximum total length of 355 mm. Cabral et
al. (2002) mention that juvenile sand sole fed on small Crustacea and Bivalvia.
S. lascaris is a species with a growing commercial interest. In Portugal, its landings
have quadrupled in the last decade (from about 28 tonnes in 1990 to 116 tonnes
landed in 2000), coming to represent 6.4% of the landed flatfish. Still less common
than other commercially important sole species like Solea solea (Linnaeus, 1758) and
Solea senegalensis Kaup, 1858, with which S. lascaris are fished, it reaches high
values in auction giving it a great economic importance (DGPA, unpub. data).
As a commercially important species, increasingly exploited and poorly known, the
study of S. lascaris ecology has become of particular importance for fisheries
management purposes. Thus, the aim of the present work was to study the feeding
ecology, growth and sexual cycle of S. lascaris along the Portuguese coast.
MATERIALS AND METHODS
Sampling Surveys and Samples Processing
A total of 665 individuals were collected seasonally (autumn, winter, spring and
summer), between October 2002 and July 2003, from commercial fishing vessels
operating with gill nets and bottom trawls along the Portuguese coast (Figure 3.1).
All fish were measured (total length to nearest 1 mm) and weighed (total and
eviscerated wet weight with 0.01 g precision). Stomachs and gonads were removed
and frozen (-20ºC) for further analysis. Then, the stomach contents were removed for
identification and gonads were weighed. Each prey item was identified to the lowest
taxonomic level possible, counted and weighed (wet weight to 0.001 g). Saggitae
otoliths were removed, cleaned and kept dry for later age determination.
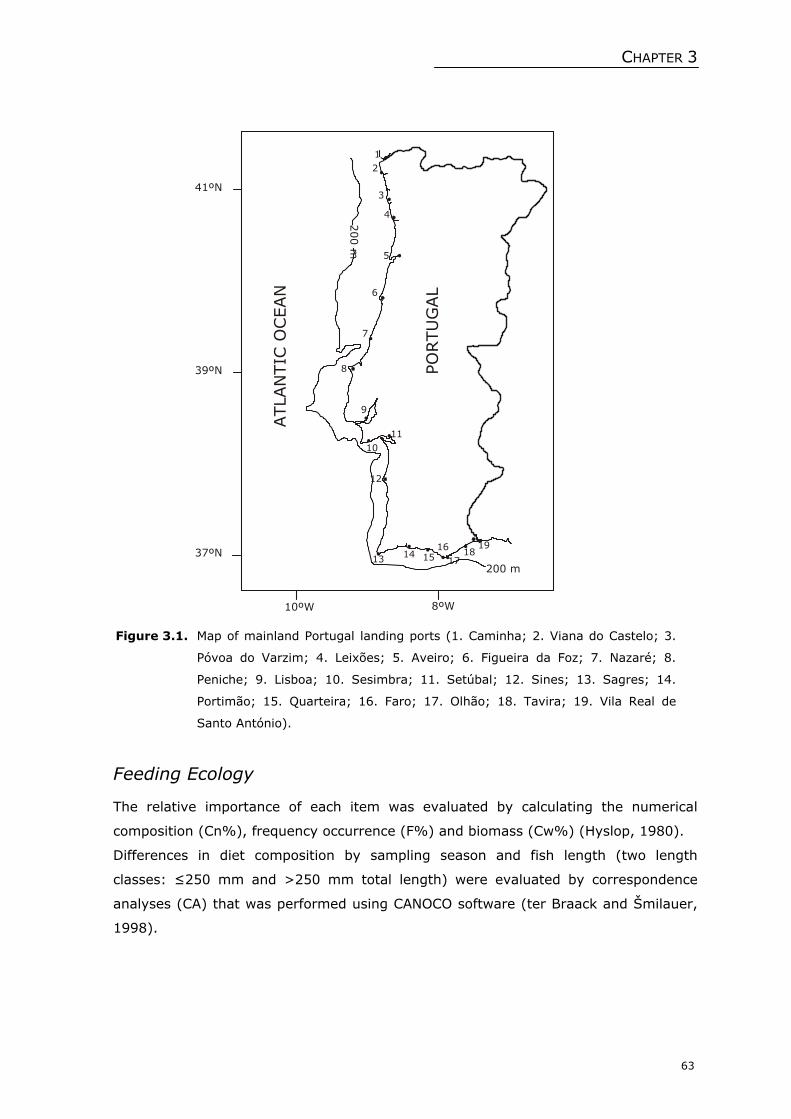
CHAPTER 3
63
Figure 3.1. Map of mainland Portugal landing ports (1. Caminha; 2. Viana do Castelo; 3.
Póvoa do Varzim; 4. Leixões; 5. Aveiro; 6. Figueira da Foz; 7. Nazaré; 8.
Peniche; 9. Lisboa; 10. Sesimbra; 11. Setúbal; 12. Sines; 13. Sagres; 14.
Portimão; 15. Quarteira; 16. Faro; 17. Olhão; 18. Tavira; 19. Vila Real de
Santo António).
Feeding Ecology
The relative importance of each item was evaluated by calculating the numerical
composition (Cn%), frequency occurrence (F%) and biomass (Cw%) (Hyslop, 1980).
Differences in diet composition by sampling season and fish length (two length
classes: ≤250 mm and >250 mm total length) were evaluated by correspondence
analyses (CA) that was performed using CANOCO software (ter Braack and Šmilauer,
1998).
ATLA
NTIC
OCEAN
41ºN
39ºN
37ºN 200 m
PORTU
GAL
200 m
10ºW 8ºW
6
19
4
12
8
12
3
5
7
9
1011
13 14 1516
1718

Feeding Ecology, Growth and Sexual Cycle of the Sand Sole
64
Age and Growth
Age was evaluated using otoliths. For each specimen, two counts of otolith annuli were
made under a dissecting microscope. Whenever the two readings of the same otolith
resulted in different age estimates the data were not considered for further analysis.
Estimates of theoretical growth in length were obtained by fitting length-at-age data
to the von Bertalanffy growth equation:
)1.( ).( 0ttkt eLL −−
∞ −=
where Lt is the total length at age t, L∞ is the asymptotic length, k is the growth
coefficient and t0 is the theoretical age at zero length. The growth parameters of this
model were estimated iteratively using the least squares method in STATISTICA
software. This analysis was performed separately for females and males.
Sexual Cycle
Gonads were observed macroscopically and a maturation stage was assigned to each
individual, according to a five-stage scale (Table 3.1). For each season the proportion
of fish in stages 2 to 5 was determined.
In order to evaluate gonadal development during the annual sexual cycle and to
determine the spawning season, the gonadosomatic index (GSI) was calculated per
sex for each season. The GSI was expressed as the percentage of the weight of
gonads in relation to eviscerated weight of fish.
Table 3.1. Sexual maturity stages of Solea lascaris (adapted from Andrade, 1990, and
Cabral, 1998).
Females Males
1. Immature Ovaries small and translucent Testes small and translucent
2. Early development Ovaries larger and opaque,
small white eggs can be seen
Testes larger and opaque;
whitish
3. Late development Ovaries yellow, both white and
translucent eggs can be seen
Testes swelling; light-brown
4. Spawning or partly spent Hyaline eggs run from vent on
slight pressure; or less swollen
and with red spots but hyaline
eggs are still numerous.
Testes fully swollen; sperm can
be extruded under light
pressure
5. Spent Ovaries flabby, red coloured Testes flabby, residual sperm
CHAPTER 3
65
RESULTS
Feeding Ecology
The diet spectrum of Solea lascaris was broad, consisting of a variety of Polychaeta,
Crustacea, Mollusca, Echinodermata and Cephalochordata (Table 3.2). Crustacea was
found to be the most important prey group according to all three indices (Cn=80.7%;
F=67.3%; Cw=73.8%). Amongst Crustacea, Mysidacea were the most important prey
in both numbers and weight (values of Cn=44.1% and Cw=64.8%), while on
occurrence alone Amphipoda was the most important group (F=17.2%). Polychaeta
also held a considerable importance in S. lascaris diet: when considering occurrence in
stomach contents (F=18.8%). Polychaeta were more important than any subgroup of
Crustacea and also scored a high value on the basis of weight (Cw=20.5%).
The first two axes of all three CA that were performed explained a high percentage of
the total observed variation in diet according to each of the three indices (85.9%,
90.6% and 88.7% for Cn, F and Cw data based analyses, respectively) (Figure 3.2).
Three groups can be identified based on the Cn ordination diagram: one group
encompasses the samples relative to autumn diet of the length class 1, that was
strongly associated with Polychaeta; winter and spring diets of the length class 1 and
winter of the length class 2 formed a second group associated to Amphipoda, Bivalvia
and Isopoda; the third group consisted of the spring diet of the length class 2, the
summer diet of length class 1 and 2, and the autumn diet of length class 2, which was
associated with Cumacea, Decapoda, Echinodermata and Mysidacea.
In the ordination diagram obtained for frequency of occurrence data it can be seen
one group relative to winter diet of the length class 1, autumn diet of the length class
1 and 2, and summer diet of the length class 1, associated with Amphipoda and
Polychaeta. The diet of individuals of length class 1 in spring and of length class 2 in
winter, spring and summer were associated with Crustacea, Decapoda and
Echinodermata.
When the Cw was considered in the ordination analysis, Polychaeta was strongly
related to spring and winter diets of the length class 1 and 2, respectively. Winter and
autumn diets of the length class 1 were associated with Crustacea, Amphipoda and
Isopoda; the summer diet of the length size 2 were associated with Cumacea and
Decapoda; Echinodermata, Bivalvia and Mysidacea were associated with spring and
autumn diets of the length class 2 and summer diet of length class 1.

Feeding Ecology, Growth and Sexual Cycle of the Sand Sole
66
Table 3.2. Numerical composition (Cn), frequency of occurrence (F) and biomass
composition (Cw) indices values of prey found in stomachs of Solea lascaris in
the Portuguese coast (n – number of stomachs in which prey occurs; p – number of
individuals of a specific prey; n.i. – not identified).
Prey Item n p Cn F Cw
Polychaeta 139 364 8.4 18.8 20.5 Aphroditidae 1 3 0.1 0.1 0.2 Cirratulidae 2 2 0.1 0.2 0.2 Glycera spp. 1 10 0.3 0.1 1.2 Nereis spp. 7 19 0.5 0.8 0.7 Ophelia bicornis 7 49 1.3 0.9 2.7 Phyllodocidae 3 4 0.1 0.3 0.2 Ephesiella abyssorum 1 1 0.0 0.1 0.0 Syllidae 1 1 0.0 0.1 0.0 Polychaeta n.i. 116 275 6.1 16.1 15.3 Crustacea 413 3099 80.7 67.3 73.8 Cumacea 98 340 9.2 11.8 0.4 Iphinoe trispinosa 3 4 0.3 0.6 0.0 Iphinoe sp. 3 3 0.3 0.7 0.0 Bodotria scorpioides 14 61 1.6 1.6 0.0 Bodotriidae n.i. 5 4 0.1 0.4 0.0 Pseudocuma (Pseudocuma) longicorne 5 8 0.2 0.6 0.0 Diastylis rugosa 20 153 4.0 2.3 0.1 Diastylidae n.i. 9 18 0.5 1.0 0.1 Cumacea n.i. 38 87 2.3 4.7 0.1 Apseudes latreillii 1 2 0.1 0.1 0.0 Mysidacea 85 1689 44.1 12.2 64.8 Isopoda 29 35 0.9 3.2 0.1 Gnathiidae 1 1 0.0 0.1 0.0 Conilera cylindracea 1 1 0.0 0.1 0.0 Eurydice pulchra 3 3 0.1 0.3 0.0 Eurydice sp. 2 2 0.1 0.2 0.0 Idotea balthica 3 4 0.1 0.3 0.0 Idotea sp. 3 3 0.1 0.3 0.0 Isopoda n.i. 16 21 0.5 1.8 0.1 Amphipoda 121 411 10.7 17.2 1.3 Gammaridea 121 406 10.6 16.8 1.2 Amphipoda n.i. 4 5 0.1 0.4 0.1 Decapoda 97 410 11.1 12.8 5.5 Crangon crangon 66 358 9.7 9.3 5.0 Paguridae 2 3 0.1 0.3 0.0 Portunidae 10 15 0.4 1.1 0.1 Decapoda n.i. 19 34 0.9 2.1 0.4 Crustacea n.i. 79 214 4.7 9.8 1.6 Mollusca 88 245 6.4 10.2 4.7 Antalis entalis 2 5 0.1 0.2 0.0 Gastropoda. 2 2 0.1 0.2 0.0 Bivalvia 84 238 6.2 9.7 4.6 Arca tetragona 1 3 0.1 0.1 0.1 Tapes rhomboides 1 4 0.1 0.1 0.1 Mactra sp. 3 6 0.2 0.3 0.1 Spisula solida 6 10 0.3 0.7 0.1 Tellina tenuis 5 31 0.8 0.7 0.5 Tellina fabula 21 63 1.6 2.5 1.7 Scrobicularia plana 6 9 0.2 0.7 0.6 Abra sp. 1 2 0.1 0.1 0.0 Solecurtinae 2 7 0.2 0.2 0.2 Solenidae 2 4 0.1 0.2 0.0 Bivalvia n.i. 36 99 2.6 4.1 1.3 Echinodermata 25 152 4.0 3.4 0.8 Asteroidea 1 1 0.0 0.1 0.0 Ophiuroidea 16 99 2.6 2.1 0.6 Echinocyamus pusillus 6 50 1.3 0.9 0.2 Echinodermata n.i. 2 2 0.1 0.2 0.0 Cephalochordata 2 17 0.4 0.2 0.2 Branchiostoma lanceolatum 2 17 0.4 0.2 0.2

CHAPTER 3
67
(a) (b)
(c)
Figure 3.2. Ordination diagrams of the correspondence analyses performed to numerical
composition (a), frequency of occurrence (b) and biomass composition (c) of
prey found in stomachs of Solea lascaris (1 – length class 1; 2 – length class
2; W – Winter; Sp – Spring; S – Summer; A – Autumn).
-0.3 0.4
-0.4
1.0
W 1 W 2
Sp 1
Sp 2
S 1 S 2
A 1
A 2
AmphipodaBivalvia
Crustacea
CumaceaDecapoda
Echinodermata
Isopoda
MysidaceaPolychaeta
Others
-0.6 0.8
-0.4
1.0
W1
W 2Sp 1
Sp 2
S 1
S 2
A 1 A 2
Amphipoda
Bivalvia
Crustacea
Cumacea
DecapodaEchinodermata
Isopoda
Mysidacea
Polychaeta
Others
-0.6 0.6
-0.4
1.0
W 1
W 2
Sp 1Sp 2
S 1
S 2
A 1
A 2
Amphipoda
Bivalvia
Crustacea
Cumacea
Decapoda
Echinodermata
Isopoda
Mysidacea
Polychaeta
Others

Feeding Ecology, Growth and Sexual Cycle of the Sand Sole
68
Overall, Amphipoda and Echinodermata were the most important element of the
winter and summer diets, respectively, according to all three indices. Considering Cn
and F, Decapoda were particularly important in spring. The Amphipoda were the major
item of the autumn diet according to F and Cw. Winter and autumn diets were very
similar according to F and Cw, and spring and summer diets were very similar
according to F. Amphipoda were the most important prey item of the length size 1,
according to all three indices. The length class 2 fed mainly on Decapoda and
Echinodermata, according to all three indices.
Age and Growth
A total of 296 females and 113 males were analysed for age determination. The total
length of fish analysed varied from 61 mm to 340 mm, for females, and from 61 mm
to 310 mm, for males. The oldest fish was 6 years.
The von Bertalanffy growth equation parameters differed between sexes (Figure 3.3).
The asymptotic length (L∞) obtained for females was higher compared to the one
obtained for males (342.3 mm and 264.5 mm, respectively), while the growth
coefficient (k) estimated for females (k= 0.50) was lower than that determined for
males (k=0.82). The t0 estimates were -0.87 and 0.13 for females and males,
respectively.
0 1 2 3 4 5 6 7
Age (years)
0
50
100
150
200
250
300
350
400
Tota
l le
ngth
(m
m)
Figure 3.3. von Bertalanffy growth curves fitted to length-at-age data of Solea lascaris
(females – black circles and solid lines; males – empty circles and dashed
lines).

CHAPTER 3
69
Sexual Cycle
Percentage of individuals according to maturity stages was in agreement with GSI
seasonal changes (Figures 3.4 and 3.5).
Figure 3.4. Gonadossomatic index mean values season, determined for each sex (standard
deviation is represented).
The highest values of the GSI were obtained in winter and spring, the seasons when
the highest percentage of individuals in spawning were recorded. The lowest GSI
values (2.8% of eviscerated weigth for females, 0.2% of eviscerated weigth for males)
were recorded in autumn, but a large proportion of partly spent females and spawning
males indicated spawning was still taking place.
(a) (b)
Figure 3.5. Percentage of individuals in each maturation stage according season, for
females (a) and males (b) (maturation stages as in Table 3.1).
0
2
4
6
8
10
Autumn Winter Spring Summer0.0
0.2
0.4
0.6
0.8
1.0
females males
0%
20%
40%
60%
80%
100%
Autumn Winter Spring Summer
Stage 2 Stage 3 Stage 4 Stage 5
0%
20%
40%
60%
80%
100%
Autumn Winter Spring Summer
Stage 2 Stage 3 Stage 4 Stage 5

Feeding Ecology, Growth and Sexual Cycle of the Sand Sole
70
Discussion
The diet composition determined for Solea lascaris along the Portuguese coast was
similar to that described by Rodriguez (1996) for the west coast of Brittany. In both
studies, it was found that S. lascaris feeds on a wide range of prey belonging to
several taxa, the most important groups being Mysidacea, Polychaeta and Amphipoda.
S. lascaris diet reported by Cabral et al. (2002) and Marinaro and Bouabid (1983) is
somewhat different: the prey range is much smaller and Polychaeta are not an
important prey. However, Cabral et al. (2002) studied the diet of juveniles and
Marinaro and Bouabid (1983) had a small sample size (24 full stomachs), which could
bias the estimation of prey importance.
The diet of S. lascaris is similar to that of S. solea and S. senegalensis differing mostly
on Mollusca importance (e.g. Molinero and Flos, 1991; Garcia-Franquesa et al., 1996;
Cabral, 2000b; Darnaude et al., 2001) that seem to be a preferential prey for the
former species but not for S. lascaris. Overall, S. lascaris can be considered an
opportunistic and generalist feeder, status that has been recognized for several
species of Soleidae (e.g. Cabral, 2000b; Darnaude et al., 2001).
The differences found in the diet of S. lascaris in what regards to season and length
size were in agreement with Rodriguez (1996). These seasonal variations were
consequence of changes in space- and time-variation of benthic fauna composition,
shifts due to life-history patterns of prey and feeding activity of predator (Wootton,
1998). The diet variation according to fish length is consistent with the optimum
foraging theory (Gerking, 1994), which states that larger predators tend to consume
larger prey in order to maximize the energetic gain relative to capture effort.
The growth pattern found for S. lascaris in this study is quite different from what was
previously described (e.g. Deniel, 1981; Dinis, 1986; Andrade, 1990). The observed
longevities of 6 years for females and 5 years for males are lower than those found by
Dinis (1986) (11 years, both for females and males), but similar to that reported by
Andrade (1990) (7 and 6 years, respectively for females and males).
The observed pattern in the sexual cycle along the year is in accordance with
expectations, and is similar to those reported by Dinis (1986), Andrade (1990) and
Gomes (2002) for the Portuguese coast: S. lascaris has a winter-summer spawning
season and a latitudinal gradient that can be noticed. For the Douarnenez Bay
(France), Deniel (1981) found a spawning season from May to September. Deniel
(1981) reported a similar gradient for the S. solea spawning season.

CHAPTER 3
71
The observed duration of the spawning period was longer than has been reported (7/8
months in this study against 5 months, Deniel, 1981; Dinis, 1986; Andrade, 1990;
Gomes, 2002). These authors have noted that there is an asynchrony in the spawning
of older and younger females, the second group spawns later, which could explain this
long duration. This trend was not completely evident in this study (data not shown),
and the long duration of the spawning season is due perhaps to serial spawning
temporally spaced and/or to year fluctuations (e.g. Koutsikopoulos et al., 1995).
Other Soleidae species have a winter-summer spawning season, namely S.
senegalensis and Dicologlossa cuneata (Moreau, 1881) (Dinis, 1986): as S. lascaris
these are sub-tropical species that attain maturity during the increasing day-light
period.
Many aspects of S. lascaris biology remain to be studied, namely those regarding
larvae and juvenile stages. These have been generally considered as very important
life cycle phases, critical for individual survival, and so their knowledge is of extreme
importance, both for fisheries and aquaculture purposes.
Aknowledgements
This study was partially financed by the Fundação para a Ciência e a Tecnologia (FCT),
through the grant attributed to C.M. Teixeira (Grant SFRH/BD/19319/2004). This
study was also co-funded by the European Union through the FEDER–Fisheries
Programme (MARE).
References
Andrade, J.P.A.S., 1990. A importância da Ria Formosa no ciclo biológico de Solea
senegalensis Kaup 1858, Solea vulgaris Quensel 1806, Solea lascaris (Risso, 1810) e
Microchirus azevia (Capello, 1868). PhD Thesis, Universidade do Algarve, Portugal.
Cabral, H.M.R.N., 1998. Utilização do estuário do Tejo como área de viveiro pelos
linguados, Solea solea (L., 1758) e Solea senegalensis Kaup, 1858, e robalo,
Dicentrarchus labrax (L., 1758). PhD Thesis, Universidade de Lisboa, Portugal.
Cabral, H.N., 2000a. Distribution and abundance patterns of flatfishes in the Sado estuary,
Portugal. Estuaries 53, 351–358.

Feeding Ecology, Growth and Sexual Cycle of the Sand Sole
72
Cabral, H.N., 2000b. Comparative feeding ecology of two sympatric soles, Solea solea and
Solea senegalensis, within the nursery areas of the Tagus estuary. Journal of Fish
Biology 57, 1550–1562.
Cabral, H.N., Costa, M.J., 1999. Differential use of nursery areas within the Tagus estuary
by sympatric soles, Solea solea and Solea senegalensis. Environmental Biology of Fish
56, 389–397.
Cabral, H.N., Lopes, M., Loeper, R., 2002. Trophic niche overlap between flatfishes in a
nursery area in the Portuguese coast. Scientia Marina 66, 293–300.
Darnaude, A.M., Harmelin-Vivien, M.L., Salen-Picard, C., 2001. Food partioning among
flatfish (Pisces: Pleuronectiformes) juveniles in a Mediterranean coastal shallow sandy
area. Journal of the Marine Biological Association of the United Kingdom 81, 119–127.
Deniel, C., 1981. Les poisons plats en baie de Douarnenez. Reproduction, croissance et
migration des Bothidae, Scophthalmidae, Pleuronectidae et Soleidae. PhD Thesis,
Université de Bretagne Occidentale, France.
Deniel, C., Le Blanc, C., Rodriguez, A., 1989. Comparative study of sexual cycles,
oogenesis and spawning of two Soleidae, Solea lascaris (Risso, 1810) and Solea impar
(Bennet, 1831), on the western coast of Brittany. Journal of Fish Biology 35, 49–58.
Dinis, M.T., 1986. Quatre Soleidae de l’estuaire du Tage. Reproduction et croissance. Essai
d’élevage de Solea senegalensis Kaup. PhD Thesis, Université de Bretagne Occidentale,
France.
Garcia-Franquesa, E., Molinero, A, Valero, V., Flos, R., 1996. Influence of sex, age and
season on the feeding habits of the flatfish Solea senegalensis. Environmental Biology
of Fish 47, 289–298.
Gerking, S.D., 1994. Feeding Ecology of Fish. Academic Press, San Diego.
Gomes, T.M.M.F., 2002 Reprodução e fecundidade de Solea lascaris (Risso, 1810) em
águas costeiras do Norte de Portugal. MSc Thesis, Universidade do Porto, Portugal.
Hyslop, E.J., 1980. Stomach contents analysis: a review of methods and their application.
Journal of Fish Biology 17, 415–429.
Koutsikopoulos, C., Dorel, D., Desaunay, Y., 1995. Movement of sole (Solea solea) in the
Bay of Biscay: coastal environment and spawning. Journal of the Marine Biological
Association of the United Kingdom 75, 109–126.
Marinaro, J.Y., Bouabid, M., 1983. Ecologie alimentaire de deux soles d’Algérie, Pegusa
nasuta (Pallas) et P. lascaris (Risso) (Téléostéens soléidés). Rapport Commission
Internationale Mer Méditerranée 28, 73–75.
Molinero, A., Flos, R., 1991. Influence of sex and age on the feeding habits of the common
sole Solea solea. Marine Biology 111, 493–501.
Nielsen, J.G., 1986a. Citharidae. In: Whithead, P.J.P., Bauchot, M.L., Hureau, J.C., Nielsen,
J., Tortonese, E. (eds.). Fishes of the North-eastern Atlantic and the Mediterranean.
UNESCO, Vol III, pp. 1286.

CHAPTER 3
73
Nielsen, J.G., 1986b. Scophthalmidae. In: Whithead, P.J.P., Bauchot, M.L., Hureau, J.C.,
Nielsen, J., Tortonese, E. (eds.). Fishes of the North-eastern Atlantic and the
Mediterranean. UNESCO, Vol III, pp. 1287–1293.
Nielsen, J.G., 1986c. Bothidae. In: Whithead, P.J.P., Bauchot, M.L., Hureau, J.C., Nielsen,
J., Tortonese, E. (eds.). Fishes of the North-eastern Atlantic and the Mediterranean.
UNESCO, Vol III, pp. 1294–1298.
Nielsen, J.G., 1986d. Pleuronectidae. In: Whithead, P.J.P., Bauchot, M.L., Hureau, J.C.,
Nielsen, J., Tortonese, E. (eds.). Fishes of the North-eastern Atlantic and the
Mediterranean. UNESCO, Vol III, pp. 1299–1307.
Quéro, J.C., Desoutter, M., Lagardère, F., 1986a. Soleidae. In: Whithead, P.J.P., Bauchot,
M.L., Hureau, J.C., Nielsen, J., Tortonese. E. (eds.). Fishes of the North-eastern
Atlantic and the Mediterranean. UNESCO, Vol III, pp. 1308–1324.
Quéro, J.C., Desoutter, M., Lagardère, F., 1986b. Cynoglossidae. In: Whithead, P.J.P.,
Bauchot, M.L., Hureau, J.C., Nielsen, J., Tortonese, E. (eds.). Fishes of the North-
eastern Atlantic and the Mediterranean. UNESCO, Vol III, pp. 1325–1328.
Rodriguez, A., 1996. Regime alimentaire de deux soleidae, Solea lascaris et Solea impar de
la côte ouest de Bretagne. Cybium 20, 261–277.
ter Braak, C.J.F., Šmilauer, P., 1998. CANOCO reference manual and user’s guide to
Canoco for Windows: software for Canonical Community Ordination (version 4).
Microcomputer Power, Ithaca, NY, USA.
Wootton, R.J., 1998. Feeding. In: Wootton, R.J. (eds). Ecology of Teleost Fishes. Kluwer
Academic Publishers, pp. 27–62.


CHAPTER 4
Diet, growth and reproduction of spotted flounder, four-spotted megrim, flounder and
bastard sole in the Portuguese coast
Scientia Marina (in revision)
By Teixeira, C.M., Batista, M.I., Cabral, H.N.


CHAPTER 4
77
Diet, growth and reproduction of spotted
flounder, four-spotted megrim, flounder and
bastard sole in the Portuguese coast
ABSTRACT: Four flatfish species were collected between January 2003 and June 2005 from commercial
fishing vessels operating with gill nets and bottom trawls along the Portuguese coast, to examine feeding
habits, age and growth and reproduction. Citharus linguatula (Linnaeus, 1758), Lepidorhombus boscii
(Risso, 1810) fed mainly fishes and crustaceans and Microchirus azevia (de Brito Capello, 1867), fed chiefly
on polychaets and crustaceans. The diet of Platichthys flesus (Linnaeus, 1758) was mainly composed by
echinoderms and crustaceans. Feeding activity was highest in spring-summer; females and small individuals
presented lowest vacuity index values. For all the species, significant differences were found in the
proportion of prey items according to season, sex and size class. Ages were determined from sagittae
otoliths. The von Bertalanffy growth equation coefficients differed between sexes. The asymptotic length L∞
of females was higher compared to males, except for C. linguatula. The lowest growth coefficient was
obtained for P. flesus (k=0.11 for males and k=0.10 for females) and M. azevia presented the highest
growth coefficient estimates (k=0.40 for females and k=0.30 for males). The highest proportion of
individuals at spawning stage was recorded in autumn-winter for L. boscii and P. flesus. For C. linguatula
and M. azevia mature individuals were observed throughout the year.
KEYWORDS:
flatfish, diet, growth, otoliths, reproduction, Portuguese coast
INTRODUCTION
A large number of flatfish species occur in the Portuguese coast (e.g. Nielsen,
1986a,b,c,d; Quéro et al., 1986a,b; Cabral, 2000a), this species richness is usually
higher than that found in North Europe and similar to that found in the Mediterranean,
since many flatfish species are at their southern and northern distribution limits,
respectively, along the Portuguese coast (e.g. Quéro et al., 1986a; Desoutter, 1997).
The majority of flatfish occurring in the Portuguese coast present a high commercial
value and are caught by fisheries, as target or bycatch species. Flatfish catches
represent 4% of all the fish biomass landed in the Portuguese coast. However, the
importance of flatfish fisheries is considerably higher due to the high commercial value

Diet, Growth and Reproduction of Four Flatfishes
78
of flatfish species, accounting for near 11% of the economical value of fish landings.
According to official data, flatfishes landings increased from 1998 to 2005 (source:
DGPA).
Knowledge on the ecology of some flatfish species is extremely scarce, especially for
those that are considered fisheries bycatches. Spotted flounder Citharus linguatula
(Linnaeus, 1758), four-spotted megrim Lepidorhombus boscii (Risso, 1810), flounder
Platichthys flesus (Linnaeus, 1758) and bastard sole Microchirus azevia (de Brito
Capello, 1867) are very different flatfish species with distinct distribution areas.
Spotted flounder is distributed in the East Atlantic and Mediterranean, inhabiting soft
bottoms from the coastline to a depth of about 200 m (Nielsen, 1986a). Four-spotted
megrim occurs in the Northeast Atlantic from the British Isles south to Cape Bojador,
and it is also found in the Mediterranean. It is common on soft bottoms on depths
down to 700-800 m (Nielsen, 1986b). Flounder is common around the coasts of
northern Europe and the Mediterranean. This species occurs on soft bottoms from
shallow water down to 50 m, it can tolerate brackish or freshwater (Nielsen, 1986d).
Bastard sole occurs from the southern range of the Iberian Peninsula to the western
part of the Mediterranean Sea and off the African coast, southward to Senegal. It is
common on mud and sand of the continental shelf, from the shore down to 250 m
(Quéro et al., 1986a).
Diet of C. lingutula, as well as age and growth, and reproduction has been studied in
the Mediterranean and in the Atlantic coast of Morocco (e.g. Belghyti et al., 1993;
Redon et al., 1994; Vassilopoulou and Papaconstantinou, 1994; García-Rodríguez and
Esteban, 2000). Studies on four-spotted megrim diet, age and growth, and
reproduction were conducted in the western Europe and Mediterranean (e.g. Santos,
1994; Vassilopoulou and Ondrias, 1999; Landa et al., 2002; Vassilopoulou, 2006).
Several authors studied the diet, age and growth, and reproduction of P. flesus on the
north-western Europe, and in the Black Sea (e.g. Summers, 1979; Beaumont and
Mann, 1984; Andersen et al., 2005; Çiloğlu, 2005). Age and growth of M. azevia, well
as reproduction, has been studied in the south coast of Portugal, in the Mediterranean
and in the south of Morocco (e.g. Belaid and Marinaro, 1983; Marfin and Hajji, 1988;
Andrade, 1998; Afonso-Dias et al., 2005).
Studies conducted in the Portuguese coast, showed that P. flesus fed mainly
crustaceans, polychaets and molluscs (Vinagre et al., 2005). Santos (1994)
determined for a L. boscii a maximum total length of 398 mm. Longevity of M. azevia
was 8 years and a maximum total length of 327 mm (Andrade, 1998). L. boscii and M.
azevia spawns from winter to spring (Santos, 1994; Afonso-Dias et al., 2005).

CHAPTER 4
79
Despite these studies, knowledge on these species is scarce and integrative and
comparative studies are missing. Being a transition between temperate and
subtropical waters of the Northeastern Atlantic coasts (Ekman, 1953; Briggs, 1974),
studies conducted in the Portuguese coast may provide important information in order
to outline those trends. Therefore, the aim of the present work was to study the diet,
age and growth and reproduction of spotted flounder, four-spotted megrim, flounder
and bastard sole off the Portuguese coast.
MATERIALS AND METHODS
Sampling Surveys and Samples Processing
Samples were collected bimonthly between January 2003 and June 2005 from
commercial fishing vessels operating with gill nets and bottom trawls along the
Portuguese coast (Figure 4.1). Samples were collected regularly throughout the year
and along the coast (a minimum of 40 individuals were obtained per season and
sampling area).
Fish were identified, measured (total length to nearest 1 mm) and weighed (total and
eviscerated wet weight with 0.01 g precision). Stomachs and gonads were removed
and frozen (-20ºC) for further analysis. Saggitae otoliths were removed, cleaned and
kept dry for later age determination.

Diet, Growth and Reproduction of Four Flatfishes
80
Figure 4.1. Location of sampling area.
Diet
The stomach contents of 344 individuals of C. linguatula (149–293 mm), 317
individuals of L. boscii (149–346 mm), 325 individuals of P. flesus (150–430 mm) and
314 individuals of M. azevia (149–313 mm) were analysed. Each prey item was
identified to the lowest taxonomic level possible, counted and weighed (wet weight to
0.001 g). The relative importance of each prey item in the diet was expressed as a
percent of numerical abundance (NI – numerical index), occurrence of food items in
stomachs (OI – occurrence index) and weight (GI – gravimetrical index) (Hyslop,
1980). Feeding activity was evaluated by the vacuity index (VI) defined as the percent
of empty stomachs (Hyslop, 1980).
Correspondence analyses (CA) were run to evaluate diet variation with season, sex
and fish length according to each of the three index values. Prey items were grouped
in a broader taxonomic level and two seasons (autumn-winter and spring-summer),
and two size classes (size class 1: <250 mm and size class 2: ≥250 mm total length)
Lisbon
ATLA
NTIC
OCEAN
41ºN
39ºN
37ºN 200 m
PORTU
GAL
200 m
10ºW 8ºW

CHAPTER 4
81
were created. These analyses were performed using CANOCO version 4.5 (ter Braak
and Šmilauer, 2002).
Diet differences between seasons, sexes and fish size were evaluated using χ2 tests
(Zar, 1984), and with a 0.05 significance level.
Prey diversity was determine for each season, sex and size class using the Shannon–
Wiener diversity index H’ (Shannon and Weaver, 1949), expressed as
Pln P- H' is
1ii∑
==
where Pi is the numerical proportion of the ith prey category in the diet and S is the
total number of different prey categories consumed by the predator. This index
corresponds to the dietary breadth (Marshall and Elliott, 1997).
Age and Growth
Age was evaluated based on otolith readings. For each specimen, two counts of otolith
annuli were made under a dissecting microscope. Whenever the two readings of the
same otolith resulted in different age estimates, the data were not considered for
further analysis. A total of 321 (216 females and 105 males) individuals of spotted
flounder, 302 (199 females and 103 males) individuals of four-spotted megrim, 314
(209 females and 105 males) individuals of flounder and 292 (147 females and 145
males) individuals of bastard sole were used for age determination.
Estimates of theoretical growth in length were obtained by fitting length-at-age data
to the von Bertalanffy growth equation:
)1.( ).( 0ttkt eLL −−
∞ −= ,
where Lt is the total length, L∞ is the asymptotic length, k is the growth coefficient and
t0 is the theoretical age at zero length. The growth parameters of this model were
estimated iteratively using the least squares method in STATISTICA software. This
analysis was performed separately for males and females.
Reproduction
Gonads were observed macroscopically and a maturation stage was assigned to each
individual, according to the scale: I – immature, II – development, III – spawning, IV

Diet, Growth and Reproduction of Four Flatfishes
82
– post-spawning (Cabral, 1998). For each season (autumn-winter, spring-summer),
the percentage of fish in stages I, II, III and IV was determined.
The gonadosomatic index (GSI) was also determined for each sex and season. The
GSI was expressed as the percentage of the weight of gonads in relation to
eviscerated weight of fish. Age and length at first maturity were determined.
RESULTS
Diet
The diet of C. linguatula were mainly composed by mysids and fishes, the most
important prey items for L. boscii were decapods and fishes, and M. azevia fed mainly
polychaets and decapods. For P. flesus, the most important prey items were
echinoderms (particularly Holothuroida), bivalves and crustaceans (amphipods and
decapods) (Table 4.1).
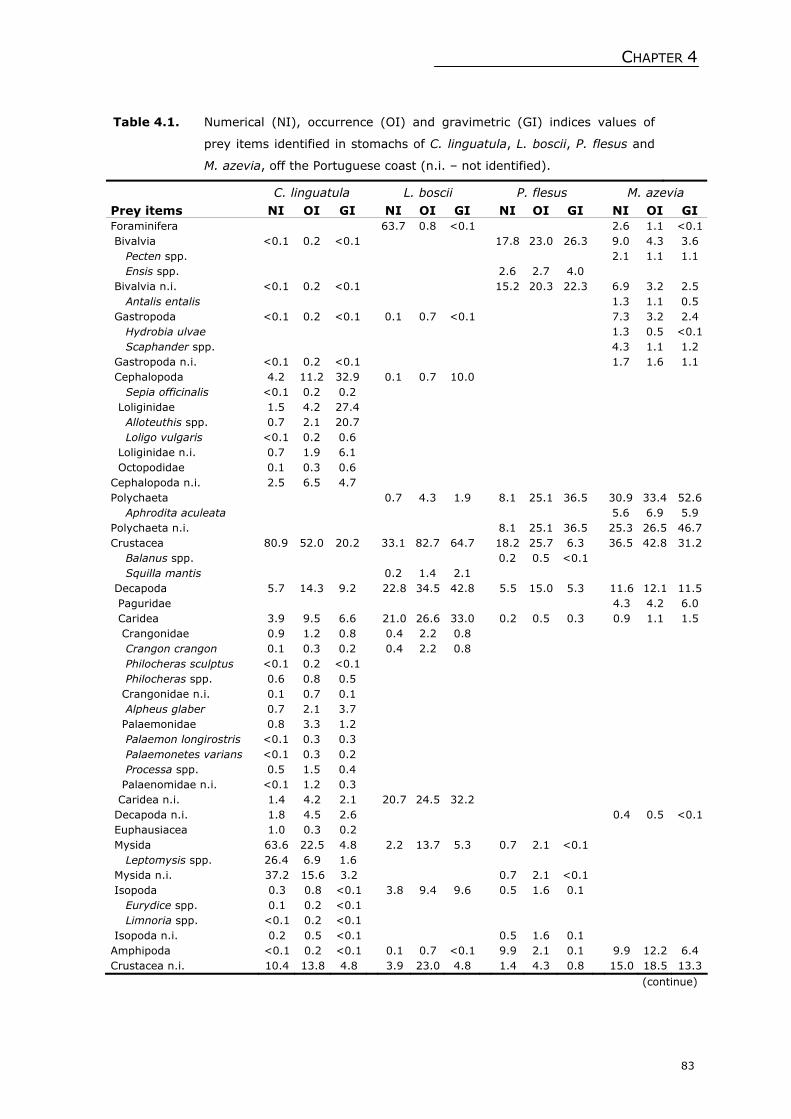
CHAPTER 4
83
Table 4.1. Numerical (NI), occurrence (OI) and gravimetric (GI) indices values of
prey items identified in stomachs of C. linguatula, L. boscii, P. flesus and
M. azevia, off the Portuguese coast (n.i. – not identified).
C. linguatula L. boscii P. flesus M. azevia Prey items NI OI GI NI OI GI NI OI GI NI OI GI Foraminifera 63.7 0.8 <0.1 2.6 1.1 <0.1 Bivalvia <0.1 0.2 <0.1 17.8 23.0 26.3 9.0 4.3 3.6 Pecten spp. 2.1 1.1 1.1 Ensis spp. 2.6 2.7 4.0 Bivalvia n.i. <0.1 0.2 <0.1 15.2 20.3 22.3 6.9 3.2 2.5 Antalis entalis 1.3 1.1 0.5 Gastropoda <0.1 0.2 <0.1 0.1 0.7 <0.1 7.3 3.2 2.4 Hydrobia ulvae 1.3 0.5 <0.1 Scaphander spp. 4.3 1.1 1.2 Gastropoda n.i. <0.1 0.2 <0.1 1.7 1.6 1.1 Cephalopoda 4.2 11.2 32.9 0.1 0.7 10.0 Sepia officinalis <0.1 0.2 0.2 Loliginidae 1.5 4.2 27.4 Alloteuthis spp. 0.7 2.1 20.7 Loligo vulgaris <0.1 0.2 0.6 Loliginidae n.i. 0.7 1.9 6.1 Octopodidae 0.1 0.3 0.6 Cephalopoda n.i. 2.5 6.5 4.7 Polychaeta 0.7 4.3 1.9 8.1 25.1 36.5 30.9 33.4 52.6 Aphrodita aculeata 5.6 6.9 5.9 Polychaeta n.i. 8.1 25.1 36.5 25.3 26.5 46.7Crustacea 80.9 52.0 20.2 33.1 82.7 64.7 18.2 25.7 6.3 36.5 42.8 31.2 Balanus spp. 0.2 0.5 <0.1 Squilla mantis 0.2 1.4 2.1 Decapoda 5.7 14.3 9.2 22.8 34.5 42.8 5.5 15.0 5.3 11.6 12.1 11.5 Paguridae 4.3 4.2 6.0 Caridea 3.9 9.5 6.6 21.0 26.6 33.0 0.2 0.5 0.3 0.9 1.1 1.5 Crangonidae 0.9 1.2 0.8 0.4 2.2 0.8 Crangon crangon 0.1 0.3 0.2 0.4 2.2 0.8 Philocheras sculptus <0.1 0.2 <0.1 Philocheras spp. 0.6 0.8 0.5 Crangonidae n.i. 0.1 0.7 0.1 Alpheus glaber 0.7 2.1 3.7 Palaemonidae 0.8 3.3 1.2 Palaemon longirostris <0.1 0.3 0.3 Palaemonetes varians <0.1 0.3 0.2 Processa spp. 0.5 1.5 0.4 Palaenomidae n.i. <0.1 1.2 0.3 Caridea n.i. 1.4 4.2 2.1 20.7 24.5 32.2 Decapoda n.i. 1.8 4.5 2.6 0.4 0.5 <0.1 Euphausiacea 1.0 0.3 0.2 Mysida 63.6 22.5 4.8 2.2 13.7 5.3 0.7 2.1 <0.1 Leptomysis spp. 26.4 6.9 1.6 Mysida n.i. 37.2 15.6 3.2 0.7 2.1 <0.1 Isopoda 0.3 0.8 <0.1 3.8 9.4 9.6 0.5 1.6 0.1 Eurydice spp. 0.1 0.2 <0.1 Limnoria spp. <0.1 0.2 <0.1 Isopoda n.i. 0.2 0.5 <0.1 0.5 1.6 0.1 Amphipoda <0.1 0.2 <0.1 0.1 0.7 <0.1 9.9 2.1 0.1 9.9 12.2 6.4 Crustacea n.i. 10.4 13.8 4.8 3.9 23.0 4.8 1.4 4.3 0.8 15.0 18.5 13.3
(continue)

Diet, Growth and Reproduction of Four Flatfishes
84
Table 4.1. (Continued)
C. linguatula L. boscii P. flesus M. azevia
Prey items NI OI GI NI OI GI NI OI GI NI OI GI Echinodermata <0.1 0.2 <0.1 0.2 1.4 <0.1 51.9 15.0 20.7 9.4 10.6 2.2 Crinoidea 0.3 1.1 <0.1 Ophiuroidea 0.1 0.7 <0.1 3.0 3.7 1.0 Holothuroidea 51.4 13.4 20.7 Echinoidea <0.1 0.2 <0.1 Echinodermata n.i. 0.1 0.7 <0.1 0.2 0.5 <0.1 6.4 6.9 1.2 Actinopterygii 12.5 29.8 44.5 2.1 9.4 23.3 1.0 2.1 3.7 Pleuronectiformes 0.3 0.5 2.9 Arnoglossus spp. <0.1 0.2 0.6 Pleuronectiformes n.i. 0.3 0.3 2.3 Ammoditidae 0.3 0.5 2.4 Callionymus reticulatus <0.1 0.2 1.8 Callionymus spp. <0.1 0.2 0.1 Trachinidae <0.1 0.2 0.2 Gobiidae 0.2 0.4 1.8 Gobius niger 0.1 0.2 1.0 Pomatoschistus microps <0.1 0.1 0.1 Gobiidae n.i. <0.1 0.1 0.7 Trachurus trachurus 0.1 0.2 5.5 Lepidotrigla cavillone <0.1 0.2 0.5 Merluccius merluccius <0.1 0.2 0.3 Actinopterygii n.i. 11.6 27.7 31.4 0.7 1.6 1.3 Unidentified 2.1 6.4 2.1 2.9 9.1 6.5 3.0 3.7 7.8
Vacuity index was higher for spotted flounder (34%) than for bastard sole (29%),
flounder (26%) and four-spotted megrim (20%). The lowest values of vacuity
occurred in spring-summer, particularly for females and for smallest fishes (Table
4.2).
Table 4.2. Vacuity index (VI) for each season (aw – autumn/winter; sps –
spring/summer), sex (F – females; M – males) and size class (I – size class
I; II – size class II), for the C. linguatula, L. boscii, P. flesus and M. azevia.
Vacuity Index
Season Sexes Size class aw sps F M I II C. linguatula 40.78 27.72 31.01 38.46 33.87 35.38 34.01
L. boscii 33.33 15.46 14.29 28.00 17.65 23.81 19.69
P. flesus 37.93 22.76 19.77 33.33 20.00 27.35 25.66
M. azevia 30.77 28.43 27.63 30.77 25.77 36.36 29.08
The correspondence analysis (CA) performed, based on the three indices considered
averaged per season, sex and size class, explained ca. 40% the variance in the first
two axes (42.0%, 48.6% and 43.2%, respectively for NI, OI and GI). In all three
ordination diagrams (NI, OI and GI) for the four species were well discriminated.
CHAPTER 4
85
In the ordination diagram obtained for numerical data (Figure 4.2a) it can be seen
that: Cephalopods were associated with the largest individuals of C. linguatula in
autumn-winter, and with the largest males in spring-summer. Largest females diet, in
spring-summer was composed by fishes. Smallest individuals were associated with
mysids. Diet of L. boscii was composed largely with decapods and fishes. In autumn-
winter the largest females were associated with isopods and the smallest individuals
with fishes. P. flesus, in the spring-summer, was chiefly related with echinoderms.
Amphipods were associated, in spring-summer, with the largest males. Largest
females’ diet, in autumn-winter, was associated with decapods. M. azevia diet was
composed mainly by polychaets. In autumn-winter, small females and large males
were associated with bivalves and gastropods. Pagurids were associated with small
males in spring-summer.
When the OI was considered in the ordination analysis (Figure 4.2b), small individuals
of C. linguatula was strongly associated with mysids. Cephalopods were mainly
associated with largest individuals, and fishes were related with largest males. L.
boscii was chiefly associated with decapods and isopods. Smallest individuals, in
autumn-winter, were related with fishes. P. flesus diet was mostly related with
echinoderms, bivalves and gastropods. The diet of M. azevia was mainly composed by
polychaets and amphipods.
Considereding the gravimetrical data in the ordination diagram (Figure 4.2c) it can be
seen that: C. linguatula was chiefly associated with fishes and cephalopods. The diet
of L. boscii was mostly related with decapods. In autumn-winter, diet of smallest
males was composed by fishes, and largest females were associated with isopods.
Mysids were related with smallest females. P. flesus diet was largely composed by
echinoderms in spring-summer. Largest females, in autumn-winter, were associated
with decapods. M. azevia was heavily associated with polychaets. Smallest females’
diet was composed by amphipods. Males diet, in autumn-winter was associated with
pagurids and gatropods for smallest and with decapods for the largest ones.

Diet, Growth and Reproduction of Four Flatfishes
86
(a) (b)
(c)
Figure 4.2. Ordination diagrams of the correspondence analyses performed to numerical
(a), occurrence (b) and gravimetric (c) indices values of prey found in guts of C.
linguatula, L. boscii, P. flesus and M. azevia (CL – C. linguatula; LB – L. boscii;
PF – P. flesus; MA – M. azevia; f – females; m – males; aw – autumn/winter;
sps – spring/summer; I – size class I; II – size class II).
-0.6 0.6
-0.6
1.0
Amphipoda
Bivalvia
Cephalopoda
Crustacea
Decapoda
EchinodermataGastropoda
Isopoda
Mysida
Others
Paguridae
Polychaeta
Teleostei
LBfawI
LBfawII
LBmawI
LBmawII
LBfspsILBfspsII
LBmspsI
LBmspsII
PFfawII
PFmawII
PFfspsI
PFfspsII
PFmspsI
PFmspsII
MAfawI
MAfawII
MAmawI
MAmawII
MAfspsI
MAfspsII
MAmspsI
MAmspsII
CLfawI
CLfawII
CLmawI
CLmawII
CLfspsI
CLfspsII
CLmspsI
CLmspsII
-0.6 0.6
-0.6
1.0
Amphipoda
Biv
alv
ia
Cephalopoda
Crustacea
Decapoda
Echinodermata
Gastr
op
od
a
Isopoda
Mysida
Others
Paguridae
Polychaeta
Teleostei
LBfawI
LBfawII
LBmawI
LBmawII
LBfspsI
LBfspsIILBmspsI
LBmspsII
PFfawIIPFmawII
PFfspsI
PFf
spsI
I
PFmspsI
PFmspsII
MAfa
wI
MAfawII
MAmawI
MAm
aw
II
MAfspsI
MAfspsIIMAmspsI
MAmspsII
CLfawI
CLfawIICLmawI
CLmawII
CLfspsI
CLfspsII
CLmspsI
CLmspsII
-0.8 0.8
-1.0
1.0
Amphipoda
Bivalvia
Cephalopoda
Crustacea
Decapoda
Echinodermata
Gastropoda
Isopoda
Mysida
Others
Paguridae
Polychaeta
Teleostei
LBfawI
LBfawII
LBmawI
LBmawII
LBfspsI
LBfspsII
LBmspsILBmspsII
PFfawII
PFmawII
PFfspsI
PFf
spsI
I
PFmspsIPFmspsII
MAfawI
MAfawII
MAmawI
MAm
aw
II
MAfspsI
MAfspsII
MAmspsI
MAmspsII
CLfawI
CLfawII
CLmawI
CLmawII
CLfspsICLfspsII
CLmspsI
CLmspsII

CHAPTER 4
87
C. linguatula, L. boscii, P. flesus and M. azevia showed significant differences in their
diets between seasons (χ2=30.9, d.f.=11, P<0.05; χ2=268.7, d.f.=11, P<0.05;
χ2=187.7, d.f.=11, P<0.05 and χ2=60.0, d.f.=11, P<0.05, respectively).
Significant differences in the diet were observed between sexes in C. linguatula, L.
boscii and P. flesus (χ2=31.7, d.f.=11, P<0.05; χ2=461.6, d.f.=11, P<0.05 and
χ2=115.9, d.f.=11, P<0.05, respectively).
The diet of individuals of the two size classes also differed significantly in spotted
flounder, four-spotted megrim and flounder (χ2=294.5, d.f.=11, P<0.05; χ2=558.4,
d.f.=11, P<0.05 and χ2=133.7, d.f.=11, P<0.05, respectively).
The dietary diversification was higher for C. linguatula and P. flesus in spring-summer
period (H’=1.90 and H’=1.58, respectively), and for L. boscii and M. azevia the higest
values were obtained in autumn-winter period (H’=1.30 and H’=2.20, respectively).
For the majority of the species, males (C. linguatula: H’=1.93; P. flesus: H’=2.01; M.
azevia: H’=2.40) showed a higher dietary breath than females (C. linguatula:
H’=1.81; P. flesus: H’=1.43; M. azevia: H’=2.39), L. boscii showed an opposite trend,
females’ diet (H’=1.70) was more diverse than that of males (H’=0.66). For C.
linguatula and M. azevia the dietary diversity increased with size (size class I:
H’=1.82; size class II: H’=2.12 and size class I: H’=2.30; size class II: H’=2.49,
respectively). L. boscii and P. flesus presented the opposite trend; dietary diversity
was higher for smaller size individuals (size class I: H’=1.43; size class II: H’=0.61
and size class I: H’=1.52; size class II: H’=1.51, respectively).
Age and Growth
The total length of fishes analysed varied between 149 mm and 275 mm for spotted
flounder, between 149 mm and 346 mm for four-spotted megrim, between 150 mm
and 430 mm for flounder, and between 149 mm and 275 mm for bastard sole. The
age ranged from 0 to 7 years in spotted flounder, from 1 to 9 years in four-spotted
megrim, from 1 and 14 years in flounder, and from 2 and 7 years in bastard sole.
All species showed a differential growth according to sex. For the majority of the
species (L. boscii, P. flesus and M. azevia) females attained higher lengths than males,
except for C. linguatula (Figure 4.3 a,b,c,d). The estimated asymptotic lengths for
spotted flounder were higher for males than for females (L∞=308.1 mm and L∞=302.0
mm, respectively). For the other species, an opposite trend was noticed: four-spotted
megrim: females: L∞=381.1 mm, males: L∞=323.7 mm; flounder: females: L∞=487.9
mm, L∞=456.6mm; and bastard sole: females:
Diet, Growth and Reproduction of Four Flatfishes
88
L∞=339.5 mm; males: L∞=314.8 mm). The growth coefficient of spotted flounder
(females: k=0.19; males: k= 0.15) and bastard sole (females: k= 0.40; males:
k=0.30) were higher for females than males, while for four-spotted megrim estimated
k for males was high that the one determined for females (females: k=0.14; males:
k= 0.20). For flounder, growth coefficient estimates were similar for both sexes
(females: k=0.10, males: k=0.11). The t0 estimates for spotted flounder were -4.40 ,
for females, and 3.04, for males; four-spotted megrim were -2.85, for females, and -
2.49 for males; flounder were -4.61 for females, and -3.75 for males; and bastard
sole were -0.01 for females, and -1.15 for males.
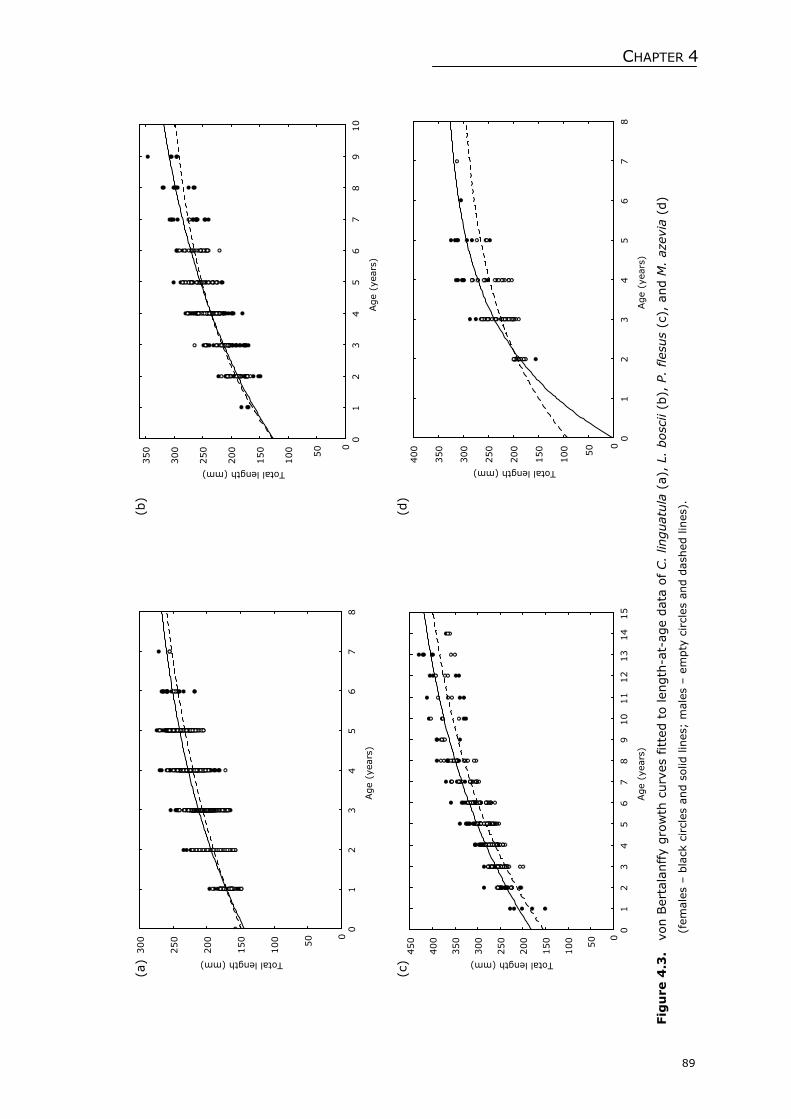
(a)
(b)
(c)
(d)
Fig
ure
4.3
. vo
n B
erta
lanffy
gro
wth
curv
es f
itte
d t
o len
gth
-at-
age
dat
a of C.
linguat
ula
(a)
, L.
bosc
ii (b
), P
. fles
us
(c),
and M
. az
evia
(d)
(fem
ales
– b
lack
cir
cles
and s
olid
lin
es;
male
s – e
mpty
cir
cles
and d
ash
ed lin
es).
01
23
45
67
8
Age
(yea
rs)
0
50
100
150
200
250
300
Total length (mm)
01
23
45
67
89
10
Age
(yea
rs)
0
50
100
150
200
250
300
350
Total length (mm)
01
23
45
67
89
10
11
12
13
14
15
Age
(yea
rs)
0
50
100
150
200
250
300
350
400
450
Total length (mm)
01
23
45
67
8
Age
(yea
rs)
0
50
100
150
200
250
300
350
400
Total length (mm)
89
CHAPTER 4

Diet, Growth and Reproduction of Four Flatfishes
90
Reproduction
For all the species studied, the percentage of individuals in each maturation stage per
season was in agreement with results relative to GSI values (Figures 4. and 4.5).
The highest GSI values were obtained in autumn-winter for L. boscii and P. flesus,
corresponding to period with the highest percentage of individuals in stage III
(spawning). The GSI values obtained for C. linguatula and M. azevia were high
throughout the year. Regarding the GSI values of females and males, it can be noticed
that the values obtained for females (C. linguatula: 1.96 – 2.16; L. boscii: 4.90 –
0.90; P flesus: 7.41 – 1.38; M. azevia: 1.70 – 2.62) were extremely high compared to
those determined for males (C. linguatula: 0.24 – 0.35; L. boscii: 0.17 – 0.14; P
flesus: 1.11 – 0.20; M. azevia: 0.10 – 0.11).
Figure 4.4. Percentage of individual of C. linguatula (CL), L. boscii (LB), P. flesus (PF) and
M. azevia (MA) in each maturation stage (I - Immature; II - Development; III
- Spawning; IV - Post-spawning), according to season (aw - autumn/winter;
sps - spring/summer) and to sex (F - females; M - males).
( Immature; Development; Spawning; Post-spawning).
L. boscii and C. linguatula were the species for which the sexual maturation occurred
in individuals with lower age and size (2 years for both, and 182 mm and 190 mm
respectively). Except for P. flesus (females: 3 years and male: 2 years, all the other
species presented the same age at first maturity for both sexes. M. azevia attained the
first sexual maturity at 3 years of age.
0%
25%
50%
75%
100%
F M F M F M F M F M F M F M F M
CL LB PF MA CL LB PF MA
aw sps
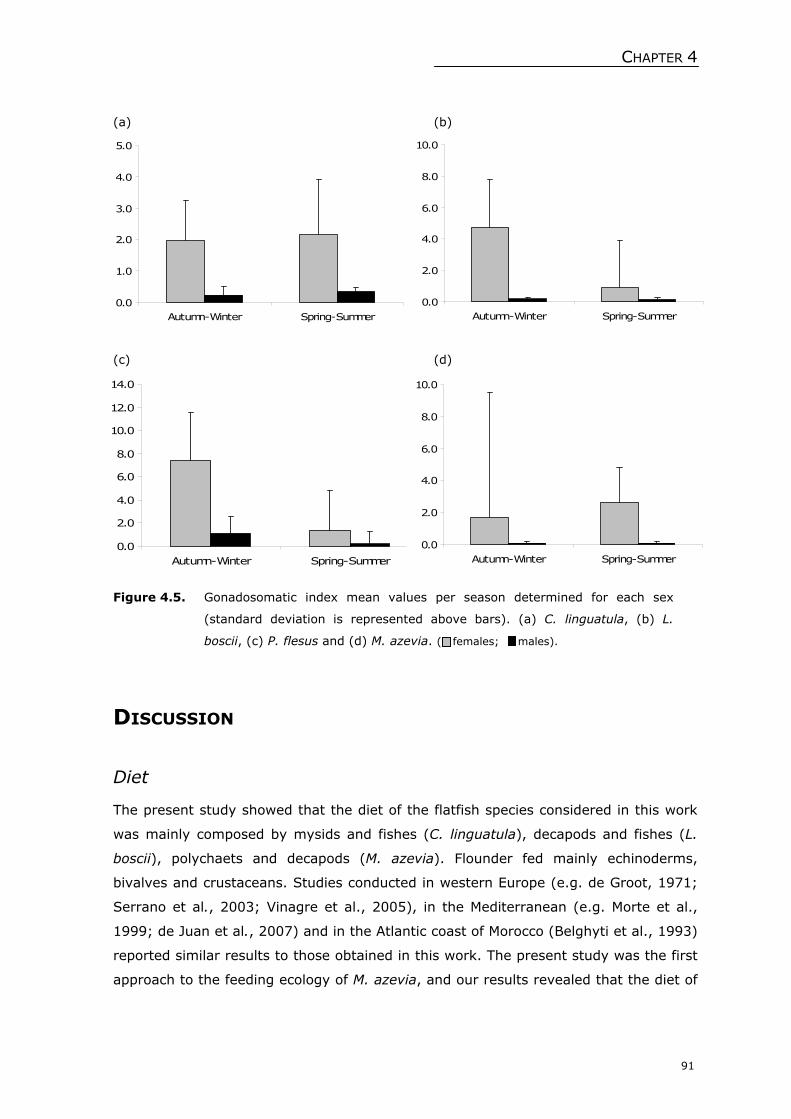
CHAPTER 4
91
(a) (b)
(c) (d)
Figure 4.5. Gonadosomatic index mean values per season determined for each sex
(standard deviation is represented above bars). (a) C. linguatula, (b) L.
boscii, (c) P. flesus and (d) M. azevia. ( females; males).
DISCUSSION
Diet
The present study showed that the diet of the flatfish species considered in this work
was mainly composed by mysids and fishes (C. linguatula), decapods and fishes (L.
boscii), polychaets and decapods (M. azevia). Flounder fed mainly echinoderms,
bivalves and crustaceans. Studies conducted in western Europe (e.g. de Groot, 1971;
Serrano et al., 2003; Vinagre et al., 2005), in the Mediterranean (e.g. Morte et al.,
1999; de Juan et al., 2007) and in the Atlantic coast of Morocco (Belghyti et al., 1993)
reported similar results to those obtained in this work. The present study was the first
approach to the feeding ecology of M. azevia, and our results revealed that the diet of
0.0
1.0
2.0
3.0
4.0
5.0
Autumn-Winter Spring-Summer
0.0
2.0
4.0
6.0
8.0
10.0
Autumn-Winter Spring-Summer
0.0
2.0
4.0
6.0
8.0
10.0
12.0
14.0
Autumn-Winter Spring-Summer
0.0
2.0
4.0
6.0
8.0
10.0
Autumn-Winter Spring-Summer
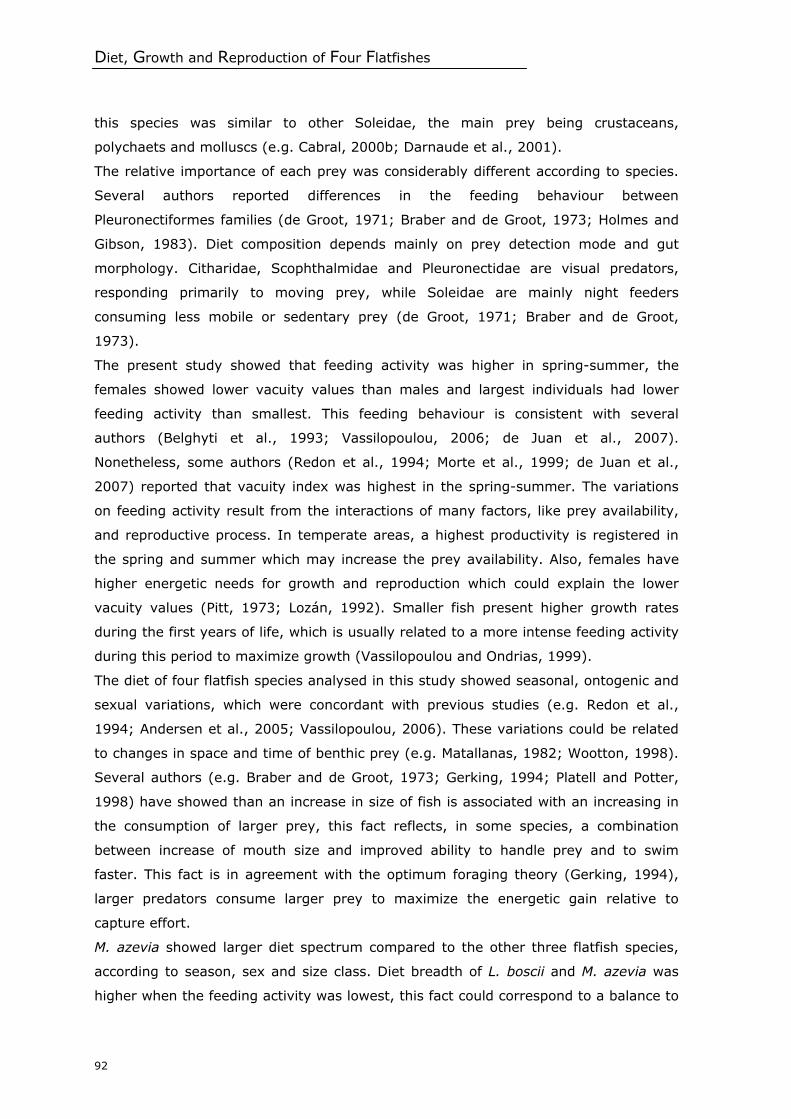
Diet, Growth and Reproduction of Four Flatfishes
92
this species was similar to other Soleidae, the main prey being crustaceans,
polychaets and molluscs (e.g. Cabral, 2000b; Darnaude et al., 2001).
The relative importance of each prey was considerably different according to species.
Several authors reported differences in the feeding behaviour between
Pleuronectiformes families (de Groot, 1971; Braber and de Groot, 1973; Holmes and
Gibson, 1983). Diet composition depends mainly on prey detection mode and gut
morphology. Citharidae, Scophthalmidae and Pleuronectidae are visual predators,
responding primarily to moving prey, while Soleidae are mainly night feeders
consuming less mobile or sedentary prey (de Groot, 1971; Braber and de Groot,
1973).
The present study showed that feeding activity was higher in spring-summer, the
females showed lower vacuity values than males and largest individuals had lower
feeding activity than smallest. This feeding behaviour is consistent with several
authors (Belghyti et al., 1993; Vassilopoulou, 2006; de Juan et al., 2007).
Nonetheless, some authors (Redon et al., 1994; Morte et al., 1999; de Juan et al.,
2007) reported that vacuity index was highest in the spring-summer. The variations
on feeding activity result from the interactions of many factors, like prey availability,
and reproductive process. In temperate areas, a highest productivity is registered in
the spring and summer which may increase the prey availability. Also, females have
higher energetic needs for growth and reproduction which could explain the lower
vacuity values (Pitt, 1973; Lozán, 1992). Smaller fish present higher growth rates
during the first years of life, which is usually related to a more intense feeding activity
during this period to maximize growth (Vassilopoulou and Ondrias, 1999).
The diet of four flatfish species analysed in this study showed seasonal, ontogenic and
sexual variations, which were concordant with previous studies (e.g. Redon et al.,
1994; Andersen et al., 2005; Vassilopoulou, 2006). These variations could be related
to changes in space and time of benthic prey (e.g. Matallanas, 1982; Wootton, 1998).
Several authors (e.g. Braber and de Groot, 1973; Gerking, 1994; Platell and Potter,
1998) have showed than an increase in size of fish is associated with an increasing in
the consumption of larger prey, this fact reflects, in some species, a combination
between increase of mouth size and improved ability to handle prey and to swim
faster. This fact is in agreement with the optimum foraging theory (Gerking, 1994),
larger predators consume larger prey to maximize the energetic gain relative to
capture effort.
M. azevia showed larger diet spectrum compared to the other three flatfish species,
according to season, sex and size class. Diet breadth of L. boscii and M. azevia was
higher when the feeding activity was lowest, this fact could correspond to a balance to
CHAPTER 4
93
compensate the decreasing of prey availability during those seasons (Vassilopoulou,
2006). C. linguatula and P. flesus presented largest diet diversity on spring-summer,
probably due to the availability of a large spectrum of prey.
Age and Growth
The present study showed than the asymptotic length (L∞) obtained for C. linguatula
were higher than the values obtained in studies conducted in the eastern
Mediterranean (Vassilopoulou and Papaconstantinou, 1994; Turker Çakir et al., 2005).
The opposite situation was observed for the growth coefficient (k). The estimate of
von Bertalanffy parameters obtained for L. boscii is in agreement with those estimated
by several authors in different geographical locations (e.g. Santos, 1994;
Vassilopoulou and Ondrias, 1999; Robson et al., 2000). The growth coefficient (k) was
similar to those obtained in previous studies, except for Robson et al. (2000), that
reported a higher growth coefficient. The values of asymptotic length for P. flesus
obtained in this work were higher than on earlier studies. This fact could be related to
the smallest length of the fish on the studies conducted in the North Atlantic and the
Mediterranean (Deniel, 1981; Vianet et al., 1989). The growth coefficient obtained in
this study was smaller than those obtained in previous studies. Growth studies for M.
azevia were scarce and all were conducted in the Portuguese coast. The estimate of
von Bertalanffy parameters obtained in this work was similar to Andrade (1990,
1998), for the southern coast the of Portugal.
Growth can be influenced by many factors. Latitudinal variations in temperature
induce variations in maintenance metabolism (Pauly, 1994a). The different growth
patterns between sexes could be explained by the differences in metabolism between
females and males, like differences in oxygen consumption (Pauly, 1994b), in the level
of surplus energy between reproduction and somatic growth (Rijnsdorp and Ibelings,
1989) and differential food ingestion (Lozán, 1992).
Reproduction
The analysis of seasonal variation of gonadal development suggests that the spawning
period of C. linguatula and M. azevia occurs throughout the year. However, the GSI
values of C. linguatula were higher during spring-summer which suggested that
reproduction occurs mainly in this season. Studies on the reproduction of spotted
flounder are scarce and reported only length and age at first maturity. Vassilopoulou
and Papaconstantinou (1994) and García-Rodriguez and Esteban (2000) suggested
age at first maturity was between the first and the third year of life, being early on

Diet, Growth and Reproduction of Four Flatfishes
94
males. Results obtained on the present work were consistent with the previous
studies, exception with the length of first maturity, that was highest than earlier
studies. The pattern of sexual development pointed out for M. azevia is consistent with
the existing literature (Andrade, 1990; Afonso-Dias et al., 2005). Age at first maturity
obtained on the present work was similar to earlier studies (Belaid and Marinaro,
1983; Andrade, 1990; Afonso-Dias et al., 2005). The results concerning the seasonal
variation of gonadal development on the present work for L. boscii were similar to
previous studies (Santos, 1994; Anonymous, 2006). The spawning season of P. flesus
proposed by several authors outline a latitudinal gradient, with later spawning at
higher latitudes. Studies carried out in North Europe showed that flounder spawns at
the end of spring (e.g. Cieglewicz, 1962; Solemdal, 1967; Rae, 1971), while in the
north of the French and Spanish coast, the spawning occurs mainly in the winter (e.g.
Anonymous, 1979; Deniel, 1981; Masson, 1988), similar results were showed in the
previous studies conducted while in the Portuguese coast the spawning occurs mainly
in the winter (Cunha, 1988), our results were in agreement with earlier work. The
length at first maturity obtained in the present study was higher compared to those
reported in previous studies (e.g. Masson, 1988; Kosior et al., 1996), which could be
explained by the highest growth rates at lower latitudes. Stable populations can present small variation in size and age at maturity, these
variations may be genetical changes, and can be associated with changes on
environmental conditions on nursery grounds or during the juvenile and the adult
stage (e.g. Stearns and Crandall, 1984; Rijnsdorp, 1993). Some studies have showed
that marked variations in length or age at first maturation could indicate population
decline (e.g. Bowering et al., 1997; Rijnsdorp and Vethaak, 1997).
Further studies on the bio-ecology of these species, are needed in order to bring new
insights into the population dynamics of these commercially important flatfish species.
ACKNOWLEDGEMENTS
This study was partially financed by the Fundação para a Ciência e a Tecnologia (FCT),
through the grant attributed to C.M. Teixeira (Grant SFRH/BD/19319/2004). This
study was also co-funded by the European Union through the FEDER–Fisheries
Programme (MARE).

CHAPTER 4
95
REFERENCES
Afonso-Dias, I., Reis, C., Andrade, J.P., 2005. Reproductive aspects of Microchirus azevia
(Risso, 1810) (Pisces: Soleidae) from the south coast of Portugal. Scientia Marina
69(2), 275–283.
Andersen, B.S., Carl, J.D., Grønkjær, P., Støttrup, J.G., 2005. Feeding ecology and growth
of age 0 year Platichthys flesus (L.) in a vegetated and a bare sand habitat in a
nutrient rich fjord. Journal of Fish Biology 66, 531–552.
Andrade, J.P.A.S., 1990. A importância da Ria Formosa no ciclo biológico de Solea
senegalensis Kaup 1858, Solea vulgaris Quensel 1806, Solea lascaris (Risso, 1810) e
Microchirus azevia (Capello, 1868). PhD Thesis, Universidade do Algarve, Portugal.
Andrade, J.P., 1998. Age and growth of the bastard sole, Microchirus azevia (Capello,
1868) (Pisces, Soleidae) from the south coast of Portugal. Fisheries Research 34, 205–
208.
Anonymous, 1979. Étude halieutique de l’estuaire de la Gironde. CTGREF-Groupement de
Bordeaux-Division aménagements littoraux et aquaculture. 189 pp.
Anonymous, 2006. Megrim in the South West of the British Isles (ICES Divisions VII and
VIII).
Beaumont, W.R.C., Mann, R.H.K., 1984. The age, growth and diet of a freshwater
population of the flounder, Platichthys flesus (L.), in the southern England. Journal of
Fish Biology 25, 617–623.
Belaid, B., Marinaro, J.Y., 1983. Biologie de la reproduction de Microchirus azevia (Capello)
(Téléostéen soléidé). Rapport Commission Internationale Mer Méditerranée 28(5), 59–
60.
Belghyti, D., Aguesse, P., Gabrion, C., 1993. Éthologie alimentaire de Citharus linguatula
et Dicologoglossa cuneata sur les côtes atlantiques du Maroc. Vie et Milieu 43, 95–108.
Beyst, B., Cattrijsse, A., Mees, J., 1999. Feeding ecology of juvenile flatfishes of the surf
zone of a sandy beach. Journal of Fish Biology 55, 1171–1186.
Bowering, W.R., Morgan, M.J., Brodie, W.B., 1997. Changes in the population of American
plaice (Hippoglossoides platessoides) off Labrador and northeastern Newfoundland: a
collapsing stock with low exploitation. Fisheries Research 30, 199–216.
Braber, L., de Groot, S.J., 1973. The food of five flatfish species (Pleuronectiformes) in the
soutern Nort Sea. Netherlands Journal of Sea Research 6, 163–172.
Briggs, J.C., 1974. Marine zoogeography. McGraw-Hill, London.
Cabral, H.M.R.N., 1998. Utilização do estuário do Tejo como área de viveiro pelos
linguados, Solea solea (L., 1758) e Solea senegalensis Kaup, 1858, e robalo,
Dicentrarchus labrax (L., 1758). PhD Thesis, Universidade de Lisboa, Portugal.

Diet, Growth and Reproduction of Four Flatfishes
96
Cabral, H.N., 2000a. Distribution and abundance patterns of flatfishes in the Sado estuary,
Portugal. Estuaries 53, 351–358.
Cabral, H.N., 2000b. Comparative feeding ecology of sympatric Solea solea and S.
senegalensis, within the nursery areas of the Tagus estuary, Portugal. Journal of Fish
Biology 57, 1550–1562.
Cieglewicz, W., 1962. The maturation of the flounder (Pleuronectes flesus) and
composition of the shoal of the spawning flounder in the bay of Danzig. Archives. d’
Hydrobiologie et d’Ichtyologie XI, 8–13.
Cunha, M.M., 1984. Ciclo reprodutivo de Platichthys flesus flesus (L., 1758) (Pisces:
Pleuronectidae) na Ria de Aveiro (costa portuguesa). Actas do 4º Simpósio Ibérico de
Estudos de Benthos Marinho 3, 23-34.
Çiloglu, E., 2005. Determination of the Recruitment to Stock and Reproduction Period for
Flounder (Platichthys flesus luscus Pallas, 1811) along the Trabzon-Rize Coast, Eastern
Black Sea. Turkish Journal of Veterinary and Animal Sciences 29, 43–48
Darnaude, A.M., Harmelin-Vivien, M.L., Salen-Picard, C., 2001. Food partioning among
flatfish (Pisces: Pleuronectiformes) juveniles in a Mediterranean coastal shallow sandy
area. Journal of the Marine Biological Association of the United Kingdom 81, 119–127.
de Groot, S.J., 1971. On the interrelationships between morphology of the alimentary
tract, food and feeding behaviour in flatfishes (Pisces: Pleuronectiformes). Netherlands
Journal of Sea Research 5, 121–196.
de Juan, S., Cartes, J.E., Demestre, M., 2007. Effects of commercial trawling activities in
the diet of the flat fish Citharus linguatula (Osteichthyes: Pleuronectiformes) and the
starfish Astropecten irregularis (Echinodermata: Asteroidea). Journal of Experimental
Marine Biology and Ecology 349, 152–169.
Deniel, C., 1981. Les poissons plats (Téléostéens-Pleuronectiformes) en Baie de
Douarnenez. Reproduction, croissance et migration des Bothidae, Scophthalmidae,
Pleuronectidae et Soleidae. PhD Thesis, Université de Bretagne Occidentale, France.
Desoutter, M., 1997. Révision systématique des genres de la famille des Soleidae présents
sur les côtes de l’Est-Atlantique et de la Méditerranée. PhD Thesis, Muséum National
d’Histoire Naturelle, Paris.
Ekman, S., 1953. Zoogeography of the sea. Sidgwick and Jackson, London.
García-Rodríguez, M., Esteban, A., 2000. Contribution to the knowledge of Citharus
linguatula (Linnaeus, 1758) (Osteicthyes: Heterosomata) in the Iberian Mediterranean.
Demersal Resources in the Mediterranean. Actes des Colloques IFREMER 26, 131–140.
Gerking, S.D., 1994. Feeding Ecology of Fish. Academic Press, San Diego.
Holmes, R.A., Gibson, R.N., 1983. A comparison of predatory behaviour in flatfish. Animal
Behaviour 31, 1244–1255.
Hyslop, E.J., 1980. Stomach contents analysis: a review of methods and their application.
Journal of Fish Biology 17, 415–429.

CHAPTER 4
97
Kosior, M., Kuczynski, J., Grygiel, W., 1996. Reproduction of Baltic flounder (Platichthys
flesus (L)) in relation to some somatic factors. ICES. Council Meeting Papers, 25 pp.
Landa, J., Pérez, N., Piñeiro, C., 2002. Growth patterns of the four spot megrim
(Lepidorhombus boscii) in the northeast Atlantic. Fisheries Research 55, 141–152.
Lozán, J.L., 1992. Sexual differences in food intake, digestive tract size, and growth
performance of the dab, Limanda limanda L. Netherlands Journal of Sea Research 29,
22–227.
Marfin, J.P., Hajji, N., 1988. Croissance de Microchirus azevia (Capello, 1867) du sud
Marocain. Cybium 12(2), 123–128.
Marshall, S., Elliott, M., 1997. A comparison of univariate and multivariate numerical and
graphical techniques for determining inter- and intraspecific feeding relationships in
estuarine fish. Journal of Fish Biology 51, 526–545.
Masson, G., 1988. Biologie du Flet, Platichthys flesus L. Sur les côtes europeennes.
Rapport de Diplôme d’Études Approndies d’Ecologie, 51 pp.
Matallanas, J., 1982. Estudio del regimen alimentario de Lampanyctus crodilus (Risso,
1810) (Pisces, Myctophidae) en lascostas catalanas (Med. occid.). Téthys 10, 254–260.
Morte, S., Redón, M.J., Sanz-Brau, A., 1999. Feeding ecology of two megrims
Lepidorhombus boscii and Lepidorhombus whiffiagonis in the western Mediterranean
(Gulf of Valencia, Spain). Journal of the Marine Biological Association of the United
Kingdom 79, 161–169.
Nielsen, J.G., 1986a. Citharidae. In: Whithead, P.J.P., Bauchot, M.L., Hureau, J.C., Nielsen,
J., Tortonese, E. (eds.). Fishes of the North-eastern Atlantic and the Mediterranean.
UNESCO, Vol III, pp. 1286.
Nielsen, J.G., 1986b. Scophthalmidae. In: Whithead, P.J.P., Bauchot, M.L., Hureau, J.C.,
Nielsen, J., Tortonese, E. (eds.). Fishes of the North-eastern Atlantic and the
Mediterranean. UNESCO, Vol III, pp. 1287–1293.
Nielsen, J.G., 1986c. Bothidae. In: Whithead, P.J.P., Bauchot, M.L., Hureau, J.C., Nielsen,
J., Tortonese, E. (eds.). Fishes of the North-eastern Atlantic and the Mediterranean.
UNESCO, Vol III, pp. 1294–1298.
Nielsen, J.G., 1986d. Pleuronectidae. In: Whithead, P.J.P., Bauchot, M.L., Hureau, J.C.,
Nielsen, J., Tortonese, E. (eds.). Fishes of the North-eastern Atlantic and the
Mediterranean. UNESCO, Vol III, pp. 1299–1307.
Pitt, T.K., 1973. Food of the American plaice (Hippoglossoides platessoides) from the
Grand Bank, Newfoundland. Journal of the Fisheries Research Board of Canada 30,
1261–1273.
Platell, M.E., Potter, I.C., 1998. Distributions, size compositions and diets of two abundant
benthic ambush-feeding teleosts in coastal waters of south-western Australia. Journal
of the Marine Biological Association of the United Kingdom 78, 587–608.

Diet, Growth and Reproduction of Four Flatfishes
98
Quéro, J.C., Desoutter, M., Lagardère, F., 1986a. Soleidae. In: Whithead, P.J.P., Bauchot,
M.L., Hureau, J.C., Nielsen, J., Tortonese, E. (eds.). Fishes of the North-eastern
Atlantic and the Mediterranean. UNESCO, Vol III, pp.1308–1324.
Quéro, J.C., Desoutter, M., Lagardère, F., 1986b. Cynoglossidae. In: Whithead, P.J.P.,
Bauchot, M.L., Hureau, J.C., Nielsen, J., Tortonese, E. (eds.). Fishes of the North-
eastern Atlantic and the Mediterranean. UNESCO, Vol III, pp. 1325–1328.
Rae, B.B., 1971. The distribution of flatfishes in Scottish and adjacent waters. Marine
Research Scotland 2, 1–19.
Redon, M.J., Morte, M.S., Sanz-Brau, A., 1994. Feeding habitats of the spotted flounder
Citharus linguatula off the eastern coast of Spain. Marine Biology 120, 197–291.
Rijnsdorp, A.D., 1989. Maturation of male and female North Sea plaice (Pleuronectes
platessa L.). ICES Journal of Marine Science 46(1), 35–51.
Rijnsdorp, A.D., 1993. Selection differentials in male and female North Sea plaice and
changes in maturation and fecundity. In: Stokes, T.K., McGlade, J.M., Law, R. (eds.),
The Explotation of Evolving Resources. Springer, 19–36.
Rijnsdorp, A.D. and Ibelings, B., 1989. Sexual dimorphism in the energetics of
reproduction and growth of North Sea plaice, Pleuronectes platessa L. Journal of Fish
Biology 35, 401–415.
Rijnsdorp, A.D., Vethaak, A.D., 1997. Changes in reproductive parameters of North Sea
plaice and sole between 1960–1995. ICES C.M. Doc., No. U:14, 31 pp.
Robson, S.M., King, P.A., Hannan, J., McGrath, D., 2000. Age and growth of a sample of
four-spot megrim, Lepidorhombus boscii, from off the west coast of Ireland. Biology
and Environment: Proceedings of the Royal Irish Academy 100B(3), 143–148.
Santos, P.T., 1994. Growth and reproduction of the population of the four-spot megrim
(Lepidorhombus bosccii Risso) off the Portuguese coast. Netherlands Journal of Sea
Research 32(3-4), 379–383.
Serrano, A., Velasco, F., Olasco, I., Sanchez, F., 2003. Macrobenthic crustaceans in the
diet of demersal fish in the Bay of Biscay in relation to abundance in the environment.
Sarsia 88, 36–48.
Shannon, C.E., Weaver, W., 1949. The Mathematical Theory of Communication. University
of Illinois Press.
Solemdal, P., 1967. The effect of salinity on buoyancy, size and development of flounder
eggs. Sarsia 29, 431–442.
Stearns, S.C., Crandall, R.E., 1984. Plasticity for age and size at sexual maturity: a life
history response to unavoidable stress. In: Potts, G.W., Wootton, R.J. (eds.). Fish
Reproduction: Strategies and Tactics. Academic Press, pp. 2–33.
Summers, R.W., 1979. Life cycle and population ecology of the flounder Platichthys flesus
(L.) in the Ythan estuary, Scotland. Journal of Natural History 13, 703–723.

CHAPTER 4
99
ter Braak, C.J.F., Šmilauer, P., 2002. Canoco for Windows Version 4.5. Biometris–Plant
Research International, Wageningen.
Türker Çakir, D., Bayhan, B., Hossucu, B., 2005. Some Parameters of the Population
Biology of Spotted Flounder (Citharus linguatula Linnaeus, 1758) in Edremit Bay (North
Aegean Sea). Turkish Journal of Veterinary and Animal Sciences 29, 1013–1018.
Vassilopoulou, V., 2006. Dietary habits of the deep-sea flatfish Lepidorhombus boscii in
north-eastern Mediterranean waters. Journal of Fish Biology 69, 1202–1220.
Vassilopoulou, V., Papaconstantinou, C., 1994. Age, growth and mortality of the spotted
flounder (Citharus linguatula Linnaues, 1758) in the Aegean Sea. Scientia Marina
58(3), 261–267.
Vassilopoulou, V., Ondrias, I., 1999. Age and growth of the four-spotted megrim
(Lepidorhombus boscii) in eastern Mediterranean waters. Journal of the Marine
Biological Association of the United Kingdom 79, 171–178.
Vianet, R., Quignard, J.P., Tomasini, J.A., 1989. Age et croissance de quatre poissons
pleuronectiformes (flet, turbot, barbue, sole) du Golf du Lion. Evolution de la struture
de la sagitta. Cymbium 13(3), 247–258.
Vinagre, C., França, S., Costa, M.J., Cabral, H.N., 2005. Niche overlap between juvenile
flatfishes, Platichthys flesus and Solea solea, in a southern European estuary and
adjacent coastal waters. Journal of Applied Ichthyology 21, 114–120.
Wootton, R.J., 1998. Feeding. In: Wootton, R.J. (ed.). Ecology of Teleost Fishes. Kluwer
Academic Publishers, pp. 27–62.
Zar, J.H., 1984. Biostatistical Analysis. Prentice-Hall. New Jersey.


CHAPTER 5
Genetic diversity and population structure of Solea solea and Solea senegalensis and
its relationships with life history patterns
By Teixeira, T.F. , Teixeira, C.M., Marques, J.M., Coelho, M.M., Cabral, H.N.

CHAPTER 5
103
Genetic diversity and population structure of
Solea solea and Solea senegalensis and its
relationships with life history patterns
ABSTRACT: The genetic diversity and population structure of Solea solea and Solea senegalensis were
analysed, based on the complete cytochrome b sequence of mitochondrial DNA, of samples obtained
throughout the species distribution ranges. A low nucleotide diversity and high haplotype diversity was
observed in both species (except for Portugal-North population of S. senegalensis). The pairwise Φ-statistics
and AMOVA of S. solea samples evidenced the genetic divergence of Atlantic and Mediterranean populations
and of Eastern and Western Mediterranean populations. Significant differences were also observed between
samples of S. senegalensis. Atlantic populations of S. solea, ranging from the Baltic Sea to Portugal-South
could be considered as representative of the same panmictic unit. Minimum spanning network analysis
revealed star-shaped patterns for populations of both species, suggesting that populations have undergone
expansion following bottlenecks. The higher levels of diversity observed in S. senegalensis, compared to S.
solea, may be due to differences in the duration of the pelagic larval stage, spawning period and habitat use
patterns, with water temperature assuming a major role in restricting gene flow and consequently in the
population genetic structure of both species. Although no assessment of soles stocks exploitation status
exists for the Portuguese coast, the fact that common populational unit have been recognized for the NE
Atlantic, deserves a strong regarding these species, since overexploitation of soles stocks have been
reported for the Northern Europe.
KEYWORDS:
common sole, Senegalese sole, mitochondrial DNA, genetic population structure, stock
identification, fisheries management
INTRODUCTION
The definition of stocks and their boundaries has become an essential part of fisheries
management, especially since several studies developed in worldwide have referred
high pressure on marine resources, resulting in a decrease of effective population size,
being some stocks already out of their biological safety limits. However, the
geographic areas considered in the establishment of management policies do not often
coincide with the biological stocks’ distribution, simply because of seasonal

Genetic Diversity and Population Structure of Two Sympatric Soles
104
movements of these stocks between the several management areas, or because
different fish stocks may occur simultaneously in a unique area, generally resulting in
a mismatch in the spatial scale of management and biological reality (Pawson and
Jennings, 1996). The stock concept has numerous meanings in the fisheries context,
such as an abstract and undefined unit or a spatial location in which fish are found and
can be exploited by a specific fishing technique, and, in the biological context, a
genetic unit defined as a group of individuals that mate randomly, with a variable
degree of spatial and temporal integrity (Carvalho and Hauser, 1995).
In marine species with high dispersal patterns, which includes most of marine fishes, it
is considered that high gene flow leads to population homogeneity, at a large scale, as
a result of their life cycle patterns; factors like high fecundity, passive dispersal of
larvae and active migration of adults, lead to the lower levels of genetic differentiation
exhibited by marine species, relatively to freshwater or anadromous species (Ward et
al., 1994; Carvalho and Hauser, 1995; Ward, 2002).
The analysis of genetic variation among fish species allows the discrimination of
different stocks and the analyses of their migration patterns and effective size, and to
assess individual stock contribution to mixed stock fisheries, evaluating the response
of stocks to fisheries exploitation (Wirgin and Waldman, 1994). The assessment of
genetic variation and the concept of geographical structure in marine fish populations
are fundamental to the understanding of population dynamics and to the conservation
and sustainable management of fisheries resources (Carvalho and Hauser, 1995;
Bailey, 1997).
The knowledge on population structure is fundamental to manage fisheries of high
commercial value species that present a broad-scale distribution. Flatfish species
inhabit most of the shelf waters of the world oceans, but the largest quantities are
caught in the temperate and boreal zones of the Northern Hemisphere (Pauly, 1994).
In 2005, flatfish catches represented 1.46% of the world marine landings and near
70% these were relative to the North Atlantic (721950 tonnes) (source: FAO).
According to the Portuguese fisheries statistics, flatfish fisheries represent 4% of all
the fish biomass landed in the Portuguese coast. However, the importance of flatfish
fisheries is considerable higher due to the high commercial value of flatfish species,
accounting for near 11% of the economical value of fish landings (source: DGPA).
According to official data, the most important flatfish species for Portuguese fisheries,
in terms of landings, were the soles, Solea solea (Linnaeus, 1758) and Solea
senegalensis Kaup, 1858. Soles landings increased from 464 tonnes, in 1998, to 510
tonnes, in 2005 (source: DGPA).
CHAPTER 5
105
Few studies of broad-scale geographic range have considered commercially important
flatfish, but common sole inhabiting the northern areas of the Eastern Atlantic have
been particularly well studied using different kinds of genetic markers: allozymes and
nuclear DNA detected significant differentiation between Mediterranean and Atlantic
populations, within European Atlantic coast and across Mediterranean (e.g. Koutoulas
et al., 1995; Exadactylos et al., 1998; Garoia et al., 2007; Rolland et al., 2007);
control region of mitochondrial DNA (mtDNA) revealed the existence of genetic
structure among adjacent basins (Guarniero et al., 2002) and RAPDs (random
amplification of polymorphic DNA) detected higher levels of genetic variation within
and between populations (Exadactylos et al., 2003).
Genetic studies developed with Senegalese sole focused its systematics and
phylogeny, particularly in the Mediterranean (e.g. Borsa and Quignard, 2001; Infante
et al., 2004), and only recently including a broader-scale area (Pardo et al., 2005).
The only population genetic study was developed by Cabral et al. (2003) that analysed
nine polymorphic allozyme loci, pointing out a low genetic differentiation and the
absence of population structure for S. senegalensis inhabiting several estuarine
systems along the Portuguese coast.
The aim of the present study is to determine the genetic diversity and population
structure of S. solea and S. senegalensis throughout their distribution range, using
mtDNA cytochrome b data, and to evaluate its relationships with species life history
patterns, that could be especially useful for the sustainable management of these
resources.
MATERIALS AND METHODS
Sampling and DNA Extraction
A total of 172 soles, belonging to both species, were collected from 13 different
locations, covering their distribution range, from the Baltic Sea to the Mauritanian
coast, and throughout the Mediterranean Sea (Figure 5.1). The number of individuals
analysed for each species and the location of sampling areas are presented in Table
5.1.
Total genomic DNA was extracted from tissue samples (fin or muscle), following a
phenol-chloroform protocol, as described by Wasko et al. (2003).

Genetic Diversity and Population Structure of Two Sympatric Soles
106
Figure 5.1. Sampling areas for each species analysed in this study and their distribution
range (blue – S. solea; orange – S. senegalensis). Codes of sampling areas
are defined in Table 5.1.
PCR Amplification and Sequencing
The entire cytochrome b (cyt b) mitochondrial DNA gene (about 1141 bp in length)
was amplified by PCR, using two specific primers (Infante et al., 2004):
GLU1 (5’-GGGGATTTTAACCTCAGGCGTTCAGTTTAC-3’) and
Thr2 (5’-GGACTAATCGCTTGAAAAAACCACCGTTG-3’).
DBS DNS
BNS
UKIS
FBBy
PN PC PS
Maur
GL IAdS
GAS
TAS
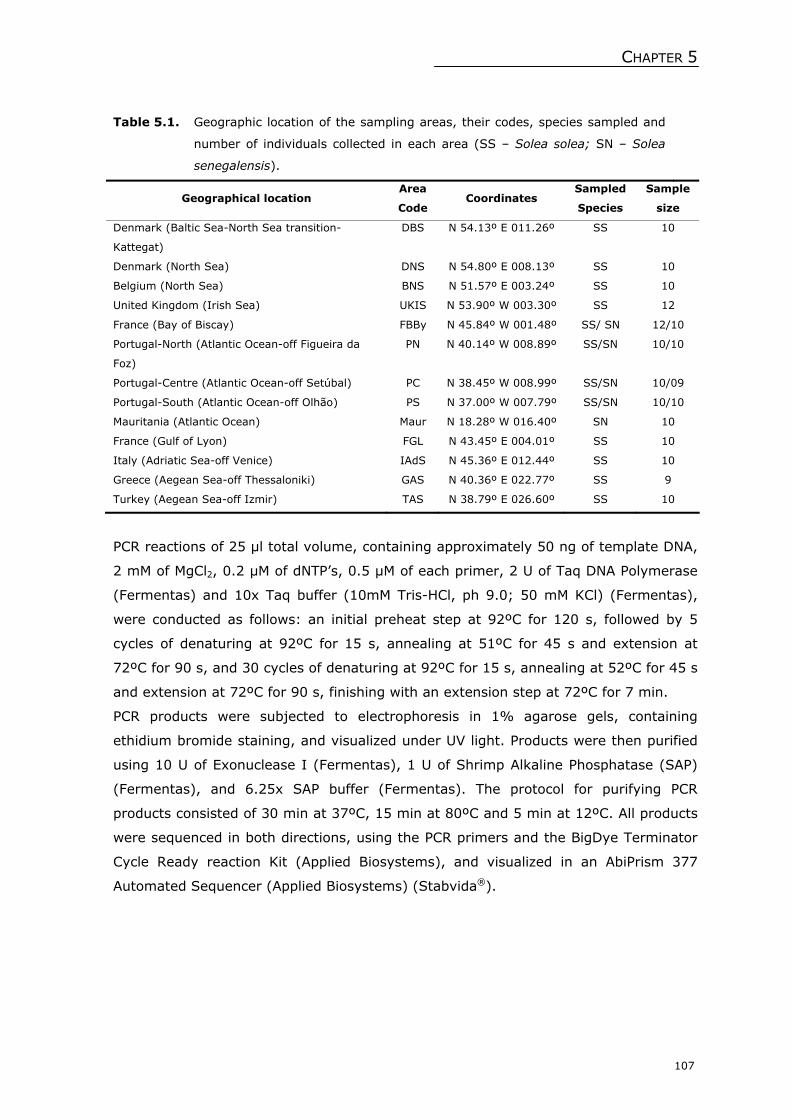
CHAPTER 5
107
Table 5.1. Geographic location of the sampling areas, their codes, species sampled and
number of individuals collected in each area (SS – Solea solea; SN – Solea
senegalensis).
Geographical location Area
Code Coordinates
Sampled
Species
Sample
size
Denmark (Baltic Sea-North Sea transition-
Kattegat)
DBS N 54.13º E 011.26º SS 10
Denmark (North Sea) DNS N 54.80º E 008.13º SS 10
Belgium (North Sea) BNS N 51.57º E 003.24º SS 10
United Kingdom (Irish Sea) UKIS N 53.90º W 003.30º SS 12
France (Bay of Biscay) FBBy N 45.84º W 001.48º SS/ SN 12/10
Portugal-North (Atlantic Ocean-off Figueira da
Foz)
PN N 40.14º W 008.89º SS/SN 10/10
Portugal-Centre (Atlantic Ocean-off Setúbal) PC N 38.45º W 008.99º SS/SN 10/09
Portugal-South (Atlantic Ocean-off Olhão) PS N 37.00º W 007.79º SS/SN 10/10
Mauritania (Atlantic Ocean) Maur N 18.28º W 016.40º SN 10
France (Gulf of Lyon) FGL N 43.45º E 004.01º SS 10
Italy (Adriatic Sea-off Venice) IAdS N 45.36º E 012.44º SS 10
Greece (Aegean Sea-off Thessaloniki) GAS N 40.36º E 022.77º SS 9
Turkey (Aegean Sea-off Izmir) TAS N 38.79º E 026.60º SS 10
PCR reactions of 25 μl total volume, containing approximately 50 ng of template DNA,
2 mM of MgCl2, 0.2 μM of dNTP’s, 0.5 μM of each primer, 2 U of Taq DNA Polymerase
(Fermentas) and 10x Taq buffer (10mM Tris-HCl, ph 9.0; 50 mM KCl) (Fermentas),
were conducted as follows: an initial preheat step at 92ºC for 120 s, followed by 5
cycles of denaturing at 92ºC for 15 s, annealing at 51ºC for 45 s and extension at
72ºC for 90 s, and 30 cycles of denaturing at 92ºC for 15 s, annealing at 52ºC for 45 s
and extension at 72ºC for 90 s, finishing with an extension step at 72ºC for 7 min.
PCR products were subjected to electrophoresis in 1% agarose gels, containing
ethidium bromide staining, and visualized under UV light. Products were then purified
using 10 U of Exonuclease I (Fermentas), 1 U of Shrimp Alkaline Phosphatase (SAP)
(Fermentas), and 6.25x SAP buffer (Fermentas). The protocol for purifying PCR
products consisted of 30 min at 37ºC, 15 min at 80ºC and 5 min at 12ºC. All products
were sequenced in both directions, using the PCR primers and the BigDye Terminator
Cycle Ready reaction Kit (Applied Biosystems), and visualized in an AbiPrism 377
Automated Sequencer (Applied Biosystems) (Stabvida®).
Genetic Diversity and Population Structure of Two Sympatric Soles
108
Sequence Alignment
Contiguous sequences were assembled in Sequencher 4.0 (GeneCodes Corp.) and
compared to similar sequences deposited in GenBank, using the Basic Local Alignment
Search Tool (BLAST) available on the NCBI website (NCBI,
http://www.ncbi.nlm.nih.gov/Genbank). All sequences were aligned using Sequencher
4.0 (GeneCodes Corp.).
Population Genetic Analysis
Intrapopulation diversity was analysed by estimating gene diversity (h), and
nucleotide diversity (π) (Nei, 1987), using DNASP 4.10.9 (Rozas et al., 2003).
Population structure and genetic variation were characterised by Φ–statistics
(analogous to the F-Statistics of Wright (1969)), which incorporate genetic distance
between haplotypes and haplotipic frequencies, using Arlequin 3.11 (Excoffier et al.,
2005). The software Modeltest 3.7 (Posada and Crandall, 1998) was used to find the
best model of evolution that fitted the data, according with the Akaike criterion.
Although resultant models were different for both species (GTR+I+G – general time
reversible plus Proportion invariant plus Gamma, for S. solea, and GTR – general time
reversible for S. senegalensis) the pairwise distance method, with γ=0, was
considered for both species analyses, since the resultant models were not included in
Arlequin 3.11.
Analysis of molecular variance (AMOVA) was used to assess the population
configuration and the geographical pattern of population subdivision (Excoffier et al.,
1992). For hierarchical analyses, populations were grouped according to their
geographic location. Several other rearrangements were tested and the one that
maximised among group variation (θCT) was assumed to be the most probable
subdivision. Simulations with 1000 permutations were made to test the statistic
significance of results. The isolation by distance (IBD) model was analysed by testing
the association between geographic and genetic distances (Smouse et al., 1986)
through a Mantel test (Mantel, 1967) with 10000 permutations, as implemented in
Arlequin 3.11. Geographical distances between populations were measured as a
straight line along the coast between each two areas. A standard Bonferroni a
posteriori correction was applied to determine the level of significance in multiple
tests.
Minimum spanning networks (using the median joining agglomeration method) were
constructed with Network 4.201 (Bandelt et al., 1999) based on haplotype data of the
sampled populations, and generated with MacClade 4.08 (Maddison and Maddison,
1989). Network 4.201 uses the maximum parsimony method for reconstructing trees,

CHAPTER 5
109
choosing the smallest and simplest as the best. Median-joining algorithm was used
with default parameters, as recommended for this kind of data (Bandelt et al., 1999).
The population structure was also investigated using the program BAPS 4.1 (Corander
and Tang, 2007), which allows the analysis of sequence data. Given a maximum value
of partitions, the algorithm uses a stochastic optimization procedure to find the
clustering solution with the highest ‘marginal likelihood’ of K (i.e., an approximation of
the most probable number of differentiated genetic populations conditional on
observed data). The maximum number of partitions, K, was set as ranging from 5 to
20 (S. senegalensis) and from 12 to 20 (S. solea) and, in each case, we the analyses
were ran several times, recording the best partition found and the corresponding
‘marginal likelihood’.
RESULTS
Solea solea
Genetic diversity was very high, with 75 haplotypes recovered from 123 individuals
(77% were unique). The most common haplotype, H7 (15% of the samples), was
shared by 18 individuals from Northeast (NE) Atlantic samples (BNS, FBBy, DBS, DNS,
PC, PN and UKIS), and did not included any of the Mediterranean samples. Moreover,
no haplotypes were shared between individuals from NE Atlantic and Mediterranean
samples. The second major common haplotype, H38, was shared by 10 individuals, all
from Mediterranean samples (GAS and TAS).
The overall level of haplotype diversity (h) was high, ranging from 0.667, in the
Denmark North Sea (DNS) and Turkey (TAS) samples, to 1.000, in Portugal-South
(PS) and France Gulf of Lyon (FGL) samples. Nucleotide diversity (π) exhibited by all
populations was low, ranging from 0.001, in Turkey (TAS), to 0.007, in Portugal-South
(PS). The number of haplotypes presented by each population varied, ranging from 5
in the Denmark Baltic Sea (DBS), Denmark North Sea (DNS) and Turkey (TAS)
samples to 10 in France Bay of Biscay (FBBy), Portugal-South (PS) and France Gulf of
Lyon (FGL) (Table 5.2).

Genetic Diversity and Population Structure of Two Sympatric Soles
110
Table 5.2. Genetic diversity of cyt b sequences for S. solea populations (standard
deviation is presented between brackets) (see Table 5.1 for sample codes).
Sample
Nucleotide diversity
(π)
Haplotype diversity
(h)
Number of
haplotypes
DBS 0.005 (0.003) 0.844 (0.080) 5
DNS 0.003 (0.002) 0.667 (0.163) 5
BNS 0.005 (0.003) 0.978 (0.054) 9
UKIS 0.005 (0.003) 0.909 (0.080) 9
FBBy 0.004 (0.003) 0.970 (0.044) 10
PN 0.004 (0.003) 0.956 (0.059) 8
PC 0.004 (0.003) 0.978 (0.054) 9
PS 0.007 (0.004) 1.000 (0.045) 10
FGL 0.003 (0.002) 1.000 (0.045) 10
IAdS 0.003 (0.002) 0.956 (0.059) 8
GAS 0.002 (0.001) 0.833 (0.127) 6
TAS 0.001 (0.001) 0.667 (0.163) 5
The hierarchical partition of variance amongst population tested using AMOVA
revealed that the proportion of “among groups” variation is large (48.5%) (θCT=0.485;
P<0.001), the proportion of variation “within populations” is 47.19% (θST=0.528;
P<0.001). Only a small variance component was attributable to “among populations
and within groups” (4.31%) (θSC=0.084; P<0.001).
Low ΦST values were found in all pairwise analyses within the NE Atlantic samples,
while those obtained between the group of NE Atlantic samples and the group of
Mediterranean samples were high (0.385-0.771) and significant (P<0.001). High and
significant ΦST values (0.191-0.368; P<0.001) were also obtained in the pairwise
analysis between Western (FGL and IAdS) and Eastern (GAS and TAS) Mediterranean
samples (Table 5.3).

CHAPTER 5
111
Table 5.3. Genetic differentiation (ΦST) values for S. solea samples (* indicates
significant values, P<0.001) (see Table 5.1 for sample codes).
Sample DBS DNS BNS UKIS FBBy PN PC PS FGL IAdS TAS GAS
DBS -
DNS 0.080 -
BNS -0.028 0.013 -
UKIS 0.023 0.174 0.007 -
FBBy 0.021 0.021 -0.09 0.083 -
PN 0.044 0.158 0.027 0.047 0.015 -
PC 0.030 0.046 -0.003 0.075 0.000 0.007 -
PS 0.085 0.207 0.085 0.083 0.095 0.001 0.020 -
FGL 0.462* 0.599* 0.465* 0.414* 0.502* 0.482* 0.488* 0.385* -
IAdS 0.528* 0.657* 0.530* 0.480* 0.563* 0.537* 0.531* 0.412* 0.056 -
TAS 0.627* 0.771* 0.630* 0.566* 0.652* 0.664* 0.664* 0.553* 0.232* 0.368* -
GAS 0.587* 0.725* 0.587* 0.533* 0.617* 0.618* 0.618* 0.506* 0.191* 0.285* 0.017 -
The Mantel test with sampled populations (from Baltic Sea to Aegean Sea) revealed a
clear correlation between genetic and geographical distance (Z=0.63; P<0.05).
However, when this test was applied separately to Atlantic and Mediterranean
samples, no significant correlations between genetic and geographical distance were
found (Z=0.30, P>0.05 and Z=0.44, P>0.05, respectively).
The haplotype network derived from cyt b sequences, and using the maximum
parsimony method, is presented in Figure 5.2. Size of circles is proportional to the
number of individuals within each haplotype. Two major common haplotypes were
found, and represent individuals from NE Atlantic samples (H7, shared between 18
individuals) and Mediterranean samples (H38, shared between 10 individuals of
Greece (GAS) and Turkey (TAS) samples). These two haplotypes differ from each
other by 8 mutations, and 3 haplotypes are missing between them. It is also possible
to identify a third haplotype (H27), shared by the individuals from France Gulf of Lyon
(FGL) and Italy (IAdS) samples, from which several haplotypes derive by only one
mutation.

Genetic Diversity and Population Structure of Two Sympatric Soles
112
Figure 5.2. Minimum spanning network analysis of haplotypes identified in samples of
S. solea. Distances between haplotypes are proportional to the number of
mutational steps. Colours correspond to populations as follows:
Denmark Baltic Sea-North Sea transition (DBS), Denmark North Sea
coast (DNS), United Kingdom Irish Sea (UKIS), Belgium North Sea
(BNS), France Bay of Biscay (FBBy), Portugal-North (PN),
Portugal-Centre (PC), Portugal-South (PS), France Gulf of Lyon
(FGL), Itay Adriatic Sea (IAdS), Greece Aegean Sea (GAS) and
Turkey Aegean Sea (TAS).
The population analysis performed in BAPS (Figure 5.3) suggests the existence of
three different clusters, represented by the blue, red and green vertical bars. Two of
the clusters are present in all Atlantic samples (blue and green), but not in
Mediterranean samples, and the red cluster is only found in Mediterranean samples.
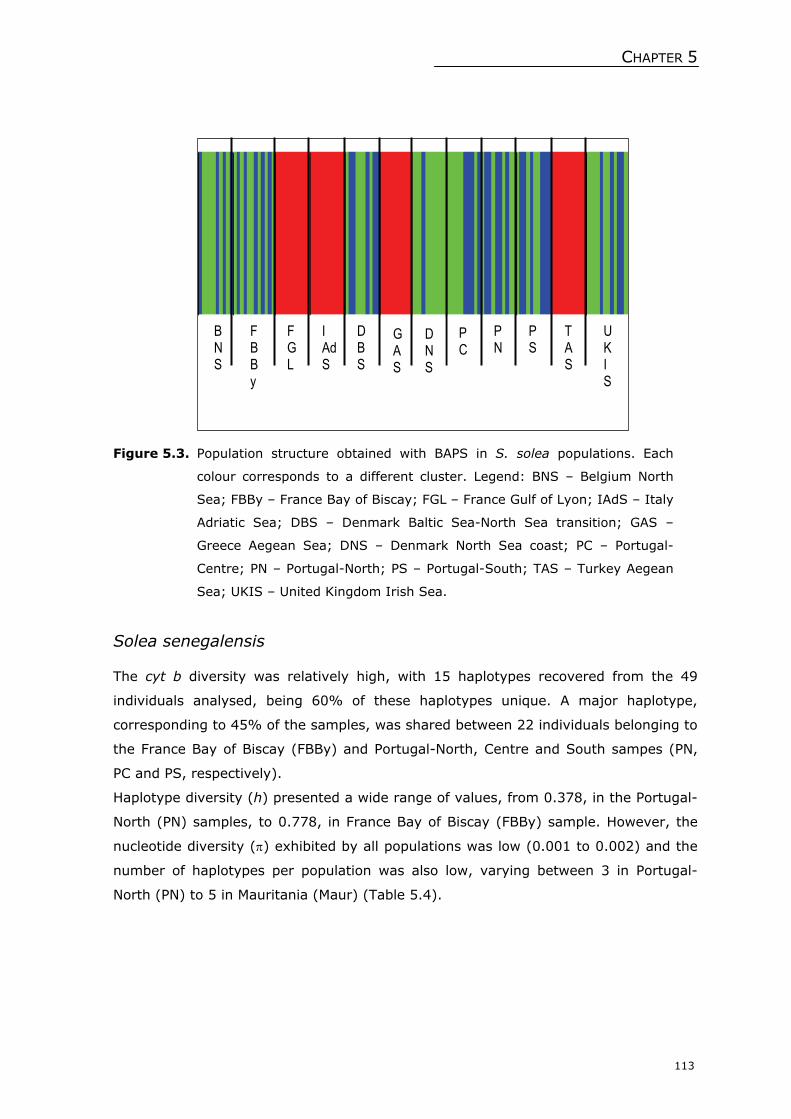
CHAPTER 5
113
Figure 5.3. Population structure obtained with BAPS in S. solea populations. Each
colour corresponds to a different cluster. Legend: BNS – Belgium North
Sea; FBBy – France Bay of Biscay; FGL – France Gulf of Lyon; IAdS – Italy
Adriatic Sea; DBS – Denmark Baltic Sea-North Sea transition; GAS –
Greece Aegean Sea; DNS – Denmark North Sea coast; PC – Portugal-
Centre; PN – Portugal-North; PS – Portugal-South; TAS – Turkey Aegean
Sea; UKIS – United Kingdom Irish Sea.
Solea senegalensis
The cyt b diversity was relatively high, with 15 haplotypes recovered from the 49
individuals analysed, being 60% of these haplotypes unique. A major haplotype,
corresponding to 45% of the samples, was shared between 22 individuals belonging to
the France Bay of Biscay (FBBy) and Portugal-North, Centre and South sampes (PN,
PC and PS, respectively).
Haplotype diversity (h) presented a wide range of values, from 0.378, in the Portugal-
North (PN) samples, to 0.778, in France Bay of Biscay (FBBy) sample. However, the
nucleotide diversity (π) exhibited by all populations was low (0.001 to 0.002) and the
number of haplotypes per population was also low, varying between 3 in Portugal-
North (PN) to 5 in Mauritania (Maur) (Table 5.4).
B NS
FBBy
FGL
I AdS
DBS
GAS
DNS
UK IS
PC
PN
PS
TAS

Genetic Diversity and Population Structure of Two Sympatric Soles
114
Table 5.4. Genetic diversity of cyt b sequences for S. senegalensis populations
(standard deviation is presented between brackets) (see Table 5.1 for
sample codes).
Sample
Nucleotide diversity
(π)
Haplotype diversity
(h)
Number of
haplotypes
FBBy 0.002 (0.001) 0.778 (0.091) 4
PN 0.001 (0.001) 0.378 (0.181) 3
PC 0.001 (0.001) 0.583 (0.183) 4
PS 0.001 (0.001) 0.711 (0.118) 4
Maur 0.001 (0.001) 0.667 (0.163) 5
The AMOVA indicated that a high and significant proportion of the total variance was
attributed to “among groups” (48.55%)(θCT=0.485; P<0.001), but the highest, and
significant, percentage of variation (52.66%) (θST=0.473, P<0.001) was obtained
“within populations”. A small proportion of variance was attributable to “among
populations and within groups” (-1.21%) (θSC=-0.024, P<0.001).
The highest levels of genetic differentiation were obtained between the France Bay of
Biscay (FBBy) sample and all the others under study (Table 5.5). No genetic
differentiation was found between Portuguese coast samples, which were the
geographically closest ones, being the highest and significant values of ΦST presented
by a pair of the most geographically distant samples, France Bay of Biscay (FBBy) and
Mauritania (Maur) (ΦST=0.502). The Portugal-Centre (PC) sample did not present
significant genetic differentiation from any of the other samples.
Table 5.5. Genetic differentiation (ΦST) values for S. senegalensis
samples (* indicates significant values, P<0.01) (see
Table 5.1 for sample codes).
Sample FBBy PN PC PS Maur
FBBy -
PN 0.453* -
PC 0.405* -0.032* -
PS 0.429* -0.095* 0.000 -
Maur 0.502* -0.444* 0.301 0.405* -
The Mantel test considering all the samples (from France Bay of Biscay (FBBy) to
Mauritania (Maur)) failed to show a significant correlation between genetic and
geographical distance (P>0.05), despite the high value of the correlation coefficient
obtained (Z=0.75).

CHAPTER 5
115
The haplotype network based on the cyt b sequences presented a star-shape (Figure
5.4), suggesting population expansion.
Figure 5.4. Minimum spanning network analysis of haplotypes identified in samples of
S. senegalensis. Distances between haplotypes are proportional to the
number of mutational steps. Colours correspond to samples as follows:
France Bay of Biscay (FBBy), Portugal-North (PN), Portugal-Centre
(PC), Portugal-South (PS), Mauritania (Maur).
The most common haplotype, H2, was shared by individuals from four of the five
samples analysed – France Bay of Biscay (FBBy), Portugal-North (PN), Portugal-Centre
(PC) and Portugal-South (PS). All other haplotypes derived from this one, by one to
five mutations, with the highest differentiation being found between the France Bay of
Biscay (FBBy) and Mauritania (Maur) samples, which was also evidenced by the
absence of shared haplotypes between these samples.
The structure obtained trough BAPS analysis (Figure 5.5) revealed three different
clusters, represented by blue, red and green vertical bars. Whereas the green cluster
is present in all samples, the blue one occurs only in France Bay of Biscay (FBBy)
sample, corroborating the pattern obtained in the network. The presence of the red
cluster only in Portugal-Centre (PC) and Mauritania (Maur) samples is concordant with
the non-significance of the ΦST value exhibited in the pairwise analysis of genetic
differences between these two samples.

Genetic Diversity and Population Structure of Two Sympatric Soles
116
Figure 5.5. Population structure obtained with BAPS in S. senegalensis populations.
Each colour corresponds to a different cluster. Legend: FBBy – France Bay
of Biscay; PC – Portugal-Centre; PN – Portugal-North; PS – Portugal-
South; Maur – Mauritania.
DISCUSSION
High genetic variation (h) and low to moderate nucleotide diversity (π) were found in
all samples of S. solea and S. senegalensis analysed, except for Portugal-North sample
of S. senegalensis. The values obtained for both diversity indices were similar to those
obtained for another flatfish species, plaice, in the Atlantic area (Hoarau et al., 2004)
and are characteristic of species with wide geographic distribution areas.
Significant genetic differentiation was detected, to S. solea, at an interregional scale,
mainly between two major groups of populations, the Atlantic and the Mediterranean,
whereas little or no differentiation could be detected beneath that scale. The
geographical distance between these two major areas seems to be the main cause
underlying the genetic differentiation found, evidencing a clear relationship between
geographical distances and genetic differentiation. These results are, therefore, in
agreement with the existence of an isolation by distance model (IBD), as suggested in
Kotoulas et al. (1995).
Low levels of differentiation from the Baltic Sea to Portugal-South exhibited by S.
solea populations, supported by low ΦST values and high number of shared haplotypes
by Atlantic populations, with no particular geographical organization, were also
F BB y
Ma u r
PC
PN
PS

CHAPTER 5
117
obtained for other flatfishes (e.g. Borsa et al., 1997; Hoarau et al., 2002; Nielsen et
al., 2004), and also for other marine fishes (Viñas et al., 2004). According to Kotoulas
et al. (1995), S. solea populations from the Atlantic region are expected to constitute
panmictic or quasi-panmictic units (structural units that occur in neighbouring
localities within a radius of 100 km), presenting high levels of gene flow that,
presumably, occur each generation through the gathering of individuals from different
areas of spawning, and the passive diffusion of eggs and larvae back to coastal and
estuarine nursery areas. In general, marine species seem to be more genetically
variable than anadromous and freshwater species (Dewoody and Avise, 2000) and at
the same time, less differentiated into populations (Ward, 2002). In the light of these
considerations, the absence of genetic differentiation among S. solea samples
throughout the NE Atlantic was not unexpected, as well as the absence of correlation
between geographical distances and genetic differentiation of samples.
Separation between Atlantic and Mediterranean S. solea populations can be explained
by the colonization of the Mediterranean, from the Atlantic, during the early Pliocene
and their settlement there since then, which is consistent with conclusions of
Mediterranean biogeographers (Klausewitz, 1973; Quignard, 1978). Thus, an
interruption of gene flow between these populations, probably due to the major
oceanographic discontinuity between these areas – the Gibraltar Strait-Alboran Sea
region – might be the reason for the exhibited pattern, that has already been reported
for other marine fish species (Bahri-Sfar et al., 2000; Zardoya et al., 2004; Charrier et
al., 2006).
Our results also support an eastward-westward differentiation among Mediterranean
populations of common sole, suggested which was in previously studies using
allozymes (Kotoulas et al., 1995), control region of mtDNA (Guarniero et al., 2002),
nuclear-DNA intronic loci markers (Rolland et al., 2007) and amplified fragment length
polymorphisms (AFLPs) (Garoia et al., 2007). Differentiation among such populations
could be due to the complex history of the Mediterranean that was strongly impacted
during last glacial episodes. During these periods the lower sea level modified coast
lines, creating distinct refuges in the Mediterranean and allowing the splitting of the
eastern and western basins; since then, they present different hydrographic regimes,
the western one being much more uniform than the eastern one because of their
respective geographies (Bahri-Sfar et al., 2000). The possible partial recolonization by
populations from the Atlantic can, therefore, also be an explanation for the detected
differentiation within the Mediterranean (Rolland et al., 2007). These differences have
also been attributed to larval temperature tolerances (Kotoulas et al., 1995; Borsa et
al., 1997) and to local adaptations to different salinities (Nielsen et al., 2004). The
Genetic Diversity and Population Structure of Two Sympatric Soles
118
present study excludes the geographical distances as a structuring force responsible
for the genetic differentiation within the Mediterranean, since the Mantel test
performed, considering only Mediterranean populations revealed the absence of a
significant correlation between genetic and geographical distances. This
“Mediterranean division” has also been reported in other marine fishes (Bahri-Sfar et
al., 2000; Suzuki et al., 2004).
For S. senegalensis, geographical distance, it seems important for the structuring of
populations. This association appeared to be highly related with latitudinal differences
between samples, since more geographically distant S. senegalensis populations, such
as France Bay of Biscay and Mauritania, showed the highest pairwise ΦST value,
absence of shared haplotypes in the network and unique clusters in BAPS analysis.
Results obtained for the geographically closest S. senegalensis populations, such as
those from the Portuguese coast – North, Centre and South – presented no genetic
differentiation at all, and shared the most common haplotype present in the minimum
spanning network of this species. These results are in agreement with those obtained
by Cabral et al. (2003) using allozymes, which detected the absence of genetic
differentiation throughout the Portuguese coast. Considering the strong association
obtained between geographic distances and genetic distances, a significant IBD model,
confirmed by the Mantel test would be expected. However, the resulting correlation
coefficient was high, but not significant, probably due to the reduced number of
populations analysed and/or to a low sample size. The importance of geographical
distances per se, acting as a structuring force in NE Atlantic populations, has been
found in other marine fishes such as cod (Hutchinson et al., 2001), plaice (Hoarau et
al., 2002) and Atlantic herring (Mariani et al., 2005). A weak pattern of isolation by
distance along a latitudinal axis was also found in European flounder, from the
Western Baltic Sea to Portugal (Borsa et al., 1997).
Considering the NE Atlantic area, S. solea and S. senegalensis occur in simpatry from
Bay of Biscay to North Africa. Since both species present similar life history pattern (a
division into a juvenile phase, predominantly estuarine and an adult phase, marine,
that may have an impact on the structuring of offshore adult populations, particularly
on their genetic differentiation, since a strong association between a particular
spawning and nursery area can be expected), similar patterns of genetic
differentiation throughout their simpatry area were, somehow, expected. However the
level of genetic differentiation obtained for each species was different, with S. solea
samples presenting genetic homogeneity, conversely to significant genetic
differentiation among S. senegalensis samples, contradicting the assumption that
marine organisms capable of extensive dispersal (those that undergo lengthy

CHAPTER 5
119
planktonic larval development) will necessarily demonstrate widespread genetic
homogeneity (Exadactylos et al., 1998).
The low genetic differentiation exhibited by S. solea compared to S. senegalensis, can
be due to a high genetic flow between populations at different stages of their life
cycles, namely adult migration between spawning grounds and juvenile dispersion
after the estuarine phase. Other authors suggest that the larval period is the most
important in this context, with genetic flow increasing with the duration of the pelagic
larval period. This latter fact should lead to lower values of genetic differentiation in S.
senegalensis relatively to S. solea, when analysing samples from the same
geographical area, since this species presents a wider spawning period (e.g. Dinis et
al., 1999; Anguis and Cañavate, 2005).
For the sustainable use of biological resources in the coastal zone are necessary
strategies for conservation for maintenance of fisheries in these regions. Because
species are not homogeneous, but structured in groups of individuals that are more or
less isolated from another, it is necessary that biological sustainable management will
be based on knowledge on population genetic structure. The identification of
genetically homogeneous groups of individuals constitutes the basic unit for
conservation, management and sustainable use.
Soles are the most important species group in Portuguese flatfish fisheries, but are not
assessed. This situation is of deep concern, since a decreasing trend in LPUE have
been determined for the period between 1992 and 2005 (Teixeira and Cabral, 2009).
Also, since the species are not usually sorted at species level at fish houses, it is
extremely difficult to evaluate if restrictive measures (net and mesh sizes, minimum
legal size and Total Allowable Captures – TAC) are being effective.
In conclusion, because S. solea represented one unit in NE Atlantic, and because no
evaluations of the exploitation status of flatfish stocks exist in Portugal, there are
strong concerns and probably overexploitation of these resources, based on the
evidences reported by Teixeira and Cabral (2009) to this fishery in the Portuguese
coast, as well as in information for the adjoining areas (North coast of Spain and
France), it is urgent to adopt the same management measures to all stock.

Genetic Diversity and Population Structure of Two Sympatric Soles
120
ACKNOWLEDGEMENTS
This study was partially financed by the Fundação para a Ciência e a Tecnologia (FCT),
through the grant attributed to C.M. Teixeira (Grant SFRH/BD/19319/2004). This
study was also co-funded by the European Union through the FEDER–Fisheries
Programme (MARE).
REFERENCES
Anguis, V., Cañavate, J.P., 2005. Spawning of captive Senegal sole (Solea senegalensis)
under a naturally fluctuating temperature regime. Aquaculture 243(1-4), 133–145.
Bahri-Sfar, L., Lemaire, C., Ben Hassine, O.K., Bonhomme, F., 2000. Fragmentation of sea
bass populations in the western and eastern Mediterranean as revealed by
microsatellite polymorphism. Proceedings of the Royal Society B: Biological Sciences B
267, 929–935.
Bailey, K.M., 1997. Structural dynamics and ecology of flatfish populations. Journal of Sea
Research 37, 269–280.
Bandelt, H., Forster, P., Rohl, A., 1999. Median-Joining Networks for Inferring Intraspecific
Phylogenies. Molecular Biology and Evolution 16(1), 37–48.
Borsa, P., Blanquer, A., Berrebi, P., 1997. Genetic structure of the flounders Platichthys
flesus and P. stellatus at different geographic scales. Marine Biology 129, 233–246.
Borsa, P., Quignard, J.P., 2001. Systematics of the Atlantic-Mediterranean soles Pegusa
impar, P. lascaris, Solea aegyptiaca, S. senegalensis, and S. solea (Pleuronectiformes:
Soleidae). Canadian Jornal of Zoology 79, 2297–2302.
Cabral, H.N., Castro, F., Linhares, D., Alexandrino, P., 2003. Genetic differentiation of
Solea solea (Linnaeus, 1758) and S. senegalensis Kaup, 1858, (Pisces:
Pleuronectiformes) from several estuarine systems of the Portuguese coast. Scientia
Marina 67, 43–52.
Carvalho, G.R., Hauser, L., 1995. Molecular genetics and the stock concept in fisheries. In:
Carvalho, G.R., Pitcher, T.J. (eds.). Molecular genetics in fisheries. Chapman and Hall,
pp. 55–79.
Charrier, G., Chenel, T., Durand, J.D., Girard, M., Quiniou, L., Laroche, J., 2006.
Discrepancies in phylogeographical patterns of two European anglerfishes (Lophius
budegassa and Lophius piscatorius). Molecular Phylogenetics and Evolution 38(3), 742–
754.

CHAPTER 5
121
Corander, J., Tang, J., 2007. Bayesian analysis of population structure based on linked
molecular information. Mathematical Biosciences 205(1), 19–31.
DeWoody, J.A., Avise, J.C., 2000. Microsatellite variation in marine, freshwater and
anadromous fishes compared with other animals. Journal of Fish Biology 56, 461–473.
Dinis, M.T., Ribeiro, L., Soares, F., Sarasquete, C., 1999. A review on the cultivation
potential of Solea senegalensis in Spain and in Portugal. Aquaculture 176, 27–38.
Exadactylos, A., Geffen, A.J., Thorpe, J.P., 1998. Population structure of the Dover sole,
Solea solea L., in a background of high gene flow. Netherlands Journal of Sea Research
40, 117–129.
Exadactylos, A., Geffen, A.J., Panagiotaki, P., Thorpe, J.P., 2003. Population structure of
Dover sole Solea solea: RAPD and allozyme data indicate divergence in European
stocks. Marine Ecology Progress Series 246, 253–264.
Excoffier, L., Smouse, P.E., Quattro, J.M., 1992. Analysis of molecular variance inferred
from metric distances among DNA haplotypes: Application to human mitochondrial DNA
restriction data. Genetics 131, 479–491.
Excoffier, L., Laval, G., Schneider, S., 2005. Arlequin ver. 3.0: An integrated software
package for population genetics data analysis. Evolutionary Bioinformatics Online 1,
47–50.
Garoia, F., Guarniero, I., Grifoni, D., Marzola, S., Tinti, F., 2007. Comparative analysis of
AFLPs and SSRs efficiency in resolving population genetic structure of Mediterranean
Solea vulgaris. Molecular Ecology 16, 1377–1387.
Guarniero, I., Franzellitti, S., Ungaro, N., Tommasini, S., Piccinetti, C., Tinti, F., 2002.
Control region haplotype variation in the central Mediterranean common sole indicates
geographical isolation and population structuring in Italian stocks. Journal of Fish
Biology 60, 1459–1474.
Hoarau, G., Rijnsdorp, A.D., van der Veer, H.W., Stam, W.T., Olsen, J.L., 2002. Population
structure of plaice (Pleuronectes platessa L.) in northern Europe: microsatellites
revealed large scale spatial and temporal homogeneity. Molecular Ecology 11, 1165–
1176.
Hoarau, G., Piquet, A.M.T., van der Veer, H.W., Rijnsdorp, A.D., Stam, W.T., Olsen, J.L.,
2004. Population structure of plaice (Pleuronectes platessa L.) in northern Europe: a
comparison of resolving power between microsatellites and mitochondrial DNA data.
Journal Sea Research 51, 183–190.
Hutchinson, W.F., Carvalho, G.R., Rogers, S.I., 2001. Marked genetic structuring in
localised spawning populations of cod Gadus morhua in the North Sea and adjoining
waters, as revealed by microsatellites. Marine Ecology Progress Series 223, 251–260.
Infante, C., Catanese, G., Manchado, M., 2004. Phylogenetic Relationships Among Ten Sole
Species (Soleidae, Pleuronectiformes) from the Gulf of Cádiz (Spain) Based on
Mitochondrial DNA Sequences. Marine Biotechnology 6, 612–624.

Genetic Diversity and Population Structure of Two Sympatric Soles
122
Klausewitz, W., 1973. New aspects of the paleogeography of the Mediterranean
ichthyofauna. Ichthyologia 5, 79–86
Kotoulas, G., Bonhomme, F., Borsa, P., 1995. Genetic structure of the common sole Solea
vulgaris at different geographic scales. Marine Biology 122, 361–375.
Maddison, W.P., Maddison, D.R., 1989. Interactive analysis of phylogeny and character
evolution using the computer program MacClade. Folia Primatologica 53(1-4), 190–
202.
Mantel, N., 1967. The detection of disease clustering and a generalized regression
approach. Cancer Research 27, 209–220.
Mariani, S., Hutchinson, W.F., Hatfield, E.M.C., Ruzzante, D.E., Simmonds, E.J., Dahlgren,
T.G., André, C., Brigham, J., Torstensen, E., Carvalho, G.R., 2005. North Sea herring
population structure as revealed by microsatellite analysis. Marine Ecology Progress
Series 303, 245–257.
Nei, M., 1987. Molecular Evolutionary Genetics. Columbia University Press.
Nielsen, E.E., Nielsen, P.H., Meldrup, D., Hansen, M.M., 2004. Genetic population structure
of turbot (Scophthalmus maximus L.) supports the presence of multiple hybrid zones
for marine fishes in the transition zone between the Baltic Sea and the North Sea.
Molecular Ecology 13, 585–595.
Pardo, B.G., Machordom, A., Foresti, F., Porto-Foresti, F., Azevedo, M.F.C., Bañon, R.,
Sánchez, L., Martínez, P., 2005. Phylogenetic analysis of flatfish (Order
Pleuronectiformes) based on mitochondrial 16s rDNA sequences. Scientia Marina 69(4),
531–543.
Pauly, D., 1994. A framework for latitudinal comparisons of flatfish recruitment. Journal of
Sea Research 32, 107–118.
Pawson, M.G., Jennings, S., 1996. A critique of methods for stock identification in marine
capture fisheries. Fisheries Research 25, 203–217.
Posada, D., Crandall, K.A., 1998. MODELTEST: testing the model of DNA substitution.
Bioinformatics 14, 817–818.
Quignard, J.P., 1978. Introduction a l’ichthyologie méditerranéenne: aspect general du
peuplement. Bulletin de l'Office national de Pêche Tunisie 2, 3–21.
Rolland, J.L., Bonhomme, F., Lagardère, F., Hassan, M., Guinand, B., 2007. Population
structure of the common sole (Solea solea) in the Northeastern Atlantic and the
Mediterranean Sea: revisiting the divide with EPIC markers. Marine Biology 151(1),
327–341.
Rozas, J., Sánchez-DelBarrio, J.C., Messeguer, X., Rozas, R., 2003. DnaSP, DNA
polymorphism analyses by the coalescent and other methods. Bioinformatics 19, 2496–
2497.
Smouse, P.E., Long, J.C., Sokal, R.R., 1986. Multiple regression and correlation extensions
of the Mantel test of matrix correspondence. Systematic Zoology 35, 627–632.
CHAPTER 5
123
Suzuki, N., Nishida, M., Yoseda, K., Üstündağ, C., Şahin, T., Amaoka, K., 2004.
Phylogeographic relationships within the Mediterranean turbot inferred by
mitochondrial DNA haplotype variation. Journal of Fish Biology 65, 580–585.
Teixeira, C.M., Cabral, H.N., 2009. Time series analysis of flatfish landings in the
Portuguese coast. Fisheries Research 96, 252–258.
Viñas, J., Alvarado Bremer, J., Pla, C., 2004. Phylogeography of the Atlantic bonito (Sarda
sarda) in the northern Mediterranean: the combined effects of historical vicariance,
population expansion, secondary invasion, and isolation by distance. Molecular
Phylogenetics and Evolution 33, 32–42.
Ward, R.D., 2002. Genetics of fish populations. In: Hart, P.J.B., Reynolds, J.D. (eds.).
Handbook of Fish Biology and Fisheries. Blackwell Publishing, pp. 200–224.
Ward, R.D., Woodwark, M., Skibinski, D.O.F., 1994. A comparison of genetic diversity
levels in marine, freshwater, and anadromous fishes. Journal of Fish Biology 44, 213–
232.
Wasko, A., Martins, C., Oliveira, C., Foresti, F., 2003. Non-destructive genetic sampling in
fish. An improved method for DNA extraction from fish fins and scales. Hereditas 138,
161–165.
Wirgin, I.I., Waldman, J.R., 1994. What DNA can do for you? Fisheries 19, 16–27.
Wright, S., 1969. Evolution and the genetics of populations. v.2. The theory of gene
frequencies. The University of Chicago Press.
Zardoya, R., Castilho, R., Grande, C., Favre-Krey, L., Caetano, S., Marcato, S., Krey, G.,
Patarnello, T., 2004. Differential population structuring of two closely related fish species,
the mackerel (Scomber scombrus) and the chub mackerel (Scomber japonicus), in the
Mediterranean Sea. Molecular Ecology 13, 1785–1798.


PART III
Stock Assessment and
Fisheries


CHAPTER 6
Time series analysis of flatfish landings in the Portuguese coast
Fisheries Research 2009, 96, 252–258
By Teixeira, C.M., Cabral, H.N.


CHAPTER 6
129
Time series analysis of flatfish landings in the
Portuguese coast
ABSTRACT: Flatfish fisheries are widely spread over the Portuguese coast and traditionally have a high
social and economical relevance in some coastal communities. The artisanal multi-gear fleet is responsible
for the largest share of flatfishes landings. However, only a fraction of these vessels actively target
flatfishes, since many other species are caught in these multi-species fisheries. To explain the variability of
flatfish landings we used the data set of official landings of commercially important flatfish species (monthly
landings values, from 1992 to 2005) and applied generalized linear models (GLM) using the NAO index
(NAO), sea surface temperature (SST), scalar wind (WIND), rainfall (RAIN) and month as explanatory
variables. Flatfish landings did not showed a common trend for different species group between 1992 and
2005. For the majority of the species, significant relationships were found between month and SST and
landings per unit effort (LPUE). The seasonal pattern in LPUE reflected migrations to spawning grounds,
when flatfishes concentrate in some areas of the continental shelf and become more vulnerable to fishery.
Temporal closures should be implemented for the stocks that evidence overexploitation. More studies
focused in species abundance and fishing effort estimation are necessary on Portuguese flatfish fisheries in
order to determine the status of stocks and adopt adequate management measures.
KEYWORDS:
flatfish, landings, stock assessment, environmental factors, fisheries management,
Portugal
INTRODUCTION
Fishing is a traditional and culturally important activity in Portugal, being dominated
by small fishing vessels (Baeta and Cabral, 2005). Flatfish fisheries are widely spread
over the Portuguese coast and traditionally have played and important socio-economic
role. Flatfish landings account for less than 4% of all the fish biomass landed in the
Portuguese coast. However, the importance of flatfish fisheries is considerable higher
due to the high commercial value of flatfish species, accounting for almost 11% of the
economical value of fish landings (source: DGPA).
Time Series Analysis of Flatfish Landings
130
The most important species, in terms of landings, are the soles, Solea solea (Linnaeus,
1758), Solea senegalensis Kaup, 1858, and Solea lascaris (Risso, 1810), the bastard
sole, Microchirus azevia (Capello, 1868), the flounder, Platichthys flesus (Linnaeus,
1758), the spotted flounder, Citharus linguatula (Linnaeus, 1758), the wedge sole,
Dicologlossa cuneata (Moreau, 1881), the turbot, Scophthalmus maximus (Linnaeus,
1758), the brill, Scophtahlmus rhombus (Linnaeus, 1758), and the megrims,
Lepidorhombus boscii (Risso, 1810) and Lepidorhombus whiffiagonis (Walbaum,
1792). The artisanal multi-gears fleet is responsible for the largest share of flatfishes
landings. However, only a fraction of these vessels actively target flatfishes, since
many other species are caught in this multi-species fishery. The main fishing gears
used in flatfish fisheries are trammel and gill nets and bottom trawl.
Regular fluctuations in the stocks and catches of abundant fish species have been
documented in many of the world’s oceans (e.g. Cushing, 1996; Klyashtorin, 1998;
Ménard et al., 2007). Climatic oscillations, anomalies or changes clearly affect
population dynamics and several ecological processes in marine ecosystems (e.g.
Walther et al., 2002; Stenseth et al., 2004; Duffy-Anderson et al., 2005). The wind
regime (e.g. Schwartzlose et al., 1999; Borges et al., 2003) and changes in sea
surface temperature (e.g. Fox et al., 2000; Zuur and Pierce, 2004; Désaunay et al.,
2006) play a key role in the ecological effects of climate fluctuations. But variations in
population abundance are very often associated with large-scale climate indices such
as the North Atlantic Oscillation (NAO) or the Southern Oscillation Index (SOI)
(Ottersen et al., 2001; Stenseth et al., 2004). They do not have necessarily a strong
link with local weather condition (Stenseth et al., 2003), but they can be good
predictors of ecological processes (Hallett et al., 2004).
The main aim of this work is to analyse the main trends in commercial flatfish landings
in the Portuguese coast, their relationships with key environmental factors and to
evaluate possible implications for the management of these resources.
MATERIALS AND METHODS
Data Source
The data set use in this study was composed of LPUE monthly data, by flatfish species
group, from 1992 to 2005, obtained from the Governmental Fisheries Bureau
(Direcção Geral das Pescas e Aquicultura – DGPA). The species groups considered
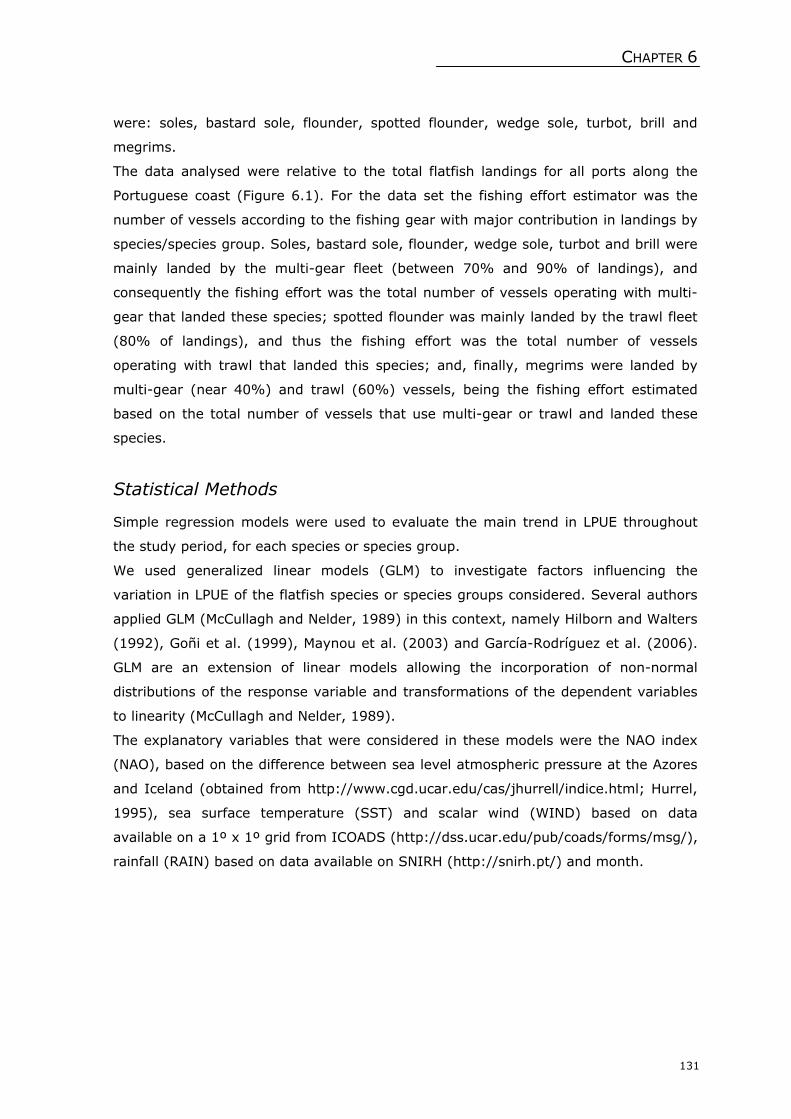
CHAPTER 6
131
were: soles, bastard sole, flounder, spotted flounder, wedge sole, turbot, brill and
megrims.
The data analysed were relative to the total flatfish landings for all ports along the
Portuguese coast (Figure 6.1). For the data set the fishing effort estimator was the
number of vessels according to the fishing gear with major contribution in landings by
species/species group. Soles, bastard sole, flounder, wedge sole, turbot and brill were
mainly landed by the multi-gear fleet (between 70% and 90% of landings), and
consequently the fishing effort was the total number of vessels operating with multi-
gear that landed these species; spotted flounder was mainly landed by the trawl fleet
(80% of landings), and thus the fishing effort was the total number of vessels
operating with trawl that landed this species; and, finally, megrims were landed by
multi-gear (near 40%) and trawl (60%) vessels, being the fishing effort estimated
based on the total number of vessels that use multi-gear or trawl and landed these
species.
Statistical Methods
Simple regression models were used to evaluate the main trend in LPUE throughout
the study period, for each species or species group.
We used generalized linear models (GLM) to investigate factors influencing the
variation in LPUE of the flatfish species or species groups considered. Several authors
applied GLM (McCullagh and Nelder, 1989) in this context, namely Hilborn and Walters
(1992), Goñi et al. (1999), Maynou et al. (2003) and García-Rodríguez et al. (2006).
GLM are an extension of linear models allowing the incorporation of non-normal
distributions of the response variable and transformations of the dependent variables
to linearity (McCullagh and Nelder, 1989).
The explanatory variables that were considered in these models were the NAO index
(NAO), based on the difference between sea level atmospheric pressure at the Azores
and Iceland (obtained from http://www.cgd.ucar.edu/cas/jhurrell/indice.html; Hurrel,
1995), sea surface temperature (SST) and scalar wind (WIND) based on data
available on a 1º x 1º grid from ICOADS (http://dss.ucar.edu/pub/coads/forms/msg/),
rainfall (RAIN) based on data available on SNIRH (http://snirh.pt/) and month.

Time Series Analysis of Flatfish Landings
132
Figure 6.1. Map of mainland Portugal landing ports (1. Caminha; 2. Viana do Castelo; 3.
Póvoa do Varzim; 4. Leixões; 5. Aveiro; 6. Figueira da Foz; 7. Nazaré; 8.
Peniche; 9. Lisboa; 10. Sesimbra; 11. Setúbal; 12. Sines; 13. Sagres; 14.
Portimão; 15. Quarteira; 16. Faro; 17. Olhão; 18. Tavira; 19. Vila Real de
Santo António).
For the oceanographic and climate variables a time-lag of 2 years was considered,
since their effect is mainly registered in early life stages, influencing recruitment
success. This time-lag was based on the available knowledge on age at first maturity
for each species (e.g. Deniel, 1981; Andrade, 1990; Garcia-Rodriguez and Esteban,
2000; Anonymous, 2006).
The general form of GLM is
g(μ) = βtx
whereby a function link g(·) is used to achieve linearity in the parameters βt of the
dependent variable x.
ATLA
NTIC
OCEAN
41ºN
39ºN
37ºN 200 m
PORTU
GAL
200 m
10ºW 8ºW
6
19
4
12
8
12
3
5
7
9
1011
13 14 1516
1718

CHAPTER 6
133
A second part of the model is the specification of a variance function (φ) that relates
the variance of the response variable to the mean:
Var(Y) = φV(μ), with φ constant
Catch rates (Uymtwrn) were modelled as a function of year (y), month (m), sea surface
temperature (t), scalar wind (w), rainfall (r) and North Atlantic oscillation (n).
The general model used was:
log(μymtwrn) = log(E(Uymtwrn))
= μ0 + β1y + β2
m + β3t + β4
w + β5r+ β6
n
where βt is the parameter set relating the dependent variables to the response, using
a log-link function and a gamma distribution for the response variable.
The correct procedure in any analysis to account for the level of catch rates when a
species is captured is classified in two categories: zero values and non-zero values.
When zero values are eliminated, it is seen that data may be close to lognormal, which
implies that a lognormal or gamma distribution may be appropriate for positive values
(Stefánsson, 1996). The results of Myers and Pepin (1990) suggested that the use of
the gamma density is preferable to the use of a lognormal density for fisheries data,
although this seems to apply mainly when there is a considerable probability of small
observations, not dealt with otherwise (Pennington, 1991) and, in other instances, the
gain is minor (Firth, 1988). Although other members of the exponential family could
be used, the gamma density is used here when the positive values are under
consideration.
The goodness-of-fit of the models was assessed by comparing their relative
contribution to total deviance explained. The model was fitted in R environment (R
Development Core Team, 2005) using a gamma distribution with a log-link function,
adding the first order interactions whenever considered adequate.
All statistical analyses were performed using R software (R Development Core Team,
2005). A significance level of 0.05 was considered in all test procedures.
RESULTS
Considering the models that used the monthly landings data, from 1992 to 2005, a
decreasing trend was observed for soles landings, with the highest LPUE value
registered in 1993 (0.14 tonnes vessel-1) (Figure 6.2a). SST and month were the most

Time Series Analysis of Flatfish Landings
134
important explanatory variables (29.66% and 15.89% of variance explained,
respectively), and the model explained 51.32% of the deviance (Table 6.1). Highest
LPUE were obtained for low SST values (Figure 6.3a). These species were mainly
landed in winter months (Figure 6.4a).
(a) (b)
(c) (d)
(e) (f)
(g) (h)
Figure 6.2.
Monthly landings per unit effort (LPUE) of flatfishes species or species groups
in the Portuguese coast, between 1992 and 2005. (a) Soles; (b) bastard sole;
(c) flounder; (d) spotted flounder; (e) wedge sole; (f) turbot; (g) brill; (h)
megrims.
0.00
0.02
0.04
0.06
0.08
0.10
0.12
0.14
0.16
1992
1993
1994
1995
1996
1997
1998
1999
2000
2001
2002
2003
2004
2005
LPU
E (t
onne
s ve
ssel
-1)
Year
0
0.01
0.02
0.03
0.04
0.05
0.06
0.07
1992
1993
1994
1995
1996
1997
1998
1999
2000
2001
2002
2003
2004
2005
LPU
E (t
onne
s ve
ssel
-1)
Year
0
0.01
0.02
0.03
0.04
0.05
0.06
0.07
1992
1993
1994
1995
1996
1997
1998
1999
2000
2001
2002
2003
2004
2005
LPU
E (t
onne
s ve
ssel
-1)
Year
0
0.1
0.2
0.3
0.4
0.5
0.6
1992
1993
1994
1995
1996
1997
1998
1999
2000
2001
2002
2003
2004
2005
LPU
E (t
onne
s ve
ssel
-1)
Year
0.000
0.005
0.010
0.015
0.020
0.025
1992
1993
1994
1995
1996
1997
1998
1999
2000
2001
2002
2003
2004
2005
LPU
E (t
onne
s ve
ssel
-1)
Year
0.000
0.002
0.004
0.006
0.008
0.010
0.012
1992
1993
1994
1995
1996
1997
1998
1999
2000
2001
2002
2003
2004
2005
LPU
E (t
onne
s ve
ssel
-1)
Year
0.0000.0010.0020.0030.0040.0050.0060.0070.0080.0090.010
1992
1993
1994
1995
1996
1997
1998
1999
2000
2001
2002
2003
2004
2005
LPU
E (t
onne
s ve
ssel
-1)
Year
v
0.000
0.001
0.002
0.003
0.004
0.005
0.006
0.007
0.008
1992
1993
1994
1995
1996
1997
1998
1999
2000
2001
2002
2003
2004
2005
LPU
E (t
onne
s ve
ssel
-1)
Year

CHAPTER 6
135
Bastard sole landings showed an increasing trend throughout the period considered.
The highest LPUE value was registered in 2000 (0.06 tonnes vessel-1) (Figure 6.2b).
SST and rainfall were the most important explanatory variables (23.91% and 4.11%
of variance explained, respectively), and the model explained 30.65% of the deviance
(Table 6.1). Highest LPUE were obtained for low SST values (Figure 6.3b).
Flounder landings showed a increasing trend between 1992 and 2005. The highest
LPUE value was recorded in 2003 (0.07 tonnes vessel-1) (Figure 6.2c). SST and month
were the most important explanatory variables (37.92% and 16.08% of variance
explained, respectively), and the model explained 65.20% of the deviance (Table 6.1).
The highest LPUE were obtained for low SST values (Figure 6.3c). This species was
mainly landed in autumn and winter (Figure 6.4b).
(a) (b)
(c) (d)
Figure 6.3. Relationships between landings per unit effort (LPUE) of soles (a), bastard
sole (b), flounder (c), brill (d) and SST.
Spotted flounder landings evidenced a decreasing trend between 1992 and 2005. The
LPUE highest value was registered in 1992 (0.51 tonnes vessel-1) (Figure 6.2d). Month
was the most important predictor for this species (5.33%), and rainfall was also
significant (4.72%). The model explained 12.16% of the deviance (Table 6.1). This
species is mainly landed in autumn and winter (Figure 6.4c).
Wedge sole landings showed a decreasing trend between 1995 and 2005. The major
LPUE value was registered in 1995 (0.02 tonnes vessel-1) (Figure 6.2e). For this
species none of the predictors used showed to be significant.
0.00
0.02
0.04
0.06
0.08
0.10
0.12
0.14
0.16
13.0 14.0 15.0 16.0 17.0 18.0 19.0 20.0 21.0 22.0 23.0
SST (ºC)
LPU
E (t
onne
s ve
ssel
-1)
0.00
0.01
0.02
0.03
0.04
0.05
0.06
0.07
13.0 14.0 15.0 16.0 17.0 18.0 19.0 20.0 21.0 22.0 23.0
SST (ºC)
LPU
E (t
onne
s ve
ssel
-1)
0.00
0.01
0.02
0.03
0.04
0.05
0.06
0.07
13.0 14.0 15.0 16.0 17.0 18.0 19.0 20.0 21.0 22.0 23.0SST (ºC)
LPU
E (t
onne
s ve
ssel
-1)
0.000
0.002
0.004
0.006
0.008
0.011
13.0 14.0 15.0 16.0 17.0 18.0 19.0 20.0 21.0 22.0 23.0
SST (ºC)
LPU
E (t
onne
s ve
ssel
-1)

Time Series Analysis of Flatfish Landings
136
Table 6.1. Goodness-of-fit statistics for the GLMs fitted to LPUE flatfishes groups (values
of deviance for each factor, residual deviance (Res. Dev.), percentage of the
total deviance explained by each factor (% Expl.), and p-values are
presented).
Predictor p-value Res. Dev. Deviance % Expl.
NULL 23.941
Main Effects
Month 4.38E-07 20.136 3.805 15.893
NAO 0.003 19.772 4.169 1.520
SST <2E-16 12.672 11.269 29.656
Scalar wind 0.042 12.098 11.843 2.398
Rainfall 0.007 11.942 11.999 0.652
Interactions
Month : SST 0.012 11.499 12.442 1.849
NAO : Scalar wind 0.049 11.386 12.555 0.471
Soles
Total explained 51.317
NULL 34.797
Main Effects SST 1.36E-11 26.478 8.319 23.907 Rainfall 3.38E-05 25.047 9.750 4.112
Interactions SST : Rainfall 0.013 24.130 10.667 2.635
Bastard sole
Total explained 30.654
NULL 90.981
Main Effects Month 9.52E-06 76.350 14.631 16.081 NAO 6.49E-04 74.204 16.777 2.359 SST <2E-16 39.708 51.273 37.916 Rainfall 7.32E-04 37.588 53.393 2.330
Interactions Month : SST 6.36E-10 30.582 60.399 6.506
Flounders
Total explained 65.195
NULL 27.039
Main Effects Month 0.003 25.597 1.442 5.333 Scalar wind 0.040 25.027 2.012 2.108 Rainfall 8.47E-04 23.750 3.289 4.723
Spotted flounder
Total explained 12.164
NULL 31.732
Main Effects Month 9.14E-05 29.000 2.732 8.609 SST 5.11E04 28.379 3.353 1.958
Turbot
Total explained 10.567
NULL 28.499
Main Effects Month 7.35E-10 21.853 6.646 23.320 NAO 0.008 21.634 6.865 0.768 SST <2E-16 12.816 15.683 30.941 Rainfall 0.022 12.815 15.684 0.004
Interactions Month : SST 0.004 12.107 16.392 2.484 SST : Rainfall 0.043 12.091 16.408 0.056
Brill
Total explained 56.746
NULL 95.402
Main Effects Month 0.041 93.631 1.771 1.860
Megrims
Total explained 1.860

CHAPTER 6
137
For turbot landings an increasing trend was showed. The highest LPUE value was
registered in 2005 (0.01 tonnes vessel-1) (Figure 6.2f). Month (8.61%) and SST
(1.96%) were the most important explanatory variable, and the model explained
10.57% of the deviance (Table 6.1). This species was mainly landed in summer and
autumn (Figure 6.4d).
A decreasing trend was observed in brill landings values between 1992 and 2005. The
highest LPUE value was registered in 2005 (0.01 tonnes vessel-1) (Figure 6.2g). SST
was the most important predictor for this species (30.94%) and month was also
significant (23.32%). The model explained 56.75% of the deviance (Table 6.1).
Highest LPUE were obtained for low SST values (Figure 6.3d). This species was mainly
landed in summer and autumn (Figure 6.4e).
Megrims landings presented an increasing trend between 1992 and 2005. The LPUE
highest value was registered in 2004 (0.01 tonnes vessel-1) (Figure 6.2h). Month was
the most important predictor for this group (1.86%). The model explained 1.86% of
the deviance (Table 6.1). These species were mainly caught in summer and autumn
(Figure 6.4f).
Time Series Analysis of Flatfish Landings
138
(a) (b)
(c) (d)
(e) (f)
Figure 6.4. Landings per unit effort (LPUE) of flatfish species or group of species according
to month. (a) Soles; (b) flounder; (c) spotted flounder; (d) turbot; (e) brill;
(f) megrims.
DISCUSSION
The data used in fisheries management are often of poor quality. This is particularly
relevant when assessing and managing fleets that target a large number of resources
and use several fishing gears, as is the case of flatfish fisheries in Portugal. In the
present study, we used the only possible information to assess the fishing effort
(number of boats per fleet component), that, although being a proxy to the real effort,
is surely biased. Nonetheless, it is expected that the bias introduced when using this
estimator is presumably stable over a large number of years, which do not
compromise the trends obtained in the analyses, nor the interpretation of LPUE
0.00
0.02
0.04
0.06
0.08
0.10
0.12
0.14
0.16
0.18
1 2 3 4 5 6 7 8 9 10 11 12
LPU
E (t
onne
s ve
ssel
-1)
Month
0.00
0.01
0.02
0.03
0.04
0.05
1 2 3 4 5 6 7 8 9 10 11 12
LPU
E (t
onne
s ve
ssel
-1)
Month
0.00
0.10
0.20
0.30
0.40
0.50
0.60
0.70
0.80
1 2 3 4 5 6 7 8 9 10 11 12
LPU
E (t
onne
s ve
ssel
-1)
Month
0.000
0.001
0.002
0.003
0.004
0.005
0.006
0.007
0.008
0.009
0.010
1 2 3 4 5 6 7 8 9 10 11 12
LPU
E (t
onne
s ve
ssel
-1)
Month
0.000
0.001
0.002
0.003
0.004
0.005
0.006
0.007
0.008
0.009
1 2 3 4 5 6 7 8 9 10 11 12
LPU
E (t
onne
s ve
ssel
-1)
Month
0.000
0.001
0.002
0.003
0.004
0.005
1 2 3 4 5 6 7 8 9 10 11 12
LPU
E (t
onne
s ve
ssel
-1)
Month

CHAPTER 6
139
variability. Another source of bias was the use of landings, instead of catches. For
fishes with a high commercial value, like the majority of flatfishes, the amount of the
catches that is not landed, but sold directly in markets, can be high (it may reach 30%
to 40% in some seasons and areas). Thus landings are really subestimates of the
catches for these resources.
Flatfish landings showed an increasing trend in Portugal in the last decades, which has
also been reported all over Europe. In the last 50 years, the increase was near 40% in
Europe (228700 to 388783 tonnes) (source: FAO). In Portugal, this increase was even
more pronounced, reaching 70%: 394 tonnes, in the 1950; 1270 tonnes, in 2005
(source: DGPA).
Among the environmental factors considered in GLM, month and SST were the ones
for which significant relationships with LPUE were found for the large majority of the
species. A marked seasonal pattern of LPUE was found for most species or species
groups, which should be due to seasonal migrations towards spawning grounds (e.g.
Deniel, 1981; Andrade, 1990; Rijnsdorp et al., 1992), usually located at shallower
areas comparatively to the habitats used in other periods of the year. Several species
concentrate during spawning which can also promote high LPUE values, since
fishermen have that empirical knowledge (Petitgas et al., 2003).
SST was the most important predictor explaining soles, bastard sole, flounder and brill
landings. Temperature can have direct effects on survival, growth, and distribution of
marine organisms. Water temperature can also have indirect effects on production in
higher trophic levels by influencing primary or secondary production or may be
correlated with other variables that have direct effects on production (e.g. upwelling).
Temperature is a limiting factor to maturity and spawning (e.g. Rijnsdorp and
Vethaak, 1997; Sims et al., 2005), egg, (e.g. van der Land, 1991; Rijnsdorp and
Vingerhoed, 1994), larval (Campos et al., 1994) and juvenile development (e.g.
Wegner et al., 2003; Henderson and Seaby, 2005) of flatfish species. The effect of
water temperature also influences other trophic levels, namely phytoplankton,
zooplankton and benthic communities (Colebrook, 1982; Tunberg and Nelson, 1998).
Some authors (e.g. Salen-Picard et al., 2002; Vinagre et al., 2006; Nicolas et al.,
2007) suggested that fluctuations in demersal fisheries could be linked to fluctuations
in benthic resources. Benthos represent one of the most import prey of the soles,
bastard sole and flounder (e.g. Marinaro and Bouabid, 1983; Molinero et al., 1991;
Andersen et al., 2005) and an increase in food resources available to these flatfish
species may influence their distribution and abundance.
The relationships of LPUE and some of the environmental factors included in the GLM
were not significant, although its importance has been reported in other studies.

Time Series Analysis of Flatfish Landings
140
The NAO influences atmospheric variables such as wind speed and direction, air
temperature, sea surface temperature, and rainfall (Hurrell et al., 2003). Marine
productivity (Beaugrand and Reid, 2003), abundance of fishes (Attrill and Power,
2002) and recruitment (Ottersen et al., 2001) are also influenced by NAO. During the
low NAO periods, higher temperatures result in onshore drift promoting higher larval
retention inshore. Some authors have found correlations between NAO and
recruitment strength and abundance of sole (Henderson and Seaby, 2005), sardine
(Guisande et al., 2001), tuna (Borja and Santiago, 2001) and cod (Dippner and
Ottersen, 2001). Other authors who studied the influence of environmental factors on
abundance found correlations between upwelling events and larval success (Sanchéz
et al., 2003), and between wind and transport of eggs and larvae (Nakata et al.,
2000).
For some species considered in the present study, the variability in LPUE explained by
GLM was low (e.g. spotted flounder, wedge sole, turbot and megrims), which is
probably due to the fact that these species are bycatches of several fisheries and not
target species (Fonseca et al., 2005; ICES, 2007).
Scientific studies to sustain an improvement of management measures are scarce for
Portuguese flatfish fisheries. The knowledge about these fisheries does not reflect the
importance of these resources. Although some regulations exist concerning the total
allowable captures (TAC), fishing quotas and minimum legal size (MLS) for some
flatfish species and fishing areas, the application of technical conservation measures
and the mitigation of fishing effort was never essayed and these fisheries are mainly
unassessed and unmanaged.
The main goal of fisheries management has shifted from maximising yields to
maintaining sustainable fisheries, and for that purpose a reliable stock assessment and
management plan are an urgent need. In Portugal, only megrims have been assessed,
based on two indicators: fishing mortality and spawning stock biomass (SSB) (ICES,
2007); although megrims are not extremely important flatfish resources and are a
bycatch of anglerfish and hake fisheries (ICES, 2007). Soles are the most important
species group in Portuguese flatfish fisheries, but are not assessed. This situation is of
deep concern, since a decreasing trend in LPUE has been determined for the period
between 1992 and 2005.
Several authors discussed the management of flatfish fisheries (e.g. Daan, 1997; Rice
and Cooper, 2003; Kell et al., 2005). Some of the problems in the management of
Portuguese flatfish fisheries are the lack of assessment of resource abundance and the
limitation of management measures to net and mesh sizes, minimum legal size and
TAC. TAC have been proposed only for sole (S. solea) and megrims and are relative to

CHAPTER 6
141
wide geographical areas (ICES areas), being difficult to assign a certain quota to a
particular fishing fleet. Also, since the species are not usually sorted at species level at
fish houses, it is extremely difficult to evaluate if these restrictive measures are being
effective.
In this study we showed some species are mainly caught during the reproduction
season, when individuals concentrate in some areas of the continental shelf. Temporal
and spatial closures should be implemented for these stocks that evidence
overexploitation. The protection of nursery grounds (species such as soles or flounder
use estuarine systems and shallow coastal areas as nursery grounds) would also be
extremely important to the recovery of overexploited stocks.
Catches trends constitute a conceptually simple and meaningful indicator to
characterize fisheries status. Nonetheless, the use of this indicator to define
sustainability and to characterize the ‘health’ of fish stocks might be dangerous and
controversial (Mullon et al., 2005). In soles trammel nets fishery, the only possible
evaluation of stock is based on official landings data, which are incomplete. Thus,
measures to incentive fishermen to land an increasing fraction of fish caught should be
implemented. More studies focused in species abundance and fishing effort estimation
of Portuguese flatfish fisheries are necessary in order to determine the status of stocks
and adopt adequate management measures.
In conclusion, although no evaluations of the exploitation status of flatfish stocks exist
in Portugal, there are strong concerns and probably overexploitation of these
resources, based on evidences reported in this study, as well as in information for the
adjoining (North coast of Spain and France) and more distant geographical areas in
the North Atlantic (Rice and Cooper, 2003)
ACKNOWLEDGEMENTS
This study was partially funded by the Fundação para a Ciência e a Tecnologia (FCT),
through the grant attributed to C.M. Teixeira (Grant SFRH/BD/19319/2004). This
study was also co-funded by the European Union through the FEDER–Fisheries
Programme (MARE).

Time Series Analysis of Flatfish Landings
142
REFERENCES
Andersen, B.S., Carl, J.D., Grønkjær, P., Støttrup, J.G., 2005. Feeding ecology and growth
of age 0 year Platichthys flesus (L.) in a vegetated and a bare sand habitat in a
nutrient rich fjord. Journal of Fish Biology 66, 531–552.
Andrade, J.P.A.S., 1990. A importância da Ria Formosa no ciclo biológico de Solea
senegalensis Kaup 1858, Solea vulgaris Quensel 1806, Solea lascaris (Risso, 1810) e
Microchirus azevia (Capello, 1868). PhD Thesis, Universidade do Algarve, Portugal.
Anonymous, 2006. Megrim in the South West of the British Isles (ICES Divisions VII and
VIII).
Attrill, M.J., Power, M., 2002. Climatic influence on a marine fish assemble. Nature 417,
275-278.
Baeta, F., Cabral, H.N., 2005. Status of Portuguese Fisheries. Technical Report.
Oceanography Institute, School of Sciences of the University of Lisbon, 48 pp.
Beaugrand, G., Reid, P.C., 2003. Long-term changes in phytoplankton, zooplankton and
salmon related to climate. Global Change Biology 9, 1–17.
Borges, M.F., Santos, A.M.P., Crato, N., Mendes, H., Mota, B., 2003. Sardine regime shifts
off Portugal: a time series analysis of catches and wind conditions. Scientia Marina
67(1), 235–244.
Borja, A., Santiago, J., 2001. Does the North Atlantic Oscillation control some processes
influencing recruitment of temperate tunas? ICCAT SCRS/01/33, 19 pp.
Campos, W., Kloppmann, M., von Westernhagen, H., 1994. Inferences from the horizontal
distribution of dab Limanda limanda (L.) and flounder Platichthys flesus (L.) larvae in
the southeastern North Sea. Netherlands Journal of Sea Research 32(3/4), 277–286.
Colebrook, J.M., 1982. Continuous plankton records: phytoplankton, zooplankton and
environment, North-East Atlantic and North Sea, 1958-1980. Oceanologica Acta 5,
473-480.
Cushing, D.H., 1996. Towards a science of recruitment in fish populations. Inter-Research,
Oldendorf/Luhe.
Daan, N., 1997. TAC management in North Sea flatfish fisheries. Journal of Sea Research
37, 321–341.
Deniel, C., 1981. Les poissons plats (Téléostéens-Pleuronectiformes) en Baie de
Douarnenez. Reproduction, croissance et migration des Bothidae, Scophthalmidae,
Pleuronectidae et Soleidae. PhD Thesis. Université de Bretagne Occidentale, France.
Désaunay, Y., Guérault, D., Le Pape, O., Poulard, J.-C., 2006. Changes in occurrence and
abundance of northern/southern flatfishes over a 20-year period in a coastal nursery
area (Bay of Vilaine) and on the eastern continental shelf of the Bay of Biscay. Scientia
Marina 70S1, 193–200.

CHAPTER 6
143
Dippner, J., Ottersen, G., 2001. Cod and climate variability in the Barents Sea. Climate
Research 17, 73–82.
Duffy-Anderson, J.T., Bailey, K., Ciannelli, L., Cury, P., Belgrano, A., Stenseth, N.C., 2005.
Phase transitions in marine fish recruitment processes. Ecological Complexity 205–218.
Firth, D., 1988. Multiplicative errors: log-normal or gamma? Journal of the Royal Statistical
Society B 50, 266–268.
Fonseca, P., Martins, R., Campos, A., Sobral, P., 2005. Gill-net selectivity off the
Portuguese western coast. Fisheries Research 73(3), 323–339.
Fox, C.J., Planque, B.P., Darby, C.D., 2000. Synchrony in the recruitment time-series of
the plaice (Pleuronectes platessa L.) around the United Kingdom and the influence of
sea temperature. Journal of Sea Research 44, 159–168.
García-Rodríguez, Esteban, A., 2000. Contribution to the knowledge of Citharus linguatula
(Linnaeus, 1758) (Osteicthyes: Heterosomata) in the Iberian Mediterranean. Demersal
Resources in the Mediterranean. Actes des Colloques IFREMER 26, 131–140.
García-Rodríguez, M., Fernández, Á.M., Esteban, A., 2006. Characterisation, analysis and
catch rates of the small-scale fisheries of the Alicante Gulf (Spain) over a 10 years time
series. Fisheries Research 77, 226–238.
Goñi, R., Álvarez, F., Alderstein, S., 1999. Application of generalized linear modeling to
catch rate analysis of western Mediterranean: the Castellón trawl fleet as a case study.
Fisheries Research 42, 291–302.
Guisande, C., Cabanas, J.M., Vergara, A.R., Riveiro, I., 2001. Effect of climate on
recruitment success of Atlantic Iberian sardine Sardina pilchardus. Marine Ecology
Progress Series 223, 243–250.
Hallett, T.B., Coulson, T., Pilkingston, J.G., Clutton-Brock, T.H., Pemberton, J.M., Grenfell,
B.T., 2004. Why large-scale climate indices seem to predict ecological processes better
than local weather. Nature 430, 71–75.
Henderson, P.A., Seaby, R.M., 2005. The role of climate in determining the temporal
variation in abundance, recruitment and growth of sole Solea solea in the Bristol
Channel. Journal of the Marine Biological Association of the United Kingdom 85, 197–
204.
Hilborn, R., Walters, C.J., 1992. Quantitative Fisheries Stock Assessment: Choice,
Dynamics and Uncertainty. Chapman and Hall, London.
Hurrell, J.W., 1995. Decadal trends in the North Atlantic oscillation: regional temperatures
and precipitation. Science 269, 676–679.
Hurrell, J.W., Kushnir, Y., Ottersen, G., Visbeck, M., 2003. An overview of the North
Atlantic Oscillation. In: Hurrell, J.W., Kushnir, Y., Ottersen, G., Visbeck, M. (eds.). The
North Atlantic Oscillation: Climatic Significance and Environmental Impact, volume 134.
Geophysical Monograph Series pp. 1–35.
Time Series Analysis of Flatfish Landings
144
ICES, 2007. Report of the Working Group on the Assessment of Southern Shelf Stocks of
Hake, Monk and Megrim (WGHMM), 8–17 May 2007, Vigo, Spain. ICES CM
2007/ACFM:21. 700 pp.
Kell, L.T., Pastoors, M.A., Scott, R.D., Smith, M.T., Van Beek, F.A., O’Brien, C.M., Pilling,
G.M., 2005. Evaluation of multiple management objectives for Northeast Atlantic
flatfish stocks: sustainability vs. stability of yield. ICES Journal of Marine Science 62,
1104–1117.
Klyashtorin, L.B., 1998. Long-term climate change and main commercial fish production in
the Atlantic and Pacific. Fisheries Research 37, 115–125.
Marinaro, J.Y., Bouabid, M., 1983. Ecologie alimentaire de deux soles d’Algérie, Pegusa
nasuta (Pallas) et P. lascaris (Risso) (Téléostéens soléidés). Rapport du Commité
International de la Mer Méditerranée 28, 73–75.
Maynou, F., Demestre, M., Sánchez, P., 2003. Analysis of catch per unit effort by
multivariate analysis and generalised linear models for deep-water crustacean fisheries
off Barcelona (NW Mediterranean). Fisheries Research 65, 257–269.
McCullagh, P., Nelder, J.A., 1989. Generalized Linear Models. Chapman and Hall, London.
Ménard, F., Marsac, F., Bellier, E., Cazelles, B., 2007. Climatic oscillations and tuna catch
rates in the Indian Ocean: a wavelet approach to time series analysis. Fisheries
Oceanography 16(1), 95–104.
Molinero, A., Garcia, E., Flos, R., 1991. Comparative study of the feeding habits for two
species of sole: Solea vulgaris and Solea senegalensis. Special Publication European
Aquaculture Society 14, 219–220.
Mullon, C., Fréon, P., Cury, P., 2005. The dynamics of collapse in world fisheries. Fish and
Fisheries 6, 111–120.
Myers, R.A., Pepin, P. 1990. The robustness of lognormal based estimators of abundance.
Biometrics 46, 1185–1192.
Nakata, H., Fujihara, M., Suenaga, Y., Nagasawa, T., Fujii, T., 2000. Effect of wind blows
on the transport and settlement of brown sole (Pleuronectes herzensteini) larvae in a
shelf region of the Sea of Japan: numerical experiments with an Euler-Lagrangian
model. Journal of Sea Research 44, 91–100.
Nicolas ,D., Le Loc’h, F., Désaunay, Y., Hamon, D., Blanchet, A., Le Pape, O., 2007.
Relationships between benthic macrofauna and habitat suitability for juvenile common
sole (Solea solea, L.) in the Vilaine estuary (Bay of Biscay, France) nursery ground.
Estuarine, Coastal and Shelf Science 73, 639–650.
Ottersen, G., Planque, B., Belgrano, A., Post, E., Reid, P.C., Stenseth, N.C., 2001.
Ecological effects of the North Atlantic Oscillation. Oecologia 128, 1–14.
Pennington, M., 1991. On testing the robustness of lognormal based estimators. Biometrics
47, 1623–1624.
CHAPTER 6
145
Petitgas, P., Poulard, J.C, Biseau, A., 2003. Comparing commercial and research survey
catch per unit of effort: megrim in the Celtic Sea. ICES Journal of Marine Science 60,
66–76.
R Development Core Team, 2005. R: a language and environment for statistical 609
computing. R Foundation for Statistical Computing, Vienna, Austria, ISBN 610 3-
900051-07-0, URL http:www.R-project.org
Rice, J., Cooper, J.A., 2003. Management of flatfish fisheries–what factors matter? Journal
of Sea Research 50, 227-243.
Rijnsdorp, A.D., van Beeck, F.A., Flatman, S., Millner, R.M., Riley, J.D., Giret, M., de Clero,
R., 1992. Recruitment of sole stocks, Solea solea (L.), in the Northeast Atlantic.
Netherlands Journal of Sea Research 29(1/3), 173–192.
Rijnsdorp, A.D., Vingerhoed, B., 1994. The ecological significance of geographical and
seasonal differences in egg size in sole (Solea solea (L.)). Netherlands Journal of Sea
Research 32(3/4), 255–270.
Rijnsdorp, A.D., Vethaak, A.D., 1997. Changes in reproduction parameters of North Sea
plaice and sole between 1960 and 1995. ICES C.M. 1997/U:14 (mimeo).
Salen-Picard, C., Darnaude, A.M., Arlhac, D., Harmelin-Vivien, M.L., 2002. Fluctuations of
macrobenthic populations: a link between climate-driven river run-off and sole fishery
yields in the Gulf of Lions. Oecologia 133, 380–388.
Sanchez, R., Sanchez, F., Landa, J., Fernandez, A., 2003. Influence of oceanographic
parameters on recruitments of megrim (Lepidorhombus whiffiagonis) and fourspot
megrim (L. boscii) in the northern Spanish continental shelf (ICES division VIIIC). ICES
Marine Science Symposia 219, 400–402.
Schwartzlose, R.A., Alheit, J., Bakun, A., Baumgasrtner, T., Cloete, R., Crawford, R.,
Fletcher, W., Green-Ruiz, M.Y., Hagen, E., Kawasaki, T., Lluch-Belda, D., Lluch-Cota,
S., MacGall, A., Matsuura, Y., Nevarez-Martinez, M., Parrish, R., Roy, C., Serra, R.,
Shust, K., Ward, M., Zuzunaga, J., 1999. Worldwide largescale fluctuations of sardine
and anchovy populations. South African Journal of Marine Science 21, 289–347.
Sims, D.W., Wearmouth, V.J., Genner, M.J., Southward, A.J., Hawkins, S.J., 2005. Low-
temperature-driven early spawning migration of a temperate marine fish. Journal of
Animal Ecology 73, 333–341.
Stefánsson, G., 1996. Analysis of groundfish survey abundance data: combining the GLM
and delta approaches. ICES Journal of Marine Science 53, 577–588.
Stenseth, N.C., Ottersen, G., Hurrel, J.W., Mysterud, A., Lima, M., Chan, K-S., Yoccoz,
N.G., Adlandsvik, B., 2003. Studying climate effects on ecology through the use of
climate indices: the North Oscillation, El Niño Southern Oscillation and beyond.
Proceedings of the Royal Society of London. Series B: Biological Sciences 270, 2087–
2096.
Time Series Analysis of Flatfish Landings
146
Stenseth, N.C., Ottersen, G., Hurrel, J.W., Belgrano, A., 2004. Marine ecosystems and
climate variation. Oxford University Press, New York.
Tunberg, B.G., Nelson, W.G., 1998. Do climatic oscillations influence cyclical patterns of
soft bottom macrobenthic communities on the Swedish west coast? Marine Ecology
Progress Series 170, 85–94.
van der Land, M., 1991. Distribution of flatfish eggs in the 1989 egg surveys in the
southeastern North Sea, and mortality of plaice and sole eggs. Netherlands Journal of
Sea Research 27(3/4), 277–286.
Vinagre, C., Fonseca, V., Cabral, H., Costa, M.J., 2006. Habitat suitability index models for
the juvenile soles, Solea solea and Solea senegalensis, in the Tagus estuary: Defining
variables for species management. Fisheries Research 82, 140–149.
Walther, G.R., Post, E., Convey, P. Menzel, A., Parmesan, C., Beebee, T.J., Frometin, J.M.,
Hoegh-Guldberg, O., Bairlein, F., 2002. Ecological responses to recent climate change.
Nature 416, 389–395.
Wegner, G., Damm, U., Purps, M., 2003. Physical influences on the stock dynamics of
plaice and sole in the North Sea. Scientia Marina 67, 219–234.
Zuur, A.F., Pierce, G.J., 2004. Common trends in northeast Atlantic squid time series.
Journal of Sea Research 52, 57–72.

CHAPTER 7
Flatfish fisheries in the Portuguese coast
Fisheries Research (submitted)
By Teixeira, C.M., Batista, M.I., Cabral, H.N.


CHAPTER 7
149
Flatfish fisheries in the Portuguese coast
ABSTRACT: Flatfishes represent an important resource in Portuguese fisheries. Flatfish landings represent
a low percentage of total fish weight landed, but its importance is higher when landing commercial value is
considered (11%). Official data on flatfish landings from 1992 to 2005 for all landing ports of Portugal was
analysed together with vessels characteristics in order to detect patterns in flatfish fisheries. The fleet
characteristics of the targeting flatfish are heterogeneous but most of the vessels are multi-gear. Small
vessels caught species that occur near coastal areas, mainly soles, bastard sole, flounder, turbot and brill,
and octopuses, rays and cuttlefish. Megrims and spotted flounder were caught with others species, like
small pelagic fishes, anglerfishes and hake by coastal trawlers. For this fleet component, catches of flatfish
are usually bycatch. Generalized Linear Models (GLM) were used to analyze flatfish landings (LPUE –
landings per unit effort) between 1992 and 2005 and to evaluate its relationships with several variables.
Main effects of the models included year, month, landing port and length vessel class. The models explained
between 15% and 60% of the variability of the LPUE for the flatfish groups considered, with landing port,
length vessel class and month being the more important factors. These results suggest a high spatial-
temporal variability. The technical characteristics of the vessel (length) also contributed to LPUE variability.
In order to avoid overfishing, a management program should be adopted for which a more in depth
knowledge of flatfish stocks is required.
KEYWORDS:
flatfish, landings, fleet characteristics, generalized linear models, fisheries management,
Portugal
INTRODUCTION
Flatfishes have nearly global occurrence in marine habitats, ranging from the southern
Arctic Ocean to continental seas off Antarctica, but the largest quantities are caught in
the temperate and boreal zones of the Northern Hemisphere (Munroe, 2005).
In 2005, flatfish catches represented 1.5% of the world marine landings and near 70%
of these were in the North Atlantic (721950 tonnes) (source: FAO). Although flatfish
Flatfish Fisheries in the Portuguese Coast
150
constitute only a minor part of total fish resources, they include highly priced species
and support important fisheries.
Fishing is a traditional, culturally important activity in Portugal, and is dominated by
small, local fishing vessels (Baeta and Cabral, 2005). Flatfish fisheries are widely
spread over the Portuguese coast and traditionally have played and important socio-
economic role. Flatfish landings account for less than 4% of all the fish biomass landed
in the Portuguese coast. However, the importance of flatfish fisheries is considerable
higher due to the high commercial value of flatfish species, accounting for near 11%
of the economical value of fish landings (source: DGPA). The most important species,
in terms of landings, are the soles (Solea solea (Linnaeus, 1758), Solea senegalensis
Kaup, 1858 and Solea lascaris (Risso, 1810)), the bastard sole (Microchirus azevia
(Capello, 1868)), the flounder (Platichthys flesus (Linnaeus, 1758)), the spotted
flounder (Citharus linguatula (Linnaeus, 1758)), the wedge sole (Dicologlossa cuneata
(Moreau, 1881)), the turbot (Scophthalmus maximus (Linnaeus, 1758)), the brill
(Scophtahlmus rhombus (Linnaeus, 1758)), and the megrims (Lepidorhombus boscii
(Risso, 1810) and Lepidorhombus whiffiagonis (Walbaum, 1792)).
Artisanal multi-gears fleet is responsible for the largest share of flatfishes landings.
This fleet consists of almost 6000 vessels, most of them between 5 and 17 m overall
length with open deck, and thus only fish within a limited distance off the coastline
(source: DGPA). However, only a fraction of these vessels actively target flatfishes,
since many other species are caught in this multi-species fisheries. The main fishing
gears used in flatfish fisheries are trammel and gill nets and bottom trawl. Although an
operative artisanal fleet census exists in the Portuguese coast, there is not an
exhaustive inventory of gear used by this fleet, thus making it unlikely that landings
can be linked to a specific gear. In addition, this fishery activity is wide dispersed that
makes it difficult to obtain data.
Most of the regulations in the Portuguese legislation related to flatfish fisheries
concern the establishment of the minimum allowed size of captured fish and total
admissible captures (TAC). The minimum allowed sizes of captured fish are
established for megrims, plaice, soles, bastard sole, brill and flounder. Only the first
three species are regulated with TAC in our area (ICES IX, X e CECAF). Although there
are no stock evaluations for the flatfish off the Portuguese coast, their status might be
a matter of concern given that these resources present strong evidence of
overexploitation in close geographic areas in the Northeast Atlantic such as the Bay of
Biscay.
Catch and effort data have been used to derive indices of relative abundance for many
world fisheries (e.g. Large, 1992; Mejuto and García, 1996; Kimura and Zenger,
CHAPTER 7
151
1997). Catch and effort data from commercial fisheries provide one of the most
readily available sources of information to assess the condition of exploited stocks
(Gulland, 1956; Gavaris, 1980).
Multi-species fisheries exhibit space- and time-varying fishing practices, whereby a
given fleet, may change its target species, gear type or fishing location over short
time scales (weeks to months). These changes may reflect the local abundance of the
resource or may be directed by market considerations, such as consumer preferences.
The impact of the fleet on the resources mortality is thus, a complex relationship
between fishing practice at certain times of the year and locations. To model this
relationship it is necessary to identify the fishing tactics or métiers (Biseau, 1998)
existing in a given fishery. The fishing tactics in a fishery are determined, for example,
by target species, gear type, fishing location and fishing season using multivariate
ordination and classification methods (e.g. Pelletier and Ferraris, 2000; Pech et al.,
2001).
Several authors (e.g. Hilborn and Walters, 1992; Goñi et al., 1999; Mahévas et al.,
2004) have used generalized linear models (GLM) (McCullagh and Nelder, 1989) as a
means of accounting for technical and biological factors to model landing per unit
effort (LPUE) variations. GLM may combine continuous and categorical variables in a
single model, helping determine the relative importance of the variables affecting
LPUE.
The present study was planned as a combined approach to obtain typologies (Pelletier
and Ferraris, 2000) for describing the flatfish fishery of the Portuguese coast. We
identify the gears used and determine the LPUE by analysing monthly landings data
from an important fraction of the artisanal fleet during a long period (1992–2005).
The methodological approach applied, that showed to be useful when studying large
amounts of uncharacterised landings data, provides a more complete account of this
important fishery in the Portuguese coast and could be the basis for the
implementation of management measures.
MATERIALS AND METHODS
Data Source
Commercial fishing data use in these analyses was obtained from the Governmental
Fisheries Bureau (Direcção Geral das Pescas e Aquicultura – DGPA). The data used in
this study spanned a 14 years period (from January 1992 to December 2005), all
Flatfish Fisheries in the Portuguese Coast
152
landings data (in weight and in value), included the year, month, vessel number, fishing
gear and landing port at which the fish were caught. In addition, the technical
characteristics of each vessel (gross tonnage, engine power, length, age and hull
material) were also recorded.
The entire flatfish fleet is composed of 5942 vessels operating off the Portuguese coast
(Figure 7.1). This fleet catch a wide diversity of species (near 290) and for identifying
different métiers several species groups were considered, for flatfish: soles, bastard sole,
flounder, spotted flounder, wedge sole, turbot, brill and megrims; and for roundfish and
cephalopods: hake (Merluccius merluccius (Linnaeus, 1758)), cuttlefish (Sepia officinalis
Linnaeus, 1758), octopuses (Octopus vulgaris Cuvier, 1797 and Eledone cirrhosa
(Lamarck, 1798)), seabreams (Boops boops (Linaeus, 1758), Dentex dentex (Linnaeus,
1758), Dentex macrophathalmus (Bloch, 1791), Dentex marroccanus Valenciennes,
1830, Diplodus annularis (Linnaeus, 1758), Diplodus cervinus (Lowe, 1838), Diplodus
puntazzo (Cetti, 1777), Diplodus sargus (Linnaeus, 1758), Diplodus vulgaris (Geoffroy
Saint-Hilaire, 1817), Diplodus bellottii (Steindachner, 1882), Lithognathus mormyrus
(Linnaeus, 1758), Oblada melanura (Linnaeus, 1758), Pagellus acarne (Risso, 1827),
Pagellus bogaraveo (Brünnich, 1768), Pagellus erythrinus (Linnaeus, 1758), Pagrus
auriga Valenciennes, 1843, Pagrus pagrus (Linnaeus, 1758), Sarpa salpa (Linnaeus,
1758), Sparus aurata Linnaeus, 1758, and Spondyliosoma cantharus (Linnaeus, 1758)),
small pelagic fishes (Sardina pilchardus (Walbaum, 1792), Trachurus trachurus
(Linnaeus, 1758), Trachurus picturatus (Bowdich, 1825), Trachurus mediterraneus
(Steindachner, 1868), Scomber scombrus Linnaeus, 1758, and Scomber japonicus
Houttuyn, 1782), rays (Raja brachyura Lafont, 1873, Leucoraja circularis (Couch, 1838),
Raja clavata Linnaeus, 1758, Raja montagui Fowler, 1910, Leucoraja naevus (Müller &
Henle, 1841) and Raja undulata Lacepède, 1802) and anglerfishes (Lophius budegassa
Spinola, 1807 and Lophius piscatorius Linnaeus, 1758), and the remaining species were
grouped in “others”.

CHAPTER 7
153
Figure 7.1. Map of mainland Portugal landing ports (1. Caminha; 2. Viana do Castelo; 3.
Póvoa do Varzim; 4. Leixões; 5. Aveiro; 6. Figueira da Foz; 7. Nazaré; 8.
Peniche; 9. Lisboa; 10. Sesimbra; 11. Setúbal; 12. Sines; 13. Sagres; 14.
Portimão; 15. Quarteira; 16. Faro; 17. Olhão; 18. Tavira; 19. Vila Real de
Santo António).
The monthly LPUE for each vessel and for each species group was calculated by
summing the species total monthly landing per vessel and dividing by the monthly
number of landings (number of days at the sea; being landing relative to one day of
fishing). Thus, the LPUE for each species group is the monthly average kg per month
per vessel and was combined for all vessels.
Statistical Methods
The vessels that landed less than 1000 kg of flatfish per year along the time series
were discarded for the analysis. The final data filtering resulting in 375 vessels that
represented 73% of total flatfish landing. To avoid an excessive number of vessels,
ATLA
NTIC
OCEAN
41ºN
39ºN
37ºN 200 m
PORTU
GAL
200 m
10ºW 8ºW
6
19
4
12
8
12
3
5
7
9
1011
13 14 1516
1718

Flatfish Fisheries in the Portuguese Coast
154
three groups were established according to the flatfish landings: group 1 (G1) with
landings >1000 kg of flatfish per year and ≤2000 kg of flatfish per year; group 2 (G2)
with landings >2000 kg of flatfish per year and ≤5000 kg of flatfish per year and
group 3 (G3) with landings >5000 kg of flatfish per year.
Due to the large amount of compiled data, the first step of the analysis was to obtain
a geometrical representation of both cases and variables that could be easily
interpreted, thus providing a reduced description of the large data set (Pelletier and
Ferraris, 2000). Canonical correspondence analysis (CCA) is a useful tool to describe
fishing tactics, since it provides information about the relation between vessel’s
characteristics (gross tonnage, length, engine power, hull material and fishing gear)
and landings (flatfishes and others groups). All calculations were performed using
CANOCO (CANOnical Community Ordination) version 4.5 (ter Braack and Šmilauer,
2002).
To investigate the variation in LPUE for flatfishes species (soles, bastard sole,
flounder, spotted flounder, wedge sole, turbot, brill and megrims) in relation to year,
month, landing port and technical characteristics of vessel (gross tonnage, length and
engine power), a GLM (e.g. Chambers and Hastie, 1992; Hilborn and Walters, 1992)
was applied. Due to the fact that the technical characteristics of the vessels were
highly correlated (r ≥0.96), we use the only vessel length. Based on the frequency
distribution of vessel length, were assigned to four vessel length class: class 1: ≤7 m;
class 2: ≥16 and ≤8 m, class 3: ≥22 and ≤17 m and class 4: ≥23 m.
Several authors have applied GLM (McCullagh and Nelder, 1989) to the problem of
estimating standardised catch rates (e.g. Maynou et al, 2003; Sánchez et al., 2004;
García-Rodríguez et al., 2006). GLM are an extension of linear models allowing the
incorporation of non-normal distributions of the response variable and transformations
of the dependent variables to linearity (McCullagh and Nelder, 1989). The general
form of GLM is
g(μ) = βtx
whereby a link function g(·) is used to achieve linearity in the parameters βt of the
dependent variables x.
A second part of the model involves the specification of a variance function (φ) that
relates the variance of the response variable to the mean:
Var(Y) = φV(μ), with φ constant

CHAPTER 7
155
The general model used was:
lnμympv = α + βy + θm + λp + δv,
where μympv is the expected LPUE for year y and month m, landing port p and vessel
class v and in this work, α the LPUE obtained in January 1992 by vessel class 1 at
Aveiro port; βy the LPUE in the year y relative to 1992; θm the LPUE in month m
relative to January; λp the difference between Aveiro port and the other landing ports;
and δv the efficiency of vessel class v relative to class 1.
When zero values were eliminated for landings, it is seen that data may be close to
lognormal, which implies that a lognormal or gamma distribution may be appropriate
for positive values (Stefánsson, 1996). The results of Myers and Pepin (1990)
suggested that the use of the gamma density is preferable to the use of a lognormal
density for fisheries data, although this seems to apply mainly when there is a
considerable probability of small observations, not dealt with otherwise (Pennington,
1991) and, in other instances, the gain is minor (Firth, 1988). Although other
members of the exponential family could be used, the gamma density is what will be
used here when the positive values are under consideration (Stefánsson, 1996).
The goodness-of-fit of the models was assessed by comparing their relative
contribution to total deviance explained. The model was fitted in R environment (R
Development Core Team, 2005) using the gamma distribution with a log-link function,
adding the first order interactions whenever it result in a better models (high
proportion of deviance explained).
All statistical analyses were performed using R software (R Development Core Team,
2005). A significance level of 0.05 was considered in all test procedures.
RESULTS
The flatfish fleet consisted mostly in wood vessels (78%); the fibre vessels
represented 18% and only 4% of the vessels were constructed in steel. The average
age of these vessels was 27.8 years and the mean values of total length, gross
tonnage and engine power were 16.4 m, 54.4 tonnes and 200.2 kW, respectively
(Table 7.1).

Tab
le 7
.1.
Mai
n c
har
acte
rist
ics
of
vess
els
that
lan
ded
fla
tfis
h v
alues
of
age
gro
ss t
onnag
es,
length
, en
gin
e pow
er a
nd h
ull
mat
eria
l.
A
ge (
years
)
GT
(to
nn
es)
Len
gth
(m
)
HP
(kW
)
Hu
ll m
ate
rial (%
)
N
um
ber
m
in
max
avera
ge
sd
m
inm
ax
avera
ge
sd
m
inm
ax
avera
ge
sd
m
in
max
avera
ge
sd
Fib
reW
oo
d
Ste
el
Cam
inha
7
15.0
49.0
31.0
11.0
2.9
14.7
7.9
4.9
8.0
13.4
10.2
1.9
50.0
140.0
91.6
34.7
0.0
100.0
0.0
Via
na
do C
aste
lo
13
10.0
49.0
29.6
12.8
8.4
223.0
92.1
87.7
11.7
32.8
22.0
9.3
64.0
950.0
412.0
314.8
0.0
53.8
46.2
Póvo
a do V
arzi
m
112
3.0
49.0
21.2
9.4
2.8
187.0
27.6
21.0
7.7
28.6
15.8
2.8
40.0
630.0
193.3
79.3
0.9
93.8
5.4
Leix
ões
13
16.0
52.0
33.8
9.2
4.3
266.0
91.2
107.7
9.2
34.5
19.4
10.6
59.0
1455.0
399.9
446.4
0.0
69.2
30.8
Ave
iro
43
6.0
48.0
23.6
11.5
0.9
366.0
179.7
73.7
7.0
34.2
26.2
6.7
9.9
1000.0
638.9
230.4
2.4
12.2
85.4
Figuei
ra d
a Fo
z 12
8.0
49.0
30.3
13.2
92.0
240.0
189.0
47.0
24.0
34.3
30.0
3.3
440.0
1000.0
718.3
183.6
0.0
66.7
33.3
Naz
aré
1
-
-
29.0
-
-
-
9.3
-
-
-
12.2
-
-
-
111.0
-
0.0
100.0
0.0
Pen
iche
25
10.0
56.0
24.3
11.5
2.5
310.0
89.8
104.4
7.3
35.0
19.2
9.1
40.0
940.0
353.5
306.1
12.0
64.0
24.0
Lisb
oa
19
12.0
54.0
27.0
9.6
1.2
275.0
25.1
63.2
5.8
34.1
12.9
7.8
35.0
1455.0
210.1
336.9
0.0
100.0
0.0
Ses
imbra
15
4.0
59.0
37.9
15.4
2.0
20.0
8.7
4.9
7.1
14.7
10.9
2.0
35.0
140.0
89.6
29.4
0.0
93.3
6.7
Set
úbal
35
8.0
61.0
35.5
13.8
3.6
15.7
7.8
3.7
7.8
13.7
10.3
1.6
35.0
182.0
89.5
38.3
0.0
100.0
0.0
Sin
es
16
5.0
50.0
22.8
13.6
0.9
192.0
21.1
46.3
5.3
24.0
11.5
4.3
40.0
600.0
123.1
134.6
6.3
75.0
18.8
Sag
res
17
10.0
56.0
33.3
17.4
2.6
36.7
12.4
10.4
8.1
17.0
11.8
3.1
35.0
195.0
104.9
52.8
11.8
82.4
5.9
Port
imão
7
7.0
64.0
35.0
24.6
14.2
215.0
46.7
74.3
12.4
32.1
16.8
6.9
110.0
630.0
210.6
188.2
0.0
71.4
28.6
Quar
teir
a 2
25.0
30.0
27.5
3.5
4.9
11.3
8.1
4.6
8.3
12.2
10.2
2.7
74.8
160.0
117.4
60.3
50.0
50.0
0.0
Faro
6
9.0
48.0
33.0
15.0
3.4
15.2
9.3
5.2
8.9
14.8
11.7
2.4
40.0
150.0
96.9
49.1
0.0
100.0
0.0
Olh
ão
13
3.0
81.0
41.8
21.2
5.3
82.1
20.4
20.4
9.8
18.5
13.5
2.7
36.0
461.0
144.1
111.6
7.7
92.3
0.0
Tav
ira
7
26.0
48.0
36.4
8.1
5.7
22.3
13.7
5.4
9.2
14.1
12.4
1.9
60.0
175.0
115.6
43.5
0.0
100.0
0.0
V.R
.San
to A
ntó
nio
12
3.0
86.0
36.3
25.4
1.4
140.6
30.4
36.8
6.0
23.0
14.5
5.6
60.0
494.0
201.5
120.5
25.0
66.7
8.3
Tota
l fl
eet
27
.8
54
.4
16
.4
20
0.2
7
8
18
4
156
Flatfish Fisheries in the Portuguese Coast

CHAPTER 7
157
Vessels that caught different flatfish species presented different technical
characteristics (Figure 7.2). Soles, bastard sole and turbot were caught by vessels
with low gross tonnage, length and engine power.
(a)
(b)
(c)
Figure 7.2. Technical characteristics of flatfish fishery fleet clusters according to main
landed species: (a) gross tonnage; (b) vessel length; (c) engine power.
(standard deviation above bars).
0
40
80
120
160
200
Soles Bastardsole
Flounder Spottedflounder
Wedgesole
Turbot Brill Megrims
Ves
sel (
gros
s to
nnag
e )
0
10
20
30
40
Soles Bastardsole
Flounder Spottedflounder
Wedgesole
Turbot Brill Megrims
Ves
sel (
leng
th)
0
100
200
300
400
500
Soles Bastardsole
Flounder Spottedflounder
Wedgesole
Turbot Brill Megrims
Ves
sel (
engi
ne p
ower
)

Flatfish Fisheries in the Portuguese Coast
158
The CCA identified different fleet components. In the analysis that included the vessels
responsible for flatfish landings between 1000 kg and 2000 kg per year, wood/fibre
vessels were mainly associated with landings of bastard sole, wedge sole, turbot, brill,
spotted flounder, and also of hake, cuttlefish, octopuses, rays and anglerfishes;
trawlers caught megrims and small pelagic fishes. Soles, flounder, seabreams and a
wide diversity of other fish (“others”) were associated with the multi-gear fleet (Figure
7.3a).
In the second group of landings (Figure 7.3b), vessels with flatfish landings between
2000 kg and 5000 kg per year, soles, bastard sole, flounder, turbot, brill, cuttlefish,
octopuses, rays and anglerfishes were associated with wood vessels and purse
seine/multi-gear. Megrims, spotted flounder, hake and small pelagic fishes were
caught mainly by trawlers. Fibre vessels landed higher quantities of wedge sole,
seabreams and “others”.
The more important vessels in terms of landings, i.e. those with landings of flatfishes
higher than 5000 kg per year (Figure 7.3c), showed an association between soles,
bastard sole, flounder, turbot, brill, cuttlefish, octopuses, rays and “others” and wood
vessels operating with multi-gear/purse seine. Steel vessels operating with trawl
landed higher quantities of megrims, spotted flounder, wedge sole, small pelagic
fishes, hake, seabreams and anglerfishes. Soles and flounder were caught more
intensively by wood vessels operating with several gears, and landings of these
species were associated with other flatfish species (bastard sole, turbot and brill) and
with cuttlefish, octopuses and rays. Megrims were caught mainly by trawlers, which
also landed other flatfish species (spotted flounder and wedge sole) and small pelagic
fishes, hake and anglerfishes.
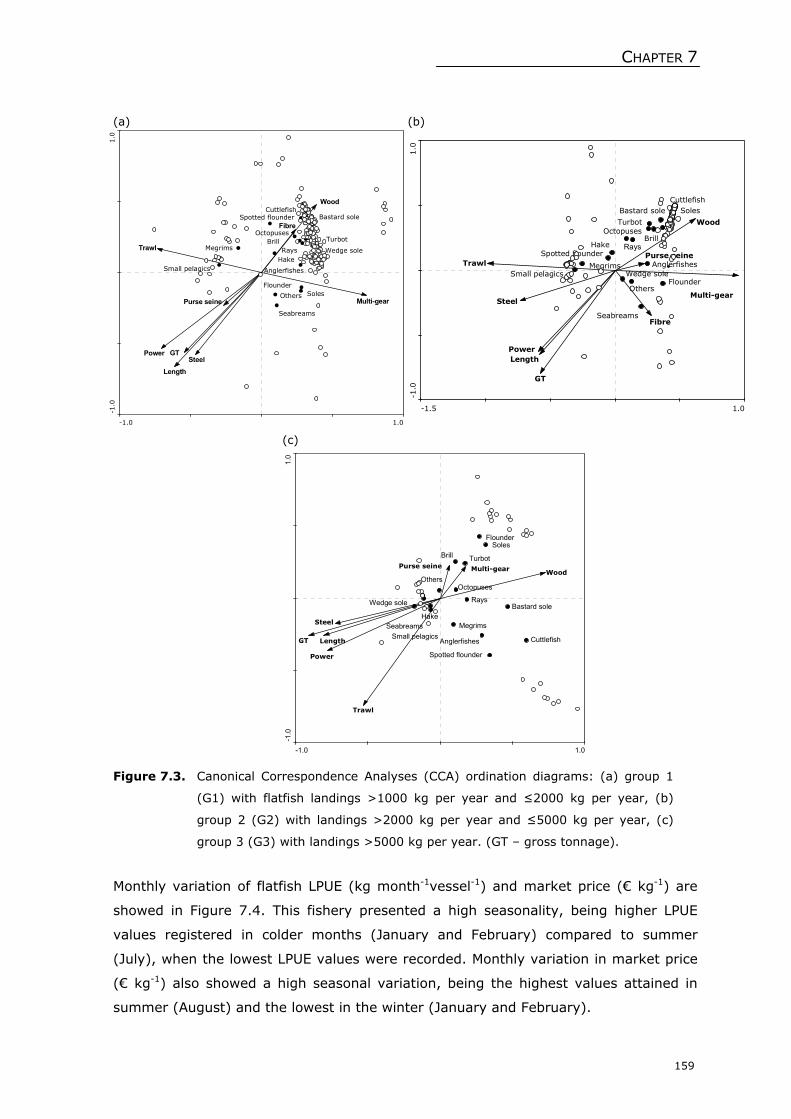
CHAPTER 7
159
(a) (b)
(c)
Figure 7.3. Canonical Correspondence Analyses (CCA) ordination diagrams: (a) group 1
(G1) with flatfish landings >1000 kg per year and ≤2000 kg per year, (b)
group 2 (G2) with landings >2000 kg per year and ≤5000 kg per year, (c)
group 3 (G3) with landings >5000 kg per year. (GT – gross tonnage).
Monthly variation of flatfish LPUE (kg month-1vessel-1) and market price (€ kg-1) are
showed in Figure 7.4. This fishery presented a high seasonality, being higher LPUE
values registered in colder months (January and February) compared to summer
(July), when the lowest LPUE values were recorded. Monthly variation in market price
(€ kg-1) also showed a high seasonal variation, being the highest values attained in
summer (August) and the lowest in the winter (January and February).
-1.0 1.0
-1.0
1.0
Megrims
Bastard soleSpotted flounder
Soles
Wedge sole
Others
Small pelagicsHake
OctopusesTurbotBrill
Flounder
Seabreams
Anglerfishes
Rays
Cuttlefish
GT
Length
Power
Wood
Steel
Fibre
Trawl
Purse seine Multi-gear
-1.5 1.0-1
.01.0
Megrims
Bastard sole
Spotted flounder
CuttlefishSoles
Wedge sole
Others
Small pelagics
Hake
OctopusesTurbot
RaysBrill
Flounder
Seabreams
Anglerfishes
GT
LengthPower
Wood
Steel
Fibre
TrawlPurse seine
Multi-gear
-1.0 1.0
-1.0
1.0
Megrims
Bastard sole
Spotted flounder
Cuttlefish
Soles
Wedge sole
Others
Small pelagics
Hake
Octopuses
Turbot
Rays
Brill
Flounder
Seabreams
AnglerfishesGT Length
Power
Wood
Steel
Trawl
Purse seine Multi-gear
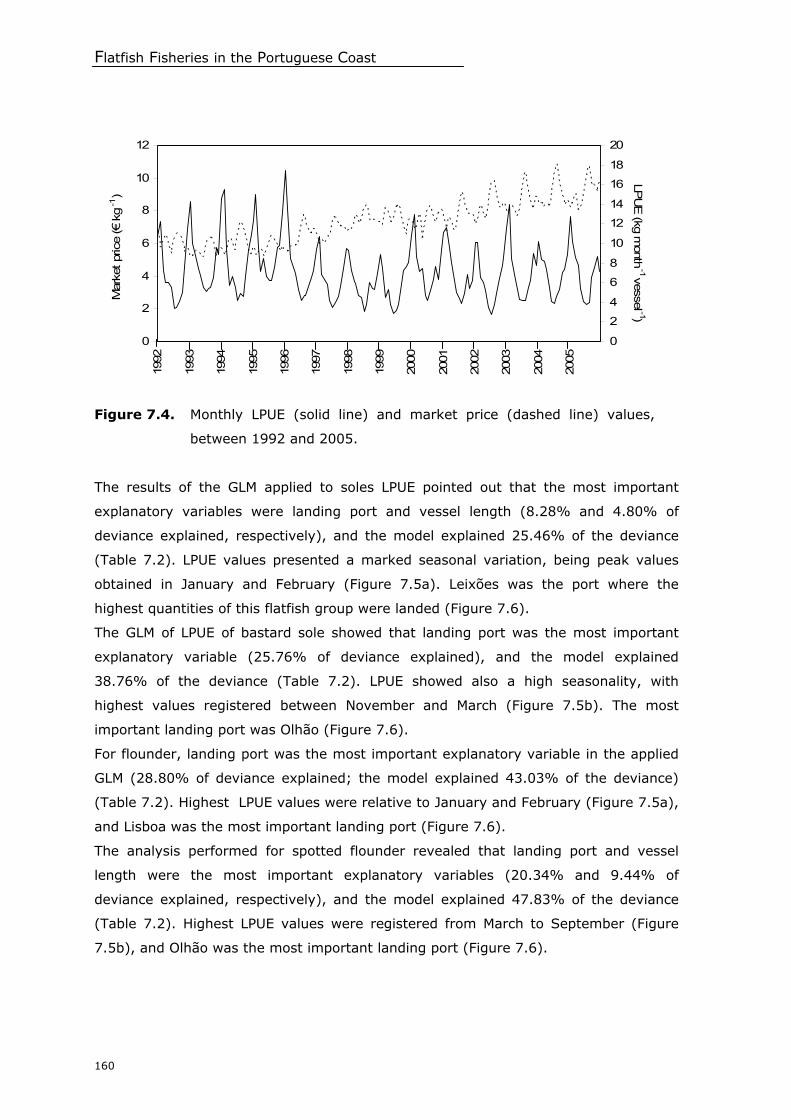
Flatfish Fisheries in the Portuguese Coast
160
Figure 7.4. Monthly LPUE (solid line) and market price (dashed line) values,
between 1992 and 2005.
The results of the GLM applied to soles LPUE pointed out that the most important
explanatory variables were landing port and vessel length (8.28% and 4.80% of
deviance explained, respectively), and the model explained 25.46% of the deviance
(Table 7.2). LPUE values presented a marked seasonal variation, being peak values
obtained in January and February (Figure 7.5a). Leixões was the port where the
highest quantities of this flatfish group were landed (Figure 7.6).
The GLM of LPUE of bastard sole showed that landing port was the most important
explanatory variable (25.76% of deviance explained), and the model explained
38.76% of the deviance (Table 7.2). LPUE showed also a high seasonality, with
highest values registered between November and March (Figure 7.5b). The most
important landing port was Olhão (Figure 7.6).
For flounder, landing port was the most important explanatory variable in the applied
GLM (28.80% of deviance explained; the model explained 43.03% of the deviance)
(Table 7.2). Highest LPUE values were relative to January and February (Figure 7.5a),
and Lisboa was the most important landing port (Figure 7.6).
The analysis performed for spotted flounder revealed that landing port and vessel
length were the most important explanatory variables (20.34% and 9.44% of
deviance explained, respectively), and the model explained 47.83% of the deviance
(Table 7.2). Highest LPUE values were registered from March to September (Figure
7.5b), and Olhão was the most important landing port (Figure 7.6).
0
2
4
6
8
10
1219
92
1993
1994
1995
1996
1997
1998
1999
2000
2001
2002
2003
2004
2005
0
2
4
6
8
10
12
14
16
18
20
Mar
ket p
rice
(€ k
g
-1
)
LPU
E (kg m
onth -1 vessel -1)

Tab
le 7
.2.
Res
ults
of
the
GLM
per
fla
tfis
h g
roups
(sole
s, b
asta
rd s
ole
, flounder
, sp
ott
ed f
lounder
, w
edge
sole
, tu
rbot,
brill
and m
egrim
s) f
rom
1992-
2005 o
n t
he
Port
ugues
e co
ast.
Val
ues
of
dev
iance
for
each
fac
tor,
res
idual
dev
iance
(Res
. D
ev.)
and p
erce
nta
ge
of
the
tota
l dev
iance
expla
ined
by
each
fac
tor
(% E
xpl.),
and p
-val
ue.
(Po
rt –
lan
din
g p
ort
; Le
ngth
– len
gth
ves
sel)
.
M
ain
eff
ect
s
Inte
ract
ion
s
Yea
r M
onth
Po
rt
Length
Yea
r:M
onth
Yea
r:Po
rt
Yea
r:Le
ngth
M
onth
:Port
Month
:Len
gth
Port
:Len
gth
To
tal
exp
lain
ed
NU
LL
p-v
alue
<
2E-1
6
<2E-1
6<
0.0
001
<0.0
001
<0.0
001
<0.0
001
<0.0
001
<0.0
001
<0.0
001
Res
. D
ev.
80924
80169
78341
71634
67751
65964
64595
63675
62376
60321
Dev
iance
755
2583
9290
13173
14960
16329
17249
18548
20603
So
les
% E
xpl.
0.9
3
2.2
78.2
84.8
02.2
1
1.6
91.1
41.6
02.5
4
25.4
6%
p-v
alue
3.8
8E-0
6
<2E-1
6<
0.0
001
<0.0
001
0.0
417
<0.0
001
<0.0
001
<0.0
001
<0.0
001
<0.0
001
Res
. D
ev.
71403
71269
70658
52296
50071
49635
48232
47900
47550
47449
43728
Dev
iance
134
745
19107
21332
21768
23171
23503
23853
23954
27675
Bast
ard
so
le
% E
xpl.
0.1
9
0.8
525.7
63.0
80.6
11.9
6
0.4
60.5
00.1
45.2
1
38.7
6%
p-v
alue
4.2
1E-0
5
1.3
1E-1
2<
0.0
001
<0.0
001
<0.0
001
<0.0
001
<0.0
001
<0.0
001
<0.0
001
Res
. D
ev.
65259
64782
63844
45047
42132
41431
41302
41099
40190
38593
Dev
iance
477
1415
20212
23127
23828
23957
24160
25069
26666
Flo
un
ders
% E
xpl.
0.7
3
1.4
428.8
06.6
41.0
7
0.2
00.3
11.3
92.4
5
43.0
3%
p-v
alue
<
2E-1
6
<2E-1
6<
0.0
001
<0.0
001
7.9
2E-1
2<
0.0
001
<0.0
001
<0.0
001
<0.0
001
<0.0
001
Res
. D
ev.
47613
47305
46004
36321
33721
33228
31821
30221
29397
28981
25231
Dev
iance
308
1609
11292
13892
14385
15792
17392
18216
18632
22382
Sp
ott
ed
fl
ou
nd
er
% E
xpl.
0.6
5
2.4
520.3
49.4
40.4
32.9
6
3.3
61.7
30.8
75.7
7
47.8
3%
(continue)
)
161
CHAPTER 7

Tab
le 7
.2.
(Continued
)
M
ain
eff
ect
s
Inte
ract
ion
s
Yea
r M
onth
Po
rt
Length
Yea
r:M
onth
Yea
r:Po
rt
Yea
r:Le
ngth
Month
:Port
Month
:Len
gth
Port
:Len
gth
To
tal
exp
lain
ed
NU
LL
p-v
alue
0.0
0177
0.0
017
<0.0
001
<0.0
001
<
0.0
001
<0.0
001
<0.0
001
<0.0
001
Res
. D
ev.
31168
31107
25691
18391
18393
18203
17980
17631
17250
Dev
iance
61
5477
12777
12775
12965
13188
13537
13918
Wed
ge
sole
% E
xpl.
0.2
0
15.3
723.4
217.5
7
0.6
10.7
11.1
21.2
2
60.2
2%
p-v
alue
0.0
0417
<2E-1
6<
0.0
001
<0.0
001
<0.0
001
<0.0
001
<0.0
001
<0.0
001
<0.0
001
Res
. D
ev.
33998
33978
33604
30980
30403
30113
30100
30000
29980
29013
Dev
iance
20
304
3018
3595
3885
3898
3998
4018
4985
Tu
rbo
t
% E
xpl.
0.0
6
1.1
07.6
61.6
90.8
6
0.0
40.2
90.0
62.8
4
14.6
0%
p-v
alue
1.8
2E-1
0
<2E-1
6<
0.0
001
<0.0
001
1.3
5E-0
6<
0.0
001
<0.0
001
<0.0
001
<0.0
001
<0.0
001
Res
. D
ev.
37358
37205
36789
30789
28069
27983
27630
27620
27321
26893
26174
Dev
iance
153
569
6569
9289
9375
9728
9738
10037
10465
11184
Bri
ll
% E
xpl.
0.4
1
1.1
116.0
67.2
80.2
30.9
5
0.0
30.8
01.1
41.9
3
29.9
4%
p-v
alue
0.0
1
<0.0
001
<0.0
001
<0.0
001
0.1
<0.0
001
<0.0
001
<0.0
001
<0.0
001
<0.0
001
Res
. D
ev.
14093
14073
13959
12932
12880
12101
11098
10853
10408
10001
9003
Dev
iance
20
134
1161
1293
1992
2995
3240
3685
4092
5090
Meg
rim
s
% E
xpl.
0.1
4
0.8
17.2
90.9
34.9
67.1
2
0.8
93.1
62.9
17.0
6
35.2
7%
162
Flatfish Fisheries in the Portuguese Coast

CHAPTER 7
163
(a)
(b)
(c)
Figure 7.5. Monthly average values of LPUE (kg month-1 vessel-1) for (a) soles and
flounder; (b) bastard sole, spotted flounder and wedge sole, and (c).
megrims, turbot and brill.
The analysis of the GLM of LPUE of wedge sole showed that landing port, vessel length
and month were the most important explanatory variables (23.42%, 17.57% and
15.37% of deviance explained, respectively), and the model explained 60.22% of the
deviance (Table 7.2). The highest LPUE values were obtained from October
0
2000
4000
6000
8000
10000
12000
14000
1992
1993
1994
1995
1996
1997
1998
1999
2000
2001
2002
2003
2004
2005
SolesFlounder
LPUE (k
g m
onth
-1 ve
ssel
-1
)
0
1000
2000
3000
4000
5000
6000
7000
8000
1992
1993
1994
1995
1996
1997
1998
1999
2000
2001
2002
2003
2004
2005
Bastard soleSpotted flounderWedge sole
LPUE (k
g m
onth
-1 ve
ssel -1 )
0
200
400
600
800
1000
1992
1993
1994
1995
1996
1997
1998
1999
2000
2001
2002
2003
2004
2005
MegrimsTurbotBrill
LPUE (k
g m
onth -
1 ve
ssel
-1)

Flatfish Fisheries in the Portuguese Coast
164
to January (Figure 7.5b). Aveiro was the port with the highest landings of this species
(Figure 7.6).
For turbot, landing port was the most important explanatory variable in the GLM
(7.66% of deviance explained), and the model explained 14.60% of the deviance
(Table 7.2). A marked seasonal variation was also noticed, being the highest LPUE
values recorded from March to May (Figure 7.5c). Figueira da Foz was the most
important landing port for this species (Figure 7.6).
Figure 7.6. Average values of flatfish LPUE in the mainly important landing ports on the
Portuguese coast, between 1992 and 2005.
Landing port and vessel length were the most important explanatory variables for brill
(16.06% and 7.28% of deviance explained, respectively; the model explained 29.94%
of the deviance) (Table 7.2). Highest LPUE values were obtained between December
and February (Figure 7.5c), and Leixões was the most important landing port (Figure
7.6).
Finally, for megrims, the most important explanatory variables in GLM were landing
port and the interaction between year and landing port (7.29% and 7.12% of variance
explained, respectively; the model explained 35.27% of the deviance) (Table 7.2).
Seasonal variation was also evident, with LPUE peaks from January to March (Figure
7.5c). Highest quatities of this species group were landed at Aveiro (Figure 7.6).
0 50000 100000 150000 200000 250000 300000 350000 400000
VRSATaviraOlhãoFaro
QuarteiraPortimão
SagresSines
SetúbalSesimbra
LisboaPenicheNazaré
Fig. FozAveiro
LeixõesP. Varzim
V. CasteloCaminha
Soles Bastard sole Flounder Spotted flounder Wedge sole Turbot Brill Megrims
LPUE (kg month-1 vessel -1)
CHAPTER 7
165
DISCUSSION
The flatfish fisheries in the Portuguese coast are characterised by their multi-species
and multi-gear nature. The fishing fleet that catch flatfish is mainly composed by small
vessels with low gross tonnage and engine power, and about 70% of the boats
constructed more than 20 years ago. This fleet is similar to small-scale fisheries fleet
operating in the Mediterranean (e.g. Jiménez et al., 2004; Tzanatos et al., 2005;
Piniella et al., 2007), and very different from the one of the North Sea, that is
composed by recent and large beam trawlers, with high engine power (Rijsndorp et
al., 2006; Hoff and Frost, 2008).
The daily choice of fishing tactics is based on a multitude of factors, including recent
fisheries yield and income, knowledge on fishing grounds and the seasonal availability
of resources, market demand, weather conditions, tradition, as well as information
and rumours about the yield of other fishermen. Changes in the biological or economic
conditions and the relative profitability of the métiers result in a redistribution of
fishing effort (Holland and Sutinen, 1999) leading to tactic diversification.
The results of the ordination analyses that were performed highlighted that the
flatfishes that are target species (soles, bastard sole, flounder, turbot and brill) were
caught by wood vessels operating with gill nets and trammel nets (multi-gear fleet
cluster). The small size of vessels may limit travel distances to areas surrounding
homeports, especially in winter when bad weather conditions occur more often. These
target species occur near shore, typically in sandy and muddy grounds in the
continental shelf, from 10 to 200 m deep (Nielsen, 1986a,b; Quéro et al., 1986).
Others species are captured by these vessels, namely cuttlefish, octopuses and rays.
Smaller vessels are involved in relatively seasonal fisheries often switching from high
income-low risk to lower income-more uncertain métiers. This risk-averse behaviour,
when followed for many years by the owners of small vessels, can render them “area
specialists” (around their homeports), as outlined by Hilborn (1985) and Pet-Soede et
al. (2001).
Large vessels with highest gross tonnage and engine power operating with trawl nets
landed megrims, spotted flounder, wedge sole, hake, small pelagic fishes and
anglerfishes. These flatfish species occur at depths between 300 m and 800 m
(Nielsen, 1986a,c; Quero et al., 1986), and are mainly bycatches of this fleet cluster.
The flatfish market prices per weight vary in opposite direction of the landings: the
selling price increased during summer due to the lower landings registered in this
period and to the highest market demand related with tourism. Nevertheless, the
increase in flatfish market prices during summer did not compensate the profits due to
Flatfish Fisheries in the Portuguese Coast
166
the reduction in landings, which differ from the situation reported for other flatfish
fisheries (Wilde, 2003). During summer, the more valuable flatfish species are sold
directly to restaurants and local fish markets, promoting parallel markets and a sub-
estimation of landings in this season. As a consequence, the official landings records
are indeed underestimates of the catches of commercially important flatfish species.
Among the predictors considered in GLM, landing port, vessel length and month were
the most important factors for which significant relationships with LPUE were
evidenced for the majority of the flatfish species groups considered. This suggest high
spatial-temporal variability of the catches of these species and technical characteristics
of the vessel also contribute to LPUE variability, which was also outlined by several
authors (e.g. Goñi et al., 1999; Ye et al., 2001; Maynou et al., 2003; Mahévas et al.,
2004).
The exploitation patterns of flatfish species differ according to latitude, being soles,
wedge sole, turbot and megrims caught in higher quantities in the north of Portugal;
flounder and brill mainly caught in the central Portuguese coast; and spotted flounder
and bastard sole chiefly caught in the southern coast of Portugal. Many métiers of the
small-scale fisheries are extremely localized being present in only a few ports or a
single one (Silva et al., 2002). However, other métiers may exist in several locations
of a broader geographical area. The specific habitat and migration patterns of certain
species are likely to lead to similar exploitation of these species in different locations
within a broader area. Also, several flatfish species present their north or south
distribution limit along the Portuguese coast which may also explain these differences
(Ekman, 1953; Briggs, 1974).
The large variability observed in LPUE of the flatfish species groups considered in this
study suggest that resource abundance may also be extremely variable seasonally and
interannually. Teixeira and Cabral (2009) showed that these species were caught
mainly during the spawning season, when the species concentrate near the coast,
which can also induce increase of LPUE values.
Several authors have studied the relationships between vessel characteristics and
fishing power or fishing effort (e.g. Houghton, 1977; Biseau, 1991). Fishing effort
depends not only on the vessel characteristics, but also on crew (Taylor and
Prochaska, 1985; Le Pape and Vigneaux, 2001) and on gear technology and on-board
equipment (Marchal et al., 2007).
Effective fisheries sustainable development requires a significant investment to collect
the needed information (FAO, 1999; Garcia and Staples 2000). Scientific studies to
sustain an improve management measures are scarce for Portuguese fisheries. Some
of the problems in the management of flatfish fisheries are the lack of assessment of
CHAPTER 7
167
resource abundance and the limitation of management measures to net and mesh
sizes, minimum fish size and TAC. This is of particular concern since there are
evidences of flatfish stocks overexploitation: there are 16 flatfish stocks considered
overfished in the ICES region and 9 in the NAFO area (Rice et al, 2003). Some
management measures are in practice in these areas, namely a recovery plan for sole
in Bay of Biscay (COM, 2003). Following a precautionary approach, these measures
should probably be expanded to adjoining areas together with the development of
management-oriented studies.
ACKNOWLEDGEMENTS
This study was partially funded by Fundação para a Ciência e a Tecnologia (FCT),
through the grant attributed to C.M. Teixeira (Grant SFRH/BD/19319/2004). This
study was also co-funded by the European Union through the FEDER–Fisheries
Programme (MARE).
REFERENCES
Baeta, F., Cabral, H.N., 2005. Status of Portuguese Fisheries. Technical Report.
Oceanography Institute, School of Sciences of the University of Lisbon, 48 pp.
Biseau, A., 1991. Relationships between fishing powers and some vessels characteristics
commonly used to estimate ‘‘fishing capacity’’. Example of the Celtic sea French fleets.
ICES CM 1991/B: 25, 15 pp.
Biseau, A., 1998. Definition of a directed fishing effort in a mixedspecies trawl fishery, and
its impact on stock assessments. Aquatic Living Resources 11, 119–136.
Briggs, J.C., 1974. Marine zoogeography. McGraw-Hill, London.
Chambers, J.M., Hastie, T.J., 1992. Statistical Models. Chapman and Hall, New York.
Comission of the European Communities (COM), 2003. Proposal for a establishing
measures for the recovery of the sole stocks in the western channel and the bay of
Biscay. Brussels, 819 pp.
FAO, 1999. Indicators for sustainable development of marine capture fisheries. FAO
Technical Guidelines for Responsible Fisheries No. 8. FAO, Rome.
Firth, D., 1988. Multiplicative errors: Log-normal or Gamma? Journal of the Royal
Statistical Society B 50, 266–268.
Garcia, S.N., Staples, D.J., 2000. Sustainability indicators in marine capture species:
introduction to the species issue. Marine and Freshwater Research 51, 381–384.
Flatfish Fisheries in the Portuguese Coast
168
García-Rodríguez, M., Fernández, Á.M., Esteban, A., 2006. Characterisation, analysis and
catch rates of the small-scale fisheries of the Alicante Gulf (Spain) over a 10 years time
series. Fisheries Research 77, 226–238.
Gavaris, S., 1980. Assessment of the cod stock in NAFO Divisions 2J.3K. NAFO, SCR Doc.
80/VI/81, No. N135, 5 pp.
Goñi, R., Álvarez, F., Alderstein, S., 1999. Application of generalized linear modeling to
catch rate analysis of western Mediterranean: the Castellón trawl fleet as a case study.
Fisheries Research 42, 291–302.
Gulland, J.A., 1956. On the fishing effort in English Demersal Fisheries. Fishery
Investigations, series 2(20), 1–41.
Hilborn, R., 1985. Fleet dynamics and individual variation: why some people catch more
fish than others. Canadian Journal of Fisheries and Aquatic Sciences 42, 2–13.
Hilborn, R., Walters, C., 1992. Quantitative fisheries stock assessment: Choice, Dynamics
and Uncertainty. Chapman and Hall, London.
Hoff, A., Frost, H., 2008. Modelling combined harvest and effort regulations: the case of
the Dutch beam trawl fishery for plaice and sole in the North Sea. ICES Journal of
Marine Science 65, 822–831.
Holland, D.S., Sutinen, J.G., 1999. An empirical model of fleet dynamics in New England
trawl fisheries. Canadian Journal of Fisheries and Aquatic Sciences 56, 253–264.
Houghton, R.G., 1977. The fishing power of trawlers in the western English channel
between 1965 and 1968. ICES Journal of Marine Science 37, 130–136.
Jiménez, M.P., Sobrino, I., Ramos, F., 2004. Objective methods for defining mixed-species
trawl fisheries in Spanish waters of the Gulf of Cádiz. Fisheries Research 67, 195–206.
Kimura, D.K., Zenger, H.H., 1997. Standardizing sable fish longline survey abundance
indices by modeling the lob-ratio of paired comparative fishing CPUEs. ICES Journal of
Marine Science 54, 48–59.
Large, P.A., 1992. Use of a multiplicative model to estimate relative abundance from
commercial CPUE data. ICES Journal of Marine Science 49, 253–261.
Le Pape, O., Vigneau, J., 2001. The influence of vessel size and fishing strategy on the
fishing effort for multispecies fisheries in northwestern France. ICES Journal of Marine
Science 58, 1232–1242.
Mahévas, S., Sandon, Y., Biseau, A., 2004. Quantification of annual variations in fishing
power due to vessel characteristics: an application to the bottom-trawlers of South-
Brittany targeting anglerfish (Lophius budegassa and Lophius piscatorius). ICES Journal
of Marine Science 61, 71–83.
Marchal, P., Andersen, B., Caillart, B., Eigaard, O., Guyader, O., Hovgaard, H., Iriondo, A.,
Le Fur, F., Sacchi, J., Santurtún, M., 2007. Impact of technological creep on fishing
effort and fishing mortality, for a selection of European fleets. ICES Journal of Marine
Science 64, 192–209.

CHAPTER 7
169
Maynou, F., Demestre, M., Sánchez, P., 2003. Analysis of catch per unit effort by
multivariate analysis and generalised linear models for deep-water crustacean fisheries
off Barcelona (NW Mediterranean). Fisheries Research 65, 257–269.
McCullagh, P., Nelder, J.A., 1989. Generalized Linear Models. Chapman and Hall, London.
Mejuto, J., García, B., 1996. Standardized age specific catch rates for albacore Thunnus
alalunga from the Spanish surface fleets in the Northeast Atlantic, 1981-1995. ICCAT,
SCRS/96/081, 12 pp.
Munroe, T.A., 2005. Distributions and biogeography. In: Gibson, R.N. (eds). Flatfishes
Biology and Exploitation. Fish and Aquatic Resources Series. Blackwell Publishing,
Oxford, pp 43-67.
Myers, R.A., Pepin, P. 1990. The robustness of lognormal based estimators of abundance.
Biometrics 46, 1185–1192.
Nielsen, J. 1986a. Scophthalmidae. In: Whitehead, P.J.P., Bauchot, M.L., Hureau, J.C.,
Nielsen, J., Tortonese, E. (eds.). Fishes of the North-eastern Atlantic and
Mediterranean. UNESCO, Vol. III, pp. 1287–1293.
Nielsen, J. 1986b. Pleuronectidae. In: Whitehead, P.J.P., Bauchot, M.L., Hureau, J.C.,
Nielsen, J., Tortonese, E. (eds.). Fishes of the North-eastern Atlantic and
Mediterranean. UNESCO, Vol. III, pp. 1299–1307.
Nielsen, J. 1986c. Citharidae. In: Whitehead, P.J.P., Bauchot, M.L., Hureau, J.C., Nielsen,
J., Tortonese, E. (eds.). Fishes of the North-eastern Atlantic and Mediterranean.
UNESCO III, pp. 1286.
Pech, N., Samba, A., Drapeau, L., Sabatier, R., Laloë, F., 2001. Fitting a model of flexible
multifleet–multispecies fisheries to Senegalese artisanal fishery data. Aquatic Living
Resources 14, 81–98.
Pelletier, D., Ferraris, J., 2000. A multivariate approach for defining fishing tactics from
commercial catch and effort data. Canadian Journal of Fisheries and Aquatic Sciences
57, 51–65.
Pennington, M., 1991. On testing the robustness of lognormal based estimators. Biometrics
47, 1623–1624.
Pet-Soede, C., Van Densen, W.L.T., Hiddink, J.G., Kuyl, S., Machiels, M.A.M., 2001. Can
fishermen allocate their fishing effort in space and time on the basis of their catch
rates? An example from Spermonde Archipelago, SW Sulawesi, Indonesia. Fisheries
Management and Ecology 8, 15–36.
Piniella, F., Soriguer, M.C., Fernández-Engo, M.A., 2007. Artisanal fishing in Andalusia: A
statistical study of the fleet. Marine Policy 31(4), 573–581.
Quéro, J.C., Desoutter, M., Lagardère, F., 1986. Soleidae. In: Whithead, P.J.P., Bauchot,
M.L., Hureau, J.C., Nielsen, J., Tortonese, E. (eds.). Fishes of the North-eastern
Atlantic and the Mediterranean. UNESCO III, pp. 1308–1328.

Flatfish Fisheries in the Portuguese Coast
170
R Development Core Team, 2005. R: A language and environment for statistical 609
computing. R Foundation for Statistical Computing, Vienna, Austria, ISBN 610 3-900051-
07-0, URL http: www.R-project.org
Rice, J., Cooper, J.A., 2003. Management of flatfish fisheries – what factors matter?. Journal
of Sea Research 50, 227–243.
Rijnsdorp, A.D., Daan N., Dekker, W., 2006. Partial fishing mortality per fishing trip: a useful
indicator of effective fishing effort in mixed demersal fisheries. ICES Journal of Marine
Science 63, 556–566.
Sánchez, P., Maynou, F., Demestre, M., 2004. Modelling catch, effort and price in a juvenile
Eledone cirrhosa fishery over a 10-year period. Fis. Res. 68, 319–327.
Silva, L., Gil, J., Sobrino, I., 2002. Definition of fleet components in the Spanish artisanal
fishery of the Gulf of Cadiz (SW Spain ICES division IXa). Fisheries Research 59, 117–128.
Stefánsson, G., 1996. Analysis of groundfish survey abundance data: combining the GLM and
delta approaches. ICES Journal of Marine Science 53, 577–588.
Taylor, T.G., Prochaska, F.J. 1985. Fishing power functions in agregate bioeconomics models.
Marine Resource Economics 2, 87–107.
ter Braak, C.J.F., Šmilauer, P., 2002. Canoco for Windows Version 4.5. Biometris – Plant
Research International, Wageningen.
Teixeira, C.M., Cabral, H.N., 2009. Time series analysis of flatfish landings in the Portuguese
coast. Fisheries Resarch 96, 252–258.
Tzanatos, E., Dimitriou, E., Katselis, G., Georgiadis, M., Koutsikopoulos, C., 2005.
Composition, temporal dynamics and regional characteristics of small-scale fisheries in
Greece. Fisheries Resarch 73, 147–158.
Ye, Y., Al-Husaini, M., Al-Baz, A., 2001. Use of generalized linear models to analyze catch
rates having zero values: the Kuwait driftnet fishery. Fisheries Resarch 53, 151–168.
Wilde, J.W. de, 2003. The 2001 North Sea Cod recovery measures: economic consequences
for the Dutch fishing fleet. Proceedings: XVth Annual Conference van de EAFE (European
Association of Fisheries, Economists). Brest, 15-16 May 2003. IFREMER, Brest (France),
No. 37, 5 pp.

CHAPTER 8
Catches of target species and bycatches of an artisanal fishery: the case study of a
trammel net fishery in the Portuguese coast
Fisheries Research (submitted)
By Batista, M.I., Teixeira, C.M., Cabral, H.N.

CHAPTER 8
173
Catches of target species and bycatches of an
artisanal fishery: the case study of a trammel
net fishery in the Portuguese coast
ABSTRACT: In this work we studied a small-scale fishery targeting mainly soles (Solea senegalensis and
Solea solea) and cuttlefish (Sepia officinalis) with trammel nets. The catches of target species, bycatches
and discards of this fishery were studied from October 2004 until August 2005 in the west coast of Portugal.
A total of 37 sampling surveys onboard commercial fishing vessels were conducted. The number and weight
of individuals of all species caught were registered, as well as the amount discarded and retained by
fishermen. A total of 112 species were identified: Scomber japonicus, Chelidonichthys obscura and
Callioynimus lyra were the most discarded fishes, corresponding to 28% in weight and 36% in number of
discards. Discards represented 22%, in weight, of the total catches, while the amount retained by fishermen
for consumption or direct selling was 12%, also in weight. The overall estimate for the annual discards value
due to this fishery was 174 tonnes, comprising 200 fishing vessels. Inconsistencies between the catches
recorded onboard and the official landings were detected for the main target species. Some bycatches of
species under recovery plans were also found.
KEYWORDS:
small-scale fishery, trammel net, bycatch, discards, Portugal
INTRODUCTION
Artisanal or small-scale fisheries are important worldwide because they account for
more than a quarter of the world marine catch, contribute about a half of the landings
used as human food, and employ about 90% of the world’s fishermen (McGoodwin,
1990; FAO, 2003). In Portugal as in other southern European countries, small-scale
fishing has a long tradition going back many centuries and is of high socio-economic
importance (Stergiou et al., 1997; Baeta and Cabral, 2005). A lot of people from a
highly diverse socio-cultural environment are directly and indirectly involved in small-
Catches of Target Species and Bycatches of an Artisanal Fishery
174
scale fisheries, which include generally a large number of small vessels exploiting a
wide variety of species, using multiple fishing gears. In this context, multi-species
catches highlight the necessity for management plans to explicitly recognize the direct
and indirect impacts these fisheries have on marine ecosystems (Díaz-Uribe et al.,
2007). Although their recognized importance, scientific data on small-scale fisheries is
scarce and consequently they are poorly covered by adequate management plans
(FAO, 2003, 2004).
Most of the Portuguese fishing vessels are included in the artisanal fisheries group,
working mainly with gill and trammel nets, longlines and traps. The artisanal fleet
represents near a half of the Portuguese landings, more than 60% of total revenues
and near 80% of total fishermen (DGPA, 2006; INE, 2006).
Trammel nets are highly represented in the Portuguese artisanal fisheries. This fishing
gear is included in various métiers which are characterized by different combinations
of mesh sizes, fishing grounds, fishing time, season, markets and consequently target
species (e.g. Borges et al., 2001; Stergiou et al., 2006). Thus, trammel net catches
along Portuguese coast are composed by a widely range of species, some of them with
recognized or highly expected management problems (e.g. European hake, Merluccius
merluccius (Linnaeus, 1758), anglerfishes, Lophius spp., soles, Solea spp., cuttlefish,
Sepia officinalis Linnaeus, 1758, and skates, Raja spp.).
Trammel nets fishery for targeting soles is one of the most important métiers of
trammel net Portuguese fisheries. This fishery is of high importance in Portugal and
acquires special relevance in the central coast, since 60% of total soles landings occur
in this area being almost all from trammel net fishery (source: DGPA).
Discarding unmarketable, undersized or damaged fish is common practice in most
fisheries worldwide, its relevance being extremely variable according to the gear used
(Alverson et al., 1994). Discard estimates are necessary, not only for evaluating the
impact of fishing on non-commercial species, but also on ecosystems as a whole
(Alverson et al., 1994; Hall, 1999). Another relevant fact is that discards are not
usually taken into account in stock assessment (Borges et al., 2005). Discarding
practices are affected by bycatch composition, which are determined by environmental
and social factors but are ultimately controlled by the fishing vessel crews, who are
influenced by landings constraints and economic forces (Catchpole et al., 2005).
Despite the large number of studies on bycatch and discards practices worldwide (e.g.
Alverson et al., 1994; Rochet et al., 2002; Sánchez et al., 2004; Catchpole et al.,
2005; Hall and Mainprize, 2005; Walmsley et al., 2007), few were conducted in small-
scale trammel nets fisheries. Tzanatos et al. (2007) reported about 10% for the small-
scale fisheries discards in the Patraikos Gulf and Stergiou et al. (1996) in the Evvoikos
CHAPTER 8
175
Gulf found a discard ratio for gill and trammel nets fishery under 4%. Stergiou et al.
(2006) studied the trammel net catch species composition in southern European
waters and concluded that both season and depth strongly affected catch species
composition and that trammel net fishing occurs in ‘hot spots’, which present essential
habitats of the life history of the targeted and associated species. In Portuguese
coastal area also a few studies on trammel net fisheries and their impacts on sea
grounds were conducted, but all of them along the southern coast of mainland (Erzini
et al., 1997; Borges et al., 2001; Erzini et al., 2002; Erzini et al., 2006; Gonçalves et
al., 2007, 2008a).
However, the composition of bycatches, namely of discards, in small-scale fisheries
have received few attention and existing studies are scarce. Furthermore, the high
variability inherent to small-scale fisheries leads to the need of much more information
than the existing in order to apply successful measures in the minimization of the
main impact of discards.
In addition to official landings and discards, catches can also include a certain amount
of illegal, unreported and unregulated catches, this unknown fraction of catches could
profoundly affect estimates of stock abundance and safe removal rates (Ainsworth and
Pitcher, 2005).
The main goals of the present study were to characterize the multi-species fishery
operating with trammel nets and targeting soles and cuttlefish in the central coast of
Portugal and to evaluate the factors affecting variability in catches, bycatches and
discards, in order to contribute to the improvement of small-scale fisheries
management and to the reduction of bycatches.
MATERIALS AND METHODS
Study Area and Sampling Surveys
The sampling area is located within 38º and 39º North and 8º and 10º West, where
depths range between 10 m and 100 m, corresponding to areas from 0.25 to 6
nautical miles off the coast. Winds are predominantly from North and Northeast
directions, ranging on average from 8 to 20 knots. Sampling was usually performed
with good sea conditions (waves less than 5 m high, most of the time ca. 2 m).
Samplings were carried out in fishing vessels from the two most important fishing
harbours of the central coast of Portugal: Setúbal and Sesimbra (Figure 8.1), between
October 2004 and August 2005. Ten vessels, randomly chosen amongst a set of
voluntary fishermen, were sampled: 4 from Sesimbra and 6 from Setúbal (overall

Catches of Target Species and Bycatches of an Artisanal Fishery
176
length between 10 m and 14 m, crew from 3 to 5 fishermen). A total of 37 trips were
carried out seasonally (autumn: 5 in Setúbal, 4 in Sesimbra; winter: 4 in Setúbal; 4 in
Sesimbra; spring: 5 in Setúbal, 5 in Sesimbra and summer: 5 in Setúbal, 5 in
Sesimbra) and 136 net sets were sampled (with a total length of about 204 km), with
an average number of 38 sheets and 1.5 km in length per set. Trammel nets sampled
were composed of 3 panels, usually made of polyethylene, with a mesh size of the
inner panel equal to 100 mm (minimum allowed by Portuguese legislation). Each net
sheet had 1.5 to 2.5 m high and ca. 40 m in length. A set of nets was usually
composed by a large number of these sheets, usually with more than 2000 m long,
with a gap of ca. 1 m between consecutive sheets. Net sets were anchored at each
end on the sea bottom. Nets’ length, haul location, depth, fishing time (total
immersion time of nets) and number of sheets in each set net group were always
registed.
Figure 8.1. Location of fishing harbours studied (Sesimbra and Setúbal) and of the fishing
sites sampled onboard vessels from each fishing harbour.
CHAPTER 8
177
In each survey, observers accompanied commercial fishermen during one full-day
fishing trip; each trip lasted on average ca. 10 h. Vessels left the fishing harbour at
night (before sunrise) and went to the fishing grounds, where the nets were set during
the last fishing trip and usually began to retrieve their nets at sunrise.
The observers team was composed of two researchers (one of whom accompanied all
fishing trips). When each net was retrieved, each specimen was untangled from the
net by fishermen and retained or discarded. During each trip, retained captures were
separated by fishermen in specimens for selling and specimens for their own
consumption. The observers team identified, measured (total length to the nearest
mm) and weighed (with a dynamometer, to the nearest 5 g) all retained individuals.
Discards were preserved in ice and brought to the laboratory to be identified,
measured and weighed. The majority of individuals were dead when they were
untangled from the nets, at least juvenile skates and rays belonging to discard were
processed on board to be returned alive to the sea. All discarded individuals were also
classified according to their damage condition following an empirical scale from 1 to 3
in an increasing damage level (1 was attributed to fish in good condition and 3 to
severely damage fish).
Data Analysis
Total catches per species (g per 10000 m of net) and ratio between target species
catches, retained bycatch and discards in weight and number were determined.
Estimates of the retained portion of catches for the fishermen’s own consumption and
for direct sale (which is forbidden in Portugal) were also calculated. The total annual
amount of discards from this trammel nets fishery was estimated based on mean
weight of discards per vessel and fishing effort observed. The measure of fishing effort
considered took in account number of vessels per fishing harbour, nets length, fishing
days and fishing time. This estimate was calculated separately for each season and
fishing harbour.
Catches by season were calculated for the eight most important species. The rank of
importance was obtained calculating the revenues (in €) of each species using the
mean price of each species in the studied sites during the sample period. Captures
was calculated by species, in kg per 10000 m of net. Based on these results, a
comparison between Sesimbra and Setúbal vessels was done.
Correspondence Analyses (CA) were performed using Canoco 4.5 software (ter Braak
and Šmilauer, 2002) in order to evaluate patterns and relationships between discards
and several factors. Two CA with addition of supplementary “environmental data”
(latitude, depth, fishing time, total number of species caught and total catches in

Catches of Target Species and Bycatches of an Artisanal Fishery
178
weight) were performed: one using the species for which the total amount of discards
were higher than 10000 kg and the other considering the species for which more than
80 individuals were discarded in overall surveys.
In order to detect the relative importance of the factors affecting discards (low or no
marketable value, damage condition and low size) comparative analyses were
performed for the 20 most discarded species. Of these, species without marketable
value were removed from the analyses as this was the main reason for being
discarded.
For each species analysed, percentage of discards was plotted against their mean
damage condition. For species with a legislated minimum landing size (MLS) the same
approach was applied considering the percentage of discarded individuals below MLS
instead of mean damage condition.
In order to estimate the percentage of fish that were not sold by according to national
regulations (Portuguese law obligates all captures to be sold in fishing docks or pass
there before being sold elsewhere), a comparative analysis between the weight of the
most valuable species captured (Senegalese sole, Solea senegalensis Kaup, 1858,
common sole, Solea solea (Linnaeus, 1758) and turbot, Scophthalmus maximus
(Linnaeus, 1758)) registed by observers in each trip and the weight declared to fishing
docks officers by fishermen in the same days. Other possible causes for the
differences between both values were negligible.
Finally, the total annual amount of discards from this trammel nets fishery was
estimated based on mean weight of discards per vessel and fishing effort (nets length
per vessel and number of vessels per fishing harbour). This estimate was calculated
separately for each season and fishing harbour.
RESULTS
A total of 87 fish species, 9 molluscs, 5 echinoderms and 11 crustaceans were
identified in the catches of this trammel net fishery (Table 8.1). The most important
species in terms of weight were S. officinalis and S. senegalensis which are target
species of this trammel net fishery. Captures of this species were almost always
landed in fishing docks: 96.8% of S. senegalensis captured biomass (94.8% of total
number of individuals) and 97.6% of S. officinalis biomass captured (96.4% of total
number of individuals) were landed in fishing docks. The other target species, S.
solea, is less important in total captures, however 97.4% of weighted captures were
landed in fishing docks (95.1% of total number of individuals).

CHAPTER 8
179
Table 8.1. Total catches (in biomass and number), retained (R) and discarded bycatch (D)
values for each species caught in the trammel nets fishery in the west central
coast of Portugal (in brackets values for retained species that are sold at
fishing docks).
Total Catch % Bycatch (Weight)
% Bycatch (Number)
Species g
10000 m-1 N
10000 m-1 R (sold) D R (sold) D
Pisces Alosa fallax 47.0 0.1 - 100.0 - 100.0 Ammodytes tobianus 22.9 0.2 77.3 ( - ) 22.7 25.0 ( - ) 75.0 Argentina sphyraena 1.4 < 0.1 - 100.0 - 100.0 Argyrosomus regius 239.2 0.1 100.0 (57.6) 0.0 100.0 (33.3) 0.0 Arnoglossus imperialis 93.1 2.2 2.6 ( - ) 97.4 2.3 ( - ) 97.7 Arnoglossus laterna 6.4 0.1 - 100.0 - 100.0 Arnoglossus spp. 9.3 0.3 52.7 ( - ) 47.3 16.7 ( - ) 83.3 Arnoglossus thori 1.1 < 0.1 - 100.0 - 100.0 Aspitrigla cuculus 14.2 0.1 - 100.0 - 100.0 Balistes capriscus 1702.4 2.4 88.1 ( - ) 11.9 83.3 ( - ) 16.7 Belone belone 182.3 0.4 27 ( - ) 73.0 22.2 ( - ) 77.8 Boops boops 743.0 5.9 4.8 ( - ) 95.2 4.2 ( - ) 95.8 Bothidae 0.5 < 0.1 - 100.0 - 100.0 Bothus podas 14.9 0.1 - 100.0 - 100.0 Callionymus lyra 1411.7 17.5 1.7 ( - ) 98.3 1.4 ( - ) 98.6 Callionymus reticulatus 0.2 < 0.1 - 100.0 - 100.0 Capros aper 2.3.0 < 0.1 - 100.0 - 100.0 Centrolabrus exoletus 24.0 < 0.1 - 100.0 - 100.0 Chelidonichthys lastoviza 229.2 1.5 - 100.0 - 100.0 Chelidonichthys lucerna 1244.1 4.2 77.5 ( - ) 22.5 67.1 ( - ) 32.9 Chelidonichthys obscurus 2670.6 27.8 28.5 ( - ) 71.5 14.9 (0.4) 85.1 Chelon labrosus 60.1 < 0.1 - 100.0 - 100.0 Citharus linguatula 228.7 3.3 27.8 ( - ) 72.2 23.9 ( - ) 76.1 Conger conger 522.1 0.2 97.8 (34.0) 2.2 75.0 (25.0) 25.0 Coris julis 21.6 0.1 74.1 ( - ) 25.9 66.7 ( - ) 33.3 Dasyatis pastinaca 216.5 < 0.1 100.0 (100.0) 0.0 100.0 (00.0) 0.0 Dentex dentex 20.2 < 0.1 - 100.0 - 100.0 Dentex macrophthalmus 7.5 0.1 - 100.0 - 100.0 Dentex maroccanus 14.2 0.1 - 100.0 - 100.0 Dentex spp. 10.6 < 0.1 - 100.0 - 100.0 Dicentrarchus labrax 637.3 0.7 86.2 (20.8) 13.8 78.6 (14.3) 21.4 Dicologlossa cuneata 922.8 11.5 62.1 ( - ) 37.9 48.3 ( - ) 51.7 Diplodus annularis 10.9 < 0.1 - 100.0 - 100.0 Diplodus sargus 123.2 0.3 93.7 ( - ) 6.3 85.7 ( - ) 14.3 Diplodus spp. 61.7 0.3 81.4 ( - ) 18.6 57.1 ( - ) 42.9 Diplodus vulgaris 680.4 0.4 100.0 (91.1) 0.0 100.0 (37.5) 0.0 Gymnammodytes cicerelus 2.5 < 0.1 - 100.0 - 100.0 Halobatrachus didactylus 88.8 0.1 51.2 ( - ) 48.8 66.7 ( - ) 33.3 Labridae 97.2 0.2 88.1 ( - ) 11.9 75.0 ( - ) 25.0 Labrus mixtus 12.1 0.1 - 100.0 - 100.0 Labrus spp. 22.1 < 0.1 100.0 ( - ) 0.0 100.0 ( - ) 0.0 Lepidorhombus boscii 239.1 1.8 93.4 ( - ) 6.6 88.9 ( - ) 11.1 Lepidotrigla cavillone 199.4 2.1 32.0 ( - ) 68.0 16.3 ( - ) 83.7 Lepidotrigla dieuzeidei 9.5 0.2 - 100.0 - 100.0 Liza ramada 960.4 1.2 72.5 (64.6) 27.5 50.0 (45.8) 50.0 Liza spp. 45.4 0.1 - 6.8 50.0 ( - ) 50.0 Macroramphosus scolopax 0.6 < 0.1 - 100.0 - 100.0 Merlangius merlangus 123.0 < 0.1 100.0 ( - ) 0.0 100.0 ( - ) 0.0 Merluccius merluccius 3305.4 16.2 60.7 (18.3) 39.3 42.1 (0.9) 57.9 Microchirus azevia 428.6 2.4 91.6 (12.0) 8.4 83.7 (8.2) 16.3 Microchirus ocellatus 18.1 0.2 - 100.0 - 100.0 Microchirus variegatus 158.1 2.7 81.1 ( - ) 18.9 74.1 ( - ) 25.9 Micromesistius poutassou 102.5 1.8 3.8 ( - ) 96.2 2.8 ( - ) 97.2 Mola mola 581.0 0.2 - 100.0 - 100.0 (continue)

Catches of Target Species and Bycatches of an Artisanal Fishery
180
Table 1. (Continued)
Total Catch % Bycatch (Weight)
% Bycatch (Number)
Species g
10000 m-1 N
10000 m-1 R (sold) D R (sold) D
Mugil cephalus 29.6 0.1 - 100.0 - 100.0 Mullus barbatus 115.4 0.6 41.4 ( - ) 58.6 41.7 ( - ) 58.3 Mullus spp. 70.7 0.6 13.2 ( - ) 86.8 8.3 ( - ) 91.7 Mullus surmuletus 65.4 0.3 76.0 ( - ) 24.0 83.3 ( - ) 16.7 Mustelus mustelus 343.3 0.2 100.0 (100.0) 0.0 100.0 (100.0) 0.0 Myliobatis aquila 317.4 0.7 - 100.0 - 100.0 Pagellus acarne 797.4 8.5 55.0 ( - ) 45.0 39.0 ( - ) 61.0 Pagellus erythrinus 538.0 1.5 51.2 ( - ) 48.8 38.7 ( - ) 61.3 Pagellus spp. 20.1 0.3 - 100.0 - 100.0 Pagrus pagrus 36.3 0.2 - 100.0 - 100.0 Pagrus spp. 13.3 < 0.1 100.0 ( - ) 0.0 100.0 ( - ) 0.0 Phycis phycis 265.8 0.3 97.7 (78.1) 2.3 85.7 (71.4) 14.3 Pleuronectiformes 3.7 < 0.1 - 100.0 - 100.0 Raja brachyura 5913.1 2.8 95.9 (95.0) 4.1 83.9 (80.4) 16.1 Raja clavata 6530.7 7.4 94.0 (89.3) 6.0 82.0 (80.7) 18.0 Raja miraletus 1151.8 4.1 70.0 (65.8) 30.0 63.9 (60.2) 36.1 Raja montagui 91.5 0.2 100.0 (100.0) 0.0 100.0 (100.0) 0.0 Raja spp. 154.3 0.1 79.0 (79.7) 20.3 33.3 (33.3) 66.7 Raja undulata 8512.4 4.2 98.6 (94.4 ) 1.4 94.2 (90.7) 5.8 Sardina pilchardus 666.3 13.1 0.2 ( - ) 99.8 0.4 ( - ) 99.6 Scomber japonicus 7524.6 61.6 4.2 (0.1) 95.8 2.9 (0.1) 97.1 Scomber scombrus 1308.4 7.5 27.2 ( - ) 72.8 12.5 ( - ) 87.5 Scomber spp. 6.7 0.1 - 100.0 - 100.0 Scophthalmus maximus 3036.7 4.6 99.5 (94.9) 0.5 97.9 (94.7) 2.1 Scophthalmus rhombus 1945.2 3.7 98.1 (40.4) 1.9 96.1 (35.5) 3.9 Scorpaena notata 318.0 3.8 - 100.0 - 100.0 Scorpaena porcus 345.8 0.8 79.4 ( - ) 20.6 76.5 ( - ) 23.5 Scyliorhinus canicula 243.7 0.7 57. 4 (26.8) 42.6 42.9 (21.4) 57.1 Serranus cabrilla 166.3 1.4 26.6 ( - ) 73.4 25.0 ( - ) 75.0 Serranus hepatus 6.9 0.2 - 100.0 - 100.0 Solea lascaris 5204.8 31.8 83.7 (41.1) 16.3 73.2 (31.0) 26.8 Solea senegalensis 29798.7 92.9 0.6 ( - ) 2.7 0.7 ( - ) 4.6 Solea solea 2352.5 5.1 1.5 ( - ) 1.1 1.9 ( - ) 2.9 Solea spp. 40.5 0.2 - 100.0 - 100.0 Soleidae 6.5 0.1 - 100.0 - 100.0 Sparidae 4.2 < 0.1 100.0 ( - ) 0.0 100.0 ( - ) 0.0 Sparus aurata 403.3 1 86.6 ( - ) 13.4 81.0 ( - ) 19.0 Spondyliosoma cantharus 1095.7 5.5 50.1 (3.4) 49.9 37.8 (1.8) 62.2 Symphodus bailloni 2.3 < 0.1 - 100.0 - 100.0 Symphodus spp. 3.9 < 0.1 - 100.0 - 100.0 Torpedo marmorata 233.3 0.1 100.0 (100.0) 0.0 100.0 (100.0) 0.0 Torpedo torpedo 330.0 0.5 - 100.0 - 100.0 Trachinus draco 1369.4 10.4 19.9 ( - ) 80.1 10.4 ( - ) 89.6 Trachurus picturatus 10.6 < 0.1 100.0 ( - ) 0.0 100.0 ( - ) 0.0 Trachurus trachurus 517.2 5.1 57.7 ( - ) 42.3 40.8 ( - ) 59.2 Trigla lyra 176.5 0.4 93.8 ( - ) 6.2 77.8 ( - ) 22.2 Trisopterus luscus 2765.0 32.1 54.2 ( - ) 45.8 46.4 ( - ) 53.6 Uranoscopus scaber 9.6 < 0.1 - 100.0 - 100.0 Zeugopterus punctatus 1.3 < 0.1 - 100.0 - 100.0 Zeus faber 643.3 2.3 76.4 ( - ) 23.6 61.7 ( - ) 38.3 Total* 104098.8 427.4 Equinodermata Astropecten aranciacus 4651.0 35.0 - 100.0 - 100.0 Asterias rubens 19.6 0.1 - 100.0 - 100.0 Echinus acutus 19.4 0.1 - 100.0 - 100.0 Holothuroidea 1177.3 2.8 - 100.0 - 100.0 Marthasterias glacialis 28.5 0.4 - 100.0 - 100.0 Paracentrotus lividus 18.8 0.1 - 100.0 - 100.0 Total* 5914.5 38.5 Crustacea Carcinus maenas 1.5 < 0.1 - 100.0 - 100.0 Dardanus arrosor 25.3 0.6 - 100.0 - 100.0 Goneplax rhomboides 0.4 < 0.1 - 100.0 - 100.0 Hommarus gammurus 57.6 0.1 100.0 (100.0) 0.0 100.0 (100.0) 0.0 Maja goltziana 1.1 < 0.1 - 100.0 - 100.0 Maja squinada 1979.4 2 87.3 (5.2) 12.7 87.8 (2.4) 12.2 Palinurus elephas 83.9 0.2 96.8 (96.8) 3.2 75.0 (75.0) 25.0 Pagurus forbesii 0.8 < 0.1 - 100.0 - 100.0 Liocarcinus holsatus 0.3 <0.1 - 100.0 - 100.0 Calappa granulata 7 0.1 - 100.0 - 100.0
(continue)
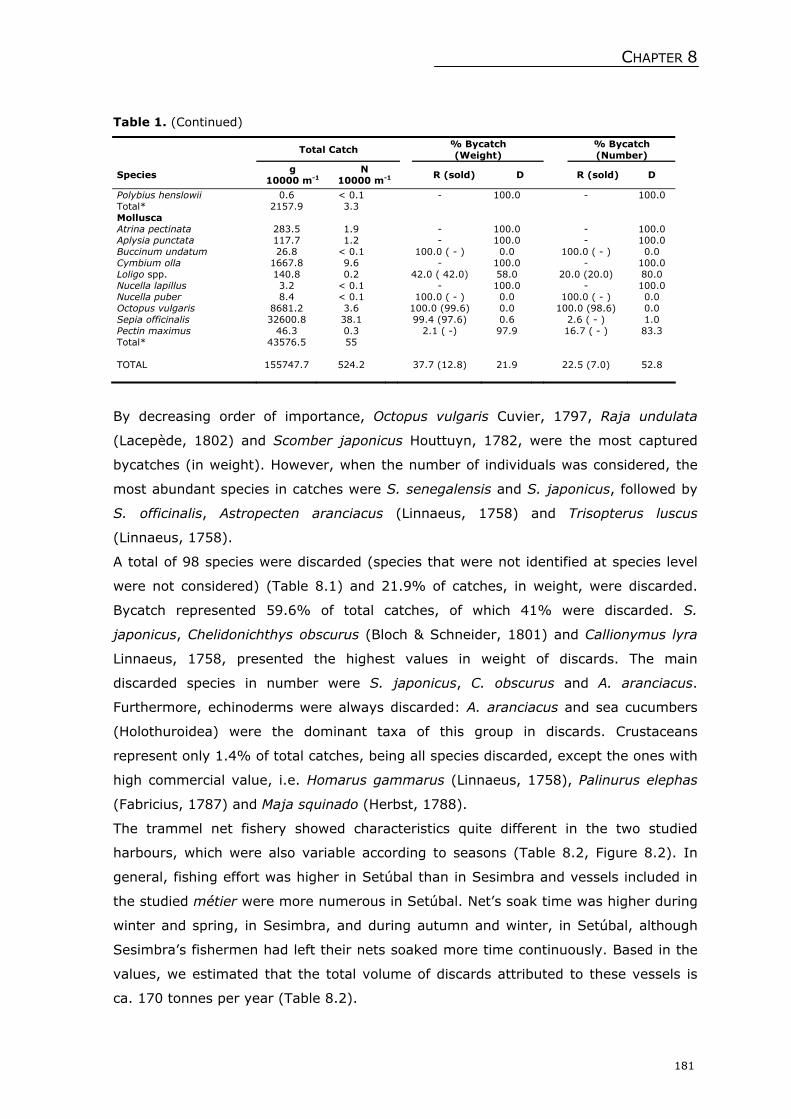
CHAPTER 8
181
Table 1. (Continued)
Total Catch % Bycatch (Weight)
% Bycatch (Number)
Species g
10000 m-1 N
10000 m-1 R (sold) D R (sold) D
Polybius henslowii 0.6 < 0.1 - 100.0 - 100.0 Total* 2157.9 3.3 Mollusca Atrina pectinata 283.5 1.9 - 100.0 - 100.0 Aplysia punctata 117.7 1.2 - 100.0 - 100.0 Buccinum undatum 26.8 < 0.1 100.0 ( - ) 0.0 100.0 ( - ) 0.0 Cymbium olla 1667.8 9.6 - 100.0 - 100.0 Loligo spp. 140.8 0.2 42.0 ( 42.0) 58.0 20.0 (20.0) 80.0 Nucella lapillus 3.2 < 0.1 - 100.0 - 100.0 Nucella puber 8.4 < 0.1 100.0 ( - ) 0.0 100.0 ( - ) 0.0 Octopus vulgaris 8681.2 3.6 100.0 (99.6) 0.0 100.0 (98.6) 0.0 Sepia officinalis 32600.8 38.1 99.4 (97.6) 0.6 2.6 ( - ) 1.0 Pectin maximus 46.3 0.3 2.1 ( -) 97.9 16.7 ( - ) 83.3 Total* 43576.5 55 TOTAL 155747.7 524.2 37.7 (12.8) 21.9 22.5 (7.0) 52.8
By decreasing order of importance, Octopus vulgaris Cuvier, 1797, Raja undulata
(Lacepède, 1802) and Scomber japonicus Houttuyn, 1782, were the most captured
bycatches (in weight). However, when the number of individuals was considered, the
most abundant species in catches were S. senegalensis and S. japonicus, followed by
S. officinalis, Astropecten aranciacus (Linnaeus, 1758) and Trisopterus luscus
(Linnaeus, 1758).
A total of 98 species were discarded (species that were not identified at species level
were not considered) (Table 8.1) and 21.9% of catches, in weight, were discarded.
Bycatch represented 59.6% of total catches, of which 41% were discarded. S.
japonicus, Chelidonichthys obscurus (Bloch & Schneider, 1801) and Callionymus lyra
Linnaeus, 1758, presented the highest values in weight of discards. The main
discarded species in number were S. japonicus, C. obscurus and A. aranciacus.
Furthermore, echinoderms were always discarded: A. aranciacus and sea cucumbers
(Holothuroidea) were the dominant taxa of this group in discards. Crustaceans
represent only 1.4% of total catches, being all species discarded, except the ones with
high commercial value, i.e. Homarus gammarus (Linnaeus, 1758), Palinurus elephas
(Fabricius, 1787) and Maja squinado (Herbst, 1788).
The trammel net fishery showed characteristics quite different in the two studied
harbours, which were also variable according to seasons (Table 8.2, Figure 8.2). In
general, fishing effort was higher in Setúbal than in Sesimbra and vessels included in
the studied métier were more numerous in Setúbal. Net’s soak time was higher during
winter and spring, in Sesimbra, and during autumn and winter, in Setúbal, although
Sesimbra’s fishermen had left their nets soaked more time continuously. Based in the
values, we estimated that the total volume of discards attributed to these vessels is
ca. 170 tonnes per year (Table 8.2).

Catches of Target Species and Bycatches of an Artisanal Fishery
182
Tabela 8.2. Estimates of discard rates, fishing effort (net length, number of fishing days,
number of vessels and mean net’s soak time) and total discards per season,
for Sesimbra and Setúbal trammel nets fishing fleet (in brackets are indicated
the standard deviation calculated values).
Local Season Discards-1 Vessel-1 day(kg)
Net´s mean
length-1 vessel (m)
Fishing
days
N. vessels
Mean
soak time (h)
Total
discards (kg)
Autumn 12.1 (8.0) 3882.6 (338.6) 32 (6) 12 (5) 49.5 (7.2) 4664.4
Winter 45.4 (37.6) 4464.7 (801.4) 30 (10) 12 (5) 45.0 (4.3) 16348.2
Spring 19.3 (3.7) 4300.5 (832.0) 30 (8) 12 (5) 35.6 (4.6) 6954.6
Sesi
mb
ra
Summer 11.3 (5.3) 3846.6 (1159.0) 34 (6) 12 (5) 46.9 (3.4) 4628.9
Autumn 38.1 (17.0) 7694.0 (981.5) 60 (8) 30 (5) 20.6 (15.6) 68589.4
Winter 13.9 (5.4) 6310.0 (1026.8) 50 (15) 30 (5) 25.6 (20.2) 20872.7
Spring 16.3 (9.5) 6032.7 (1342,2) 55 (8) 30 (5) 28.2 (13.3) 26865.3 Setú
bal
Summer 14.3 (14.0) 5508.8 (2991.9) 55 (10) 30 (5) 24.2 (13.0) 23673.7
TOTAL 170.9 42039.8 346 168 275.7 172597.4
R. undulata, Raja clavata (Linnaeus, 1758), Raja brachyura (Günther, 1880), S.
maximus, O. vulgaris and S. solea were the most important retained bycatches for this
fishery revenues (considering weigh captured and species economic value). Catches of
cuttlefish were higher in autumn and winter and attained higher values in Setúbal than
in Sesimbra (Figure 8.2a). Catches of this species were negligible, in spring and
summer, in both fishing areas. The Senegalese sole was the most captured flatfish
species, being caught all over the year. A marked trend with higher values in spring
and summer was observed in the catches of S. senegalensis in Sesimbra. In Setúbal,
catches were more constant and with an opposite trend in respect to Sesimbra, where
a marked increase was noticeable in catches from winter to spring (maximum
catches); in Setúbal a less evident seasonal variation pattern was outlined, with
maximum catches in winter, decreasing in spring and summer. In general, catches of
target species (Senegalese sole and cuttlefish) were always higher in Setúbal than in
Sesimbra, except Senegalese sole in spring and summer.
Octopus is also captured all over the year, with high catches in Setúbal every season,
except in summer (Figure 8.2b). In Sesimbra, its captures are minimal in autumn
showing an increase trend to spring when attained the maximum capture rate and a
little decrease between spring and summer captures was found. In Setúbal catches of
O. vulgaris showed a different trend: captures recorded a decrease from winter
(maximum captures) to summer (minimum captures); in autumn the captures had
also low rates.

CHAPTER 8
183
(a) (b) Figure 8.2. Seasonal variation of total catches of the eight species responsible from higher
incomes to fishermen ((a) Solea senegalensis and Sepia officinalis; (b)
Octopus vulgaris, Raja brachyura, Raja undulata, Raja clavata, Scophthalmus
maximus and Solea solea), in Sesimbra and Setúbal.
As it can be seen in Table 8.1 and Figure 8.2b, the majority of skates’ species had true
importance as retained bycatch and there was a relevant seasonality in catches. In
Setúbal, R. undulata was the skate most captured attaining higher captures during
winter and spring. In this harbour captures of R. clavata were low in winter,
increasing in spring to near 9 kg.10000m-1net and turn down to a little bit lower
captures in summer; R. brachyura showed the lower captures of the three
0
10
20
30
40
50
60
70
80
90
100
110
Autumn Winter Spring Summer Autumn Winter Spring Summer
Sesimbra Setúbal
Catc
hes
(kg. 10000m
S. officinalis S. senegalensis
Cat
ches
(kg
.10000 m
-1)
0
5
10
15
20
25
30
35
Autumn Winter Spring Summer Autumn Winter Spring Summer
Sesimbra Setúbal
Catc
hes
(kg. 10000m
O. vulgaris R. brachyura R. undulata R. clavata S. maximus S. solea
Cat
ches
(kg
.10000 m
-1)

Catches of Target Species and Bycatches of an Artisanal Fishery
184
skates analysed, attaining higher captures in autumn and winter. In contrast, R.
brachyura was the most captured skate in Sesimbra where captures were higher than
those obtained to R. undulata in Setúbal, accounting with near 33 kg.10000 m-1 of net
in autumn. However, in winter and summer R. brachyura was low captured in both
studied sites. Catches of R. undulata were higher in spring, achieving lower values
than in Setúbal. Finally, R. clavata presented a near constant trend in captures during
the four studied seasons, generally with lower values in Sesimbra than in Setúbal
(exception obtained in winter).
S. solea and S. maximus were lower captured (in weigh) than the other species
considered in the seasonality analyses. However, they attain the highest market
values of all species sold in Portuguese fishing docks, being of really economic
importance to this fishery. Vessels from Setúbal just caught S. solea in autumn while
in Sesimbra this species was captured in all seasons, except in spring, but higher
captures of S. solea were obtained in winter. S. maximus showed higher captures in
summer, in Setúbal, and revealed short variation along other seasons and sites.
The CA performed regarding discarded species biomass showed that total catches of
each trip, fishing time and number of species caught were the principal factors
affecting discards (Figure 8.3a). The first two CA ordination axes explained 44.3% of
total variance.
The CA performed based on number of individuals discarded (Figure 8.3b) revealed a
similar pattern to that obtained using biomass, emphasising the role of total catches
per trip, fishing time and number of species caught as important factors affecting
discards. In this approach, latitude also appears as an important factor affecting
discards. The first two CA ordination axes explained 42.7% of total variance. Depth
appears to be a factor with low influence in discards of the studied fishery.
Both ordination diagrams obtained shows a slightly separation between discards from
Sesimbra and Setúbal. Discards obtained in Sesimbra seems to be more correlated
with higher depths, latitudes, species richness and fishing times and lower total
catches than the ones from Setúbal surveys.
Results of CA showed that a separation between seasons occurs also. Thus, samples
from autumn and winter are in general closely each other and slightly distant from
samples obtained in spring and summer which are closely between them. In the
analyses with the number of individuals discarded the seasonal pattern is clearer,
although it occurs also in the analyses of discarded biomass. In Figure 8.3a almost all
samples from spring and summer appear in the left side of the ordination diagram
since they are characterized by higher diversity of species caught per trip, lower total
catches in each trip and lower fishing time than in autumn and winter.
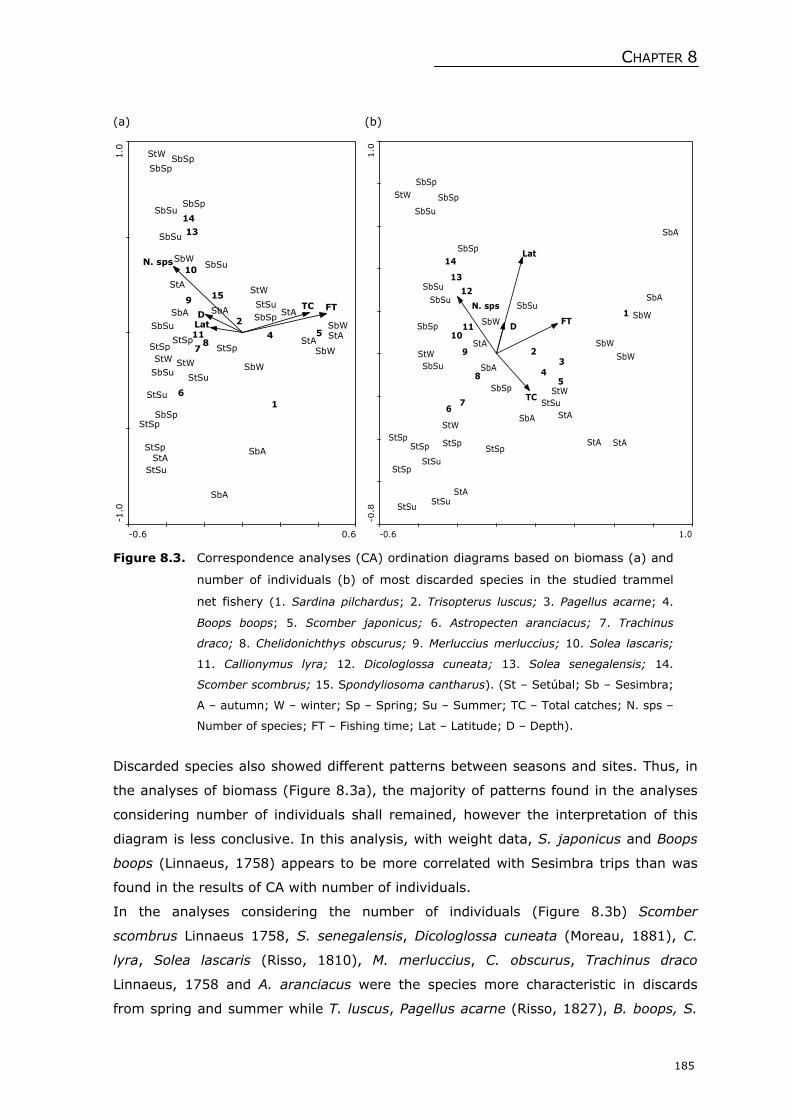
CHAPTER 8
185
(a) (b) Figure 8.3. Correspondence analyses (CA) ordination diagrams based on biomass (a) and
number of individuals (b) of most discarded species in the studied trammel
net fishery (1. Sardina pilchardus; 2. Trisopterus luscus; 3. Pagellus acarne; 4.
Boops boops; 5. Scomber japonicus; 6. Astropecten aranciacus; 7. Trachinus
draco; 8. Chelidonichthys obscurus; 9. Merluccius merluccius; 10. Solea lascaris;
11. Callionymus lyra; 12. Dicologlossa cuneata; 13. Solea senegalensis; 14.
Scomber scombrus; 15. Spondyliosoma cantharus). (St – Setúbal; Sb – Sesimbra;
A – autumn; W – winter; Sp – Spring; Su – Summer; TC – Total catches; N. sps –
Number of species; FT – Fishing time; Lat – Latitude; D – Depth).
Discarded species also showed different patterns between seasons and sites. Thus, in
the analyses of biomass (Figure 8.3a), the majority of patterns found in the analyses
considering number of individuals shall remained, however the interpretation of this
diagram is less conclusive. In this analysis, with weight data, S. japonicus and Boops
boops (Linnaeus, 1758) appears to be more correlated with Sesimbra trips than was
found in the results of CA with number of individuals.
In the analyses considering the number of individuals (Figure 8.3b) Scomber
scombrus Linnaeus 1758, S. senegalensis, Dicologlossa cuneata (Moreau, 1881), C.
lyra, Solea lascaris (Risso, 1810), M. merluccius, C. obscurus, Trachinus draco
Linnaeus, 1758 and A. aranciacus were the species more characteristic in discards
from spring and summer while T. luscus, Pagellus acarne (Risso, 1827), B. boops, S.
-0.6 0.6
-1.0
1.0
6
8411
9 15
5
10
1
14
13
7
2
SbA
SbA
SbASbA
SbW
SbW
SbW
SbWSbSp
SbSp
SbSp
SbSpSbSp
SbSu
SbSu
SbSu
SbSu
SbSu
StA
StA
StA
StA
StA
StW
StW
StW
StW
StSpStSp
StSp
StSp
StSp
StSu
StSu
StSu
StSuD
N. sps
FT
Lat
TC
-0.6 1.0
-0.8
1.0
6
8 4
11
12
93
5
10
1
14
13
7
2
SbA
SbA
SbA
SbA
SbWSbW
SbW
SbW
SbSp
SbSp
SbSp
SbSp
SbSp
SbSu
SbSuSbSu
SbSu
SbSu
StA
StA
StA
StA
StA
StW
StW
StW
StW
StSp
StSpStSp
StSp StSp
StSuStSu
StSu
StSu
D
N. sps
FT
Lat
TC
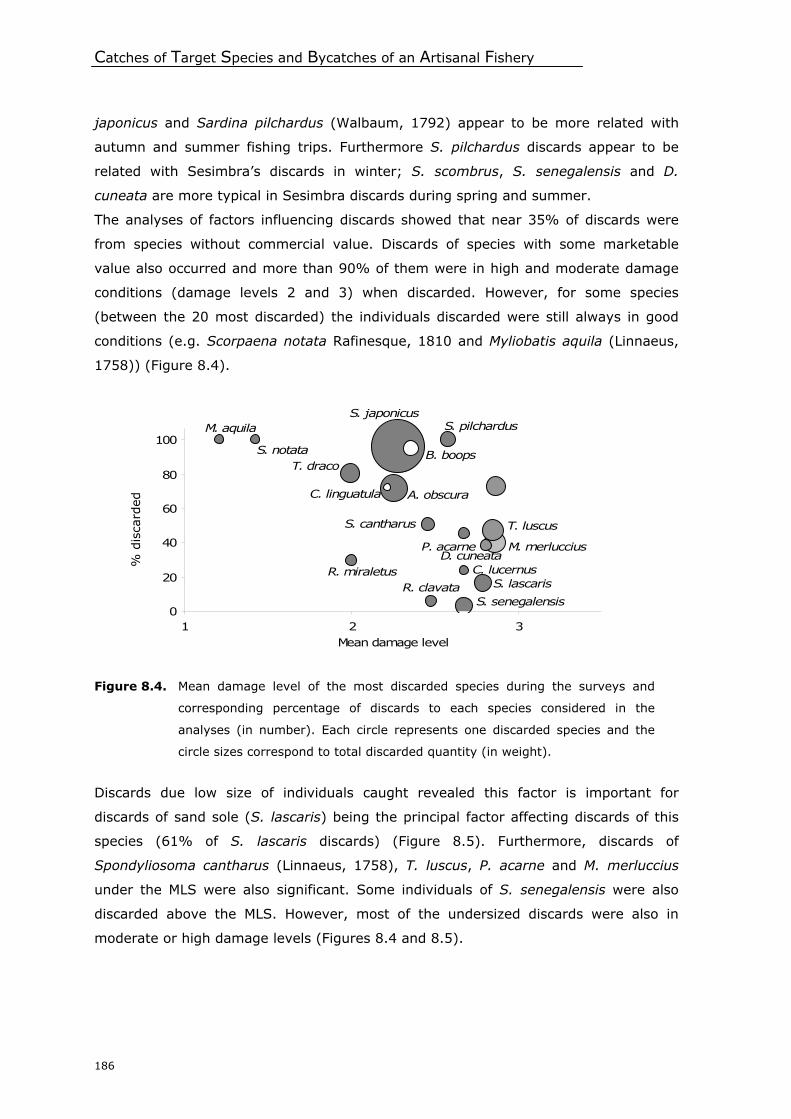
Catches of Target Species and Bycatches of an Artisanal Fishery
186
japonicus and Sardina pilchardus (Walbaum, 1792) appear to be more related with
autumn and summer fishing trips. Furthermore S. pilchardus discards appear to be
related with Sesimbra’s discards in winter; S. scombrus, S. senegalensis and D.
cuneata are more typical in Sesimbra discards during spring and summer.
The analyses of factors influencing discards showed that near 35% of discards were
from species without commercial value. Discards of species with some marketable
value also occurred and more than 90% of them were in high and moderate damage
conditions (damage levels 2 and 3) when discarded. However, for some species
(between the 20 most discarded) the individuals discarded were still always in good
conditions (e.g. Scorpaena notata Rafinesque, 1810 and Myliobatis aquila (Linnaeus,
1758)) (Figure 8.4).
Figure 8.4. Mean damage level of the most discarded species during the surveys and
corresponding percentage of discards to each species considered in the
analyses (in number). Each circle represents one discarded species and the
circle sizes correspond to total discarded quantity (in weight).
Discards due low size of individuals caught revealed this factor is important for
discards of sand sole (S. lascaris) being the principal factor affecting discards of this
species (61% of S. lascaris discards) (Figure 8.5). Furthermore, discards of
Spondyliosoma cantharus (Linnaeus, 1758), T. luscus, P. acarne and M. merluccius
under the MLS were also significant. Some individuals of S. senegalensis were also
discarded above the MLS. However, most of the undersized discards were also in
moderate or high damage levels (Figures 8.4 and 8.5).
S. senegalensis
S. pilchardus
S. cantharus
P. acarne
R. miraletus
S. notata
S. japonicus
T. draco
S. lascarisR. clavata
M. aquila
C. lucernus
B. boops
A. obscuraC. linguatula
M. merluccius
T. luscus
D. cuneata
0
20
40
60
80
100
120
1 2 3Mean damage level
% d
isca
rde
% d
isca
rded

CHAPTER 8
187
Figure 8.5. Relationship between percentage of individuals under minimum landing size
(MLS) and percentages of discards for most discarded species which are under
MLS legislation. Each circle represents one discarded species and the circle
sizes correspond to total discarded quantity (in weight). Often the catches landed at fishing docks were not exactly the same as those
determined aboard fishing vessels (Figure 8.6). The major discrepancies between
catches and landings weights were obtained for S. senegalensis: 62% and 31% of fish
was not sold at fishing docks, in spring and summer respectively. The higher
proportions of the catches retained by fishermen for food consumption or direct sale to
local markets or restaurants were registered when mean prices were higher and also
in seasons where total catches of the main 3 species (i.e. S. senegalensis, S. solea, S.
maximus) were higher.
M. merluccius
P. acarne S. cantharus
S. japonicus
S. lascaris
S. pilchardus
S. scombrus
S. senegalensis
T. luscus
-20
0
20
40
60
80
100
120
-20 -10 0 10 20 30 40 50 60 70 80
% ind. < MLS
% d
isca
rde
% d
isca
rded
0
0

Catches of Target Species and Bycatches of an Artisanal Fishery
188
Figure 8.6. Seasonal variation of catches of S. maximus, S. senegalensis and S. solea
(in weight) according with their final destiny (landed at fishing docks or
other destiny, including own consumption and illegal sales). The dashed
line above bars corresponds to the mean price (€ kg-1) for each species in
each season.
DISCUSSION
Regarding catch composition of the studied trammel net fishery, we conclude that S.
senegalensis and S. officinalis were the most important species in this fishery, as
would be expected since they are its target species. Although S. solea had been
considered a target species, their significance in total catches is lower than was found
to the other target species. This species apparently has lower populations in study
area than S. senegalensis, and also shows a higher seasonal variance in captures, as
well as cuttlefish, whose captures were almost inexistent during spring and summer.
Likewise the seasonal increase in landings is also probably related to reproductive
strategies. Cuttlefish, for example, assembles in coastal areas outside estuaries (high
captures in coastal fisheries) before they enter in estuaries to spawn (Serrano, 1992).
The existence of different resources in the study area is of great importance to the
studied fishery, since when the principal resources have lower catch rates fishermen
can slightly avoid the decline in revenues through the improvement of bycatch
0
2000
4000
6000
8000
10000
12000
14000
16000
18000
20000
22000
24000
26000
28000
30000
32000
S. m
axim
us
S.
senegale
nsis
S. so
lea
S. m
axim
us
S.
senegale
nsis
S. so
lea
S. m
axim
us
S.
senegale
nsis
S. so
lea
S. m
axim
us
S.
senegale
nsis
S. so
lea
Autumn Winter Spring Summer
Weig
ht (g
10,0
00 m
0
5
10
15
20
25
Price
(€ k
g-
Fishing dock
Other destiny
Mean price (€ kg-1)
Price (€ kg
-1)
Wei
ght
(kg 1
0000 m
-1)
Fishing dock Other destiny Mean price (€ kg-1)
S.
max
imus
S.
seneg
alen
sis
S.
sole
a
S.
max
imus
S.
seneg
alen
sis
S.
sole
a
S.
max
imus
S.
seneg
alen
sis
S.
sole
a
S.
max
imus
S.
seneg
alen
sis
S.
sole
a Autumn Winter Spring Summer

CHAPTER 8
189
species, maintained their activity economically sustainable. Autumn and winter seems
to be the most profitable seasons for fishermen in the studied fishery, with high
captures of most valuable species. Thus, the abundances of captures can be due to
species life cycle, as highlighted above, but also due fishermen choices and also
vessels and gears technical characteristics (Le Pape and Vigneau, 2001). Our results
showed that in Sesimbra S. senegalensis captures had increased from winter to
spring, while in Setúbal they experimented a slightly decrease. From winter to spring,
S. officinalis is almost inexistent in the study area, meaning that fishermen possibly
direct their effort to catch S. officinalis during autumn and winter and consequently
captures of S. senegalensis are lower than they could be if fishermen exclusively had
directed their effort to them. Similar considerations can also be made to the other
target and relevant non-target species (e.g. skates, octopus), which emphasize that
although controlled by biological and environmental factors, human economic-social
constrains are extremely important in these type of fisheries (Merino et al., 2008;
Reglero and Morales-Nin, 2008).
Furthermore, our results showed that there are some retained bycatch species whose
relevance in final revenues is also high, such as skates (R. clavata, R. undulata, R.
brachyura), octopus (O. vulgaris) and some flatfish species (S. maximus). Fishermen
retained all species that have some commercial value but when only one or a few
individuals of one valuable species were captured, fishermen kept them for personal
consumption, due to the low selling value that they would have at the fishing dock,
which was also concluded by Gonçalves et al. (2007) for a similar fishery in the
southern coast of the country.
The results obtained in this study revealed there were a great number of species
caught in this trammel net fishery. Of all species caught, 98 was discarded once at
least. In the Algarve fisheries (southern Portugal), Erzini et al. (2002) found that 78
species were discarded in trammel nets fishery, while Gonçalves et al. (2007, 2008a)
identified a higher number of discarded species for the same area, 105 and 156,
respectively. However, lower diversity of discarded species was found in some studies
regarding trammel nets fishery in the Mediterranean (Stergiou et al., 2006; Gonçalves
et al., 2007).
In which respect to discards ratio, the present study found one of the highest values
for percentage of discards in trammel nets fisheries (21.9% in weight and 52.8% of
the total number of individuals). Percentage of discards found in this study is higher
than reported in other works regarding trammel nets in the Algarve coast: Borges et
al. (2001) found a discard ratio of 13% (in weight) and Gonçalves et al. (2007)
determined a discard ratio of 49% (in number of individuals). Thus, differences
Catches of Target Species and Bycatches of an Artisanal Fishery
190
between discarded rates using the same gear could be related to local species
diversity, to environmental constrains, social-economic aspects or simply due random
factors. The south coast of Portugal (Algarve) usually has lower hydrodynamics and
less storm days at sea than the west coast (source: Instituto Hidrográfico), which can
contribute to lower bycatch rates found in that area. During our observations after
storming days, the species entangled usually showed higher degradation signs and, on
the other hand, storming days lead to higher soak times since fishermen left nets
soaked during those periods.
However, species discarded from trammel nets have been far greater than that of
other static gears such as longlines or gill nets (Borges et al., 2001). Thus, we can
conclude that although trammel nets are considered a selective gear, they are not
species selective and they present lower selectivity than other gears with the same
classification.
The discard ratio of the studied fishery is similar to that found by Borges et al. (2001)
for demersal purse-seine fisheries in southern Portugal (near 20%) and showed lower
rates than was found in fish trawl fishery (62%), crustacean trawl fishery (70%)
(Borges et al., 2001) and demersal purse-seine (near 51%) (Gonçalves et al., 2008b)
in south Portuguese coast and than it was estimated for beach seine fishery (44%) in
the central coast of Portugal (Cabral et al., 2003). In the North Sea, soles are mainly
caught by beam trawlers, for which a high level of discards is also reported: per each
kilogram of S. solea caught, 11.4 kilograms are discarded, mainly other flatfishes
(Garthe and Damm, 1997).
The differences found in discard ratios of several fisheries, even using the same gear
and in adjacent areas, indicate the need to evaluate discards for each fishery. Thus,
long-term monitoring is required to improve our understanding of the factors affecting
discarding and of the implications of such levels of discarding on a fragile and stressed
environment (Hollingworth, 2000; Kaiser and de Groot, 2000). The discards of the
studied fishery were estimated as about 174 tonnes per year. However, we can not
assess what this means in which respects to ecosystem level impacts because
although the great number of studies about bycatch composition or bycatch rates in
fisheries around the world, little is known about the fate of these discards and their
real impact on ecosystems (ICES, 1998; Tingley et al., 2000; Monteiro et al., 2001).
However, it is likely that the type of discarding associated with purse seines that fish
in relatively shallow water, often involving large quantities released over a short
period of time in a small area may have a greater potential impact on the ecosystem
than trawl discarding that takes place as the trawler is moving, over periods of time.
Thus, trawl discards are dispersed over a much wider area and the continuous stream

CHAPTER 8
191
of discards going overboard allows sea birds more opportunity to scavenge than when
a large catch is slipped (Erzini et al., 2002). Follow this assumption, discards from
trammel nets fishery can be considered as having less impact in the ecosystem than
seiners or trawlers, since their discards are made in little amounts along all net length
and during a long time period. However, the high importance of small-scale fisheries,
which contribute to most of the total captures worldwide, lead us to think that their
global capacity to disturbing ecosystems could match large-scale fisheries (Bundy and
Pauly, 2001; Díaz-Uribe et al., 2007).
There are many reasons for discards (Clucas, 1997), however, in most situations, the
decision by fishermen to discard components of their catch is driven by economic
factors (FAO, 1999). In this study the main reasons for discards were found to be the
low or inexistent selling price of the species and fishes’ damage condition. Borges et
al. (2001) reported that poor condition of the catch after the nets have been set for
periods of up to 12 h or more is the main reason for discards of trammel nets. Acosta
(1994) showed that higher soak times does not represent higher efficiency and the
proportion of dead fish and the spoiled degree increases with the increase of soak
time. Restrictions on the fish landings and undersized fish are also strong motives for
discards in other fisheries, namely the North Sea flatfish fishery, where undersized
plaice is highly discarded (Clucas, 1997) although in the present study the capture of
undersized fishes is rare due to size selective characteristics of the gear.
So, in order to reduce discards of the trammel net fishery existing regulation could be
enforced, namely in which respects to nets soak time. In Sesimbra, almost all vessels
included in the studied métier also had traps for catching cephalopods, hauling each
kind of gear in alternating days. Consequently, fishermen from Sesimbra left them
nets at sea more than 48 hours and nets usually became soaked during all weekend in
both studied harbours. Those behaviours should be avoided in order to minimize the
amount of damage fishes, allowing them to be sold. Another measure to reduce
discards could be the development of more appropriate net configurations,
independent of mesh size, as suggested by Gray (2002) for a multi-species gill net
fishery. Besides this, some adjustment on fisheries legislation could also minimize
bycatch, namely in which respect to minimum landing sizes. In the present analyses of
bycatch, we found that 60% of S. lascaris captures are under the MLS (some of them
were retained to fishermen own consumption). However, this species are under the
same legislation as S. senegalensis and S. solea (MLS is 240 mm). We considerer that
the MLS for S. lascaris should be revised since individuals became mature at lower
lengths than the other to species of genus Solea spp. (Cabral et al., 2007; Teixeira et
al., in press).
Catches of Target Species and Bycatches of an Artisanal Fishery
192
In addition to all impacts in the marine ecosystems due discard practices, all
bycatches constitute a higher amount of unreported data that could be of great
importance in the stock evaluation or in the analyses of the results of recovery
programs applied to species that are bycatch of other fisheries. In fisheries where
there is not a continuous monitoring, especially in fisheries as the studied one, whose
captures are so variable and influenced by so many factors, great amounts of
important data are unknown. Mettling et al. (1995) estimated that 40% of French
catches are unreported and we think that in Portugal the percentage is not lower
certainly.
Most of the small-scale fisheries around the world has no management and when it
exist is based in landing data and consequently without taking in consideration
bycatch or discards neither continuous monitoring (Lleonart and Maynou, 2003;
Merino et al., 2008).
Moreover, bycatch captures are not the only reason for incorrect fisheries statistics,
also target species records are underestimations of the catches of commercially
important species because there are an important fraction of their catches that is not
declared and sold at the fishing docks, as it should be, and consequently does not part
of the fisheries statistics. Concerning the most valuable species, namely S.
senegalensis, S. solea and S. maximus, the highest differences between landings and
captures corresponds to periods when prices and total catches are higher. This
happens essentially in spring and summer, when catches and landings differ 62% and
31%, respectively. In these seasons selling prices for these species are much higher
as a result of an increase in demand. Fishes are often sold directly to restaurants,
which pay more than fishing docks. This is a common practice in other Portuguese
fisheries, such as beach seine fishery, where a large proportion of the catches with
higher commercial value is sold directly after capture at the beach (Cabral et al.,
2003).
Catch trends constitutes a conceptually simple and meaningful indicator to
characterise fisheries status. Nonetheless, the use of this indicator to define
sustainability and to characterize the ‘health’ of fish stocks might be dangerous and
controversial (Mullon et al., 2005). In the studied trammel net fishery, the only
available evaluation of stock possible is based on official data landings, which are
incomplete as outlined above. Aiming for a better management of fisheries resources,
the use of effective total catches would be of great importance. Thus, incentives for
fishermen (such as more competitive prices and better market strategies in fishing
docks) to land an increasing fraction of fish caught should be implemented. Some EU
countries, including Portugal, have in practice sampling programmes to determine and

CHAPTER 8
193
monitor bycatches (Tingley et al., 2000). However, the Portuguese sampling surveys
in the scope of this programme are quite limited, which constrains its use on a broader
fisheries context.
Thus, the lack of quantitative data on a spatial and temporal scale strongly reduces
the chance of developing management measures to make fishing methods sustainable
in the long term (Colloca et al., 2004). Moreover, it is necessary to develop
standardized data collection routines and indicators of fishing effort for Portuguese
artisanal fisheries that allow scientists and fisheries managers the possibility of work
with data that consider all catches, bycatches and other usually unreported captures.
ACKNOWLEDGEMENTS
We thank the crews of the vessels sampled for their help. We are also grateful to all
the volunteers that helped in sampling work. This study was funded by the European
Union through the FEDER–Fisheries Programme (MARE) and by the Fundação para a
Ciência e a Tecnologia (FCT), through the grant attributed to C.M. Teixeira (Grant
SFRH/BD/19319/2004).
REFERENCES
Acosta, A.R., 1994. Soak time and net length effects on catch rate of entangling nets in
coral reef areas. Fisheries Research 19, 105–119.
Ainsworth, C.H., Pitcher, T.J., 2005. Estimating illegal, unreported and unregulated catch
in British Columbia’s marine fisheries. Fisheries Research 75, 40–55.
Alverson, D.L., Freeberg, M.H., Murawski, S.A., Pope, J.G., 1994. A global assessment of
fisheries bycatch and discards. FAO Fisheries Technical Paper: 339. FAO, Rome.
Baeta, F., Cabral, H.N., 2005. Status of Portuguese Fisheries. Technical Report. Instituto
de Oceanografia.
Borges, L., Rogan, E., Officer, R., 2005. Discarding by the demersal fishery in the waters
around Ireland. Fisheries Research 76, 1–13.
Borges, T.C., Erzini, K., Bentes, L., Costa, M.E., Gonçalves, J.M.S., Lino, P.G., Pais, C.,
Ribeiro, J., 2001. Bycatch and discarding practices in five Algarve (southern Portugal)
métiers. Journal of Applied Ichthyology 17, 104–114.
Bundy, A., Pauly, D., 2001. Selective harvesting by small-scale fisheries: ecosystem
analysis of San Miguel Bay, Philippines. Fisheries Research 53, 263–281.
Catches of Target Species and Bycatches of an Artisanal Fishery
194
Cabral, H., Duque, J., Costa, M.J., 2003. Discards of the beach seine fishery in the central
coast of Portugal. Fisheries Research 63, 63–71.
Cabral, H.N., Teixeira, C.M., Marques, J.F., Batista, M.I., Baeta, F., Teixeira, T., Costa,
M.J., 2007. Fisheries biology and management of flatfishes of the Portuguese coast:
contributes to the sustainable management of resources. Technical Report. Instituto de
Oceanografia.
Catchpole, T.L., Frid, C.L.J., Gray, T.S., 2005. Discarding in the English north-east coast
Nephrops norvegicus fishery: the role of social and environmental factors. Fisheries
Research 72, 45–54.
Clucas, I., 1997. A study of the options for utilization of bycatch and discards from marine
capture fisheries. FAO Fisheries Circular 928. FAO, Rome.
Colloca, F., Crespi, V., Cerasi, S., Coppola, S.R., 2004. Structure and evolution of the
artisanal fishery in a southern Italian coastal area. Fisheries Research 69, 359–369.
DGPA, 2006. Datapescas N.º 71, Janeiro-Dezembro 2006. Direcção Geral de Pescas e
Aquacultura, 11 pp.
Diaz-Uribe, J.G., Arreguin-Sanchez, F., Cisneros-Mata, M.A., 2007. Multi-species
perspective for small-scale fisheries management: A trophic analysis of La Paz Bay in
the Gulf of California, Mexico. Ecological Modelling 201, 205–222.
Erzini, K., Monteiro, C.C., Ribeiro, J., Santos, M.N., Gaspar, M., Monteiro, P., Borges, T.C.,
1997. An experimental study of gill net and trammel net 'ghost fishing' off the Algarve
(southern Portugal). Marine Ecology Progress Series 158, 257–265.
Erzini, K., Costa, M.E., Bentes, L., Borges, T.C., 2002. A comparative study of the species
composition of discards from five fisheries from the Algarve (southern Portugal).
Fisheries Management and Ecology 9, 31–40.
Erzini, K., Gonçalves, J.M.S., Bentes, L., Moutopoulos, D.K., Casal, J.A.H., Soriguer, M.C.,
Puente, E., Errazkin, L.A., Stergiou, K.I., 2006. Size selectivity of trammel nets in
southern European small-scale fisheries. Fisheries Research 79, 183–201.
FAO, 1999. The state of world fisheries and aquaculture 1998. FAO, Rome.
FAO, 2003. Strategies for increasing the sustainable contribution of small-scale fisheries to
food security and poverty alleviation. FAO, Rome. 1–14.
FAO, 2004. Report of the Second Session of the Working Party on Smallscale Fisheries.
FAO Fish. Rep. 735, pp. 1–21.
Garthe, S., Damm, U., 1997. Discards from beam trawl fisheries in the German Bight
(North Sea). Archive of Fishery and Marine Research 45, 223–242.
Goncalves, J.M.S., Stergiou, K.L., Hernando, J.A., Puente, E., Moutopoulos, D.K., Arregi,
L., Soriguer, M.C., Vilas, C., Coelho, R., Erzini, K., 2007. Discards from experimental
trammel nets in southern European small-scale fisheries. Fisheries Research 88, 5–14.
CHAPTER 8
195
Gonçalves, J.M.S., Bentes, L., Coelho, R., Monteiro, P., Ribeiro, J., Correia, C., Lino, P.G.,
Erzini, K., 2008a. Non-commercial invertebrate discards in an experimental trammel
net fishery. Fisheries Management and Ecology 15, 199–210.
Gonçalves, J.M.S., Bentes, L., Monteiro, P., Coelho, R., Corado, M., Erzini, K., 2008b.
Reducing discards in a demersal purse-seine fishery. Aquatic Living Resources 21, 135–
144.
Gray, C.A., 2002. Management implications of discarding in an estuarine multi-species gill
net fishery. Fisheries Research 56, 177–192.
Hall, S.J., 1999. The effects of Fishing on Marine Ecosystems and Communities. Blackwell
Science, London.
Hall, S.J., Mainprize, B.M., 2005. Managing by-catch and discards: how much progress are
we making and how can we do better? Fisheries Research 6, 134–155.
Hollingworth, C.E., 2000. Ecosystem effects of fishing. Proceedings of an ICES/SCOR
Symposium Held in Montpellier, France, 16-19 March 1999. ICES Journal of Marine
Science. 327 pp.
ICES, 1998. Report of the working group on ecosystem effects of fishing activities. ICES
CM 1998/ACFM/ACME: 1 Ref. E. 263 pp.
INE, 2006. Estatísticas da pesca 2005. Instituto Nacional de Estatística, I.P., Lisboa. 75 pp.
Kaiser, M.J., de Groot, S.J., 2000. Effects of Fishing on Non-Target Species and Habitats.
Biological, Conservation and Socio-Economic Issues. Blackwell Science, Oxford.
Le Pape, O., Vigneau, J., 2001. The influence of vessel size and fishing strategy on the
fishing effort for multispecies fisheries in northwestern France. ICES Journal of Marine
Science 58, 1232–1242.
Lleonart, J., Maynou, F., 2003. Fish stock assessments in the Mediterranean: state of the
art. Scientia Marina 67, 37–49.
McGoodwin, J.R., 1990. Crisis in the World’s Fisheries: People, Problems and Policies.
Stanford Univerisity Press, Stanford, California.
Merino, G., Morales-Nin, B., Maynou, F., Grau, A.M., 2008. Assessment and bioeconomic
analysis of the Majorca (NW Mediterranean) trammel net fishery. Aquatic Living
Resources 21, 99–107.
Mettling, B., Henaff, P., Mingasson, A., Menanteau, J.P., 1995. Rapport d’audit sur la
situation financière dês navires de pêche artisanale et des rganismes d’intervention.
Rapport du ministére de l’agriculture et de la pêche, Paris, France. 31 pp.+appendix.
Monteiro, P., Araújo, A., Erzini, K., Castro, M., 2001. Discards of the Algarve (southern
Portugal) crustacean trawl fishery. Hydrobiologia 449, 267–277.
Mullon, C., Fréon, P., Cury, P., 2005. The dynamics of collapse in world fisheries. Fish and
Fisheries 6, 111–120.
Catches of Target Species and Bycatches of an Artisanal Fishery
196
Reglero, P., Morales-Nin, B., 2008. Relationship between first sale price, body size and
total catch of trammelnet target species in Majorca (NW Mediterranean). Fisheries
Research 92, 102–106.
Rochet, M.J., Péronnet, I., Trenkel, V.M., 2002. An analyses of discards from the French
trawler fleet in the Celtic Sea. ICES Journal of Marine Science 59, 538–552.
Sánchez, P., Demestre, M., Martín, P., 2004. Characterization of the discards generated by
bottom trawling in the northwestern Mediterranean. Fisheries Research 67, 71–80.
Serrano, M.D., 1992. Contribuição para o conhecimento da biologia e da pescaria do choco,
Sepia officinalis (Linnaeus, 1758) no Estuário do Sado e Zona Costeira Adjacente.
Relatórios Científicos e Técnicos INIP, Lisboa. 26 pp.
Stergiou, K.I., Petrakis, G., Politou, C.Y., 1996. Small-scale fisheries in the south Euboicos
Gulf (Greece): species composition and gear competition. Fisheries Research 26, 325–
336.
Stergiou, K.I., Christou, E.D., Georgopoulos, D., Zenetos, A., Souvermezoglou, C., 1997.
The Hellenic Seas: physics, chemistry, biology and fisheries. Oceanography Marine
Biology: an Annual Review 35, 415–538.
Stergiou, K.I., Moutopoulos, D.K., Soriguer, M.C., Puente, E., Lino, P.G., Zabala, C.,
Monteiro, P., Errazkin, L.A., Erzini, K., 2006. Trammel net catch species composition,
catch rates and métiers in southern European waters: A multivariate approach.
Fisheries Research 79, 170–182.
ter Braak, C.J.F., Šmilauer, P., 2002. CANOCO Reference Manual and CanoDraw for
windows User’s Guide: Software for Canonical Community Ordination. Version 4.5.
Microcomputer Power, Ithaca, New York, USA.
Teixeira, C.M., Pinheiro, A., Cabral, H.N., in press. Feeding ecology, growth and sexual
cycle of the sand sole, Solea lascaris, along the Portuguese coast. Journal of the Marine
Biological Association of the United Kingdom. doi:10.1017/S0025315409002562
Tingley, D., Erzini, K., Gouling, I., 2000. Evaluation of the state of knowledge concerning
discard practices in European fisheries. Final report. Megapesca Lda.
Tzanatos, E., Somarakis, S., Tserpes, G., Koutsikopoulos, C., 2007. Discarding practices in
a Mediterranean small-scale fishing fleet (Patraikos Gulf, Greece). Fisheries
Management and Ecology 14 (4), 277–285.
Walmsley, S.A., Leslie, R.W., Sauer, W.H.H., 2007. Bycatch and discarding in the South
African demersal trawl fishery. Fisheries Research 86, 15–30.

PART IV
Main Conclusions and
Final Remarks


CHAPTER 9


CHAPTER 9
201
Main Conclusions and
Final Remarks
The present work analysed several aspects of the bio-ecology and fisheries of the
most commercially important flatfishes in the Portuguese coast. The study of the
feeding habits revealed that soles and bastard sole fed mainly on crustaceans,
polychaetes and molluscs, while spotted flounder and four-spotted megrim consumed
more intensively fishes, decapods and mysids, and founder fed preferentially
echinoderms, crustaceans and bivalves (Chapters 2, 3 and 4). Diet composition varied
with season, sex and size class. All species considered in this study showed a
differential growth according to sex (Chapters 2, 3 and 4). The estimated asymptotic
lengths were highest for females than males, with the exception of spotted flounder.
Spawning occurred mainly in autumn-winter for common sole, Senegalese sole, four-
spotted flounder and flounder, spanning into spring for the sand sole, and throughout
the year for spotted flounder and bastard sole (Chapters 2, 3 and 4). Our results
showed that age at first maturity of females and males was similar, except for
flounder.
The genetic analysis of two sympatric species, common sole and Senegalese sole,
revealed that both have a low haplotype diversity and a moderate to high nucleotide
diversity (Chapter 5). Common sole presented a population structure with a genetic
divergence between Atlantic and Mediterranean populations, and between west and
east Mediterranean populations. For the Senegalese sole a pattern of genetic
heterogeneity among populations separated geographically was evidenced.
Main Conclusions and Final Remarks
202
Multi-species fisheries, as is the case of flatfish fisheries in Portugal, are extremely
complex to evaluate and manage. Catches result from a variety of fishing grounds,
and several species are targeted by these fisheries which use different gears.
Furthermore factors like environmental conditions, economics or individual fishers’
behaviour also influence catches. The artisanal flatfish fisheries in the Portuguese
coast exhibited a marked spatial and temporal variation of fishing practices, whereby a
given fleet may change its target species, gear type or fishing location in short time
scales. A marked seasonal variation was found for these fisheries (Chapter 6) and
different fleet components, targeting some particular species, were identified (Chapter
7). The variety of species captured, gears used, and the use of a wide range of landing
sites make it difficult to evaluate the stocks exploitation status of the resources and
the fishing intensity exerted. Efficiency varies among individual vessels owing to
differences in the skill of the fishers and vessel characteristics (e.g. Squires and
Kirkley, 1999), and it may increase over time through continuous developments in the
fishing industry (e.g. Ulrich et al., 2002; O’Neill et al., 2003).
In the Portuguese multi-species fisheries only a fraction of the catches are relative to
target species, and, thus, a wide variety of non-target species are also captured.
Some of the bycatch species have commercial value and can be sold, while others are
discarded (e.g. fish are damaged, prohibited species, less than legal minimum landing
size). Bycatches represented near 60% of total catches of the trammel net fishery in
the central coast of Portugal, of which about 40% were discarded (Chapter 8). This
study revealed that this fleet, composed by ca. 200 vessels, discarded 174 tonnes per
year. Solutions to discard problems in multi-species fisheries elsewhere include the
development of more selective fishing gear and practices that minimize the capture of
non-target species and undersize individuals of the target species (Gray et al., 2001).
Bycatch contributes to changing the structure of marine communities and/or
ecosystems and to biological overfishing, with serious implications for marine
populations and the overall health and sustainability of ecosystems (e.g. Kaiser and
De Groot, 2000; Kelleher, 2005).
The present work represents the first integrative approach to the study of flatfish
subjected to fisheries in the Portuguese coast, but further studies are needed in order
to provide a good scientific knowledge on these species and for management
purposes. Some of the topics that need to be addressed are length-frequency
distribution analysis of landings, characterization of the reproductive period through
the evaluation of the seasonal variation in gonads development, fecundity,
relationships between larvae, juvenile and adult stages, flatfish distribution and
abundance patterns, fishing effort and métiers involved in these small-scale fisheries.
CHAPTER 9
203
Furthermore, it would be particularly important to evaluate climate change and other
anthropogenic impacts on flatfish populations and fisheries.
Sustainable fisheries management is the challenge in nowadays fisheries, which is,
however, extremely difficult to reach, especially in these complex multi-species and
multi-gear fisheries and with scarce knowledge.
References
Gray, C.A., Kennelly, S.J., Hodgson, K.E., Ashby, C.J.T., Beatson, M.L., 2001. Retained and
discarded catches from commercial beach-seining in Botany Bay, Australia. Fisheries
Research 50, 205–219.
Kaiser, M.J., De Groot, S.J., 2000. Effects of Fishing on Non-Target Species and Habitats:
Biological, Conservation Socio-Economic Issues. Blackwell Science, Oxford.
Kelleher, K., 2005. Discards in the world’s marine fisheries: an update. FAO Fisheries
Technical Paper No. 470, 131 pp.
O’Neill, M.F., Courtney, A.J., Turnbull, C.T., Good, N.M., Yeomans, K.M., Smith, J.S.,
Shootingstar, C., 2003. Comparison of relative fishing power between different sectors
of the Queensland trawl fishery, Australia. Fisheries Research 65, 309–321.
Squires, D., Kirkley, J., 1999. Skipper skill and panel data in fishing industries. Canadian
Journal of Fisheries and Aquatic Sciences 56, 2011–2018.
Ulrich, C., Pascoe, S., Sparre, P.J., de Wilde, J.W., Marchal, P. 2002. Influence of trends in
fishing power on bioeconomics in the North Sea flatfish fishery regulated by catches or
by effort quotas. Canadian Journal of Fisheries and Aquatic Sciences 59, 829–843.
