stock futures block trade report€¦ · stock futures block trade report view by: instrument...
TRANSCRIPT

Stock Futures Block Trade Report
View By: Instrument Instrument Class:
As of date : 26/7/2018
Underlying Price (THB) OI (Contracts)
Total AOM Block Trade AOM Block Trade As of 26/07/2018 As of 26/07/2018
AAV AAVU18 28/09/2017 - 26/07/2018 27,828 728 27,100 2.62 97.38 4.6 9,687 43,394,473.91
AAV AAVZ18 28/12/2017 - 26/07/2018 3,803 203 3,600 5.34 94.66 4.6 327 1,423,907.44
AAV AAVH19 29/03/2018 - 26/07/2018 200 - 200 - 100 4.6 - -
AAV AAVM19 28/06/2018 - 26/07/2018 1,000 - 1,000 - 100 4.6 1,000 4,600,000.00
32,831 931 31,900 2.84 97.16 4.6 11,014 49,418,381.35
ADVANC ADVANCU18 28/09/2017 - 26/07/2018 31,492 1,032 30,460 3.28 96.72 199.5 1,208 233,098,506.29
ADVANC ADVANCZ18 28/12/2017 - 26/07/2018 2,278 85 2,193 3.73 96.27 199.5 442 84,888,738.81
ADVANC ADVANCH19 29/03/2018 - 26/07/2018 2,462 2 2,460 0.08 99.92 199.5 2 398,675.87
ADVANC ADVANCM19 28/06/2018 - 26/07/2018 - - - - - 199.5 - -
36,232 1,119 35,113 3.09 96.91 199.5 1,652 318,385,920.97
AMATA AMATAU18 28/09/2017 - 26/07/2018 154,643 1,639 153,004 1.06 98.94 20.5 5,141 104,273,507.77
AMATA AMATAZ18 28/12/2017 - 26/07/2018 7,254 114 7,140 1.57 98.43 20.5 519 10,472,295.29
AMATA AMATAH19 29/03/2018 - 26/07/2018 45 45 - 100 - 20.5 5 -
AMATA AMATAM19 28/06/2018 - 26/07/2018 - - - - - 20.5 - -
161,942 1,798 160,144 1.11 98.89 20.5 5,665 114,745,803.05
AOT AOTU18 28/09/2017 - 26/07/2018 96,811 3,196 93,615 3.3 96.7 66 5,134 327,657,818.43
AOT AOTZ18 28/12/2017 - 26/07/2018 26,666 1,215 25,451 4.56 95.44 66 3,695 232,758,395.33
AOT AOTH19 29/03/2018 - 26/07/2018 3,093 313 2,780 10.12 89.88 66 584 34,643,491.76
AOT AOTM19 28/06/2018 - 26/07/2018 421 21 400 4.99 95.01 66 1 62,707.84
126,991 4,745 122,246 3.74 96.26 66 9,414 595,122,413.36
AP APU18 28/09/2017 - 26/07/2018 54,738 138 54,600 0.25 99.75 9.05 15,132 136,599,348.90
AP APZ18 28/12/2017 - 26/07/2018 51,509 26 51,483 0.05 99.95 9.05 30,695 277,649,531.14
AP APH19 29/03/2018 - 26/07/2018 22,880 75 22,805 0.33 99.67 9.05 21,617 194,992,567.71
AP APM19 28/06/2018 - 26/07/2018 8 8 - 100 - 9.05 8 -
129,135 247 128,888 0.19 99.81 9.05 67,452 609,241,447.75
BA BAU18 28/09/2017 - 26/07/2018 4,397 797 3,600 18.13 81.87 12.7 484 5,032,631.34
BA BAZ18 28/12/2017 - 26/07/2018 242 42 200 17.36 82.64 12.7 22 230,909.09
BA BAH19 29/03/2018 - 26/07/2018 - - - - - 12.7 - -
BA BAM19 28/06/2018 - 26/07/2018 - - - - - 12.7 - -
4,639 839 3,800 18.09 81.91 12.7 506 5,263,540.43
Total AAV
Total ADVANC
Total AMATA
Total AOT
Total AP
Total BA
All
Underlying Series Period
Trading Volume (Contracts) % Trading Volume
Approximated Block Trade Value (THB)

Stock Futures Block Trade Report
View By: Instrument Instrument Class:
As of date : 26/7/2018
Underlying Price (THB) OI (Contracts)
Total AOM Block Trade AOM Block Trade As of 26/07/2018 As of 26/07/2018
All
Underlying Series Period
Trading Volume (Contracts) % Trading Volume
Approximated Block Trade Value (THB)
BANPU BANPUU18 28/09/2017 - 26/07/2018 357,062 11,636 345,426 3.26 96.74 21.1 28,830 588,489,187.70
BANPU BANPUZ18 28/12/2017 - 26/07/2018 205,459 726 204,733 0.35 99.65 21.1 13,512 284,095,773.10
BANPU BANPUH19 29/03/2018 - 26/07/2018 39,247 69 39,178 0.18 99.82 21.1 22,430 472,440,940.56
BANPU BANPUM19 28/06/2018 - 26/07/2018 4,261 61 4,200 1.43 98.57 21.1 4,001 83,212,536.96
606,029 12,492 593,537 2.06 97.94 21.1 68,773 1,428,238,438.32
BAY BAYU18 28/09/2017 - 26/07/2018 2,785 185 2,600 6.64 93.36 39.25 577 21,142,854.58
BAY BAYZ18 28/12/2017 - 26/07/2018 205 5 200 2.44 97.56 39.25 203 7,773,414.63
BAY BAYH19 29/03/2018 - 26/07/2018 2 2 - 100 - 39.25 2 -
BAY BAYM19 28/06/2018 - 26/07/2018 - - - - - 39.25 - -
2,992 192 2,800 6.42 93.58 39.25 782 28,916,269.21
BBL BBLU18 28/09/2017 - 26/07/2018 19,552 585 18,967 2.99 97.01 204 1,144 226,393,340.43
BBL BBLZ18 28/12/2017 - 26/07/2018 3,831 111 3,720 2.9 97.1 204 380 75,273,923.26
BBL BBLH19 29/03/2018 - 26/07/2018 1,257 97 1,160 7.72 92.28 204 56 10,542,434.37
BBL BBLM19 28/06/2018 - 26/07/2018 - - - - - 204 - -
24,640 793 23,847 3.22 96.78 204 1,580 312,209,698.05
BCH BCHU18 28/09/2017 - 26/07/2018 32,688 214 32,474 0.65 99.35 16.6 1,722 28,398,059.99
BCH BCHZ18 28/12/2017 - 26/07/2018 7,426 126 7,300 1.7 98.3 16.6 3,134 51,141,680.58
BCH BCHH19 29/03/2018 - 26/07/2018 668 68 600 10.18 89.82 16.6 650 9,691,616.77
BCH BCHM19 28/06/2018 - 26/07/2018 - - - - - 16.6 - -
40,782 408 40,374 1 99 16.6 5,506 89,231,357.33
BCP BCPU18 28/09/2017 - 26/07/2018 14,078 478 13,600 3.4 96.6 35.25 1,085 36,947,648.81
BCP BCPZ18 28/12/2017 - 26/07/2018 8,895 325 8,570 3.65 96.35 35.25 3,271 111,089,889.54
BCP BCPH19 29/03/2018 - 26/07/2018 1,503 103 1,400 6.85 93.15 35.25 879 28,861,377.25
BCP BCPM19 28/06/2018 - 26/07/2018 800 - 800 - 100 35.25 - -
25,276 906 24,370 3.58 96.42 35.25 5,235 176,898,915.60
BDMS BDMSU18 28/09/2017 - 26/07/2018 80,636 716 79,920 0.89 99.11 27 5,118 136,958,990.03
BDMS BDMSZ18 28/12/2017 - 26/07/2018 12,115 275 11,840 2.27 97.73 27 533 14,064,336.77
BDMS BDMSH19 29/03/2018 - 26/07/2018 3,561 161 3,400 4.52 95.48 27 2,160 55,683,235.05
BDMS BDMSM19 28/06/2018 - 26/07/2018 200 - 200 - 100 27 200 5,400,000.00
96,512 1,152 95,360 1.19 98.81 27 8,011 212,106,561.85
Total BANPU
Total BAY
Total BBL
Total BCH
Total BCP
Total BDMS

Stock Futures Block Trade Report
View By: Instrument Instrument Class:
As of date : 26/7/2018
Underlying Price (THB) OI (Contracts)
Total AOM Block Trade AOM Block Trade As of 26/07/2018 As of 26/07/2018
All
Underlying Series Period
Trading Volume (Contracts) % Trading Volume
Approximated Block Trade Value (THB)
BEAUTY BEAUTYU18 28/09/2017 - 26/07/2018 396,350 19,514 376,836 4.92 95.08 8.05 12,711 97,285,725.46
BEAUTY BEAUTYZ18 28/12/2017 - 26/07/2018 43,088 1,128 41,960 2.62 97.38 8.05 3,006 23,564,813.13
BEAUTY BEAUTYH19 29/03/2018 - 26/07/2018 1,425 125 1,300 8.77 91.23 8.05 194 1,424,708.77
BEAUTY BEAUTYM19 28/06/2018 - 26/07/2018 692 92 600 13.29 86.71 8.05 477 3,329,349.71
441,555 20,859 420,696 4.72 95.28 8.05 16,388 125,604,597.07
BEC BECU18 28/09/2017 - 26/07/2018 29,148 2,198 26,950 7.54 92.46 9.6 2,055 18,240,345.82
BEC BECZ18 28/12/2017 - 26/07/2018 2,638 664 1,974 25.17 74.83 9.6 882 6,335,956.33
BEC BECH19 29/03/2018 - 26/07/2018 1,735 135 1,600 7.78 92.22 9.6 303 2,682,466.86
BEC BECM19 28/06/2018 - 26/07/2018 11 11 - 100 - 9.6 10 -
33,532 3,008 30,524 8.97 91.03 9.6 3,250 27,258,769.01
BEM BEMU18 28/09/2017 - 26/07/2018 58,735 885 57,850 1.51 98.49 8.35 10,998 90,449,585.51
BEM BEMZ18 28/12/2017 - 26/07/2018 22,003 203 21,800 0.92 99.08 8.35 9,056 74,919,950.92
BEM BEMH19 29/03/2018 - 26/07/2018 2,428 28 2,400 1.15 98.85 8.35 24 198,088.96
BEM BEMM19 28/06/2018 - 26/07/2018 36 36 - 100 - 8.35 36 -
83,202 1,152 82,050 1.38 98.62 8.35 20,114 165,567,625.39
BH BHU18 28/09/2017 - 26/07/2018 7,649 347 7,302 4.54 95.46 181.5 275 47,648,199.11
BH BHZ18 28/12/2017 - 26/07/2018 914 42 872 4.6 95.4 181.5 28 4,848,472.65
BH BHH19 29/03/2018 - 26/07/2018 52 12 40 23.08 76.92 181.5 12 1,675,384.62
BH BHM19 28/06/2018 - 26/07/2018 - - - - - 181.5 - -
8,615 401 8,214 4.65 95.35 181.5 315 54,172,056.37
BJC BJCU18 28/09/2017 - 26/07/2018 32,580 176 32,404 0.54 99.46 56.5 2,846 159,930,349.79
BJC BJCZ18 28/12/2017 - 26/07/2018 4,744 - 4,744 - 100 56.5 1,344 75,936,000.00
BJC BJCH19 29/03/2018 - 26/07/2018 1,108 8 1,100 0.72 99.28 56.5 804 45,098,014.44
BJC BJCM19 28/06/2018 - 26/07/2018 2 2 - 100 - 56.5 2 -
38,434 186 38,248 0.48 99.52 56.5 4,996 280,964,364.23
BLA BLAU18 28/09/2017 - 26/07/2018 3,850 150 3,700 3.9 96.1 32.5 732 22,863,116.88
BLA BLAZ18 28/12/2017 - 26/07/2018 520 20 500 3.85 96.15 32.5 310 9,687,500.00
BLA BLAH19 29/03/2018 - 26/07/2018 4 4 - 100 - 32.5 2 -
BLA BLAM19 28/06/2018 - 26/07/2018 5 5 - 100 - 32.5 5 -
4,379 179 4,200 4.09 95.91 32.5 1,049 32,550,616.88
Total BEAUTY
Total BEC
Total BEM
Total BH
Total BJC
Total BLA
Stock Futures Block Trade Report
View By: Instrument Instrument Class:
As of date : 26/7/2018
Underlying Price (THB) OI (Contracts)
Total AOM Block Trade AOM Block Trade As of 26/07/2018 As of 26/07/2018
All
Underlying Series Period
Trading Volume (Contracts) % Trading Volume
Approximated Block Trade Value (THB)
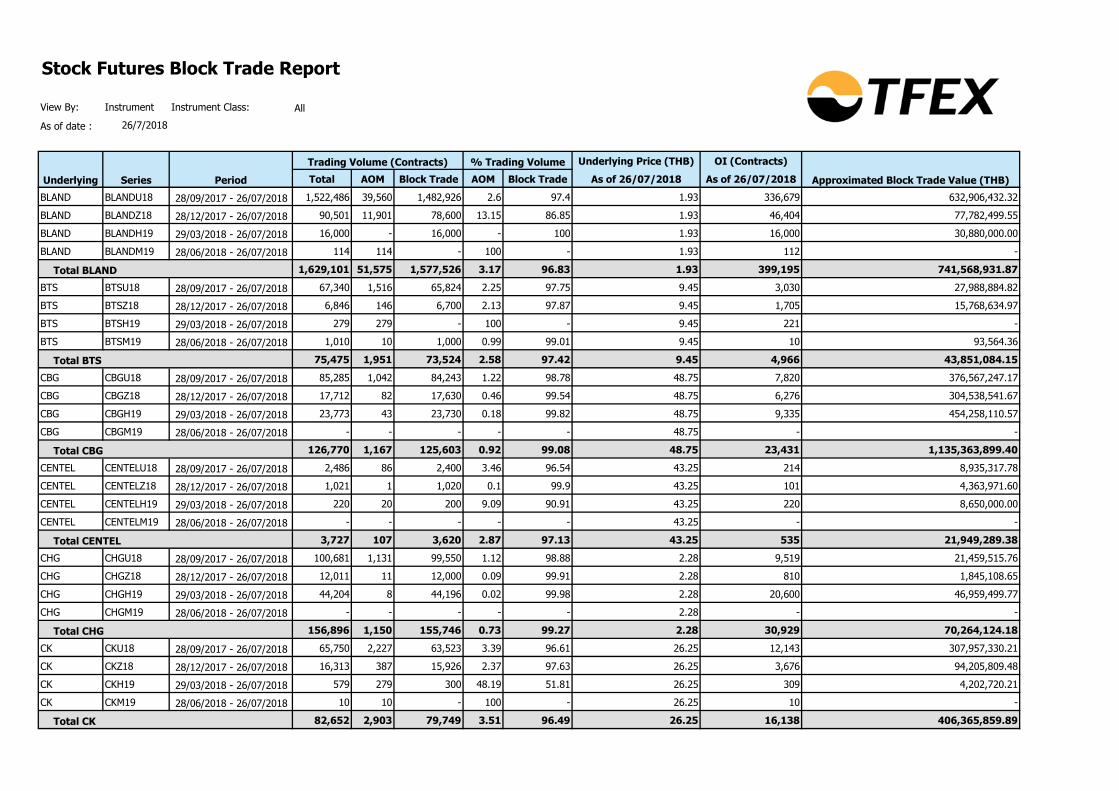
BLAND BLANDU18 28/09/2017 - 26/07/2018 1,522,486 39,560 1,482,926 2.6 97.4 1.93 336,679 632,906,432.32
BLAND BLANDZ18 28/12/2017 - 26/07/2018 90,501 11,901 78,600 13.15 86.85 1.93 46,404 77,782,499.55
BLAND BLANDH19 29/03/2018 - 26/07/2018 16,000 - 16,000 - 100 1.93 16,000 30,880,000.00
BLAND BLANDM19 28/06/2018 - 26/07/2018 114 114 - 100 - 1.93 112 -
1,629,101 51,575 1,577,526 3.17 96.83 1.93 399,195 741,568,931.87
BTS BTSU18 28/09/2017 - 26/07/2018 67,340 1,516 65,824 2.25 97.75 9.45 3,030 27,988,884.82
BTS BTSZ18 28/12/2017 - 26/07/2018 6,846 146 6,700 2.13 97.87 9.45 1,705 15,768,634.97
BTS BTSH19 29/03/2018 - 26/07/2018 279 279 - 100 - 9.45 221 -
BTS BTSM19 28/06/2018 - 26/07/2018 1,010 10 1,000 0.99 99.01 9.45 10 93,564.36
75,475 1,951 73,524 2.58 97.42 9.45 4,966 43,851,084.15
CBG CBGU18 28/09/2017 - 26/07/2018 85,285 1,042 84,243 1.22 98.78 48.75 7,820 376,567,247.17
CBG CBGZ18 28/12/2017 - 26/07/2018 17,712 82 17,630 0.46 99.54 48.75 6,276 304,538,541.67
CBG CBGH19 29/03/2018 - 26/07/2018 23,773 43 23,730 0.18 99.82 48.75 9,335 454,258,110.57
CBG CBGM19 28/06/2018 - 26/07/2018 - - - - - 48.75 - -
126,770 1,167 125,603 0.92 99.08 48.75 23,431 1,135,363,899.40
CENTEL CENTELU18 28/09/2017 - 26/07/2018 2,486 86 2,400 3.46 96.54 43.25 214 8,935,317.78
CENTEL CENTELZ18 28/12/2017 - 26/07/2018 1,021 1 1,020 0.1 99.9 43.25 101 4,363,971.60
CENTEL CENTELH19 29/03/2018 - 26/07/2018 220 20 200 9.09 90.91 43.25 220 8,650,000.00
CENTEL CENTELM19 28/06/2018 - 26/07/2018 - - - - - 43.25 - -
3,727 107 3,620 2.87 97.13 43.25 535 21,949,289.38
CHG CHGU18 28/09/2017 - 26/07/2018 100,681 1,131 99,550 1.12 98.88 2.28 9,519 21,459,515.76
CHG CHGZ18 28/12/2017 - 26/07/2018 12,011 11 12,000 0.09 99.91 2.28 810 1,845,108.65
CHG CHGH19 29/03/2018 - 26/07/2018 44,204 8 44,196 0.02 99.98 2.28 20,600 46,959,499.77
CHG CHGM19 28/06/2018 - 26/07/2018 - - - - - 2.28 - -
156,896 1,150 155,746 0.73 99.27 2.28 30,929 70,264,124.18
CK CKU18 28/09/2017 - 26/07/2018 65,750 2,227 63,523 3.39 96.61 26.25 12,143 307,957,330.21
CK CKZ18 28/12/2017 - 26/07/2018 16,313 387 15,926 2.37 97.63 26.25 3,676 94,205,809.48
CK CKH19 29/03/2018 - 26/07/2018 579 279 300 48.19 51.81 26.25 309 4,202,720.21
CK CKM19 28/06/2018 - 26/07/2018 10 10 - 100 - 26.25 10 -
82,652 2,903 79,749 3.51 96.49 26.25 16,138 406,365,859.89
Total BLAND
Total BTS
Total CBG
Total CENTEL
Total CHG
Total CK

Stock Futures Block Trade Report
View By: Instrument Instrument Class:
As of date : 26/7/2018
Underlying Price (THB) OI (Contracts)
Total AOM Block Trade AOM Block Trade As of 26/07/2018 As of 26/07/2018
All
Underlying Series Period
Trading Volume (Contracts) % Trading Volume
Approximated Block Trade Value (THB)
CKP CKPU18 28/09/2017 - 26/07/2018 102,840 4,340 98,500 4.22 95.78 4 7,431 28,469,603.27
CKP CKPZ18 28/12/2017 - 26/07/2018 18,256 606 17,650 3.32 96.68 4 1,853 7,165,961.88
CKP CKPH19 29/03/2018 - 26/07/2018 13,940 340 13,600 2.44 97.56 4 218 850,731.71
CKP CKPM19 28/06/2018 - 26/07/2018 212 12 200 5.66 94.34 4 10 37,735.85
135,248 5,298 129,950 3.92 96.08 4 9,512 36,524,032.70
CPALL CPALLU18 28/09/2017 - 26/07/2018 89,695 1,530 88,165 1.71 98.29 76 8,802 657,541,145.88
CPALL CPALLZ18 28/12/2017 - 26/07/2018 18,425 413 18,012 2.24 97.76 76 6,271 465,913,006.89
CPALL CPALLH19 29/03/2018 - 26/07/2018 4,849 109 4,740 2.25 97.75 76 525 39,003,093.42
CPALL CPALLM19 28/06/2018 - 26/07/2018 58 38 20 65.52 34.48 76 58 1,520,000.00
113,027 2,090 110,937 1.85 98.15 76 15,656 1,163,977,246.20
CPF CPFU18 28/09/2017 - 26/07/2018 95,364 4,414 90,950 4.63 95.37 27 7,017 180,689,736.69
CPF CPFZ18 28/12/2017 - 26/07/2018 31,714 136 31,578 0.43 99.57 27 811 21,803,098.51
CPF CPFH19 29/03/2018 - 26/07/2018 5,240 540 4,700 10.31 89.69 27 744 18,017,862.60
CPF CPFM19 28/06/2018 - 26/07/2018 1,303 3 1,300 0.23 99.77 27 203 5,468,380.66
133,621 5,093 128,528 3.81 96.19 27 8,775 225,979,078.45
CPN CPNU18 28/09/2017 - 26/07/2018 16,258 228 16,030 1.4 98.6 75.25 702 52,084,682.31
CPN CPNZ18 28/12/2017 - 26/07/2018 7,216 6 7,210 0.08 99.92 75.25 435 32,706,532.36
CPN CPNH19 29/03/2018 - 26/07/2018 1,146 6 1,140 0.52 99.48 75.25 26 1,946,256.54
CPN CPNM19 28/06/2018 - 26/07/2018 10 10 - 100 - 75.25 10 -
24,630 250 24,380 1.02 98.98 75.25 1,173 86,737,471.21
DELTA DELTAU18 28/09/2017 - 26/07/2018 2,088 41 2,047 1.96 98.04 68.5 218 14,639,775.38
DELTA DELTAZ18 28/12/2017 - 26/07/2018 703 13 690 1.85 98.15 68.5 194 13,043,257.47
DELTA DELTAH19 29/03/2018 - 26/07/2018 74 14 60 18.92 81.08 68.5 21 1,166,351.35
DELTA DELTAM19 28/06/2018 - 26/07/2018 204 4 200 1.96 98.04 68.5 204 13,700,000.00
3,069 72 2,997 2.35 97.65 68.5 637 42,549,384.20
DTAC DTACU18 28/09/2017 - 26/07/2018 52,182 1,628 50,554 3.12 96.88 42 2,968 120,766,920.09
DTAC DTACZ18 28/12/2017 - 26/07/2018 6,636 136 6,500 2.05 97.95 42 536 22,050,632.91
DTAC DTACH19 29/03/2018 - 26/07/2018 1,208 8 1,200 0.66 99.34 42 1,006 41,972,185.43
DTAC DTACM19 28/06/2018 - 26/07/2018 280 280 - 100 - 42 - -
60,306 2,052 58,254 3.4 96.6 42 4,510 184,789,738.43
Total CKP
Total CPALL
Total CPF
Total CPN
Total DELTA
Total DTAC

Stock Futures Block Trade Report
View By: Instrument Instrument Class:
As of date : 26/7/2018
Underlying Price (THB) OI (Contracts)
Total AOM Block Trade AOM Block Trade As of 26/07/2018 As of 26/07/2018
All
Underlying Series Period
Trading Volume (Contracts) % Trading Volume
Approximated Block Trade Value (THB)
EARTH EARTHU18 28/09/2017 - 26/07/2018 - - - - - - - -
EARTH EARTHZ18 28/12/2017 - 26/07/2018 - - - - - - - -
EARTH EARTHH19 29/03/2018 - 26/07/2018 - - - - - - - -
EARTH EARTHM19 28/06/2018 - 26/07/2018 - - - - - - - -
- - - - - - - -
EGCO EGCOU18 28/09/2017 - 26/07/2018 6,673 303 6,370 4.54 95.46 231 2,599 573,108,126.78
EGCO EGCOZ18 28/12/2017 - 26/07/2018 2,284 4 2,280 0.18 99.82 231 22 5,073,099.82
EGCO EGCOH19 29/03/2018 - 26/07/2018 41 1 40 2.44 97.56 231 1 225,365.85
EGCO EGCOM19 28/06/2018 - 26/07/2018 - - - - - 231 - -
8,998 308 8,690 3.42 96.58 231 2,622 578,406,592.46
EPG EPGU18 28/09/2017 - 26/07/2018 35,800 824 34,976 2.3 97.7 8.65 940 7,943,850.73
EPG EPGZ18 28/12/2017 - 26/07/2018 2,946 146 2,800 4.96 95.04 8.65 368 3,025,444.67
EPG EPGH19 29/03/2018 - 26/07/2018 436 36 400 8.26 91.74 8.65 4 31,743.12
EPG EPGM19 28/06/2018 - 26/07/2018 - - - - - 8.65 - -
39,182 1,006 38,176 2.57 97.43 8.65 1,312 11,001,038.52
GLOBAL GLOBALU18X 28/09/2017 - 26/07/2018 20,414 62 20,352 0.3 99.7 17.4 1,249 21,666,595.24
GLOBAL GLOBALZ18X 28/12/2017 - 26/07/2018 3,509 9 3,500 0.26 99.74 17.4 2,509 43,544,628.10
GLOBAL GLOBALH19 29/03/2018 - 26/07/2018 6,900 - 6,900 - 100 17.4 - -
GLOBAL GLOBALM19 28/06/2018 - 26/07/2018 2,222 - 2,222 - 100 17.4 2,222 38,662,800.00
33,045 71 32,974 0.21 99.79 17.4 5,980 103,874,023.34
GLOW GLOWU18X 28/09/2017 - 26/07/2018 30,078 48 30,030 0.16 99.84 93.75 254 23,774,498.80
GLOW GLOWZ18X 28/12/2017 - 26/07/2018 1,680 - 1,680 - 100 93.75 - -
GLOW GLOWH19X 29/03/2018 - 26/07/2018 40 - 40 - 100 93.75 - -
GLOW GLOWM19 28/06/2018 - 26/07/2018 - - - - - 93.75 - -
31,798 48 31,750 0.15 99.85 93.75 254 23,774,498.80
GPSC GPSCU18 28/09/2017 - 26/07/2018 32,742 360 32,382 1.1 98.9 70.25 1,706 118,528,781.47
GPSC GPSCZ18 28/12/2017 - 26/07/2018 6,491 31 6,460 0.48 99.52 70.25 19 1,328,375.44
GPSC GPSCH19 29/03/2018 - 26/07/2018 3,320 20 3,300 0.6 99.4 70.25 117 8,169,736.45
GPSC GPSCM19 28/06/2018 - 26/07/2018 40 40 - 100 - 70.25 - -
42,593 451 42,142 1.06 98.94 70.25 1,842 128,026,893.36
Total EARTH
Total EGCO
Total EPG
Total GLOBAL
Total GLOW
Total GPSC

Stock Futures Block Trade Report
View By: Instrument Instrument Class:
As of date : 26/7/2018
Underlying Price (THB) OI (Contracts)
Total AOM Block Trade AOM Block Trade As of 26/07/2018 As of 26/07/2018
All
Underlying Series Period
Trading Volume (Contracts) % Trading Volume
Approximated Block Trade Value (THB)
GUNKUL GUNKULU18 28/09/2017 - 26/07/2018 54,923 763 54,160 1.39 98.61 3 9,768 28,896,903.67
GUNKUL GUNKULZ18 28/12/2017 - 26/07/2018 3,632 265 3,367 7.3 92.7 3 2,287 6,360,403.91
GUNKUL GUNKULH19 29/03/2018 - 26/07/2018 - - - - - 3 - -
GUNKUL GUNKULM19 28/06/2018 - 26/07/2018 - - - - - 3 - -
58,555 1,028 57,527 1.76 98.24 3 12,055 35,257,307.57
HANA HANAU18 28/09/2017 - 26/07/2018 6,433 59 6,374 0.92 99.08 36.5 314 11,355,885.90
HANA HANAZ18 28/12/2017 - 26/07/2018 1,057 57 1,000 5.39 94.61 36.5 337 11,637,180.70
HANA HANAH19 29/03/2018 - 26/07/2018 134 34 100 25.37 74.63 36.5 133 3,622,761.19
HANA HANAM19 28/06/2018 - 26/07/2018 - - - - - 36.5 - -
7,624 150 7,474 1.97 98.03 36.5 784 26,615,827.79
HMPRO HMPROU18 28/09/2017 - 26/07/2018 61,064 784 60,280 1.28 98.72 14.5 2,809 40,207,561.57
HMPRO HMPROZ18 28/12/2017 - 26/07/2018 8,918 118 8,800 1.32 98.68 14.5 313 4,478,448.08
HMPRO HMPROH19 29/03/2018 - 26/07/2018 1,500 100 1,400 6.67 93.33 14.5 - -
HMPRO HMPROM19 28/06/2018 - 26/07/2018 200 - 200 - 100 14.5 - -
71,682 1,002 70,680 1.4 98.6 14.5 3,122 44,686,009.66
ICHI ICHIU18 28/09/2017 - 26/07/2018 74,328 1,300 73,028 1.75 98.25 4.9 6,711 32,308,759.14
ICHI ICHIZ18 28/12/2017 - 26/07/2018 8,164 64 8,100 0.78 99.22 4.9 319 1,550,846.40
ICHI ICHIH19 29/03/2018 - 26/07/2018 112 12 100 10.71 89.29 4.9 109 476,875.00
ICHI ICHIM19 28/06/2018 - 26/07/2018 16 16 - 100 - 4.9 16 -
82,620 1,392 81,228 1.68 98.32 4.9 7,155 34,336,480.54
INTUCH INTUCHU18 28/09/2017 - 26/07/2018 12,486 226 12,260 1.81 98.19 55.75 337 18,447,686.61
INTUCH INTUCHZ18 28/12/2017 - 26/07/2018 856 6 850 0.7 99.3 55.75 152 8,414,602.80
INTUCH INTUCHH19 29/03/2018 - 26/07/2018 150 - 150 - 100 55.75 30 1,672,500.00
INTUCH INTUCHM19 28/06/2018 - 26/07/2018 - - - - - 55.75 - -
13,492 232 13,260 1.72 98.28 55.75 519 28,534,789.41
IRPC IRPCU18 28/09/2017 - 26/07/2018 348,682 8,162 340,520 2.34 97.66 6.4 24,936 155,854,684.23
IRPC IRPCZ18 28/12/2017 - 26/07/2018 67,722 992 66,730 1.46 98.54 6.4 12,302 77,579,512.48
IRPC IRPCH19 29/03/2018 - 26/07/2018 17,702 902 16,800 5.1 94.9 6.4 2,109 12,809,833.92
IRPC IRPCM19 28/06/2018 - 26/07/2018 1,300 - 1,300 - 100 6.4 100 640,000.00
435,406 10,056 425,350 2.31 97.69 6.4 39,447 246,884,030.63
Total GUNKUL
Total HANA
Total HMPRO
Total ICHI
Total INTUCH
Total IRPC
Stock Futures Block Trade Report
View By: Instrument Instrument Class:
As of date : 26/7/2018
Underlying Price (THB) OI (Contracts)
Total AOM Block Trade AOM Block Trade As of 26/07/2018 As of 26/07/2018
All
Underlying Series Period
Trading Volume (Contracts) % Trading Volume
Approximated Block Trade Value (THB)
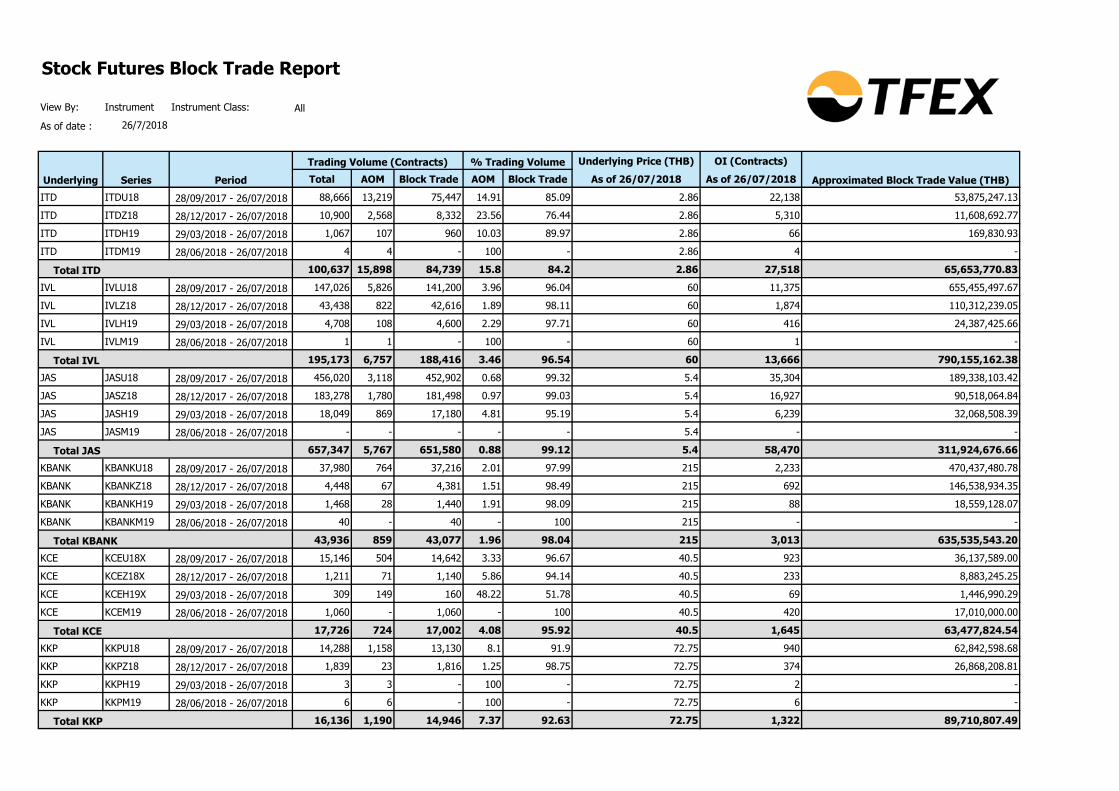
ITD ITDU18 28/09/2017 - 26/07/2018 88,666 13,219 75,447 14.91 85.09 2.86 22,138 53,875,247.13
ITD ITDZ18 28/12/2017 - 26/07/2018 10,900 2,568 8,332 23.56 76.44 2.86 5,310 11,608,692.77
ITD ITDH19 29/03/2018 - 26/07/2018 1,067 107 960 10.03 89.97 2.86 66 169,830.93
ITD ITDM19 28/06/2018 - 26/07/2018 4 4 - 100 - 2.86 4 -
100,637 15,898 84,739 15.8 84.2 2.86 27,518 65,653,770.83
IVL IVLU18 28/09/2017 - 26/07/2018 147,026 5,826 141,200 3.96 96.04 60 11,375 655,455,497.67
IVL IVLZ18 28/12/2017 - 26/07/2018 43,438 822 42,616 1.89 98.11 60 1,874 110,312,239.05
IVL IVLH19 29/03/2018 - 26/07/2018 4,708 108 4,600 2.29 97.71 60 416 24,387,425.66
IVL IVLM19 28/06/2018 - 26/07/2018 1 1 - 100 - 60 1 -
195,173 6,757 188,416 3.46 96.54 60 13,666 790,155,162.38
JAS JASU18 28/09/2017 - 26/07/2018 456,020 3,118 452,902 0.68 99.32 5.4 35,304 189,338,103.42
JAS JASZ18 28/12/2017 - 26/07/2018 183,278 1,780 181,498 0.97 99.03 5.4 16,927 90,518,064.84
JAS JASH19 29/03/2018 - 26/07/2018 18,049 869 17,180 4.81 95.19 5.4 6,239 32,068,508.39
JAS JASM19 28/06/2018 - 26/07/2018 - - - - - 5.4 - -
657,347 5,767 651,580 0.88 99.12 5.4 58,470 311,924,676.66
KBANK KBANKU18 28/09/2017 - 26/07/2018 37,980 764 37,216 2.01 97.99 215 2,233 470,437,480.78
KBANK KBANKZ18 28/12/2017 - 26/07/2018 4,448 67 4,381 1.51 98.49 215 692 146,538,934.35
KBANK KBANKH19 29/03/2018 - 26/07/2018 1,468 28 1,440 1.91 98.09 215 88 18,559,128.07
KBANK KBANKM19 28/06/2018 - 26/07/2018 40 - 40 - 100 215 - -
43,936 859 43,077 1.96 98.04 215 3,013 635,535,543.20
KCE KCEU18X 28/09/2017 - 26/07/2018 15,146 504 14,642 3.33 96.67 40.5 923 36,137,589.00
KCE KCEZ18X 28/12/2017 - 26/07/2018 1,211 71 1,140 5.86 94.14 40.5 233 8,883,245.25
KCE KCEH19X 29/03/2018 - 26/07/2018 309 149 160 48.22 51.78 40.5 69 1,446,990.29
KCE KCEM19 28/06/2018 - 26/07/2018 1,060 - 1,060 - 100 40.5 420 17,010,000.00
17,726 724 17,002 4.08 95.92 40.5 1,645 63,477,824.54
KKP KKPU18 28/09/2017 - 26/07/2018 14,288 1,158 13,130 8.1 91.9 72.75 940 62,842,598.68
KKP KKPZ18 28/12/2017 - 26/07/2018 1,839 23 1,816 1.25 98.75 72.75 374 26,868,208.81
KKP KKPH19 29/03/2018 - 26/07/2018 3 3 - 100 - 72.75 2 -
KKP KKPM19 28/06/2018 - 26/07/2018 6 6 - 100 - 72.75 6 -
16,136 1,190 14,946 7.37 92.63 72.75 1,322 89,710,807.49
Total ITD
Total IVL
Total JAS
Total KBANK
Total KCE
Total KKP

Stock Futures Block Trade Report
View By: Instrument Instrument Class:
As of date : 26/7/2018
Underlying Price (THB) OI (Contracts)
Total AOM Block Trade AOM Block Trade As of 26/07/2018 As of 26/07/2018
All
Underlying Series Period
Trading Volume (Contracts) % Trading Volume
Approximated Block Trade Value (THB)
KTB KTBU18 28/09/2017 - 26/07/2018 109,272 6,162 103,110 5.64 94.36 19 5,653 101,350,169.94
KTB KTBZ18 28/12/2017 - 26/07/2018 169,786 707 169,079 0.42 99.58 19 74,502 1,409,643,607.26
KTB KTBH19 29/03/2018 - 26/07/2018 26,719 52 26,667 0.19 99.81 19 26,488 502,292,541.79
KTB KTBM19 28/06/2018 - 26/07/2018 112 112 - 100 - 19 10 -
305,889 7,033 298,856 2.3 97.7 19 106,653 2,013,286,318.99
KTC KTCU18X 28/09/2017 - 26/07/2018 17,826 932 16,894 5.23 94.77 28 2,102 55,778,821.05
KTC KTCZ18X 28/12/2017 - 26/07/2018 6,707 49 6,658 0.73 99.27 28 1,804 50,142,969.43
KTC KTCH19X 29/03/2018 - 26/07/2018 265 5 260 1.89 98.11 28 183 5,027,320.75
KTC KTCM19X 28/06/2018 - 26/07/2018 3 3 - 100 - 28 2 -
24,801 989 23,812 3.99 96.01 28 4,091 110,949,111.24
LH LHU18 28/09/2017 - 26/07/2018 199,716 1,260 198,456 0.63 99.37 12.1 2,727 32,788,525.18
LH LHZ18 28/12/2017 - 26/07/2018 123,205 42 123,163 0.03 99.97 12.1 7,263 87,852,341.34
LH LHH19 29/03/2018 - 26/07/2018 4 4 - 100 - 12.1 2 -
LH LHM19 28/06/2018 - 26/07/2018 5 5 - 100 - 12.1 5 -
322,930 1,311 321,619 0.41 99.59 12.1 9,997 120,640,866.52
LPN LPNU18 28/09/2017 - 26/07/2018 46,453 1,223 45,230 2.63 97.37 10.2 3,808 37,818,990.55
LPN LPNZ18 28/12/2017 - 26/07/2018 12,288 68 12,220 0.55 99.45 10.2 2,340 23,735,917.97
LPN LPNH19 29/03/2018 - 26/07/2018 4,862 62 4,800 1.28 98.72 10.2 262 2,638,321.68
LPN LPNM19 28/06/2018 - 26/07/2018 250 50 200 20 80 10.2 50 408,000.00
63,853 1,403 62,450 2.2 97.8 10.2 6,460 64,601,230.20
MAJOR MAJORU18 28/09/2017 - 26/07/2018 4,388 288 4,100 6.56 93.44 25.75 199 4,787,927.30
MAJOR MAJORZ18 28/12/2017 - 26/07/2018 423 23 400 5.44 94.56 25.75 12 292,198.58
MAJOR MAJORH19 29/03/2018 - 26/07/2018 20 20 - 100 - 25.75 20 -
MAJOR MAJORM19 28/06/2018 - 26/07/2018 - - - - - 25.75 - -
4,831 331 4,500 6.85 93.15 25.75 231 5,080,125.88
MINT MINTU18 28/09/2017 - 26/07/2018 65,256 1,136 64,120 1.74 98.26 36.5 4,296 154,074,299.37
MINT MINTZ18 28/12/2017 - 26/07/2018 36,168 562 35,606 1.55 98.45 36.5 4,818 173,124,428.83
MINT MINTH19 29/03/2018 - 26/07/2018 16,197 117 16,080 0.72 99.28 36.5 7,148 259,017,358.77
MINT MINTM19 28/06/2018 - 26/07/2018 - - - - - 36.5 - -
117,621 1,815 115,806 1.54 98.46 36.5 16,262 586,216,086.98
Total KTB
Total KTC
Total LH
Total LPN
Total MAJOR
Total MINT

Stock Futures Block Trade Report
View By: Instrument Instrument Class:
As of date : 26/7/2018
Underlying Price (THB) OI (Contracts)
Total AOM Block Trade AOM Block Trade As of 26/07/2018 As of 26/07/2018
All
Underlying Series Period
Trading Volume (Contracts) % Trading Volume
Approximated Block Trade Value (THB)
MTC MTCU18 28/09/2017 - 26/07/2018 33,127 617 32,510 1.86 98.14 38.75 2,552 97,048,145.02
MTC MTCZ18 28/12/2017 - 26/07/2018 3,847 247 3,600 6.42 93.58 38.75 1,429 51,818,429.95
MTC MTCH19 29/03/2018 - 26/07/2018 1,200 - 1,200 - 100 38.75 400 15,500,000.00
MTC MTCM19 28/06/2018 - 26/07/2018 502 2 500 0.4 99.6 38.75 102 3,936,752.99
38,676 866 37,810 2.24 97.76 38.75 4,483 168,303,327.95
PLANB PLANBU18 28/09/2017 - 26/07/2018 34,894 194 34,700 0.56 99.44 6.45 1,481 9,499,341.29
PLANB PLANBZ18 28/12/2017 - 26/07/2018 8,072 22 8,050 0.27 99.73 6.45 5,769 37,108,635.10
PLANB PLANBH19 29/03/2018 - 26/07/2018 30 30 - 100 - 6.45 27 -
PLANB PLANBM19 28/06/2018 - 26/07/2018 - - - - - 6.45 - -
42,996 246 42,750 0.57 99.43 6.45 7,277 46,607,976.39
PSH PSHU18 28/09/2017 - 26/07/2018 20,971 671 20,300 3.2 96.8 20.7 1,636 32,781,629.87
PSH PSHZ18 28/12/2017 - 26/07/2018 4,785 710 4,075 14.84 85.16 20.7 3,966 69,914,736.68
PSH PSHH19 29/03/2018 - 26/07/2018 10,491 100 10,391 0.95 99.05 20.7 9,991 204,842,355.99
PSH PSHM19 28/06/2018 - 26/07/2018 1,000 - 1,000 - 100 20.7 1,000 20,700,000.00
37,247 1,481 35,766 3.98 96.02 20.7 16,593 328,238,722.54
PTG PTGU18 28/09/2017 - 26/07/2018 38,182 1,635 36,547 4.28 95.72 15.3 6,259 91,662,023.91
PTG PTGZ18 28/12/2017 - 26/07/2018 3,572 22 3,550 0.62 99.38 15.3 261 3,968,705.21
PTG PTGH19 29/03/2018 - 26/07/2018 - - - - - 15.3 - -
PTG PTGM19 28/06/2018 - 26/07/2018 340 240 100 70.59 29.41 15.3 - -
42,094 1,897 40,197 4.51 95.49 15.3 6,520 95,630,729.12
PTT PTTU18X 28/09/2017 - 26/07/2018 27,084 2,908 24,176 10.74 89.26 51.75 977 45,131,166.59
PTT PTTZ18X 28/12/2017 - 26/07/2018 6,814 594 6,220 8.72 91.28 51.75 242 11,431,783.09
PTT PTTH19X 29/03/2018 - 26/07/2018 1,647 257 1,390 15.6 84.4 51.75 71 3,100,915.30
PTT PTTM19 28/06/2018 - 26/07/2018 13,246 48 13,198 0.36 99.64 51.75 2,098 108,178,065.60
48,791 3,807 44,984 7.8 92.2 51.75 3,388 167,841,930.59
PTTEP PTTEPU18 28/09/2017 - 26/07/2018 69,225 3,333 65,892 4.81 95.19 138 2,502 328,651,877.10
PTTEP PTTEPZ18 28/12/2017 - 26/07/2018 16,227 87 16,140 0.54 99.46 138 417 57,237,470.88
PTTEP PTTEPH19 29/03/2018 - 26/07/2018 3,182 2 3,180 0.06 99.94 138 1 137,913.26
PTTEP PTTEPM19 28/06/2018 - 26/07/2018 - - - - - 138 - -
88,634 3,422 85,212 3.86 96.14 138 2,920 386,027,261.24
Total MTC
Total PLANB
Total PSH
Total PTG
Total PTT
Total PTTEP

Stock Futures Block Trade Report
View By: Instrument Instrument Class:
As of date : 26/7/2018
Underlying Price (THB) OI (Contracts)
Total AOM Block Trade AOM Block Trade As of 26/07/2018 As of 26/07/2018
All
Underlying Series Period
Trading Volume (Contracts) % Trading Volume
Approximated Block Trade Value (THB)
PTTGC PTTGCU18 28/09/2017 - 26/07/2018 80,960 2,411 78,549 2.98 97.02 81.5 2,871 227,018,349.66
PTTGC PTTGCZ18 28/12/2017 - 26/07/2018 27,175 244 26,931 0.9 99.1 81.5 855 69,056,831.92
PTTGC PTTGCH19 29/03/2018 - 26/07/2018 1,970 60 1,910 3.05 96.95 81.5 572 45,198,162.44
PTTGC PTTGCM19 28/06/2018 - 26/07/2018 130 50 80 38.46 61.54 81.5 28 1,404,307.69
110,235 2,765 107,470 2.51 97.49 81.5 4,326 342,677,651.71
QH QHU18 28/09/2017 - 26/07/2018 390,883 6,361 384,522 1.63 98.37 3.54 28,097 97,844,771.46
QH QHZ18 28/12/2017 - 26/07/2018 104,956 2 104,954 0 100 3.54 5,671 20,074,957.45
QH QHH19 29/03/2018 - 26/07/2018 7,400 - 7,400 - 100 3.54 - -
QH QHM19 28/06/2018 - 26/07/2018 2 2 - 100 - 3.54 2 -
503,241 6,365 496,876 1.26 98.74 3.54 33,770 117,919,728.92
RATCH RATCHU18 28/09/2017 - 26/07/2018 4,126 46 4,080 1.11 98.89 51.5 260 13,240,717.40
RATCH RATCHZ18 28/12/2017 - 26/07/2018 1,260 - 1,260 - 100 51.5 - -
RATCH RATCHH19 29/03/2018 - 26/07/2018 323 3 320 0.93 99.07 51.5 2 102,043.34
RATCH RATCHM19 28/06/2018 - 26/07/2018 - - - - - 51.5 - -
5,709 49 5,660 0.86 99.14 51.5 262 13,342,760.75
ROBINS ROBINSU18 28/09/2017 - 26/07/2018 4,739 29 4,710 0.61 99.39 63 435 27,237,296.90
ROBINS ROBINSZ18 28/12/2017 - 26/07/2018 1,014 4 1,010 0.39 99.61 63 133 8,345,946.75
ROBINS ROBINSH19 29/03/2018 - 26/07/2018 - - - - - 63 - -
ROBINS ROBINSM19 28/06/2018 - 26/07/2018 - - - - - 63 - -
5,753 33 5,720 0.57 99.43 63 568 35,583,243.64
S SU18 28/09/2017 - 26/07/2018 22,356 136 22,220 0.61 99.39 3.04 9,183 27,746,494.47
S SZ18 28/12/2017 - 26/07/2018 3,270 370 2,900 11.31 88.69 3.04 2,265 6,106,495.41
S SH19 29/03/2018 - 26/07/2018 1,780 280 1,500 15.73 84.27 3.04 1,580 4,047,640.45
S SM19 28/06/2018 - 26/07/2018 220 - 220 - 100 3.04 220 668,800.00
27,626 786 26,840 2.85 97.15 3.04 13,248 38,569,430.33
SAMART SAMARTU18 28/09/2017 - 26/07/2018 5,655 25 5,630 0.44 99.56 7.3 1,141 8,292,477.28
SAMART SAMARTZ18 28/12/2017 - 26/07/2018 1,554 74 1,480 4.76 95.24 7.3 1,099 7,640,666.67
SAMART SAMARTH19 29/03/2018 - 26/07/2018 1 1 - 100 - 7.3 1 -
SAMART SAMARTM19 28/06/2018 - 26/07/2018 - - - - - 7.3 - -
7,210 100 7,110 1.39 98.61 7.3 2,241 15,933,143.94
Total PTTGC
Total QH
Total RATCH
Total ROBINS
Total S
Total SAMART

Stock Futures Block Trade Report
View By: Instrument Instrument Class:
As of date : 26/7/2018
Underlying Price (THB) OI (Contracts)
Total AOM Block Trade AOM Block Trade As of 26/07/2018 As of 26/07/2018
All
Underlying Series Period
Trading Volume (Contracts) % Trading Volume
Approximated Block Trade Value (THB)
SAWAD SAWADU18X 28/09/2017 - 26/07/2018 53,431 1,305 52,126 2.44 97.56 37.75 7,392 272,232,525.09
SAWAD SAWADZ18X 28/12/2017 - 26/07/2018 16,942 522 16,420 3.08 96.92 37.75 1,164 42,587,133.75
SAWAD SAWADH19X 29/03/2018 - 26/07/2018 31,752 44 31,708 0.14 99.86 37.75 1,034 38,979,409.74
SAWAD SAWADM19 28/06/2018 - 26/07/2018 544 40 504 7.35 92.65 37.75 52 1,818,661.76
102,669 1,911 100,758 1.86 98.14 37.75 9,642 355,617,730.34
SCB SCBU18 28/09/2017 - 26/07/2018 32,845 1,205 31,640 3.67 96.33 136.5 1,922 252,727,931.80
SCB SCBZ18 28/12/2017 - 26/07/2018 3,808 249 3,559 6.54 93.46 136.5 215 27,428,506.43
SCB SCBH19 29/03/2018 - 26/07/2018 262 82 180 31.3 68.7 136.5 56 5,251,603.05
SCB SCBM19 28/06/2018 - 26/07/2018 6 6 - 100 - 136.5 3 -
36,921 1,542 35,379 4.18 95.82 136.5 2,196 285,408,041.29
SCC SCCU18 28/09/2017 - 26/07/2018 21,903 2,721 19,182 12.42 87.58 452 1,352 535,186,820.44
SCC SCCZ18 28/12/2017 - 26/07/2018 5,005 418 4,587 8.35 91.65 452 1,450 600,663,296.70
SCC SCCH19 29/03/2018 - 26/07/2018 704 124 580 17.61 82.39 452 35 13,033,522.73
SCC SCCM19 28/06/2018 - 26/07/2018 72 72 - 100 - 452 55 -
27,684 3,335 24,349 12.05 87.95 452 2,892 1,148,883,639.87
SIRI SIRIU18 28/09/2017 - 26/07/2018 491,962 16,522 475,440 3.36 96.64 1.67 241,482 389,731,396.88
SIRI SIRIZ18 28/12/2017 - 26/07/2018 332,286 1,586 330,700 0.48 99.52 1.67 195,076 324,221,987.82
SIRI SIRIH19 29/03/2018 - 26/07/2018 82,139 144 81,995 0.18 99.82 1.67 77,938 129,928,279.35
SIRI SIRIM19 28/06/2018 - 26/07/2018 17,000 - 17,000 - 100 1.67 17,000 28,390,000.00
923,387 18,252 905,135 1.98 98.02 1.67 531,496 872,271,664.05
SPALI SPALIU18 28/09/2017 - 26/07/2018 26,851 123 26,728 0.46 99.54 23.7 1,715 40,459,309.67
SPALI SPALIZ18 28/12/2017 - 26/07/2018 4,537 37 4,500 0.82 99.18 23.7 1,018 23,929,843.51
SPALI SPALIH19 29/03/2018 - 26/07/2018 2,002 2 2,000 0.1 99.9 23.7 1 23,676.32
SPALI SPALIM19 28/06/2018 - 26/07/2018 - - - - - 23.7 - -
33,390 162 33,228 0.49 99.51 23.7 2,734 64,412,829.50
SPCG SPCGU18 28/09/2017 - 26/07/2018 5,668 446 5,222 7.87 92.13 20.9 283 5,449,287.83
SPCG SPCGZ18 28/12/2017 - 26/07/2018 1,189 389 800 32.72 67.28 20.9 971 13,654,432.30
SPCG SPCGH19 29/03/2018 - 26/07/2018 32 32 - 100 - 20.9 32 -
SPCG SPCGM19 28/06/2018 - 26/07/2018 1 1 - 100 - 20.9 1 -
6,890 868 6,022 12.6 87.4 20.9 1,287 19,103,720.12
Total SAWAD
Total SCB
Total SCC
Total SIRI
Total SPALI
Total SPCG

Stock Futures Block Trade Report
View By: Instrument Instrument Class:
As of date : 26/7/2018
Underlying Price (THB) OI (Contracts)
Total AOM Block Trade AOM Block Trade As of 26/07/2018 As of 26/07/2018
All
Underlying Series Period
Trading Volume (Contracts) % Trading Volume
Approximated Block Trade Value (THB)
STA STAU18 28/09/2017 - 26/07/2018 27,512 585 26,927 2.13 97.87 11.3 2,304 25,481,601.86
STA STAZ18 28/12/2017 - 26/07/2018 430 27 403 6.28 93.72 11.3 220 2,329,902.33
STA STAH19 29/03/2018 - 26/07/2018 4 4 - 100 - 11.3 4 -
STA STAM19 28/06/2018 - 26/07/2018 - - - - - 11.3 - -
27,946 616 27,330 2.2 97.8 11.3 2,528 27,811,504.19
STEC STECU18 28/09/2017 - 26/07/2018 88,355 2,003 86,352 2.27 97.73 21.5 14,024 294,680,659.07
STEC STECZ18 28/12/2017 - 26/07/2018 7,111 251 6,860 3.53 96.47 21.5 1,184 24,557,468.71
STEC STECH19 29/03/2018 - 26/07/2018 865 465 400 53.76 46.24 21.5 210 2,087,861.27
STEC STECM19 28/06/2018 - 26/07/2018 201 1 200 0.5 99.5 21.5 1 21,393.03
96,532 2,720 93,812 2.82 97.18 21.5 15,419 321,347,382.09
STPI STPIU18 28/09/2017 - 26/07/2018 1,315 15 1,300 1.14 98.86 4.42 - -
STPI STPIZ18 28/12/2017 - 26/07/2018 - - - - - 4.42 - -
STPI STPIH19 29/03/2018 - 26/07/2018 400 - 400 - 100 4.42 200 884,000.00
STPI STPIM19 28/06/2018 - 26/07/2018 - - - - - 4.42 - -
1,715 15 1,700 0.87 99.13 4.42 200 884,000.00
TASCO TASCOU18 28/09/2017 - 26/07/2018 57,679 1,627 56,052 2.82 97.18 14 2,467 33,563,757.62
TASCO TASCOZ18 28/12/2017 - 26/07/2018 13,369 170 13,199 1.27 98.73 14 438 6,054,025.58
TASCO TASCOH19 29/03/2018 - 26/07/2018 1,015 515 500 50.74 49.26 14 405 2,793,103.45
TASCO TASCOM19 28/06/2018 - 26/07/2018 400 - 400 - 100 14 - -
72,463 2,312 70,151 3.19 96.81 14 3,310 42,410,886.65
TCAP TCAPU18 28/09/2017 - 26/07/2018 12,949 249 12,700 1.92 98.08 51.25 6,007 301,938,846.63
TCAP TCAPZ18 28/12/2017 - 26/07/2018 16,470 20 16,450 0.12 99.88 51.25 10,163 520,221,262.14
TCAP TCAPH19 29/03/2018 - 26/07/2018 9,760 10 9,750 0.1 99.9 51.25 9,757 499,533,907.53
TCAP TCAPM19 28/06/2018 - 26/07/2018 924 4 920 0.43 99.57 51.25 923 47,098,971.86
40,103 283 39,820 0.71 99.29 51.25 26,850 1,368,792,988.16
THAI THAIU18 28/09/2017 - 26/07/2018 17,718 3,505 14,213 19.78 80.22 14.1 4,611 52,153,720.30
THAI THAIZ18 28/12/2017 - 26/07/2018 1,927 427 1,500 22.16 77.84 14.1 885 9,713,414.63
THAI THAIH19 29/03/2018 - 26/07/2018 1,158 258 900 22.28 77.72 14.1 1,134 12,426,994.82
THAI THAIM19 28/06/2018 - 26/07/2018 - - - - - 14.1 - -
20,803 4,190 16,613 20.14 79.86 14.1 6,630 74,294,129.75
Total STA
Total STEC
Total STPI
Total TASCO
Total TCAP
Total THAI
Stock Futures Block Trade Report
View By: Instrument Instrument Class:
As of date : 26/7/2018
Underlying Price (THB) OI (Contracts)
Total AOM Block Trade AOM Block Trade As of 26/07/2018 As of 26/07/2018
All
Underlying Series Period
Trading Volume (Contracts) % Trading Volume
Approximated Block Trade Value (THB)
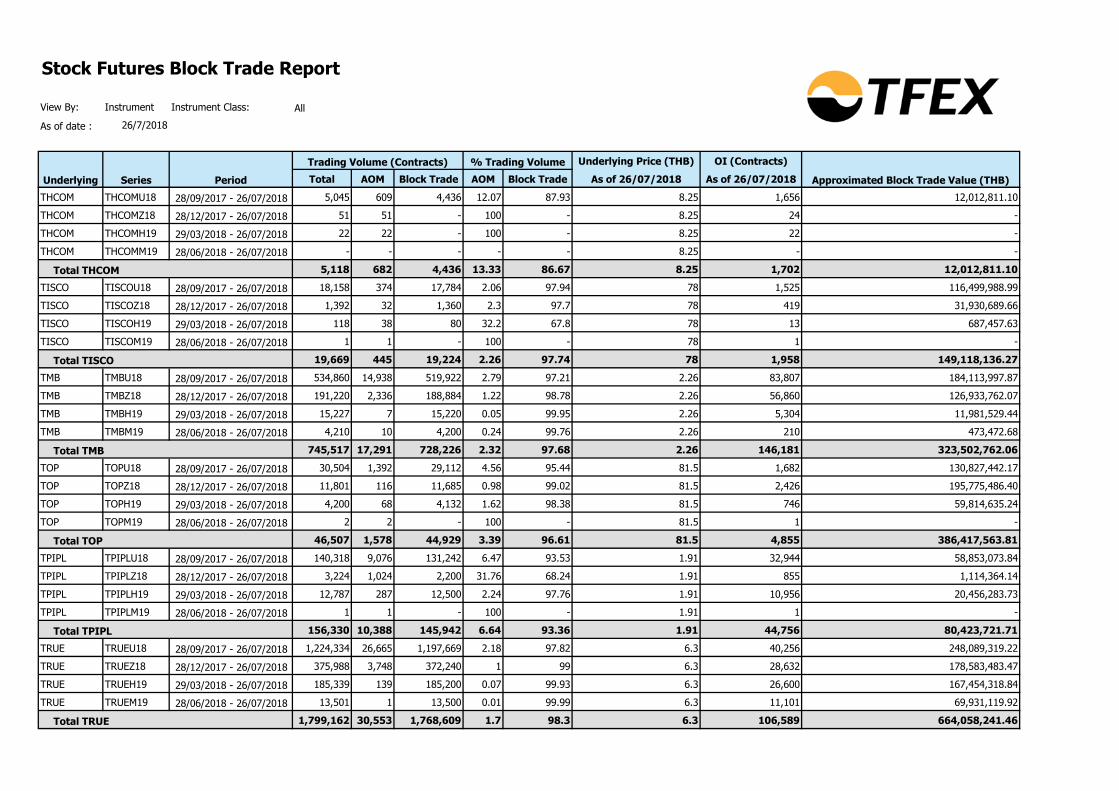
THCOM THCOMU18 28/09/2017 - 26/07/2018 5,045 609 4,436 12.07 87.93 8.25 1,656 12,012,811.10
THCOM THCOMZ18 28/12/2017 - 26/07/2018 51 51 - 100 - 8.25 24 -
THCOM THCOMH19 29/03/2018 - 26/07/2018 22 22 - 100 - 8.25 22 -
THCOM THCOMM19 28/06/2018 - 26/07/2018 - - - - - 8.25 - -
5,118 682 4,436 13.33 86.67 8.25 1,702 12,012,811.10
TISCO TISCOU18 28/09/2017 - 26/07/2018 18,158 374 17,784 2.06 97.94 78 1,525 116,499,988.99
TISCO TISCOZ18 28/12/2017 - 26/07/2018 1,392 32 1,360 2.3 97.7 78 419 31,930,689.66
TISCO TISCOH19 29/03/2018 - 26/07/2018 118 38 80 32.2 67.8 78 13 687,457.63
TISCO TISCOM19 28/06/2018 - 26/07/2018 1 1 - 100 - 78 1 -
19,669 445 19,224 2.26 97.74 78 1,958 149,118,136.27
TMB TMBU18 28/09/2017 - 26/07/2018 534,860 14,938 519,922 2.79 97.21 2.26 83,807 184,113,997.87
TMB TMBZ18 28/12/2017 - 26/07/2018 191,220 2,336 188,884 1.22 98.78 2.26 56,860 126,933,762.07
TMB TMBH19 29/03/2018 - 26/07/2018 15,227 7 15,220 0.05 99.95 2.26 5,304 11,981,529.44
TMB TMBM19 28/06/2018 - 26/07/2018 4,210 10 4,200 0.24 99.76 2.26 210 473,472.68
745,517 17,291 728,226 2.32 97.68 2.26 146,181 323,502,762.06
TOP TOPU18 28/09/2017 - 26/07/2018 30,504 1,392 29,112 4.56 95.44 81.5 1,682 130,827,442.17
TOP TOPZ18 28/12/2017 - 26/07/2018 11,801 116 11,685 0.98 99.02 81.5 2,426 195,775,486.40
TOP TOPH19 29/03/2018 - 26/07/2018 4,200 68 4,132 1.62 98.38 81.5 746 59,814,635.24
TOP TOPM19 28/06/2018 - 26/07/2018 2 2 - 100 - 81.5 1 -
46,507 1,578 44,929 3.39 96.61 81.5 4,855 386,417,563.81
TPIPL TPIPLU18 28/09/2017 - 26/07/2018 140,318 9,076 131,242 6.47 93.53 1.91 32,944 58,853,073.84
TPIPL TPIPLZ18 28/12/2017 - 26/07/2018 3,224 1,024 2,200 31.76 68.24 1.91 855 1,114,364.14
TPIPL TPIPLH19 29/03/2018 - 26/07/2018 12,787 287 12,500 2.24 97.76 1.91 10,956 20,456,283.73
TPIPL TPIPLM19 28/06/2018 - 26/07/2018 1 1 - 100 - 1.91 1 -
156,330 10,388 145,942 6.64 93.36 1.91 44,756 80,423,721.71
TRUE TRUEU18 28/09/2017 - 26/07/2018 1,224,334 26,665 1,197,669 2.18 97.82 6.3 40,256 248,089,319.22
TRUE TRUEZ18 28/12/2017 - 26/07/2018 375,988 3,748 372,240 1 99 6.3 28,632 178,583,483.47
TRUE TRUEH19 29/03/2018 - 26/07/2018 185,339 139 185,200 0.07 99.93 6.3 26,600 167,454,318.84
TRUE TRUEM19 28/06/2018 - 26/07/2018 13,501 1 13,500 0.01 99.99 6.3 11,101 69,931,119.92
1,799,162 30,553 1,768,609 1.7 98.3 6.3 106,589 664,058,241.46
Total THCOM
Total TISCO
Total TMB
Total TOP
Total TPIPL
Total TRUE

Stock Futures Block Trade Report
View By: Instrument Instrument Class:
As of date : 26/7/2018
Underlying Price (THB) OI (Contracts)
Total AOM Block Trade AOM Block Trade As of 26/07/2018 As of 26/07/2018
All
Underlying Series Period
Trading Volume (Contracts) % Trading Volume
Approximated Block Trade Value (THB)
TTA TTAU18 28/09/2017 - 26/07/2018 10,923 1,793 9,130 16.41 83.59 7.35 2,394 14,707,549.85
TTA TTAZ18 28/12/2017 - 26/07/2018 4,516 3,016 1,500 66.78 33.22 7.35 528 1,289,016.83
TTA TTAH19 29/03/2018 - 26/07/2018 2,138 1,438 700 67.26 32.74 7.35 813 1,956,447.61
TTA TTAM19 28/06/2018 - 26/07/2018 - - - - - 7.35 - -
17,577 6,247 11,330 35.54 64.46 7.35 3,735 17,953,014.29
TTCL TTCLU18 28/09/2017 - 26/07/2018 15,799 55 15,744 0.35 99.65 8.15 3,812 30,959,645.75
TTCL TTCLZ18 28/12/2017 - 26/07/2018 259 59 200 22.78 77.22 8.15 249 1,567,065.64
TTCL TTCLH19 29/03/2018 - 26/07/2018 3 3 - 100 - 8.15 3 -
TTCL TTCLM19 28/06/2018 - 26/07/2018 - - - - - 8.15 - -
16,061 117 15,944 0.73 99.27 8.15 4,064 32,526,711.39
TTW TTWU18 28/09/2017 - 26/07/2018 9,573 173 9,400 1.81 98.19 12.3 4,568 55,171,018.49
TTW TTWZ18 28/12/2017 - 26/07/2018 19,119 19 19,100 0.1 99.9 12.3 4,318 53,058,619.17
TTW TTWH19 29/03/2018 - 26/07/2018 1,000 - 1,000 - 100 12.3 1,000 12,300,000.00
TTW TTWM19 28/06/2018 - 26/07/2018 - - - - - 12.3 - -
29,692 192 29,500 0.65 99.35 12.3 9,886 120,529,637.66
TU TUU18 28/09/2017 - 26/07/2018 31,098 684 30,414 2.2 97.8 16.5 2,408 38,858,095.31
TU TUZ18 28/12/2017 - 26/07/2018 3,970 130 3,840 3.27 96.73 16.5 454 7,245,702.77
TU TUH19 29/03/2018 - 26/07/2018 52 52 - 100 - 16.5 52 -
TU TUM19 28/06/2018 - 26/07/2018 1 1 - 100 - 16.5 1 -
35,121 867 34,254 2.47 97.53 16.5 2,915 46,103,798.08
TVO TVOU18 28/09/2017 - 26/07/2018 5,441 138 5,303 2.54 97.46 29.25 631 17,988,631.73
TVO TVOZ18 28/12/2017 - 26/07/2018 - - - - - 29.25 - -
TVO TVOH19 29/03/2018 - 26/07/2018 6 6 - 100 - 29.25 6 -
TVO TVOM19 28/06/2018 - 26/07/2018 - - - - - 29.25 - -
5,447 144 5,303 2.64 97.36 29.25 637 17,988,631.73
UNIQ UNIQU18 28/09/2017 - 26/07/2018 33,195 395 32,800 1.19 98.81 12.8 3,500 44,266,907.67
UNIQ UNIQZ18 28/12/2017 - 26/07/2018 2,404 104 2,300 4.33 95.67 12.8 560 6,857,903.49
UNIQ UNIQH19 29/03/2018 - 26/07/2018 502 2 500 0.4 99.6 12.8 102 1,300,398.41
UNIQ UNIQM19 28/06/2018 - 26/07/2018 1 1 - 100 - 12.8 1 -
36,102 502 35,600 1.39 98.61 12.8 4,163 52,425,209.57
Total TTA
Total TTCL
Total TTW
Total TU
Total TVO
Total UNIQ

Stock Futures Block Trade Report
View By: Instrument Instrument Class:
As of date : 26/7/2018
Underlying Price (THB) OI (Contracts)
Total AOM Block Trade AOM Block Trade As of 26/07/2018 As of 26/07/2018
All
Underlying Series Period
Trading Volume (Contracts) % Trading Volume
Approximated Block Trade Value (THB)
VGI VGIU18 28/09/2017 - 26/07/2018 51,138 1,378 49,760 2.69 97.31 7.3 5,728 40,687,640.19
VGI VGIZ18 28/12/2017 - 26/07/2018 11,520 170 11,350 1.48 98.52 7.3 2,682 19,289,679.69
VGI VGIH19 29/03/2018 - 26/07/2018 205 5 200 2.44 97.56 7.3 5 35,609.76
VGI VGIM19 28/06/2018 - 26/07/2018 8 8 - 100 - 7.3 6 -
62,871 1,561 61,310 2.48 97.52 7.3 8,421 60,012,929.63
VNG VNGU18 28/09/2017 - 26/07/2018 3,443 43 3,400 1.25 98.75 8.05 1,741 13,840,014.52
VNG VNGZ18 28/12/2017 - 26/07/2018 2,852 9 2,843 0.32 99.68 8.05 2,850 22,870,100.81
VNG VNGH19 29/03/2018 - 26/07/2018 - - - - - 8.05 - -
VNG VNGM19 28/06/2018 - 26/07/2018 - - - - - 8.05 - -
6,295 52 6,243 0.83 99.17 8.05 4,591 36,710,115.33
WHA WHAU18 28/09/2017 - 26/07/2018 631,622 8,390 623,232 1.33 98.67 4 24,928 98,387,499.46
WHA WHAZ18 28/12/2017 - 26/07/2018 71,059 759 70,300 1.07 98.93 4 5,339 21,127,890.91
WHA WHAH19 29/03/2018 - 26/07/2018 5,785 195 5,590 3.37 96.63 4 1,663 6,427,775.28
WHA WHAM19 28/06/2018 - 26/07/2018 2 2 - 100 - 4 2 -
708,468 9,346 699,122 1.32 98.68 4 31,932 125,943,165.65
Block Trade value is an estimate only. A standard contract size of 1,000 shares is used for calculations.
Total VGI
Total VNG
Total WHA
Disclaimer This contents are created and provided for informative and education purposes only. TFEX does not make any representations regarding the completeness, accuracy or reliability of the contents. TFEX does
not make any representations and hereby disclaims with respect to this content.