stock futures block trade report - tfex.co.th · stock futures block trade report view by:...
TRANSCRIPT

Stock Futures Block Trade Report
View By: Instrument Instrument Class:
As of date : 20/7/2018
Underlying Price (THB) OI (Contracts)
Total AOM Block Trade AOM Block Trade As of 20/07/2018 As of 20/07/2018
AAV AAVU18 28/09/2017 - 20/07/2018 21,366 566 20,800 2.65 97.35 4.7 5,481 25,078,281.38
AAV AAVZ18 28/12/2017 - 20/07/2018 3,742 142 3,600 3.79 96.21 4.7 266 1,202,757.88
AAV AAVH19 29/03/2018 - 20/07/2018 200 - 200 - 100 4.7 - -
AAV AAVM19 28/06/2018 - 20/07/2018 1,000 - 1,000 - 100 4.7 1,000 4,700,000.00
26,308 708 25,600 2.69 97.31 4.7 6,747 30,981,039.27
ADVANC ADVANCU18 28/09/2017 - 20/07/2018 29,851 991 28,860 3.32 96.68 198 1,185 226,840,702.15
ADVANC ADVANCZ18 28/12/2017 - 20/07/2018 1,864 84 1,780 4.51 95.49 198 69 13,046,330.47
ADVANC ADVANCH19 29/03/2018 - 20/07/2018 2,462 2 2,460 0.08 99.92 198 2 395,678.31
ADVANC ADVANCM19 28/06/2018 - 20/07/2018 - - - - - 198 - -
34,177 1,077 33,100 3.15 96.85 198 1,256 240,282,710.94
AMATA AMATAU18 28/09/2017 - 20/07/2018 139,597 1,333 138,264 0.95 99.05 19.7 8,520 166,241,271.78
AMATA AMATAZ18 28/12/2017 - 20/07/2018 7,052 112 6,940 1.59 98.41 19.7 519 10,061,917.47
AMATA AMATAH19 29/03/2018 - 20/07/2018 45 45 - 100 - 19.7 5 -
AMATA AMATAM19 28/06/2018 - 20/07/2018 - - - - - 19.7 - -
146,694 1,490 145,204 1.02 98.98 19.7 9,044 176,303,189.25
AOT AOTU18 28/09/2017 - 20/07/2018 88,969 2,839 86,130 3.19 96.81 64.25 5,427 337,558,222.72
AOT AOTZ18 28/12/2017 - 20/07/2018 23,964 1,152 22,812 4.81 95.19 64.25 2,950 180,426,032.80
AOT AOTH19 29/03/2018 - 20/07/2018 3,075 295 2,780 9.59 90.41 64.25 585 33,980,414.63
AOT AOTM19 28/06/2018 - 20/07/2018 421 21 400 4.99 95.01 64.25 1 61,045.13
116,429 4,307 112,122 3.7 96.3 64.25 8,963 552,025,715.29
AP APU18 28/09/2017 - 20/07/2018 53,720 120 53,600 0.22 99.78 9.05 15,120 136,530,335.07
AP APZ18 28/12/2017 - 20/07/2018 51,509 26 51,483 0.05 99.95 9.05 30,695 277,649,531.14
AP APH19 29/03/2018 - 20/07/2018 22,879 74 22,805 0.32 99.68 9.05 21,618 195,010,111.22
AP APM19 28/06/2018 - 20/07/2018 5 5 - 100 - 9.05 5 -
128,113 225 127,888 0.18 99.82 9.05 67,438 609,189,977.42
BA BAU18 28/09/2017 - 20/07/2018 3,335 735 2,600 22.04 77.96 12.4 290 2,803,478.26
BA BAZ18 28/12/2017 - 20/07/2018 242 42 200 17.36 82.64 12.4 22 225,454.55
BA BAH19 29/03/2018 - 20/07/2018 - - - - - 12.4 - -
BA BAM19 28/06/2018 - 20/07/2018 - - - - - 12.4 - -
3,577 777 2,800 21.72 78.28 12.4 312 3,028,932.81
Total AAV
Total ADVANC
Total AMATA
Total AOT
Total AP
Total BA
All
Underlying Series Period
Trading Volume (Contracts) % Trading Volume
Approximated Block Trade Value (THB)

Stock Futures Block Trade Report
View By: Instrument Instrument Class:
As of date : 20/7/2018
Underlying Price (THB) OI (Contracts)
Total AOM Block Trade AOM Block Trade As of 20/07/2018 As of 20/07/2018
All
Underlying Series Period
Trading Volume (Contracts) % Trading Volume
Approximated Block Trade Value (THB)
BANPU BANPUU18 28/09/2017 - 20/07/2018 337,420 10,244 327,176 3.04 96.96 20.9 31,328 634,876,970.29
BANPU BANPUZ18 28/12/2017 - 20/07/2018 199,614 681 198,933 0.34 99.66 20.9 9,373 195,227,385.29
BANPU BANPUH19 29/03/2018 - 20/07/2018 39,241 63 39,178 0.16 99.84 20.9 22,430 468,034,379.50
BANPU BANPUM19 28/06/2018 - 20/07/2018 3,201 1 3,200 0.03 99.97 20.9 3,001 62,701,305.84
579,476 10,989 568,487 1.9 98.1 20.9 66,132 1,360,840,040.93
BAY BAYU18 28/09/2017 - 20/07/2018 2,627 127 2,500 4.83 95.17 40 683 25,999,238.68
BAY BAYZ18 28/12/2017 - 20/07/2018 202 2 200 0.99 99.01 40 201 7,960,396.04
BAY BAYH19 29/03/2018 - 20/07/2018 - - - - - 40 - -
BAY BAYM19 28/06/2018 - 20/07/2018 - - - - - 40 - -
2,829 129 2,700 4.56 95.44 40 884 33,959,634.71
BBL BBLU18 28/09/2017 - 20/07/2018 16,879 502 16,377 2.97 97.03 197.5 1,045 200,249,309.05
BBL BBLZ18 28/12/2017 - 20/07/2018 3,569 109 3,460 3.05 96.95 197.5 402 76,970,215.75
BBL BBLH19 29/03/2018 - 20/07/2018 1,235 95 1,140 7.69 92.31 197.5 75 13,673,076.92
BBL BBLM19 28/06/2018 - 20/07/2018 - - - - - 197.5 - -
21,683 706 20,977 3.26 96.74 197.5 1,522 290,892,601.72
BCH BCHU18 28/09/2017 - 20/07/2018 30,438 164 30,274 0.54 99.46 16 1,485 23,631,981.08
BCH BCHZ18 28/12/2017 - 20/07/2018 5,523 123 5,400 2.23 97.77 16 1,634 25,561,759.91
BCH BCHH19 29/03/2018 - 20/07/2018 658 58 600 8.81 91.19 16 647 9,439,513.68
BCH BCHM19 28/06/2018 - 20/07/2018 - - - - - 16 - -
36,619 345 36,274 0.94 99.06 16 3,766 58,633,254.67
BCP BCPU18 28/09/2017 - 20/07/2018 12,365 365 12,000 2.95 97.05 34.25 1,266 42,080,549.94
BCP BCPZ18 28/12/2017 - 20/07/2018 8,191 321 7,870 3.92 96.08 34.25 3,968 130,578,010.01
BCP BCPH19 29/03/2018 - 20/07/2018 1,488 88 1,400 5.91 94.09 34.25 879 28,325,302.42
BCP BCPM19 28/06/2018 - 20/07/2018 800 - 800 - 100 34.25 - -
22,844 774 22,070 3.39 96.61 34.25 6,113 200,983,862.37
BDMS BDMSU18 28/09/2017 - 20/07/2018 76,401 612 75,789 0.8 99.2 26 4,939 127,385,356.81
BDMS BDMSZ18 28/12/2017 - 20/07/2018 11,669 269 11,400 2.31 97.69 26 289 7,340,783.27
BDMS BDMSH19 29/03/2018 - 20/07/2018 3,561 161 3,400 4.52 95.48 26 2,160 53,620,893.01
BDMS BDMSM19 28/06/2018 - 20/07/2018 200 - 200 - 100 26 200 5,200,000.00
91,831 1,042 90,789 1.13 98.87 26 7,588 193,547,033.09
Total BANPU
Total BAY
Total BBL
Total BCH
Total BCP
Total BDMS
Stock Futures Block Trade Report
View By: Instrument Instrument Class:
As of date : 20/7/2018
Underlying Price (THB) OI (Contracts)
Total AOM Block Trade AOM Block Trade As of 20/07/2018 As of 20/07/2018
All
Underlying Series Period
Trading Volume (Contracts) % Trading Volume
Approximated Block Trade Value (THB)
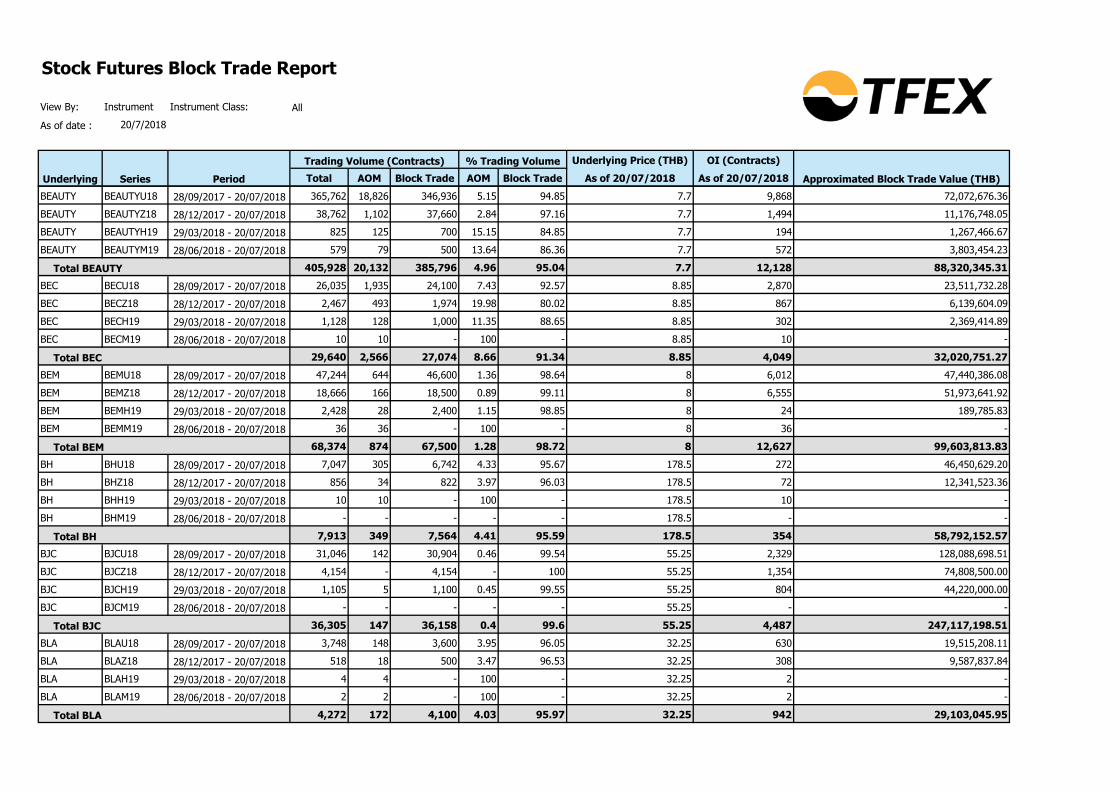
BEAUTY BEAUTYU18 28/09/2017 - 20/07/2018 365,762 18,826 346,936 5.15 94.85 7.7 9,868 72,072,676.36
BEAUTY BEAUTYZ18 28/12/2017 - 20/07/2018 38,762 1,102 37,660 2.84 97.16 7.7 1,494 11,176,748.05
BEAUTY BEAUTYH19 29/03/2018 - 20/07/2018 825 125 700 15.15 84.85 7.7 194 1,267,466.67
BEAUTY BEAUTYM19 28/06/2018 - 20/07/2018 579 79 500 13.64 86.36 7.7 572 3,803,454.23
405,928 20,132 385,796 4.96 95.04 7.7 12,128 88,320,345.31
BEC BECU18 28/09/2017 - 20/07/2018 26,035 1,935 24,100 7.43 92.57 8.85 2,870 23,511,732.28
BEC BECZ18 28/12/2017 - 20/07/2018 2,467 493 1,974 19.98 80.02 8.85 867 6,139,604.09
BEC BECH19 29/03/2018 - 20/07/2018 1,128 128 1,000 11.35 88.65 8.85 302 2,369,414.89
BEC BECM19 28/06/2018 - 20/07/2018 10 10 - 100 - 8.85 10 -
29,640 2,566 27,074 8.66 91.34 8.85 4,049 32,020,751.27
BEM BEMU18 28/09/2017 - 20/07/2018 47,244 644 46,600 1.36 98.64 8 6,012 47,440,386.08
BEM BEMZ18 28/12/2017 - 20/07/2018 18,666 166 18,500 0.89 99.11 8 6,555 51,973,641.92
BEM BEMH19 29/03/2018 - 20/07/2018 2,428 28 2,400 1.15 98.85 8 24 189,785.83
BEM BEMM19 28/06/2018 - 20/07/2018 36 36 - 100 - 8 36 -
68,374 874 67,500 1.28 98.72 8 12,627 99,603,813.83
BH BHU18 28/09/2017 - 20/07/2018 7,047 305 6,742 4.33 95.67 178.5 272 46,450,629.20
BH BHZ18 28/12/2017 - 20/07/2018 856 34 822 3.97 96.03 178.5 72 12,341,523.36
BH BHH19 29/03/2018 - 20/07/2018 10 10 - 100 - 178.5 10 -
BH BHM19 28/06/2018 - 20/07/2018 - - - - - 178.5 - -
7,913 349 7,564 4.41 95.59 178.5 354 58,792,152.57
BJC BJCU18 28/09/2017 - 20/07/2018 31,046 142 30,904 0.46 99.54 55.25 2,329 128,088,698.51
BJC BJCZ18 28/12/2017 - 20/07/2018 4,154 - 4,154 - 100 55.25 1,354 74,808,500.00
BJC BJCH19 29/03/2018 - 20/07/2018 1,105 5 1,100 0.45 99.55 55.25 804 44,220,000.00
BJC BJCM19 28/06/2018 - 20/07/2018 - - - - - 55.25 - -
36,305 147 36,158 0.4 99.6 55.25 4,487 247,117,198.51
BLA BLAU18 28/09/2017 - 20/07/2018 3,748 148 3,600 3.95 96.05 32.25 630 19,515,208.11
BLA BLAZ18 28/12/2017 - 20/07/2018 518 18 500 3.47 96.53 32.25 308 9,587,837.84
BLA BLAH19 29/03/2018 - 20/07/2018 4 4 - 100 - 32.25 2 -
BLA BLAM19 28/06/2018 - 20/07/2018 2 2 - 100 - 32.25 2 -
4,272 172 4,100 4.03 95.97 32.25 942 29,103,045.95
Total BEAUTY
Total BEC
Total BEM
Total BH
Total BJC
Total BLA
Stock Futures Block Trade Report
View By: Instrument Instrument Class:
As of date : 20/7/2018
Underlying Price (THB) OI (Contracts)
Total AOM Block Trade AOM Block Trade As of 20/07/2018 As of 20/07/2018
All
Underlying Series Period
Trading Volume (Contracts) % Trading Volume
Approximated Block Trade Value (THB)
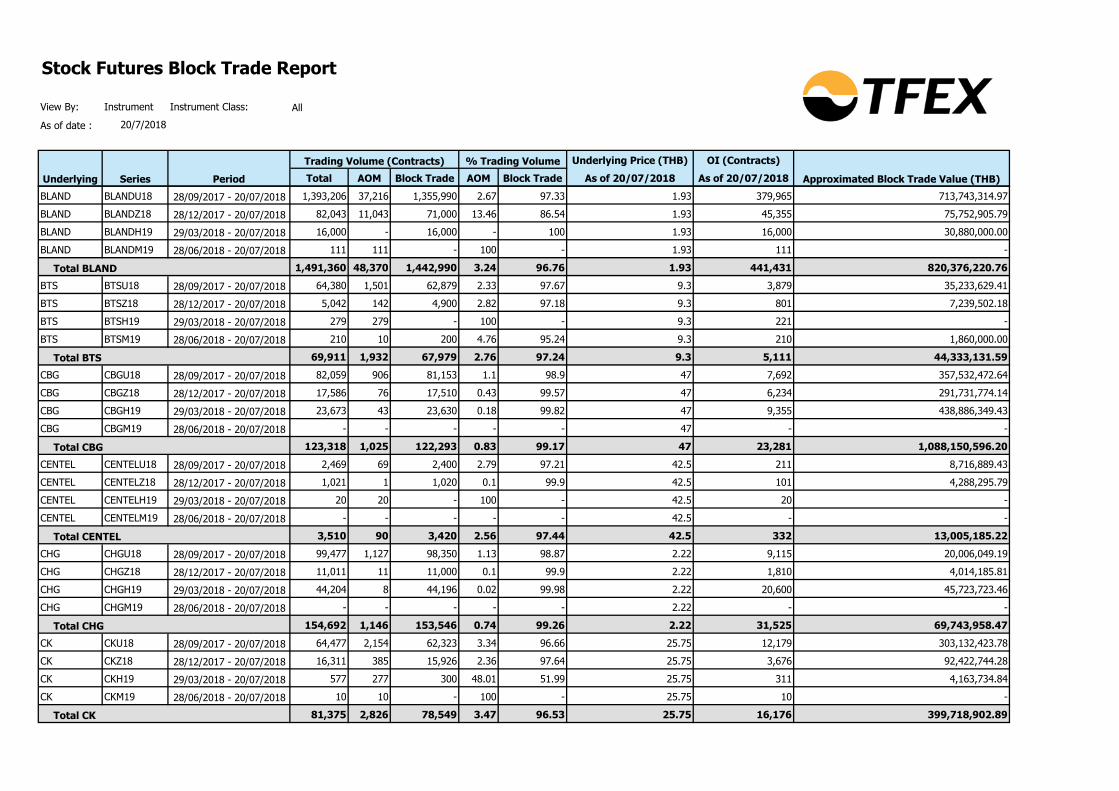
BLAND BLANDU18 28/09/2017 - 20/07/2018 1,393,206 37,216 1,355,990 2.67 97.33 1.93 379,965 713,743,314.97
BLAND BLANDZ18 28/12/2017 - 20/07/2018 82,043 11,043 71,000 13.46 86.54 1.93 45,355 75,752,905.79
BLAND BLANDH19 29/03/2018 - 20/07/2018 16,000 - 16,000 - 100 1.93 16,000 30,880,000.00
BLAND BLANDM19 28/06/2018 - 20/07/2018 111 111 - 100 - 1.93 111 -
1,491,360 48,370 1,442,990 3.24 96.76 1.93 441,431 820,376,220.76
BTS BTSU18 28/09/2017 - 20/07/2018 64,380 1,501 62,879 2.33 97.67 9.3 3,879 35,233,629.41
BTS BTSZ18 28/12/2017 - 20/07/2018 5,042 142 4,900 2.82 97.18 9.3 801 7,239,502.18
BTS BTSH19 29/03/2018 - 20/07/2018 279 279 - 100 - 9.3 221 -
BTS BTSM19 28/06/2018 - 20/07/2018 210 10 200 4.76 95.24 9.3 210 1,860,000.00
69,911 1,932 67,979 2.76 97.24 9.3 5,111 44,333,131.59
CBG CBGU18 28/09/2017 - 20/07/2018 82,059 906 81,153 1.1 98.9 47 7,692 357,532,472.64
CBG CBGZ18 28/12/2017 - 20/07/2018 17,586 76 17,510 0.43 99.57 47 6,234 291,731,774.14
CBG CBGH19 29/03/2018 - 20/07/2018 23,673 43 23,630 0.18 99.82 47 9,355 438,886,349.43
CBG CBGM19 28/06/2018 - 20/07/2018 - - - - - 47 - -
123,318 1,025 122,293 0.83 99.17 47 23,281 1,088,150,596.20
CENTEL CENTELU18 28/09/2017 - 20/07/2018 2,469 69 2,400 2.79 97.21 42.5 211 8,716,889.43
CENTEL CENTELZ18 28/12/2017 - 20/07/2018 1,021 1 1,020 0.1 99.9 42.5 101 4,288,295.79
CENTEL CENTELH19 29/03/2018 - 20/07/2018 20 20 - 100 - 42.5 20 -
CENTEL CENTELM19 28/06/2018 - 20/07/2018 - - - - - 42.5 - -
3,510 90 3,420 2.56 97.44 42.5 332 13,005,185.22
CHG CHGU18 28/09/2017 - 20/07/2018 99,477 1,127 98,350 1.13 98.87 2.22 9,115 20,006,049.19
CHG CHGZ18 28/12/2017 - 20/07/2018 11,011 11 11,000 0.1 99.9 2.22 1,810 4,014,185.81
CHG CHGH19 29/03/2018 - 20/07/2018 44,204 8 44,196 0.02 99.98 2.22 20,600 45,723,723.46
CHG CHGM19 28/06/2018 - 20/07/2018 - - - - - 2.22 - -
154,692 1,146 153,546 0.74 99.26 2.22 31,525 69,743,958.47
CK CKU18 28/09/2017 - 20/07/2018 64,477 2,154 62,323 3.34 96.66 25.75 12,179 303,132,423.78
CK CKZ18 28/12/2017 - 20/07/2018 16,311 385 15,926 2.36 97.64 25.75 3,676 92,422,744.28
CK CKH19 29/03/2018 - 20/07/2018 577 277 300 48.01 51.99 25.75 311 4,163,734.84
CK CKM19 28/06/2018 - 20/07/2018 10 10 - 100 - 25.75 10 -
81,375 2,826 78,549 3.47 96.53 25.75 16,176 399,718,902.89
Total BLAND
Total BTS
Total CBG
Total CENTEL
Total CHG
Total CK

Stock Futures Block Trade Report
View By: Instrument Instrument Class:
As of date : 20/7/2018
Underlying Price (THB) OI (Contracts)
Total AOM Block Trade AOM Block Trade As of 20/07/2018 As of 20/07/2018
All
Underlying Series Period
Trading Volume (Contracts) % Trading Volume
Approximated Block Trade Value (THB)
CKP CKPU18 28/09/2017 - 20/07/2018 99,833 3,933 95,900 3.94 96.06 4.06 9,661 37,678,412.89
CKP CKPZ18 28/12/2017 - 20/07/2018 17,993 443 17,550 2.46 97.54 4.06 1,943 7,694,357.75
CKP CKPH19 29/03/2018 - 20/07/2018 13,940 340 13,600 2.44 97.56 4.06 218 863,492.68
CKP CKPM19 28/06/2018 - 20/07/2018 211 11 200 5.21 94.79 4.06 10 38,483.41
131,977 4,727 127,250 3.58 96.42 4.06 11,832 46,274,746.74
CPALL CPALLU18 28/09/2017 - 20/07/2018 80,083 1,323 78,760 1.65 98.35 74.75 8,443 620,688,015.31
CPALL CPALLZ18 28/12/2017 - 20/07/2018 14,376 395 13,981 2.75 97.25 74.75 2,705 196,643,066.48
CPALL CPALLH19 29/03/2018 - 20/07/2018 4,629 89 4,540 1.92 98.08 74.75 445 32,624,200.69
CPALL CPALLM19 28/06/2018 - 20/07/2018 45 25 20 55.56 44.44 74.75 45 1,495,000.00
99,133 1,832 97,301 1.85 98.15 74.75 11,638 851,450,282.48
CPF CPFU18 28/09/2017 - 20/07/2018 90,736 3,686 87,050 4.06 95.94 26.75 6,467 165,964,725.83
CPF CPFZ18 28/12/2017 - 20/07/2018 31,514 126 31,388 0.4 99.6 26.75 611 16,278,902.04
CPF CPFH19 29/03/2018 - 20/07/2018 4,539 539 4,000 11.87 88.13 26.75 44 1,037,232.87
CPF CPFM19 28/06/2018 - 20/07/2018 900 - 900 - 100 26.75 200 5,350,000.00
127,689 4,351 123,338 3.41 96.59 26.75 7,322 188,630,860.74
CPN CPNU18 28/09/2017 - 20/07/2018 14,943 153 14,790 1.02 98.98 76.5 923 69,886,535.84
CPN CPNZ18 28/12/2017 - 20/07/2018 6,896 6 6,890 0.09 99.91 76.5 235 17,961,858.32
CPN CPNH19 29/03/2018 - 20/07/2018 1,146 6 1,140 0.52 99.48 76.5 26 1,978,586.39
CPN CPNM19 28/06/2018 - 20/07/2018 7 7 - 100 - 76.5 7 -
22,992 172 22,820 0.75 99.25 76.5 1,191 89,826,980.55
DELTA DELTAU18 28/09/2017 - 20/07/2018 1,759 37 1,722 2.1 97.9 67.5 157 10,374,584.99
DELTA DELTAZ18 28/12/2017 - 20/07/2018 415 5 410 1.2 98.8 67.5 231 15,404,638.55
DELTA DELTAH19 29/03/2018 - 20/07/2018 71 11 60 15.49 84.51 67.5 24 1,369,014.08
DELTA DELTAM19 28/06/2018 - 20/07/2018 201 1 200 0.5 99.5 67.5 201 13,500,000.00
2,446 54 2,392 2.21 97.79 67.5 613 40,648,237.63
DTAC DTACU18 28/09/2017 - 20/07/2018 51,013 1,559 49,454 3.06 96.94 40.5 3,361 131,960,543.53
DTAC DTACZ18 28/12/2017 - 20/07/2018 6,630 130 6,500 1.96 98.04 40.5 534 21,202,941.18
DTAC DTACH19 29/03/2018 - 20/07/2018 1,208 8 1,200 0.66 99.34 40.5 1,006 40,473,178.81
DTAC DTACM19 28/06/2018 - 20/07/2018 280 280 - 100 - 40.5 - -
59,131 1,977 57,154 3.34 96.66 40.5 4,901 193,636,663.51
Total CKP
Total CPALL
Total CPF
Total CPN
Total DELTA
Total DTAC

Stock Futures Block Trade Report
View By: Instrument Instrument Class:
As of date : 20/7/2018
Underlying Price (THB) OI (Contracts)
Total AOM Block Trade AOM Block Trade As of 20/07/2018 As of 20/07/2018
All
Underlying Series Period
Trading Volume (Contracts) % Trading Volume
Approximated Block Trade Value (THB)
EARTH EARTHU18 28/09/2017 - 20/07/2018 - - - - - - - -
EARTH EARTHZ18 28/12/2017 - 20/07/2018 - - - - - - - -
EARTH EARTHH19 29/03/2018 - 20/07/2018 - - - - - - - -
EARTH EARTHM19 28/06/2018 - 20/07/2018 - - - - - - - -
- - - - - - - -
EGCO EGCOU18 28/09/2017 - 20/07/2018 6,489 299 6,190 4.61 95.39 227 2,740 593,320,419.17
EGCO EGCOZ18 28/12/2017 - 20/07/2018 2,264 4 2,260 0.18 99.82 227 2 453,197.88
EGCO EGCOH19 29/03/2018 - 20/07/2018 41 1 40 2.44 97.56 227 1 221,463.41
EGCO EGCOM19 28/06/2018 - 20/07/2018 - - - - - 227 - -
8,794 304 8,490 3.46 96.54 227 2,743 593,995,080.47
EPG EPGU18 28/09/2017 - 20/07/2018 34,569 793 33,776 2.29 97.71 8.45 1,057 8,726,761.27
EPG EPGZ18 28/12/2017 - 20/07/2018 2,892 92 2,800 3.18 96.82 8.45 374 3,059,764.87
EPG EPGH19 29/03/2018 - 20/07/2018 20 20 - 100 - 8.45 20 -
EPG EPGM19 28/06/2018 - 20/07/2018 - - - - - 8.45 - -
37,481 905 36,576 2.41 97.59 8.45 1,451 11,786,526.14
GLOBAL GLOBALU18X 28/09/2017 - 20/07/2018 20,085 33 20,052 0.16 99.84 17.4 1,125 19,542,837.94
GLOBAL GLOBALZ18X 28/12/2017 - 20/07/2018 3,208 8 3,200 0.25 99.75 17.4 2,408 41,794,713.22
GLOBAL GLOBALH19 29/03/2018 - 20/07/2018 6,800 - 6,800 - 100 17.4 100 1,740,000.00
GLOBAL GLOBALM19 28/06/2018 - 20/07/2018 2,222 - 2,222 - 100 17.4 2,222 38,662,800.00
32,315 41 32,274 0.13 99.87 17.4 5,855 101,740,351.16
GLOW GLOWU18X 28/09/2017 - 20/07/2018 29,977 47 29,930 0.16 99.84 93.25 355 33,051,847.67
GLOW GLOWZ18X 28/12/2017 - 20/07/2018 1,680 - 1,680 - 100 93.25 - -
GLOW GLOWH19X 29/03/2018 - 20/07/2018 40 - 40 - 100 93.25 - -
GLOW GLOWM19 28/06/2018 - 20/07/2018 - - - - - 93.25 - -
31,697 47 31,650 0.15 99.85 93.25 355 33,051,847.67
GPSC GPSCU18 28/09/2017 - 20/07/2018 32,736 354 32,382 1.08 98.92 70.5 1,701 118,623,705.74
GPSC GPSCZ18 28/12/2017 - 20/07/2018 6,491 31 6,460 0.48 99.52 70.5 19 1,333,102.76
GPSC GPSCH19 29/03/2018 - 20/07/2018 3,320 20 3,300 0.6 99.4 70.5 117 8,198,810.24
GPSC GPSCM19 28/06/2018 - 20/07/2018 40 40 - 100 - 70.5 - -
42,587 445 42,142 1.04 98.96 70.5 1,837 128,155,618.74
Total EARTH
Total EGCO
Total EPG
Total GLOBAL
Total GLOW
Total GPSC

Stock Futures Block Trade Report
View By: Instrument Instrument Class:
As of date : 20/7/2018
Underlying Price (THB) OI (Contracts)
Total AOM Block Trade AOM Block Trade As of 20/07/2018 As of 20/07/2018
All
Underlying Series Period
Trading Volume (Contracts) % Trading Volume
Approximated Block Trade Value (THB)
GUNKUL GUNKULU18 28/09/2017 - 20/07/2018 48,579 719 47,860 1.48 98.52 2.92 4,673 13,443,202.98
GUNKUL GUNKULZ18 28/12/2017 - 20/07/2018 2,911 244 2,667 8.38 91.62 2.92 2,807 7,509,414.46
GUNKUL GUNKULH19 29/03/2018 - 20/07/2018 - - - - - 2.92 - -
GUNKUL GUNKULM19 28/06/2018 - 20/07/2018 - - - - - 2.92 - -
51,490 963 50,527 1.87 98.13 2.92 7,480 20,952,617.44
HANA HANAU18 28/09/2017 - 20/07/2018 5,875 55 5,820 0.94 99.06 36.75 615 22,389,663.83
HANA HANAZ18 28/12/2017 - 20/07/2018 1,055 55 1,000 5.21 94.79 36.75 335 11,669,431.28
HANA HANAH19 29/03/2018 - 20/07/2018 134 34 100 25.37 74.63 36.75 133 3,647,574.63
HANA HANAM19 28/06/2018 - 20/07/2018 - - - - - 36.75 - -
7,064 144 6,920 2.04 97.96 36.75 1,083 37,706,669.74
HMPRO HMPROU18 28/09/2017 - 20/07/2018 54,633 653 53,980 1.2 98.8 14.3 3,267 46,159,702.71
HMPRO HMPROZ18 28/12/2017 - 20/07/2018 8,517 117 8,400 1.37 98.63 14.3 712 10,041,733.00
HMPRO HMPROH19 29/03/2018 - 20/07/2018 1,500 100 1,400 6.67 93.33 14.3 - -
HMPRO HMPROM19 28/06/2018 - 20/07/2018 200 - 200 - 100 14.3 - -
64,850 870 63,980 1.34 98.66 14.3 3,979 56,201,435.71
ICHI ICHIU18 28/09/2017 - 20/07/2018 73,287 759 72,528 1.04 98.96 4.8 6,676 31,712,926.64
ICHI ICHIZ18 28/12/2017 - 20/07/2018 8,151 51 8,100 0.63 99.37 4.8 314 1,497,769.60
ICHI ICHIH19 29/03/2018 - 20/07/2018 108 8 100 7.41 92.59 4.8 105 466,666.67
ICHI ICHIM19 28/06/2018 - 20/07/2018 12 12 - 100 - 4.8 12 -
81,558 830 80,728 1.02 98.98 4.8 7,107 33,677,362.90
INTUCH INTUCHU18 28/09/2017 - 20/07/2018 12,003 223 11,780 1.86 98.14 55.25 617 33,455,916.44
INTUCH INTUCHZ18 28/12/2017 - 20/07/2018 816 6 810 0.74 99.26 55.25 112 6,142,500.00
INTUCH INTUCHH19 29/03/2018 - 20/07/2018 150 - 150 - 100 55.25 30 1,657,500.00
INTUCH INTUCHM19 28/06/2018 - 20/07/2018 - - - - - 55.25 - -
12,969 229 12,740 1.77 98.23 55.25 759 41,255,916.44
IRPC IRPCU18 28/09/2017 - 20/07/2018 311,204 6,984 304,220 2.24 97.76 6.35 31,241 193,928,323.79
IRPC IRPCZ18 28/12/2017 - 20/07/2018 64,957 847 64,110 1.3 98.7 6.35 11,455 71,790,774.17
IRPC IRPCH19 29/03/2018 - 20/07/2018 15,837 837 15,000 5.29 94.71 6.35 1,877 11,289,022.54
IRPC IRPCM19 28/06/2018 - 20/07/2018 1,200 - 1,200 - 100 6.35 - -
393,198 8,668 384,530 2.2 97.8 6.35 44,573 277,008,120.50
Total GUNKUL
Total HANA
Total HMPRO
Total ICHI
Total INTUCH
Total IRPC

Stock Futures Block Trade Report
View By: Instrument Instrument Class:
As of date : 20/7/2018
Underlying Price (THB) OI (Contracts)
Total AOM Block Trade AOM Block Trade As of 20/07/2018 As of 20/07/2018
All
Underlying Series Period
Trading Volume (Contracts) % Trading Volume
Approximated Block Trade Value (THB)
ITD ITDU18 28/09/2017 - 20/07/2018 85,754 11,707 74,047 13.65 86.35 2.86 22,182 54,779,720.88
ITD ITDZ18 28/12/2017 - 20/07/2018 9,664 1,832 7,832 18.96 81.04 2.86 4,817 11,164,992.53
ITD ITDH19 29/03/2018 - 20/07/2018 1,058 98 960 9.26 90.74 2.86 62 160,895.27
ITD ITDM19 28/06/2018 - 20/07/2018 - - - - - 2.86 - -
96,476 13,637 82,839 14.14 85.86 2.86 27,061 66,105,608.69
IVL IVLU18 28/09/2017 - 20/07/2018 138,158 2,308 135,850 1.67 98.33 58.75 8,637 498,946,976.92
IVL IVLZ18 28/12/2017 - 20/07/2018 41,797 801 40,996 1.92 98.08 58.75 1,644 94,734,039.76
IVL IVLH19 29/03/2018 - 20/07/2018 4,098 98 4,000 2.39 97.61 58.75 406 23,282,088.82
IVL IVLM19 28/06/2018 - 20/07/2018 1 1 - 100 - 58.75 1 -
184,054 3,208 180,846 1.74 98.26 58.75 10,688 616,963,105.51
JAS JASU18 28/09/2017 - 20/07/2018 450,393 2,791 447,602 0.62 99.38 5.15 35,088 179,583,416.54
JAS JASZ18 28/12/2017 - 20/07/2018 177,264 1,766 175,498 1 99 5.15 17,016 86,759,358.56
JAS JASH19 29/03/2018 - 20/07/2018 18,048 868 17,180 4.81 95.19 5.15 6,238 30,580,647.50
JAS JASM19 28/06/2018 - 20/07/2018 - - - - - 5.15 - -
645,705 5,425 640,280 0.84 99.16 5.15 58,342 296,923,422.59
KBANK KBANKU18 28/09/2017 - 20/07/2018 35,173 647 34,526 1.84 98.16 210 2,508 516,991,831.23
KBANK KBANKZ18 28/12/2017 - 20/07/2018 3,409 64 3,345 1.88 98.12 210 334 68,823,203.29
KBANK KBANKH19 29/03/2018 - 20/07/2018 1,425 25 1,400 1.75 98.25 210 45 9,284,210.53
KBANK KBANKM19 28/06/2018 - 20/07/2018 20 - 20 - 100 210 20 4,200,000.00
40,027 736 39,291 1.84 98.16 210 2,907 599,299,245.05
KCE KCEU18X 28/09/2017 - 20/07/2018 14,275 473 13,802 3.31 96.69 42.75 1,092 45,136,165.74
KCE KCEZ18X 28/12/2017 - 20/07/2018 1,163 63 1,100 5.42 94.58 42.75 270 10,917,239.90
KCE KCEH19X 29/03/2018 - 20/07/2018 309 149 160 48.22 51.78 42.75 69 1,527,378.64
KCE KCEM19 28/06/2018 - 20/07/2018 600 - 600 - 100 42.75 200 8,550,000.00
16,347 685 15,662 4.19 95.81 42.75 1,631 66,130,784.28
KKP KKPU18 28/09/2017 - 20/07/2018 12,135 1,065 11,070 8.78 91.22 73 1,686 112,276,346.11
KKP KKPZ18 28/12/2017 - 20/07/2018 1,513 23 1,490 1.52 98.48 73 348 25,017,818.90
KKP KKPH19 29/03/2018 - 20/07/2018 2 2 - 100 - 73 1 -
KKP KKPM19 28/06/2018 - 20/07/2018 1 1 - 100 - 73 1 -
13,651 1,091 12,560 7.99 92.01 73 2,036 137,294,165.01
Total ITD
Total IVL
Total JAS
Total KBANK
Total KCE
Total KKP

Stock Futures Block Trade Report
View By: Instrument Instrument Class:
As of date : 20/7/2018
Underlying Price (THB) OI (Contracts)
Total AOM Block Trade AOM Block Trade As of 20/07/2018 As of 20/07/2018
All
Underlying Series Period
Trading Volume (Contracts) % Trading Volume
Approximated Block Trade Value (THB)
KTB KTBU18 28/09/2017 - 20/07/2018 94,152 5,342 88,810 5.67 94.33 18.2 14,359 246,506,232.24
KTB KTBZ18 28/12/2017 - 20/07/2018 164,230 618 163,612 0.38 99.62 18.2 77,856 1,411,647,085.61
KTB KTBH19 29/03/2018 - 20/07/2018 26,715 48 26,667 0.18 99.82 18.2 26,487 481,197,255.77
KTB KTBM19 28/06/2018 - 20/07/2018 55 55 - 100 - 18.2 55 -
285,152 6,063 279,089 2.13 97.87 18.2 118,757 2,139,350,573.62
KTC KTCU18X 28/09/2017 - 20/07/2018 16,136 777 15,359 4.82 95.18 31.75 2,350 71,019,669.53
KTC KTCZ18X 28/12/2017 - 20/07/2018 5,875 37 5,838 0.63 99.37 31.75 2,626 82,850,411.74
KTC KTCH19X 29/03/2018 - 20/07/2018 264 4 260 1.52 98.48 31.75 182 5,690,946.97
KTC KTCM19X 28/06/2018 - 20/07/2018 3 3 - 100 - 31.75 2 -
22,278 821 21,457 3.69 96.31 31.75 5,160 159,561,028.24
LH LHU18 28/09/2017 - 20/07/2018 196,323 1,037 195,286 0.53 99.47 11.5 1,387 15,866,247.68
LH LHZ18 28/12/2017 - 20/07/2018 116,142 42 116,100 0.04 99.96 11.5 200 2,299,168.26
LH LHH19 29/03/2018 - 20/07/2018 2 2 - 100 - 11.5 1 -
LH LHM19 28/06/2018 - 20/07/2018 4 4 - 100 - 11.5 4 -
312,471 1,085 311,386 0.35 99.65 11.5 1,592 18,165,415.94
LPN LPNU18 28/09/2017 - 20/07/2018 42,944 1,114 41,830 2.59 97.41 10.8 2,584 27,183,266.02
LPN LPNZ18 28/12/2017 - 20/07/2018 8,182 62 8,120 0.76 99.24 10.8 1,234 13,226,211.68
LPN LPNH19 29/03/2018 - 20/07/2018 4,862 62 4,800 1.28 98.72 10.8 262 2,793,517.07
LPN LPNM19 28/06/2018 - 20/07/2018 200 - 200 - 100 10.8 - -
56,188 1,238 54,950 2.2 97.8 10.8 4,080 43,202,994.78
MAJOR MAJORU18 28/09/2017 - 20/07/2018 4,260 260 4,000 6.1 93.9 26.25 285 7,024,647.89
MAJOR MAJORZ18 28/12/2017 - 20/07/2018 323 23 300 7.12 92.88 26.25 112 2,730,650.15
MAJOR MAJORH19 29/03/2018 - 20/07/2018 20 20 - 100 - 26.25 20 -
MAJOR MAJORM19 28/06/2018 - 20/07/2018 - - - - - 26.25 - -
4,603 303 4,300 6.58 93.42 26.25 417 9,755,298.04
MINT MINTU18 28/09/2017 - 20/07/2018 62,752 1,052 61,700 1.68 98.32 34.5 4,209 142,776,132.23
MINT MINTZ18 28/12/2017 - 20/07/2018 35,152 546 34,606 1.55 98.45 34.5 4,320 146,725,029.59
MINT MINTH19 29/03/2018 - 20/07/2018 14,295 115 14,180 0.8 99.2 34.5 7,148 244,622,111.23
MINT MINTM19 28/06/2018 - 20/07/2018 - - - - - 34.5 - -
112,199 1,713 110,486 1.53 98.47 34.5 15,677 534,123,273.05
Total KTB
Total KTC
Total LH
Total LPN
Total MAJOR
Total MINT
Stock Futures Block Trade Report
View By: Instrument Instrument Class:
As of date : 20/7/2018
Underlying Price (THB) OI (Contracts)
Total AOM Block Trade AOM Block Trade As of 20/07/2018 As of 20/07/2018
All
Underlying Series Period
Trading Volume (Contracts) % Trading Volume
Approximated Block Trade Value (THB)
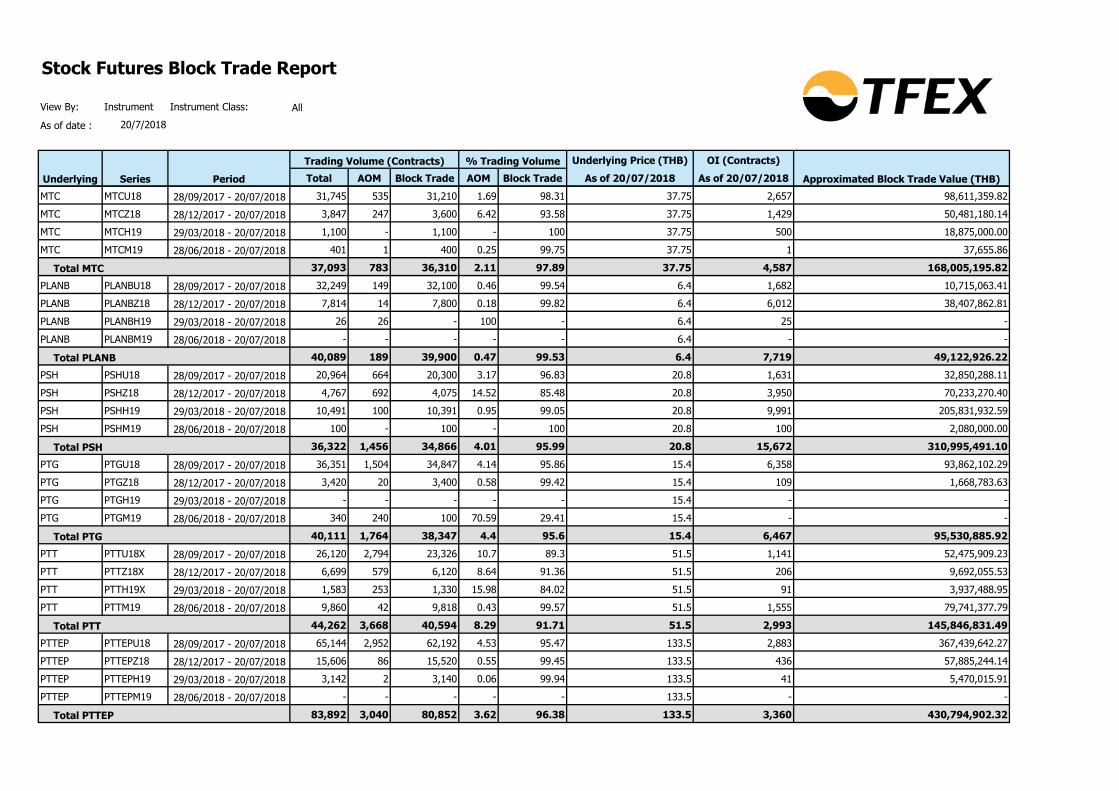
MTC MTCU18 28/09/2017 - 20/07/2018 31,745 535 31,210 1.69 98.31 37.75 2,657 98,611,359.82
MTC MTCZ18 28/12/2017 - 20/07/2018 3,847 247 3,600 6.42 93.58 37.75 1,429 50,481,180.14
MTC MTCH19 29/03/2018 - 20/07/2018 1,100 - 1,100 - 100 37.75 500 18,875,000.00
MTC MTCM19 28/06/2018 - 20/07/2018 401 1 400 0.25 99.75 37.75 1 37,655.86
37,093 783 36,310 2.11 97.89 37.75 4,587 168,005,195.82
PLANB PLANBU18 28/09/2017 - 20/07/2018 32,249 149 32,100 0.46 99.54 6.4 1,682 10,715,063.41
PLANB PLANBZ18 28/12/2017 - 20/07/2018 7,814 14 7,800 0.18 99.82 6.4 6,012 38,407,862.81
PLANB PLANBH19 29/03/2018 - 20/07/2018 26 26 - 100 - 6.4 25 -
PLANB PLANBM19 28/06/2018 - 20/07/2018 - - - - - 6.4 - -
40,089 189 39,900 0.47 99.53 6.4 7,719 49,122,926.22
PSH PSHU18 28/09/2017 - 20/07/2018 20,964 664 20,300 3.17 96.83 20.8 1,631 32,850,288.11
PSH PSHZ18 28/12/2017 - 20/07/2018 4,767 692 4,075 14.52 85.48 20.8 3,950 70,233,270.40
PSH PSHH19 29/03/2018 - 20/07/2018 10,491 100 10,391 0.95 99.05 20.8 9,991 205,831,932.59
PSH PSHM19 28/06/2018 - 20/07/2018 100 - 100 - 100 20.8 100 2,080,000.00
36,322 1,456 34,866 4.01 95.99 20.8 15,672 310,995,491.10
PTG PTGU18 28/09/2017 - 20/07/2018 36,351 1,504 34,847 4.14 95.86 15.4 6,358 93,862,102.29
PTG PTGZ18 28/12/2017 - 20/07/2018 3,420 20 3,400 0.58 99.42 15.4 109 1,668,783.63
PTG PTGH19 29/03/2018 - 20/07/2018 - - - - - 15.4 - -
PTG PTGM19 28/06/2018 - 20/07/2018 340 240 100 70.59 29.41 15.4 - -
40,111 1,764 38,347 4.4 95.6 15.4 6,467 95,530,885.92
PTT PTTU18X 28/09/2017 - 20/07/2018 26,120 2,794 23,326 10.7 89.3 51.5 1,141 52,475,909.23
PTT PTTZ18X 28/12/2017 - 20/07/2018 6,699 579 6,120 8.64 91.36 51.5 206 9,692,055.53
PTT PTTH19X 29/03/2018 - 20/07/2018 1,583 253 1,330 15.98 84.02 51.5 91 3,937,488.95
PTT PTTM19 28/06/2018 - 20/07/2018 9,860 42 9,818 0.43 99.57 51.5 1,555 79,741,377.79
44,262 3,668 40,594 8.29 91.71 51.5 2,993 145,846,831.49
PTTEP PTTEPU18 28/09/2017 - 20/07/2018 65,144 2,952 62,192 4.53 95.47 133.5 2,883 367,439,642.27
PTTEP PTTEPZ18 28/12/2017 - 20/07/2018 15,606 86 15,520 0.55 99.45 133.5 436 57,885,244.14
PTTEP PTTEPH19 29/03/2018 - 20/07/2018 3,142 2 3,140 0.06 99.94 133.5 41 5,470,015.91
PTTEP PTTEPM19 28/06/2018 - 20/07/2018 - - - - - 133.5 - -
83,892 3,040 80,852 3.62 96.38 133.5 3,360 430,794,902.32
Total MTC
Total PLANB
Total PSH
Total PTG
Total PTT
Total PTTEP

Stock Futures Block Trade Report
View By: Instrument Instrument Class:
As of date : 20/7/2018
Underlying Price (THB) OI (Contracts)
Total AOM Block Trade AOM Block Trade As of 20/07/2018 As of 20/07/2018
All
Underlying Series Period
Trading Volume (Contracts) % Trading Volume
Approximated Block Trade Value (THB)
PTTGC PTTGCU18 28/09/2017 - 20/07/2018 75,145 2,216 72,929 2.95 97.05 79.25 3,316 255,043,325.53
PTTGC PTTGCZ18 28/12/2017 - 20/07/2018 25,890 223 25,667 0.86 99.14 79.25 873 68,589,332.24
PTTGC PTTGCH19 29/03/2018 - 20/07/2018 1,845 55 1,790 2.98 97.02 79.25 535 41,134,830.62
PTTGC PTTGCM19 28/06/2018 - 20/07/2018 130 50 80 38.46 61.54 79.25 28 1,365,538.46
103,010 2,544 100,466 2.47 97.53 79.25 4,752 366,133,026.86
QH QHU18 28/09/2017 - 20/07/2018 352,476 4,154 348,322 1.18 98.82 3.32 14,235 46,703,229.11
QH QHZ18 28/12/2017 - 20/07/2018 93,236 2 93,234 0 100 3.32 8,851 29,384,689.66
QH QHH19 29/03/2018 - 20/07/2018 7,400 - 7,400 - 100 3.32 - -
QH QHM19 28/06/2018 - 20/07/2018 - - - - - 3.32 - -
453,112 4,156 448,956 0.92 99.08 3.32 23,086 76,087,918.77
RATCH RATCHU18 28/09/2017 - 20/07/2018 3,344 24 3,320 0.72 99.28 52 109 5,627,320.57
RATCH RATCHZ18 28/12/2017 - 20/07/2018 1,260 - 1,260 - 100 52 - -
RATCH RATCHH19 29/03/2018 - 20/07/2018 282 2 280 0.71 99.29 52 1 51,631.21
RATCH RATCHM19 28/06/2018 - 20/07/2018 - - - - - 52 - -
4,886 26 4,860 0.53 99.47 52 110 5,678,951.78
ROBINS ROBINSU18 28/09/2017 - 20/07/2018 4,097 27 4,070 0.66 99.34 59.5 335 19,801,141.08
ROBINS ROBINSZ18 28/12/2017 - 20/07/2018 754 4 750 0.53 99.47 59.5 153 9,055,205.57
ROBINS ROBINSH19 29/03/2018 - 20/07/2018 - - - - - 59.5 - -
ROBINS ROBINSM19 28/06/2018 - 20/07/2018 - - - - - 59.5 - -
4,851 31 4,820 0.64 99.36 59.5 488 28,856,346.65
S SU18 28/09/2017 - 20/07/2018 19,204 84 19,120 0.44 99.56 2.9 7,660 22,116,833.99
S SZ18 28/12/2017 - 20/07/2018 2,960 160 2,800 5.41 94.59 2.9 2,110 5,788,243.24
S SH19 29/03/2018 - 20/07/2018 1,380 280 1,100 20.29 79.71 2.9 1,380 3,190,000.00
S SM19 28/06/2018 - 20/07/2018 220 - 220 - 100 2.9 220 638,000.00
23,764 524 23,240 2.21 97.79 2.9 11,370 31,733,077.24
SAMART SAMARTU18 28/09/2017 - 20/07/2018 5,453 23 5,430 0.42 99.58 7.35 1,239 9,068,239.41
SAMART SAMARTZ18 28/12/2017 - 20/07/2018 1,553 73 1,480 4.7 95.3 7.35 1,099 7,697,953.64
SAMART SAMARTH19 29/03/2018 - 20/07/2018 1 1 - 100 - 7.35 1 -
SAMART SAMARTM19 28/06/2018 - 20/07/2018 - - - - - 7.35 - -
7,007 97 6,910 1.38 98.62 7.35 2,339 16,766,193.05
Total PTTGC
Total QH
Total RATCH
Total ROBINS
Total S
Total SAMART

Stock Futures Block Trade Report
View By: Instrument Instrument Class:
As of date : 20/7/2018
Underlying Price (THB) OI (Contracts)
Total AOM Block Trade AOM Block Trade As of 20/07/2018 As of 20/07/2018
All
Underlying Series Period
Trading Volume (Contracts) % Trading Volume
Approximated Block Trade Value (THB)
SAWAD SAWADU18X 28/09/2017 - 20/07/2018 47,147 1,191 45,956 2.53 97.47 35 8,651 295,136,222.03
SAWAD SAWADZ18X 28/12/2017 - 20/07/2018 15,608 508 15,100 3.25 96.75 35 1,225 41,479,529.73
SAWAD SAWADH19X 29/03/2018 - 20/07/2018 31,192 44 31,148 0.14 99.86 35 1,334 46,624,138.24
SAWAD SAWADM19 28/06/2018 - 20/07/2018 504 20 484 3.97 96.03 35 32 1,075,555.56
94,451 1,763 92,688 1.87 98.13 35 11,242 384,315,445.55
SCB SCBU18 28/09/2017 - 20/07/2018 31,765 1,135 30,630 3.57 96.43 132 2,133 271,495,680.15
SCB SCBZ18 28/12/2017 - 20/07/2018 3,638 246 3,392 6.76 93.24 132 221 27,199,401.87
SCB SCBH19 29/03/2018 - 20/07/2018 217 77 140 35.48 64.52 132 52 4,428,387.10
SCB SCBM19 28/06/2018 - 20/07/2018 6 6 - 100 - 132 3 -
35,626 1,464 34,162 4.11 95.89 132 2,409 303,123,469.12
SCC SCCU18 28/09/2017 - 20/07/2018 20,658 2,356 18,302 11.4 88.6 426 1,963 740,866,873.66
SCC SCCZ18 28/12/2017 - 20/07/2018 3,961 373 3,588 9.42 90.58 426 946 365,046,616.51
SCC SCCH19 29/03/2018 - 20/07/2018 676 116 560 17.16 82.84 426 56 19,762,366.86
SCC SCCM19 28/06/2018 - 20/07/2018 56 56 - 100 - 426 43 -
25,351 2,901 22,450 11.44 88.56 426 3,008 1,125,675,857.03
SIRI SIRIU18 28/09/2017 - 20/07/2018 471,700 14,310 457,390 3.03 96.97 1.62 241,298 379,043,912.22
SIRI SIRIZ18 28/12/2017 - 20/07/2018 321,977 777 321,200 0.24 99.76 1.62 190,771 308,303,218.01
SIRI SIRIH19 29/03/2018 - 20/07/2018 81,639 144 81,495 0.18 99.82 1.62 78,238 126,521,998.21
SIRI SIRIM19 28/06/2018 - 20/07/2018 2,000 - 2,000 - 100 1.62 2,000 3,240,000.00
877,316 15,231 862,085 1.74 98.26 1.62 512,307 817,109,128.45
SPALI SPALIU18 28/09/2017 - 20/07/2018 25,519 91 25,428 0.36 99.64 23.5 1,311 30,698,637.80
SPALI SPALIZ18 28/12/2017 - 20/07/2018 3,035 35 3,000 1.15 98.85 23.5 1,316 30,569,357.50
SPALI SPALIH19 29/03/2018 - 20/07/2018 2,002 2 2,000 0.1 99.9 23.5 1 23,476.52
SPALI SPALIM19 28/06/2018 - 20/07/2018 - - - - - 23.5 - -
30,556 128 30,428 0.42 99.58 23.5 2,628 61,291,471.82
SPCG SPCGU18 28/09/2017 - 20/07/2018 5,509 287 5,222 5.21 94.79 20.7 275 5,395,940.28
SPCG SPCGZ18 28/12/2017 - 20/07/2018 996 296 700 29.72 70.28 20.7 814 11,842,228.92
SPCG SPCGH19 29/03/2018 - 20/07/2018 22 22 - 100 - 20.7 22 -
SPCG SPCGM19 28/06/2018 - 20/07/2018 - - - - - 20.7 - -
6,527 605 5,922 9.27 90.73 20.7 1,111 17,238,169.20
Total SAWAD
Total SCB
Total SCC
Total SIRI
Total SPALI
Total SPCG

Stock Futures Block Trade Report
View By: Instrument Instrument Class:
As of date : 20/7/2018
Underlying Price (THB) OI (Contracts)
Total AOM Block Trade AOM Block Trade As of 20/07/2018 As of 20/07/2018
All
Underlying Series Period
Trading Volume (Contracts) % Trading Volume
Approximated Block Trade Value (THB)
STA STAU18 28/09/2017 - 20/07/2018 24,988 361 24,627 1.44 98.56 10.6 2,811 29,366,130.47
STA STAZ18 28/12/2017 - 20/07/2018 413 10 403 2.42 97.58 10.6 213 2,203,131.72
STA STAH19 29/03/2018 - 20/07/2018 - - - - - 10.6 - -
STA STAM19 28/06/2018 - 20/07/2018 - - - - - 10.6 - -
25,401 371 25,030 1.46 98.54 10.6 3,024 31,569,262.19
STEC STECU18 28/09/2017 - 20/07/2018 82,987 1,735 81,252 2.09 97.91 21 15,353 315,672,347.19
STEC STECZ18 28/12/2017 - 20/07/2018 5,906 246 5,660 4.17 95.83 21 1,181 23,767,974.94
STEC STECH19 29/03/2018 - 20/07/2018 865 465 400 53.76 46.24 21 210 2,039,306.36
STEC STECM19 28/06/2018 - 20/07/2018 1 1 - 100 - 21 1 -
89,759 2,447 87,312 2.73 97.27 21 16,745 341,479,628.49
STPI STPIU18 28/09/2017 - 20/07/2018 1,315 15 1,300 1.14 98.86 4.44 - -
STPI STPIZ18 28/12/2017 - 20/07/2018 - - - - - 4.44 - -
STPI STPIH19 29/03/2018 - 20/07/2018 400 - 400 - 100 4.44 200 888,000.00
STPI STPIM19 28/06/2018 - 20/07/2018 - - - - - 4.44 - -
1,715 15 1,700 0.87 99.13 4.44 200 888,000.00
TASCO TASCOU18 28/09/2017 - 20/07/2018 55,830 1,478 54,352 2.65 97.35 13.8 2,436 32,726,854.98
TASCO TASCOZ18 28/12/2017 - 20/07/2018 12,966 167 12,799 1.29 98.71 13.8 635 8,650,133.97
TASCO TASCOH19 29/03/2018 - 20/07/2018 812 512 300 63.05 36.95 13.8 202 1,029,901.48
TASCO TASCOM19 28/06/2018 - 20/07/2018 200 - 200 - 100 13.8 200 2,760,000.00
69,808 2,157 67,651 3.09 96.91 13.8 3,473 45,166,890.42
TCAP TCAPU18 28/09/2017 - 20/07/2018 12,545 245 12,300 1.95 98.05 49.75 5,805 283,158,599.04
TCAP TCAPZ18 28/12/2017 - 20/07/2018 16,466 16 16,450 0.1 99.9 49.75 10,159 504,919,143.23
TCAP TCAPH19 29/03/2018 - 20/07/2018 9,757 7 9,750 0.07 99.93 49.75 9,754 484,913,357.08
TCAP TCAPM19 28/06/2018 - 20/07/2018 422 2 420 0.47 99.53 49.75 422 20,895,000.00
39,190 270 38,920 0.69 99.31 49.75 26,140 1,293,886,099.35
THAI THAIU18 28/09/2017 - 20/07/2018 16,614 3,101 13,513 18.66 81.34 13.7 4,658 51,903,616.82
THAI THAIZ18 28/12/2017 - 20/07/2018 1,694 294 1,400 17.36 82.64 13.7 724 8,197,355.37
THAI THAIH19 29/03/2018 - 20/07/2018 1,153 253 900 21.94 78.06 13.7 1,132 12,105,429.31
THAI THAIM19 28/06/2018 - 20/07/2018 - - - - - 13.7 - -
19,461 3,648 15,813 18.75 81.25 13.7 6,514 72,206,401.50
Total STA
Total STEC
Total STPI
Total TASCO
Total TCAP
Total THAI

Stock Futures Block Trade Report
View By: Instrument Instrument Class:
As of date : 20/7/2018
Underlying Price (THB) OI (Contracts)
Total AOM Block Trade AOM Block Trade As of 20/07/2018 As of 20/07/2018
All
Underlying Series Period
Trading Volume (Contracts) % Trading Volume
Approximated Block Trade Value (THB)
THCOM THCOMU18 28/09/2017 - 20/07/2018 5,035 599 4,436 11.9 88.1 8.25 1,658 12,051,206.75
THCOM THCOMZ18 28/12/2017 - 20/07/2018 51 51 - 100 - 8.25 24 -
THCOM THCOMH19 29/03/2018 - 20/07/2018 20 20 - 100 - 8.25 20 -
THCOM THCOMM19 28/06/2018 - 20/07/2018 - - - - - 8.25 - -
5,106 670 4,436 13.12 86.88 8.25 1,702 12,051,206.75
TISCO TISCOU18 28/09/2017 - 20/07/2018 16,198 334 15,864 2.06 97.94 77 1,611 121,489,172.00
TISCO TISCOZ18 28/12/2017 - 20/07/2018 1,043 23 1,020 2.21 97.79 77 150 11,295,302.01
TISCO TISCOH19 29/03/2018 - 20/07/2018 118 38 80 32.2 67.8 77 13 678,644.07
TISCO TISCOM19 28/06/2018 - 20/07/2018 - - - - - 77 - -
17,359 395 16,964 2.28 97.72 77 1,774 133,463,118.08
TMB TMBU18 28/09/2017 - 20/07/2018 374,441 10,369 364,072 2.77 97.23 2.24 67,028 145,984,975.89
TMB TMBZ18 28/12/2017 - 20/07/2018 97,324 2,040 95,284 2.1 97.9 2.24 18,806 41,242,452.27
TMB TMBH19 29/03/2018 - 20/07/2018 14,473 3 14,470 0.02 99.98 2.24 4,751 10,640,034.05
TMB TMBM19 28/06/2018 - 20/07/2018 4,000 - 4,000 - 100 2.24 - -
490,238 12,412 477,826 2.53 97.47 2.24 90,585 197,867,462.21
TOP TOPU18 28/09/2017 - 20/07/2018 28,327 1,235 27,092 4.36 95.64 79.5 2,526 192,061,784.30
TOP TOPZ18 28/12/2017 - 20/07/2018 11,287 112 11,175 0.99 99.01 79.5 2,373 186,781,506.38
TOP TOPH19 29/03/2018 - 20/07/2018 4,195 63 4,132 1.5 98.5 79.5 747 58,494,640.76
TOP TOPM19 28/06/2018 - 20/07/2018 1 1 - 100 - 79.5 1 -
43,810 1,411 42,399 3.22 96.78 79.5 5,647 437,337,931.45
TPIPL TPIPLU18 28/09/2017 - 20/07/2018 121,534 7,992 113,542 6.58 93.42 1.87 31,653 55,298,739.54
TPIPL TPIPLZ18 28/12/2017 - 20/07/2018 3,039 839 2,200 27.61 72.39 1.87 814 1,101,940.11
TPIPL TPIPLH19 29/03/2018 - 20/07/2018 12,770 270 12,500 2.11 97.89 1.87 10,942 20,028,915.43
TPIPL TPIPLM19 28/06/2018 - 20/07/2018 1 1 - 100 - 1.87 1 -
137,344 9,102 128,242 6.63 93.37 1.87 43,410 76,429,595.08
TRUE TRUEU18 28/09/2017 - 20/07/2018 1,206,623 24,454 1,182,169 2.03 97.97 6.2 40,938 248,671,651.41
TRUE TRUEZ18 28/12/2017 - 20/07/2018 372,811 3,571 369,240 0.96 99.04 6.2 30,804 189,155,436.81
TRUE TRUEH19 29/03/2018 - 20/07/2018 180,327 127 180,200 0.07 99.93 6.2 21,596 133,800,900.81
TRUE TRUEM19 28/06/2018 - 20/07/2018 2,401 1 2,400 0.04 99.96 6.2 201 1,245,680.97
1,762,162 28,153 1,734,009 1.6 98.4 6.2 93,539 572,873,669.99
Total THCOM
Total TISCO
Total TMB
Total TOP
Total TPIPL
Total TRUE

Stock Futures Block Trade Report
View By: Instrument Instrument Class:
As of date : 20/7/2018
Underlying Price (THB) OI (Contracts)
Total AOM Block Trade AOM Block Trade As of 20/07/2018 As of 20/07/2018
All
Underlying Series Period
Trading Volume (Contracts) % Trading Volume
Approximated Block Trade Value (THB)
TTA TTAU18 28/09/2017 - 20/07/2018 10,433 1,603 8,830 15.36 84.64 7.15 1,977 11,963,664.00
TTA TTAZ18 28/12/2017 - 20/07/2018 4,458 2,958 1,500 66.35 33.65 7.15 529 1,272,661.51
TTA TTAH19 29/03/2018 - 20/07/2018 2,007 1,407 600 70.1 29.9 7.15 710 1,517,638.27
TTA TTAM19 28/06/2018 - 20/07/2018 - - - - - 7.15 - -
16,898 5,968 10,930 35.32 64.68 7.15 3,216 14,753,963.77
TTCL TTCLU18 28/09/2017 - 20/07/2018 15,799 55 15,744 0.35 99.65 8.05 3,812 30,579,772.80
TTCL TTCLZ18 28/12/2017 - 20/07/2018 256 56 200 21.88 78.13 8.05 247 1,553,398.44
TTCL TTCLH19 29/03/2018 - 20/07/2018 2 2 - 100 - 8.05 2 -
TTCL TTCLM19 28/06/2018 - 20/07/2018 - - - - - 8.05 - -
16,057 113 15,944 0.7 99.3 8.05 4,061 32,133,171.23
TTW TTWU18 28/09/2017 - 20/07/2018 9,273 173 9,100 1.87 98.13 12.5 4,668 57,261,404.08
TTW TTWZ18 28/12/2017 - 20/07/2018 19,019 19 19,000 0.1 99.9 12.5 4,218 52,672,327.67
TTW TTWH19 29/03/2018 - 20/07/2018 1,000 - 1,000 - 100 12.5 1,000 12,500,000.00
TTW TTWM19 28/06/2018 - 20/07/2018 - - - - - 12.5 - -
29,292 192 29,100 0.66 99.34 12.5 9,886 122,433,731.75
TU TUU18 28/09/2017 - 20/07/2018 28,894 580 28,314 2.01 97.99 16.1 2,350 37,075,523.98
TU TUZ18 28/12/2017 - 20/07/2018 3,455 115 3,340 3.33 96.67 16.1 154 2,396,872.94
TU TUH19 29/03/2018 - 20/07/2018 52 52 - 100 - 16.1 52 -
TU TUM19 28/06/2018 - 20/07/2018 1 1 - 100 - 16.1 1 -
32,402 748 31,654 2.31 97.69 16.1 2,557 39,472,396.92
TVO TVOU18 28/09/2017 - 20/07/2018 4,934 131 4,803 2.66 97.34 28.75 532 14,888,910.62
TVO TVOZ18 28/12/2017 - 20/07/2018 - - - - - 28.75 - -
TVO TVOH19 29/03/2018 - 20/07/2018 6 6 - 100 - 28.75 6 -
TVO TVOM19 28/06/2018 - 20/07/2018 - - - - - 28.75 - -
4,940 137 4,803 2.77 97.23 28.75 538 14,888,910.62
UNIQ UNIQU18 28/09/2017 - 20/07/2018 32,835 335 32,500 1.02 98.98 12.7 3,586 45,077,554.44
UNIQ UNIQZ18 28/12/2017 - 20/07/2018 2,376 76 2,300 3.2 96.8 12.7 555 6,823,042.93
UNIQ UNIQH19 29/03/2018 - 20/07/2018 501 1 500 0.2 99.8 12.7 101 1,280,139.72
UNIQ UNIQM19 28/06/2018 - 20/07/2018 1 1 - 100 - 12.7 1 -
35,713 413 35,300 1.16 98.84 12.7 4,243 53,180,737.09
Total TTA
Total TTCL
Total TTW
Total TU
Total TVO
Total UNIQ

Stock Futures Block Trade Report
View By: Instrument Instrument Class:
As of date : 20/7/2018
Underlying Price (THB) OI (Contracts)
Total AOM Block Trade AOM Block Trade As of 20/07/2018 As of 20/07/2018
All
Underlying Series Period
Trading Volume (Contracts) % Trading Volume
Approximated Block Trade Value (THB)
VGI VGIU18 28/09/2017 - 20/07/2018 48,556 1,296 47,260 2.67 97.33 7.15 5,727 39,855,112.51
VGI VGIZ18 28/12/2017 - 20/07/2018 11,515 165 11,350 1.43 98.57 7.15 2,682 18,901,520.19
VGI VGIH19 29/03/2018 - 20/07/2018 205 5 200 2.44 97.56 7.15 5 34,878.05
VGI VGIM19 28/06/2018 - 20/07/2018 8 8 - 100 - 7.15 6 -
60,284 1,474 58,810 2.45 97.55 7.15 8,420 58,791,510.75
VNG VNGU18 28/09/2017 - 20/07/2018 3,342 42 3,300 1.26 98.74 8.05 1,840 14,625,852.78
VNG VNGZ18 28/12/2017 - 20/07/2018 2,852 9 2,843 0.32 99.68 8.05 2,850 22,870,100.81
VNG VNGH19 29/03/2018 - 20/07/2018 - - - - - 8.05 - -
VNG VNGM19 28/06/2018 - 20/07/2018 - - - - - 8.05 - -
6,194 51 6,143 0.82 99.18 8.05 4,690 37,495,953.59
WHA WHAU18 28/09/2017 - 20/07/2018 617,400 7,768 609,632 1.26 98.74 4.08 19,402 78,164,183.12
WHA WHAZ18 28/12/2017 - 20/07/2018 70,426 726 69,700 1.03 98.97 4.08 5,227 21,106,315.17
WHA WHAH19 29/03/2018 - 20/07/2018 5,075 35 5,040 0.69 99.31 4.08 1,353 5,482,169.38
WHA WHAM19 28/06/2018 - 20/07/2018 2 2 - 100 - 4.08 2 -
692,903 8,531 684,372 1.23 98.77 4.08 25,984 104,752,667.67
Block Trade value is an estimate only. A standard contract size of 1,000 shares is used for calculations.
Total VGI
Total VNG
Total WHA
Disclaimer This contents are created and provided for informative and education purposes only. TFEX does not make any representations regarding the completeness, accuracy or reliability of the contents. TFEX
does not make any representations and hereby disclaims with respect to this content.