stock markets banks, analysis of a panel data set for and ... · stock markets banks, analysis of a...
TRANSCRIPT

wps 2410
POLICY RESEARCH WORKING PAPER 2670
Stock Markets Banks, Analysis of a panel data set for1976-98 shows that on
and Growth balance stock markets and
banks positively influence
Correlation or Causality? economic growth-Findingsthat do not result from biases
induced by simultaneity,
Thorsten Beck omitted variables, or
Ross Levine unobserved country-specific
effects.
The World Bank
Development Research Group
Finance HSeptember 2001
Pub
lic D
iscl
osur
e A
utho
rized
Pub
lic D
iscl
osur
e A
utho
rized
Pub
lic D
iscl
osur
e A
utho
rized
Pub
lic D
iscl
osur
e A
utho
rized
Pub
lic D
iscl
osur
e A
utho
rized
Pub
lic D
iscl
osur
e A
utho
rized
Pub
lic D
iscl
osur
e A
utho
rized
Pub
lic D
iscl
osur
e A
utho
rized

| POLICY RESEARCH WORKING PAPER 2670
Summary findingsBeck and Levine investigate the impact of stock markets differences that emerge from different panel procedures.and banks on economic growth using a panel data set for On balance, stock markets and banks positively influence1976-98 and applying recent generalized method of economic growth-and these findings are not a result ofmoments (GMM) techniques developed for dynamic biases induced by simultaneity, omitted variables, orpanels. The authors illustrate econometrically the unobserved country-specific effects.
This paper-a product of Finance, Development Research Group-is part of a larger effort in the group to understand thelinks between the financial system and economic growth. Copies of the paper are available free from the World Bank, 1818H Street NW, Washington, DC 20433. Please contactAgnesYaptenco, room MC3-446, telephone 202-473-1823, fax 202-522-1155, email address [email protected]. Policy Research Working Papers are also posted on the Web at http://econ.worldbank.org. The authors may be contacted at [email protected] or [email protected]. September2001. (23 pages)
The Policy Research Working Paper Series disseminates the findings of work in progress to encourage the exchange of ideas aboutdevelopment issues. An objective of the series is to get the findings out quickly, even if the presentations are less than fully polished. The
papers carry the names of the authors and should be cited accordingly. The findings, interpretations, and conclusions expressed in thispaper are entirely those of the authors. They do not necessarily represent the view of the World Bank, its Executive Directors, or thecountries they represent.
Produced by the Policy Research Dissemination Center

Stock Markets, Banks, and Growth:Correlation or Causality
Thorsten Beck and Ross Levine
JEL Classification: GOO; 016; F 36
Keywords: Economic Growth; Stock Markets; Banks
Beck: World Bank; Levine: Carlson School of Management, University of Minnesota. We thankNorman Loayza for very helpful comments.


1. Introduction
Do well-functioning stock markets and banks boost economic growth? Theory provides
conflicting predictions about both the impact of overall financial development on growth and about
the separate effects of stock markets on growth and banks on economic growth. Many models
emphasize that well-functioning financial intermediaries and markets ameliorate information and
transactions costs and thereby foster efficient resource allocation and hence faster long-run growth
[Bencivenga and Smith, 1991; Bencivenga, Smith, and Starr, 1995; King and Levine, 1993a]. These
models, however, also show that financial development can hurt growth. Specifically, financial
development, by enhancing resource allocation and hence the retums to saving, may lower saving
rates. If there are sufficiently large externalities associated with saving and investment, then financial
development slows long-run growth. Theory also provides conflicting predictions about whether
stock markets and banks are substitutes, compliments, or whether one is more conducive to growth
than the other. For instance, Boyd and Prescott (1986) model the critical role that banks play in
easing information frictions and therefore in improving resource allocation, while Stiglitz (1985) and
Bhide (1993) stress that stock markets will not produce the same improvement in resource allocation
and corporate governance as banks. On the other hand, some models emphasize that markets
mitigate the inefficient monopoly power exercised by banks and stress that the competitive nature of
markets encourages innovative, growth-enhancing activities as opposed to the excessively
conservative approach taken by banks [Allen and Gale, 2000]. Finally, some theories stress that it is
not banks or markets, it is banks and markets; these different components of the financial system
ameliorate different information and transaction costs. l
See, Levine (1997), Boyd and Smith (1998), Huybens and Smith (1999) and Demirguc-Kunt and Levine (2001).
1

This paper rigorously explores the interactions between stock markets, banks and economic
growth. Specifically, using a panel dataset for 40 countries over the period 1976-98 we examine (i)
whether financial development has a positive impact on economic growth, and (ii) whether banks and
stock markets each have an independent impact on economic growth. We use new panel econometric
techniques that reduce statistical shortcomings with existing growth studies. Furthermore, we apply
these techniques to assess the independent impact of both stock markets and banks on growth, while
most existing studies focus only on the bank-growth relationship.
Although a burgeoning empirical literature suggests that well-functioning banks accelerate
economic growth, these studies generally do not simultaneously examine stock market development.
More specifically, King and Levine (1 993 a,b) show that bank development helps explain economic
growth, while Levine (1998, 1999) and Levine, Loayza, and Beck (2000) show that the positive
relationship between bank development and growth is not due to simultaneity bias. These studies
generally include over 80 countries. They omit measures of stock market development because
measures of stock market development for a twenty-year period are only available for about 40
countries. Omitting stock market development makes it difficult to assess whether (a) the positive
relationship between bank development and growth holds when controlling for stock market
development, (b) banks and markets each have an independent impact on economic growth, or (c)
overall financial development matters for growth but it is difficult to identify the separate impact of
stock markets and banks on economic success.
Existing empirical assessments of stock markets, banks, and economic growth suffer from an
assortment of econometric weaknesses. Levine and Zervos (1998) find that initial measures of stock
market liquidity and banking sector development are both strong predictors of economic growth over
the next 18 years. This approach, however, does not account formally for potential simultaneity bias,
2

nor does it control explicitly for country fixed effects.2 Arestis, Demetriades and Luintel (2000) use
quarterly data and apply time series methods to five developed economies and show that while both
banking sector and stock market development explain subsequent growth, the effect of banking sector
development is substantially larger than that of stock market development. The sample size,
however, is very limited and it is not clear whether the use of quarterly data and Johansen's (1988)
vector error correction model fully abstracts from high frequency factors influencing the stock
market, bank, and growth relationship. Rousseau and Wachtel (2000) make an important
contribution to the literature by using panel techniques with annual data to assess the relationship
between stock markets, banks, and growth. They use the difference panel estimator -- developed by
Arellano and Bond (1991) and Holtz-Eakin, Newey, and Rosen (1990) -- that (a) differences the
growth regression equation to remove any omitted variable bias created by unobserved country-
specific effects, and then (b) instruments the right-hand-side variables (the differenced values of the
original regressors) using lagged values of the original regressors to eliminate potential parameter
inconsistency arising from simultaneity bias. Rousseau and Wachtel (2000) show that both banking
sector and stock market development explain subsequent growth, even after controlling for reverse
causality. The use of annual data does not, however, abstract from business cycle phenomena.
Furthermore, Alonso-Borrego and Arellano (1996) show that the instruments in the difference panel
estimator are frequently weak, which induces biases in finite samples and poor precision
asymptotically. Blundell and Bond (1998) show that a system panel estimator that simultaneously
uses both the difference panel data and the data from the original levels specification produces
dramatic increases in both consistency and efficiency.
2 See Harris (1997) and Levine (2001) for cross-country studies of stock markets and economic growth using instrumentalvariables. Also, see Atje and Jovanovic (1993).
3

This paper improves upon past econometric methods used to examine stock markets, banks,
and long-run growth and thereby permits us to (a) shed additional evidence on the relationship
between overall financial development and growth and (b) rigorously assess the independent impact
of both stock markets and banks on economic growth.3 Methodologically, we (1) construct a panel
with data averaged over five-year intervals from 1976 to 1998 to abstract from business cycle
relationships and (2) employ the system panel estimator developed by Arrellano and Bover (1995) to
improve upon the differenced panel estimator used by Wachtel and Rousseau (2000).4 We also use
different variants of the system panel estimator. As discussed in Arellano and Bond (1998), the one-
step system estimator assumes homoskedastic errors, while the two-step estimator uses the first-step
errors to construct heteroskedasticity-consistent standard errors (e.g., White, 1982). Due to the large
number of instruments that are employed in the system estimator, however, the asymptotic standard
errors from the two-step panel estimator may be a poor guide for hypothesis testing in small samples
where over-fitting becomes a problem. This is not a problem in the one-step estimator.
Consequently, we use the one-step panel estimator, the two-step estimator, and a novel, alternative
procedure developed by Calderon, Chong and Loayza (2000). This alternative system estimator
reduces the dimensionality of the instruments to avoid the over-fitting problem but still permits the
construction of heteroskedasticity consistent standard errors. The shortcoming of this alternative
procedure is that we lose a period from the sample.
3This paper also improves on previous efforts by constructing the data on stock market and bank development morecarefully. Indicators of financial development are frequently measured at the end of the period. These financialdevelopment indicators, however, are frequently divided by the Gross Domestic Product, which is measured over theperiod. Traditionally, researchers have not carefully addressed the bias that is introduced when taking the ratio of a stockvariable measured at the end of a period and a flow variable measured over a period. This bias might be especially strongin high-inflation countries. Following Levine, Loayza, and Beck (2000) and Beck, Demirguc-Kunt and Levine (2000), wedeflate the stock variables by end-of-period deflators and the flow variables by a deflator for the whole period. Then wetake the average of the real stock variable in period t and period t-l and relate it to the real flow variable for period t.4 Note, we use only three observations in the last period.
4

Thus, besides assessing the impact of stock markets and banks on economic growth, this
paper contributes to the literature on panel estimation procedures. While Arellano and Bond (199 1)
and Blundell and Bond (1998) note the potential biases associated with standard errors emerging
from the two-step estimator in small samples and while they recognize that these potential biases
must be balanced against advantages of using heteroskedasticity-consistent standard errors, this paper
exemplifies the differences that emerge from these two procedures. Moreover, we use Calderon,
Chong, and Loayza (2000)'s modification that limits the over-fitting problem and thereby reduces
potential biases associated with the two-step estimator. We provide evidence using all three
approaches. The results suggest that it is indeed important to use all three estimates in drawing
economic inferences.
This paper finds that markets and banks are important for economic growth. Bank and stock
market development always enter jointly significant, regardless of the panel methodology or the
conditioning information set that we employ. These findings are strongly consistent with models that
predict that well-functioning financial systems ease information and transaction costs and thereby
enhance resource allocation and economic growth. Further, the measure of stock market
development and the measure of bank development frequently both enter the growth regression
significantly after controlling for other growth determinants, country specific effects, and potential
simultaneity bias. This suggests that both banks and markets are important for growth. This
conclusion, however, must be qualified. The two-step indicator always indicates that both stock
markets and banks independently boost growth. There are, however, a few combinations of control
variables -- government size, inflation, trade openness and the black market premium - when using
the one-step and alternative panel estimators in which only bank development or stock market
liquidity enters with a p-value below 0.05. While we read the bulk of the results as suggesting that
5

both markets and banks independently spur economic growth, the fact that the results are not fully
consistent across all econometric methods and specifications may lead some to conclude that overall
financial development matters for growth but it is difficult to identify the specific components of the
financial system most closely associated with economic success.
The remainder of the paper is organized as follows. Section 2 presents the data. Section 3
introduces the econometric methodology. Section 4 presents the main results and section 5 concludes.
2. The Data
We analyze the link between stock market and bank development and economic growth in a
panel of 40 countries and 146 observations. Data are averaged over five 5-year periods between 1976
and 1998.5 Moving to a panel from pure cross-sectional data allows us to exploit the time-series
dimension of the data and deal rigorously with simultaneity. The theories we are evaluating focus on
the long-run relationships between stock markets, banks, and economic growth. Thus, we use five-
year averages rather than annual (or quarterly) data to focus on longer-run (as opposed to higher
frequency) relationships. This section describes the indicators of stock market and bank
development, the conditioning information set and presents descriptive statistics.
To measure stock market development we use the Turnover Ratio measure of market
liquidity, which equals the value of the trades of shares on domestic exchanges divided by total value
of listed shares. It indicates the trading volume of the stock market relative to its size. Some models
predict countries with illiquid markets will create disincentives to long-run investments because it is
comparatively difficult to sell ones stake in the firm. In contrast, more liquid stock markets reduce
disincentives to long-run investment, since liquid markets provide a ready exit-option for investors.
6

This can foster more efficient resource allocation and faster growth [Levine, 1991; Bencivenga,
Smith, and Starr, 1995].6
To measure bank development, we use Bank Credit, which equals bank claims on the private
sector by deposit money banks divided by GDP. This measure isolates loans given by deposit money
banks to the private sector. It excludes loans issued to governments and public enterprises. This
indicator of bank development does not directly measure the degree to which banks ease information
and transaction costs. Unlike many studies of finance and growth that use the ratio of broad money
to GDP as an empirical proxy of financial development, however, the Bank Credit variable isolates
bank credit to the private sector and therefore excludes credits by development banks and loans to the
government and public enterprises. Thus, while problematic, the Bank Credit measure improves
upon altemative measures of bank development that are available for a broad cross-section of
countries.7
To assess the strength of the independent link between both stock markets and growth and
bank development and economic growth, we control for other potential determinants of economic
growth in our regressions. In the simple conditioning information set we include the initial real GDP
per capita to control for convergence and the average years of schooling to control for human capital
accumulation. In the policy conditioning information set, we use the simple conditioning information
s Thus, the first period covers the years 1976-1980, the second period covers the years 1981-1985, and so on. The lastperiod only comprises the years 1996-98. Financial data are from Beck, Demirguc-Kunt and Levine (2000).
We experimented with other measures. Value Traded equals the value of the trades of domestic shares on domesticexchanges divided by GDP. Value Traded has two potential pitfalls. First, it does not measure the liquidity of themarket. It measures trading relative to the size of the economy. Second, since markets are forward looking, they willanticipate higher economic growth by higher share prices. Since Value Traded is the product of quantity and price, thisindicator can rise without an increase in the number of transactions. Turnover Ratio does not suffer from this shortcomingsince both numerator and denominator contain the price. We also considered Market Capitalization, which equals thevalue of listed shares divided by GDP. Its main shortcoming is that theory does not suggest the mere listing of shares willinfluence resource allocation and growth. Levine and Zervos (1998) show that Market Capitalization is not a goodpredictor of economic growth. Our results confirm this finding. These results are available on request.
This is the same indicator of bank development used by Levine and Zervos (1998).
7

set plus either (i) the black market premium, (ii) the share of exports and imports to GDP, (iii) the
inflation rate or (iv) the ratio of government expenditures to GDP.
Table 1 presents descriptive statistics and correlations. There is a wide variation of bank and
stock market development across the sample. While Taiwan had a Turnover Ratio of 340% of GDP
in 1986-90, Bangladesh had a Turnover Ratio of only 1.3% in 1986-90. While Taiwan's banks lent
124% of GDP to the private sector in 1991-1995, Peru's financial intermediaries lent only 4% during
1981-85. We note that while Economic Growth is correlated significantly with the Turnover Ratio, it
is not significantly correlated with Bank Credit. Turnover is significantly correlated with bank
development.
3. The Methodology
While Levine and Zervos (1998) show that stock market development and banking sector
development are robust predictors of growth, their results do not imply a causal link between the
financial sector and economic growth. To control for possible simultaneity, they use initial values of
stock market and bank development. Using initial values of the explanatory variables, however,
implies not only an efficiency (informnational) loss but also a potential consistency loss. If the
contemporaneous behavior of the explanatory variables matters for current growth, we run the risk of
grossly mis-measuring the "true" explanatory variables by using initial values, which could bias the
coefficient estimates. Using proper instruments for the contemporaneous values of the explanatory
variables is therefore preferable to using initial values.
To assess the relationship between stock market development, bank development and
economic growth in a panel, we use the Generalized-Method-of Moments (GMM) estimators
developed for dynamic panel models by Holtz-Eakin, Newey and Rosen (1990), Arrellano and Bond
8

(1991) and Arrellano and Bover (1995). We can write the traditional cross-country growth regression
as follows.
Yi,,- = -. ,,-I + #,X,, + ji + (1)
where y is the logarithm of real per capita GDP, Xrepresents the set of explanatory variables, other
than lagged per capita GDP and including our indicators of stock market and bank development, z7 is
an unobserved country-specific effect, £ is the error term, and the subscripts i and t represent country
and time period, respectively. We also include time dummies to account for time-specific effects.
Arrellano and Bond (1991) propose to difference equation (1):
(Yi, - Yi,-.) - (YO,1 - YO-2) = (Y,,-, -Yi,-2)+ 6'(Xi,, - Xi,,- ) + (i, - ei,_) (2)
While differencing eliminates the country-specific effect, it introduces a new bias; by construction
the new error term, £ijt - ei,t- I is correlated with the lagged dependent variable, Yijt-l - Yijt-2-
Under the assumptions that (a) the error term, e, is not serially correlated, and (b) the explanatory
variables, X, are weakly exogenous (i.e., the explanatory variables are assumed to be uncorrelated
with future realizations of the error term), Arrellano and Bond propose the following moment
conditions.
E[yi , 5 (Ej,, -e',,)] = 0 for s 2 2; t =3,..., T (3)
E[XS (£j,, - e,,t)] = 0 for s > 2; t 3,..., T (4)
Using these moment conditions, Arellano and Bond (1991) propose a two-step GMM estimator. In
the first step the error terms are assumed to be independent and homoskedastic across countries and
over time. In the second step, the residuals obtained in the first step are used to construct a consistent
estimate of the variance-covariance matrix, thus relaxing the assumptions of independence and
homoskedasticity. The two-step estimator is thus asymptotically more efficient relative to the first-
9

step estimator. We refer to the GMM estimator based on these conditions as the difference estimator.
This is the estimator that Rousseau and Wachtel (2000) use with annual data to examine the
relationship between stock markets, banks, and economic growth.
There are, however, conceptual and statistical shortcomings with this difference estimator.
Conceptually, we would also like to study the cross-country relationship between financial sector
development and economic growth, which is eliminated in the difference estimator. Statistically,
Alonso-Borrego and Arellano (1996) and Blundell and Bond (1998) show that in the case of
persistent explanatory variables, lagged levels of these variables are weak instruments for the
regression equation in differences. This influences the asymptotic and small-sample performance of
the difference estimator. Asymptotically, the variance of the coefficients rises. In small samples,
Monte Carlo experiments show that the weakness of the instruments can produce biased coefficients.
Finally, differencing may exacerbate the bias due to measurement errors in variables by decreasing
the signal-to-noise ratio (see Griliches and Hausman, 1986).
To reduce the potential biases and imprecision associated with the difference estimator, we
use an estimator that combines in a system the regression in differences with the regression in levels
[Arellano and Bover, 1995 and Blundell and Bond, 1998]. The instruments for the regression in
differences are the same as above. The instruments for the regression in levels are the lagged
differences of the corresponding variables. These are appropriate instruments under the following
additional assumption: although there may be correlation between the levels of the right-hand side
variables and the country-specific effect in equation (1), there is no correlation between the
differences of these variables and the country-specific effect. Given that lagged levels are used as
instruments in the regression in differences, only the most recent difference is used as an instrument
in the regression in levels. Using additional lagged differences would result in redundant moment
10

conditions (Arellano and Bover, 1995). Thus, additional moment conditions for the second part of
the system (the regression in levels) are:
E[(yi,t- -Yi,t-s-1) . (7i + ei,)] = 0 fors= 1 (5)
E[(Xit-s- Xi,t-s-1) -(7i+ei,t)] = 0 fors=l (6)
Thus, we use the moment conditions presented in equations (3) - (6) and employ the system panel
estimator to generate consistent and efficient parameter estimates.
The consistency of the GMM estimator depends on the validity of the assumption that the
error terms do not exhibit serial correlation and on the validity of the instruments. To address these
issues we use two specification tests suggested by Arellano and Bond (1991), Arellano and Bover
(1995), and Blundell and Bond (1998). The first is a Sargan test of over-identifying restrictions,
which tests the overall validity of the instruments by analyzing the sample analog of the moment
conditions used in the estimation process. The second test examines the hypothesis that the error
term ei,t is not serially correlated. We test whether the differenced error term is second-order
serially correlated (by construction, the differenced error term is probably first-order serially
correlated even if the original error term is not). Failure to reject the null hypotheses of both tests
gives support to our model.
Both the difference and the system estimator present certain problems when applied to
samples with a small number of cross-sectional units. As shown by Arrellano and Bond (1991) and
Blundell and Bond (1998), the asymptotic standard errors for the two-step estimators are biased
downwards. The one-step estimator, however, is asymptotically inefficient relative to the two-step
estimator, even in the case of homoskedastic error terms. Thus, while the coefficient estimates of the
two-step estimator are asymptotically more efficient, the asymptotic inference from the one-step
standard errors might be more reliable. This problem is exacerbated when the number of instruments
11

is equal to or larger than the number of cross-sectional units. This biases both the standard errors and
the Sargan test downwards and might result in biased asymptotic inference.
We address this problem threefold. First, we consider the first-stage results. While the
coefficient estimates are less efficient, the asymptotic standard errors are unbiased. Second, we
include a limited number of control variables at a time. Specifically, for the policy conditioning
information set, we only include one additional policy variable at the time, rather than including them
all at once, as in the usual cross-country growth regressions. This reduces the number of instruments
to less than the number of cross-sectional observations. By keeping the instrument set small, we
minimize the over-fitting problem and maximize the confidence that one has in the more efficient
two-step system estimator.
Third, we use an alternative specification of the instruments employed in the two-step system
estimator. Typically, users of the difference and system estimator treat the moment conditions as
applying to a particular time period. This provides for a more flexible variance-covariance structure
of the moment conditions (Ahn and Schmidt, 1995) because the variance for a given moment
condition is not assumed to be the same across time. This approach has the drawback that the
number of overidentifying conditions increases dramatically as the number of time periods increases.
Consequently, this typical two-step estimator tends to induce over-fitting and potentially biased
standard errors. To limit the number of overidentifying conditions, we follow Calderon, Chong and
Loayza (2000) and apply each moment condition to all available periods. This reduces the over-
fitting bias of the two-step estimator. However, applying this modified estimator reduces the number
of periods in our sample by one. While in the standard DPD estimator time dummies and the
constant are used as instruments for the second period, this modified estimator does not allow the use
of the first and second period. While losing a period, the Calderon, Chong, and Loayza (2000)
12

specification reduces the over-fitting bias and therefore permits the use of a heteroskedasticity-
consistent system estimator.
4. The Results
The results in Table 2 show that (i) the development of stock markets and of banks have both
a statistically and economically large positive impact on economic growth, and (ii) these results are
not due to simultaneity bias, omitted variables or country-specific effects. The p-values in
parentheses are from the two-step estimator. The stars in Table 2 indicate the significance of the
coefficients on the stock market and bank variables based on the one-step standard errors. Thus,
Table 2 indicates the significance of stock market and bank development for both the two-step and
one-step estimators.8
The Turnover Ratio and Bank Credit both enter significantly (at the one-percent level) and
positively in all five regressions using the two-step estimator. The one-step estimator, however,
indicates that Bank Credit does not always enter with a p-value below 0.10. Specifically, Bank Credit
does not enter significantly when controlling for either trade openness or inflation.9 However, even
with the one-step estimator, the financial indicators always enter jointly significantly. Our
specification tests indicate that we cannot reject the null-hypothesis of no second-order serial
correlation in the differenced error-term and that our instruments are adequate.
The two-step results in Table 2 are not only statistically, but also economically significant. If
Mexico's Turnover Ratio had been at the average of the OECD countries (68%) instead of the actual
36% during the period 1996-98, it would have grown 0.6 percentage points faster per year. Similarly,
8 None of the other explanatory variables enters significantly in the first-step regressions.9 These results are consistent with the findings by Boyd, Levine, and Smith (2000) that inflation exerts a negative impacton financial development.
13

if its Bank Credit had been at the average of all OECD countries (71 %) instead of the actual 16%, it
would have grown 0.8 percentage points faster per year.'0 These results suggest that both bank and
stock market development have an economically large impact on economic growth.
Since the one-step and two-step estimators provide different conclusions on the independent
impact of banks on economic growth, we examine the Calderon, Chong, and Loayza (2000) method
for reducing the over-fitting problem of the two-step estimator in order to obtain heteroskedasticity-
consistent standard errors. Unlike in Table 2 we only report the significance levels of the two-step
estimator in Table 3 because we do not have an over-fitting problem.
Stock market liquidity and bank development each enter the growth regressions significantly
in Table 3, except when controlling for trade openness. In the regression controlling for trade
openness, Bank Credit enters with a p-value below 0.05, but Turnover is insignificant. Even in this
regression, however, they enter jointly significantly. Both bank development and stock market
development, however, enter individually significantly in the other four regressions. Overall, these
results suggest an independent link between growth and both stock market liquidity (Turnover) and
bank development (Bank Credit). The Calderon, Chong and Loayza (2000) adjustment to the
standard two-step system estimator produces both consistent standard errors and heteroskedasticity
consistent standard errors in the Table 3 results. It does this at the cost of reducing the size the
instrumental variable matrix. Since the regressions in Table 3 pass the Sargan and serial correlation
tests, this adjusted two-step system estimator seems to offer a particularly useful assessment of the
stock market, bank and growth relationship.
° We calculate this by taking the lowest coefficients across the five columns, 0.958 in the case of Turnover Ratio and0.538 in the case of Bank Credit.
14

5. Conclusions
In sum, the results strongly reject the notion that overall financial development is unimportant
or harmful for economic growth. Using three alternative panel specifications, the data reject the
hypothesis that financial development is unrelated to growth. Stock market development and bank
development jointly enter all of the growth regressions significantly using alternative conditioning
information sets and alternative panel estimators. Thus, after controlling for country-specific effects
and potential endogeneity, the data are consistent with theories that emphasize an important positive
role for financial development in the process of economic growth.
This paper also assessed the independent impact of both stock market development and bank
development on economic growth. In general, we find across different estimation procedures and
across different control variables that both stock markets and banks enter the growth regression
significantly. For instance, with the traditional two-step system estimator, both stock market liquidity
and bank development each enter the growth regressions significantly regardless of the control
variables. Similarly, with the Calderon, Chong, and Loayza (2000) two-step alternative estimator
that reduces the over-fitting problem of the two-step estimator but obtains heteroskedasticity-
consistent standard errors, we find that both stock market liquidity and bank development enter all of
the growth regressions significantly except for one. These findings suggest that stock markets
provide different financial services from banks, or else mulitcollinearity would produce jointly
significant results but would not produce results where both enter the growth regression significantly.
However, the one-step system estimator provides a more cautious assessment. In two out of the five
specifications, only one financial development indicator enters individually significantly. While we
interpret the bulk of the results as suggesting that both markets and banks independently spur
economic growth, the one-step results may lead some readers to conclude that overall financial
15

development matters for growth but it is difficult to identify the specific financial institutions
associated with economic success.
Econometrically, this paper's findings suggest that it is important to use altemative
specifications of the system panel estimator in drawing inferences. The two-step estimator produces
heteroskedasticity-consistent standard errors, but may produce standard errors that are biased
downwards in small samples. The one-step estimator produces consistent standard errors, but does
not yield heteroskedasticity-consistent standard errors, which is important in economic growth
regressions. The Calderon, Chong and Loayza (2000) adjustment to the standard two-step system
estimator produces both consistent standard errors and heteroskedasticity consistent standard errors,
but it does this by reducing the information content of the instrumental variable matrix. In small
samples, this adjusted measure seems to offer a reasonable compromise, especially if the system
passes the Sargan- and serial correlation tests.
16

REFERENCES
Ahn, Seung and Schmidt, Peter. "Efficient Estimation of Models for Dynamic Panel Data," Journalof Econometrics, 1995, 68, pp. 5-27.
Allen, Franklin and Gale, Douglas. Comparing Financial Systems. Cambridge, MA: MIT Press,2000.
Alonso-Borrego, C. and Arellano, Manuel. "Symmetrically Normalised Instrumental VariableEstimation Using Panel Data," CEMFI Working Paper No. 9612, September 1996.
Arellano, Manuel and Bond, Stephen. "Some Tests of Specification for Panel Data: Monte CarloEvidence and an Application to Employment Equations," Review of Economic Studies 1991,58, pp. 277-297.
Arellano, Manuel, and Bover, Olympia. "Another Look at the Instrumental-Variable Estimation ofError-Components Models," Journal of Econometrics 1995, 68, pp. 29-52.
Arestis, Philip; Demetriades, Panicos 0; and Luintel, Kul B. "Financial Development and EconomicGrowth: The Role of Stock Markets," Journal of Money, Credit, and Banking, 2001, 33, pp.16-41.
Atje, R. and Jovanovic, B. "Stock Markets and Development," European Economic Review, 1993,37, pp. 632-40.
Beck, Thorsten; Demirgiu,-Kunt, Asli; Levine, Ross. "A New Database on Financial Developmentand Structure" World Bank Economic Review 14, 2000, 597-605
Beck, Thorsten; Levine, Ross; and Loayza, Norman. "Finance and the Sources of Growth", Journalof Financial Economics,2 000, 58(1).
Bencivenga, Valerie R. and Smith, Bruce D. "Financial Intermediation and Endogenous Growth,"Review of Economic Studies 1991, 58, pp. 195-209.
Bencivenga, Valerie R.; Smith, Bruce D. and Starr, Ross M. "Transaction Costs, TechnologicalChoice, and Endogenous Growth", Journal of Economic Theory 1995, 67(1), pp. 53-117.
Bhide, Amar. "The Hidden Costs of Stock Market Liquidity," Journal of Financial Economics,August 1993, 34(1), pp. 1-51.
Blundell, Richard and Bond, Stephen. "Initial Conditions and Moment Restrictions in DynamicPanel Data Models," Journal of Econometrics, 1998, 87, pp. 115-43.
Boyd, John H. and Prescott, Edward C. "Financial Intermediary-Coalitions," Journal of Economics
17

Theory, April 1986, 38(2), pp. 211-32.
Boyd, John H.; Levine, Ross; and Smith, Bruce D. "The Impact of Inflation on Financial SectorPerformance." Journal of Monetary Economics, 2000, forthcoming.
Calderon, Cesar; Chong, Alberto; and Loayza, Norman. "Determinants of Current Account Deficitsin Developing Countries," World Bank Research Policy Working Paper 2398, July 2000.
Demirgtii-Kunt, Asti and Levine, Ross. "Financial Structures and Economic Growth. A Cross-Country Comparison of Banks, Markets, and Development," Cambridge, MA: MIT Press,2001.
Demirgiui-Kunt, Asli and Maksimovic, Vojislav. "Law, Finance, and Firm Growth," Journal ofFinance, December 1998, 53(6), pp.2107-2137.
Griliches, Zvi. and Hausman, Jerry A. "Errors in Variables in Panel Data, " Journal of Econometrics,1986, 31, pp. 93-118.
Harris, Richard D.F. Stock Markets and Development: A Re-assessment," European EconomicReview, 1997, 41, pp. 139-46.
Holtz-Eakin, D.; Newey, W, and Rosen, H. "Estimating Vector Autoregressions with Panel Data,"Econometrica, 1990, 56(6), pp. 1371-1395.
Huybens, Elisabeth, and Smith, Bruce, 1999, Inflation, Financial Markets, and Long-Run Real Activity,Journal of Monetary Economics, 43, 283-315.
Johansen, Sbren. "Statistical Analysis of Co-Integrating Vectors," Journal of Economic Dynamicsand Control, 1988, 12, pp.23 1 -54.
King, Robert G. and Levine, Ross. "Finance and Growth: Schumpeter Might Be Right," QuarterlyJournal of Economics, August 1993a, 108(3), pp. 717-38.
King, Robert G. and Levine, Ross. "Finance, Entrepreneurship, and Growth: Theory and Evidence,"Journal of Monetary Economics, December 1993b, 32(3), pp. 513-42.
Levine, Ross. "Stock Markets, Growth and Tax Policy," Journal of Finance, 1991, 46, 1445-65.
Levine, Ross. "Financial Development and Economic Growth: Views and Agenda," Journal ofEconomic Literature, June 1997, 35(2), pp. 688-726.
Levine, Ross. "The Legal Environment, Banks, and Long-Run Economic Growth," Journal ofMoney, Credit, and Banking, August 1998, 30(3 pt.2), pp.596-613.
Levine, Ross. "Law, Finance, and Economic Growth", Journal of Financial Intermediation, 1999,8(1/2), pp. 36-67.
18

Levine, Ross. "Napoleon, Bourses, and Growth: With A Focus on Latin America," in MarketAugmenting Government, Eds. Omar Azfar and Charles Cadwell. Ann Arbor, MI: Universityof Michigan Press, forthcoming 2001.
Levine, Ross; Loayza, Norman; and Beck, Thorsten. "Financial Intermediation and Growth:Causality and Causes", Journal of Monetary Economics, 2000, 46, pp. 31-77.
Levine, Ross and Zervos, Sara. "Stock Markets, Banks, and Economic Growth," AmericanEconomic Review, June 1998, 88(3), pp. 537-58.
Rousseau, Peter L. and Wachtel, Paul. "Financial Intermediation and Economic Performance:Historical Evidence from Five Industrial Countries," Journal of Money. Credit, and Banking,November 1998, 30(4), pp. 657-78.
Rousseau, Peter L. and Wachtel, Paul. "Equity Markets and Growth: Cross-Country Evidence onTiming and Outcomes, 1980-1995, Journal of Business and Finance, November 2000, 24, pp.1933-57.
Stiglitz, Joseph. E.. "Credit Markets and the Control of Capital." Journal of Money. Credit andBanking 1985, 17, pp. 133-52.
19

Table 1: Summary Statistics: 1975-1998
Descriptive Statistics
Economic Turnover BankGrowth Ratio Credit
Mean 1.89 41.54 50.00Maximum 8.57 340.02 124.38Minimum -4.77 1.31 4.13Std. Dev. 2.23 42.91 28.16
Observations 146 146 146
Correlations
Economic Turnover BankGrowth Ratio Credit
Economic Growth 1(0.001)
Turnover Ratio 0.38 1(0.001)
Bank Credit 0.11 0.41 1(0.194) (0.001)
p-values are reported in parentheses

Table 2: Stock Markets, Banks and Growth
Regressors (1) (2) (3) (4) (5)
Constant -0.774 -1.757 -4.095 -1.062 -0.156(0.570) (0.090) (0.048) (0.265) (0.855)
Logarithm of initial income per capita -0.717 -0.350 -0.242 -0.189 -0.384(0.008) (0.099) (0.291) (0.356) (0.010)
Average Years of Schooling2 -0.388 -1.156 -1.492 -1.297 -1.629(0.646) (0.111) (0.076) (0.040) (0.013)
Government Consumption' -0.073(0.868)
Trade Openness' 0.679(0.045)
Inflation Rate2 -0.35(0.257)
Black Market Premium2 0.549(0.444)
Bank Credit' 1.756*** 1.539** 0.977 0.538 1.045*(0.001) (0.001) (0.001) (0.001) (0.001)
Turnover Ratio' 0.958** 1.078*** 1.522*** 1.667*** 1.501***(0.001) (0.001) (0.001) (0.001) (0.001)
Sargan test3 (p-value) 0.488 0.602 0.452 0.558 0.656
Serial correlation test4 (p-value) 0.595 0.456 0.275 0.272 0.335
Wald test for joint significance 0.001*** 0.001*** 0.001*** 0.001*** 0.001***(p-value)Countries 40 40 40 40 40Observations 146 146 146 146 146
p-values in parentheses
1In the regression, this variable is included as log(variable)2 In the regression, this variable is included as log(1 + variable)3 The null hypothesis is that the instruments used are not correlated with the residuals.4 The null hypothesis is that the errors in the first-difference regression exhibit
no second-order serial correlation.*,* ~ indicate significance at the 10%, 5%, and 11% level in the first-stage regression.
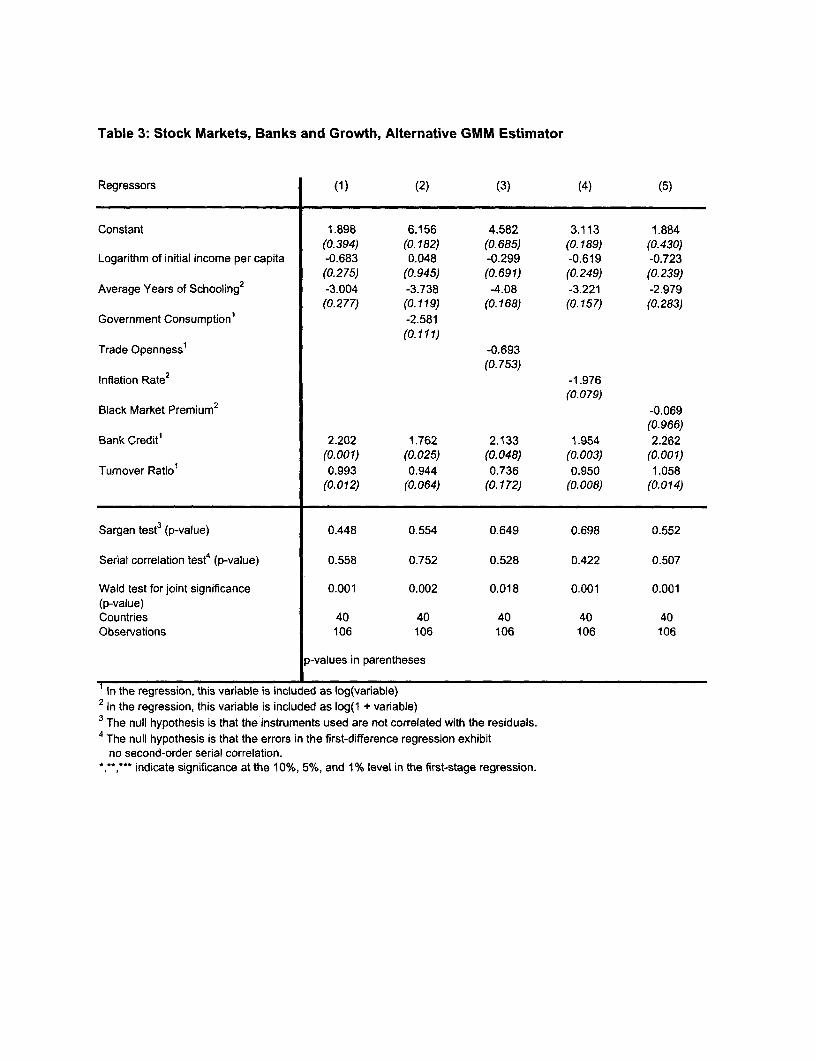
Table 3: Stock Markets, Banks and Growth, Alternative GMM Estimator
Regressors (1) (2) (3) (4) (5)
Constant 1.898 6.156 4.582 3.113 1.884(0.394) (0.182) (0.685) (0.189) (0.430)
Logarithm of initial income per capita -0.683 0.048 -0.299 -0.619 -0.723(0.275) (0.945) (0.691) (0.249) (0.239)
Average Years of Schooling2 -3.004 -3.738 -4.08 -3.221 -2.979(0.277) (0.119) (0.168) (0.157) (0.283)
Government Consumption' -2.581(0.111)
Trade Openness' -0.693(0.753)
Inflation Rate2 -1.976(0.079)
Black Market Premium2 -0.069
(0.966)Bank Credit' 2.202 1.762 2.133 1.954 2.262
(0.001) (0.025) (0.048) (0.003) (0.001)Tumover Ratio' 0.993 0.944 0.736 0.950 1.058
(0.012) (0.064) (0.172) (0.008) (0.014)
Sargan test3 (p-value) 0.448 0.554 0.649 0.698 0.552
Serial correlation test4 (p-value) 0.558 0.752 0.528 0.422 0.507
Wald test for joint significance 0.001 0.002 0.018 0.001 0.001(p-value)Countries 40 40 40 40 40Observations 106 106 106 106 106
p-values in parentheses
1In the regression, this variable is included as log(variable)2 In the regression, this variable is included as log( + variable)
3 The null hypothesis is that the instruments used are not correlated with the residuals.4 The null hypothesis is that the errors in the first-difference regression exhibit
no second-order serial correlation.indicate significance at the 10%, 5%, and 1% level in the first-stage regression.

Table Al: List of Countries
Australia Greece NorwayAustria India PakistanBangladesh Indonesia PeruBelgium Israel PhilippinesBrazil Italy PortugalCanada Jamaica South AfricaChile Japan SwedenColombia Jordan TaiwanDenmark Korea ThailandEgypt Malaysia U.S.Finland Mexico UruguayFrance Netherlands VenezuelaGermany New Zealand ZimbabweGreat Britain


Policy Research Working Paper Series
ContactTitle Author Date for paper
WPS2655 Measuring Services Trade Aaditya Mattoo August 2001 L. TabadaLiberalization and its Impact on Randeep Rathindran 36896Economic Growth: An Illustration Arvind Subramanian
WPS2656 The Ability of Banks to Lend to Allen N. Berger August 2001 A. YaptencoInformationally Opaque Small Leora F. Klapper 31823Businesses Gregory F. Udell
WPS2657 Middle-Income Countries: Peter Fallon August 2001 D. FischerDevelopment Challenges and Vivian Hon 38656Growing Global Role Zia Qureshi
Dilip Ratha
WPS2658 How Comparable are Labor Demand Pablo Fajnzylber August 2001 A. PillayElasticities across Countries? William F. Maloney 88046
WPS2659 Firm Entry and Exit, Labor Demand, Pablo Fajnzylber August 2001 A. Pillayand Trade Reform: Evidence from William F. Maloney 88046Chile and Colombia Eduardo Ribeiro
WPS2660 Short and Long-Run Integration: Graciela Kaminsky August 2001 E. KhineDo Capital Controls Matter? Sergio Schmukler 37471
WPS2661 The Regulation of Entry Simeon Djankov August 2001 R. VoRafael La Porta 33722Florencio Lopez de SilanesAndrei Shleifer
WPS2662 Markups, Entry Regulation, and Bernard Hoekman August 2001 L. TabadaTrade: Does Country Size Matter? Hiau Looi Kee 36896
Marcelo Olarreaga
WPS2663 Agglomeration Economies and Somik Lail August 2001 R. YazigiProductivity in Indian Industry Zmarak Shalizi 37176
Uwe Deichmann
WPS2664 Does Piped Water Reduce Diarrhea Jyotsna Jalan August 2001 C. Cunananfor Children in Rural India? Martin Ravallion 32301
WPS2665 Measuring Aggregate Welfare in Martin Ravallion August 2001 C. CunananDeveloping Countries: How Well Do 32301National Accounts and Surveys Agree?
WPS2666 Measuring Pro-Poor Growth Martin Ravallion August 2001 C. Cunanan32301

Policy Research Working Paper Series
ContactTitle Author Date for paper
WPS2667 Trade Reform and Household Welfare: Elena lanchovichina August 2001 L. TabadaThe Case of Mexico Alessandro Nicita 36896
Isidro Soloaga
WPS2668 Comparative Life Expectancy in Africa F. Desmond McCarthy August 2001 H. SladovichHolger Wolf 37698
WPS2669 The Impact of NAFTA and Options for Jorge Martinez-Vazquez September 2001 S. EverhartTax Reform in Mexico Duanjie Chen 30128