stock markets, banks and the sources of economic growth in...
TRANSCRIPT

Stock Markets, Banks and the Sources of Economic Growth in Low and High Income Countries
Felix Rioja and NevenValev Department of Economics
AndrewYoungSchool of Policy Studies GeorgiaStateUniversity
Revised: July 2011
Abstract
This paper studies the effects of stock markets and banks on the sources of economic growth,
productivity and capital accumulation, using a large cross country panel that includes high- and low-income countries. Results show that, in Low Income countries, banks have a sizable positive effect on capital accumulation. We find that stock markets, however, have not contributed to capital accumulation or productivity growth in these countries. Given the emphasis that has been placed in developing equity markets in developing countries, these findings are somewhat surprising. Conversely, in high-income countries, stock markets are found to have sizable positive effects on both productivity and capital growth, while banks only affect capital accumulation JEL Classification: G1, O4. Key words: Financial development, capital growth, productivity, stock markets, banking, low-income countries, high-income countries. __________________________________________________________________ Contact information: Rioja ([email protected]). Valev ([email protected]). Acknowledgements: We are grateful to Gustavo Canavire-Bacarreza, Fernando Rios-Avila, and Tatyana Zelenskaya for research assistance. Comments from Federico Mandelman and seminar participants at the Federal Reserve Bank of Atlanta, Auburn University, and the University of Georgia are gratefully acknowledged.

2
Stock Markets, Banks and the Sources of Economic Growth
I. Introduction
An extensive literature has established that financial development has a strong positive effect
on economic growth.1 Financial markets overcome transaction costs and informational
asymmetries to reduce liquidity constraints and improve the allocation of capital. The positive
effect on economic growth is obtained through both greater physical capital accumulation and
greater productivity growth. The literature also shows that stock markets and banks both
enhance economic growth (e.g., Beck and Levine, 2004). Less is known, however, about the
effects of stock markets and banks on the two sources of economic growth – physical capital
accumulation and productivity growth. And in particular whether these effects vary between
high- and low-income countries. In a widely discussed article in The Economist (July 11, 2009),
the Chief Economist of the World Bank, Justin Lin, proposed that sophisticated financial
institutions “are not appropriate in low-income markets.” Further, Lin suggests that “small local
banks are the best entities for providing financial services” in these countries.
In this paper, we attempt to answer the following questions:
Do stock markets and banks both enhance productivity growth? Is the effect of stock markets more pronounced?
Do stock markets and banks both increase physical capital accumulation? Is the effect of banks more pronounced?
Do banks have a stronger effect on the sources of growth in low-income countries? Do stock markets have a stronger effect on the sources of growth in high-income
economies?
Our motivation for this analysis is twofold. First, as described in Acemoglu, Aghion, and
Zilibotti (2002) countries grow in different ways. A country that is behind the technological
frontier will typically pursue a capital accumulation growth strategy ("investment-based
growth"). In contrast, advanced countries have a strong incentive for innovation. Financial
markets will fund these innovation activities leading to larger productivity gains (“innovation-
1 Levine (2005) provides a comprehensive review of the literature.
3
based growth”).2 It is important then to understand the driving forces for each of the two sources
of growth and in particular the role that different components of the financial markets play.
Furthermore, Aghion, Howitt and Mayer-Foulkes (2005) and Rioja and Valev (2004) have
shown that the effects of finance on growth may vary according to the country’s income level.
Lin, Sun and Jiang (2009) show theoretically that the structure of the financial system depends
on the country’s stage of development. Second, in addition to the effect on economic growth, the
literature provides theoretical arguments for the effects of stock markets and banks on the
sources of growth, but the empirical literature has analyzed primarily their effect on overall
growth. Hence, our objective is to focus on the sources of growth.
The theoretical literature proposes that both banks and stock markets are expected to
enhance productivity. Allen (1993) and Allen and Gale (1999) argue that stock markets are
essential for productivity growth. In Allen and Gale’s (1999) model, individual investors “agree
to disagree” on the feasibility of new investment projects. With disaggregated decision making in
stock markets, each investor makes a decision whether or not to invest; as a result more
innovative projects receive financing. Similarly, Boyd and Smith (1998) show that stock
markets become more important when economies approach the technological frontier where
innovation is the primary source of growth. According to theory, banks are also important for
productivity growth. Bhide (1993) argues that banks raise productivity by monitoring firm
managers and improving corporate governance.
Similarly, both banks and stock markets provide financing for physical capital
accumulation. Levine (1991) shows that liquid stock markets allow investors to convert shares
into cash in case they experience a liquidity shock. With reduced liquidity risk, investors are
willing to commit funds to capital investments. Furthermore, stock markets allow investors to
diversify idiosyncratic productivity risks which also serves to raise investment. Other theoretical
work shows that banks are also important for physical capital accumulation. For example,
Gershenkron (1962) argues that banks can exert pressure on firms to service their debts.
Therefore they finance capital investments even in weak institutional environments. Stulz (2001)
points out that bankscan commit funds to capital investments that require financing in successive
stages.
2 Some empirical papers have confirmed that the engines of growth vary for different countries (e.g., Young (1994) and Christensen, Cummings, and Jorgenson (1980)).

4
In summary, the theoretical literature argues that banks and stock markets both enhance
productivity growth and physical capital accumulation.3 We use data from a large panel of
countries to test these hypotheses. Furthermore, we investigate the influence of stock markets
and banks on the sources of growth in developed and developing countries. Banks may be
especially important in developing countries where stock markets are smaller and less active. As
countries develop, their stock markets may start to play a more significant role. Our empirical
findings are that:1) banks primarily affect capital growth while stock markets primarily affect
productivity; 2) in high income countries, however, there is strong evidence that banks and stock
markets have independently affected capital growth, while productivity seems to be driven by the
stock market only; and 3) in low income countries, conversely, bank credit is the primary driver
of capital accumulation. However, neither stock markets nor banks seem to affect productivity
growth.
Our paper is not the first one to consider the effects of stock markets and banks on the
sources of growth. Levine and Zervos (1998) find that measures of stock market and credit
market development both enter significantly in equations explaining capital and productivity
growth. We extend their work in three ways. First, increased data availability allows us to
expand the number of countries and the length of the time series used by Levine and Zervos (47
countries with data ending in 1993). Both credit markets and stock markets have developed
significantly since the mid 1990’s. We use data for 62 countries covering the period of 1980-
2009. Second, we confront well-known potential endogenity problems by using GMM dynamic
panel techniques to try to establish causality. Levine and Zervos use cross-country OLS
regressions which, while suggestive of a positive effect of finance on the sources of growth, fall
short of establishing causality.4 Third, we investigate the roles of financial markets in developed
and developing countries separately. Here, we are motivated by Rioja and Valev (2004) who
find that the effects of finance on growth vary with income. However, Rioja and Valev (2004)
focus on the effects of private credit and do not study in detail how the effects of stock markets
vary according to income levels. 3 There are additional related theoretical papers not referenced in the paper. However, the finance and growth literature is voluminous and a comprehensive review is beyond the scope of this paper. The reader is referred to Levine (2005) who provides a detailed summary of the theory and empirical results. 4 A follow up paper by Beck and Levine (2004) uses GMM techniques to study the effects of stock markets and banks on economic growth, but does not study the effects on the sources of growth. Rousseau and Wachtel (2000) combine a panel VAR with GMM techniques to study the effects of stock markets and financial intermediation on economic growth.

5
The remainder of the paper is organized as follows. Section II describes the data and the
measures used. Section III describes the methodology and Section IV discusses the results.
Section V concludes.
II. Data and Measures
The data set consists of a panel of observations for 62 countries for which we have stock
market data for the period 1980-2004. We take advantage of the wider availability of data to
expand on the previous work of Levine and Zervos (47 countries, up to 1993) and Beck and
Levine (2004) which study 40 countries up to the year 1998. We use the “Financial Structure and
Development Data Base” available from the World Bank for the financial market variables. The
data for the sources of growth and some control variables is computed from the Penn World
Tables 7.0 (Heston, Summers and Aten, 2011). As standard in this literature, the data are
averaged over five-year intervals: 1980-1984, 1985-1989, 1990-1994, 1995-1999, 2000-2004,
and 2005-2009, so there are six observations per country when available.
The sources of economic growth
We follow a standard method, for example as in Easterly and Levine (2001), to calculate
physical capital growth. The calculation starts with an estimate of the initial level of capital stock
per person for each country in 1950 assuming that the capital-output ratio was in steady state.
Capital stock per person in later years is then computed using the real investment series from the
Penn World Tables 6.2 and the perpetual inventory method with a 7% annual depreciation rate.5
The variable Capital Growth is then computed as the growth rate of this capital stock per person.
To calculate Productivity Growth, we formulate a production function in per unit of labor
terms as: y Ak . Then taking logarithms, productivity is computed according to,
(1) ln( ) ln( ) ln( )A y k ,
wherey is output per person and k is capital per person. This specification is the one that has been
most commonly used in the financial development-growth literature in papers by Beck, Levine,
and Loayza (2000), and Rioja and Valev (2004). 5 The farther in the past the initial observation of investment is, the more accurate the capital series will be. Penn World Tables (PWT) data starts in 1950 and provides fairly uniform measures across countries. Alternatively, the World Development Indicators (WDI) data could have been used; however, these data do not go back in time as early as PWT and have sparser coverage of the earlier years. Hence, we chose to use PWT data.

6
Summary statistics are presented in Table 1. The average capital growth rate over all
countries was 2.3% per year. The maximum capital growth was 11.24% per year observed in
Korea in1990-1994, and the minimum of -3.37% was observed in Zimbabwe in the 2005-2009
period. For productivity, the average growth was 1.29% with a minimum of -13.1% in
Zimbabwe (2000-2004) and a maximum of 8.5% in Trinidad and Tobago (2005-2009).We
further separate countries into two groups, Low Income and High Income, according to their
World Bank classification system.6 Table 1 also presents summary statistics for each income
group.
Financial Sector Variables
Three measures of banking development are used. First, Bank Credit is the credit that
deposit money banks have issued to the private sector as a share of GDP. Second, Bank Deposits
is the total amount of demand, time and saving deposits in deposit money banks as a share of
GDP. Third, Private Credit is the credit issued by all financial intermediaries (excluding central
banks) to the private sector as percent of GDP. While this measure includes intermediaries in
addition to banks, banks still account for a major share. We choose to use Private Credit as an
alternative measure because of its widespread use in the literature (Levine, 2005). The
descriptive statistics of Table 1 show that Bank Credit and Bank Deposits average about 55% of
GDP, while Private Credit is about 60% of GDP. The countries with largest Bank Credit and
Bank Deposits are the Netherlands, Japan, and Switzerland in the latest years of the sample.
Countries with the smallest banking sectors include Peru (1985-1989) and Ghana (1990-1994).
Three measures of stock market development and activity are also used. First, the
Turnover Ratio measures the value of the traded shares in the domestic stock market divided by
the total value of shares in the market. It measures how active or liquid the stock market is
relative to its size. Beck and Levine (2004) use this measure exclusively in their study. Second,
Value Traded is the value of all shares traded in the stock market as percent of GDP. It measures
how active the stock market is as a share of the economy. Third, Market Capitalization is the
total value of all shares in the stock market as percent of GDP; it measures the size of the stock
6 We attempted to have an approximately balanced number of countries in the two groups. Countries classified by the World Bank as “High Income OECD” and “High Income non-OECD” comprise our High Income group. Countries classified as “Low Income”; “Lower Middle Income”; and “Upper Middle Income” comprise our Low Income group.

7
market. Hence, the three measures of stock markets capture different aspects: liquidity with
respect to market size, liquidity with respect to the economy size, and size with respect to the
economy. According to Table 1, the Turnover Ratio averages about 44% (65% in High Income
countries and 28% in Low Income countries), while the Value Traded is about 27% of the
economy (46% in High Income countries and 10% in Low Income countries), and the average
size of the stock market is about 48% of GDP. Clearly there is a wide variation among countries.
The most active stock markets are found in the US and Switzerland with Value Traded in excess
of 200% of GDP, while the least active stock markets were in several developing countries in the
1980s with Value Traded less than 1% of GDP.7
The control variables are described as follows. Initial Capital is the capital stock per
person at the beginning of the five-year period and it is computed according to the perpetual
inventory method described at the beginning of this section. Initial Income is the GDP per capita
at the beginning of the corresponding five-year period. Initial Income (or Initial Capital) control
for the convergence effect: countries that start poorer are expected to grow faster. Schooling is
measured as the average years of schooling in the population 25 years-of-age or older from the
Barro and Lee (2001) data set. This variable is typically used as a proxy of human capital and a
control for the steady state--countries with higher human capital should achieve a higher steady
state. We denote Schooling and Initial income (or Initial capital when appropriate) as our Simple
Control Set. The remaining control variables are policy related and are standard in this literature.
These variables are: Government Size (as percent of GDP), Inflation (rate), and Openness
(Exports + Imports / GDP). To re-iterate, the dependent variables and all the control variables
(except Schooling) come from the Penn World Tables.Table 2 presents the simple correlations.
III. Methodology
We use dynamic panel generalized-method-of-moments (GMM) techniques to address
potential endogeneity in the data.8 This technique has become standard in the literature in the
past few years. While Beck and Levine’s (2004) paper on stock markets and banks also uses this
approach, we incorporate recent refinements like a small-sample correction for standard errors
by Windmeijer (2005). The technique can be briefly described as follows.
7 Clearly, we only use countries in our data set that have stock markets given that we attempt to study their effects. 8 This method is fully described in Arellano and Bond (1991), Arellano and Bover (1995), and Blundell and Bond (1998).

8
Let yit be the logarithm of the stock of capital per person (or alternatively, of our measure of
productivity) in country i at time t. We are interested in the following equation:
(2) tiititititi Xyyy ,,1,1,, )1(
where yi,t- yi,t-1 is the growth rate of capital or productivity, Xi,t is a set of explanatory variables,
including our measures of banking and stock markets, i captures unobserved country-specific
effects, and it is an error term. Rewrite equation (2) as:
(3) ,,,1,, tiitititi Xyy
Notice in (3) that the lagged dependent variable, which enters as an independent explanatory
variable is correlated with the country-specific component of the error term. To resolve this
problem, as a first step, the GMM procedure involves taking first differences to eliminate the
country-specific effect:
(4) 1,,1,,2,1,1,, titititititititi XXyyyy .
By construction, in equation (4), however, the lagged difference of capital per person is
correlated with the error term, which along with the potential endogeneity of the explanatory
variables X, requires the use of instruments. The GMM difference estimator uses the lagged
levels of the explanatory variables as instruments under the conditions that the error term is not
serially correlated and that the lagged levels of the explanatory variables are weakly exogenous
(i.e., they are uncorrelated with future error terms). Then the following moment conditions are
used to calculate the difference estimator:
(5) ,,....,3;201,,, TtsforyE titisti
(6) .,....,3;201,,, TtsforXE titisti

9
Since persistence in the explanatory variables may adversely affect the small-sample and
asymptotic properties of the difference estimator (Blundell and Bond, 1998), the difference
estimator is further combined with an estimator in levels to produce a system estimator. The
inclusion of a levels equation also allows us to use information on cross-country differences.
The equation in levels uses the lagged differences of the explanatory variables as
instruments under two conditions. First, the error term is not serially correlated. Second,
although there may be correlation between the levels of the explanatory variables and the
country-specific error term, there is no correlation between the difference in the explanatory
variables and the error term. This yields the following stationarity properties:
(7) iqtiiptiiqtiipti XEXEandyEyE ,,,, for all p and q.
The additional moment conditions for the regression in levels are:
(8) 10,1,, sforyyE tiististi
(9) 10,1,, sforXXE tiististi .
In summary, the GMM system estimator is obtained using the moment conditions in
equations (5), (6), (8), and (9). Two specification tests are used. The Hansen-J test which tests
the joint validity of the instruments, and the AR(2) test which tests if the error term is not
second-order serially correlated. We also attempt to keep the number of instruments below the
number of cross sectional units by “collapsing” the instrument matrix as suggested by Roodman
(2007).

10
IV. Results
Capital Growth
We ran various specifications to establish how banking and stock markets affect capital
growth. Table 3 presents the summary results of running every combination of banks and stock
market measures (3x3).9 The results for the full sample are described in Panel A. The banking
measures are generally statistically significant. The stock market measures, on the other hand,
are not statistically significant at conventional 5% levels. These results indicate that, when
looking across a wide range of countries, banks have a strong positive effect on capital
accumulation, but stock markets do not.10
As described in the introduction, we split the sample into two groups of countries based
on the World Bank classification system. The High Income group is composed of 28 countries,
and the Low Income group has 34 countries. The Appendix lists which counties fall in which
group. Panel B in Table 3 presents the results from re-running all the specificationsonly for the
Low Income countries.11Overall, the results show that banks are significant determinants of
capital growth, while stock market measures are not. It is useful to interpret the economic
significance of the coefficients. Consider the regression that uses the Bank Credit and Value
Traded measures (the second cell on the first row). The coefficient of Bank Credit is 4.868. With
a Bank Credit at about 22% of GDP, the country of Pakistan was at the 33 percentile among Low
Income countries in the 2000-04 period. Increasing banking system development in Pakistan to
9 Each equation estimated also included the Simple Control Set (i.e., initial capital and schooling) and time dummies. These coefficients are not reported on Table 3 for conciseness. The coefficients are two-step GMM system estimators with robust standard errors (Windmeijer, 2005). The instruments are lagged values of levels and differences of the financial variables and the controls and the instrument matrix is “collapsed.” For all regressions on Table 3, the Hansen-J test shows that we cannot reject the joint validity of the instruments. The AR(2) tests reject the presence of second-order serial correlation. Full results are available from the authors. 10 In addition, we computed joint significance tests for the combined effects of stock market development and banking system development in every regression that we estimated. In line with the literature, these tests reveal that, looking broadly at the results, overall financial development (banks and stock markets) enhances both capital accumulation and productivity growth. In the large majority of cases, the joint significance test indicated a statistical significant effect when at least one of the financial development variables (either stock market or banking system development) was statistically significant. These results are also available on request. 11 As an initial step, we interacted the bank and stock measures with income and ran regressions using the all-countries group. The results were as expected with diminishing effects of bank measures as income increased. However, those regressions make the strong assumption of holding constant the coefficients for all other variables for all countries. We believe it is more appropriate to separate them in two groups and study each group separately as we do here.

11
the median of 26% of GDP (Costa Rica), would raise the capital growth rate in Pakistan by about
0.88% per year. This is a sizable effect.12
Regarding the coefficient estimates for the stock market variables, they are generally not
statistically significant for Low Income countries as Panel B shows.This is somewhat of a
surprising finding given that stock market development in Low Income countries has received
lots of attention in the last 15-20 years. Furthermore, these results would agree with Lin (2009)
that developing counties need banks and not more sophisticated financial institutions like stock
markets. There may be several explanations for this finding. While stock markets have been
established in low income countries, perhaps they have not yet reached the minimum levels of
size and activity to supply significant amounts of funding to domestic enterprises. Indeed, as
shown on Table 1, Value Traded averages only 10% of GDP in Low Income countries, while it
is 46% of GDP in our High Income group. Therefore, banks have remained the primary suppliers
of funding for capital accumulation. It is also possible that the strong links developed between
businesses and banks for many years prior to the establishment of stock markets account for a
strong preference by firms to keep borrowing from banks rather than issue equity.13
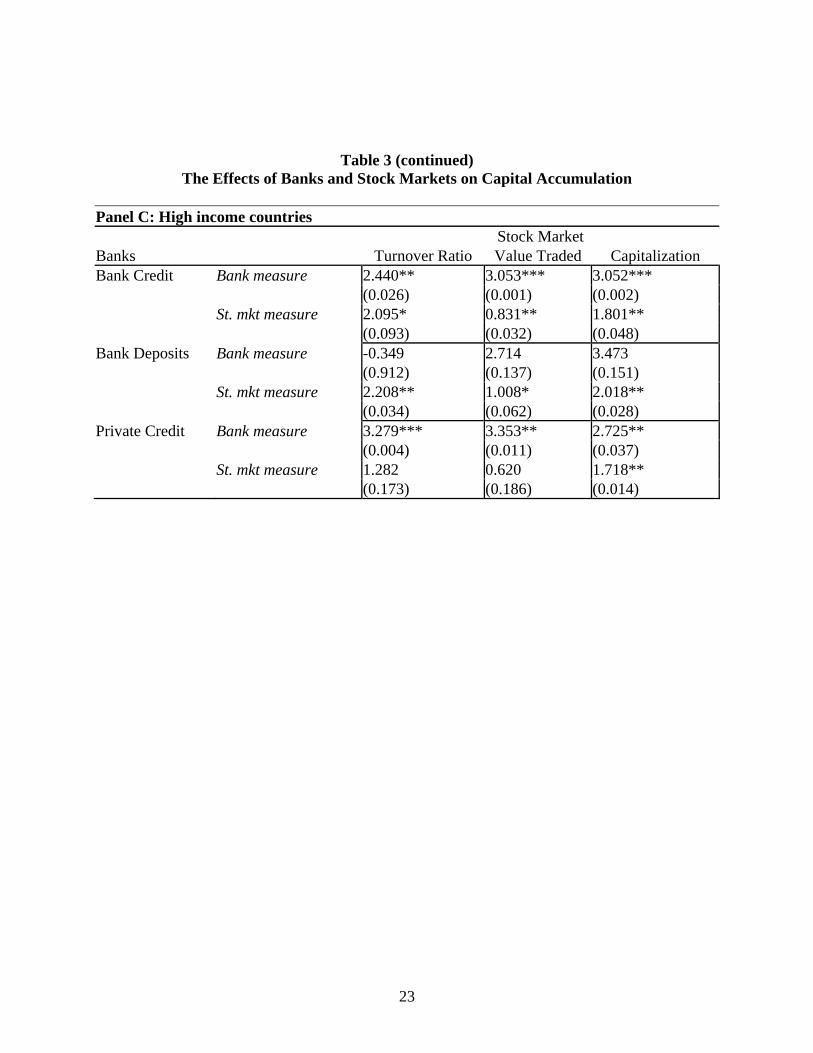
Compare the results above with those from High Income countries shown in Panel C.
Both banks and stock markets are statistically significant in some of the regressions, though the
results are mixed. The bank measures Bank Credit and Private Credit are statistically significant
in every regression, as is the stock market measure Market Capitalization. Again, it is useful to
interpret and compare the coefficients to those for Low Income countries. We focus on the
regression that uses the Bank Credit and Value Tradedmeasures to be consistent. The coefficient
of Bank Creditin High Income countries is 3.053 vs. 4.868 in Low Income countries. Hence,
expanding bank credit has a larger positive effect on capital growth in Low Income countries.On
the other hand, the Value Traded coefficient is 0.831 and statistically significant at the 5% level
in High Income countries, while not significant for Low Income countries. Among High Income
12 Since the bank and stock market measures enter the regressions in logarithms, the exact calculations are as follows. For Bank Credit, the increase is from -1.51 to -1.33 = 0.18. Hence, 4.868 (coeff) x 0.18 = 0.88. 13 Countries with large banking sectors often have large stock markets and vice versa, so some degree of collinearity is expected. We conduct a robustness test in which we run regressions with either bank or stock market measure without the other. Then we compare the coefficients to those obtained from a regression that includes both types of financial markets. We find similar results in terms of statistical significance. However, the size of the coefficients is larger in the regression that only include one of the measures. This would indicate that indeed it is appropriate to test the effects of banks and stock markets by including both in each regression as we do in our results. These robustness regressions are available from the authors.
12
countries, Israel is at the 33 percentile with a Value Tradedof 35% in the period 2000-04. If the
stock market activity increased to the median level of 51% (Italy), the capital growth rate would
rise by 0.31%.14
While the regressions of Table 3 include the Simple Control set and time dummies, we
add other control variables for robustness in the specifications of Table 4 that use the two most
commonly used measures of banking and stock markets: Bank Credit and Value Traded. The
control variables Government Size, Inflation, and Openness are added one at a time. The results
are consistent with those from Table 3. In Low Income countries, Bank Credit is positive and
statistically significant at the 1% significance level in every regression, while Value Traded is
not. In High Income countries, Value Traded is statistically significant in 3 of 4 regressions,
while Bank Credit is only statistically significant in two regressions. Of the three controls added,
only Government Size is statistically significant and shows the expected sign.
Productivity Growth
We rerun the above estimations with Productivity Growth as the dependent variable. The
results are presented on Table 5. When looking at the all-countries sample, bank measures and
stock market measures are generally not significant. Only Market Capitalization is significant in
all regressions. The picture becomes more clear looking at the two income groups separately. For
the Low Income countries neither bank measures nor stock market measures are statistically
significant. This is further confirmed in Table 6 when we add other controls for robustness. In
sum, we find no evidence that productivity growth in Low Income countries has been affected by
banks or stock markets.
For High Income countries, on the other hand, Panel C of Table 5 shows that stock
markets are significant in a couple of regressions. When using the Bank Credit and Value Traded
measures and adding other controls on Table 6, Value Traded is significant and positive in every
regression, while Bank Credit is not. Let’s consider, for example, the coefficient estimate for
Value Traded in regression (2) which is 0.417. Continuing with the example of Israel which
ranks at the 33 percentile for Value Traded in the High Income group, an increase is stock
market activity to the median Value Traded would result in productivity growth growing 0.15%
14 Since the bank and stock market measures enter the regressions in logarithms, the exact calculations are as follows. For Value Traded the increase is from -1.04 to -0.67 = 0.37. Then, 0.831 (coeff) x 0.37 = 0.31.

13
faster.This is a fairly sizable increase considering that productivity grows at 1.3% per year in
these advanced countries. In sum, stock markets generally boost productivity growth in High
Income countries.
V. Conclusions
This paper studies the effects of stock markets and banks on capital accumulation and
productivity growth. Our results are succinctly summarized in Table 7. Studying panel data for a
world sample, we find that bank credit primarily affects capital accumulation across all countries
as predicted by Gershenkron (1962) and Stulz (2001). We also find that stock markets primarily
affect productivity growth. This finding confirms theoretical work by Allen (1993), Allen and
Gale (1999) and Boyd and Smith (1998). Our all-countries-sample findings are generally
consistent with Levine and Zervos (1998) while extending the number of countries and time
observations as well addressing potential endogeneity concerns by using dynamic panel GMM-
IV estimators.
Our main contribution arises when we study Low and High Income countries separately. In
Low Income countries, banks are essential as they have a sizable positive effect on capital
accumulation. We find that stock markets, however, have not contributed to capital accumulation
or productivity growth in these countries. Perhaps the size and activity of equity markets in
developing countries has not yet reached levels where they are significant determinants of the
sources of growth. Nevertheless, given the emphasis that has been placed in developing equity
markets in developing countries, these findings are somewhat surprising. These results seem to
provide support for Lin’s (2009) argument that financial markets in developing countries should
be focused on banks.
Conversely, in high-income countries, stock markets are generally found to have sizable
positive effects on both productivity and capital growth, while banks only affect capital
accumulation. This agrees with theoretical work by Allen and Gale (1999) as stock markets are
important in funding innovations which lead to productivity growth. Our results highlight the
complex nature of the relationships between the financial sector and real activity. They
underscore the importance of differentiating between the sources of growth, the different
components of the financial system, and countries at different stages of development.

14
References
Acemoglu, D., Philippe Aghion, and FabrizioZilibotti. “Distance to Frontier, Selection, and
Economic Growth.” Journal of the European Economic Association, 4(1):37–74, 2006.
Aghion, Howitt and Mayer-Foulkes. “The Effect of Financial Development on Convergence,”
Quarterly Journal of Economics, 120(1), 2005, 173-222.
Allen, F. “Stock Markets and Resource Allocation.” In: Mayer, C., Vives, X (eds.), Capital
Markets and Financial Intermediation. Cambridge, University Press, Cambridge, 1993,
81-107.
Allen, F. and D. Gale. “Diversity of Opinion and Financing of New Technologies”, Journal of
Financial Intermediation, 8, 1999, 68-89.
Allen, F. and D. Gale. Comparing Financial Systems, Cambridge, MA: MIT Press, 2000.
Arellano, M. and S. Bond. “Some Tests of Specification for Panel Data: Monte Carlo Evidence
with an Application for Employment Equations.” Review of Economic Studies, 58(2),
1991, 277-97.
Arellano, M. and O. Bover “Another Look at the Instrumental Variable Estimation of Error-
Component Models.” Journal of Econometrics, 68(1), 1995, 29-51.
Barro, Robert and Jong-Wha Lee. "International Data on Educational Attainment:
Updates and Implications," Oxford Economic Papers 53(3), 2001.
Beck, T., R. Levine, and N. Loayza “Finance and the Sources of Growth.” Journal of Financial
Economics, 58(1,2), 2000, 261-300.
Beck, T. and R.Levine. “Industry Growth and Capital Allocation: Does Having a Market- or
Bank-Based System Matter.” Journal of Financial Economics, 64(2), 2002, 147-180.
Beck, T. and R. Levine. “Stock Markets, Banks and Growth: Panel Evidence.” Journal of
Banking and Finance, 28(3), 2004, 423-42.
Bhide, A. “The Hidden Costs of Stock Market Liquidity”, Journal of Financial Economics, 34,
1993, 1-51.
Blundell, R. and S. Bond. “Initial Conditions and Moment Restrictions in Dynamic Panel Data
Models.” Journal of Econometrics, 87(1), 1998, 115-143.
Boyd, J. H. and B. D. Smith, “The Evolution of Debt and Equity Markets in Economic
Development”, Economic Theory, 12, 1998, 519-560.
15
Christensen, L., D. Cummings, and Dale Jorgenson “Relative Productivity Levels, 1947-1973:
An International Comparison.” European Economic Review, 16(1), 1981, 61-94.
Easterly, W. and R. Levine. “It’s Not Factor Accumulation: Stylized Facts and Growth”, World
Bank Economic Review, 15, 2001, 177-219.
Gerschenkron, A. Economic Backwardness in Historical Perspective — A Book of Essays,
Cambridge: HarvardUniversity Press, 1962.
Heston, Alan, Robert Summers and Bettina Aten, Penn World Table Version 7.0, Center for
International Comparisons of Production, Income and Prices at the University of
Pennsylvania, May 2011.
King, R. and R. Levine “Finance and Growth: Schumpeter Might Be Right.” Quarterly Journal
Economics, 108(3), 1993, 717-37.
Levine, R. “Stock Markets, Growth, and Tax Policy,” Journal of Finance 46, 1991, 1445-65.
Levine, R. “Financial Development and Economic Growth: Views and Agenda,” Journal
ofEconomic Literature 35, 1997, 688-726.
Levine, R. “Bank-Based or Market-Based Financial Systems: Which Is Better?” Journal of
Financial Intermediation, 11, 2002, 398-428.
Levine, R. “Finance and Growth: Theory and Evidence.” in Philippe Aghion and Steven Durlauf,
eds. Handbook of Economic Growth. The Netherlands: Elsevier Science. 2005.
Levine, R., N. Loayza, and T. Beck. “Financial Intermediation and Growth: Causality and
Causes," Journal of Monetary Economics, 46(1), 2000, 31-77.
Levine, R. and S. Zervos. “Stock Markets, Banks, and Economic Growth.” American Economic
Review, 88(3), 1998, 537-58.
Lin, Justin. “Walk, don’t run,” The Economist, July 11, 2009.
Lin, Justin, Xifang Sun, and Ye Jiang. “Towards a Theory of Optimal Financial Structure,”
Policy Research Working Paper Series 5038, The World Bank, 2009.
Rioja, F. and N. Valev, “Finance and the Sources of Growth at Various Stages of Economic
Development”, Economic Inquiry, 42, 2004, 27-40.
Roodman, David, “A Short Note on the Theme of Too Many Instruments.” Working Paper No.
125, August 2007, Center for Global Development (www.cgdev.org).
Rousseau, P.L. and P. Wachtel,“Equity markets and growth: Cross-country evidence on timing
and outcomes, 1980–1995,” Journal of Banking and Finance 24, 2000, pp.1933-1957.

16
Stulz, R.M. “Financial Structure, Corporate Finance, and Economic Growth.” In: Demirgüç-
Kunt, A., Levine, R. (eds.), Financial Structure and Economic Growth: A Cross Country
Comparison of Banks, Markets, and Development. MIT Press, Cambridge, MA, 2001,
143-188.
Windmeijer, F. “A finite sample correction for the variance of linear efficient two-step GMM
estimators,” Journal of Econometrics, 126(1), 2005, pp. 25-51.
World Bank. “Financial Structure and Economic Development Data Base,”
(http://www.worldbank.org/research/projects/finstructure/database.htm).
World Bank. “Bank Regulation and Supervision Dataset,”
(http://econ.worldbank.org/external/default/main?menuPK=478071&pagePK=64168176
&piPK=64168140&theSitePK=478060)
Young, Alwyn, “The Tyranny of Numbers: Confronting the Statistical Realities of the
East Asian Growth Experience.” Quarterly Journal of Economics, August 1995, 110(3),
641-80.
17
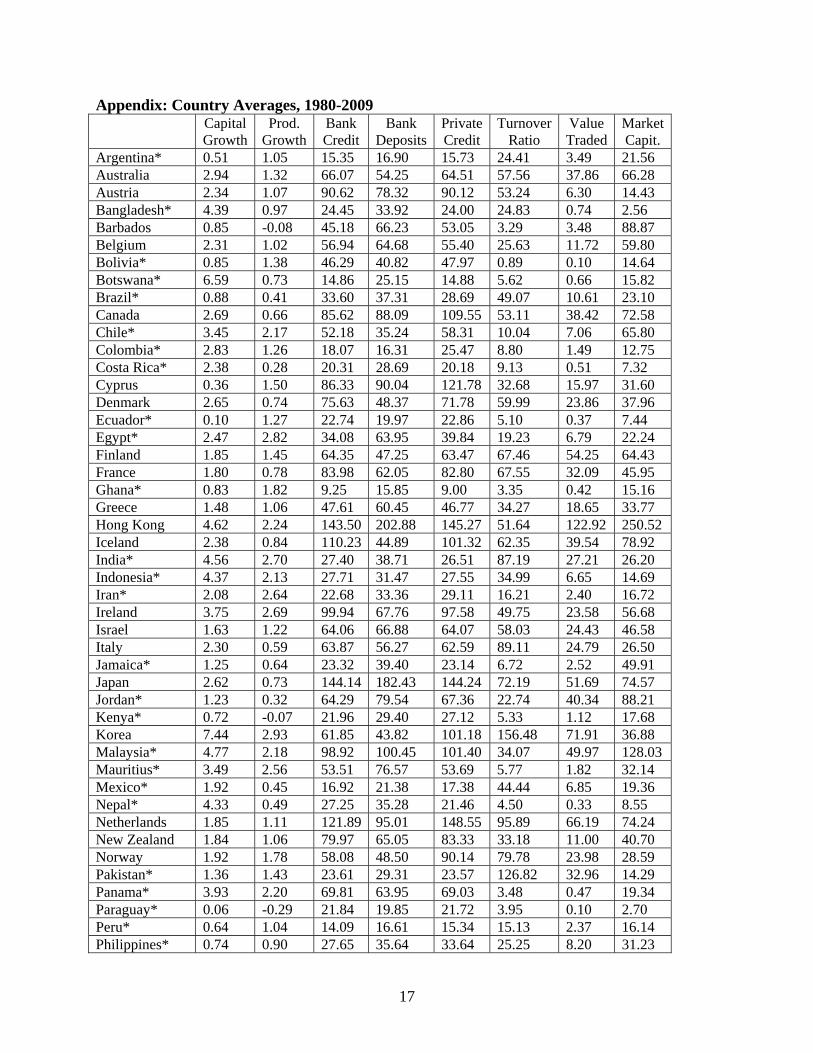
Appendix: Country Averages, 1980-2009
Capital Growth
Prod. Growth
Bank Credit
Bank Deposits
Private Credit
Turnover Ratio
Value Traded
Market Capit.
Argentina* 0.51 1.05 15.35 16.90 15.73 24.41 3.49 21.56 Australia 2.94 1.32 66.07 54.25 64.51 57.56 37.86 66.28 Austria 2.34 1.07 90.62 78.32 90.12 53.24 6.30 14.43 Bangladesh* 4.39 0.97 24.45 33.92 24.00 24.83 0.74 2.56 Barbados 0.85 -0.08 45.18 66.23 53.05 3.29 3.48 88.87 Belgium 2.31 1.02 56.94 64.68 55.40 25.63 11.72 59.80 Bolivia* 0.85 1.38 46.29 40.82 47.97 0.89 0.10 14.64 Botswana* 6.59 0.73 14.86 25.15 14.88 5.62 0.66 15.82 Brazil* 0.88 0.41 33.60 37.31 28.69 49.07 10.61 23.10 Canada 2.69 0.66 85.62 88.09 109.55 53.11 38.42 72.58 Chile* 3.45 2.17 52.18 35.24 58.31 10.04 7.06 65.80 Colombia* 2.83 1.26 18.07 16.31 25.47 8.80 1.49 12.75 Costa Rica* 2.38 0.28 20.31 28.69 20.18 9.13 0.51 7.32 Cyprus 0.36 1.50 86.33 90.04 121.78 32.68 15.97 31.60 Denmark 2.65 0.74 75.63 48.37 71.78 59.99 23.86 37.96 Ecuador* 0.10 1.27 22.74 19.97 22.86 5.10 0.37 7.44 Egypt* 2.47 2.82 34.08 63.95 39.84 19.23 6.79 22.24 Finland 1.85 1.45 64.35 47.25 63.47 67.46 54.25 64.43 France 1.80 0.78 83.98 62.05 82.80 67.55 32.09 45.95 Ghana* 0.83 1.82 9.25 15.85 9.00 3.35 0.42 15.16 Greece 1.48 1.06 47.61 60.45 46.77 34.27 18.65 33.77 Hong Kong 4.62 2.24 143.50 202.88 145.27 51.64 122.92 250.52 Iceland 2.38 0.84 110.23 44.89 101.32 62.35 39.54 78.92 India* 4.56 2.70 27.40 38.71 26.51 87.19 27.21 26.20 Indonesia* 4.37 2.13 27.71 31.47 27.55 34.99 6.65 14.69 Iran* 2.08 2.64 22.68 33.36 29.11 16.21 2.40 16.72 Ireland 3.75 2.69 99.94 67.76 97.58 49.75 23.58 56.68 Israel 1.63 1.22 64.06 66.88 64.07 58.03 24.43 46.58 Italy 2.30 0.59 63.87 56.27 62.59 89.11 24.79 26.50 Jamaica* 1.25 0.64 23.32 39.40 23.14 6.72 2.52 49.91 Japan 2.62 0.73 144.14 182.43 144.24 72.19 51.69 74.57 Jordan* 1.23 0.32 64.29 79.54 67.36 22.74 40.34 88.21 Kenya* 0.72 -0.07 21.96 29.40 27.12 5.33 1.12 17.68 Korea 7.44 2.93 61.85 43.82 101.18 156.48 71.91 36.88 Malaysia* 4.77 2.18 98.92 100.45 101.40 34.07 49.97 128.03 Mauritius* 3.49 2.56 53.51 76.57 53.69 5.77 1.82 32.14 Mexico* 1.92 0.45 16.92 21.38 17.38 44.44 6.85 19.36 Nepal* 4.33 0.49 27.25 35.28 21.46 4.50 0.33 8.55 Netherlands 1.85 1.11 121.89 95.01 148.55 95.89 66.19 74.24 New Zealand 1.84 1.06 79.97 65.05 83.33 33.18 11.00 40.70 Norway 1.92 1.78 58.08 48.50 90.14 79.78 23.98 28.59 Pakistan* 1.36 1.43 23.61 29.31 23.57 126.82 32.96 14.29 Panama* 3.93 2.20 69.81 63.95 69.03 3.48 0.47 19.34 Paraguay* 0.06 -0.29 21.84 19.85 21.72 3.95 0.10 2.70 Peru* 0.64 1.04 14.09 16.61 15.34 15.13 2.37 16.14 Philippines* 0.74 0.90 27.65 35.64 33.64 25.25 8.20 31.23

18
Portugal 3.66 1.14 94.43 88.14 92.01 44.16 11.94 22.30 Singapore 3.99 3.24 88.70 81.95 106.43 61.87 64.37 139.64 South Africa* 0.67 0.83 57.00 49.51 95.67 24.53 33.15 145.19 Spain 2.79 1.18 92.29 72.92 87.42 111.22 60.63 42.88 Sri Lanka* 2.48 2.85 22.85 27.78 22.72 12.33 2.24 13.61 Sweden 1.64 1.09 60.15 43.06 100.80 76.76 58.10 69.58 Switzerland 1.35 0.72 150.62 115.04 149.74 91.79 164.71 145.22 Thailand* 4.61 2.77 87.06 74.40 88.03 67.52 29.90 38.79 Trinidad &Tob. 0.76 4.53 30.20 39.22 44.62 6.61 2.08 47.58 Tunisia* 0.52 2.50 53.54 42.22 59.89 9.87 1.13 9.94 Turkey* 3.27 1.07 17.26 26.99 16.94 87.16 25.18 17.72 UK 2.46 1.10 106.26 80.46 103.71 68.90 79.33 107.42 United States 2.64 0.83 52.49 66.55 137.88 118.35 104.84 93.22 Uruguay* 1.01 0.89 34.47 38.79 34.47 2.58 0.03 0.88 Venezuela* -0.90 -0.03 16.69 22.32 25.58 11.29 1.13 6.57 Zimbabwe* -0.57 -2.12 13.88 18.21 21.40 11.19 4.34 33.07 Notes: Countries with a “*” are those in the Low Income group. The remainder countries are in High Income group.

19
Table 1: Summary Statistics Full Sample
Variable Mean Std. Dev. Min Max
Capital Growth 2.30 2.37 -3.37 11.24Productivity Growth 1.29 2.03 -13.06 8.51Bank Credit 56.95 42.15 2.07 234.12Bank Deposits 55.62 37.00 4.15 262.40Private Credit 63.27 44.85 4.35 264.89Turnover Ratio 44.26 49.70 0.06 371.58Value Traded 27.12 45.84 0.00 258.82Market Capitalization 47.98 57.90 0.10 527.94Initial Capital 35901 30375 672 129738Initial Income 14959 12018 155 50096Schooling 6.74 2.60 1.03 12.25Government Size 8.75 3.49 2.66 21.46Inflation 55.67 490.57 -2.28 8603.28Openness 72.90 58.47 10.57 432.08
Low Income countries (34)
Variable Mean Std. Dev. Min Max
Capital Growth 2.10 2.75 -3.37 10.91Productivity Growth 1.21 2.24 -13.06 5.48Bank Credit 33.95 24.81 2.07 145.31Bank Deposits 38.45 23.18 4.15 120.49Private Credit 36.87 27.51 4.35 145.31Turnover Ratio 27.81 43.59 0.06 371.58Value Traded 10.35 23.51 0.00 187.28Market Capitalization 30.26 41.04 0.10 220.32Initial Capital 11930 7453 672 33294Initial Income 5100 2982 155 12292Schooling 5.01 1.69 1.03 8.49Government Size 7.96 3.73 2.66 21.46Inflation 100.09 673.54 0.66 8603.28Openness 65.65 39.19 10.57 206.80
(continued)

20
Table 1 (continued) High Income countries (28)
Variable Mean Std. Dev. Min Max
Capital Growth 2.53 1.84 -2.41 11.24Productivity Growth 1.37 1.76 -2.79 8.51Bank Credit 82.14 42.89 17.90 234.12Bank Deposits 74.42 40.11 23.10 262.40Private Credit 92.70 42.08 23.45 264.89Turnover Ratio 64.58 49.39 1.26 293.05Value Traded 45.99 56.41 0.01 258.82Market Capitalization 68.21 67.13 0.45 527.94Initial Capital 62887 22834 12845 129738Initial Income 26059 7997 5975 50096Schooling 8.76 1.93 3.27 12.25Government Size 9.64 2.96 2.98 19.53Inflation 6.23 15.53 -2.28 177.53Openness 81.05 73.73 12.15 432.08

Table 2: Correlations
Cap.
Growth Prod.
Growth Bank
CreditsBank Deps.
Private Credit
Turnover Ratio
Value Traded
Market Capit.
Initial Capital
Initial Income
SchoolingGov. Size
Inflation Openness
Cap. Growth 1.00 Prod. Growth 0.32 1.00 Bank Credit 0.16 -0.07 1.00 Bank Dep. 0.10 0.00 0.82 1.00 Private Credit 0.15 -0.04 0.91 0.78 1.00 Turnover 0.17 0.01 0.38 0.26 0.42 1.00 Value Traded 0.13 0.02 0.61 0.58 0.65 0.66 1.00 Market Cap. 0.12 0.05 0.58 0.67 0.61 0.27 0.76 1.00 Initial Capital 0.05 -0.04 0.69 0.61 0.72 0.42 0.58 0.52 1.00 Initial Income 0.07 -0.02 0.66 0.54 0.71 0.43 0.55 0.47 0.96 1.00 Schooling 0.00 0.01 0.52 0.43 0.63 0.30 0.46 0.43 0.73 0.81 1.00 Gov. Size -0.06 -0.05 -0.01 -0.01 -0.01 0.07 -0.09 -0.12 0.14 0.18 0.09 1.00 Inflation -0.18 -0.16 -0.15 -0.17 -0.18 -0.05 -0.05 -0.02 -0.10 -0.10 -0.07 -0.02 1.00 Openness 0.12 0.17 0.30 0.40 0.28 -0.04 0.28 0.54 0.31 0.20 0.10 0.00 -0.03 1.00

Table 3: The Effects of Banks and Stock Markets on Capital Accumulation Dependent variable is the growth rate of capital accumulation. The results below show the coefficient estimates for each bank measure and stock market measure combination obtained from two-step, robust GMM estimations. Each regression was run with the simple control set and with time dummies; those coefficients are not reported. P-values are in parenthesis. *,**,*** indicate significance at the 10%, 5% and 1% level, respectively.
Panel A: All countries Stock Market
Banks Turnover Ratio Value Traded Capitalization Bank Credit Bank measure 5.753*** 3.938*** 4.404***
(0.000) (0.002) (0.004) St. mkt measure 0.0904 0.687* 1.820*
(0.869) (0.0813) (0.0868) Bank Deposits Bank measure 9.037*** 5.100 4.348
(0.009) (0.117) (0.211) St. mkt measure -0.304 0.446 1.228*
(0.688) (0.223) (0.0837) Private Credit Bank measure 3.991*** 2.814** 2.095
(0.008) (0.035) (0.134)
St. mkt measure 0.155 0.478 1.625*
(0.733) (0.226) (0.068) Panel B: Low income countries
Stock Market Banks Turnover Ratio Value Traded Capitalization Bank Credit Bank measure 4.696* 4.868*** 6.384***
(0.086) (0.001) (0.000) St. mkt measure 0.386 0.398 -0.514 (0.691) (0.520) (0.715)
Bank Deposits Bank measure 6.435 5.939** 8.302** (0.131) (0.038) (0.011) St. mkt measure 0.294 0.285 -1.110 (0.751) (0.690) (0.387)
Private Credit Bank measure 3.776* 4.191** 3.939 (0.076) (0.048) (0.135) St. mkt measure 0.265 0.140 -0.858
(0.812) (0.839) (0.590) (continued)
23
Table 3 (continued) The Effects of Banks and Stock Markets on Capital Accumulation
Panel C: High income countries
Stock Market Banks Turnover Ratio Value Traded Capitalization Bank Credit Bank measure 2.440** 3.053*** 3.052***
(0.026) (0.001) (0.002) St. mkt measure 2.095* 0.831** 1.801** (0.093) (0.032) (0.048)
Bank Deposits Bank measure -0.349 2.714 3.473 (0.912) (0.137) (0.151) St. mkt measure 2.208** 1.008* 2.018** (0.034) (0.062) (0.028)
Private Credit Bank measure 3.279*** 3.353** 2.725** (0.004) (0.011) (0.037) St. mkt measure 1.282 0.620 1.718**
(0.173) (0.186) (0.014)

Table 4: The Effects of Banks and Stock Markets on Capital Accumulation: Robustness Dependent variable is the growth rate of capital accumulation. The results below show the coefficient estimates from two-step, robust GMM estimations for the all-countries sample. Each regression was run with time dummies which are not reported for conciseness. P-values are in parenthesis. *,**,*** indicate significance at the 10%, 5% and 1% level, respectively. Low income High Income VARIABLES (1) (2) (3) (4) (5) (6) (7) (8) Bank Credit 4.868*** 4.791*** 4.406*** 3.428** 3.053*** 1.337 1.186 1.648** (0.001) (0.007) (0.006) (0.016) (0.001) (0.263) (0.288) (0.043) Value Traded 0.398 0.345 0.226 0.794* 0.831** 0.584** 0.504 0.617*** (0.520) (0.625) (0.511) (0.072) (0.032) (0.022) (0.126) (0.006) Initial capital 4.430 3.743 -1.914 -1.573 -7.353*** -4.679 -6.111 -7.230*** (0.417) (0.359) (0.545) (0.564) (0.009) (0.259) (0.141) (0.001) Schooling -8.320 -6.441 -0.053 -1.926 -5.852 5.732 4.726 0.312 (0.266) (0.310) (0.990) (0.539) (0.143) (0.406) (0.403) (0.894) Govt. Spending 0.182 -0.934 -3.753 -13.39*** -12.47*** -7.512** (0.981) (0.773) (0.297) (0.007) (0.001) (0.021) Inflation -0.724 -0.109 4.287 3.135 (0.629) (0.891) (0.580) (0.697) Openness 3.855** -1.620 (0.027) (0.298) Constant -17.25 -13.58 28.93 18.53 99.23*** 72.11* 88.59** 107.1*** (0.730) (0.745) (0.289) (0.497) (0.002) (0.069) (0.036) (0.000) Observations 172 172 171 171 151 151 151 151 Number of countries 34 34 34 34 28 28 28 28 AR(2) test(p-value) 0.33 0.37 0.26 0.49 0.68 0.09 0.07 0.26 Hansen J test(p-value) 0.68 0.93 1.00 0.99 0.81 0.90 0.99 1.00

Table 5: The Effects of Banks and Stock Markets on Productivity Dependent variable is the growth rate of productivity. The results below show the coefficient estimates for each bank measure and stock market measure combination obtained from two-step, robust GMM estimations. Each regression was run with the simple control set and with time dummies; those coefficients are not reported. P-values are in parenthesis. *,**,*** indicate significance at the 10%, 5% and 1% level, respectively.
Panel A: All countries Stock Market
Banks Turnover Ratio Value Traded Capitalization Bank Credit Bank measure -0.284 -1.100 -1.276
(0.825) (0.224) (0.328) St. mkt measure 0.00232 0.371* 1.362**
(0.993) (0.085) (0.035) Bank Deposits Bank measure 2.200 0.816 0.715
(0.146) (0.495) (0.652) St. mkt measure -0.217 0.248 1.275**
(0.438) (0.215) (0.025) Private Credit Bank measure -1.324 -1.166 -2.446*
(0.285) (0.214) (0.052) St. mkt measure -0.0647 0.241 1.164**
(0.814) (0.183) (0.025) Panel B: Low income countries
Stock Market Banks Turnover Ratio Value Traded Capitalization Bank Credit Bank measure 1.184 1.249 0.609
(1.140) (0.374) (0.593) St. mkt measure 0.193 0.110 -0.00163 (0.550) (0.683) (0.998)
Bank Deposits Bank measure 2.252 3.250* 3.555 (0.262) (0.096) (0.116) St. mkt measure -0.108 -0.0986 -0.666 (0.803) (0.779) (0.286)
Private Credit Bank measure 0.709 1.158 0.899 (0.657) (0.467) (0.600) St. mkt measure 0.0949 -0.0905 -0.611
(0.862) (0.660) (0.590) (continued)

26
Table 5 (continued) The Effects of Banks and Stock Markets on Productivity
Panel C: High income countries
Stock Market Banks Turnover Ratio Value Traded Capitalization Bank Credit Bank measure -1.284 -1.015 -0.543
(1.977) (0.329) (0.692) St. mkt measure -1.541 0.666** 1.941 (1.115) (0.0328) (0.103)
Bank Deposits Bank measure -3.604 -2.899** -1.965 (0.136) (0.039) (0.157) St. mkt measure -0.454 0.774* 1.462** (0.753) (0.076) (0.037)
Private Credit Bank measure -1.258 -0.0496 0.0187 (0.609) (0.965) (0.989) St. mkt measure -0.893 0.687* 2.185*
(0.422) (0.091) (0.086)

Table 6: The Effects of Banks and Stock Markets on Productivity: Robustness Dependent variable is the growth rate of productivity. The results below show the coefficient estimates from two-step, robust GMM estimations for the all-countries sample. Each regression was run with time dummies which are not reported for conciseness. P-values are in parenthesis. *,**,*** indicate significance at the 10%, 5% and 1% level, respectively.
Low income High Income VARIABLES (1) (2) (3) (4) (5) (6) (7) (8) Bank Credit -0.276 0.0867 -0.673 -1.020 -0.533 -1.858* -2.000* -1.315* (0.769) (0.915) (0.451) (0.297) (0.476) (0.058) (0.065) (0.075) Value Traded 0.0268 -0.0290 -0.0323 -0.0873 0.545*** 0.417** 0.630*** 0.452** (0.897) (0.913) (0.917) (0.763) (0.007) (0.045) (0.007) (0.017) Initial capital 4.218** 3.687* 2.968 0.717 -0.232 1.723 1.330 -3.294 (0.013) (0.0600) (0.274) (0.597) (0.937) (0.464) (0.627) (0.401) Schooling -5.556*** -4.420* -3.164 -2.951 -3.353** -0.690 2.473 -0.958 (0.009) (0.0635) (0.237) (0.195) (0.043) (0.733) (0.418) (0.683) Govt. Spending 2.908 2.794 1.938 -5.314* -6.944* -5.849 (0.306) (0.326) (0.148) (0.066) (0.064) (0.117) Inflation -1.202* -1.147** -15.27 -3.524 (0.051) (0.010) (0.109) (0.545) Openness -0.364 1.612 (0.859) (0.474) Constant -25.37** -27.86* -24.36 -3.318 10.38 -4.191 -3.106 45.62 (0.029) (0.0944) (0.306) (0.838) (0.725) (0.853) (0.908) (0.292) Observations 172 172 171 171 151 151 151 151 Number of countries 34 34 34 34 28 28 28 28 AR(2) test(p-value) 0.51 0.56 0.44 0.43 0.96 0.74 0.10 0.37 Hansen J test(p-value) 0.56 0.89 0.96 1.00 0.81 0.95 0.99 1.00

28
Table 7: Summary of empirical results “+” indicates a positive and statistically significant effect and “0” indicates that the effect is not statistically significant.
All countries High Income countries Low Income countries
Capital Productivity Capital Productivity Capital Productivity
Stock markets
0 0 + + 0 0
Banks + 0 + 0 + 0