stone tool raw material distribution network and
TRANSCRIPT

Stone Tool Raw Material Distribution Network and Predictability Study in Southern Illinois
By
Quentina Borgic
A Thesis presentation to the
Faculty of the USC Graduate School
University of Southern California
In Partial Fulfillment of the
Requirements for the Degree
Master of Science
(Geographic Information Science and Technology)
December 2017

Copyright ©2017 Quentina Borgic
iii
Table of Contents
List of Figures ................................................................................................................................. v
List of Tables ............................................................................................................................... viii
Acknowledgement ......................................................................................................................... ix
Abstract ........................................................................................................................................... x
Introduction ............................................................................................................... 1
Significance of Stone Selected ......................................................................................... 1
Regional Geology and Selected Raw Material ................................................................ 4
Research Motivation and Goals ....................................................................................... 7
1.3.1 Chert Distribution ..................................................................................................... 8
1.3.2 Chert Types and Quarry Sites ................................................................................... 9
Related Work .......................................................................................................... 11
Lithic Prediction Studies ................................................................................................ 11
Raw Material .................................................................................................................. 12
2.2.1 Burlington chert ...................................................................................................... 14
2.2.2 Mill Creek chert ...................................................................................................... 15
2.2.3 Cobden/Dongola chert ............................................................................................ 17
2.2.4 Kaolin chert ............................................................................................................. 18
Distribution Network ...................................................................................................... 20
Research Design...................................................................................................... 22
Chert Outcrop Prediction Model .................................................................................... 22
3.1.1 Prediction Study Parameters ................................................................................... 23
3.1.2 General Area Outcrop Boundary ............................................................................ 24

iv
3.1.3 Outcrop Predictor Delineation ................................................................................ 29
3.1.4 Validation of Outcrop Prediction Study ................................................................. 35
Chert Distribution Analysis ............................................................................................ 35
3.2.1 Archaeological Site Data Collection and Tabulation .............................................. 36
3.2.2 Archaeological Site Map......................................................................................... 40
3.2.3 Distribution Analysis .............................................................................................. 43
Results ..................................................................................................................... 47
Outcrop Prediction ......................................................................................................... 47
4.1.1 Prediction Model Results ........................................................................................ 47
4.1.2 Validation of the Model .......................................................................................... 57
Distribution Analysis ...................................................................................................... 58
4.2.1 Chert Total Weight Distribution ............................................................................. 60
4.2.2 Chert Average Weight Distribution ........................................................................ 72
Discussion and Conclusions ................................................................................... 75
Limitations ..................................................................................................................... 75
Future Work ................................................................................................................... 77
Conclusions .................................................................................................................... 78
References ..................................................................................................................................... 80
Appendix A Chert Outcrop Site Component Data ....................................................................... 97
Appendix B Chert Outcrop Weight Data .................................................................................... 117
v
List of Figures
Figure 1 Stone tool types per cultural component (Illinois State Museum 2006) .......................... 3
Figure 2 Chert types, study area, and physiographic regions ......................................................... 5
Figure 3 Relevant watersheds and geologic formations in the southern half of the study area ...... 6
Figure 4 Relevant geologic formations in the northern half of the study area ............................... 6
Figure 5 Burlington chert watershed area and geologic formation ............................................... 15
Figure 6 Mill Creek chert watershed area and geologic formation .............................................. 16
Figure 7 Cobden/Dongola chert watershed area and geologic formation..................................... 18
Figure 8 Kaolin chert watershed area and geologic surface feature ............................................. 19
Figure 9 Surface exposure extent of upper and middle Valmeyeran formations ......................... 25
Figure 10 Relevant geologic formations within the Mississippian age geology (Willman et al.
1975, annotations added by author) .............................................................................................. 26
Figure 11 Cobden/Dongola watershed area modifications ........................................................... 28
Figure 12 Burlington chert watershed delineation ........................................................................ 28
Figure 13 Delineation of Iron Mountain outcrop area .................................................................. 29
Figure 14 Water accumulation polygon overlay with modern influences .................................... 32
Figure 15 Downstream creek identification .................................................................................. 34
Figure 16 Search criteria available in the Illinois CRM Report Archive ..................................... 36
Figure 17 Site locations and modern influences on archaeological sites ...................................... 42
Figure 18 Burlington chert predicted outcrop areas: (a) in Madison County; and (b) in
northwestern Monroe County ....................................................................................................... 49
Figure 19 Burlington chert predicted outcrop area: (a) in west central Monroe County; and (b) in
southwestern Monroe County ....................................................................................................... 50
vi
Figure 20 Cobden/Dongola predicted outcrop areas: (a) in the Seminary Fork Clear Creek
watershed; and (b) in Big Creek watershed .................................................................................. 52
Figure 21 Cobden/Dongola predicted outcrop area: (a) in Hogthief Creek watershed; and (b)
adjacent to the Ohio River ............................................................................................................ 53
Figure 22 Kaolin chert predicted outcrop area: (a) on Iron Mountain: and (b) in the watershed of
a tributary to Big Creek................................................................................................................. 54
Figure 23 Mill Creek chert predicted outcrop area: (a) in the Seminary Fork Clear Creek and
northern Dutch Creek watershed; and (b) in the Dutch Creek and Cooper Creek watershed ...... 56
Figure 24 Mill Creek chert predicted outcrop area in the Cooper Creek and Mill Creek
watersheds ..................................................................................................................................... 57
Figure 25 Burlington chert total weight distribution: (a) all components; and (b) Archaic
component ..................................................................................................................................... 61
Figure 26 Burlington chert total weight distribution: (a) Woodland Component; and (b)
Mississippian Component ............................................................................................................. 62
Figure 27 Cobden/Dongola total weight distribution: (a) all components; (b) and Archaic
component ..................................................................................................................................... 63
Figure 28 Cobden/Dongola total weight distribution: (c) Woodland Component; and (d)
Mississippian Component ............................................................................................................. 64
Figure 29 Kaolin total weight distribution: (a) all components; and (b) Archaic component ...... 65
Figure 30 Kaolin total weight distribution: (c) Woodland Component; and (d) Mississippian
Component .................................................................................................................................... 66
Figure 31 Mill Creek total weight distribution: (a) all components; and (b) Archaic component 67

vii
Figure 32 Mill Creek total weight distribution: (c) Woodland Component; and (d) Mississippian
Component .................................................................................................................................... 68
Figure 33 Kernel density: (a) Burlington total weight; (b) Burlington average weight; (c)
Cobden/Dongola total weight; and (d) Cobden/Dongola average weight .................................... 73
Figure 34 Kernel density: (a) Kaolin total weight; (b) Kaolin average weight; (c) Mill Creek total
weight; and (d) Mill Creek average weight .................................................................................. 74

viii
List of Tables
Table 1. Chert Type Overview...................................................................................................... 21
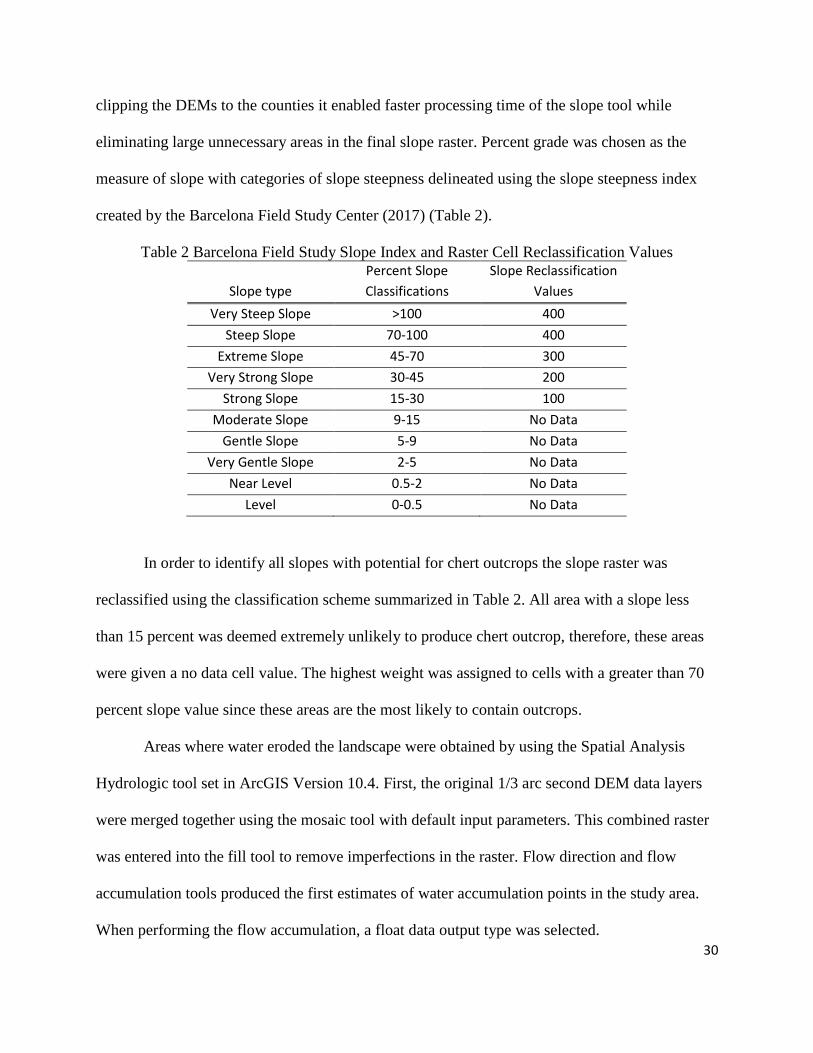
Table 2 Barcelona Field Study Slope Index and Raster Cell Reclassification Values ................. 30
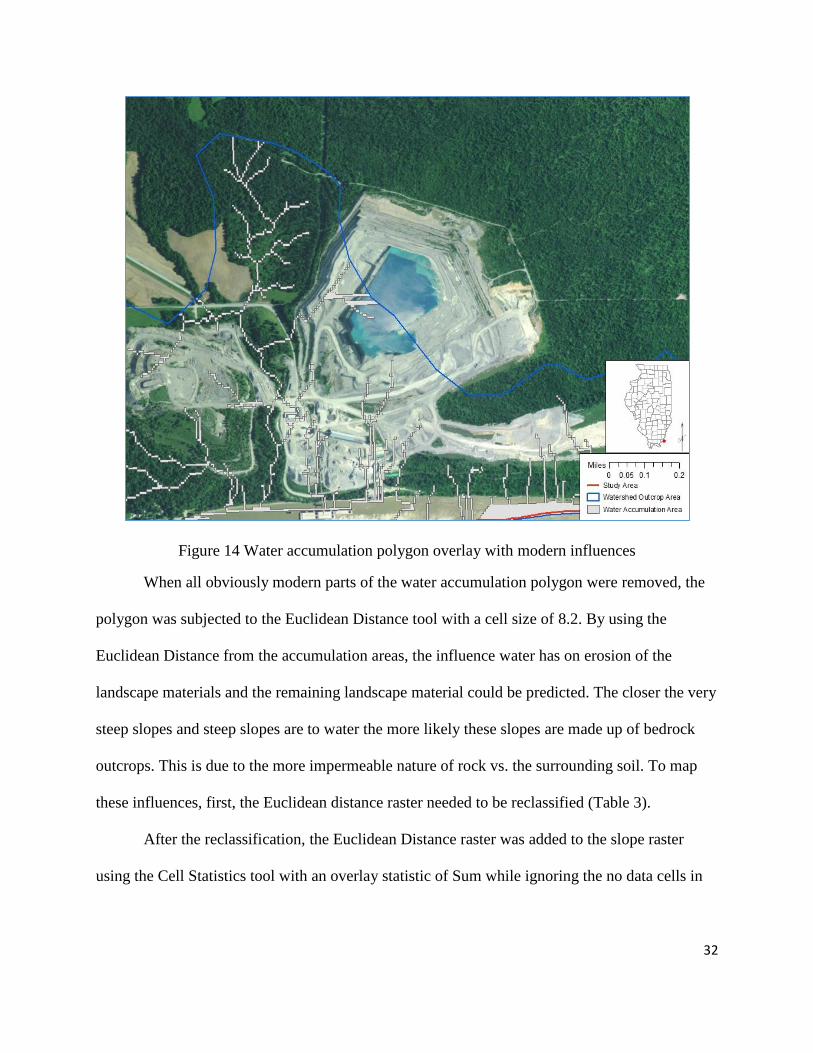
Table 3 Euclidean Distance Reclassification Values .................................................................... 33
Table 4 Combined Raster Classification Break Values ................................................................ 33
Table 5 Reports Reviewed for Relevant Data from the CRM Reports Archive ........................... 38
Table 6 Appendix A Site Type Identifiers .................................................................................... 40
Table 7 Graduated Symbol Break Values for Chert Weight ........................................................ 44
Table 8 Expression Queries for Chert Types ................................................................................ 45
Table 9 Combined Multicomponent Site Component Types ....................................................... 59
Table 10 Total Sites by Components ............................................................................................ 59
Table 11 Burlington Chert Total Weight in Grams ...................................................................... 69
Table 12 Cobden/Dongola Total Weight in Grams ...................................................................... 69
Table 13 Kaolin Total Weight in Grams ....................................................................................... 70
Table 14 Mill Creek Total Weight in Grams ................................................................................ 71
Table 15 Number of Sites by Chert Type and Component ........................................................... 71

ix
Acknowledgement
I would like to thank the Illinois State Archaeological Survey for their approval to access to the
Illinois CRM Reports Archive. Without their approval, this research would not be possible.
Additionally, I am grateful for the help I received from the USC teaching staff for all their help
in completing this work.
x
Abstract
Stone tools and their waste products, due to their durability and their importance to everyday
prehistoric life, are key elements found in archeological sites. By knowing the locations of the
stone outcrops and the distribution of the stones deposited in archaeological sites, researchers
will attain a clearer understanding of prehistoric people’s daily lives. In this study four stone
materials, Burlington chert, Mill Creek chert, Cobden/Dongola chert, and Kaolin chert, are
tracked from their outcrop location in southern Illinois to the archeological sites where
prehistoric peoples deposited them. The raw material taken from these outcrop areas has been
found as much as 100 miles away even when other sources of chert are closer. This is evidence
of the choices made by prehistoric peoples for one chert type over another.
This research was conducted in order to understand the stone material selection process,
the distance prehistoric people will go to obtain a specific chert type, and the temporal affiliation
of these choices. Included in this study is an endeavor to find the most probable outcrop areas for
each chert type. The outcrop prediction model broke down the landscape characteristics
including slope, waterways, and geology and identified the areas of highest probability of finding
these cherts. The research also sought to identify the distance chert was transported from its
outcrop location. By using archaeological site chert data, the distance that the outcrop material
was transported in the study area was identified. Additionally, a distribution pattern of the
material across the landscape shows areas where each chert type was more heavily concentrated.
Finally, by researching the distances and distribution of chert during specific cultural
components, inferences made by archeologists concerning the distribution of these specific
cherts are proven.

1
Introduction
The answers sought by this thesis are relatively simple ones, but ones that have implications
throughout the field of archeology. Where did our prehistoric ancestors obtaining the raw
material to make stone tools? How far away from the stone outcrop was the raw material
dispersed by prehistoric persons individually transporting the material or trading for the
material? In addition, how and why did the dispersal change through time? As these questions
relate to geographical extents, spatial distribution, and changing distributions through time, GIS
applications are key to finding the answers.
Significance of Stone Selected
The raw material is identified by archaeologists in documents by the term lithic when it is
made into stone tools, when it becomes waste material discarded during the tool making process,
or when it is modified by humans in any way. The importance of lithics on an archeological site
cannot be understated, since lithics are one of the few artifacts left to find due to their durability.
As a predominate prehistoric tool making raw material, chert, plays a vital role in the economics
and distribution network in areas now known as Southern Illinois.
Chert is sedimentary rocks composed primarily of microcrystalline quartz (Luedtke, 1992).
Prehistoric people moved chert from the source locations to their final destinations, the
archeological sites found today. At some point in the transportation or deposition processes,
these cherts were modified by humans, making them lithics. During this process, specific chert
types were chosen over others. As each specific chert type moved across the landscape and was
transformed into lithics made out of chert, they created distribution patterns. The distribution of
each specific type changed as the selection process and desirability changed over time.

2
By analyzing chert outcrop areas and distribution patterns, this research identifies regions
with higher and lower concentrations of a particular chert type made into lithics during a specific
cultural component. Components in the state of Illinois include Paleoindian (prior to 10,000
years ago), Archaic (10,000-3,000 years ago), Woodland (3,000-1,250 years ago), Mississippian
(1,100-550 years ago) and Late Prehistoric (550 years ago to European contact) (Illinois State
Museum 2000). This study only includes archeological sites with Archaic, Woodland, or
Mississippian cultural materials. Paleoindian and Late Prehistoric components are not included
here due to their limited appearance in the study area. The study area was chosen because of its
natural boundaries consisting of the Mississippi River on the west and the Ohio River on the
east. The northern extent was determined in order to limit the study area to the southern part of
the state while keeping in mind the Archaeological site reports are filed by county.
Each time component included in this study had distinctive cultural components and
hunting tools as shown in Figure 1. The Archaic component is distinguished by its hunter
gatherer population who use atlatls to kill their prey. Atlatls are dart throwers with darts that are
typically smaller in size and require less raw material to produce than the previously utilized
spears.
The Woodland component was a transition period from hunter gatherers to farmers. In
this time period, the first bow and arrows were used along with the first ceramic containers to
store goods. As with the transition from Paleoindian to Archaic, the hunting tool size was
generally reduced although farming tools required larger raw material pieces than hunting tools.
Additionally, long distance trade and trade networks were established. The final component
included in this study is the Mississippian. The Mississippian time period saw a greater reliance

3
Figure 1 Stone tool types per cultural component (Illinois State Museum 2006)
on farming, mound building on an expansive scale, the building of earthworks, the formation of
cities, and the creation of very finely crafted artifacts some of which are made from chert.
Given the aforementioned temporal needs for stone tools, a general trend in size of raw
material needed to make each tool is established. Hunting tools were gradually reduced in size
from the spear point to the dart point and eventually to the arrow point (Figure 1). Therefore, a
smaller piece of raw material was utilized to produce an arrow point than a spear point. With this
in mind if the population remained the same, prehistoric peoples would use less raw material as
time progressed for hunting tools.
Raw material used for farming, on the other hand, increased from no tools used in the
Archaic component to numerous tools used in the Mississippian component. These farming tools
are significantly larger than the hunting tools and their production requires larger non-fractured
pieces of chert (Figure 1). Raw material with large size and consistency of composition was of
Farming Hoe

4
high importance for prehistoric farming and was transported long distances. Two chert types that
consistently contain these attributes are included in this study.
Regional Geology and Selected Raw Material
In Illinois, the geology is heavily dependent on the extent of glaciation. Most of the state is
in the Central Lowlands physiographic region, identified in Figure 2. The Central Lowlands were
formed by till plains of seven distinctive glacial extents. These till plains consist of material
washed out from the glaciers as the glaciers melted. The material, consisting of rock and
sediment, formed thick layers on top of the bedrock. The buildup of material makes accessing
native raw material difficult in glaciated areas. Additionally, rock in the glacial till is almost
impossible to identify since it has been transported over long distances from unknown
geographic origins. The remainder of the state was unglaciated. In the south, there are two large
unglaciated regions, the Interior Highlands and the Gulf Coast Plains. The last small
physiographic region in the state is made up of the Ozark Plateau, which occurs in three small
sections that border the Mississippi River.
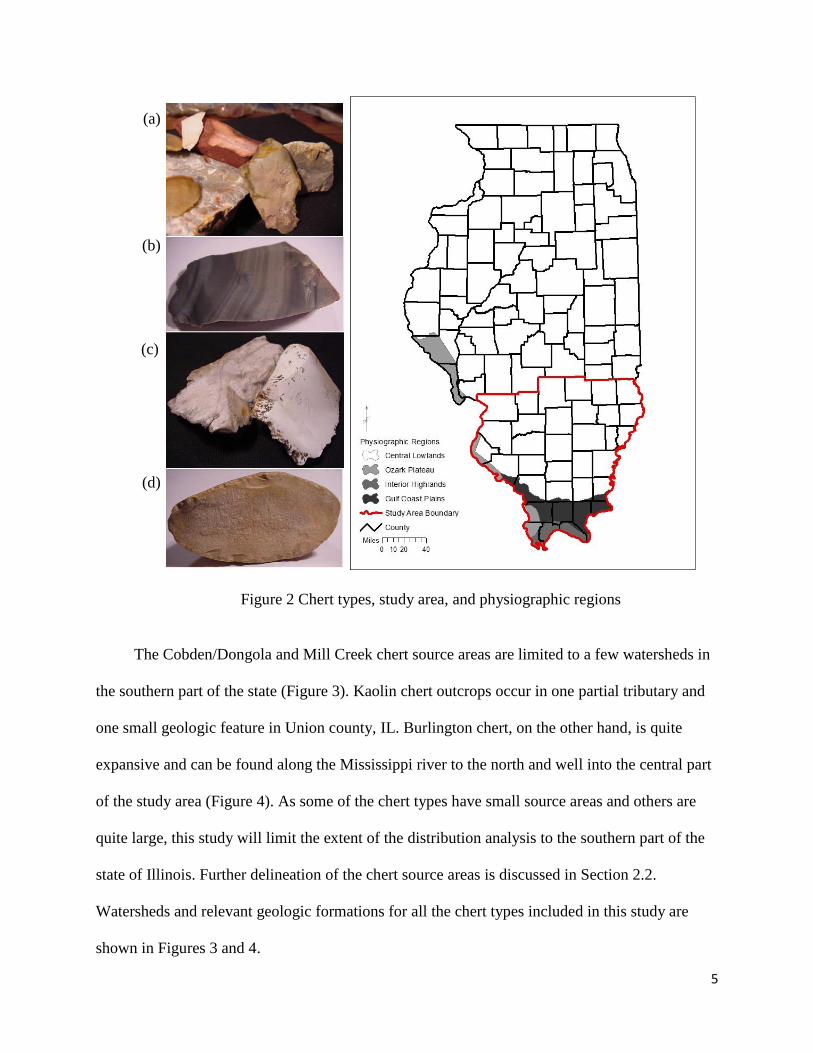
The four types of raw material selected for this study were Kaolin (Figure 2a),
Cobden/Dongola (Figure 2b), Burlington chert (Figure 2c), and Mill Creek (Figure 2d), which
are representative of both the glaciated and unglaciated regions. Kaolin, Cobden/Dongola, and
Mill creek chert are exposed in the unglaciated portions of Illinois, the Gulf Coast Plains, Interior
Highlands, and the Ozark Plateau. Burlington chert is the only type in this study that outcrops in
both the glaciated, Central Lowlands, and unglaciated, Ozark Plateau, regions. This chert type is
found in unglaciated areas due to the scouring of the Mississippi river down though the glacial
till exposing bedrock at the edge of the floodplain (Figure 2).
5
Figure 2 Chert types, study area, and physiographic regions
The Cobden/Dongola and Mill Creek chert source areas are limited to a few watersheds in
the southern part of the state (Figure 3). Kaolin chert outcrops occur in one partial tributary and
one small geologic feature in Union county, IL. Burlington chert, on the other hand, is quite
expansive and can be found along the Mississippi river to the north and well into the central part
of the study area (Figure 4). As some of the chert types have small source areas and others are
quite large, this study will limit the extent of the distribution analysis to the southern part of the
state of Illinois. Further delineation of the chert source areas is discussed in Section 2.2.
Watersheds and relevant geologic formations for all the chert types included in this study are
shown in Figures 3 and 4.
(a)
(b)
(c)
(d)

6
Figure 3 Relevant watersheds and geologic formations in the southern half of the study area
Figure 4 Relevant geologic formations in the northern half of the study area

7
Research Motivation and Goals
There are two main problems plaguing current research methods, which this research
attempts to overcome by producing a viable study on raw material outcrops and lithic
distributions. First, most previous research identifies only general area information on outcrops
without attempting to identify the most probable place chert outcrops occur (see Section 3.2 for
previously conducted research). Second, state and federal regulations dictate which projects
require archaeological assessment, testing, and mitigation. This leaves large areas unsurveyed,
untested, and open for destruction by any project not fitting the regulatory guidelines. By using
the methods employed in this study, a more complete picture of chert outcrop areas and lithic
distribution patterns over three distinct cultural components were produced for the southern part
of Illinois.
This research in essence has two parts: (1) a chert outcrop prediction study; and (2)
distribution analysis of lithic made from chert. The distribution analysis utilizes archaeological
site’s lithics data to determine the extent and volume of specific chert types found in
archaeological sites distributed across the landscape in the Archaic, Woodland, and
Mississippian cultural components (Sections 1.3.1, 2.3, and 3.2). Next, a prediction study was
employed using geographic features in order to identify the most probable locations where chert
outcrops occur (Sections 1.3.2, 2.1, 2.2, and 3.1). Both parts of this study are integral to
determining the way prehistoric humans utilized their landscape and the choices they made when
selecting lithic raw material.
To limit the confusion in this document, from this point forward chert and lithics made
out of chert will be identified using the term chert. Additionally, the combination of descriptors

8
is not a significant change since the material in both cases is the same as just the shape of the
material changed.
1.3.1 Chert Distribution
Archeological site data was used to determine the distance a piece of chert was moved
from its outcrop location. Additionally, the spread of each type of chert was obtained by
analyzing the distribution pattern from data recorded at archaeological sites. Areas where chert is
heavily deposited in archaeological sites or areas where chert is absent was revealed by studying
the distribution patterns of each chert type from different components.
As a part of the distribution analysis, chert counts and weights were collected from
reports found in the CRM Report Archive (ISAS 2017). These data were collected for specific
chert types from Phase II and III archaeological reports for the Archaic, Woodland, and
Mississippian cultural components (Appendices A and B). Multiple reports were used in this
study for sites located inside the area outlined in red in Figure 2 and recorded in the reference
section at the end of this report.
A less biased picture of the chert migration was obtained by using Phase III site reports
which are known as mitigation phase reports and Phase II reports which are known as testing
phase reports. Both phases encompass subsurface excavation, which reveals and includes
subsurface artifacts in the context of the archaeological feature. Phase I reports include only
surface collection and limited shovel testing with no known association with specific feature
attributes or fully entailed artifact assemblages.
Imagery was created from the plotted archeological site data to show the dispersal of
chert in the Archaic, Woodland, and Mississippian cultural components. Additionally, this
imagery data was segregated by the individual chert types included in this study. All imagery

9
from the same chert type was analyzed to reveal how chert distributions varied over time as well
as space. From this, inferences made by other archeologists and explored in Sections 2.2.2
through 2.2.4 were proven.
1.3.2 Chert Types and Quarry Sites
During this research, numerous periodicals were identified which discussed chert types
from across the Midwest. Most of this information is tucked into archaeological site reports and
geologic studies, although some researchers made a concerted effort to limit their discussions to
chert types. One thesis written by Koldehoff (1985) has been identified as one of the best studies
on lithic raw materials in Southern Illinois for its time. This is in part due to limited compiled
research on the subject. This research does contain information on chert types but like so many
others, it does not identify anything beyond a general area where the raw material can be found.
Unlike other studies, this thesis study pared down the larger general area of occurrence identified
by previous researchers into the most probable area where a specific type of chert can be found.
By producing a prediction map for the most probable raw material locations, future
researchers can conduct field reconnaissance with the intent of finding new prehistoric chert
quarry sites. After locating and studying a sufficient number of quarry sites, questions can be
answered pertaining to the process prehistoric people used to reduce the raw material into a
transportable form. Based on the material left at the quarry site, assumptions can be made about
the potential volume of material transported out of the quarries.
Since the author performed limited previous field reconnaissance pertaining to chert
sample collection in the state of Illinois, this reconnaissance was put to good use (Borgic 1999,
2000). As identified in the previous paragraph, this step would normally be taken after the
predictability study is completed. In so doing, the area of reconnaissance is limited and the field

10
research in essence validates the prediction study. Since the author’s reconnaissance work has
already been performed on a limited scale, it was used to validate the prediction study.
The following chapters will include information on related works, the research design for
this thesis, the results of this work, and the conclusions. The related works section, Chapter 2,
outlines the previous research on the four chert types in this study and will give detail on the
chert type’s physical and geospatial attributes. Additionally, Chapter 2 discusses distribution
inferences made by archaeologist for each chert type. The methods used to produce the final
outcrop prediction surface and chert distribution analysis are discussed in Chapter 3.A detailed
account of all the parameters and tools are included. Next the results of this work are presented
in Chapter 4. Maps are presented for each chert types distribution analysis per component along
with the prediction model for all chert types. Finally, Chapter 5 gives a brief summary and
describes the limitations of this study and the potential for future work.

11
Related Work
As the following sections will show, this research includes parts of many previous works.
Previous studies on chert exploitation include research on chert identification, geologic outcrop
locations, and archaeological site and chert quarry site prediction studies. This research combines
some of the elements from the works presented below along with original research on the topic
of stone tool raw material outcrops and distribution in Southern Illinois.
Lithic Prediction Studies
Few relevant articles were found concerning lithic predictability models. Two articles,
Barriento et al. (2016) and the Clarkson and Bellas (2014), use interpolation models based on
lithic raw material found at cultural resource sites. After producing the models, Barriento et al.
(2016) used known lithic outcrop areas to check their interpolation models. Clarkson and Bellas
(2014) utilized their model to check known outcrops, and used an interpolation model to perform
field reconnaissance to find unknown resource areas.
Following the lead of previous lithic predictions models, this prediction study was
validated by comparing it to a reconnaissance study. The author utilized her reconnaissance
study collecting raw material samples at specific geographic locations. Data from two separate
reconnaissance studies recorded 22 total chert types found in Illinois. Borgic (1999) presented 10
chert types, while Borgic (2000) presented 12 different types along with the chert geologic
formation data.
One prediction study, which is not only relevant in terms of factors used in the
predictability study but also for the chert outcrops investigated, was written by Chad Goings
(2013). This article employs distance from riverine networks, formerly identified outcrop areas,
12
slope, relief, and depth to bedrock. All of these factors except depth to bedrock were used in the
current study to determine the most probable chert outcrop location. Riverine networks are one
of the key components used to identify lithic resource outcrops in the central portion of the U.S.
due to waterways cutting through the soils and exposing the bedrock underneath. Slope is the
second significant factor since steep slopes specifically next to creeks and rivers usually indicate
potential rock outcrops.
Goings (2013) breaks down the raw material outcrop areas in his study into subtypes in
order to identify specific raw material outcrops. He uses well logs with geologic formation
information to assists in his prediction study of specific raw material outcrops. Barriento et al.
(2016) and Clarkson and Bellas (2014), who were only interested in outcrops not specific types
of stone tool raw material outcrops, did not include geologic formation information recoded in
well logs. As there are several good sources, which identify the general areas of specific raw
material outcrops, there was no need to utilize well cores for this research.
The following section will identify the four chert types included in this study.
Discussions will include not only the physical description of each chert type but also the general
consensus of where these chert types outcrop. Additionally, information is conveyed as to which
cultural components are thought to exploit the raw material more heavily.
Raw Material
The four distinct chert types, Burlington, Cobden/Dongola, Kaolin, and Mill Creek chert,
are the basis for this study. All of these types have distinctive physical features, abundance,
desirability, and source location areas. The Cobden/Dongola and Mill Creek chert source areas
are limited to a few watersheds in the southern part of the state. Kaolin chert outcrops in two
very limited areas in the southernmost part of Illinois. Burlington chert, on the other hand, is

13
quite expansive and can be found along the Mississippi river in several states. Since Burlington
chert outcrop areas are quite extensive, the chert predictability study for Burlington chert will be
limited to outcrop locations within the study area.
As can be seen in the paragraphs below, the chert types are not only different between
types but also have a variety of differences from one chert specimen to another within a single
type. This may cause confusion when the lithics are cataloged. Given these limitations, it is
important to understand that these specific chert types were selected for this study because they
are exceedingly well known by archeologists in the area and they have a low likelihood of being
identified as originating from another raw material source. Additionally, the geographic extent
and location of each chert type described below for the most part is well established even if the
geographic formations in which they occur are not.
Emerson and McElrath (2000) discuss extensively the implications of misidentified chert
sources, misidentified geologic formations of origin, and the effects of each on the
archaeological record. They specifically convey the importance of the location of origin over the
formation of origin in relation to the archaeological record. In essence, this means that the
location where an outcrop occurs is more important than what geologic formation the chert
originates from.
As it should be noted here, color and texture are both subjective qualities. Two people
looking at the same piece of chert can identify it using a different color and textural description.
The important thing to remember is that the professional archeologist, despite the color or texture
description, can identify the chert as a specific type coming from a specific source location. The
following is an amalgamated description from other archeologists concerning the outcrop and
use of each chert type included in this study.

14
2.2.1 Burlington chert
The geologic formation in which Burlington chert is found is an early Mississippian aged
limestone called Burlington Limestone. In Illinois, this formation is exposed along the
Mississippi river from Quincy, Adams County, to near Alton, Madison County and also in
Monroe county (Willman et al., 1975). Within Burlington limestone two types of chert are
prehistorically known to be quarried in Illinois: Burlington chert and Grime Hills chert.
Burlington chert can be found in nodular, tabular, or bedded form in creeks and bluff lines along
the Mississippi river (Figure 5). It comes in a variety of colors, and has been described as being
“white to light grey...yellowish and blackish” (Morrow, 1988) “light gray to bluish grey...pale
brown to white” (Odell, 1984) and “white to tanish” (Emerson, Milner, and Jackson, 1983).
Crinoid Fossils, Brachiopods, and Bryozoa are found in some Burlington cherts giving it a coarse
texture. Because of the inclusion or exclusion of fossils, Burlington’s texture ranges from fine-to
coarse-grained. The non-fossiliferous fine grained chert was sought after for tool production.
This is due to fossils in chert causing unpredictable fractures in the material during the tool
making process.
Burlington chert has previously been included in a quarry site prediction study in Iowa by
Chad Goings (Goings, 2013). He identified probable Burlington chert quarry sites in the counties
of Henry, Jefferson, Van Buren, Lee, and Des Moines counties, IA. In addition to the outcrop
locations identified in Goings (2013) study and the outcrop locations identified previously in this
section, Burlington chert can be found in Missouri and other locations in Iowa along the
Mississippi river. As Burlington chert is quite extensive with a wide range of quality no
assumptions were made about its changing distribution across the landscape or its presence in
each cultural component.
15
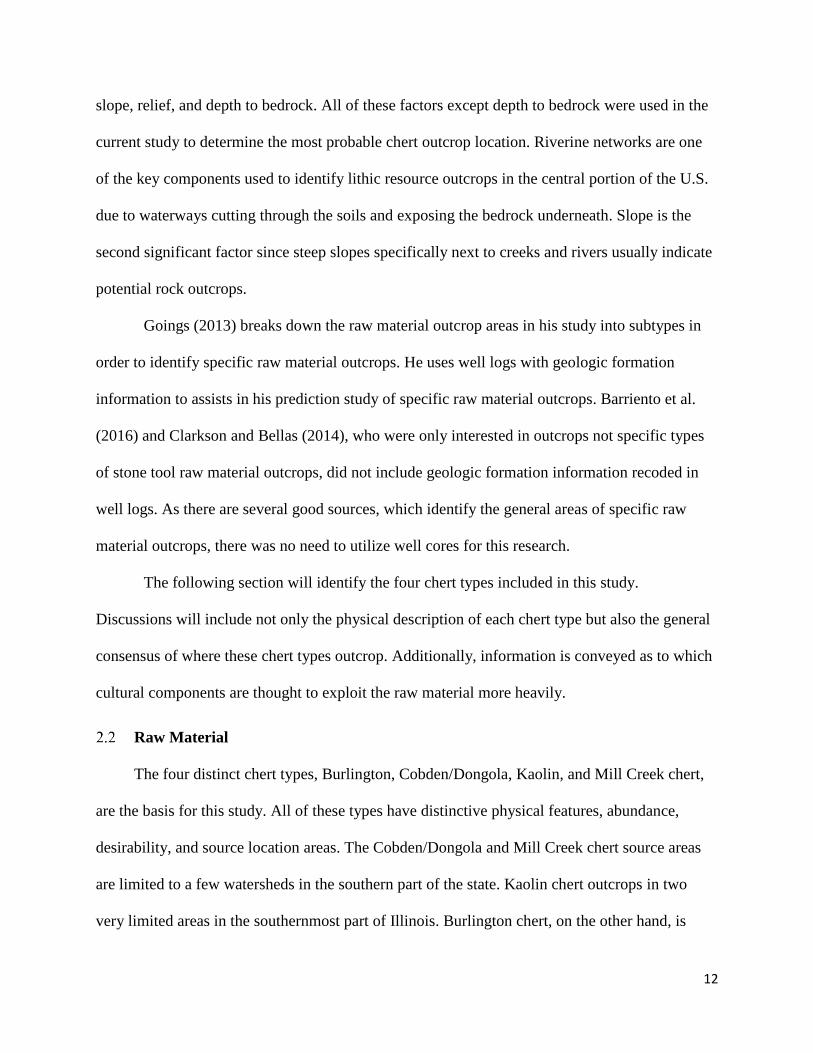
Figure 5 Burlington chert watershed area and geologic formation
2.2.2 Mill Creek chert
Recent studies suggest that Mill Creek chert is formed in the Warsaw-Salem Formation;
formerly it was thought to originate from Keokuk limestone (Spielbauer, 1984). The Warsaw-
Salem formation is of Mississippian age. It is exposed along Mill Creek, Lingle Creek, and
Cooper Creek in Union and Alexander counties (Morrow, 1988) (Figure 6).
Mill Creek chert has a rough and weathered exterior, which is generally a rusty brown.
The exterior can also be grey or brown, but these colors are not as common as the rusty brown
color. The interior of Mill Creek chert comes in a variety of colors and is described as “Grayish
tan to brown” (Spielbauer, 1984) and “blue beige, grey, yellow, pink or reddish brown”
(Morrow, 1988). A typical banded pattern occurs in Mill Creek chert. The bands run parallel to

16
the outer surface of the lenticular nodule. The interior of the nodule is coarse in texture, but the
knapping characteristics are favorable.
Figure 6 Mill Creek chert watershed area and geologic formation
Archaeologists have identified an increase in the occurrence of Mill Creek chert in
archaeological sites where evidence of farming is present (Cobb, 1989). Chert requirements for
stone farming hoes include a shape that is two to three times larger in terms of length than width,
and large enough in terms of size to produce a chipped stone implement with a length roughly 30
cm or more, limited fractures, and roughed structure. As Mill Creek chert is one of the few types
that consistently have these attributes, it was widely selected for, transported, and deposited in
archaeological sites during the Woodland and Mississippian components. Mill Creek chert was
spread across the landscape for long distances to include appearing in the lithic assemblage at
Aztalan State Park approximately 630 miles to the north of the outcrop area (Hollon, 2011). As
part of this research, the increase of Mill Creek chert in archaeological sites that practice farming
was proven by analyzing the distribution patterns.

17
In their study the practicality of Mill Creek hoes for farming in prairie soil, Hammerstedt
and Hughes (2015) performed experiments using these hoes to break up an unplowed plot of
land. The results showed that the Mill Creek chert hoes were very effective in cultivation thus
proving the durability of the chert and reason why prehistoric people used Mill Creek chert so
heavily during times when farming was initiated.
2.2.3 Cobden/Dongola chert
The St. Louis limestone is a Mississippian aged limestone (Willman et al., 1975). Two
Illinois chert types outcrop in St. Louis limestone: St. Louis chert and Cobden/Dongola chert.
Cobden/Dongola has historically been called Dongola, Dongola series, Anna, Hornstone, St.
Louis Ball chert, and Cobden (Morrow, 1988; Hofman and Morrow, 1989). In Indiana, similar
chert outcrops are still known as Hornstone or Wyandott chert. Cobden/Dongola usually has a
weathered buff colored cortex with a smooth fine-grained interior. The interior generally is a
blue-grey color, but it can also be found as Blue-black (Speilbauer, 1984) and tan (Morrow,
1988). Cobden/Dongola chert can be found as nodules or as bedded chert. The round nodular
chert frequently is banded with alternating dark and light bands. Historically the term Dongola
was used to describe the banded chert, while Cobden was used for the unbanded chert. Since the
two types were found to be from the same outcrop, they are now lumped together (Spielbauer,
1984). Cobden/Dongola outcrops in this study area near Dongola Illinois downstream from Big
Creek, along Clear Creek near Cobden IL, and in the eastern Shawnee Hills (Koldehoff, 1985;
Morrow, 1988) (Figure 7).

18
Figure 7 Cobden/Dongola chert watershed area and geologic formation
Cobden/Dongola was utilized by all of the cultural components in this study. Although, it
has been assumed that this blue grey chert was a preferred chert type during the Middle
Woodland time period. Morrow, Elan, and Glascock (1992) disagree with this due to the lack of
testing. The current study proves that Woodland peoples in southern Illinois did use blue grey
chert more heavily than Archaic or Mississippian peoples.
2.2.4 Kaolin chert
The Vienna Limestone formation and a secondary geologic deposit of unknown origin
have been noted as the origin of Kaolin chert. The uncertainty of the formation’s origin arises
from the degraded nature of the formation. The Vienna limestone formation is the earlier derived
origin of Kaolin chert (Spielbauer, 1984).
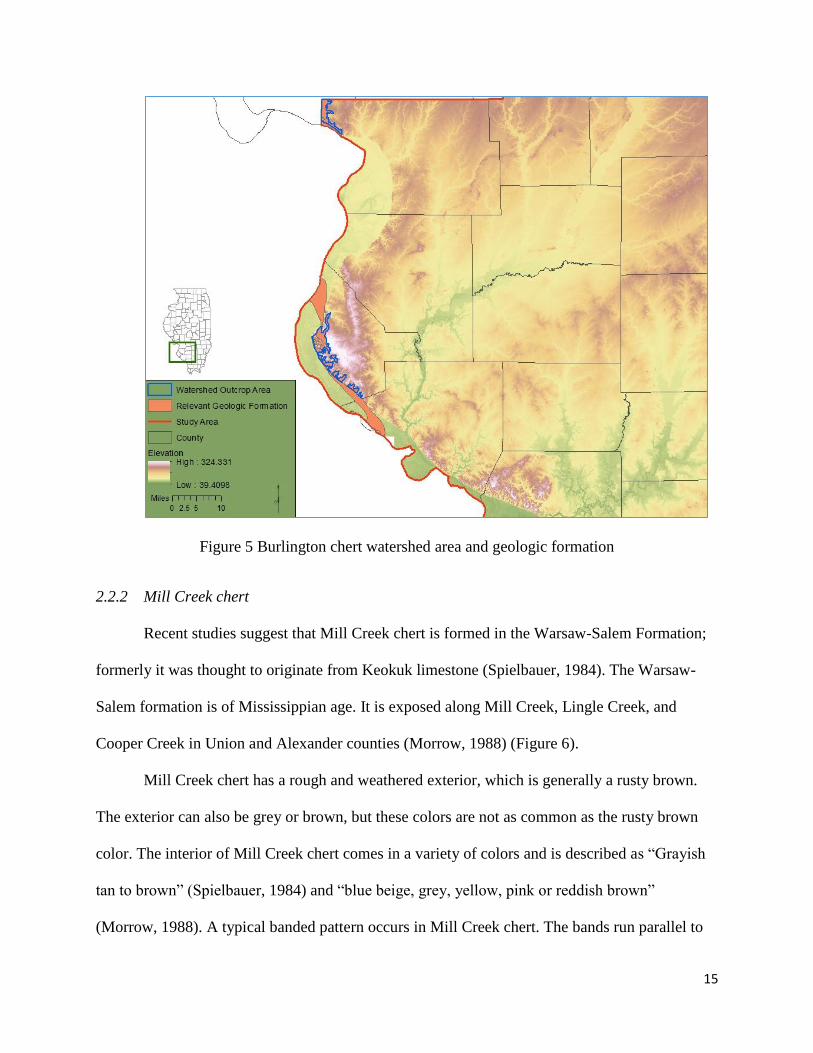
The known Kaolin outcrop areas are at Iron Mountain, a ridge that runs north and south
found approximately 4 miles west of Cobden, IL and on a tributary of Big Creek in Union
County (Figure 8). Some Kaolin chert has been called noviculite and chalcedony because of its
19
high quality (Hofman and Morrow, 1989). Kaolin can be semi-translucent with color ranges of
reds, pinks, tans, creams, buffs, yellows, purple, brown, orange, black, and white. A web like
pattern of banding occurs because of light refracting off of fractured edges or because of a more
porous area being stained. The texture of Kaolin chert is coarse-to fine-grained. Kaolin’s cortex
has a pitted texture with a yellow, white, or black color (Spielbauer, 1984). Nodules of Kaolin
chert are lenticular or discoidal (Morrow, 1988; Hofman and Morrow, 1989).
Figure 8 Kaolin chert watershed area and geologic surface feature
Kaolin chert was heavily utilized during the middle Woodland and Mississippian
components. This is due in part to the large raw material size, good workability, and range of
striking colors. An archaeological investigation of the Iron Mountain quarry site revealed the true
nature of how the chert was obtained. Prehistoric peoples predominantly dug large pits to unearth
the Kaolin chert instead of collecting it from outcrops or streambeds (Billings, 1984). This would
entail significantly more effort to obtain the chert. As with Mill Creek chert, the implication is
that Kaolin chert due to its inherent attributes was utilized for farming. In addition, Kaolin chert

20
was made into large decorative items because of its striking colors and patterns. Through
analysis of the distribution of Kaolin chert over time, it is proven in this study that Woodland and
Mississippian peoples in southern Illinois used this chert more than their predecessors.
Distribution Network
Models pertaining to the procurement of raw materials have been applied to archaeological
sites and chert exploitation in the past. The Neutral model executed by Brantingham (2003)
utilizes an idealized spatial analysis where all materials are equally spaced on the landscape.
Brantingham’s (2003) study indicates that the selection of lithics found at an archaeological site
is not a product of selection. Instead, it is a product of random selection of raw materials from
random wanderings of prehistoric peoples across the landscape. This model may have some
validity but given the choice between two sources of material, humans will always have a
preference for one over another. A paper concerning the selection for blue-grey chert by
Morrow, Elam, and Glascock (1992) was prompted by the choice of prehistoric peoples choosing
one chert type over another. Additionally, this research shows the results of the choices made by
a collective group of people in three distinct cultural components.
Geospatial models proposed by Beck (2008) and Wilson (2007) assist in calculating the
selection process of raw materials by prehistoric peoples. Beck (2008) uses a distance transport
model to prove that in areas with larger selections of raw materials a smaller raw material
acquisition range is used than in areas with limited raw materials. Wilson (2007) uses a gravity
model to determine which source of material should be utilized more than others. Both studies
are uniquely pertinent to the mode of transport and the selection of materials to be transported.
However, they leave a gap in the information as to why some raw materials are transported
21
significantly longer distances given an equal amount of resources and closer raw material
outcrops.
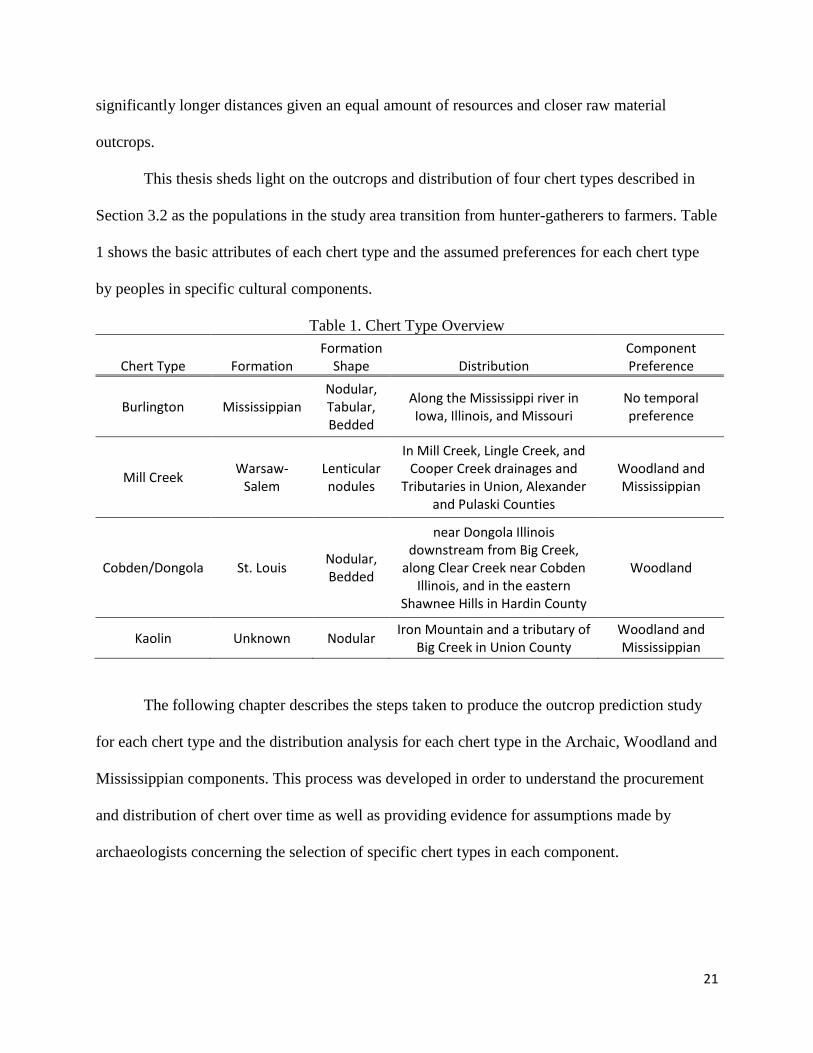
This thesis sheds light on the outcrops and distribution of four chert types described in
Section 3.2 as the populations in the study area transition from hunter-gatherers to farmers. Table
1 shows the basic attributes of each chert type and the assumed preferences for each chert type
by peoples in specific cultural components.
Table 1. Chert Type Overview
Chert Type Formation Formation
Shape Distribution Component Preference
Burlington Mississippian Nodular, Tabular, Bedded
Along the Mississippi river in Iowa, Illinois, and Missouri
No temporal preference
Mill Creek Warsaw-
Salem Lenticular nodules
In Mill Creek, Lingle Creek, and Cooper Creek drainages and
Tributaries in Union, Alexander and Pulaski Counties
Woodland and Mississippian
Cobden/Dongola St. Louis Nodular, Bedded
near Dongola Illinois downstream from Big Creek,
along Clear Creek near Cobden Illinois, and in the eastern
Shawnee Hills in Hardin County
Woodland
Kaolin Unknown Nodular Iron Mountain and a tributary of
Big Creek in Union County Woodland and Mississippian
The following chapter describes the steps taken to produce the outcrop prediction study
for each chert type and the distribution analysis for each chert type in the Archaic, Woodland and
Mississippian components. This process was developed in order to understand the procurement
and distribution of chert over time as well as providing evidence for assumptions made by
archaeologists concerning the selection of specific chert types in each component.

22
Research Design
This research has two distinctive parts: (1) the development of the chert outcrop prediction
model; and (2) the chert distribution analysis over time. The chert outcrop prediction model
delineates the most probable locations to find the four distinctive chert types presented in this
thesis study. The chert distribution analysis determines the spread and deposition of chert in
archaeological sites during the Archaic, Woodland and Mississippian components. As both parts
of this study are spatially independent, there was no need to complete one before the other. The
correlation of each part becomes apparent when the analysis is completed and the outcrop
location is spatially correlated with the distribution of chert across the landscape. By completing
this overlay, a relationship is shown between the raw material quarried locations and the spread
of chert.
The process used to arrive at the final prediction and analysis is outlined in the following
sections. All data used for this study was either downloaded or transformed into the NAD 1983
Illinois State Plane West coordinate system. This coordinate system was chosen because the
majority of the chert outcrops and site data occur in the western part of the state. By choosing
this coordinate system, the amount of distortion was minimized for the majority of the data.
Chert Outcrop Prediction Model
Previously, researchers have written about specific chert outcrop areas, as seen in Sections
2.2.1. through 2.2.4. Unfortunately, these previous reports only include the general area of chert
outcrop. Usually this generalization identified a creek watershed, geographic feature, or linear
extent. By not identifying the most probable area of outcrop, analysis potential is limited. In

23
contrast, this research identifies the most probable locations to find the specific chert types
within the general areas identified by previous researchers.
3.1.1 Prediction Study Parameters
Historically, chert outcrop area descriptions have been vague. A significant portion of the
previous researchers chert outcrop locations are identified by written descriptions and/or small-
scale maps with hazy placement of chert outcrop indicators. Given this limitation, more weight
was given to the written description of chert outcrops when imagery was poor.
Care was taken in the process of predicting chert outcrop locations to define not only the
general areas of outcrop but also the mode of outcrop. For chert identified as occurring along a
landform only, creek data were eliminated from the potential outcrop paths. For locations where
water erosion was determined to be the source of the outcrop, slope data was weighted in
preference for high slopes close to surfaces eroded by water. High slope areas within the
geologic formation’s extent were determined to have the highest potential for outcrop locations.
This is in part due to the higher likelihood of soils to fall down a steeper slope exposing the
bedrock underneath. Additionally, in Illinois, the landform is generally flat or gently rolling. As
such, any abrupt change in the slope and elevation is a good indicator of exposed bedrock or
creeks potentially cutting into the landform. Finally, since water can carry material downstream
during flooding events the portion of the watershed downstream from the geologic outcrop was
identified as potentially containing chert.
In this study, all land with slopes less than 15 percent was determined to have very
limited outcrop potential due to the thick layer of sedimentary and glacial till deposits in Illinois.
Additionally, according to the Illinois State Geological Survey the majority of the state has an
average slope by county of less than 4.25 percent with a maximum elevation difference by
24
county of 680 ft. Given this low terrain and elevation married with the thick deposits of sediment
and glacial till, areas with less than 15 percent slope were determined to have very limited
potential for chert outcrops.
Since the data used for this study were collected in the last several decades some surfaces
are not the same as they appeared during prehistoric time periods. In order to create the most
accurate prediction model, modern construction influences when feasible were removed from the
source data. Any locations with a high probability of outcrop next to roadways were evaluated to
determine the nature of the outcrop. Additionally, any areas where obviously modern
channelization occurred were removed from the prediction surface.
3D Elevation Program (3DEP) LiDAR based 1/3 arc second Digital Elevation Model
(DEM) data layers were used to locate areas of greatest slope and those most likely to be eroded
by water. Surface exposed areas of key geologic members used in this study and identified in
Section 2.2 were delineated by the USGS Mineral Resources Division and obtained from the
Illinois Geospatial Database Clearinghouse. The watershed boundaries, identified in Section 2.2
as containing chert outcrops, were obtained from the National Hydrographic Dataset. All data
manipulation was conducted in ArcGIS.
3.1.2 General Area Outcrop Boundary
As the initial step in identifying the most probable outcrop areas, a shapefile was created
for each of the generalized chert outcrop areas based on previous researcher’s descriptions,
geologic formation surface extent outcrop boundaries, and watershed boundaries (Figures 3-6).
Since no existing shapefiles containing singular formations was available, the smallest grouping
of formations in the USGS shapefile was used. The cherts identified in this study originate from
the Mississippian system in the Valmeyeran series, with the exception of Kaolin chert’s

25
unknown origin. It was found that two geologic shapes contain these formations in the USGS
shapefile. The geologic formation groups were identified as the Middle Valmeyeran (Salem,
Warsaw, Borden, Springville Series; includes thin Mvl and Mk to the south and east) and Upper
Valmeyeran (Aux Vases, Ste. Genevieve, St. Louis Series) (USGS 2005). The extent of the two
Valmeyeran groups in the study area is shown in Figure 9. The formations included in these two
groupings are shown in Figure 10 with the chert bearing formations identified within the group.
Figure 9 Surface exposure extent of upper and middle Valmeyeran formations

26
Figure 10 Relevant geologic formations within the Mississippian age geology (Willman et al.
1975, annotations added by author)
Upper Valmeyeran
Middle Valmeyeran
Burlington Chert
Cobden/Dongola Chert
Mill Creek Chert
27
Watersheds were a delineator for Kaolin, Cobden/Dongola and Mill Creek chert outcrop
locations. The level 6 sub-watershed was used from the Watershed Boundary Dataset contained
in the National Hydrographic Dataset. By choosing the level 6 watershed boundary almost all of
the watersheds were delineated by creeks containing chert outcrops in this study. Only the
Cobden/Dongola chert watershed area in Hardin county and the Kaolin chert watershed area in
Union county required modification. Additionally, since the Burlington chert outcrop area did
not include the name of a watershed when delineating its outcrop area, a watershed boundary
area was created for it.
The Hogthief Creek watershed seen in Figure 7 was initially one branch of the larger Y
shaped Big Creek watershed. In order to use only the smaller section of the watershed identified
as containing Cobden/Dongola chert all parts of the watershed not drained by Hogthief Creek
were removed from the shapefiles. In addition to these changes a vague location along the Ohio
River was identified as containing Cobden/Dongola chert by Koldehoff (1985). A shape for this
outcrop area was determined by enclosing the two small unnamed tributaries of the Ohio River
in the area identified by Koldehoff (1985) which contain the relevant geologic member. Both of
the Cobden/Dongola watershed area modifications can be seen in Figure 11.
Burlington chert outcrops in a geologic feature created by the scouring of the landscape
by the Mississippi River. Since the Mississippi River watershed is too large to be useful in the
delineation of Burlington chert outcrop areas, a smaller watershed area needed to be delineated
to encompass the effects of water on the geologic formation. A National Hydrographic Dataset
waterway shapefile was evaluated in the area of the Burlington chert geologic formation. Any
waterway within the geologic formation surface exposure area was included in the Burlington
waterway shapefile along with any area in which a watershed crossed an adjacent geologic

28
formation and reenters the same Burlington geologic formation area. In addition, all waterways
in the Mississippi river floodplain were eliminated from the Burlington chert watershed area due
to the exceedingly large percentage of channelized waterways. A finalized Burlington chert
watershed can be seen in Figure 12.
Figure 11 Cobden/Dongola watershed area modifications
Figure 12 Burlington chert watershed delineation
29
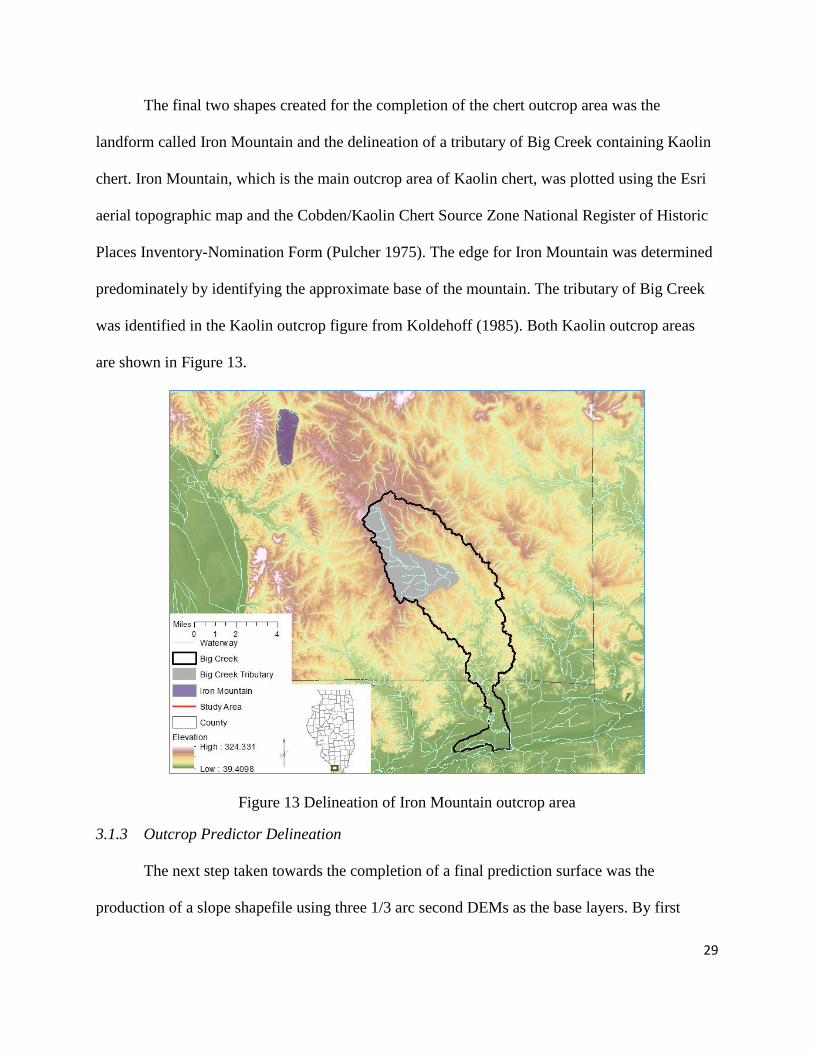
The final two shapes created for the completion of the chert outcrop area was the
landform called Iron Mountain and the delineation of a tributary of Big Creek containing Kaolin
chert. Iron Mountain, which is the main outcrop area of Kaolin chert, was plotted using the Esri
aerial topographic map and the Cobden/Kaolin Chert Source Zone National Register of Historic
Places Inventory-Nomination Form (Pulcher 1975). The edge for Iron Mountain was determined
predominately by identifying the approximate base of the mountain. The tributary of Big Creek
was identified in the Kaolin outcrop figure from Koldehoff (1985). Both Kaolin outcrop areas
are shown in Figure 13.
Figure 13 Delineation of Iron Mountain outcrop area
3.1.3 Outcrop Predictor Delineation
The next step taken towards the completion of a final prediction surface was the
production of a slope shapefile using three 1/3 arc second DEMs as the base layers. By first
30
clipping the DEMs to the counties it enabled faster processing time of the slope tool while
eliminating large unnecessary areas in the final slope raster. Percent grade was chosen as the
measure of slope with categories of slope steepness delineated using the slope steepness index
created by the Barcelona Field Study Center (2017) (Table 2).
Table 2 Barcelona Field Study Slope Index and Raster Cell Reclassification Values
Slope type
Percent Slope
Classifications
Slope Reclassification
Values
Very Steep Slope >100 400
Steep Slope 70-100 400
Extreme Slope 45-70 300
Very Strong Slope 30-45 200
Strong Slope 15-30 100
Moderate Slope 9-15 No Data
Gentle Slope 5-9 No Data
Very Gentle Slope 2-5 No Data
Near Level 0.5-2 No Data
Level 0-0.5 No Data
In order to identify all slopes with potential for chert outcrops the slope raster was
reclassified using the classification scheme summarized in Table 2. All area with a slope less
than 15 percent was deemed extremely unlikely to produce chert outcrop, therefore, these areas
were given a no data cell value. The highest weight was assigned to cells with a greater than 70
percent slope value since these areas are the most likely to contain outcrops.
Areas where water eroded the landscape were obtained by using the Spatial Analysis
Hydrologic tool set in ArcGIS Version 10.4. First, the original 1/3 arc second DEM data layers
were merged together using the mosaic tool with default input parameters. This combined raster
was entered into the fill tool to remove imperfections in the raster. Flow direction and flow
accumulation tools produced the first estimates of water accumulation points in the study area.
When performing the flow accumulation, a float data output type was selected.
31
The flow accumulation ranged from 0 to 6,584,680 m2. This prompted the use of the
raster calculator to narrow the range of data for better display. A new raster was created by
taking the Log10 of the flow accumulation raster which limited the raster cell range from zero to
just less than eight. Several different methods of classification of the data were attempted to
produce the optimum results, including several different methods of classified symbol and
stretch types. After consideration of all symbiology attempted only one appeared to show a
sufficient number of water denuded areas without limiting the raster to large rivers or including a
significant number of small fragmented segments. The selected classification type was the
natural breaks classified method with five classes.
From the five classes in the classification scheme the range of data from the top two
classes was sufficient to show the area of water accumulation. The two classes were selected for
using the raster calculation of Con("FlowAccumulationLog10",1,0,"Value >=2.082510914").
The numerical value used in this calculation is the lowest number included in the two selected
natural break classes. Finally, the raster was reclassified to only include data values above
2.082510914 leaving all other cells with no data.
After completion of this water accumulation raster, it was transformed into a polygon
using the raster to polygon tool. The simplify polygon tab was left unchecked in order to keep
the exact shape of the accumulation raster. By transforming the raster to polygon, it enabled the
removal of water accumulation points caused by modern influences. The water accumulation
polygon was then clipped to the maximum extent of all chert outcrop areas and overlaid on a Esri
aerial and Esri Topographic base map. Areas were removed from the shapefile where the water
accumulation polygon was aligned with modern ditches, overlaid on top of modern strip mines,
or run through buildings. An example of these modern influences can be seen in Figure 14.
32
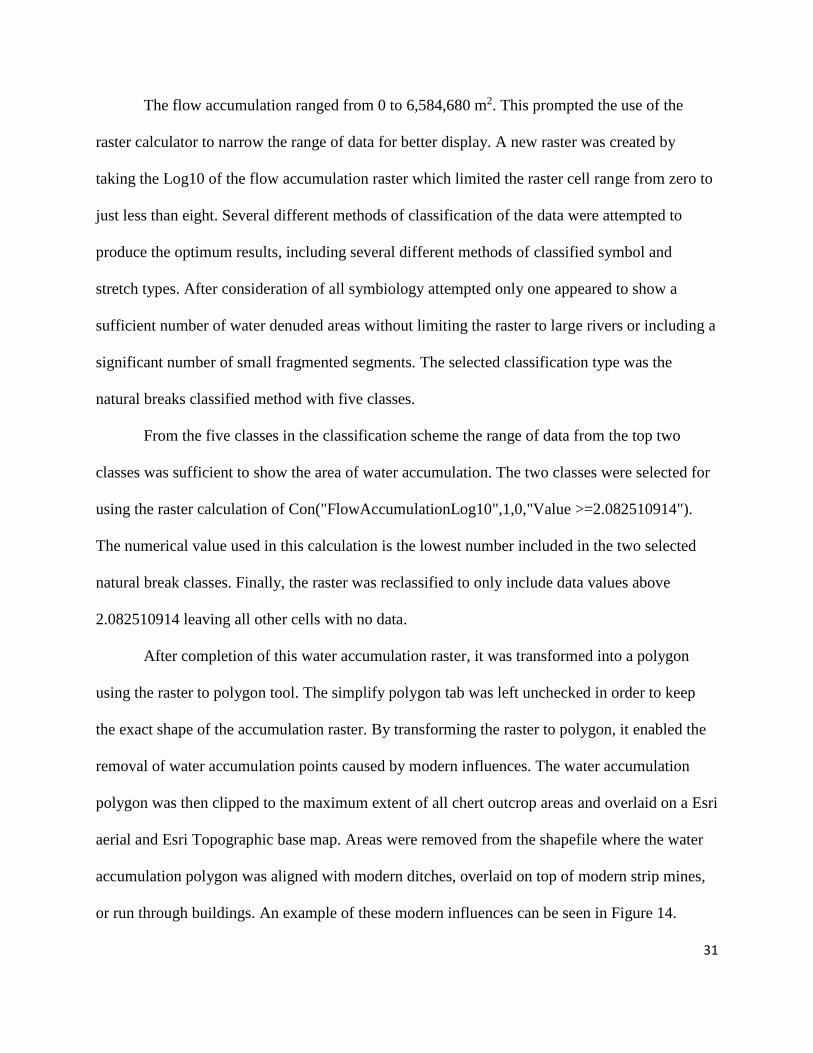
Figure 14 Water accumulation polygon overlay with modern influences
When all obviously modern parts of the water accumulation polygon were removed, the
polygon was subjected to the Euclidean Distance tool with a cell size of 8.2. By using the
Euclidean Distance from the accumulation areas, the influence water has on erosion of the
landscape materials and the remaining landscape material could be predicted. The closer the very
steep slopes and steep slopes are to water the more likely these slopes are made up of bedrock
outcrops. This is due to the more impermeable nature of rock vs. the surrounding soil. To map
these influences, first, the Euclidean distance raster needed to be reclassified (Table 3).
After the reclassification, the Euclidean Distance raster was added to the slope raster
using the Cell Statistics tool with an overlay statistic of Sum while ignoring the no data cells in
33
Table 3 Euclidean Distance Reclassification Values
Distance from
Creek in Meters
Reclassification
Values
Distance from
Creek in Meters
Reclassification
Values
0-10 25 130-140 12
10-20 24 140-150 11
20-30 23 150-160 10
30-40 22 160-170 9
40-50 21 170-180 8
50-60 20 180-190 7
60-70 19 190-200 6
70-80 18 200-210 5
80-90 17 210-220 4
90-100 16 220-230 3
100-110 15 230-240 2
110-120 14 240-250 1
120-130 13 >250 0
Table 4 Combined Raster Classification Break Values
Classification Break Values
24 124 299 404
25 199 304 409
99 204 309 414
104 209 314 419
109 214 319 424
114 219 324
119 224 399
the source datasets. The combined raster was finalized by classifying the range of cell data
identified in Table 4. All cells with values less than 24 were excluded from the dataset.
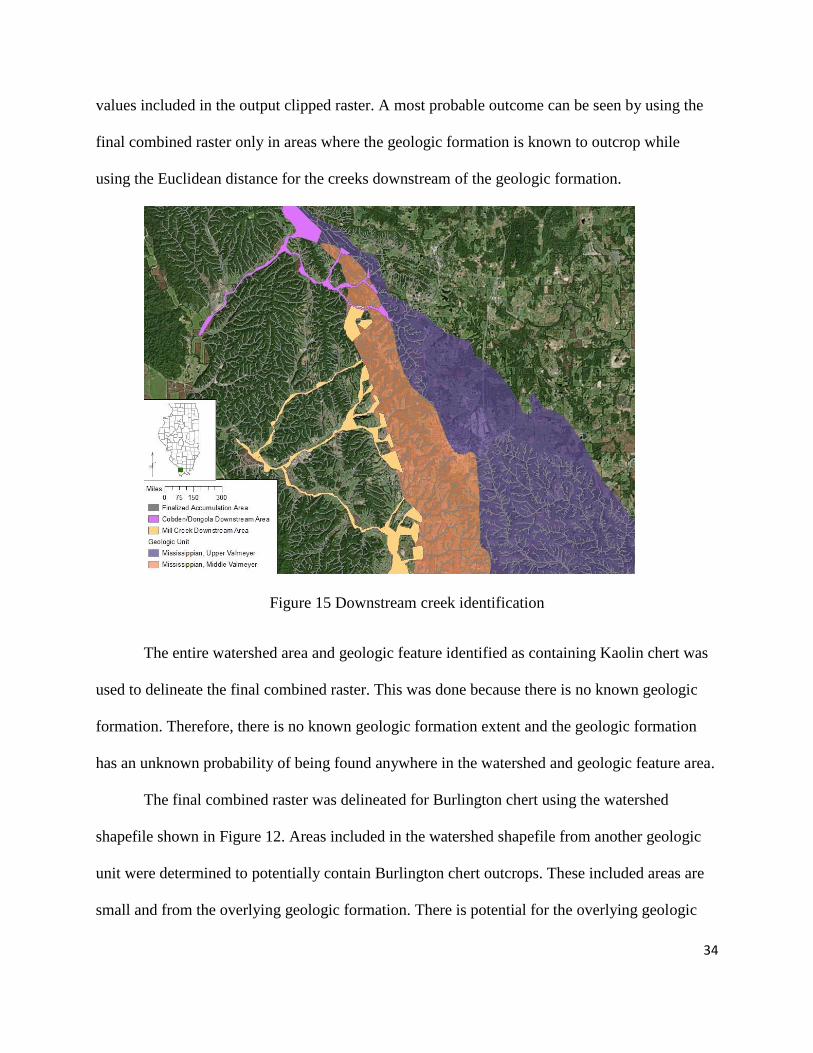
The final combined raster was used to produce the four chert types prediction model. The
use of the final raster was dependent on the availability of data on the outcrop areas for each
chert type. Mill Creek and Cobden/Dongola chert were clipped to the geologic formations extent
inside the predetermined watersheds. Then polygons were constructed to encompass only those
streams inside the watershed downstream of the geologic areas Figure 15. The Euclidean
distance raster was clipped to the downstream boundary polygons with only the closet two raster
34
values included in the output clipped raster. A most probable outcome can be seen by using the
final combined raster only in areas where the geologic formation is known to outcrop while
using the Euclidean distance for the creeks downstream of the geologic formation.
Figure 15 Downstream creek identification
The entire watershed area and geologic feature identified as containing Kaolin chert was
used to delineate the final combined raster. This was done because there is no known geologic
formation. Therefore, there is no known geologic formation extent and the geologic formation
has an unknown probability of being found anywhere in the watershed and geologic feature area.
The final combined raster was delineated for Burlington chert using the watershed
shapefile shown in Figure 12. Areas included in the watershed shapefile from another geologic
unit were determined to potentially contain Burlington chert outcrops. These included areas are
small and from the overlying geologic formation. There is potential for the overlying geologic

35
formation to be eroded away to reveal the Burlington formation underneath. Additionally, the
geologic formation in the Mississippi floodplain did not produce slope in the range used for this
probability study except for banks of modern waterways. Therefore, the floodplain was
eliminated as a potential source of Burlington chert in this study.
3.1.4 Validation of Outcrop Prediction Study
The chert samples collected and recorded during the author’s previous work were used to
validate the prediction study (Borgic 1999, 2000). All of the chert collected from these
previously conducted reconnaissance surveys was collected from road right-of-way’s or areas
where the landowner gave permission to collect the samples. Other outcrop locations were
recorded where no samples were collected. The 11 recorded locations in this previous study were
recorded on paper. For this study, the recorded locations were plotted as a point shapefile for the
chert types included in the study. The plotted locations for the previous reconnaissance survey
were overlaid onto the prediction surface to determine if the predictions accurately depicted the
real-world outcrops.
Chert Distribution Analysis
The chert distribution analysis was heavily dependent on the available site reports
containing usable chert analysis data. Archaeological reports reviewed from before the 1970s did
not include chert analysis. Chert analysis was competed for some sites reported upon in the
1970s but it was typically limited to the number of chert pieces found per chert type and/or
percent of each chert type found on individual sites. The early 1980s reports saw the beginnings
of weight data included in cultural resource reports. By analyzing weight data along with the
number of pieces of chert found it was possible to analyze chert across sites.

36
The two following subsections describe the methods of data collection and data analysis
employed in this thesis. The outcome of this distribution analysis may differ somewhat from
similar distribution analyses for the same area due to the availability of reports. This analysis is
intended to be a general overview of chert distribution in Southern Illinois in areas where data
were available.
3.2.1 Archaeological Site Data Collection and Tabulation
Archaeological site data is reported in site reports prepared with input from the Illinois
State Historic Preservation Office. Access to these reports was gained through the Illinois CRM
Reports Archive from the Illinois State Archaeological Survey. In this archive, PDFs of
archaeological site reports are searchable by a variety of variables including county, major
component, and CRM phase (Figure 16).
Figure 16 Search criteria available in the Illinois CRM Report Archive
37
To search systematically through the reports, it was determined necessary to search by
county. As the CRM Reports Archive is in essence a professional crowd sourced repository for
site reports with what appears to be little review of entries, all report entries identified with
relevant county origin were reviewed in addition to 340 reports without county affiliation. The
number of available reports in the study area per county is shown in Table 5.
Records were identified with Phase II and III archaeological data for the Archaic,
Woodland, and Mississippian components within the study area. Archaic and Woodland
components identified in the CRM Reports Archive were in some cases identified by sub-periods
of time indicated by the terms early, middle, and late. These sub-periods were identified in the
Appendix A sub-period columns to facilitate further study on this subject. Two Mississippian
sub-periods not identified in the CRM Reports Archive search criteria but identified in the PDF
reports and recorded in Appendix A are Emergent and Late. For this study, all Archaic sub-
period data for each site was combined to show a broad picture of changing chert utilization over
time. The same applied for the Woodland and Mississippian components.
The PDF from each CRM Reports Archive record, whose recorded entry appeared to
identify the sought-after criteria, was opened in windows. Additionally, reports with a title of
potential interest with limited data entered on the CRM Reports Archive record were also viewed
for potentially usable data. To determine if the sought-after data were present, a quick scan of the
document was completed. If the document was found to contain the desired chert data, it was
saved for further examination.
After all the report records were viewed and the relevant PDFs were collected, the data
was entered into an excel spreadsheet as each PDF received a thorough examination (Appendices

38
Table 5 Reports Reviewed for Relevant Data from the CRM Reports Archive
County Total Records identified for each County
Identified in database as
Phase II Reports
Identified in database as
Phase III Reports Usable Reports
Alexander 147 10 4 yes
Pulaski 92 8 0 yes
Massac 135 11 3 yes
Union 175 8 0 yes
Johnson 104 9 0 yes
Pope 126 14 0 yes
Hardin 89 4 0 no
Jackson 357 42 10 yes
Williamson 328 7 0 yes
Saline 202 10 1 yes
Gallatin 124 13 5 yes
Randolph 278 13 0 yes
Perry 131 19 6 yes
Franklin 212 10 1 yes
Hamilton 84 1 3 yes
Monroe 376 79 12 yes
St. Clair 1,369 142 12 yes
Washington 119 2 0 yes
Clinton 209 10 3 yes
Jefferson 225 14 5 yes
White 127 1 0 no
Wayne 88 0 0 no
Marion 174 17 2 no
Fayette 159 4 4 yes
Bond 117 7 1 yes
Madison 1,632 284 39 yes
Edwards 37 1 0 no
Wabash 77 0 0 no
Clay 75 1 0 no
Richland 40 0 0 no
Lawrence 69 2 0 no
Effingham 150 4 0 no
Jasper 52 2 1 no
Crawford 59 0 2 no
No County affiliation
340 6 0 yes
39
A and B). Site reports were deemed usable if the number of chert pieces found and the weight in
grams of the chert by type was available. Data was used for a limited number of sites that only
identified chert type, count, and weight for recognizable tools and in some cases another subset
of the entire chert collection. This decision was made because the portion of the collection not
identified by count and weight were predominately debitage, the waste material left over from
tool production. The tools were deemed representative of the entire collections because the
debitage was removed in the process of creating the tools.
When recording chert types and weights, the data were recorded from the available site
reports for the entire site or for specific cultural components. Multicomponent site data was
recorded as the data were represented in the report. For reports that presented data by individual
cultural component, the chert data were recorded by individual component and then summed for
the entire report. Individually tabulated cultural component data for components not included in
this study were not tabulated into the total report chert counts. When reports included data
delineated by cultural component and data where no temporal affiliation was known, the
unaffiliated data were recorded with the total site chert data. Where site data were recorded for
all components collectively only the site total was recorded with no attempt to delineate chert by
component. Both the individual component data when available and the total site data were
recorded in order to perform geospatial queries selecting for specific cultural components or total
site data. The site type column in Appendix A contains numeric indicators to differentiate the
data recording methods, as shown in Table 6.
In many cases each chert type’s counts and weights were not totaled per site, per cultural
component, or per artifact type. Data was presented in raw data format with individual artifact
attributes, in tables by geographic location, or in tables delineated by artifact types. In all these

40
cases where total chert counts and weights were not recorded, the counts and weights were
tabulated from the multiple tables presented in the reports.
Table 6 Appendix A Site Type Identifiers
Appendix A Site Type
Identifier
Explanation of Identifier
1
The data recorded in the available report is from only one cultural
component from a single component site or a multicomponent site
with only data recoded in the report for one component
2 The data recorded in the available report is from only one cultural
component from a multicomponent site
3 The data recorded in the available report is documented for all
cultural components from a multicomponent site
4 The data is calculated for all identifier two entries for each site
5
The data is calculated for all identifier two entries for each site
plus additional component data and/or indeterminate component
data recorded for the site
After thorough review of the available reports in the study area, only a small portion
contained the appropriate data to include in this study. A total of 179 reports were utilized from a
total of 24,093 reports entered into the CRM Reports Archive as of July 7th, 2017. From these
reports 317 sites were entered into Appendices A and B.
Subsequently, after collecting the raw data, calculations were performed on each row of
data to obtain the average weight of each chert type and total weight for all the chert per entry
(Appendix B). The total chert weight per chert type and component was calculated to compare
chert types. Additional tabulations were conducted from this core data set to support the research
questions identified in Sections 2.2.1 through 2.2.4. These results are presented in Chapter 4.
3.2.2 Archaeological Site Map
All the reports included in this study contain PDF map imagery. These maps are in
varying degrees of detail, scale, and correlation to today’s geospatial imagery. Generally, each
report contained a small and a large-scale image of the site or sites contained in the report and
41
surrounding geospatial features in simple line and point shapes. Some reports contained the
location of surrounding archaeological sites. These multi-site maps were generally limited to
sites excavated for the same project but reported on separately.
It was necessary to plot all sites individually into a point shapefile using Esri topographic
and imagery base maps as a guide for site placement. Additional sources used to correctly place
each site include the National Hydrology Dataset overlaid on the Esri base map and Google Map
searches for geospatial elements identified on the PDF maps. Cemeteries were the most often
depicted feature on the PDF imagery that could be searched for via Google Maps. These searches
gave the author a general area to focus on when looking for the exact location of each site. When
determining the exact location of each site’s center, topo lines, roadways, and creeks were of the
most help. The center of each site was visually estimated from the PDF imager. As most sites are
not circular the author used best judgement when determining the center of each site.
Since the majority of the sites were investigated, excavated, and recorded as the result of
modern construction, the sites tended to center around roadways, damns, lakes, borrow pits, or
pipelines. Site dispersal across the study area was heavily dependent on the time each site was
recorded, the construction needs of the area, and the availability of reports in the CRM Reports
Archive. Rural areas contained less available site data than metropolitan areas due to less state
and federally funded construction. Given the above-mentioned restrictions it is not surprising
that the rural eastern section of the study area did not contain any usable site information and the
western portion of the study area known as St. Louis Metro East contained the greatest number
of usable site data.
In addition to these modern data imbalance factors, prehistoric preferences for site
locations were also at play. St. Louis Metro East contains the largest existing prehistoric mound
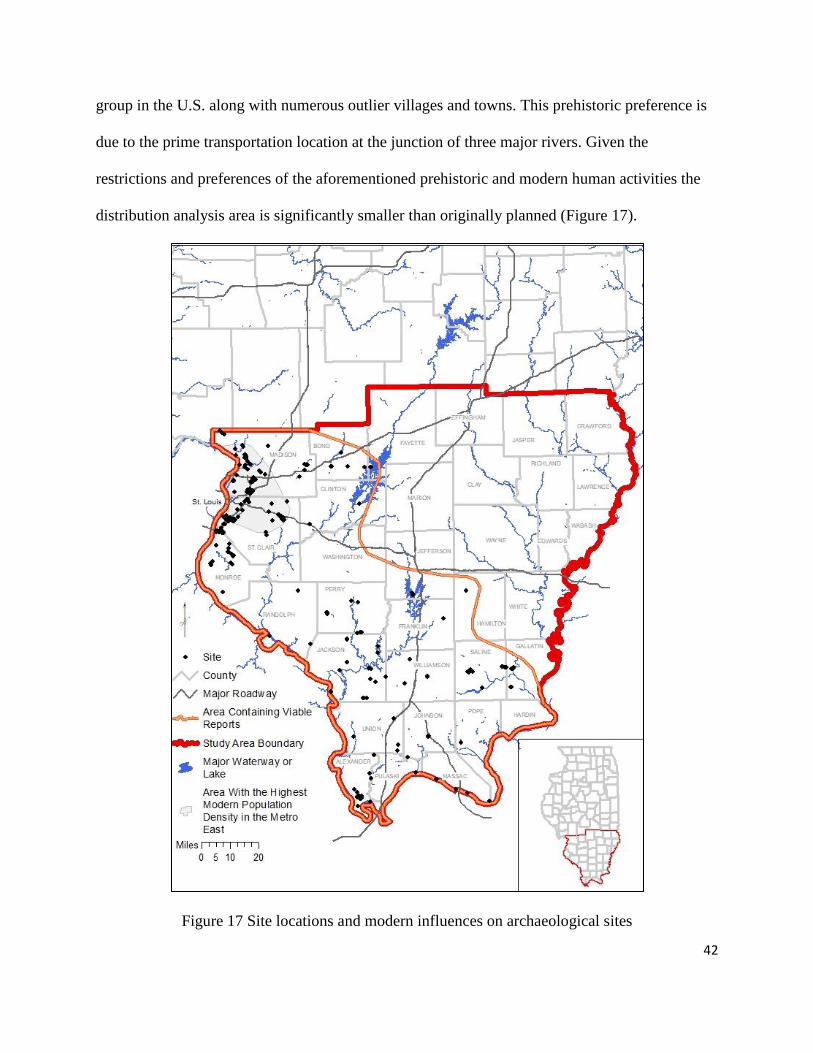
42
group in the U.S. along with numerous outlier villages and towns. This prehistoric preference is
due to the prime transportation location at the junction of three major rivers. Given the
restrictions and preferences of the aforementioned prehistoric and modern human activities the
distribution analysis area is significantly smaller than originally planned (Figure 17).
Figure 17 Site locations and modern influences on archaeological sites
43
3.2.3 Distribution Analysis
The initial setup for the distribution analysis started by creating a comma separated value
(CSV) file from the sites data excel spreadsheet. The CSV was added to ArcMap along with the
sites shapefile. Two fields were added to the sites shapefile for X and Y coordinates. The
coordinates were calculated using the Calculate Geometry tool with parameters set for the X or
Y coordinates of each point and using the NAD 1983 State Plane Illinois West FIPS 1202
coordinate system in meters. The sites shapefile was joined to the CSV site data file. The joined
CSV file was subsequently displayed in ArcMap using the X and Y coordinates imported from
the sites shapefile. In order to facilitate reproduction and manipulation of the joined CSV file, the
data from the joined CSV file was exported into a data shapefile.
The compiled shapefile was copied numerous times to accommodate all of the different
parameters this study included. The comparative analysis was visualized by utilizing the
graduated symbol break values listed in Table 7. Break values were determined in order to show
all site weight data at the same scale across all parameters and to visualize the weight classes
where the highest concentration of site data was accumulated. The median weights for each chert
type were used to determine appropriate break values. In order to not bias the data, the median
weights were calculated without zero weight entries. This produced medians between 1.8 and 86
g. Since the median weights were all very small compared to the total range of weights, smaller
intervals were used for lower total weight and larger intervals for larger total weights to show a
visual change in the data while not including an exorbitant number of break values and classes.
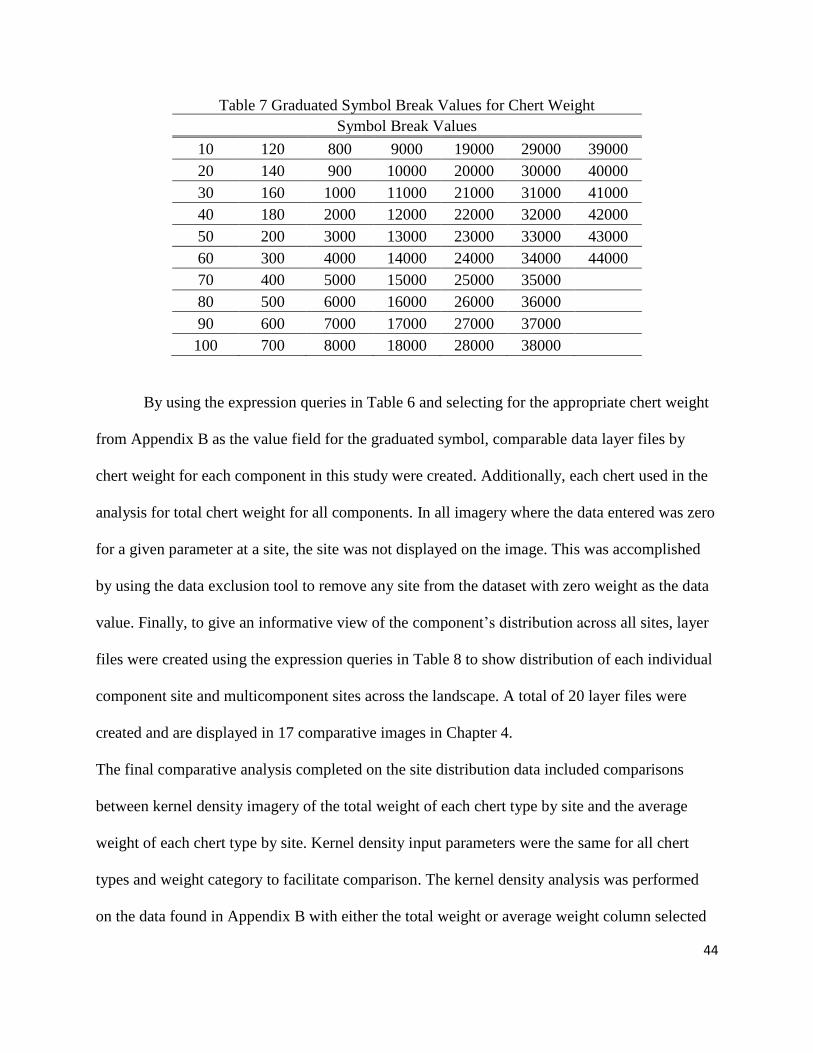
44
Table 7 Graduated Symbol Break Values for Chert Weight
Symbol Break Values
10 120 800 9000 19000 29000 39000
20 140 900 10000 20000 30000 40000
30 160 1000 11000 21000 31000 41000
40 180 2000 12000 22000 32000 42000
50 200 3000 13000 23000 33000 43000
60 300 4000 14000 24000 34000 44000
70 400 5000 15000 25000 35000
80 500 6000 16000 26000 36000
90 600 7000 17000 27000 37000
100 700 8000 18000 28000 38000
By using the expression queries in Table 6 and selecting for the appropriate chert weight
from Appendix B as the value field for the graduated symbol, comparable data layer files by
chert weight for each component in this study were created. Additionally, each chert used in the
analysis for total chert weight for all components. In all imagery where the data entered was zero
for a given parameter at a site, the site was not displayed on the image. This was accomplished
by using the data exclusion tool to remove any site from the dataset with zero weight as the data
value. Finally, to give an informative view of the component’s distribution across all sites, layer
files were created using the expression queries in Table 8 to show distribution of each individual
component site and multicomponent sites across the landscape. A total of 20 layer files were
created and are displayed in 17 comparative images in Chapter 4.
The final comparative analysis completed on the site distribution data included comparisons
between kernel density imagery of the total weight of each chert type by site and the average
weight of each chert type by site. Kernel density input parameters were the same for all chert
types and weight category to facilitate comparison. The kernel density analysis was performed
on the data found in Appendix B with either the total weight or average weight column selected

45
for each chert type and using the distribution of total weight per chert type definition query from
Table 8. The output cell size used was 692.1 which is the width of the output extent divided by
250. Since the site locations are spread across a large area with clusters of sites around modern
construction areas, several trials were attempted on different search radii in order to find an
appropriate radius for this study. A radius of 4,828.032 m or 3 mi was found to be sufficient to
show the spread of chert across the landscape. The final input parameter for the kernel density
analysis included area units in square meters, the use of density output values and a planar
distance in meters.
Table 8 Expression Queries for Chert Types
Component Distribution of Sites by Component only
Distribution of Sites by individual Chert type Total Weight and Component
Distribution of Total Weight per Chert Type
Multicomponent [Sitetype] > 2
Archaic [Sitetype] < 3 AND [Period] LIKE 'Archaic'
[Sitetype] < 3 AND [Period] LIKE 'Archaic'
Woodland [Sitetype] < 3 AND [Period] LIKE 'Woodland'
[Sitetype] < 3 AND [Period] LIKE 'Woodland'
Mississippian
[Sitetype] < 3 AND [Period] LIKE 'Mississippian'
[Sitetype] < 3 AND [Period] LIKE 'Mississippian'
All Component
[Sitetype] = 1 OR [Sitetype] > 2
Each output density shapefile was modified to show the best possible view of the kernel
density data. Since all the density values were very low it was necessary to change the
classification scheme to geometrical interval. This allowed for the density map to show the data
in multiple categories instead of containing most of the data in the lowest interval. As an added
visual enhancement, data with a zero data value were excluded from the final density image. The

46
completed density images included eight shapefiles representing the total and average weights of
the four chert types. The results and implications of these density images are discussed in
Chapter 4.
47
Results
The resulting imagery included in this section proves theories presented in Section 2.2. in
addition to raising a few more questions. The following section demonstrates where data is
sufficient and where improvements can be made in future research. Imagery presented here uses
the best possible input data at the time this report was created (i.e. 2017). New geospatial data
may become available in the future which may add to the outcomes of this thesis project.
Outcrop Prediction
The outcrop prediction proved to be a larger undertaking than originally anticipated. The
many transformations to the data to obtain one workable prediction range took careful planning
and numerous attempts at different methods to finally produce a workable and viable prediction
model. The method outlined in Section 3.1 and presented here in final imagery is the result of
many hours of diligent work.
4.1.1 Prediction Model Results
The following series of maps show the outcrop prediction surfaces for Burlington,
Cobden/Dongola, Kaolin, and Mill Creek chert. The most probable locations to find chert are in
the red spectrum of cells with yellow to blue/grey cells having a decreasing likelihood of chert
outcrops. The dark blue end of the predictability range with cell counts of 24 and 25 represent
the area’s most likely to contain secondary deposits of chert. The 24 and 25 count cells are 20 m
or less from the flow accumulation points.
As with all predictability studies testing of the prediction only increases the validity of
the prediction model itself. As stated in Section 3.1.4, locations identified during previous chert

48
reconnaissance are used to test the model. At least one reconnaissance location exists for all of
the chert types examined in this study. Reconnaissance locations in areas disturbed by modern
construction were not included in this study.
The Burlington chert outcrop area included several locations along the bluff line of the
Mississippi River (Figures 18 and 19). The Mississippi river exposed the bluff lines when a large
magnitude of water rushed through the area during the Ice Age and cut into the bedrock. The
outcrop locations along this bluff line are severed and generally enclose parts of smaller
tributaries to the Mississippi River waterways but not entire watershed systems. The smaller
watersheds included in the Burlington chert prediction area have a significantly smaller influence
on the locations of outcrops but their influence is still important. These smaller waterways are
responsible for exposing additional areas of Burlington chert after the Ice age.
Burlington waterway influences are significantly different from the other chert types in
this study. The other chert types include descriptive areas along creeks as outcrop areas and
contain waterways with much less scouring potential than the Mississippi River.
Cobden/Dongola chert outcrop in three distinctive watersheds and in a small nondescript area
along the Ohio River. Mill Creek chert is identified as outcropping along three distinctive but
geographically large creek areas. Kaolin chert has significantly less waterway exposure with
only one partial watershed. Kaolin, Cobden/Dongola, and Mill Creek chert do not outcrop on the
same massive scale as Burlington chert.
Cobden/Dongola chert has the most geographically expansive outcrop area in this study.
The outcrop area includes locations on the east and west sides of the state. The prediction study
shows several locations with high potential for Cobden/Dongola chert as can be seen in

49
Figure 18 Burlington chert predicted outcrop areas: (a) in Madison County; and (b) in
northwestern Monroe County
(a)
(b)

50
Figure 19 Burlington chert predicted outcrop area: (a) in west central Monroe County; and (b) in
southwestern Monroe County
(a)
(b)

51
Figures 20 and 21. The high prediction areas can be seen in along the Ohio river (Figure 21b)
and in the Clear Creek watershed area (Figure 20a). The remainder of the prediction study shows
a mid-range of potential prediction surfaces.
There are several areas where the Cobden/Dongola prediction study is lacking due to the
removal of modern waterway systems and the construction of a large modern stone quarry
(Figures 14, 20 and 21). When these areas were removed from the prediction study, no
information was available at the time of this study to replace them with prehistoric landscape
features. Therefore, holes appear in the prediction surface where modern influence occurs.
Noticeable are the large area of removal where the modern quarry exists (Figure 21b) and areas
occupied by farm fields (Figure 20b). The farmed areas contained a significantly large number of
modern influences on waterways. Water was diverted in channelized fashion around the edges of
property lines to maximize the amount of tillable land. This channelization is beneficial to
modern farmers but it leaves gaps in the prehistoric surficial geologic record of the area.
Kaolin chert by far contains the smallest outcrop area of all the chert types in this study
(Figure 22). This is consistent with the small Kaolin chert distribution in comparison to the other
chert types included in this study noted in section 4.1. The small distribution amounts can also be
attributed to the methods employed by prehistoric peoples to obtain Kaolin chert. In reality, the
author is confident that a combination of both small outcrop areas and more labor-intensive
methods to obtain Kaolin chert influences not only the distribution but also the areas of known
outcrop locations.
The lack of known geologic formations changed the way the outcrop prediction model
was used to identified outcrop areas of Kaolin chert. The entire watershed area was assumed to
contain potential Kaolin outcrops along with the entire geologic feature know as Iron Mountain
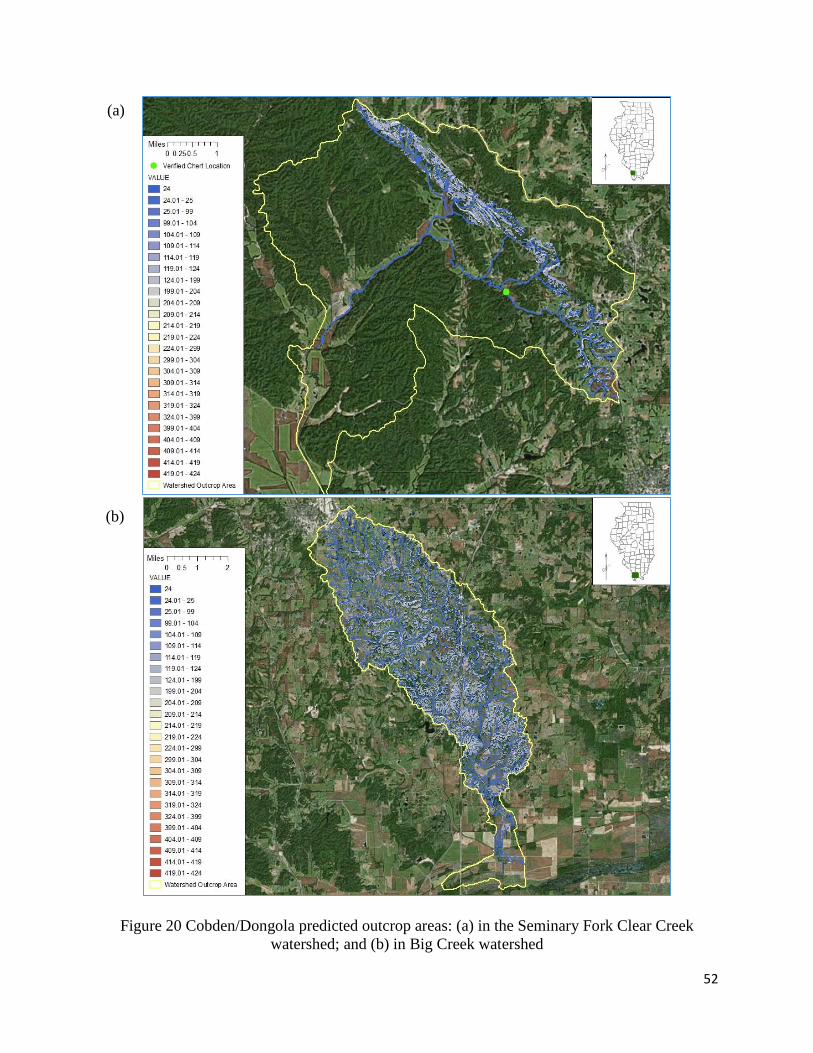
52
Figure 20 Cobden/Dongola predicted outcrop areas: (a) in the Seminary Fork Clear Creek
watershed; and (b) in Big Creek watershed
(a)
(b)
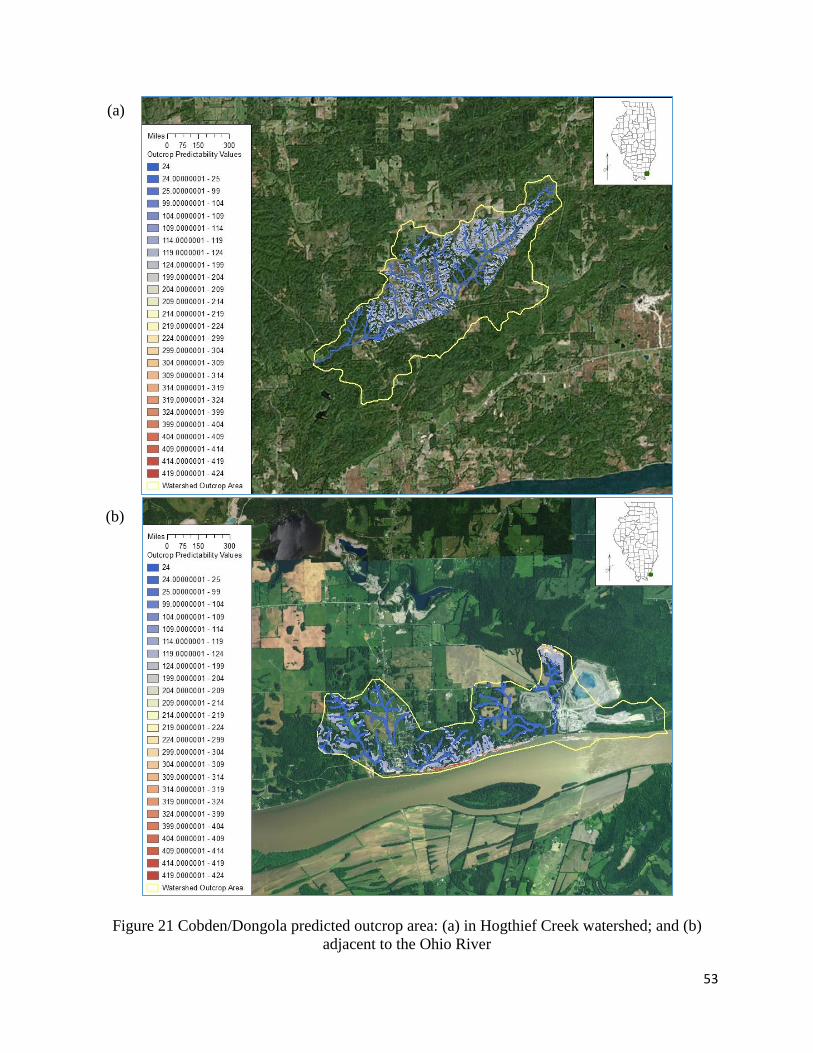
53
Figure 21 Cobden/Dongola predicted outcrop area: (a) in Hogthief Creek watershed; and (b)
adjacent to the Ohio River
(a)
(b)

54
Figure 22 Kaolin chert predicted outcrop area: (a) on Iron Mountain: and (b) in the watershed of
a tributary to Big Creek
(a)
(b)

55
(Figure 22). By including both areas in their entirety, it is very possible locations are identified as
potentially containing outcrops when none exist.
Iron Mountain (Figure 22a) contains the most probable locations to find Kaolin chert in
this study. Large areas with the highest prediction surfaces are located within this surficial
geologic formation. Outside of the Burlington Chert outcrop areas, no other chert outcrop area in
this study contains as much surface area with the highest probable chert outcrop locations. In
part, this is attributed to the high percent slope found in both the Burlington chert outcrop area
and Iron Mountain.
The Mill Creek chert outcrop locations includes the largest contiguous area of potential
outcrop in this study (Figures 23 and 24). Most of the potential outcrop areas have mid-range
outcrop probability except for the southern portion of the outcrop area (Figure 24). In this area,
there are scattered high range outcrop locations. The high range outcrop areas are a factor of the
larger percent slope in the area.
As with Cobden/Dongola chert, the Mill Creek chert outcrop prediction surface contains
areas where modern channelization was removed. Again, farming practices played a large part in
the relocation and channelization of waterways which is seen predominately in Figure 24.
Channelization also played a part in the production of Figure 23a where accumulation points
downstream of the geologic surface exposure area appear to end where farm fields occur on the
landscape.
The Cobden/Dongola and Mill Creek chert watersheds contain large areas downstream of
the relevant geologic surficial exposure areas. As stated in Section 3.1.1 and identified in Figure
15 these downstream accumulation points were included as part of the potential outcrop areas.
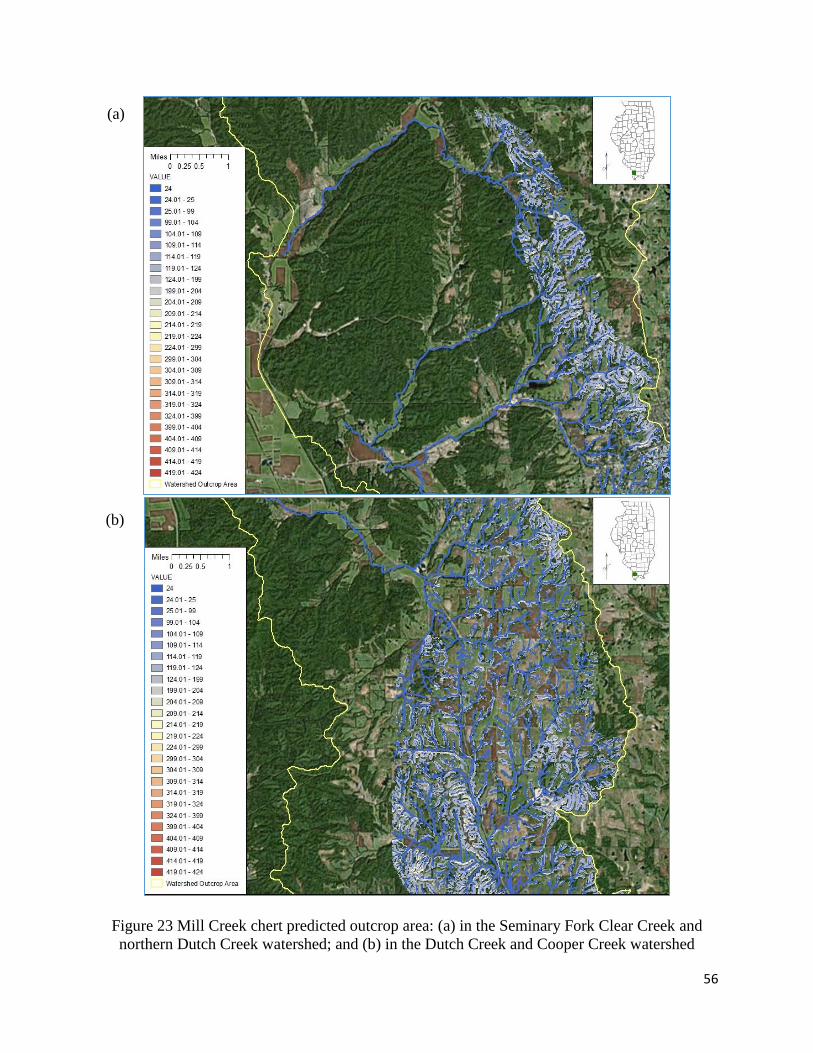
56
Figure 23 Mill Creek chert predicted outcrop area: (a) in the Seminary Fork Clear Creek and
northern Dutch Creek watershed; and (b) in the Dutch Creek and Cooper Creek watershed
(a)
(b)

57
Figure 24 Mill Creek chert predicted outcrop area in the Cooper Creek and Mill Creek
watersheds
All other accumulation point locations upstream or not originating inside the surficial geologic
exposure area were not included as potential outcrop locations. This process lead to the
exclusion of large portions of the chert bearing creeks identified in Sections 2.2.2 and 2.2.3. With
the exclusion of these areas the resulting images are believed to contain a more accurate
prediction model.
4.1.2 Validation of the Model
The chert outcrop reconnaissance performed by the author was in unison with the outcrop
prediction model. Figures 18a, 20a, 22a, and 30 show the location of the reconnaissance
locations on the prediction surface. All of the reconnaissance locations are located in areas
identified as containing probable outcrop locations.

58
The Burlington chert reconnaissance locations are located on some of the highest
probable locations in the prediction surface. The Mill Creek chert reconnaissance location is in
an accumulation point location adjacent to one of the highest probable areas in the outcrop area.
As the author was limited in terms of road access in the Mill Creek prediction area, it is
extremely probable that the chert found at the Mill Creek reconnaissance location originated
from the high probability area upslope from the reconnaissance area.
The Cobden/Dongola and Kaolin reconnaissance location are the same. In both prediction
models the point is located in an accumulation area. In the Cobden/Dongola prediction model,
the reconnaissance location is significantly downstream from the surficial geologic exposure
area. With this in mind, it may be prudent in future studies to include more downstream
accumulation points or perform reconnaissance downstream of the outcrop location to determine
the distance chert can travel.
Distribution Analysis
There are a few things, if they were made available, that would advance the distribution
analysis. The analysis of the chert distribution patterns across the landscape would be greatly
improved with additional data points or separated data by component for all of the included
multicomponent sites. As can be seen in Table 9 there are 109 multicomponent sites in which the
chert data is combined for the entire site and not split up by component. This data proved to be
important when analyzing the overall pattern of each chert types distribution but could not be
used when showing the distribution analysis of chert types by component. In addition, there were
48 sites with unknown components which could only be used to show the overall distribution
pattern (Table 10).
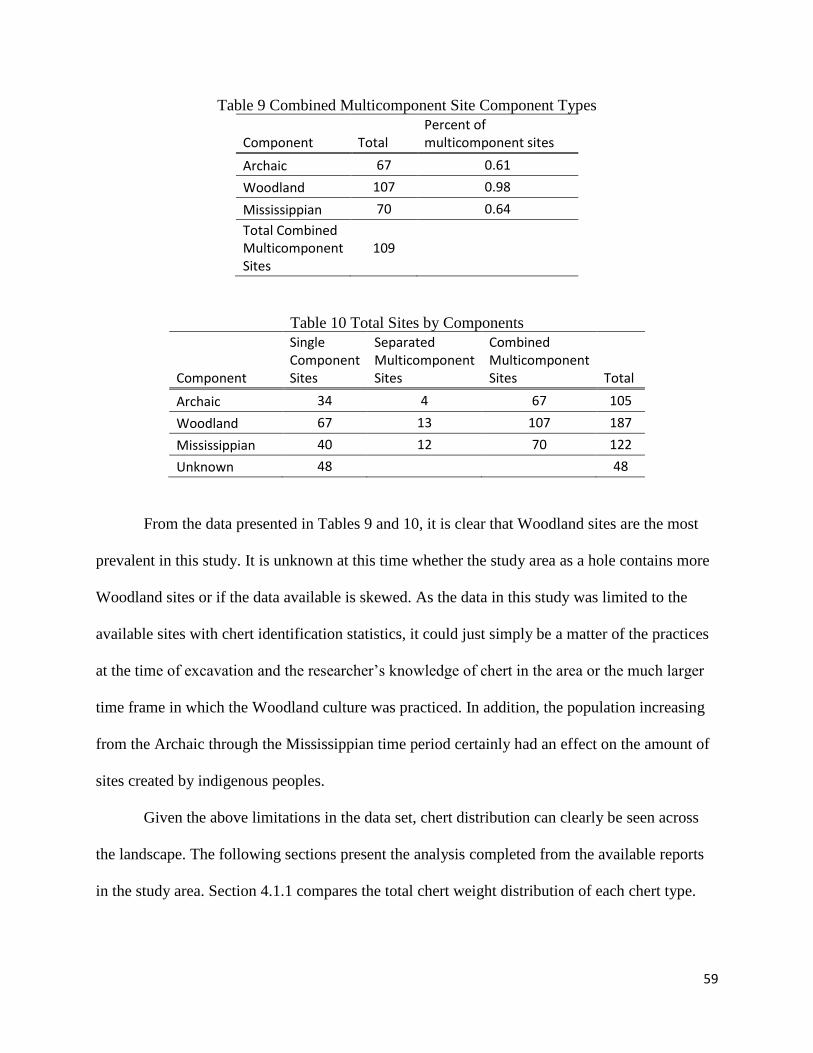
59
Table 9 Combined Multicomponent Site Component Types
Component Total Percent of multicomponent sites
Archaic 67 0.61
Woodland 107 0.98
Mississippian 70 0.64
Total Combined Multicomponent Sites
109
Table 10 Total Sites by Components
Component
Single Component Sites
Separated Multicomponent Sites
Combined Multicomponent Sites Total
Archaic 34 4 67 105
Woodland 67 13 107 187
Mississippian 40 12 70 122
Unknown 48 48
From the data presented in Tables 9 and 10, it is clear that Woodland sites are the most
prevalent in this study. It is unknown at this time whether the study area as a hole contains more
Woodland sites or if the data available is skewed. As the data in this study was limited to the
available sites with chert identification statistics, it could just simply be a matter of the practices
at the time of excavation and the researcher’s knowledge of chert in the area or the much larger
time frame in which the Woodland culture was practiced. In addition, the population increasing
from the Archaic through the Mississippian time period certainly had an effect on the amount of
sites created by indigenous peoples.
Given the above limitations in the data set, chert distribution can clearly be seen across
the landscape. The following sections present the analysis completed from the available reports
in the study area. Section 4.1.1 compares the total chert weight distribution of each chert type.
60
Section 4.1.2 compare each chert types total weight for all components to the average size of the
chert distributed.
4.2.1 Chert Total Weight Distribution
Each chert type’s total weight distribution is displayed in Figures 25-32. The total weight for all
sites is used as a general distribution of chert throughout time (Figures 25a, 27a, 29a and 31a).
By knowing the general area where the majority of the chert is distributed, assumptions were
made on the total distribution of chert from the Archaic to the Mississippian time period.
The majority of the chert types were distributed most heavily around the area of outcrop
with lesser concentrations along major waterways outside of the outcrop area. Chert was found
less often farther away from the major waterways outside the outcrop area. An exception to this
is Mill Creek chert. The distribution of Mill Creek chert is relatively uniform across the study
area. This is due to the large pieces of Mill Creek chert used for farming hoes weighing several
hundred grams.
Burlington chert use increased from the Archaic to the Mississippian time periods
(Figures 25-26) (Table 11). This is most likely due to an increase in population living at the
archaeological sites. The general area of deposition in archaeological sites seems to hold true to
the total Burlington distribution. The closer to the outcrop the more chert was deposited in
archaeological sites. Additionally, archaeological sites along the major waterway have higher
concentrations of Burlington chert than the surrounding landscape.
Cobden/Dongola chert was most significantly used during the Woodland component.
This supports the aforementioned claims by archaeologists that the blue grey chert was preferred
during the Woodland Period (Section 2.2.3). Morrow, Elan, and Glascock (1992) disagreed with

61
Figure 25 Burlington chert total weight distribution: (a) all components; and (b) Archaic
component
(a)
(b)

62
Figure 26 Burlington chert total weight distribution: (a) Woodland Component; and (b)
Mississippian Component
(a)
(b)

63
Figure 27 Cobden/Dongola total weight distribution: (a) all components; (b) and Archaic
component
(a)
(b)

64
Figure 28 Cobden/Dongola total weight distribution: (c) Woodland Component; and (d)
Mississippian Component
(a)
(b)
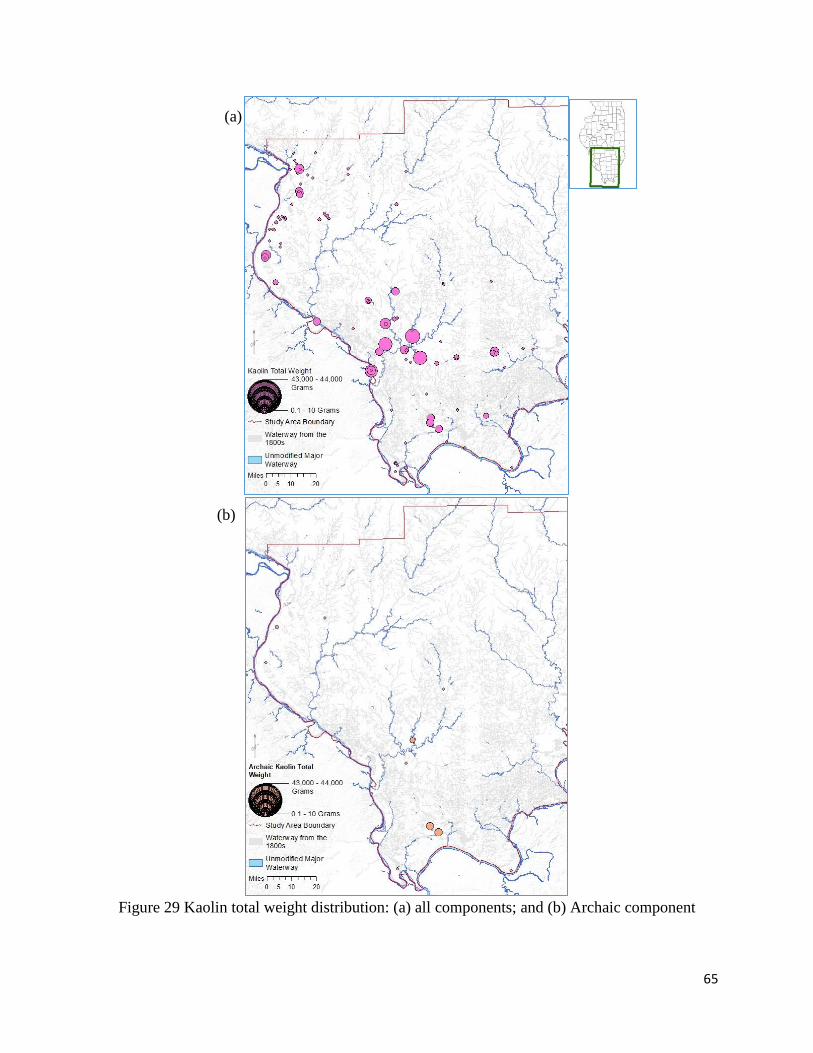
65
Figure 29 Kaolin total weight distribution: (a) all components; and (b) Archaic component
(a)
(b)

66
Figure 30 Kaolin total weight distribution: (a) Woodland Component; and (b) Mississippian
Component
(a)
(b)

67
Figure 31 Mill Creek total weight distribution: (a) all components; and (b) Archaic component
(a)
(b)

68
Figure 32 Mill Creek total weight distribution: (a) Woodland Component; and (b) Mississippian
Component
(a)
(b)

69
Table 11 Burlington Chert Total Weight in Grams
Component Single Component Sites
Separated Multi Component Sites
Total Weight Burlington
Archaic 8,909.2 4,798.2 13,707.4
Woodland 29,738.4 27,549.2 57,287.6
Mississippian 95,907.6 20,199.1 116,106.7
Unknown 2,891.2
Added to Separated Multi Component
6,074.1
Multicomponent 90,082.3
Total 286,149.3
these claims based on the lack of evidence. By use of this study, there is now evidence to support
the Woodland people’s preference for blue grey chert over people of adjacent time periods
(Figures 27-28) (Table 12). Significantly more sites containing Cobden/Dongola chert were
Woodland with a larger amount of chert overall deposited in the Woodland sites. Like
Burlington chert, Cobden/Dongola chert appeared more often in sites surrounding the outcrop
area and along major drainage pathways.
Table 12 Cobden/Dongola Total Weight in Grams
Component Single Component Sites
Separated Multi Component Sites
Total Weight Cobden/Dongola
Archaic 5,013.6 804.9 5,818.5
Woodland 11,542.5 7,569.3 19,111.8
Mississippian 421.2 1,728.0 2,149.2
Unknown 1,282.1
Added to Separated Multi Component
5425.4
Multicomponent 19,869.3
Total 53,656.3
Kaolin chert was less often used than the other cherts in this study. Due to the difficulty
of acquiring Kaolin chert it is not surprising that Archaic peoples did not use Kaolin very much

70
when other more accessible cherts were available in the appropriate size (Figures 29-30). The
Archaic peoples did not routinely make large stone tools therefore mining for large pieces of
chert was not necessary. Woodland and Mississippian people were anticipated to use the most
Kaolin chert due to the large raw material pieces needed to produce farming hoes. Before
performing this analysis, the author anticipated that the most kaolin would appear in
Mississippian sites. However, this proved not to be the case. The Woodland people used Kaolin
chert almost four times as much as the Mississippians (Table 13). This may be a factor of small
sample size in this study since Kaolin chert only appeared in 115 sites. The distribution of Kaolin
chert was similar to Burlington and Cobden/Dongola and concentrated near the outcrop area and
along major waterways.
Table 13 Kaolin Total Weight in Grams
Component Single Component Sites
Separated Multi Component Sites
Total Weight Kaolin
Archaic 243.8 95.8 339.6
Woodland 2,917.2 2,589.9 5,507.1
Mississippian 523.8 1,088.3 1,612.1
Unknown 8.0
Added to Separated Multi Component
777.9
Multicomponent 3,066.1
Total 11,310.8
Mill Creek chert was the most dissimilar to the distribution pattern of the other cherts. As
was expected, the Archaic peoples used very little Mill Creek chert compared to the Woodland
or Mississippian (Figure 31-32) (Table 14). The Mississippian and Woodland components saw a
relatively equal amount of chert in the outcrop area and along major waterways. This even
distribution is due to the large size needed to make farming hoes. As anticipated the
Mississippian people, who were high intensity farmers, used more Mill Creek chert than the

71
Woodland people, who were in the transitioning from hunter gather to farmers. The amount of
Mill Creek chert in this study reflects the difference in food acquisition type with almost four
times as much Mill Creek chert used by the Mississippians.
The distribution of chert not only varies between the chert type but also between
components. Burlington chert is the most frequent chert type in all components, making
Burlington chert the most widespread chert type in this study. Kaolin is the least distributed chert
type per component. Cobden/Dongola is found at more Woodland sites while Mill Creek is
found at more Mississippian sites. Table 15 shows the distribution of chert by site per
components.
Table 14 Mill Creek Total Weight in Grams
Component Single Component Sites
Separated Multi Component Sites
Total Weight Mill Creek
Archaic 1,789.9 32.0 1,821.9
Woodland 2,979.8 2,512.4 5,492.2
Mississippian 18,146.3 1,685.3 19,831.6
Unknown 339.0
Added to Separated Multi Component
1,063.5
Multicomponent 11,165.1
Total 39,713.3
Table 15 Number of Sites by Chert Type and Component
Component Burlington Cobden/Dongola Kaolin Mill Creek
Archaic 30 18 10 18
Woodland 66 49 28 36
Mississippian 46 22 20 40
Unknown 34 10 3 14
Multicomponent 120 70 54 93
Total 296 169 115 201

72
4.2.2 Chert Average Weight Distribution
The Kernel Density tool was used to show the difference between the total weight and the
average weight of chert per site. The average weight will display the average size of chert
deposited in archaeological sites. Assumptions made at the beginning of this research about the
size of chert deposited in archaeological sites include the farther away from the outcrop the
smaller the average chert size with the exception of Mill Creek chert. Given the large size of Mill
Creek tools, this chert type average size would vary across the landscape.
As can be seen in Figures 33 and 34 distances from the outcrop source has variable
influence on the average size of the chert. Burlington chert does appear to have larger average
weight close to the outcrop area, although the average weight of some outlier site locations is
equivalent to those in the outcrop area. Cobden/Dongola, on the other hand, has little average
weight correlation between the outcrop and the distance from the outcrop (Figures 33c, d).
Kaolin average weight is relatively equal across the landscape despite the closeness to the
outcrop area. Finally, Mill Creek average weight tends to correlate relatively well with the
Kernel Density of the total weight.
From the comparison of the chert weight and average weight Kernel Density, it is clear
that distance from the source does not have direct correlations with the two weight metrics. It
may be more prudent to compare the size of similar tools made of the same kind of chert.
Additionally, if the data was available, using the average weight of all projectile points for the
same chert type instead of the average weight of all the chert found at the site might produce a
better comparison. Comparing debitage from sites may also prove useful. For this study, the data
and time were not available for a more intensive investigation of this matter.

73
Figure 33 Kernel density: (a) Burlington total weight; (b) Burlington average weight; (c)
Cobden/Dongola total weight; and (d) Cobden/Dongola average weight
(a) (b)
(c) (d)

74
Figure 34 Kernel density: (a) Kaolin total weight; (b) Kaolin average weight; (c) Mill Creek total
weight; and (d) Mill Creek average weight
(a) (b)
(c) (d)

75
Discussion and Conclusions
This project was undertaken to better understand the movement of chert from the outcrop
location to the final depositional location, the archaeological site. By studying the distribution
pattern of the stone tool raw material, prehistoric people’s preference for chert raw material types
has been shown over geographical space. The preferences for one chert type over another in
many cases appeared to be dependent on proximity to the outcrop area. In other cases, it is
heavily dependent on the inherent properties of the chert type itself. Color, size, and shape are
the three physical properties of the chert types that influence the preferential selection.
The outcrop prediction study portion of this research was implemented to identify the
most probable locations to find Burlington, Cobden/Dongola, Kaolin, and Mill Creek chert. Each
chert type contained within it a unique set of outcrop parameters. Because of this, the
aforementioned method encompassed all of the outcrop parameters while allowing for individual
manipulation of the method to customize the outcrop predictions for each chert type.
Limitations
During this study, several things limited potential avenues leading to the production of
more accurate and thorough results. Initially, obtaining the archaeological site data was a
daunting task with so many of the reviewed site reports containing no usable data. As no
additional avenues to obtain large numbers of site reports were available, the study was limited
to only those reports contained on the CRM Reports Archive and the few reports in the author’s
small personal collection. The final distribution of site report data lacked information for a large
portion of the originally defined study area. If data was available for this portion of the study
area a defined end of distribution may have been available for each chert type.

76
As stated in Section 3.1 the nature of archaeological excavation and testing is in itself a
limitation. Archaeological studies are only completed where modern construction and
government regulations dictate studies are needed. From this uneven and biased distribution of
archaeological data the distribution pattern of past lives must be interpreted to produce study area
wide results. This is one of the biggest limitations to any study of archaeological site distribution
analysis. Although interpretation of the current data is valid, there will always be unknown or
outlier data unexcavated or unresearched.
The second limitation for this study was in the available geospatial data. Geographic
formation data was only available for groupings of geologic formations. The group of
formations, although encompassing the sought-after formation, also included areas not
containing the specific chert bearing formation. Therefore, the final prediction surface is
assumed to be larger than it should be. Another geospatial data set which affects the outcrop
prediction surface is the DEM. The DEM size selected for this study was the smallest possible
cell size which encompassed the entire study area. The 3 m cell size, although good, was not the
ideal DEM cell size to derive a slope layer. A smaller cell size would have shown a more
detailed picture of the study area and potentially revealed additional high probability locations.
The final limitation to this study is the unknown changes which have occurred on the
landscape between the prehistoric component in this study and today. Creeks and rivers may
have changed courses. The slopes and bedrock could be more denuded than in prehistoric times.
Outcrop areas may be long forgotten and never rediscovered. Prehistoric peoples may have
relocated artifacts from a previous time period. All of these things may have an impact on this
study’s outcome, none of which can be known without further study in each of these areas.

77
Future Work
To build on the distribution analysis, initially it would be important to increase the number
of sites included in the study, as more data points will show a more complete picture of the chert
distribution analysis. It would also be important for future studies to increase the geographical
extent of the study to the natural limit of each chert’s distribution. In some cases, this may be
hundreds of miles, but this would document the desirability of each chert type by the entire
prehistoric population.
Another avenue to pursue would be to include all the chert types from these reports and
others in the study area. This will show a full picture of the prehistoric people’s preference for all
chert types available to them. Additionally, localized preferences will become apparent for each
component.
Potential future work concerning the outcrop areas include geographically delineating the
individual formations, performing reconnaissance surveys in areas of high probability, and
following creeks downstream of the geologic surficial exposure area to determine approximately
how far chert travels. Reconnaissance surveys to validate chert outcrop areas and tracking chert
downstream from the source would prove to be the most feasible. Determining the distance a
piece of chert travels downstream can greatly affect the distance a prehistoric person must travel
to obtain the chert. As seen with this study, chert is most likely to be used when the
archaeological site is close to the outcrop area. Therefore, if the chert travels downstream a
significant distance the location of obtaining a specific chert type may be closer due to water
transport than an adjacent chert outcrop. The proximity to one chert type over another may be the
determining factor in the makeup of the deposits at individual archaeological sites. Until the
water transport of chert types is known, no definitive answer can be obtained.
78
Conclusions
The completed outcrop prediction model and distribution analysis contained a few
surprises. Initially, the author expected Kaolin chert would be most used in the Mississippian
time period due to its large size and its intense color. As can be seen in Figures 29-30 and Table
13 this is not the case. It would appear that the Woodland peoples valued these two attributes and
used Kaolin chert almost four times as much.
As reported in Section 2.2.3, Cobden/Dongola was indicated to be preferred by the
Woodland people’s due to its blue grey color. The significance of this preference was drastically
understated. Cobden/Dongola chert was not only used more, its total weight for the Woodland
component was four times more than the Archaic component and nine times more than the
Mississippian times.
The expectations for average weight of chert distributed over the study area was for
archaeological sites closer to the outcrop to contain larger pieces of chert than archaeological
sites farther away from the outcrop location. In all cases of chert average weight was not
influenced significantly by distance from the outcrop locations. Therefore, the average weight
must be influenced more directly by some other factors. Most probably the factor determining
the average weight of the chert is the need for a specific size tool and the generally equivalent
chert debitage size.
Anticipated factors in this study include the correlation between predicted outcrop and
reconnaissance locations. During both studies, waterways and a high degree of slope were
determined to be indicators of potential chert outcrop locations. Since the input parameters were
relatively simple for the outcrop prediction model and these parameters are the same ones sought
after in the reconnaissance survey, it is not surprising that the reconnaissance locations coincide

79
with the outcrop prediction surface. Other factors predicted and validated include the large
quantity of Burlington chert found in archaeological sites of all components, the small amount of
Kaolin chert distributed over all components, and the large amount of Mill Creek chert utilized in
the Mississippian component.
This study aids in the understanding of chert distribution over Southern Illinois. By
understanding the way chert is distributed insight can be gained into the prehistoric people’s
preferences and cultural needs. Outcrop prediction helps researchers obtain a baseline for
reconnaissance surveys and aids in understanding the distances chert traveled to the final
depositional locations. The archaeological site and the outcrop location are two key components
in a prehistoric person’s daily life. This research was an attempt to better understand the
correlation between them both.
80
References
Abbott, Larry, 1989. Archaeological Investigations at the Wooded Site (11MS587) Madison
County, Illinois. Resource investigation Program.
Aberle, Gabrielle, Cally Lence, and Monica Shah, 2002. A Phase II Investigation of Sites
11G361 and 11G365 within Black Beauty Coal Company’s Cottage Grove Mine, DNR Permit
#348 Gallatin and Saline Counties, Illinois. American Resources Group, Ltd.
Aberle, Gabrielle, Monica Shah Lomas, and Cally Lence, 2006. Phase II and III Archaeological
Investigations at Sites 11SA510 and 11SA526 within Black Beauty Coal Company’s Wildcat
Hills Mine, Cottage Grove Pit, Saline County, Illinois. American Resources Group, Ltd.
Adams, Brian, Gregory Walz, Paul Kreisa, Kevin McGowan, Jacqueline McDowell, Cynthia
Balek, 1997. Archaeological Investigations for the Relocation of Valmeyer, Monroe County,
Illinois: Volume 2: The Strong Site. Public Service Archaeology Program Department of
Anthropology University of Illinois at Urbana-Champaign.
Avery, George, Everett, Bassett, Jonathan Bloom, Peter Bobrowsky, Emanuel Breitburg, Brian
Butler, Michael Hargrave, Richard Jefferies, Neal Lopinot, B. Mark Lynch, Ernest May, James
Merritt, Carol Morrow, Gerald Oetelaar, and William Woods, 1982. The Carrier Mills
Archaeological Project Human Adaptation in the Saline Valley, Illinois. Center for
Archaeological Investigations Southern Illinois University at Carbondale.
Barcelona Field Study Center. 2000-2016. “Measuring Slope Steepness”. Accessed July 2017,
http://geographyfieldwork.com/SlopeSteepnessIndex.htm
Barr, Kenneth, Mary McCorvie, Mark Wagner, Brad Koldehoff, William Cremin, 1993. The
Black Snake Site: A Mississippian Stone Box Cemetery in the Upper Galum Creek Valley Perry
County, Illinois. American Resources Group, Ltd.
Barriento, Gustava, Juan Bautista Belardi, Luciana Catalla, Flavia Carvallo Marina, and
Fernando Oliva. 2016. Continuous spatial models as an aid for sourcing lithic raw materials:
Examples from the Argentine Pampas and Patagonia. Journal of Archaeological Science:
Reports.
Beck, Kelly, 2008. Transport Distance and Debitage Assemblage Diversity: An Application of
the Field Processing Model to Southern Utah Toolstone Procurement Sites. American Antiquity.
Vol. 73, No. 4, 759-780.
Bentz, Charles, Lucy Whalley, 1985. The Leingang Site A Late Woodland Occupations.
Department of Anthropology University of Illinois at Urbana-Champaign.
Bentz, Charles, Dale McElrath, Fred Finney, and Richard Lacampagne, 1988. Late Woodland
Sites in the American Bottom Uplands. Illinois Archaeological Survey.

81
Berres, Thomas, 1985. Archaeological Investigations at the Komondor Site (11-J-79) Jackson
County, Illinois. Illinois Archaeology Survey.
Betzenhauser, Alleen, and Jennifer Howe, 2008, Archaeological Investigations at Site 11J1196
(Halloween Site) for the Southern Illinois Airport Project. Illinois Transportation Archaeological
Research Program.
Betzenhauser, Alleen, 2012. Archaeological Investigations at 11MS2300 (Auburn Sky Site) for
the Robbins Road (Hartford), IL 3 to IL111, Addendum A Project. Archaeological Testing Short
Report No. 366. Illinois State Archaeological Survey, University of Illinois at Urbana-
Champaign.
Betzenhauser, Alleen, Robert Marzim, and Mark Branstner, 2013. Archaeological Investigations
at Site 11PY198 (Perrackson Site) for the FAP 42, IL 13/127 Project. Archaeological Testing
Short Report No. 416. Illinois State Archaeological Survey, Prairie Research Institute.
Betzenhauser, Alleen, Brad Koldehoff, Kathryn Parker, Steven Kuehn, Mera Hertel, 2013. The
Prehistory of Turkey Hill: Archaeological Investigations along Illinois Route 13/15 (FAP-103)
Belleville to Freeburg, St. Clair County, Illinois. Illinois State Archaeological Survey Prairie
Research Institute.
Bevitt, Todd, 1997.Phase II Archaeological Investigations at Sites 11MO636 and 11MO672
Monroe County, Illinois. American Resource Group, Ltd.
Billings, Deborah, 1984. An Analysis of Lithic Workshop Debris from Iron Mountain, Union
County, Illinois. Center for Archaeological Investigations, Southern Illinois University at
Carbondale.
Blanton, Dennis, Lucretia Kelly, and Katherine Parker, 1989. Archaeological Mitigation at 11-
Wm-99: A Multicomponent Site in the Crab Orchard Creek Basin. Center for Archaeological
Investigations Southern Illinois University at Carbondale.
Blodgett, Daniel, Craig Kitchen, and Patrick Durst, 2016. Phase II Archaeological Investigations
at Site 11MS2248 (McCoy Site) for the FAP 310 Project. Archaeological Testing Short Report
No. 467. Illinois State Archaeological Survey at the University of Illinois at Urbana-Champaign.
Boles, Steve, and Patrick Durst, 2011. Archaeological Investigations at Site 11MS1614 (Meeks
Farm Site) for the FAP 310 Project. Archaeological Testing Short Report No. 329. Illinois State
Archaeological Survey at the University of Illinois at Urbana-Champaign.
Boles, Steven, Joseph Galloy, 2012. Additional Archaeological Investigations at Dugan Airfield
Site (11MO718) Archaeological Testing Short Report No. 446. Illinois State Archaeological
Survey Prairie Research Institute.
Boles, Steve, Patrick Durst, 2012. Archaeological Investigations at 11MS2317 (Herter Site) for
the FAP310 Four-lane Expressway, Godfrey to Jerseyville Project. Archaeological Testing Short
Report No. 368. Illinois Archaeological Survey, University of Illinois at Urbana-Champaign.

82
Booth, Donald, Brad Koldehoff, Michael Kolb, Eric Roselle, 1999.The EWP Project
Archaeological Investigations for the 1998 Metro East Ditch Cleanout Project in Madison and
St. Clair County, Illinois. Illinois Transportation Archaeological Research Program.
Booth, Donald, Matthew Bivens, Kathryn Warner, Steve Dasovich, Edwin Hajic, 2006. Phase
One Cultural Resource Survey and Phase Two National Register of Historic Places Eligibility
Testing Sites 11MO598, 11MO599, 11MO725, and 11MO1068. SCI Engineering, Inc.
Booth, Don. 2012. Phase Two National Register Eligibility Testing of Sites 11S1637, Halloran
50-acre Tract St. Clair County, Illinois. SCI Engineering, Inc.
Booth, Don, Michele Lorenzini, Kellie DeFosset, Rob Verheggan, Marjorie Schroeder, Lucretia
Kelly, 2012. Limited Phase III Investigations Schmid Site 11MS109 Wood River Illinois. SCI
Engineering, Inc.
Borgic, Quentina, 1999. Chert Types Found In Illinois A Presentation Presented in Fulfillment of
a Senior Assignment for a Bachelor of Arts in Anthropology, Southern Illinois University
Edwardsville, Illinois.
Borgic, Quentina, 2000. Geologic Descriptions of Some Illinois Chert Types. A Research Paper
Submitted in Fulfillment of a Senior Assignment for a Bachelor of Arts in Geography, Southern
Illinois University Edwardsville, Illinois.
Butler, Brian, Brian DelCastello, and Mark Wagner, 2000. Archaeological Investigations at Site
11J1145 Jackson County, Illinois. Center for Archaeological Investigations Southern Illinois
University at Carbondale.
Brantingham, Jeffery. 2003. A Neutral Model of Stone Raw Material Procurement. American
Antiquity. Vol. 68, No. 3, 487-509.
Butler, Brian, and Anne Cobry DiCosola, 2008. Archaeological Investigations at Four Stone
Forts in the Shawnee National Forest. Center for Archaeological Investigations Southern Illinois
University at Carbondale.
Butler, Brian, and Rosanna Crow, 2013. Archaic Period Occupation at Kincaid Mounds. Illinois
Archaeological Survey, Inc., Illinois Archaeology, Vol 25, pp 106-140.
Cobb, Charles, and Richard Jefferies, 1983. Archaeological Investigations at the Milar Site,
Alexander County Illinois. Center for Archaeological Investigations Southern Illinois University
at Carbondale.
Cobb, Charles, 1989. An Appraisal of the Role of Mill Creek Chert Hoes in Mississippian
Exchange System. Southeastern Archaeology. Vol. 8, No. 2. 79-92.
Clarkson, Chris, and Angelo Bellas. 2014. Mapping stone: using GIS spatial modeling to predict
lithic source zones. Journal of Archaeological Science.

83
Craig, Joseph, Joseph Galloy, 1994.Phase III Archaeological Investigations at Site GCS #1 (11-
MS-1380) A Mississippian Farmstead Near Horseshoe Lake, Madison County, Illinois. Hanson
Engineers, Inc.
Craig, Joseph, Susan Vorreyer, Rachael Baskett, Terrance Martin, Kathryn Parker, Jason Rein,
2007. The Lange Site An Early Mississippian Upland Civic and Ceremonial Center in
Southwestern Illinois. Environmental Compliance Consultants, Inc.
De Mott, Rodney, George Holley, 1991. Archaeological Investigations at the Style Site (11-MS-
1350). Contract Archaeology Program Southern Illinois University Edwardsville.
DelCastello, Brian, and Brian Butler, 2000. Archaeological Investigations at 11Js-321 Cache
River Scenic Natural Area Visitor Center, Johnson County, Illinois. Center for Archaeological
Investigations Southern Illinois University at Carbondale.
DelCastello, Brian, Jennifer Faberson, Trent Spurlock, 2007. An Archaeological Survey of a 100
Acre Parcel for the Proposed Sugarcamp No. 1 Coal Mine Operation, Franklin County, Illinois.
Cultural Resource Analysts, Inc.
Emerson, Thomas, Douglas Jackson, 1980. The Marcus Site (11-S-631) A Late Bluff and Early
Mississippian Occupation in the American Bottom. Department of Anthropology University of
Illinois Urbana-Champaign.
Emerson, Tom, Douglas Jackson, Sissel Johannessen, Lise Marx, George Milner, Alison Towers,
Lucy Walley, 1982. The BBB Motor Site (11-Ms-598): An early Mississippian Site in the
American Bottom. Department of Anthropology University of Illinois at Urbana-Champaign.
Emerson, Thomas, George R. Milner, and Douglas K. Jackson. 1983. The Florence Street Site.
Urbana & Chicago: University of Illinois Press.
Emerson, Thomas, and Dale McElrath, 2000. Toward an "Intrinsic Characteristics" Approach to
Chert Raw Material Classification: An American Bottom Example. Midcontinental Journal of
Archaeology, Vol. 25, No. 2.
Ensor, H. Blaine, Steve Titus, 2004. Phase II Archaeological Investigations at the Booster
Station Site (11MO768) Monroe County, Illinois. American Resource Group, Ltd.
Ensor, Blaine, Kathryn Parker, Jessica Allgood, Jeff Anderson, Mike McNerney, Steve Titus,
2009. Phase II Archaeological Investigations at the Fults Site (11MO1075) Monroe County,
Illinois. American Resource Group, Ltd.
Evans, Bryant, 1995. FAP-310 Project/Borrow Pit FA310-9a. Illinois Transportation
Archaeological Research Program.
Evans, Bryant, 1995. FAP-310 Project/Borrow Pit FA310-9b. Illinois Transportation
Archaeological Research Program.

84
Evans, J. Bryant, Madeleine Evans, Thomas Berres, Edwin Hajic, Sheena Beaverson, Andrea
Freeman, Mary Simon, 2000. Ringering: A Multicomponent Site in the American Bottom. Illinois
Transportation Archaeological Research Program.
Evans, Bryant, Madeleine Evans, Kathryn Parker, 2001. The Floyd Site: A Terminal Archaic
Habitiation in the Northern American Bottom. Illinois Transportation Archaeological Research
Program.
Evans, Madeleine, 2010. Archaeological Investigations at Site 11MS1435 (Refinery View Site)
for the FAP 310 Highway Project. Illinois State Archaeological Survey University of Illinois at
Urbana-Champaign.
Evans, Madeleine, 2011 Archaeological Investigations at Site 11MS627 (Shell Oil Site) for the
FAP-310 Highway Project. Archaeological Testing Short Report No. 304. Illinois State
Archaeological Survey at the University of Illinois at Urbana-Champaign.
Finney, Fred, Sissel Johannessen, 1981. The Carbon Dioxide Site: Late Woodland and Early
Mississippian Occupations on the American Bottom. Department of Anthropology University of
Illinois at Urbana-Champaign.
Fortier, Andrew, Fred Finney, 1979. Preliminary Report of Phase III Archaeological
Investigations at the Carbon Dioxide Site (11-Mo-594). Department of Anthropology University
of Illinois.
Fortier, Andrew, 1980. Final Report on Phase II Excavations at the Fiege Site (11-Mo-609).
Department of Anthropology University of Illinois Urbana-Champaign.
Fortier, Andrew, Sissel Johannessen, 1981. Archaeological Investigations of the Middle
Woodland Occupation at the Truck #7 and Go-Kart South Sites. Department of Anthropology
University of Illinois at Urbana-Champaign.
Fortier, Andrew, 1981. The Carbon Monoxide (11-Mo-593) Site: An Early and Middle
Woodland Occupation in the American Bottom. Department of Anthropology University of
Illinois at Urbana-Champaign.
Fortier, Andrew, Fred Finney, Richard Lacampagne, 1983. The Mund Site. Illinois
Archaeological Survey.
Fortier, Andrew, Richard Lacampagne, Fred Finney, 1984. The Fish Lake Site. Illinois
Archaeological Survey.
Fortier, Andrew, Fred Finney, Sissel Johannessen, 1984. The Robert Schneider Site (11-Ms-
1177). Department of Anthropology University of Illinois at Urbana-Champaign.
Fortier, Andrew, Douglas Jackson, 1988.Investigations at the Nochta Mainline Site (11Ms-128).
Department of Anthropology University of Illinois at Urbana-Champaign.

85
Fortier, Andrew, Madeleine Evans, Andrew Fortier, Michael Gornick, Steven Kuehn, Kathryn
Parker, Alexey Zelin, 2014. A Late Woodland Ceremonial and Extractive Campsite at the
Husted Site in the Northern American Bottoms Upland. Illinois State Archaeological Survey
Prairie Research Institute.
Fortier, Andrew, Brenda Beck, Madeleine Evans, Steven Kuehn, Kathryn Parker, Alexey Zelin,
2015. A Multi-Component Late Woodland Complex at the Vasey Site in the Northern American
Bottom Uplands. Illinois State Archaeological Survey Prairie Research Institute.
Fortier, Andrew, Brenda Beck, Amanda Butler, Madeleine Evans, Michael Gornick, Kristin
Hedman, Seven Kuehn, Kathryn Parker, Alexey Zelin, 2015(2). A Late Woodland Procurement
and Ceremonial Complex at the Reilley and Husted Sites in the Northern American Bottom.
Illinois State Archaeological Survey Prairie Research Institute.
Fortier, Andrew, Madeleine Evans, Andrew Fortier, Michael Gornick, Steven Kuehn, Kathryn
Parker, Adam Tufano, Alexey Zelin, 2016. Late Woodland Extractive Camps at the Ray’s Bluff
Site in the Northern American Bottom Upland. Illinois State Archaeological Survey Prairie
Research Institute.
Fortier, Andrew, Julie Bukowski, Melinda Carter, Madeleine Evans, Matthew Fort, Michael
Gornick, Eve Hargrave, Kristin Hedman, Steven Kuehn, Kathryn Parker, Adam Tufano, Alexey
Zelin, 2016(2). A Late Woodland Extractive Campsite and Designated Mortuary Location at the
Lillie Site in the Northern American Bottom Uplands. Illinois State Archaeological Survey
Prairie Research Institute.
Galloy, Joseph, Kathryn Parker, Nathan Babcook, 2000. Phase Three Archaeological Data
Recovery at the Bivouac Site (11MS1665) Madison County, Illinois. SCI Engineering, Inc.
Galloy, Joseph, 2001. Site 11B111 Mitigation Bond County, Illinois. SCI Engineering, Inc.
Galloy, Joseph, Brad Koldehoff, 2002. Illinois Route 3 Expansion and Realignment (FAP-14).
Illinois Transportation Archaeological Research Program.
Galloy, Joseph, 2003. CH 75/Governor’s Parkway; IL157 to IL143 (Edwardsville). Illinois
Transportation Archaeological Research Program.
Galloy, Joseph, 2005. Archaeological Investigations at Site 11CT225 (Harry Billhartz Site #1)
for the FAS 783/CH 8, Borrow 1/1 Project. Archaeological Testing Short Report No. 185.
Illinois Transportation Archaeological Research Program.
Galloy, Joseph, Steve Boles, Lenna Nash, and Charles O. Witty, 2013. Archaeological
Investigations at Site 11WM80 (Broglio Site) for the FAU 903/FAU 9588, Herrin to Johnston
City Blacktop Project. Illinois State Archaeological Survey.
Galloy, Joseph, Steven Boles, Mary Simon, Lucas Leady, 2015. FAP 312, IL Route 3 Waterloo
Bypass. IDOT Seq.# 11865A, 11869B. ISAS log # 11102. Illinois State Archaeological Survey
Prairie Research Institute.

86
Gaydos, Zack, Madeleine Evens, Adam Tuffano, Robert McCullough, 2016. Archaeological
Investigations at Site 11MS1956 (Long Haul Site) for the FAP-31-0 Highway Project.
Archaeological Testing Short Report No. 384. Illinois State Archaeological Survey at the
University of Illinois at Urbana-Champaign.
Goings, Chad A. 2003 A predictive model for lithic raw material in Iowa. Plains Anthropology,
Volume 48, No. 184.
Hammerstedt, Scott, and Erin Hughes, 2015. Mill Creek Chert Hoes and Prairie Soils:
Implications for Cahokian Production and Expansion. Midcontinental Journal of Archaeology,
Vol. 40 No. 2, 149–165
Hanenberger, Ned, Kathryn Parker, 1987. The Karol Kekas Site (11-Ms-1255): A Mississippian
Stirling Phase Occupation on the Bluffs above the American Bottoms. Department of
Anthropology University of Illinois at Urbana-Champaign.
Hargrave, Michael, Neal Lopinot, M. Michele Seme, 1982. Archaeological Investigations at the
Bluff Shadow Site Monroe County, Illinois. Center for Archeological Investigations Southern
Illinois University at Carbondale.
Hargrave, Michael, Brian Butler, Neal Lopinot, and Timothy Pugh, 1992. Mollie Baker (11-J-
964) A Woodland Period Site in the Kinkaid Creek Drainage, Jackson County, Illinois. Center
for Archaeological Investigations Southern Illinois University at Carbondale.
Hargrave, Michael, 1992. Archaeological Investigations at the Old Sawmill No. 2 Site (11-Jn-
108) Jefferson County, Illinois. Center for Archaeological Investigations Southern Illinois
University at Carbondale.
Hargrave, Michael, 1993. Archaeological Investigations at the Doll Head III Site (11-Jn-257)
Jefferson County, Illinois. Center for Archaeological Investigations Southern Illinois University
at Carbondale.
Harl, Joe, Robin Machiran, 2012. Phase II Archaeological Testing of Sites 11MS1049,
11MS1245, and 11MS1246 Granite City, Illinois. Archaeological Research Center of St. Louis,
Inc.
Hofman, Jack, and Carol Morrow. 1989. Chipped Stone Technologies at Twenhafel: A
multicomponent site in Southern Illinois. Lithic Resource Procurement: Proceeding From The
Second Conference on Prehistoric Chert Exploitation. United States. Southern Illinois
University.
Holley, George, Alan Brown, Neal Lopinot, 1989. Archaeological Investigations Relating to the
Glen Carbon Interceptor Sewer Line, Devision 3 through 7, Madison County, Illinois. Contract
Archaeology Program Southern Illinois University at Edwardsville.
Holley, George, 1993(1). Scott Joint-Use Airport, Jens Site S-784. Contract Archaeology
Program, Southern Illinois University at Edwardsville.

87
Holley, George, 1993(2). Scott Joint-Use Airport, Vesta Lembke Site S-782. Contract
Archaeology Program, Southern Illinois University at Edwardsville.
Holley, George, 1993(3). Scott Joint-Use Airport, E.J.Pfeifer Site #2 S-742. Contract
Archaeology Program, Southern Illinois University at Edwardsville.
Holley, George, 1993(4). Scott Joint-Use Airport, Site S-85 and S-781. Contract Archaeology
Program, Southern Illinois University at Edwardsville.
Holley, George, 1993(5). Scott Joint-Use Airport, Lembke Site #3 S-87. Contract Archaeology
Program, Southern Illinois University at Edwardsville.
Holley, George, 1993(6). Scott Joint-Use Airport, William Lembke Junior Site #1 S-234.
Contract Archaeology Program, Southern Illinois University at Edwardsville.
Holley, George, 1993(7). Scott Joint-Use Airport, Site S-889. Contract Archaeology Program,
Southern Illinois University at Edwardsville.
Holley, George, 1993(8). Scott Joint-Use Airport, J. Ernest Site S-793. Contract Archaeology
Program, Southern Illinois University at Edwardsville.
Holley, George, 1993(9). Scott Joint-Use Airport, Bill Schobert Site S-786. Contract
Archaeology Program, Southern Illinois University at Edwardsville.
Holley, George, 1993(10). Scott Joint-Use Airport, R.Hughes Site S-794. Contract Archaeology
Program, Southern Illinois University at Edwardsville.
Holley, George, 1993(11). Scott Joint-Use Airport, Crooked Creek Site #2 S-795. Contract
Archaeology Program, Southern Illinois University at Edwardsville.
Holley, George, 1993(12). Scott Joint-Use Airport, Site S-882. Contract Archaeology Program,
Southern Illinois University at Edwardsville.
Holley, George, 1993(13). Scott Joint-Use Airport, Richard Sprague Site S-764. Contract
Archaeology Program, Southern Illinois University at Edwardsville.
Holley, George, 1993(14). Scott Joint-Use Airport, Hess Site S-775. Contract Archaeology
Program, Southern Illinois University at Edwardsville.
Holley, George, 1993(15). Scott Joint-Use Airport, John H. Faust Site #1 S-237. Contract
Archaeology Program, Southern Illinois University at Edwardsville.
Holley, George, 1993(16). Scott Joint-Use Airport, William Lembke Jr Site #3 S-236. Contract
Archaeology Program, Southern Illinois University at Edwardsville.
Holley, George, 1993(17). Scott Joint-Use Airport, William Lembke Jr. Site #2 S-235. Contract
Archaeology Program, Southern Illinois University at Edwardsville.

88
Holley, George 1995(18). Cardinal Creek Residential Relocation in Association with Scott Joint-
Use Airport. Contract Archaeology Program, Southern Illinois University at Edwardsville.
Hollon, Debra, 2011. GIS and the Prehistoric Landscape: An Examination of Applicability. M.S.
Thesis, Ball State University, Indiana.
Howe, W. Gordon, Jim Snyder, and David McConkey, 1994. Phase I Survey of Six Tracts within
the Cypress Creek National Wildlife Refuge, Alexander, Pulaski, and Union Counties Illinois
and Phase II Testing at Site 11-U-682, Union County, Illinois. American Resources Group, Ltd.
Hoxie, R. David, Kurt Moore, Wes Neal, William Woods, William Cremin, Leonard Blake, Carl
Falk, Lynn Snyder, Colleen Hamilton, 1993. Phase III Archaeological Investigations at Site
21D3-67, A Multicomponent Site on White Walnut Creek in Consolidation Coal Company’s
Burning Star Mine #2, Deep Strip #3 Perry County, Illinois. American Resource Group, Ldt.
ISAS (Illinois State Archaeological Survey) 2017. CRM Report Archive, Accessed July 2017.
https://isas.illinois.edu/collections/crm_report_archive
Illinois State Museum, 2000. “Native American: Prehistoric Native American Cultures.
Accessed July 2017. http://www.museum.state.il.us/muslink/nat_amer/pre/
Illinois State Museum, 2006. “Projectile Point Type Collection”. Accessed July 2017.
http://www.museum.state.il.us/ismdepts/anthro/proj_point/points_timeline.html
Jackson, Douglas, Sandra Dunavan, 1987.Middle Woodland and Mississippian Short-Term
Occupations at the Willoughby Site (11-Ms-610). Department of Anthropology University of
Illinois at Urbana-Champaign.
Jackson, Douglas, Sandra Dunavan, 1988. Mississippian Occupation at the Esterlein Site (11-
Ms-598). Department of Anthropology University of Illinois at Urbana-Champaign.
Jackson, Douglas, Alexey Zelin, Madeleine Evans, 2011. Archaeological Investigations at Site
11MS637 (Barnhill’s Farmstead Site) for the FAP-310 Highway Project. Archaeological Testing
Short Report No. 306. Illinois State Archaeological Survey at the University of Illinois at
Urbana-Champaign.
Jackson, Douglas, Mary Simon, Lucretia Kelly, Eve Hargrave, 2014.Hawkins Hollow: A Late
Mississippian Household in the Southern American Bottom. Illinois State Archaeological Survey
Prairie Research Institute.
Kelly, John, Andrew Fortier, Seven Ozuk, Joyce Williams, Lucretia Kelly, Sissel Johannessen,
Paula Cross, George Milner, 1987. The Range Site: Archaic through Late Woodland Occupation.
Illinois Archaeological Survey.
Kelly, John, Kathryn Parker, 1997. Metro East Emergency Project: Phase I, II, and III
Archaeological Investigations of the Drainage Ditch Cleanout in Madison and St. Clair
Counties, Illinois. Illinois Transportation Archaeological Research Program.
89
Knight, Frances, Terrance Martin, J. Chris Richmond, Marjorie Schroeder, and Kenneth
Tankersley, 1992. Archaeological Investigations at the Swimming Snake Site Horseshoe Lake
Conservation Area, Alexander County, Illinois. Illinois State Museum.
Knight, Frances, and Brian Butler, 1995.Archaeological Survey on the Mississippi River
Floodplain, Union County Conservation Area, Illinois: Results of the 1994 Southern Illinois
University at Carbondale Field School Survey. Center for Archaeological Investigations
Southern Illinois University at Carbondale.
Koeppel, Christopher, 2001. CRM 1109 Phase II on 3 Sites for Construction of Transloading
Facility in Massoc County Illinois. Archaeological Survey Short Report.
Koeppel, Christopher, 2001(2). CRM 1110, Phase II on 4 sites for Shawnee Survey and
Consulting, Inc., Vienna, Illinois. Illinois Archaeological Short Report.
Koldenhoff, Brad, 1985. Southern Illinois Cherts: A Guide to Silicious Materials Exploited by
Prehistoric Populations in Southern Illinois. Center for Archaeological Investigations.
Koldehoff, Brad, and Mark Wagner, 1998. Archaeology and History of Horseshoe Lake
Alexander County, Illinois. Center for Archaeological Investigations.
Koldehoff, Brad, 2000. FAS 850, Ch2, Rogers Road Extension. Illinois Transportation
Archaeological Research Program.
Koldehoff, Brad, Kathryn Parker, Gregory Wilson, John Penman, 2001. The Woodland Ridge
Site: Archaeological Investigations on Salt Lick Point for the Expansion of Valmeyer, Monroe
County, Illinois. Illinois Transportation Archaeological Research Program.
Kruchten, Jeffery, S. Vanderford, E. Hargrave, C. Witty, 2004. Archaeological Investigations at
Site 11MS54 (St. Thomas Site) for the I-270, IL 111 to Mississippi River Project. Illinois
Transportation Archaeological Research Program.
Kruchten, Jeffery, K. Shane Vanderford, Eve Hargrave, Charles Witty, 2005. The St. Thomas
Site (11MS54) Madison County, Illinois. Illinois Transportation Archaeological Research
Program.
Kruchten, Jeffery, Mark Branstner, 2007. Archaeological Investigations at Site 11S69 (Faust
Site) for the FAI Route 64 St. Clair County Resurfacing and Bridge Rehabilitation Project.
Archaeological Testing Short Report No. 256. Illinois Transportation Archaeological Research
Program.
Kruchten, Jeffery, 2008. Archaeological Investigations at Site 11S71 (Knoebel Site) for the FAI
Route 64 St. Clair County Resurfacing and Bridge Rehabilitation Project. Archaeological
Testing Short Report No. 273. Illinois Transportation Archaeological Research Program.
Kullen, Douglas, 2000. Phase II National Register Evaluation of Sites 11U779 and 11U781 in
Cypress Creek National Wildlife Refuge Union County, Illinois. Allied Archaeology.
90
Lopinot, Neal, Alan Brown, George Holley, 1989, Archaeological Investigations of the Proposed
Sanitary Sewer Collection System, Eastern Portion of the Village of Fairmont, St. Clair and
Madison Counties, Illinois. Archaeology Program Southern Illinois University at Edwardsville.
Lopinot, Neal, 1991.The Diana Site (11-R-331) Randolph County, Illinois. Contract Archaeology
Program Southern Illinois University Edwardsville, Illinois.
Lomas, Monica Shah, Steve Titus, John Schwegman, 2011. Phase II Testing at Sites 11H2 and
11H27 Two Prehistoric Sites Located within the White Oak Resources Mine No. 1. Permit Area
in Hamilton County, Illinois. American Resource Group, Ltd.
Luedtke, Barbara. 1992. An Archeologist’s Guide to Chert and Flint. Los Angeles, California.
University of California.
Machiran, Robin, Susanna Bailey, John Kelly, 2005. Valmeyer KPR Development-Bluff
Meadows Subdivision, IAS No. 11MO475. CMVARI.
Machiran, Robin, Susanna Bailey, John Kelly, 2005(2). Valmeyer KPR Development-Bluff
Meadows Subdivision, IAS No. 11MO1032. CMVARI.
Machiran, Robin, Susanna Bailey, John Kelly, 2005(3). Valmeyer KPR Development-Bluff
Meadows Subdivision, IAS No. 11MO1033. CMVARI.
Machiran, Robin, Joe Harl, 2009. Phase II Testing of Site 11S446 on the Proposed Knollwood
Retirement Center Tract St. Clair County, Illinois. Archaeological Research Center of St. Louis,
Inc.
Machiran, Robin, John Klein, Joe Harl, Marge Schroeder, 2010. Data Recovery Investigations at
the Alexander Jacob Site. (11MS2288) in Granite City, Illinois. Archaeological Research Center
of St. Louis, Inc.
McCullough, Robert, Steven Kuehn, Robert McCullough, Kathryn Parker, Adam Tufano,
Alexey Zelin, 2015. Late Woodland Occupation at the Bland Site in the Northern American
Bottom. Illinois State Archaeological Survey Prairie Research Institute.
McCullough, Robert, Steven Kuehn, Kathryn Parker, Adam Tufano, Alexey Zelin, 2015(2).
Redwood, Cunningham, and Sponemann Occupations at the Tena Deye Site in the Northern
American Bottom. Illinois State Archaeological Survey Prairie Research Institute.
McElrath, Dale, 1986. The McLean Site. Illinois Archaeological Survey.
McElrath, Dale, Fred Finney, Marlene Moshage, Sissel Johannessen, Paula Cross, 1987. The
George Reeves Site. Illinois Archaeological Survey.
McElrath, Dale, Joyce Williams, Thomas Maher, Michael Meinkoth, Kathryn Parker, Maria
Mercer Hajic, Lucretia Kelly, 1987(2). Emergent Mississippian and Mississippian Communities
at the Radic Site (11-Ms-584). Illinois Archaeological Survey.

91
McNerney, Michael, William Cremin, William Folan, Fredrick Hill, Barry Konneker, and
Jeanette Stephens, 1975. Archaeological Investigations in the Cedar Creek Reservoir Jackson
County, Illinois. Southern Illinois University Carbondale.
McNerney, Michael, Jim Snyder, Wes Neal, David McCorkey, Paul Strader, Bonita Rubach,
Elizabeth Scott, 1996. Phase III Salvage Investigation at Site 11-R-604 After the Flood of 1993,
Kaskaskia Island, Randolph County, Illinois. American Resource Group.Ltd.
MCNerney, Michael, Wes Neal, 1998.Phase II Cultural Resource Investigation at Sites 11G326
and 11G329 within Black Beauty Coal Company’s Wildcat Hills Mine of the Gallatin County
Mine Permit Area, Gallatin County Illinois, Permit ILDNR LDR No 294.American Resource
Group, Ltd.
McNerney, Michael, Keith Keeney, Monica Shah, Cynthia Baer, 1999. A Phase II Investigation
of Sites 11G178, 11G188, 11G188, 11G190, and 11G200 within Black Beauty Coal Company’s
Cottage Grove Mine Permit Area, Gallatin County, Illinois. American Resources Group, Ltd.
McNerney, Michael Gregory Wolff, Keith Keeney, 1999. Phase II Testing at Sites 11PY179,
11PY180, and 11PY216 within Freeman United Coal Company’s Fidelity Walkers Creek Mine
Permit Area, Perry County, Illinois. American Resource Group, Ltd.
Meinholz, Norm, 1986. Archaeological Investigations at the Spring Branch Site Bond County,
Illinois. Department of Anthropology University of Illinois Urbana-Champaign.
Milner, George, Kelly Cox, Michael Meinkoth, Paula Cross, Sissel Johannessen, 1982. The
Robinson’s Lake Site (11-Ms-582) A Small Late Bluff Settlement. Department of Anthropology
University of Illinois at Urbana-Champaign.
Moffet, Charles, Brad Koldehof, William Cremin, Terrance Martin, Mary Carol Masulis, and
Mary McCorvie, 1992. The Little Muddy Rock Shelter: A Deep Stratified Prehistoric Site in the
Southern Till Plains of Illinois. American Cultural Resources Group, Ltd.
Moffat, Charles, Tamira Brennan, Brad Koldehoff, Shane Vanderford, Patti Wright, 2008.
Archaeological Investigations at the Quicksilver Site (11MS1992): A Mississippian Homestead
in the Silver Creek Headwaters, Madison County, Illinois. Illinois Transportation Archaeological
Research Program.
Moffat, Charles, Kathryn Parker, Terrance Martin, 2016. Phase III Data Recovery at Site
11MO1005, a Single-Component, Emergent Mississippian Site Located in the D & A Builders
Brellinger Subdivision Monroe County, Illinois. American Resource Group, Ltd.
Moffat, Charles, Brad Koldehoff, Mary Simon, K. Shane Vanderford, Alexey Zelin, 2016. The
Kane Village Site: A Terminal Late Woodland Habitation in Madison County, Illinois. Illinois
State Archaeological Survey Prairie Research Institute.
Moore, Kurt, and Michael McNerney, 1983. Phase II Investigations at the Westfield, Burning
Star Mine #5, Jackson County, Illinois. American Resource Group, Ltd.

92
Moore, Kurt, 1984. Cultural Resource Assessment of the Pitts Site (24B4-381) Shawnee National
Forest 43-51A8-3-586. American Resources Group, Ltd.
Morrow, Carol Ann. 1988. Chert Exploitation and Social Interaction in the Prehistoric Midwest,
200 B.C.-A.D.600. Ann Arbor, Michigan: A Bell And Howell Company.
Morrow, Carol, J. Michael Elam, and Michael Glascock, 1992. The Use of Blue-Grey Chert in
Midwestern Prehistory. Midcontinental Journal of Archaeology. Vol. 17, No. 2, 166-197.
Naglich, Dennis, 2002. Site 11MS2020 Phase II Testing Silver Creek Meadows. Archaeological
Research Center of St. Louis.
Neal, W. 1994. Phase II Cultural Resource Testing of sites 11MO797, 798, and 799 Located in
an Addition to Sterrit’s Run Subdivision in Waterloo, Illinois. American Resource Group, Ltd.
Odell, George. 1984. Chert Resource Availability in the Lower Illinois Valley: A Transect
Sample. Prehistoric Chert Exploitation: Studies from the Midcontinent. United States. Southern
Illinois University.
Parker, Katherine, 2002. Phase II and Phase III Archaeological Investigation at the Ameren 1
(11J1148), Ameren 2 (11J1149), and Hileman (11J1150) Sites, Ameren Grand Tower Power
Plant Jackson County, Illinois. American Resource Group, Ltd.
Penny, Jr, James, 1987.Archaeological Investigations for the Hard Times Timber Sale, Union
County, Illinois. Center for Archaeological Investigations Southern Illinois University at
Carbondale.
Pulcher, Ronald, 1975. Cobden-Kaolin Chert Source area: National Register of Historic Places
Inventory-Nomination Form. U.S. Department of Interior, National Park Service.
Pauketat, Timothy, Jeffery Kruchten, Susan Alt, 2015.Archaeological Test Excavations into
Mound 3 at the Emerald Site (11S1). Submitted to the Illinois Historic Preservation Agency In
fulfillment of HSRPA #2015-014.
Sant, Mark, Brad Koldehoff, and Kathryn Koldehoff, 1986. Archaeological Test Excavations at
Four Site Locations in Fort Massac State Park, Massac County, Illinois. Southern Illinois
University at Carbondale.
Santeford, Lawrence, and Neal Lopinot, 1979. Final Report on Archaeological Investigations at
Frog City and Red Light: Two Middle Woodland Period Sites in Alexander County, Illinois.
Center for Archaeological Investigations Southern Illinois University at Carbondale.
Scheid, Dwayne, Charles Witty, 2012. Archaeological Investigations at Site 11S71 (Knoebel) for
the I-64 Interchange a Rieder Road Project. Archaeological Testing Short Report No. 397.
Illinois State Archaeological Survey Prairie Research Institute.

93
Scheid, Dwayne, Steve Boles, Charles Witty, 2012. Archaeological Investigations at Site 11S816
(Knoebel South) for the I-64 Interchange a Rieder Road Project. Archaeological Testing Short
Report No. 397. Illinois State Archaeological Survey Prairie Research Institute.
Scheid, Dwayne, Mark Branstner, Charles Witty, 2012. Archaeological Investigations at Site
11S814 (George Perchbacher) for the I-64 Interchange a Rieder Road Project. Archaeological
Testing Short Report No. 398. Illinois State Archaeological Survey Prairie Research Institute.
Scheid, Dwayne,Mark Branstner, Charles Witty, 2012. Archaeological Investigations at Site
11S1098 (John Knoebel Site) for the I-64 Interchange a Rieder Road Project. Archaeological
Testing Short Report No. 413. Illinois State Archaeological Survey Prairie Research Institute.
Schwegman, John, 2006. Phase II Archaeological Investigations at Site 11SA463 Archaeological
Survey Short Report.
Schwegman, John, Jeff Myers, Gabrielle Aberle, Steve Titus, Cally Lence, Jennifer Williams,
Margaret Fink, 2007. Phase II Archaeological Investigations at Sites 11MS2018, 11MS2278,
11MS2277, 11MS2276, 11MS2275, 11B165, 11B164, 11B159, 11B155, 11FY204, and 11FY205
within the Keystone Pipeline Project Corridor, Madison, Bond, and Fayette Counties, Illinois.
American Resource Group, Ltd.
Schwegman, John, Monica Shah Lomas, H. Blaine Ensor, 2009. Phase II Archaeological
Investigations at Sites 11MS17 and 11MS619 within the Keystone Pipeline Project Corridor,
Madison County, Illinois. American Resource Group, Ltd.
Shah, Monica, Cally Lence, Kathryn Parker, Steve Titus, and Brad Williams, 2003. Phase II and
Phase III Archaeological Investigations at Sites 11J1115: A Mid-Nineteenth Century Squatter
Occupation in Jackson County, Illinois. American Resources Group, Ltd.
Snyder, David, 1991. Archaeological Test Excavations at Site 11-U-276, Union County
Conservation Area Road Realignment, Union County, Illinois. Archaeological Survey Short
Report.
Snyder, Jim, and Steve Titus, 1999. Phase II Testing at Site 11J129 within the Knight Hawk
Mine Permit Area, Jackson County, Illinois. American Resource Group, Ltd.
Snyder, Jim, Steve Titus, Chris Koeppel, Jeff Anderson, Blaine Ensor, Elizabeth Scott, and
Witty, C. 2002. Archaeological Survey Short Report Document Number 13487. Illinois
Transportation Archaeological Research Program.
Snyder, Jim, Cally Lence, and Steve Titus, 2002. Phase II Testing at 11MX269 at Cellular
Tower Site in Brookport; ARG CRM 1239. Archaeological Survey Short Report.
Spielbauer, Ronald. 1984. Potentialities for Trace Element Analyses in Southern Illinois Cherts.
Prehistoric Chert Exploitation: Studies from the Midcontinent. United States. Southern Illinois
University.

94
Stahl, Ann, James Porter, Charles Baries, Sissel Johannessen, Paul Cross, George Milner, 1985.
The Dohack Site. Illinois Archaeological Survey.
Stephens, Jeanette, and Lee Newsom, 1996.Archaeological Mitigation at the Dogtooth Bend Site
(11-Ax-31), Alexander County, Illinois. Center for Archaeological Investigations Southern
Illinois University at Carbondale.
Tankersley, Kenneth, Marjorie Schroeder, Terrance Martin, and J. Chris Richmond, 1991. Early
Mississippian Subsistence Activities on the Northern Fringes of the Gulf Coastal Plain. Illinois
State Museum.
Titus, Steve, Jim Snyder, Todd Ogier, Gordon Howe, and Michael McNerney, 1992. Phase II
Archaeological Investigations, at Sites 11-Sa-101, 11-Sa-217, and 11-Sa-234 Located within
Amax Coal Company’s Delta Mine Expansion, Saline County, Illinois. American Resources
Group, Ltd.
Titus, Steve, and Gordon Howe, 1993. Phase II Archaeological Investigations at Site 11-Sa-221
Located within the AMAX Coal Company’s Delta Mine Expansion, Saline County, Illinois.
American Resources Group, Ltd.
Titus, Steve, Cynthia Baer, and Greg Wolff, 2000. Phase II Archaeological Investigations at Site
11J967, City of Carbondale, Jackson County, Illinois. American Resource Group, Ltd.
Titus, Steve, 2002. Phase II Archaeological Investigations at Sites 11MO997, 11MO998, and
11S1520, D & A Builders Subdivision, Monroe and St. Clair County, Illinois. American
Resources Group, Ltd.
Titus, Steve, Chris Koeppel, Kathryn Parker, Lucretia Kelly, 2002. Phase II Archaeological
Investigations at Site 11MO1005, D & A Builders Subdivision, Monroe and St. Clair Counties,
Illinois. American Resource Group, Ltd.
Titus, Steve, Kevin Lomas, and Kathryn Parker, 2008. Phase II Archaeological Investigations at
Site 11WM355 and 11WM357 City of Marion Industrial Park, Williamson County, Illinois.
American Resource Group, Ltd.
Titus, Steve, H. Blaine Ensor, Karen Mayo, Kathryn Parker, 2010. Phase III Archaeological
Investigations at Site 11MS17 within the Illinois Segment of the Keystone Pipeline Project
Corridor, Madison County, Illinois. American Resource Group, Ltd.
USGS, 2005. “State Geologic Maps” Shapefile. USGS Mineral Resources.
Wagner, Mark, Mary McCorvie, Charles Foor, Kathryn Parker, 1992. Phase III Archaeological
Investigations at the Thanksgiving Site (21D3-242) in the Consolidation Coal Mine #2
Pinckneyville Pit #3 Extension Perry County, Illinois. American Resource Group, Ltd.
Wagner, Mark, Brad Koldehoff, William Cremin, Mary McCorvie, Leonard Blake, Jonathan
Bloom, 1994. The Bonnie Creek Site: A late Mississippian Homestead in the Upper Galum
Creek Valley, Perry County, Illinois. American Resource Group, Ltd.

95
Wagner, Mark, 1995. Cultural Resource Investigations at Site 11-Jn-291, Jefferson County,
Illinois. Center for Archaeological Investigations Southern Illinois University at Carbondale.
Wagner, Mark, 1995(2). Cultural Resources Investigations at the Heron Flats Site (11-Mw-279),
Williamson County, Illinois. Center for Archaeological Investigations Southern Illinois
University at Carbondale.
Wagner, Mark, 1998. The Archaeology and Rock Art of the Piney Creek Ravine Nature Preserve,
Jackson and Randolph Counties, Illinois. Center for Archaeological Investigations Southern
Illinois University at Carbondale.
Wagner, Mark, and Brian Butler, 1999. Archaeological Investigations of Three Sites at the
Southern Illinois Airport, Jackson County Illinois. Center for Archaeological Investigations
Southern Illinois University at Carbondale.
Wagner, Mark, Brain Butler, Brian DelCastello, Richard Herndon, Lucretia Kelly, and Kathryn
Parker, 2000. Archaeological Investigations at Dixon Springs State Park: The Hills Branch Rock
Shelter, Pope County, Illinois. Center for Archaeological Investigations Southern Illinois
University at Carbondale.
Wagner, Mark, 2005. Historical and Archaeological Investigations of Cantonment Wilkinson
(11Pu-281), An 1801-1802 U.S. Army Post in Pulaski County, Illinois. Center for Archaeological
Investigations Southern Illinois University at Carbondale.
Wagner, Mark, Brad Koldehoff, Candace Lutzow, Mary McCorvie, Johnathan Bloom, 2005.The
Lightfoot Site: An Early Late Woodland and Mississippian Occupation in the Upper Galum
Creek Valley, Perry County, Illinois: Phase III Excavations at the Consolidation Coal Company,
Northfield, Burning Star Mine #4. American Resource Group, Ltd.
Wagner, Mark, Brian Butler, Sarah Montieth, and Kathryn Parker. 2007, Archaeological
Investigations of the Julius and Maud Marlin Site, 11Sa-513, Saline County, Illinois. Center for
Archaeological Investigations Southern Illinois University at Carbondale.
Waltz, Gregory, Brian Adams, Jacqueline McDowell, Paul Kreisa, Kevin McGowan, Kirstin
Hedman, Cynthia Balek, 1997. Archeological Investigations for the Relocation of Valmeyer,
Monroe County, Illinois: Volume 3: The Stemler Bluff Site. Public Service Archaeological
Program Department of Anthropology University of Illinois at Urbana-Champaign.
Wells, Christy, 1992. Phase II Testing, Fohne Site, Thornbury Hill Subdivision. Contract
Archaeology Program, Southern Illinois University at Edwardsville.
Willman, H. B.,Elwood Atherton, T. C. Buschback, Charles Collinson, John Frye, M. E.
Hopkins, Jerry Lineback, and Jack Simon. 1975. Handbook of Illinois Stratigraphy. Urbana, Il.
Illinois State Geological Survey.
Wilson, Lucy, 2007. Understanding Prehistoric Lithic Raw Material Selection: Application of a
Gravity Model. Journal of Archaeological Method and Theory. Vol. 14. No. 4, 388-411.

96
Witty, Charles, Brad Koldehoff, 2005. Archaeological Investigations at Site 11S709
(Leprechaun Site) for the East Bank Pointe Development Project. Archaeological Testing Short
Report No. 200. Illinois Transportation Archaeological Research Program.
Zimmermann Holt, Julie, Miranda Yancey, Erin Marks, 2009.SIUE Field School Investigations
in the Locale of the D. Hitchins Site (11MS1124). Southern Illinois University Edwardsville.
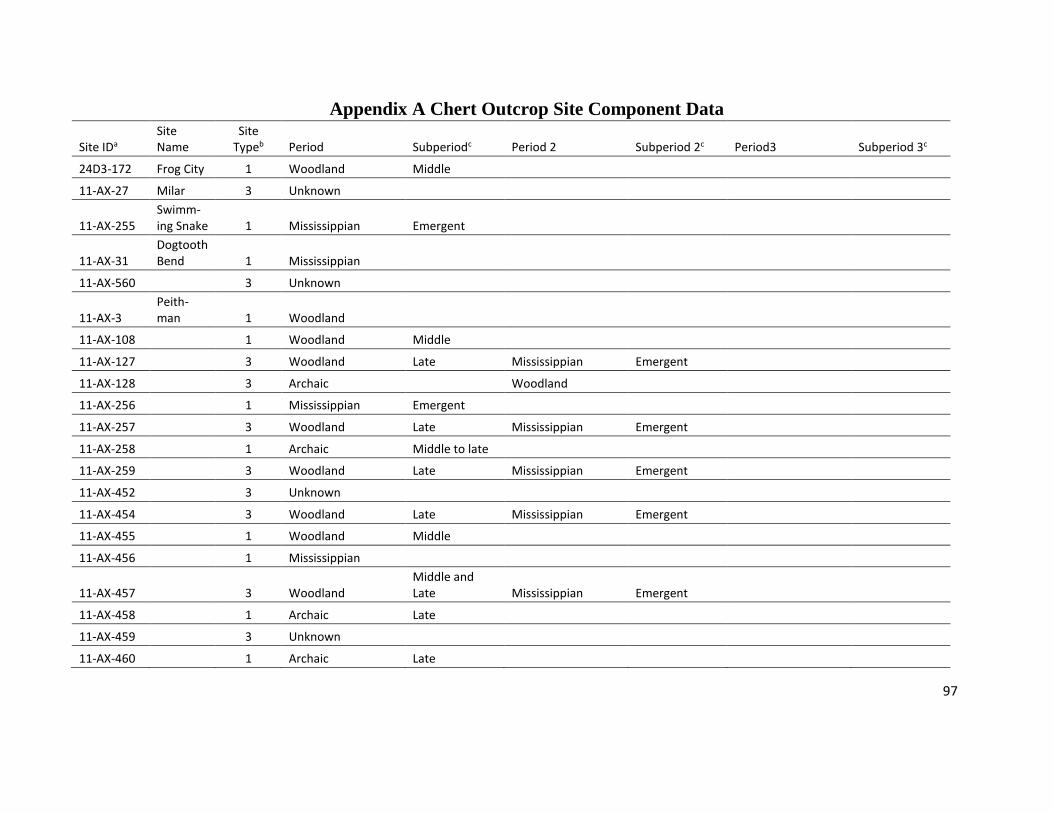
97
Appendix A Chert Outcrop Site Component Data
Site IDa
Site Name
Site Typeb Period Subperiodc Period 2 Subperiod 2c Period3 Subperiod 3c
24D3-172 Frog City 1 Woodland Middle
11-AX-27 Milar 3 Unknown
11-AX-255 Swimm-ing Snake 1 Mississippian Emergent
11-AX-31 Dogtooth Bend 1 Mississippian
11-AX-560 3 Unknown
11-AX-3 Peith-man 1 Woodland
11-AX-108 1 Woodland Middle
11-AX-127 3 Woodland Late Mississippian Emergent
11-AX-128 3 Archaic Woodland
11-AX-256 1 Mississippian Emergent
11-AX-257 3 Woodland Late Mississippian Emergent
11-AX-258 1 Archaic Middle to late
11-AX-259 3 Woodland Late Mississippian Emergent
11-AX-452 3 Unknown
11-AX-454 3 Woodland Late Mississippian Emergent
11-AX-455 1 Woodland Middle
11-AX-456 1 Mississippian
11-AX-457 3 Woodland Middle and Late Mississippian Emergent
11-AX-458 1 Archaic Late
11-AX-459 3 Unknown
11-AX-460 1 Archaic Late

98
Site IDa
Site Name
Site Typeb Period Subperiodc Period 2 Subperiod 2c Period3 Subperiod 3c
11-AX-461 3 Unknown
11-AX-462 3 Unknown
11-AX-463 1 Archaic Late
11-AX-465 3 Unknown
11-AX-467 3 Unknown
11-AX-468 1 Archaic Late
11-AX-469 3 Unknown
11-AX-472 3 Unknown
11-AX-474 3 Woodland Late Mississippian Emergent
11-AX-475 3 Woodland Middle and Late Mississippian Emergent
11-AX-476 3 Woodland Late Mississippian Emergent
11-AX-477 3 Unknown
11-AX-478 3 Unknown
11-AX-481 3 Unknown
11-AX-483 3 Woodland Late Mississippian Emergent
11-AX-485 3 Woodland Late Mississippian Emergent
11-AX-486 3 Unknown
11-PU-282 3 Woodland Late Mississippian
11-MX-238 3 Unknown
11-MX-208 3 Unknown
11-MX-278 3 Unknown
11-MX-279 1 Woodland Middle to late
11-MX-280 1 Woodland Middle to late
11-MX-269 3 Unknown

99
Site IDa
Site Name
Site Typeb Period Subperiodc Period 2 Subperiod 2c Period3 Subperiod 3c
11-MX-1 Kinkaid mound 1 Archaic
11-U-682 3 Archaic Late Woodland Early to Middle
11-PU-161F 1 Woodland Middle
11-AX-339 William-son 3 Unknown
24B4-381 Pitts 1 Woodland Late
11-U-779 1 Archaic
11-U-276 1 Woodland Late
11-JS-321 1 Archaic Early to late
11-JS-325 3 Archaic Late Woodland Early
11-JS-326 1 Woodland Early
11-JS-328 1 Woodland Early
11-JS-329 1 Woodland Early
11-PP-508
Hill Branch Rock Shelter 3 Archaic Early to late Woodland Early
24B2-59 3 Archaic Early and late Woodland Early to Middle Mississippian
24B3-99 Topping 1 Woodland Middle
24B3-100 Landreth #2 1 Woodland Middle
24B3-110
Throg-morton Dam 1 Woodland Middle to late
24B3-102 Beach 3 Archaic Late Woodland Middle
24B3-101 Landreth #1 3 Archaic Late Woodland Early
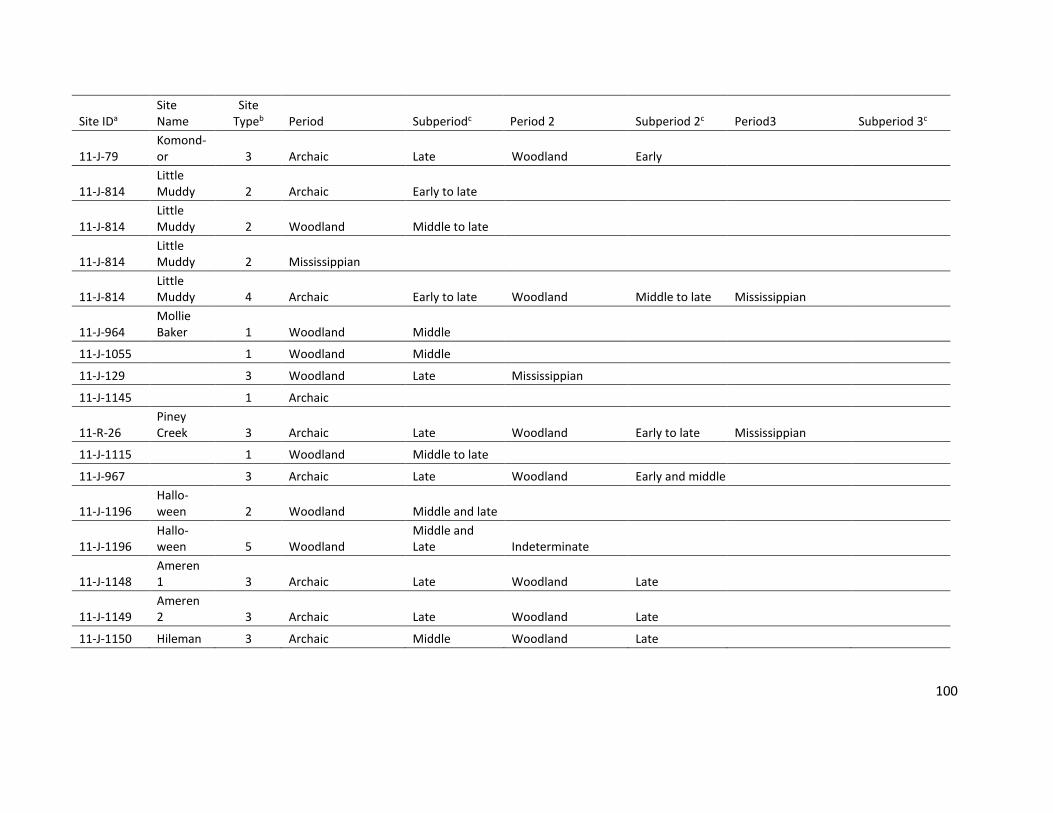
100
Site IDa
Site Name
Site Typeb Period Subperiodc Period 2 Subperiod 2c Period3 Subperiod 3c
11-J-79 Komond-or 3 Archaic Late Woodland Early
11-J-814 Little Muddy 2 Archaic Early to late
11-J-814 Little Muddy 2 Woodland Middle to late
11-J-814 Little Muddy 2 Mississippian
11-J-814 Little Muddy 4 Archaic Early to late Woodland Middle to late Mississippian
11-J-964 Mollie Baker 1 Woodland Middle
11-J-1055 1 Woodland Middle
11-J-129 3 Woodland Late Mississippian
11-J-1145 1 Archaic
11-R-26 Piney Creek 3 Archaic Late Woodland Early to late Mississippian
11-J-1115 1 Woodland Middle to late
11-J-967 3 Archaic Late Woodland Early and middle
11-J-1196 Hallo-ween 2 Woodland Middle and late
11-J-1196 Hallo-ween 5 Woodland
Middle and Late Indeterminate
11-J-1148 Ameren 1 3 Archaic Late Woodland Late
11-J-1149 Ameren 2 3 Archaic Late Woodland Late
11-J-1150 Hileman 3 Archaic Middle Woodland Late
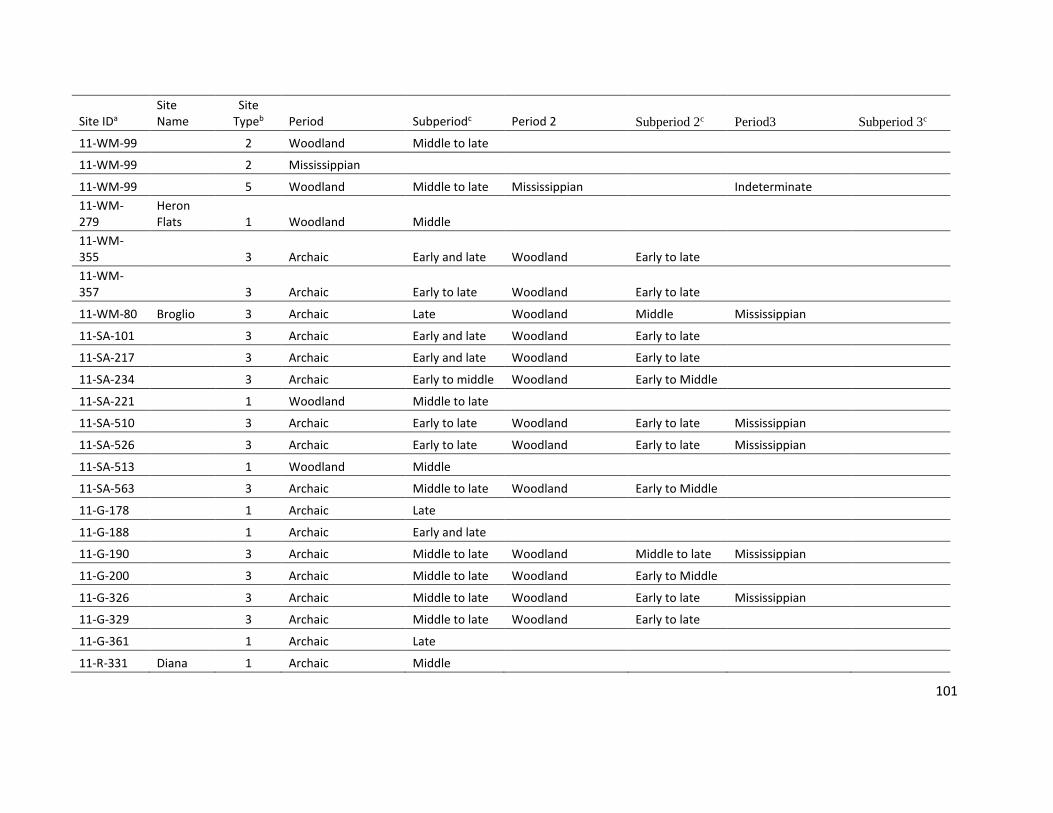
101
Site IDa
Site Name
Site Typeb Period Subperiodc Period 2 Subperiod 2c Period3 Subperiod 3c
11-WM-99 2 Woodland Middle to late
11-WM-99 2 Mississippian
11-WM-99 5 Woodland Middle to late Mississippian Indeterminate
11-WM-279
Heron Flats 1 Woodland Middle
11-WM-355 3 Archaic Early and late Woodland Early to late
11-WM-357 3 Archaic Early to late Woodland Early to late
11-WM-80 Broglio 3 Archaic Late Woodland Middle Mississippian
11-SA-101 3 Archaic Early and late Woodland Early to late
11-SA-217 3 Archaic Early and late Woodland Early to late
11-SA-234 3 Archaic Early to middle Woodland Early to Middle
11-SA-221 1 Woodland Middle to late
11-SA-510 3 Archaic Early to late Woodland Early to late Mississippian
11-SA-526 3 Archaic Early to late Woodland Early to late Mississippian
11-SA-513 1 Woodland Middle
11-SA-563 3 Archaic Middle to late Woodland Early to Middle
11-G-178 1 Archaic Late
11-G-188 1 Archaic Early and late
11-G-190 3 Archaic Middle to late Woodland Middle to late Mississippian
11-G-200 3 Archaic Middle to late Woodland Early to Middle
11-G-326 3 Archaic Middle to late Woodland Early to late Mississippian
11-G-329 3 Archaic Middle to late Woodland Early to late
11-G-361 1 Archaic Late
11-R-331 Diana 1 Archaic Middle

102
Site IDa
Site Name
Site Typeb Period Subperiodc Period 2 Subperiod 2c Period3 Subperiod 3c
11-R-604 Brown 3 Woodland Middle to late Mississippian
21C4-46 Bonnie Creek 1 Mississippian
21C4-35 Lightfoot 3 Woodland Late Mississippian
21D3-242 Thanks-giving 3 Archaic
Middle and Late Woodland Early to late
21D3-67 3 Archaic Late Woodland Middle to late Mississippian
11-PY-179 1 Woodland Early to middle
11-PY-180 1 Woodland Early to middle
11-PY-216 1 Woodland Middle
11-PY-198 Perrack-son 1 Mississippian late
21C4-9 Black Snake 1 Mississippian
11-FK-228 3 Unknown
11-H-2 3 Woodland Early to middle Mississippian
11-H-27 1 Woodland Late
11-M0-609 Fiege 1 Woodland Early
11-MO-594 Carbon Dioxide 2 Woodland Late
11-MO-594 Carbon Dioxide 2 Mississippian Early
11-MO-594 Carbon Dioxide 4 Woodland Late Mississippian Early
11-MO-200 Truck #7 1 Woodland Middle
11-MO-522S
Go Kart South 1 Woodland Early to middle

103
Site IDa
Site Name
Site Typeb Period Subperiodc Period 2 Subperiod 2c Period3 Subperiod 3c
11-MO-562 Bluff Shadow 1 Mississippian
11-MO-593
Carbon Monoxide 1 Woodland Middle
11-M0-797 3 Archaic Early to middle Mississippian Emergent
11-M0-798 1 Archaic Late
11-M0-799 1 Mississippian
11-M0-841 Strong 1 Archaic Middle
11-MO-891 Stemler Bluff 3 Woodland Late Mississippian Emergent
11-MO-636 Collin No. 2 3 Archaic Early and late Woodland Late
11-MO-672 Collin No. 3 3 Archaic Early Woodland Late
11-MO-973 Crooker-dale 1 Woodland Early to middle
11-MO-768 Booster Station 1 Woodland Middle
11-MO-997 3 Unknown
11-MO-998 3 Unknown
11-S-1520 1 Woodland late
11-MO-1005 1 Mississippian Emergent
11-MO-475 1 Archaic Early to middle
11-MO-1032 3 Archaic Early and late Woodland Late
11-MO-1033 1 Archaic Early

104
Site IDa
Site Name
Site Typeb Period Subperiodc Period 2 Subperiod 2c Period3 Subperiod 3c
11-MO-598 Power line 3 Woodland Late Mississippian
11-MO-725 Sheepshead 1 Woodland Late
11-MO-1068 Deer 3 Unknown
11-MO-599 Ramsey 3 Unknown
11-MO-855 Hawkins Hollow 1 Mississippian Late
11-MO-717 3 Archaic Early and late Woodland Late
11-MO-718 Dugan Airfield 3 Archaic Early and late Woodland Middle to late Mississippian
11-MO-880 Woodland Ridge 2 Woodland Late
11-MO-880 Woodland Ridge 2 Mississippian Emergent
11-MO-880 Woodland Ridge 4 Woodland Late Mississippian Emergent
11-MO-722 Leingang 1 Woodland Late
11-MO-776 Earl Kolmer 2 Woodland Middle
11-MO-776 Earl Kolmer 5 Archaic Early Woodland Middle to late Mississippian
11-MO-1075 Fults 3 Woodland Middle to late Mississippian
11-S-854 Fohne 1 Archaic Early
11-S-784 Jens 3 Archaic Woodland Late
11-S-782 Vesta Lembke 1 Mississippian Early

105
Site IDa
Site Name
Site Typeb Period Subperiodc Period 2 Subperiod 2c Period3 Subperiod 3c
11-S-242
E.J. Pheifer #2 1 Woodland Late
11-S-85 Lembke #1 1 Woodland Late
11-S-87 Lembke #3 3 Archaic Early and late Woodland Early and late Mississippian
11-S-234
William Lembke Jr. #1 3 Archaic Late Woodland Late
11-S-889 1 Mississippian
11-S-793 J. Ernest 1 Woodland Early to late
11-S-786 Bill Schobert 1 Woodland Late
11-S-794 Hughes 3 Archaic Early Woodland Early
11-S-795 Crooked Creek #2 1 Archaic Early
11-S-882 1 Archaic
11-S-762 Richard Sprangue 1 Archaic
11-S-775 Hess 1 Woodland Late
11-S-237 John H. Faust #1 3 Woodland Middle to late Mississippian
11-S-236
William Lembke Jr. #3 3 Archaic Woodland Mississippian
11-S-235
William Lembke Jr. #2 3 Woodland Early to late Mississippian
11-S-1061 Kell 3 Archaic Early to late Woodland Middle

106
Site IDa
Site Name
Site Typeb Period Subperiodc Period 2 Subperiod 2c Period3 Subperiod 3c
11-S-1148 Reach B 2 Mississippian
11-S-1148 Reach B 2 Woodland Late
11-S-1148 Reach B 4 Woodland Late Mississippian
11-S-19
Booker T. Washington 3 Woodland Late Mississippian Emergent
11-S-1033 Wessen 1 Mississippian Emergent
11-S-1161 Charles Hytla 1 Mississippian
11-S-709 Lepre-chaun 3 Woodland Early to late Mississippian
11-S-69 Faust 1 Woodland Late
11-S-1446 1 Mississippian
11-S-1637 1 Mississippian
11-S-71 Knoebel 5 Woodland Late Mississippian
11-S-71 Knoebel 2 Mississippian
11-S-816 Knoebel south 3 Archaic Early to late Woodland Early to late Mississippian
11-S-814
George Perch-bacher 1 Mississippian
11-S-1098 John Knoebel 1 Archaic Middle
11-S-729 Wilder-man 1 Woodland Late
11-S-730 Orville Seibert 3 Woodland Late Mississippian
11-S-747 Classen 1 Woodland Late
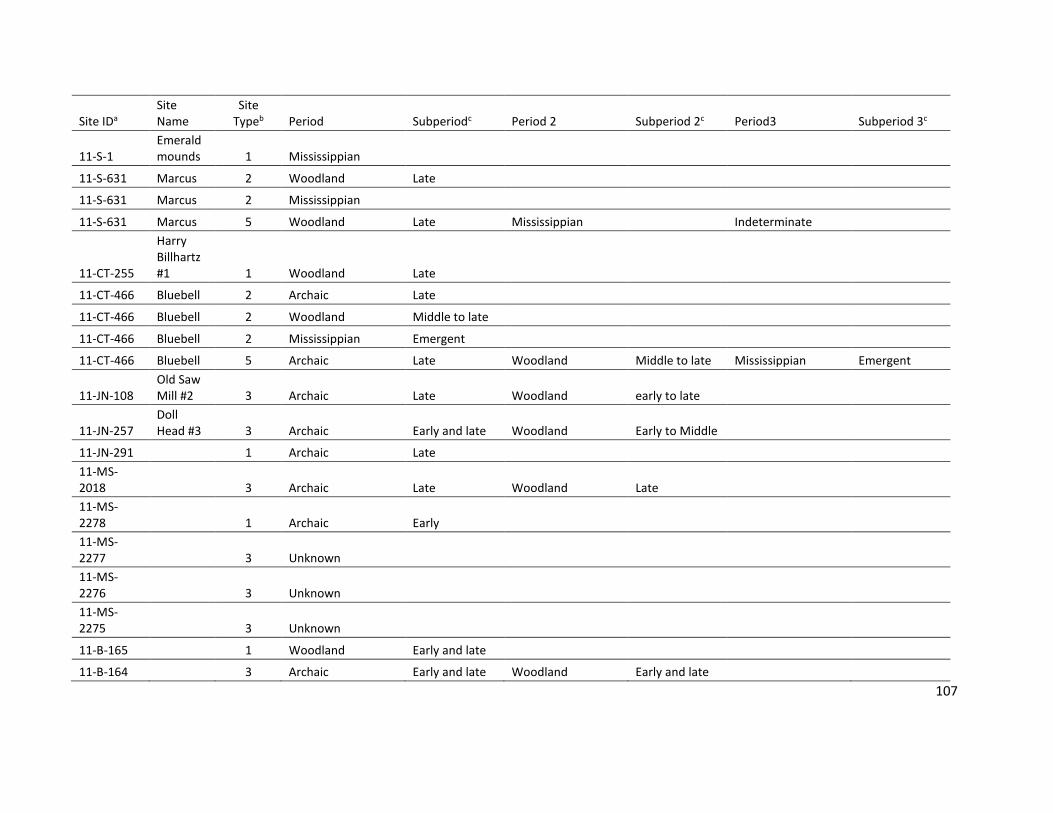
107
Site IDa
Site Name
Site Typeb Period Subperiodc Period 2 Subperiod 2c Period3 Subperiod 3c
11-S-1 Emerald mounds 1 Mississippian
11-S-631 Marcus 2 Woodland Late
11-S-631 Marcus 2 Mississippian
11-S-631 Marcus 5 Woodland Late Mississippian Indeterminate
11-CT-255
Harry Billhartz #1 1 Woodland Late
11-CT-466 Bluebell 2 Archaic Late
11-CT-466 Bluebell 2 Woodland Middle to late
11-CT-466 Bluebell 2 Mississippian Emergent
11-CT-466 Bluebell 5 Archaic Late Woodland Middle to late Mississippian Emergent
11-JN-108 Old Saw Mill #2 3 Archaic Late Woodland early to late
11-JN-257 Doll Head #3 3 Archaic Early and late Woodland Early to Middle
11-JN-291 1 Archaic Late
11-MS-2018 3 Archaic Late Woodland Late
11-MS-2278 1 Archaic Early
11-MS-2277 3 Unknown
11-MS-2276 3 Unknown
11-MS-2275 3 Unknown
11-B-165 1 Woodland Early and late
11-B-164 3 Archaic Early and late Woodland Early and late
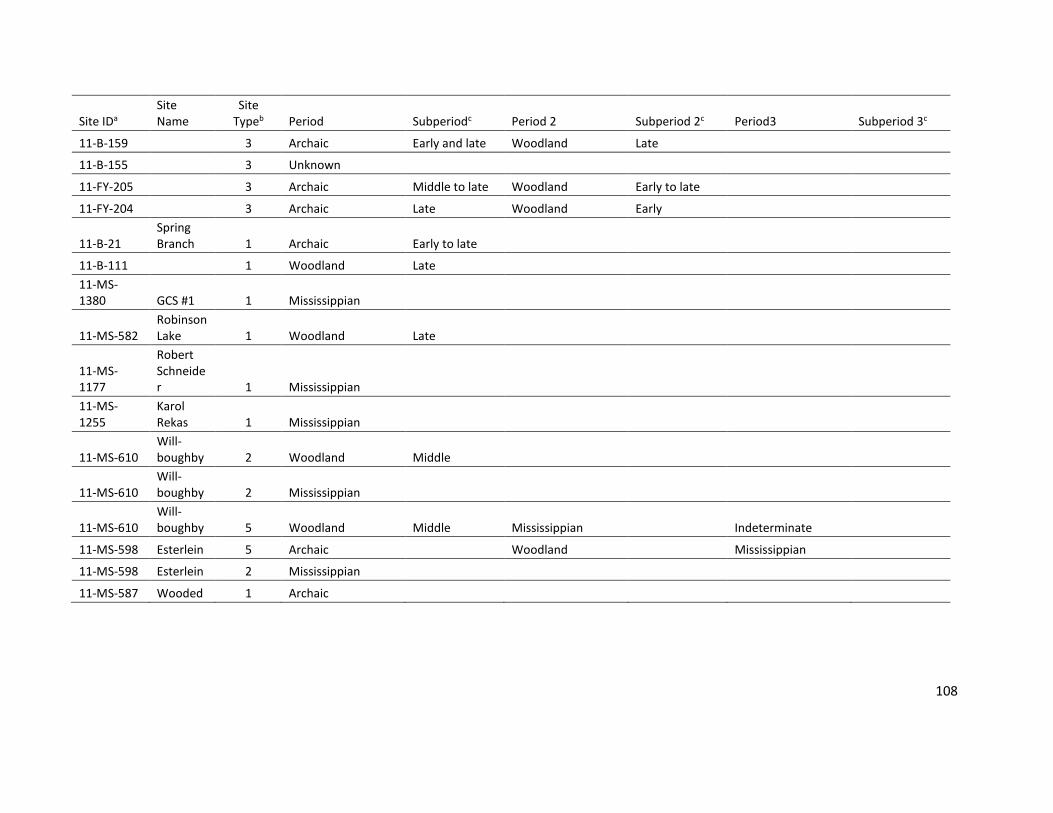
108
Site IDa
Site Name
Site Typeb Period Subperiodc Period 2 Subperiod 2c Period3 Subperiod 3c
11-B-159 3 Archaic Early and late Woodland Late
11-B-155 3 Unknown
11-FY-205 3 Archaic Middle to late Woodland Early to late
11-FY-204 3 Archaic Late Woodland Early
11-B-21 Spring Branch 1 Archaic Early to late
11-B-111 1 Woodland Late
11-MS-1380 GCS #1 1 Mississippian
11-MS-582 Robinson Lake 1 Woodland Late
11-MS-1177
Robert Schneider 1 Mississippian
11-MS-1255
Karol Rekas 1 Mississippian
11-MS-610 Will-boughby 2 Woodland Middle
11-MS-610 Will-boughby 2 Mississippian
11-MS-610 Will-boughby 5 Woodland Middle Mississippian Indeterminate
11-MS-598 Esterlein 5 Archaic Woodland Mississippian
11-MS-598 Esterlein 2 Mississippian
11-MS-587 Wooded 1 Archaic
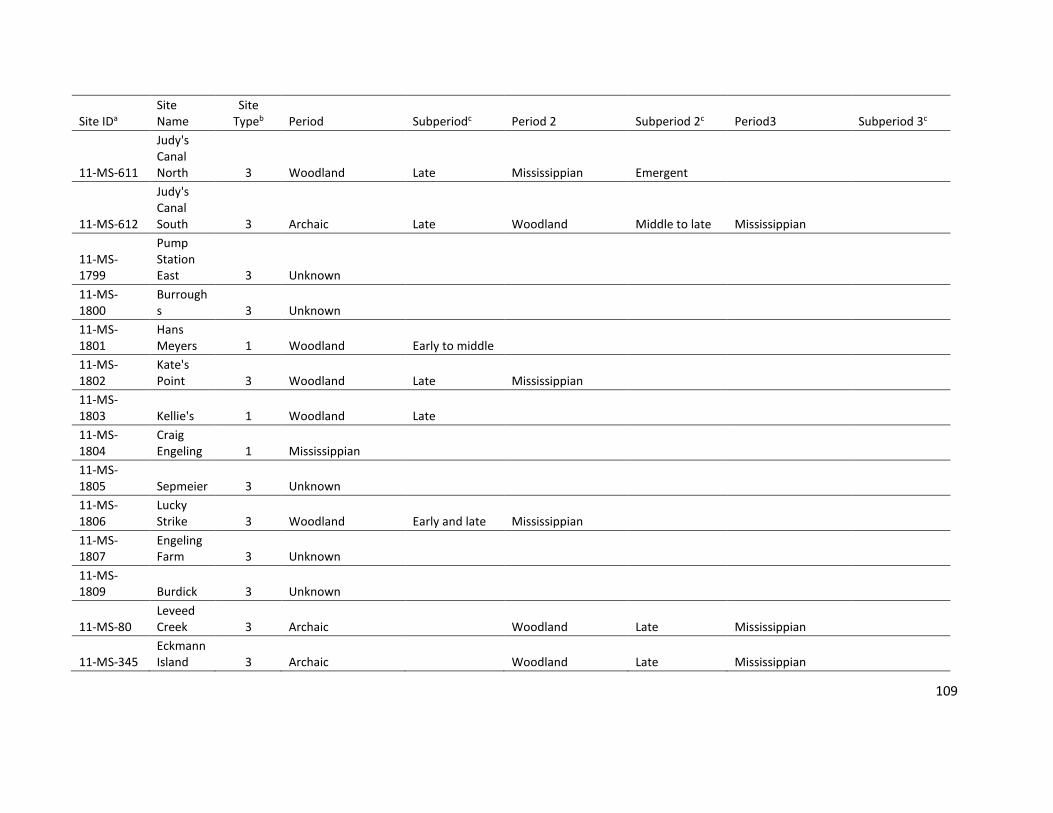
109
Site IDa
Site Name
Site Typeb Period Subperiodc Period 2 Subperiod 2c Period3 Subperiod 3c
11-MS-611
Judy's Canal North 3 Woodland Late Mississippian Emergent
11-MS-612
Judy's Canal South 3 Archaic Late Woodland Middle to late Mississippian
11-MS-1799
Pump Station East 3 Unknown
11-MS-1800
Burroughs 3 Unknown
11-MS-1801
Hans Meyers 1 Woodland Early to middle
11-MS-1802
Kate's Point 3 Woodland Late Mississippian
11-MS-1803 Kellie's 1 Woodland Late
11-MS-1804
Craig Engeling 1 Mississippian
11-MS-1805 Sepmeier 3 Unknown
11-MS-1806
Lucky Strike 3 Woodland Early and late Mississippian
11-MS-1807
Engeling Farm 3 Unknown
11-MS-1809 Burdick 3 Unknown
11-MS-80 Leveed Creek 3 Archaic Woodland Late Mississippian
11-MS-345 Eckmann Island 3 Archaic Woodland Late Mississippian

110
Site IDa
Site Name
Site Typeb Period Subperiodc Period 2 Subperiod 2c Period3 Subperiod 3c
11-MS-517 Spone-mann 3 Archaic Early to late Woodland Middle Mississippian
11-MS-1330
School-house Branch South 1 Mississippian
11-MS-1778
Nad Enoob 3 Woodland
Middle and Late Mississippian
11-MS-1815
Curve in the road 1 Woodland
11-MS-1816
Burns Farm 3 Unknown
11-MS-1817
Burns Trash 3 Unknown
11-MS-1818
Schneider Ditch 3 Unknown
11-MS-1819 Spa 3 Unknown
11-MS-1820
Diane's Place 3 Unknown
11-S-316 Axis 3 Unknown
11-S-460 Thereon 1 Archaic Middle
11-S-596 Chevy Chase 3 Woodland Late Mississippian Emergent
11-S-1234 Harding 3 Unknown
11-S-1236 Sage 3 Unknown
11-S-1278 Creamer House 3 Woodland Middle to late Mississippian Emergent
11-S-1279 Earl Crates 3 Woodland Middle Mississippian

111
Site IDa
Site Name
Site Typeb Period Subperiodc Period 2 Subperiod 2c Period3 Subperiod 3c
11-S-1280 Bevelot 1 Mississippian
11-S-1281 Illinsky 1 Mississippian Emergent
11-S-1282 Lavonne Cates 1 Woodland Late
11-S-1283 Levee Road 3 Woodland Late Mississippian Emergent
11-S-1284 Golf Course 3 Unknown
11-S-1285 Hidden Trail 3 Unknown
11-S-1252 Mullins Creek 3 Woodland Early and late Mississippian
11-S-1253 Morgan 3 Archaic Late Woodland Late Mississippian
11-S-1254 Eichaker 1 Archaic
11-S-1255 Eagle's Nest 3 Archaic Late Woodland Late Mississippian
11-S-1256 John Hays 3 Archaic Late Woodland Early and late Mississippian
11-S-1257 Pelanek 3 Woodland Early and late Mississippian Emergent and late
11-S-1258 Little Knob 3 Woodland Late Mississippian Emergent
11-S-1259 Cruse 1 Mississippian
11-S-1260 Baxter 1 Woodland Late
11-S-1261 Hertel 1 Archaic Late
11-S-1262 DeFosset 3 Woodland Early Mississippian
11-S-1263 Leveed Ridge 3 Unknown
11-S-1264 Little Rise 3 Unknown
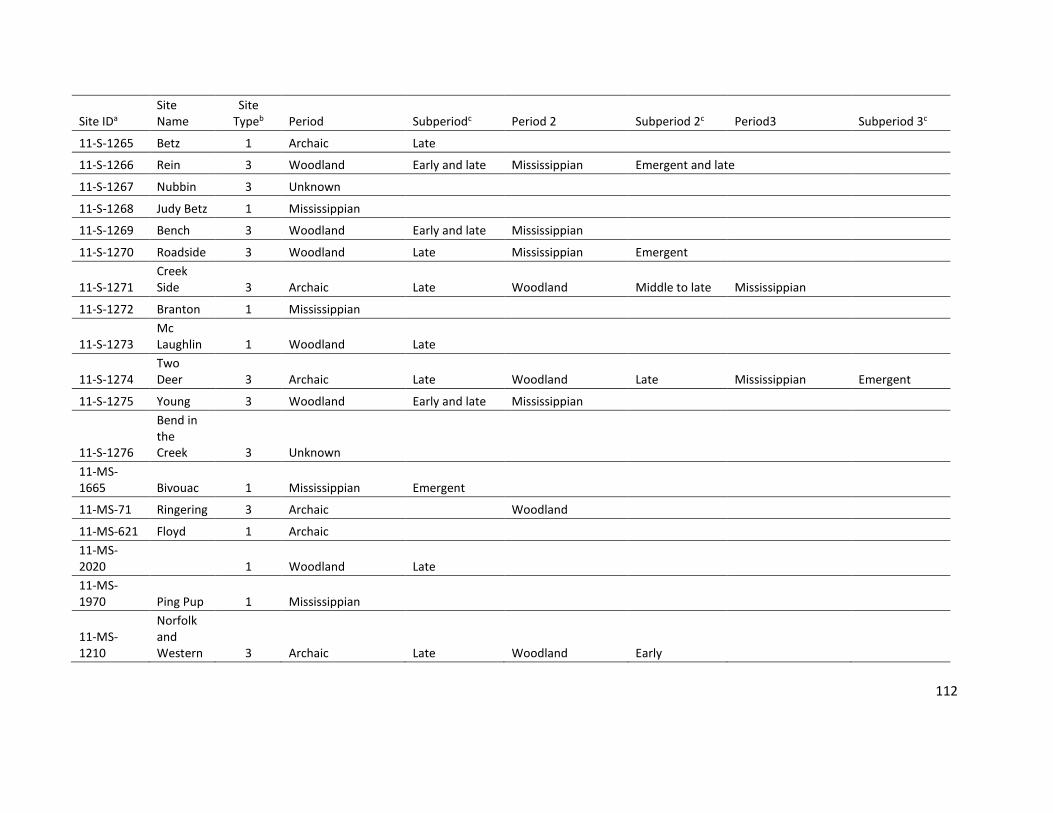
112
Site IDa
Site Name
Site Typeb Period Subperiodc Period 2 Subperiod 2c Period3 Subperiod 3c
11-S-1265 Betz 1 Archaic Late
11-S-1266 Rein 3 Woodland Early and late Mississippian Emergent and late
11-S-1267 Nubbin 3 Unknown
11-S-1268 Judy Betz 1 Mississippian
11-S-1269 Bench 3 Woodland Early and late Mississippian
11-S-1270 Roadside 3 Woodland Late Mississippian Emergent
11-S-1271 Creek Side 3 Archaic Late Woodland Middle to late Mississippian
11-S-1272 Branton 1 Mississippian
11-S-1273 Mc Laughlin 1 Woodland Late
11-S-1274 Two Deer 3 Archaic Late Woodland Late Mississippian Emergent
11-S-1275 Young 3 Woodland Early and late Mississippian
11-S-1276
Bend in the Creek 3 Unknown
11-MS-1665 Bivouac 1 Mississippian Emergent
11-MS-71 Ringering 3 Archaic Woodland
11-MS-621 Floyd 1 Archaic
11-MS-2020 1 Woodland Late
11-MS-1970 Ping Pup 1 Mississippian
11-MS-1210
Norfolk and Western 3 Archaic Late Woodland Early
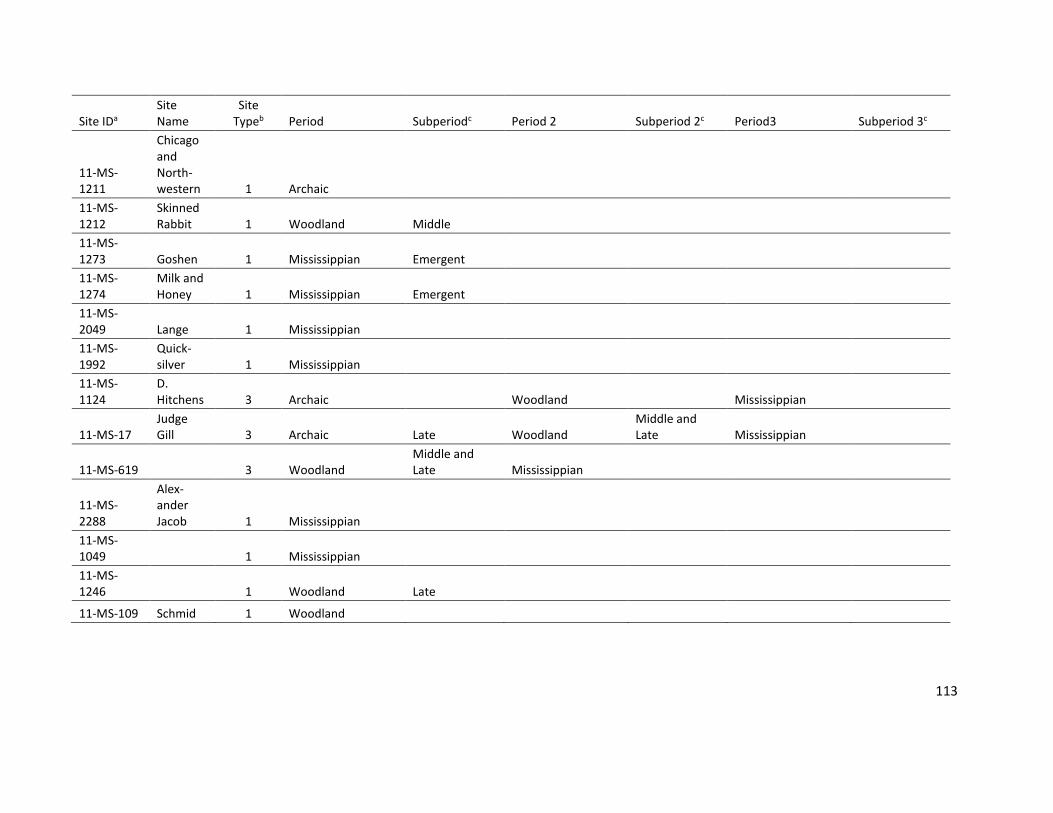
113
Site IDa
Site Name
Site Typeb Period Subperiodc Period 2 Subperiod 2c Period3 Subperiod 3c
11-MS-1211
Chicago and North-western 1 Archaic
11-MS-1212
Skinned Rabbit 1 Woodland Middle
11-MS-1273 Goshen 1 Mississippian Emergent
11-MS-1274
Milk and Honey 1 Mississippian Emergent
11-MS-2049 Lange 1 Mississippian
11-MS-1992
Quick-silver 1 Mississippian
11-MS-1124
D. Hitchens 3 Archaic Woodland Mississippian
11-MS-17 Judge Gill 3 Archaic Late Woodland
Middle and Late Mississippian
11-MS-619 3 Woodland Middle and Late Mississippian
11-MS-2288
Alex-ander Jacob 1 Mississippian
11-MS-1049 1 Mississippian
11-MS-1246 1 Woodland Late
11-MS-109 Schmid 1 Woodland

114
Site IDa
Site Name
Site Typeb Period Subperiodc Period 2 Subperiod 2c Period3 Subperiod 3c
11-MS-1960 Husted 1 Woodland Late
11-MS-526 Ray Bluff 1 Woodland Late
11-MS-923 Bland 3 Archaic Early and late Woodland Early to late
11-MS-636 Vasey 1 Woodland Late
11-MS-769 Tena Deye 1 Woodland Late
11-MS-1956
Long Haul 3 Archaic late Woodland Early and late
11-MS-2248 McCoy 3 Unknown
11-MS-662 Lillie 1 Woodland Late
11-MS-54 St. Thomas 1 Mississippian
11-MS-1350 Style 3 Archaic Woodland Mississippian Emergent
11-MS-584 Radic 1 Mississippian
11-MS-595 BBB Motor 1 Mississippian Early
11-MS-1435 3 Archaic Woodland Early to late Mississippian
11-MS-1614 Meeks 1 Archaic Early
11-MS-2300
Auburn Sky 3 Woodland Late Mississippian
11-MS-2317 Herter 1 Archaic Late
11-MS-672 Shell oil 3 Woodland Early and late Mississippian

115
Site IDa
Site Name
Site Typeb Period Subperiodc Period 2 Subperiod 2c Period3 Subperiod 3c
11-MS-637
Barnhill's Farm-stead 3 Archaic Late Woodland Middle to late Mississippian
11-MS-27 Riley 1 Woodland Late
11-MS-52 Kane Village 1 Woodland Late
11-S-47 Range 2 Archaic Late
11-S-47 Range 2 Woodland Early to late
11-S-47 Range 4 Archaic Late Woodland Early to late
11-S-650 George Reeves 2 Archaic Late
11-S-650 George Reeves 2 Woodland Late
11-S-650 George Reeves 2 Mississippian
11-S-650 George Reeves 4 Archaic Late Woodland Late Mississippian
11-S-640 McLean 3 Archaic Late Mississippian
11-S-642 Dohack 2 Woodland Late
11-S-642 Dohack 2 Mississippian
11-S-642 Dohack 4 Woodland Late Mississippian
11-S-629 Columbia Quarry 1 Woodland Late
11-S-699 Cramer #2 1 Woodland Late
11-MO-608 Fish Lake 1 Woodland Late
11-S-435 Mund 1 Woodland Middle to late

116
a Site IDs and names were identified in the reports and registered with the state SHPO. Site name was given to the site by the archaeologist registering the
site with the state SHPO. Site ID format is determined by the state and county in which they are located. The number 11 indicates the state of Illinois.
The following letters indicate the county and the final numbers specifies site identification the number. b
Multiple lines of data for the same site include data from the entire site when the site type is 4 or 5, when the site type is 1 or 2 only data from one
period is included. c Components are taken from the site reports. Cultural components that are subdivisions of Archaic, Woodland or Mississippian will be combined with
the appropriate overarching component.
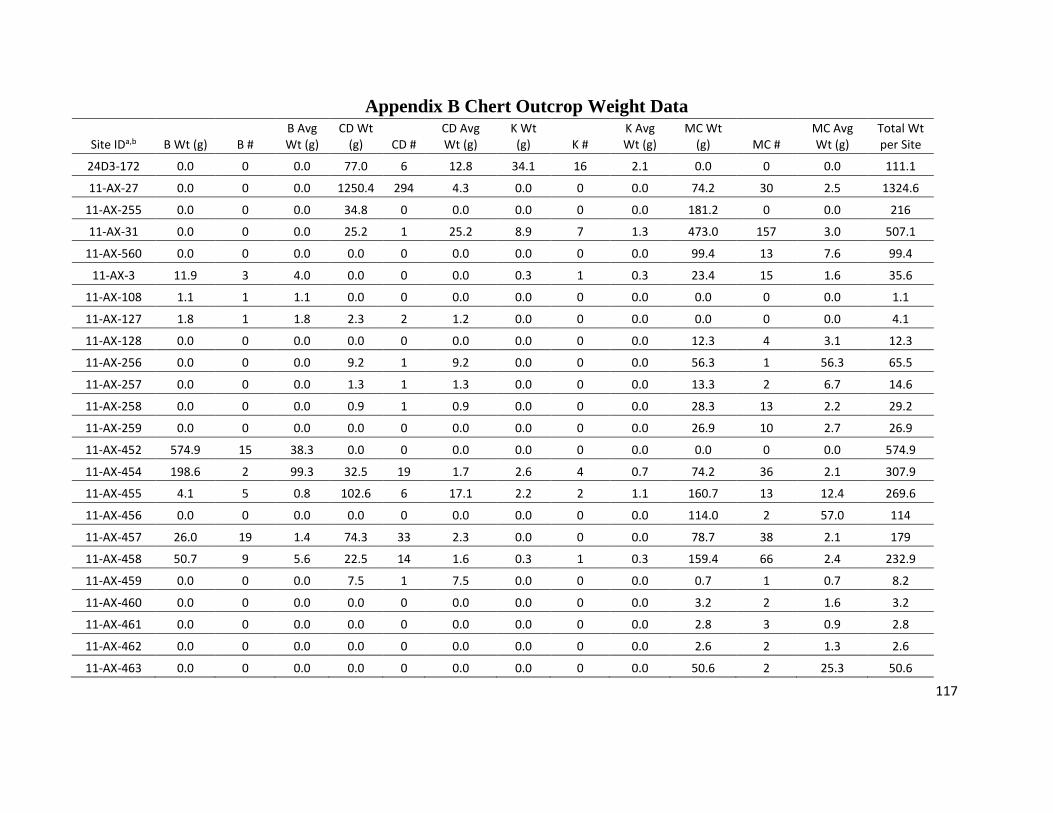
117
Appendix B Chert Outcrop Weight Data
Site IDa,b B Wt (g) B # B Avg Wt (g)
CD Wt (g) CD #
CD Avg Wt (g)
K Wt (g) K #
K Avg Wt (g)
MC Wt (g) MC #
MC Avg Wt (g)
Total Wt per Site
24D3-172 0.0 0 0.0 77.0 6 12.8 34.1 16 2.1 0.0 0 0.0 111.1
11-AX-27 0.0 0 0.0 1250.4 294 4.3 0.0 0 0.0 74.2 30 2.5 1324.6
11-AX-255 0.0 0 0.0 34.8 0 0.0 0.0 0 0.0 181.2 0 0.0 216
11-AX-31 0.0 0 0.0 25.2 1 25.2 8.9 7 1.3 473.0 157 3.0 507.1
11-AX-560 0.0 0 0.0 0.0 0 0.0 0.0 0 0.0 99.4 13 7.6 99.4
11-AX-3 11.9 3 4.0 0.0 0 0.0 0.3 1 0.3 23.4 15 1.6 35.6
11-AX-108 1.1 1 1.1 0.0 0 0.0 0.0 0 0.0 0.0 0 0.0 1.1
11-AX-127 1.8 1 1.8 2.3 2 1.2 0.0 0 0.0 0.0 0 0.0 4.1
11-AX-128 0.0 0 0.0 0.0 0 0.0 0.0 0 0.0 12.3 4 3.1 12.3
11-AX-256 0.0 0 0.0 9.2 1 9.2 0.0 0 0.0 56.3 1 56.3 65.5
11-AX-257 0.0 0 0.0 1.3 1 1.3 0.0 0 0.0 13.3 2 6.7 14.6
11-AX-258 0.0 0 0.0 0.9 1 0.9 0.0 0 0.0 28.3 13 2.2 29.2
11-AX-259 0.0 0 0.0 0.0 0 0.0 0.0 0 0.0 26.9 10 2.7 26.9
11-AX-452 574.9 15 38.3 0.0 0 0.0 0.0 0 0.0 0.0 0 0.0 574.9
11-AX-454 198.6 2 99.3 32.5 19 1.7 2.6 4 0.7 74.2 36 2.1 307.9
11-AX-455 4.1 5 0.8 102.6 6 17.1 2.2 2 1.1 160.7 13 12.4 269.6
11-AX-456 0.0 0 0.0 0.0 0 0.0 0.0 0 0.0 114.0 2 57.0 114
11-AX-457 26.0 19 1.4 74.3 33 2.3 0.0 0 0.0 78.7 38 2.1 179
11-AX-458 50.7 9 5.6 22.5 14 1.6 0.3 1 0.3 159.4 66 2.4 232.9
11-AX-459 0.0 0 0.0 7.5 1 7.5 0.0 0 0.0 0.7 1 0.7 8.2
11-AX-460 0.0 0 0.0 0.0 0 0.0 0.0 0 0.0 3.2 2 1.6 3.2
11-AX-461 0.0 0 0.0 0.0 0 0.0 0.0 0 0.0 2.8 3 0.9 2.8
11-AX-462 0.0 0 0.0 0.0 0 0.0 0.0 0 0.0 2.6 2 1.3 2.6
11-AX-463 0.0 0 0.0 0.0 0 0.0 0.0 0 0.0 50.6 2 25.3 50.6
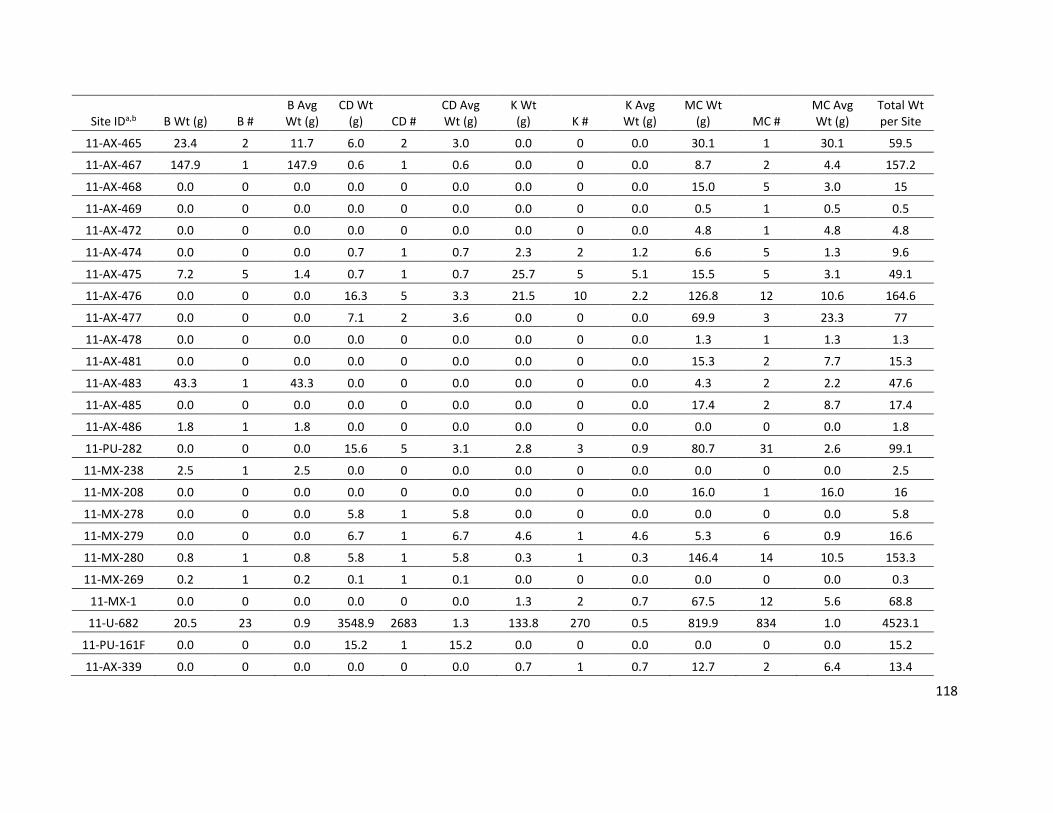
118
Site IDa,b B Wt (g) B # B Avg Wt (g)
CD Wt (g) CD #
CD Avg Wt (g)
K Wt (g) K #
K Avg Wt (g)
MC Wt (g) MC #
MC Avg Wt (g)
Total Wt per Site
11-AX-465 23.4 2 11.7 6.0 2 3.0 0.0 0 0.0 30.1 1 30.1 59.5
11-AX-467 147.9 1 147.9 0.6 1 0.6 0.0 0 0.0 8.7 2 4.4 157.2
11-AX-468 0.0 0 0.0 0.0 0 0.0 0.0 0 0.0 15.0 5 3.0 15
11-AX-469 0.0 0 0.0 0.0 0 0.0 0.0 0 0.0 0.5 1 0.5 0.5
11-AX-472 0.0 0 0.0 0.0 0 0.0 0.0 0 0.0 4.8 1 4.8 4.8
11-AX-474 0.0 0 0.0 0.7 1 0.7 2.3 2 1.2 6.6 5 1.3 9.6
11-AX-475 7.2 5 1.4 0.7 1 0.7 25.7 5 5.1 15.5 5 3.1 49.1
11-AX-476 0.0 0 0.0 16.3 5 3.3 21.5 10 2.2 126.8 12 10.6 164.6
11-AX-477 0.0 0 0.0 7.1 2 3.6 0.0 0 0.0 69.9 3 23.3 77
11-AX-478 0.0 0 0.0 0.0 0 0.0 0.0 0 0.0 1.3 1 1.3 1.3
11-AX-481 0.0 0 0.0 0.0 0 0.0 0.0 0 0.0 15.3 2 7.7 15.3
11-AX-483 43.3 1 43.3 0.0 0 0.0 0.0 0 0.0 4.3 2 2.2 47.6
11-AX-485 0.0 0 0.0 0.0 0 0.0 0.0 0 0.0 17.4 2 8.7 17.4
11-AX-486 1.8 1 1.8 0.0 0 0.0 0.0 0 0.0 0.0 0 0.0 1.8
11-PU-282 0.0 0 0.0 15.6 5 3.1 2.8 3 0.9 80.7 31 2.6 99.1
11-MX-238 2.5 1 2.5 0.0 0 0.0 0.0 0 0.0 0.0 0 0.0 2.5
11-MX-208 0.0 0 0.0 0.0 0 0.0 0.0 0 0.0 16.0 1 16.0 16
11-MX-278 0.0 0 0.0 5.8 1 5.8 0.0 0 0.0 0.0 0 0.0 5.8
11-MX-279 0.0 0 0.0 6.7 1 6.7 4.6 1 4.6 5.3 6 0.9 16.6
11-MX-280 0.8 1 0.8 5.8 1 5.8 0.3 1 0.3 146.4 14 10.5 153.3
11-MX-269 0.2 1 0.2 0.1 1 0.1 0.0 0 0.0 0.0 0 0.0 0.3
11-MX-1 0.0 0 0.0 0.0 0 0.0 1.3 2 0.7 67.5 12 5.6 68.8
11-U-682 20.5 23 0.9 3548.9 2683 1.3 133.8 270 0.5 819.9 834 1.0 4523.1
11-PU-161F 0.0 0 0.0 15.2 1 15.2 0.0 0 0.0 0.0 0 0.0 15.2
11-AX-339 0.0 0 0.0 0.0 0 0.0 0.7 1 0.7 12.7 2 6.4 13.4

119
Site IDa,b B Wt (g) B # B Avg Wt (g)
CD Wt (g) CD #
CD Avg Wt (g)
K Wt (g) K #
K Avg Wt (g)
MC Wt (g) MC #
MC Avg Wt (g)
Total Wt per Site
24B4-381 0.0 0 0.0 21.9 41 0.5 6.0 18 0.3 0.0 0 0.0 27.9
11-U-779 0.7 2 0.4 4194.8 784 5.4 127.9 15 8.5 42.0 28 1.5 4365.4
11-U-276 0.0 0 0.0 0.0 0 0.0 1.4 1 1.4 20.3 1 20.3 21.7
11-JS-321 0.0 0 0.0 509.7 43 11.9 102.2 63 1.6 1387.0 450 3.1 1998.9
11-JS-325 7.3 10 0.7 111.6 140 0.8 10.7 13 0.8 18.1 24 0.8 147.7
11-JS-326 0.0 0 0.0 58.7 58 1.0 0.0 0 0.0 2.3 4 0.6 61
11-JS-328 0.0 0 0.0 20.8 9 2.3 4.5 1 4.5 3.0 2 1.5 28.3
11-JS-329 0.8 2 0.4 4.7 5 0.9 0.0 0 0.0 0.6 2 0.3 6.1
11-PP-508 0.0 0 0.0 0.0 0 0.0 65.0 25 2.6 219.8 145 1.5 284.8
24B2-59 29.6 10 3.0 151.7 33 4.6 14.7 2 7.4 0.0 0 0.0 196
24B3-99 0.0 0 0.0 54.0 1 54.0 0.0 0 0.0 0.0 0 0.0 54
24B3-100 0.0 0 0.0 2509.0 24 104.5 0.0 0 0.0 0.0 0 0.0 2509
24B3-110 0.0 0 0.0 1204.0 18 66.9 0.0 0 0.0 0.0 0 0.0 1204
24B3-102 0.0 0 0.0 159.0 4 39.8 0.0 0 0.0 0.0 0 0.0 159
24B3-101 0.0 0 0.0 722.0 15 48.1 0.0 0 0.0 0.0 0 0.0 722
11-J-79 76.1 15 5.1 251.2 77 3.3 115.5 38 3.0 339.4 12 28.3 782.2
11-J-814(A) 111.0 29 3.8 610.0 194 3.1 74.0 39 1.9 32.0 8 4.0 827
11-J-814(W) 175.0 54 3.2 5303.0 1431 3.7 2127.0 443 4.8 1169.0 223 5.2 8774
11-J-814(M) 11.0 6 1.8 1196.0 340 3.5 840.0 153 5.5 268.0 63 4.3 2315
11-J-814 297.0 89 3.3 7109.0 1965 3.6 3141.0 635 4.9 1469.0 294 5.0 12016
11-J-964 41.3 9 4.6 5552.0 782 7.1 2620.6 347 7.6 1270.0 34 37.4 9483.9
11-J-1055 0.0 0 0.0 150.0 108 1.4 30.0 4 7.5 0.0 0 0.0 180
11-J-129 9.1 13 0.7 21.6 30 0.7 448.6 397 1.1 33.5 22 1.5 512.8
11-J-1145 0.0 0 0.0 181.6 14 13.0 9.3 5 1.9 5.8 3 1.9 196.7
11-R-26 6.0 3 2.0 14.0 15 0.9 12.0 6 2.0 26.0 5 5.2 58
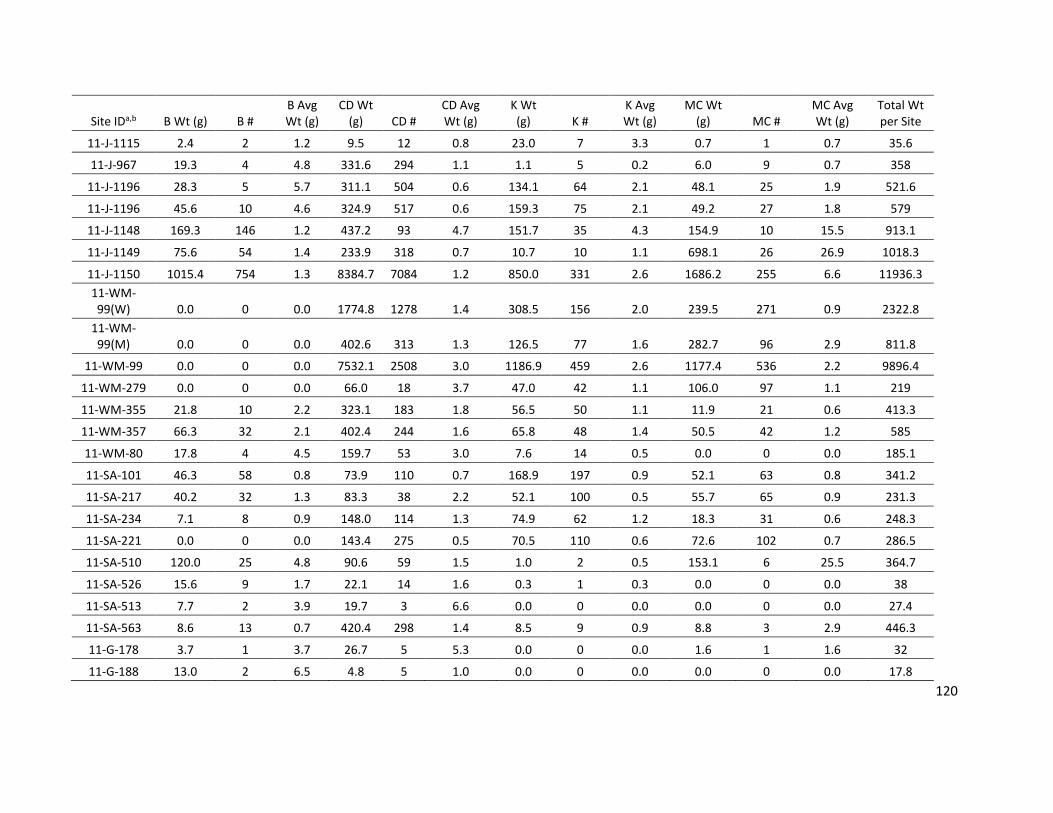
120
Site IDa,b B Wt (g) B # B Avg Wt (g)
CD Wt (g) CD #
CD Avg Wt (g)
K Wt (g) K #
K Avg Wt (g)
MC Wt (g) MC #
MC Avg Wt (g)
Total Wt per Site
11-J-1115 2.4 2 1.2 9.5 12 0.8 23.0 7 3.3 0.7 1 0.7 35.6
11-J-967 19.3 4 4.8 331.6 294 1.1 1.1 5 0.2 6.0 9 0.7 358
11-J-1196 28.3 5 5.7 311.1 504 0.6 134.1 64 2.1 48.1 25 1.9 521.6
11-J-1196 45.6 10 4.6 324.9 517 0.6 159.3 75 2.1 49.2 27 1.8 579
11-J-1148 169.3 146 1.2 437.2 93 4.7 151.7 35 4.3 154.9 10 15.5 913.1
11-J-1149 75.6 54 1.4 233.9 318 0.7 10.7 10 1.1 698.1 26 26.9 1018.3
11-J-1150 1015.4 754 1.3 8384.7 7084 1.2 850.0 331 2.6 1686.2 255 6.6 11936.3
11-WM-99(W) 0.0 0 0.0 1774.8 1278 1.4 308.5 156 2.0 239.5 271 0.9 2322.8
11-WM-99(M) 0.0 0 0.0 402.6 313 1.3 126.5 77 1.6 282.7 96 2.9 811.8
11-WM-99 0.0 0 0.0 7532.1 2508 3.0 1186.9 459 2.6 1177.4 536 2.2 9896.4
11-WM-279 0.0 0 0.0 66.0 18 3.7 47.0 42 1.1 106.0 97 1.1 219
11-WM-355 21.8 10 2.2 323.1 183 1.8 56.5 50 1.1 11.9 21 0.6 413.3
11-WM-357 66.3 32 2.1 402.4 244 1.6 65.8 48 1.4 50.5 42 1.2 585
11-WM-80 17.8 4 4.5 159.7 53 3.0 7.6 14 0.5 0.0 0 0.0 185.1
11-SA-101 46.3 58 0.8 73.9 110 0.7 168.9 197 0.9 52.1 63 0.8 341.2
11-SA-217 40.2 32 1.3 83.3 38 2.2 52.1 100 0.5 55.7 65 0.9 231.3
11-SA-234 7.1 8 0.9 148.0 114 1.3 74.9 62 1.2 18.3 31 0.6 248.3
11-SA-221 0.0 0 0.0 143.4 275 0.5 70.5 110 0.6 72.6 102 0.7 286.5
11-SA-510 120.0 25 4.8 90.6 59 1.5 1.0 2 0.5 153.1 6 25.5 364.7
11-SA-526 15.6 9 1.7 22.1 14 1.6 0.3 1 0.3 0.0 0 0.0 38
11-SA-513 7.7 2 3.9 19.7 3 6.6 0.0 0 0.0 0.0 0 0.0 27.4
11-SA-563 8.6 13 0.7 420.4 298 1.4 8.5 9 0.9 8.8 3 2.9 446.3
11-G-178 3.7 1 3.7 26.7 5 5.3 0.0 0 0.0 1.6 1 1.6 32
11-G-188 13.0 2 6.5 4.8 5 1.0 0.0 0 0.0 0.0 0 0.0 17.8

121
Site IDa,b B Wt (g) B # B Avg Wt (g)
CD Wt (g) CD #
CD Avg Wt (g)
K Wt (g) K #
K Avg Wt (g)
MC Wt (g) MC #
MC Avg Wt (g)
Total Wt per Site
11-G-190 22.7 14 1.6 98.5 43 2.3 0.0 0 0.0 0.0 0 0.0 121.2
11-G-200 17.3 6 2.9 42.2 56 0.8 6.3 7 0.9 0.6 4 0.2 66.4
11-G-326 1.0 4 0.3 9.9 21 0.5 0.0 0 0.0 3.1 4 0.8 14
11-G-329 10.1 9 1.1 28.0 34 0.8 0.0 0 0.0 0.6 1 0.6 38.7
11-G-361 4.2 1 4.2 1.3 1 1.3 0.0 0 0.0 2.8 1 2.8 8.3
11-R-331 94.2 29 3.2 0.0 0 0.0 0.0 0 0.0 0.0 0 0.0 94.2
11-R-604 5456.6 754 7.2 765.5 124 6.2 126.3 51 2.5 3189.1 738 4.3 9537.5
21C4-46 685.0 0 0.0 161.5 0 0.0 89.0 0 0.0 406.0 0 0.0 1341.5
21C4-35 77.0 0 0.0 157.5 0 0.0 30.5 0 0.0 31.0 0 0.0 296
21D3-242 48.4 5 9.7 106.1 21 5.1 0.0 0 0.0 12.9 4 3.2 167.4
21D3-67 1.0 2 0.5 268.0 66 4.1 101.0 22 4.6 321.0 50 6.4 691
11-PY-179 1.0 1 1.0 22.0 6 3.7 0.0 0 0.0 0.7 1 0.7 23.7
11-PY-180 12.3 11 1.1 366.3 215 1.7 17.8 10 1.8 140.2 56 2.5 536.6
11-PY-216 3.4 6 0.6 3.5 2 1.8 0.8 1 0.8 0.0 0 0.0 7.7
11-PY-198 65.8 35 1.9 89.3 32 2.8 58.2 25 2.3 145.1 35 4.1 358.4
21C4-9 0.0 0 0.0 27.1 13 2.1 3.0 2 1.5 13.0 4 3.3 43.1
11-FK-228 0.0 0 0.0 2.3 2 1.2 0.0 0 0.0 0.0 0 0.0 2.3
11-H-2 90.6 90 1.0 22.8 56 0.4 5.3 14 0.4 6.6 17 0.4 125.3
11-H-27 0.8 3 0.3 20.1 3 6.7 0.0 0 0.0 0.2 1 0.2 21.1
11-M0-609 195.9 1079 0.2 0.0 0 0.0 1.0 3 0.3 0.0 0 0.0 196.9
11-MO-594(W) 999.8 111 9.0 0.0 0 0.0 0.0 0 0.0 68.6 4 17.2 1068.4
11-MO-594(M) 665.9 329 2.0 7.3 10 0.7 0.0 0 0.0 183.9 67 2.7 857.1
11-MO-594 1665.7 440 3.8 7.3 10 0.7 0.0 0 0.0 252.5 71 3.6 1925.5
11-MO-200 169.4 444 0.4 6.7 3 2.2 0.0 0 0.0 0.0 0 0.0 176.1

122
Site IDa,b B Wt (g) B # B Avg Wt (g)
CD Wt (g) CD #
CD Avg Wt (g)
K Wt (g) K #
K Avg Wt (g)
MC Wt (g) MC #
MC Avg Wt (g)
Total Wt per Site
11-MO-522S 0.6 1 0.6 607.9 31 19.6 0.0 0 0.0 13.4 1 13.4 621.9
11-MO-562 388.9 48 8.1 0.0 0 0.0 15.0 3 5.0 141.7 14 10.1 545.6
11-MO-593 444.0 240 1.9 0.0 0 0.0 0.0 0 0.0 0.1 1 0.1 444.1
11-M0-797 43.2 32 1.4 55.2 10 5.5 4.1 2 2.1 18.3 5 3.7 120.8
11-M0-798 57.9 2 29.0 11.1 5 2.2 0.0 0 0.0 5.2 3 1.7 74.2
11-M0-799 60.6 2 30.3 5.1 1 5.1 0.0 0 0.0 0.0 0 0.0 65.7
11-M0-841 3598.5 986 3.6 0.0 0 0.0 1.5 2 0.8 8.6 1 8.6 3608.6
11-MO-891 14615.0 3782 3.9 141.0 50 2.8 140.0 52 2.7 371.0 61 6.1 15267
11-MO-636 19.9 9 2.2 0.0 0 0.0 0.0 0 0.0 0.0 0 0.0 19.9
11-MO-672 144.9 3 48.3 0.0 0 0.0 0.0 0 0.0 0.0 0 0.0 144.9
11-MO-973 623.9 56 11.1 11.0 1 11.0 0.0 0 0.0 272.2 4 68.1 907.1
11-MO-768 70.6 62 1.1 0.5 1 0.5 0.0 0 0.0 0.0 0 0.0 71.1
11-MO-997 7.4 6 1.2 0.0 0 0.0 0.0 0 0.0 0.0 0 0.0 7.4
11-MO-998 114.4 2 57.2 0.0 0 0.0 0.0 0 0.0 0.0 0 0.0 114.4
11-S-1520 0.6 3 0.2 0.0 0 0.0 0.0 0 0.0 0.0 0 0.0 0.6
11-MO-1005 1891.9 529 3.6 6.7 7 1.0 2.6 1 2.6 0.0 0 0.0 1901.2
11-MO-475 23.7 11 2.2 0.0 0 0.0 0.0 0 0.0 0.0 0 0.0 23.7
11-MO-1032 0.3 2 0.2 0.0 0 0.0 0.0 0 0.0 0.0 0 0.0 0.3
11-MO-1033 0.5 1 0.5 0.0 0 0.0 0.0 0 0.0 0.0 0 0.0 0.5
11-MO-598 160.3 59 2.7 0.0 0 0.0 0.0 0 0.0 2.8 2 1.4 163.1
11-MO-725 399.6 20 20.0 0.0 0 0.0 0.0 0 0.0 8.0 1 8.0 407.6
11-MO-1068 52.3 29 1.8 0.0 0 0.0 0.0 0 0.0 0.0 0 0.0 52.3
11-MO-599 17.1 6 2.9 0.0 0 0.0 6.3 1 6.3 0.0 0 0.0 23.4
11-MO-855 26651.0 3258 8.2 7.0 4 1.8 237.0 12 19.8 1484.0 94 15.8 28379
11-MO-717 21.8 7 3.1 0.0 0 0.0 0.0 0 0.0 0.0 0 0.0 21.8
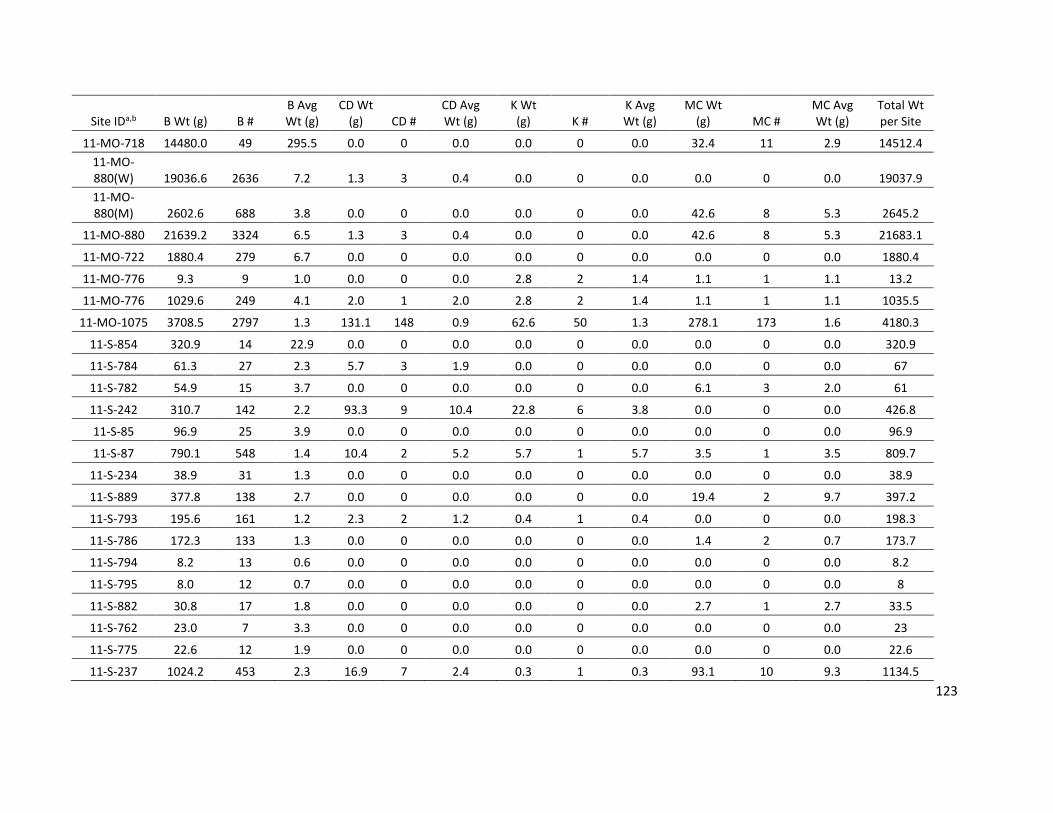
123
Site IDa,b B Wt (g) B # B Avg Wt (g)
CD Wt (g) CD #
CD Avg Wt (g)
K Wt (g) K #
K Avg Wt (g)
MC Wt (g) MC #
MC Avg Wt (g)
Total Wt per Site
11-MO-718 14480.0 49 295.5 0.0 0 0.0 0.0 0 0.0 32.4 11 2.9 14512.4
11-MO-880(W) 19036.6 2636 7.2 1.3 3 0.4 0.0 0 0.0 0.0 0 0.0 19037.9
11-MO-880(M) 2602.6 688 3.8 0.0 0 0.0 0.0 0 0.0 42.6 8 5.3 2645.2
11-MO-880 21639.2 3324 6.5 1.3 3 0.4 0.0 0 0.0 42.6 8 5.3 21683.1
11-MO-722 1880.4 279 6.7 0.0 0 0.0 0.0 0 0.0 0.0 0 0.0 1880.4
11-MO-776 9.3 9 1.0 0.0 0 0.0 2.8 2 1.4 1.1 1 1.1 13.2
11-MO-776 1029.6 249 4.1 2.0 1 2.0 2.8 2 1.4 1.1 1 1.1 1035.5
11-MO-1075 3708.5 2797 1.3 131.1 148 0.9 62.6 50 1.3 278.1 173 1.6 4180.3
11-S-854 320.9 14 22.9 0.0 0 0.0 0.0 0 0.0 0.0 0 0.0 320.9
11-S-784 61.3 27 2.3 5.7 3 1.9 0.0 0 0.0 0.0 0 0.0 67
11-S-782 54.9 15 3.7 0.0 0 0.0 0.0 0 0.0 6.1 3 2.0 61
11-S-242 310.7 142 2.2 93.3 9 10.4 22.8 6 3.8 0.0 0 0.0 426.8
11-S-85 96.9 25 3.9 0.0 0 0.0 0.0 0 0.0 0.0 0 0.0 96.9
11-S-87 790.1 548 1.4 10.4 2 5.2 5.7 1 5.7 3.5 1 3.5 809.7
11-S-234 38.9 31 1.3 0.0 0 0.0 0.0 0 0.0 0.0 0 0.0 38.9
11-S-889 377.8 138 2.7 0.0 0 0.0 0.0 0 0.0 19.4 2 9.7 397.2
11-S-793 195.6 161 1.2 2.3 2 1.2 0.4 1 0.4 0.0 0 0.0 198.3
11-S-786 172.3 133 1.3 0.0 0 0.0 0.0 0 0.0 1.4 2 0.7 173.7
11-S-794 8.2 13 0.6 0.0 0 0.0 0.0 0 0.0 0.0 0 0.0 8.2
11-S-795 8.0 12 0.7 0.0 0 0.0 0.0 0 0.0 0.0 0 0.0 8
11-S-882 30.8 17 1.8 0.0 0 0.0 0.0 0 0.0 2.7 1 2.7 33.5
11-S-762 23.0 7 3.3 0.0 0 0.0 0.0 0 0.0 0.0 0 0.0 23
11-S-775 22.6 12 1.9 0.0 0 0.0 0.0 0 0.0 0.0 0 0.0 22.6
11-S-237 1024.2 453 2.3 16.9 7 2.4 0.3 1 0.3 93.1 10 9.3 1134.5

124
Site IDa,b B Wt (g) B # B Avg Wt (g)
CD Wt (g) CD #
CD Avg Wt (g)
K Wt (g) K #
K Avg Wt (g)
MC Wt (g) MC #
MC Avg Wt (g)
Total Wt per Site
11-S-236 138.4 59 2.3 0.0 0 0.0 0.0 0 0.0 12.2 1 12.2 150.6
11-S-235 320.2 217 1.5 20.0 2 10.0 0.1 1 0.1 61.9 13 4.8 402.2
11-S-1061 101.6 21 4.8 9.2 3 3.1 39.0 2 19.5 0.0 0 0.0 149.8
11-S-1148(M) 23.9 29 0.8 0.1 1 0.1 0.0 0 0.0 34.5 1 34.5 58.5
11-S-1148(W) 3.1 7 0.4 0.0 0 0.0 0.0 0 0.0 0.0 0 0.0 3.1
11-S-1148 27.0 36 0.8 0.1 1 0.1 0.0 0 0.0 34.5 1 34.5 61.6
11-S-19 59.9 29 2.1 0.0 0 0.0 0.0 0 0.0 0.5 5 0.1 60.4
11-S-1033 113.7 23 4.9 0.0 0 0.0 0.3 1 0.3 0.0 0 0.0 114
11-S-1161 134.0 58 2.3 0.0 0 0.0 0.0 0 0.0 18.2 23 0.8 152.2
11-S-709 227.2 40 5.7 24.5 1 24.5 0.0 0 0.0 8.4 2 4.2 260.1
11-S-69 175.1 147 1.2 3.1 3 1.0 0.0 0 0.0 0.0 0 0.0 178.2
11-S-1446 28.9 20 1.4 0.1 1 0.1 0.0 0 0.0 0.2 1 0.2 29.2
11-S-1637 14.4 4 3.6 0.0 0 0.0 0.0 0 0.0 0.0 0 0.0 14.4
11-S-71 713.5 153 4.7 23.5 1 23.5 0.0 0 0.0 67.2 5 13.4 804.2
11-S-71(M) 679.4 146 4.7 23.5 1 23.5 0.0 0 0.0 9.3 4 2.3 712.2
11-S-816 51.8 4 13.0 0.0 0 0.0 0.0 0 0.0 0.0 0 0.0 51.8
11-S-814 14.6 10 1.5 0.0 0 0.0 0.2 1 0.2 6.2 12 0.5 21
11-S-1098 46.1 30 1.5 0.3 1 0.3 0.3 1 0.3 0.0 0 0.0 46.7
11-S-729 147.7 91 1.6 0.0 0 0.0 0.0 0 0.0 0.0 0 0.0 147.7
11-S-730 87.9 34 2.6 0.1 1 0.1 0.0 0 0.0 216.1 7 30.9 304.1
11-S-747 31.6 18 1.8 0.0 0 0.0 0.0 0 0.0 0.0 0 0.0 31.6
11-S-1 17.1 5 3.4 0.0 0 0.0 0.0 0 0.0 0.0 0 0.0 17.1
11-S-631(W) 124.8 67 1.9 10.4 1 10.4 0.5 2 0.3 944.5 6 157.4 1080.2
11-S-631(M) 340.6 82 4.2 0.0 0 0.0 0.0 0 0.0 25.1 4 6.3 365.7
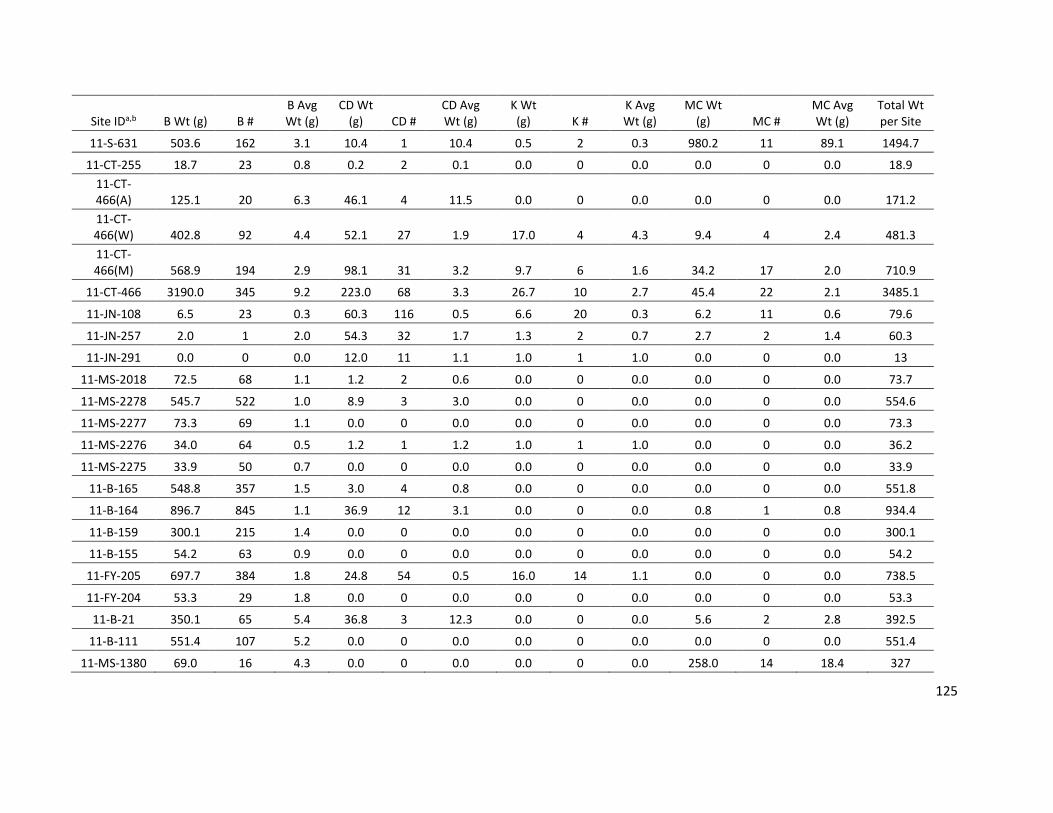
125
Site IDa,b B Wt (g) B # B Avg Wt (g)
CD Wt (g) CD #
CD Avg Wt (g)
K Wt (g) K #
K Avg Wt (g)
MC Wt (g) MC #
MC Avg Wt (g)
Total Wt per Site
11-S-631 503.6 162 3.1 10.4 1 10.4 0.5 2 0.3 980.2 11 89.1 1494.7
11-CT-255 18.7 23 0.8 0.2 2 0.1 0.0 0 0.0 0.0 0 0.0 18.9
11-CT-466(A) 125.1 20 6.3 46.1 4 11.5 0.0 0 0.0 0.0 0 0.0 171.2
11-CT-466(W) 402.8 92 4.4 52.1 27 1.9 17.0 4 4.3 9.4 4 2.4 481.3
11-CT-466(M) 568.9 194 2.9 98.1 31 3.2 9.7 6 1.6 34.2 17 2.0 710.9
11-CT-466 3190.0 345 9.2 223.0 68 3.3 26.7 10 2.7 45.4 22 2.1 3485.1
11-JN-108 6.5 23 0.3 60.3 116 0.5 6.6 20 0.3 6.2 11 0.6 79.6
11-JN-257 2.0 1 2.0 54.3 32 1.7 1.3 2 0.7 2.7 2 1.4 60.3
11-JN-291 0.0 0 0.0 12.0 11 1.1 1.0 1 1.0 0.0 0 0.0 13
11-MS-2018 72.5 68 1.1 1.2 2 0.6 0.0 0 0.0 0.0 0 0.0 73.7
11-MS-2278 545.7 522 1.0 8.9 3 3.0 0.0 0 0.0 0.0 0 0.0 554.6
11-MS-2277 73.3 69 1.1 0.0 0 0.0 0.0 0 0.0 0.0 0 0.0 73.3
11-MS-2276 34.0 64 0.5 1.2 1 1.2 1.0 1 1.0 0.0 0 0.0 36.2
11-MS-2275 33.9 50 0.7 0.0 0 0.0 0.0 0 0.0 0.0 0 0.0 33.9
11-B-165 548.8 357 1.5 3.0 4 0.8 0.0 0 0.0 0.0 0 0.0 551.8
11-B-164 896.7 845 1.1 36.9 12 3.1 0.0 0 0.0 0.8 1 0.8 934.4
11-B-159 300.1 215 1.4 0.0 0 0.0 0.0 0 0.0 0.0 0 0.0 300.1
11-B-155 54.2 63 0.9 0.0 0 0.0 0.0 0 0.0 0.0 0 0.0 54.2
11-FY-205 697.7 384 1.8 24.8 54 0.5 16.0 14 1.1 0.0 0 0.0 738.5
11-FY-204 53.3 29 1.8 0.0 0 0.0 0.0 0 0.0 0.0 0 0.0 53.3
11-B-21 350.1 65 5.4 36.8 3 12.3 0.0 0 0.0 5.6 2 2.8 392.5
11-B-111 551.4 107 5.2 0.0 0 0.0 0.0 0 0.0 0.0 0 0.0 551.4
11-MS-1380 69.0 16 4.3 0.0 0 0.0 0.0 0 0.0 258.0 14 18.4 327

126
Site IDa,b B Wt (g) B # B Avg Wt (g)
CD Wt (g) CD #
CD Avg Wt (g)
K Wt (g) K #
K Avg Wt (g)
MC Wt (g) MC #
MC Avg Wt (g)
Total Wt per Site
11-MS-582 216.7 613 0.4 0.0 0 0.0 0.0 0 0.0 698.6 25 27.9 915.3
11-MS-1177 84.2 66 1.3 0.0 0 0.0 0.0 0 0.0 130.1 40 3.3 214.3
11-MS-1255 2437.3 426 5.7 5.6 1 5.6 8.0 2 4.0 43.2 15 2.9 2494.1
11-MS-610(W) 58.3 85 0.7 6.6 4 1.7 0.0 0 0.0 1.1 1 1.1 66.01
11-MS-610(M) 11.0 7 1.6 0.0 0 0.0 0.0 0 0.0 645.9 1 645.9 656.9
11-MS-610 363.5 159 2.3 7.1 5 1.4 0.3 1 0.3 648.8 3 216.3 1019.7
11-MS-598 2699.9 81 33.3 27.7 15 1.8 112.6 4 28.2 372.0 63 5.9 3212.2
11-MS-598 123.1 174 0.7 0.0 0 0.0 112.1 3 37.4 36.9 55 0.7 272.1
11-MS-587 491.2 61 8.1 0.0 0 0.0 0.0 0 0.0 0.0 0 0.0 491.2
11-MS-611 528.8 177 3.0 0.0 0 0.0 1.1 1 1.1 33.5 5 6.7 563.4
11-MS-612 265.9 55 4.8 0.0 0 0.0 0.0 0 0.0 0.0 0 0.0 265.9
11-MS-1799 8.3 3 2.8 0.0 0 0.0 0.0 0 0.0 0.0 0 0.0 8.3
11-MS-1800 64.7 4 16.2 0.0 0 0.0 0.0 0 0.0 0.0 0 0.0 64.7
11-MS-1801 85.2 7 12.2 0.0 0 0.0 0.0 0 0.0 0.0 0 0.0 85.2
11-MS-1802 67.9 12 5.7 0.0 0 0.0 0.0 0 0.0 0.0 0 0.0 67.9
11-MS-1803 58.3 20 2.9 0.0 0 0.0 0.0 0 0.0 0.0 0 0.0 58.3
11-MS-1804 80.4 19 4.2 0.0 0 0.0 0.0 0 0.0 1.4 1 1.4 81.8
11-MS-1805 7.3 6 1.2 0.0 0 0.0 0.0 0 0.0 0.0 0 0.0 7.3
11-MS-1806 126.0 20 6.3 0.0 0 0.0 0.0 0 0.0 5.6 2 2.8 131.6
11-MS-1807 1.4 2 0.7 0.0 0 0.0 0.0 0 0.0 0.0 0 0.0 1.4
11-MS-1809 89.4 23 3.9 0.0 0 0.0 0.0 0 0.0 0.0 0 0.0 89.4
11-MS-80 537.5 383 1.4 0.0 0 0.0 0.0 0 0.0 6.4 7 0.9 543.9
11-MS-345 142.6 56 2.5 0.0 0 0.0 0.0 0 0.0 0.0 0 0.0 142.6
11-MS-517 12.1 9 1.3 0.0 0 0.0 0.0 0 0.0 0.0 0 0.0 12.1

127
Site IDa,b B Wt (g) B # B Avg Wt (g)
CD Wt (g) CD #
CD Avg Wt (g)
K Wt (g) K #
K Avg Wt (g)
MC Wt (g) MC #
MC Avg Wt (g)
Total Wt per Site
11-MS-1330 16.7 11 1.5 0.0 0 0.0 0.0 0 0.0 0.0 0 0.0 16.7
11-MS-1778 87.3 41 2.1 0.0 0 0.0 0.0 0 0.0 5.1 2 2.6 92.4
11-MS-1815 0.3 1 0.3 0.0 0 0.0 0.0 0 0.0 0.0 0 0.0 0.3
11-MS-1816 1.3 1 1.3 0.0 0 0.0 0.0 0 0.0 0.0 0 0.0 1.3
11-MS-1817 5.2 4 1.3 0.0 0 0.0 0.0 0 0.0 0.0 0 0.0 5.2
11-MS-1818 37.9 3 12.6 0.0 0 0.0 0.0 0 0.0 0.0 0 0.0 37.9
11-MS-1819 4.3 2 2.2 0.0 0 0.0 0.0 0 0.0 0.0 0 0.0 4.3
11-MS-1820 2.4 3 0.8 0.0 0 0.0 0.0 0 0.0 0.0 0 0.0 2.4
11-S-316 2.1 2 1.1 0.0 0 0.0 0.0 0 0.0 0.0 0 0.0 2.1
11-S-460 45.8 12 3.8 0.0 0 0.0 0.0 0 0.0 0.0 0 0.0 45.8
11-S-596 1.1 1 1.1 0.0 0 0.0 0.0 0 0.0 0.0 0 0.0 1.1
11-S-1234 6.7 1 6.7 0.0 0 0.0 0.0 0 0.0 0.0 0 0.0 6.7
11-S-1236 5.7 3 1.9 0.0 0 0.0 0.0 0 0.0 0.0 0 0.0 5.7
11-S-1278 46.9 17 2.8 0.0 0 0.0 0.0 0 0.0 4.4 1 4.4 51.3
11-S-1279 775.7 323 2.4 0.0 0 0.0 0.6 1 0.6 1.5 1 1.5 777.8
11-S-1280 184.4 78 2.4 0.0 0 0.0 2.1 3 0.7 4.6 3 1.5 191.1
11-S-1281 0.3 1 0.3 0.0 0 0.0 0.0 0 0.0 55.1 1 55.1 55.4
11-S-1282 2.4 3 0.8 0.0 0 0.0 0.0 0 0.0 0.0 0 0.0 2.4
11-S-1283 35.6 13 2.7 0.0 0 0.0 0.0 0 0.0 0.0 0 0.0 35.6
11-S-1284 3.1 3 1.0 0.0 0 0.0 0.0 0 0.0 0.0 0 0.0 3.1
11-S-1285 2.1 1 2.1 0.0 0 0.0 0.0 0 0.0 0.0 0 0.0 2.1
11-S-1252 1812.0 337 5.4 10.0 4 2.5 6.2 8 0.8 155.4 27 5.8 1983.6
11-S-1253 370.3 137 2.7 0.0 0 0.0 0.5 1 0.5 7.1 3 2.4 377.9
11-S-1254 452.3 146 3.1 1.2 1 1.2 0.0 0 0.0 2.4 1 2.4 455.9
11-S-1255 1125.6 400 2.8 2.1 1 2.1 3.8 2 1.9 168.5 20 8.4 1300
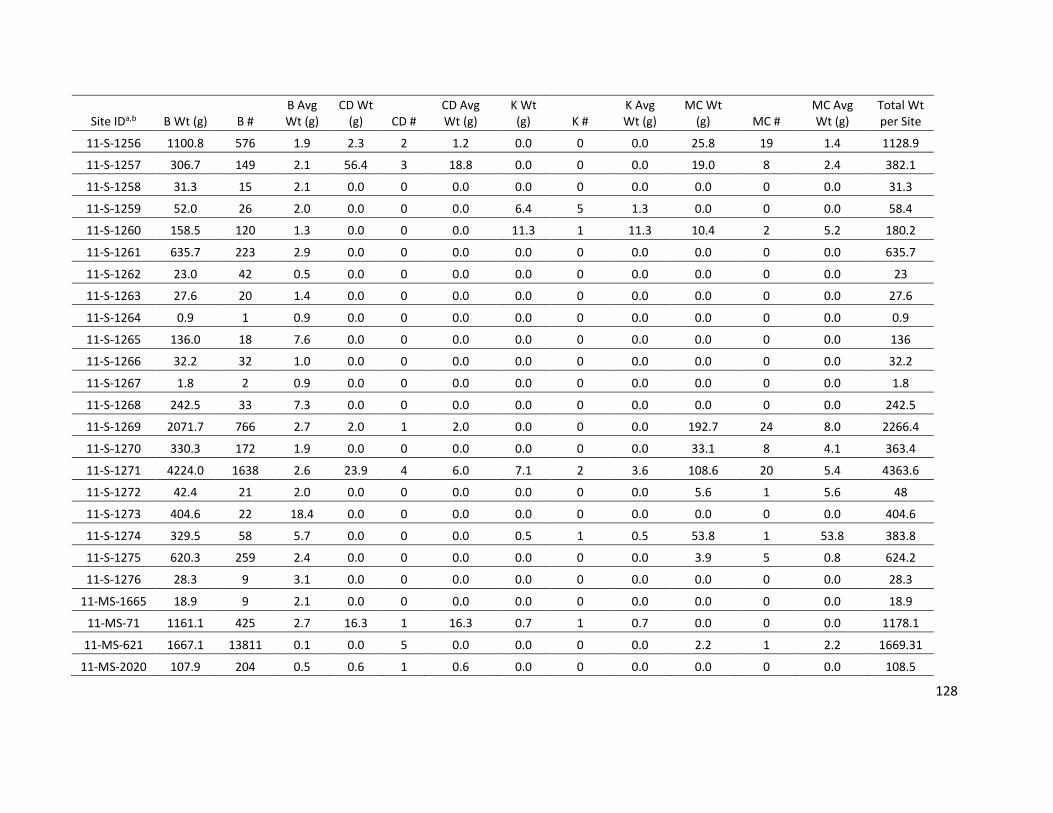
128
Site IDa,b B Wt (g) B # B Avg Wt (g)
CD Wt (g) CD #
CD Avg Wt (g)
K Wt (g) K #
K Avg Wt (g)
MC Wt (g) MC #
MC Avg Wt (g)
Total Wt per Site
11-S-1256 1100.8 576 1.9 2.3 2 1.2 0.0 0 0.0 25.8 19 1.4 1128.9
11-S-1257 306.7 149 2.1 56.4 3 18.8 0.0 0 0.0 19.0 8 2.4 382.1
11-S-1258 31.3 15 2.1 0.0 0 0.0 0.0 0 0.0 0.0 0 0.0 31.3
11-S-1259 52.0 26 2.0 0.0 0 0.0 6.4 5 1.3 0.0 0 0.0 58.4
11-S-1260 158.5 120 1.3 0.0 0 0.0 11.3 1 11.3 10.4 2 5.2 180.2
11-S-1261 635.7 223 2.9 0.0 0 0.0 0.0 0 0.0 0.0 0 0.0 635.7
11-S-1262 23.0 42 0.5 0.0 0 0.0 0.0 0 0.0 0.0 0 0.0 23
11-S-1263 27.6 20 1.4 0.0 0 0.0 0.0 0 0.0 0.0 0 0.0 27.6
11-S-1264 0.9 1 0.9 0.0 0 0.0 0.0 0 0.0 0.0 0 0.0 0.9
11-S-1265 136.0 18 7.6 0.0 0 0.0 0.0 0 0.0 0.0 0 0.0 136
11-S-1266 32.2 32 1.0 0.0 0 0.0 0.0 0 0.0 0.0 0 0.0 32.2
11-S-1267 1.8 2 0.9 0.0 0 0.0 0.0 0 0.0 0.0 0 0.0 1.8
11-S-1268 242.5 33 7.3 0.0 0 0.0 0.0 0 0.0 0.0 0 0.0 242.5
11-S-1269 2071.7 766 2.7 2.0 1 2.0 0.0 0 0.0 192.7 24 8.0 2266.4
11-S-1270 330.3 172 1.9 0.0 0 0.0 0.0 0 0.0 33.1 8 4.1 363.4
11-S-1271 4224.0 1638 2.6 23.9 4 6.0 7.1 2 3.6 108.6 20 5.4 4363.6
11-S-1272 42.4 21 2.0 0.0 0 0.0 0.0 0 0.0 5.6 1 5.6 48
11-S-1273 404.6 22 18.4 0.0 0 0.0 0.0 0 0.0 0.0 0 0.0 404.6
11-S-1274 329.5 58 5.7 0.0 0 0.0 0.5 1 0.5 53.8 1 53.8 383.8
11-S-1275 620.3 259 2.4 0.0 0 0.0 0.0 0 0.0 3.9 5 0.8 624.2
11-S-1276 28.3 9 3.1 0.0 0 0.0 0.0 0 0.0 0.0 0 0.0 28.3
11-MS-1665 18.9 9 2.1 0.0 0 0.0 0.0 0 0.0 0.0 0 0.0 18.9
11-MS-71 1161.1 425 2.7 16.3 1 16.3 0.7 1 0.7 0.0 0 0.0 1178.1
11-MS-621 1667.1 13811 0.1 0.0 5 0.0 0.0 0 0.0 2.2 1 2.2 1669.31
11-MS-2020 107.9 204 0.5 0.6 1 0.6 0.0 0 0.0 0.0 0 0.0 108.5
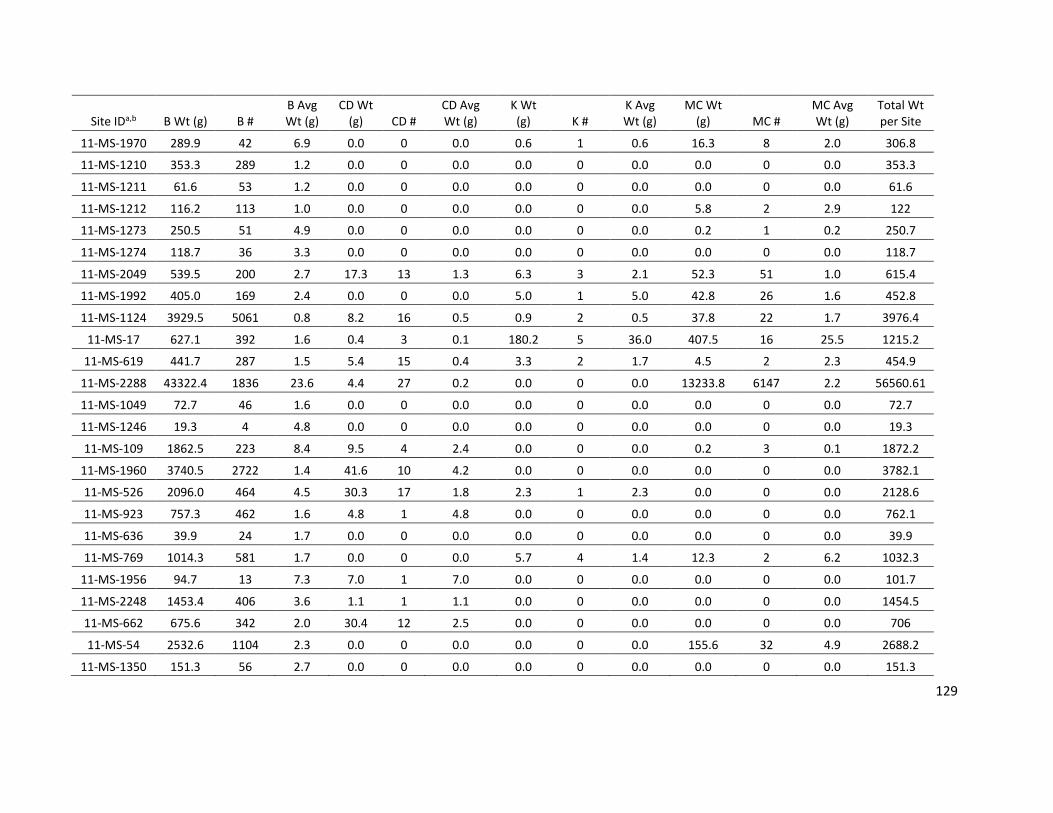
129
Site IDa,b B Wt (g) B # B Avg Wt (g)
CD Wt (g) CD #
CD Avg Wt (g)
K Wt (g) K #
K Avg Wt (g)
MC Wt (g) MC #
MC Avg Wt (g)
Total Wt per Site
11-MS-1970 289.9 42 6.9 0.0 0 0.0 0.6 1 0.6 16.3 8 2.0 306.8
11-MS-1210 353.3 289 1.2 0.0 0 0.0 0.0 0 0.0 0.0 0 0.0 353.3
11-MS-1211 61.6 53 1.2 0.0 0 0.0 0.0 0 0.0 0.0 0 0.0 61.6
11-MS-1212 116.2 113 1.0 0.0 0 0.0 0.0 0 0.0 5.8 2 2.9 122
11-MS-1273 250.5 51 4.9 0.0 0 0.0 0.0 0 0.0 0.2 1 0.2 250.7
11-MS-1274 118.7 36 3.3 0.0 0 0.0 0.0 0 0.0 0.0 0 0.0 118.7
11-MS-2049 539.5 200 2.7 17.3 13 1.3 6.3 3 2.1 52.3 51 1.0 615.4
11-MS-1992 405.0 169 2.4 0.0 0 0.0 5.0 1 5.0 42.8 26 1.6 452.8
11-MS-1124 3929.5 5061 0.8 8.2 16 0.5 0.9 2 0.5 37.8 22 1.7 3976.4
11-MS-17 627.1 392 1.6 0.4 3 0.1 180.2 5 36.0 407.5 16 25.5 1215.2
11-MS-619 441.7 287 1.5 5.4 15 0.4 3.3 2 1.7 4.5 2 2.3 454.9
11-MS-2288 43322.4 1836 23.6 4.4 27 0.2 0.0 0 0.0 13233.8 6147 2.2 56560.61
11-MS-1049 72.7 46 1.6 0.0 0 0.0 0.0 0 0.0 0.0 0 0.0 72.7
11-MS-1246 19.3 4 4.8 0.0 0 0.0 0.0 0 0.0 0.0 0 0.0 19.3
11-MS-109 1862.5 223 8.4 9.5 4 2.4 0.0 0 0.0 0.2 3 0.1 1872.2
11-MS-1960 3740.5 2722 1.4 41.6 10 4.2 0.0 0 0.0 0.0 0 0.0 3782.1
11-MS-526 2096.0 464 4.5 30.3 17 1.8 2.3 1 2.3 0.0 0 0.0 2128.6
11-MS-923 757.3 462 1.6 4.8 1 4.8 0.0 0 0.0 0.0 0 0.0 762.1
11-MS-636 39.9 24 1.7 0.0 0 0.0 0.0 0 0.0 0.0 0 0.0 39.9
11-MS-769 1014.3 581 1.7 0.0 0 0.0 5.7 4 1.4 12.3 2 6.2 1032.3
11-MS-1956 94.7 13 7.3 7.0 1 7.0 0.0 0 0.0 0.0 0 0.0 101.7
11-MS-2248 1453.4 406 3.6 1.1 1 1.1 0.0 0 0.0 0.0 0 0.0 1454.5
11-MS-662 675.6 342 2.0 30.4 12 2.5 0.0 0 0.0 0.0 0 0.0 706
11-MS-54 2532.6 1104 2.3 0.0 0 0.0 0.0 0 0.0 155.6 32 4.9 2688.2
11-MS-1350 151.3 56 2.7 0.0 0 0.0 0.0 0 0.0 0.0 0 0.0 151.3

130
Site IDa,b B Wt (g) B # B Avg Wt (g)
CD Wt (g) CD #
CD Avg Wt (g)
K Wt (g) K #
K Avg Wt (g)
MC Wt (g) MC #
MC Avg Wt (g)
Total Wt per Site
11-MS-584 858.7 240 3.6 14.7 1 14.7 0.0 0 0.0 118.3 50 2.4 991.7
11-MS-595 13790.9 4506 3.1 13.2 4 3.3 81.2 44 1.8 964.6 413 2.3 14849.9
11-MS-1435 0.9 2 0.5 0.0 0 0.0 0.0 0 0.0 0.0 0 0.0 0.9
11-MS-1614 75.0 3 25.0 0.0 0 0.0 0.0 0 0.0 0.0 0 0.0 75
11-MS-2300 889.5 51 17.4 0.0 0 0.0 1.8 2 0.9 15.8 3 5.3 907.1
11-MS-2317 172.8 240 0.7 1.0 1 1.0 0.0 0 0.0 0.0 0 0.0 173.8
11-MS-672 54.4 27 2.0 3.2 1 3.2 0.0 0 0.0 0.0 0 0.0 57.6
11-MS-637 605.1 28 21.6 11.7 2 5.9 0.0 0 0.0 22.7 1 22.7 639.5
11-MS-27 5037.3 2395 2.1 59.3 12 4.9 10.6 3 3.5 0.0 0 0.0 5107.2
11-MS-52 1565.8 719 2.2 4.6 2 2.3 0.0 0 0.0 5.0 3 1.7 1575.4
11-S-47 824.0 85 9.7 148.8 16 9.3 21.8 2 10.9 0.0 0 0.0 994.6
11-S-47 2540.9 166 15.3 39.4 4 9.9 0.0 0 0.0 21.0 9 2.3 2601.3
11-S-47 3364.9 251 13.4 188.2 20 9.4 21.8 2 10.9 21.0 9 2.3 3595.9
11-S-650 3738.1 2471 1.5 0.0 0 0.0 0.0 0 0.0 0.0 0 0.0 3738.1
11-S-650 4095.1 768 5.3 70.6 18 3.9 0.0 0 0.0 10.1 2 5.1 4175.8
11-S-650 13806.1 5353 2.6 0.4 2 0.2 0.0 0 0.0 122.2 34 3.6 13928.7
11-S-650 21639.3 8592 2.5 71.0 20 3.6 0.0 0 0.0 132.3 36 3.7 21842.6
11-S-640 17214.2 1351 12.7 108.8 14 7.8 2.0 1 2.0 31.5 1 31.5 17356.5
11-S-642 75.2 52 1.4 0.0 0 0.0 0.0 0 0.0 0.0 0 0.0 75.2
11-S-642 1366.6 141 9.7 0.0 0 0.0 0.0 0 0.0 0.0 0 0.0 1366.6
11-S-642 1441.8 193 7.5 0.0 0 0.0 0.0 0 0.0 0.0 0 0.0 1441.8
11-S-629 227.8 262 0.9 12.7 2 6.4 0.0 0 0.0 0.0 0 0.0 240.5
11-S-699 86.0 52 1.7 0.0 0 0.0 0.0 0 0.0 0.0 0 0.0 86
11-MO-608 1313.1 596 2.2 0.0 0 0.0 0.0 0 0.0 0.0 0 0.0 1313.1
11-S-435 4766.2 6426 0.7 192.6 158 1.2 0.0 0 0.0 0.0 0 0.0 4958.8

131
a Site IDs and names were identified in the reports and registered with the state SHPO. Site name was given to the site by the archaeologist registering the
site with the state SHPO. Site ID format is determined by the state and county in which they are located. The number 11 indicates the state of Illinois.
The following letters indicate the county and the final numbers specifies site identification the number.
b Time period abbreviations are inserted into the Site ID column if there are more than one time period recorded for a site as: (A)=Archaic,
(W)=Woodland, and (M)=Mississippian. Refer to Appendix A for the remainder of the components.
Notes: Some artifacts only weigh tenths of grams therefore, all weights are recorded in tenths of grams. Header abbreviations include: B=Burlington,
CD=Cobden/Dongola, K=Kaolin, MC=Mill Creek, Wt=Weight, Avg=Average, and #=number
Citations: Abbott, 1989; Aberle et al. 2002; Aberle et al. 2006; Adams et al. 1997; Avery et al. 1982; Barr et al. 1993; Bentz and Whalley 1985; Bentz et al.
1998; Berres 1985; Betzenhauser and Howe 2008; Betzenhauser 2012; Betzenhauser, Marzim, and Branstner 2013; Betzenhauser et al. 2013; Bevitt 1997;
Blanton, Kelly, and Parker 1989; Blodgett, Kitchen, and Durst 2016; Boles and Durst 2012; Booth et al. 1999; Booth et al. 2006; Booth 2012; Booth et al. 2012;
Butler, DelCastello and Wagner 2000; Butler and Crow 2013; Craig and Galloy 1994; Craig et al. 2007; Cobb and Jefferies 1983; DeMott and Holley 1991;
DelCastello and Butler 2000; DelCastello, Faberson, and Spurlock 2007; Emerson and Jackson 1980; Emerson et al. 1982; Ensor and Titus 2004; Ensor et al.
2009; Evans 1995; Evans et al. 2000; Evans, Evans, and Parker 2001; Evans 2010; Evans 2011; Finney and Johannessen 1981; Fortier and Finney 1979; Fortier
1980; Fortier and Johannessen 1981; Fortier 1981; Fortier, Finney, and Lacampagne 1983; Fortier, Lacampagne, and Finney 1984; Fortier, Finney, and
Johannessen 1984; Fortier and Jackson 1988; Fortier et al. 2014; Fortier et al. 2015; Fortier et al. 2015(2); Fortier et al. 2016; Fortier et al. 2016(2);Galloy,
Parker, Babcook 2000; Galloy 2001; Galloy and Koldehoff 2002; Galloy 2003, Galloy 2005; Galloy et al. 2013; Galloy et al. 2015; Gaydos et al. 2016;
Hanenberger and Parker 1987; Hargrave, Lopinot, and Seme 1982; Hargrave et al. 1992; Hargrave 1992; Hargrave 1993; Harl and Machiran 2012; Holley,
Brown, and Lopinot 1989; Holley 1993; Holley 1993(1); Holley 1993(2); Holley 1993(3); Holley 1993(4); Holley 1993(5); Holley 1993(6); Holley 1993(7);
Holley 1993(8); Holley 1993(9); Holley 1993(10); Holley 1993(11); Holley 1993(12); Holley 1993(13); Holley 1993(14); Holley 1993(15); Holley 1993(16);
Holley 1993(17); Holley 1993(18); Howe, Snyder and McCorkey 1994; Hoxie 1993; Jackson and Dunavan 1987, Jackson and Dunavan 1988; Jackson, Zelin,
and Evans 2011; Jackson et al. 2014; Kelly et al. 1987; Kelly and Parker 1997; Knight et al. 1992; Knight and Butler 1995; Koeppel 2001; Koeppel 2001(2);
Koldehoff and Wagner 1998; Koldehoff 2000; Koldehoff et al. 2001; Kruchten et al. 2004; Kruchten et al. 2005; Kruchten and Branstner 2007; Kruchten 2008;
Kullen 2000; Lopinot, Brown, and Holley 1989; Lopinot 1991; Lomas, Titus, and Schwegman 2011; Machiran, Bailey, and Kelley 2005; Machiran, Bailey, and
Kelley 2005(2); Machiran, Bailey, and Kelley 2005(3); Machiran and Harl 2009; Machiran et al. 2010; McCullough et al. 2015; McCullough et al. 2015(2);
McElrath 1986; McElrath et al. 1987; McElrath et al. 1987(2), McNerney et al. 1975; McNerney et al. 1996; McNerney and Neal 1998; McNerney et al. 1999;
McNerney, Wolff and Keeney 1999; Meinholz 1986; Milner et al. 1982;Moffet et al. 1992; Moffat et al. 2008, Moffat, Parker, and Martin 2016; Moffat et al.
2016; Moore and McNerney 1983; Moore 1984, Naglich 2002; Neal 1994; Parker 2002; Penny 1987; Pauketat, Kruchten and Alt 2015; Sant, Koldehoff, and
Koldehoff 1986; Santeford and Lopoinot 1979; Scheid and Witty 2012; Scheid, Boles, and Witty 2012; Scheid, Branstner, and Witty 2012; Schwegman 2006;
Schwegman et al. 2007; Schwegman Lamas, and Ensor 2009; Shah et al. 2003; Snyder 1991; Snyder and Titus 1999; Snyder et al. 2002; Snyder, Lence, and
Titus 2002; Stahl et al. 1985; Stephans and Newsom 1996; Tankersly et al. 1991; Titus et. al 1992: Titus and Howe 1993; Titus, Baer, and Wolff 2000; Titus
2002; Titus et al. 2002; Titus, Lomas, and Parker 2008; Titus et al. 2010; Wagner et al. 1992; Wagner et al. 1994; Wagner 1995; Wagner 1995(2); Wagner 1998;
Wagner and Butler 1999; Wagner et al. 2000; Wagner 2005; Wagner et al. 2005; Wagner et al. 2007; Waltz et al. 1997; Wells 1992; Witty and Koldehoff 2005;
Zimmerman et al. 2009.