stony brook university · psychiatry professor mount sinai school of medicine ... stony brook...
TRANSCRIPT

SSStttooonnnyyy BBBrrrooooookkk UUUnnniiivvveeerrrsssiiitttyyy
The official electronic file of this thesis or dissertation is maintained by the University Libraries on behalf of The Graduate School at Stony Brook University.
©©© AAAllllll RRRiiiggghhhtttsss RRReeessseeerrrvvveeeddd bbbyyy AAAuuuttthhhooorrr...

Dopamine and Leptin Interactions in Rodent Models of Obesity andCocaine Abuse
A Dissertation Presented
by
Michael Michaelides
to
The Graduate School
in Partial Fulfillment of the
Requirements
for the Degree of
Doctor of Philosophy
in
Biopsychology
Stony Brook University
May 2010

Copyright byMichael Michaelides
2010

ii
Stony Brook University
The Graduate School
Michael Michaelides
We, the dissertation committee for the above candidate for the
Doctor of Philosophy, hereby recommend
acceptance of this dissertation.
John K. Robinson – Dissertation AdvisorAssociate Professor of Psychology
Brenda J. Anderson – Chairperson of DefenseAssociate Professor of Psychology
Arthur AronProfessor of Psychology
Panayotis (Peter) K. ThanosLaboratory of Neuroimaging Staff Scientist, National Institute of Alcohol and
Alcoholism
Gene-Jack WangMedicine Senior Scientist, Brookhaven National Laboratory
Psychiatry Professor Mount Sinai School of Medicine
This dissertation is accepted by the Graduate School
____________________________Lawrence Martin
Dean of the Graduate School
iii
Abstract of the Dissertation
Dopamine and Leptin Interactions in Rodent Models of Obesity and Cocaine Abuse
by
Michael Michaelides
Doctor of Philosophy
in
Biopsychology
Stony Brook University
2010
Dopamine (DA) is a catecholamine neurotransmitter and along with its receptorsplays a well-documented role in motivation and goal-directed behavior. Clinical studieshave previously documented striatal DA D2 receptor (D2R) deficits in obese individualsand chronic cocaine users. These studies suggest that impaired DA-D2R signaling in thestriatum may underlie deficits in goal-directed behaviors that can ultimately lead toobesity and drug addiction. However, such studies have not addressed the question ofwhether D2R deficits precede obesity and cocaine abuse or whether D2R decline inresponse to repeated overeating and cocaine use.
This thesis aims to answer this question by further investigating the involvementof D2R in obesity and cocaine abuse in rodents. In particular, this thesis documentsstriatal D2R deficits in genetic and environmentally-induced obese as well as cocaine-exposed rodents using small animal positron emission tomography (µPET) and receptorautoradiography. Furthermore, a functional role for D2R in mediating cocaine use isdemonstrated by genetically upregulating D2R in the striatum by way of an adenoviralviral vector expressing the D2R gene, which attenuated operant responding forintravenous cocaine in rats. Using µPET, this thesis also shows that D2R can serve as abiomarker that predicts susceptibility to weight gain and cocaine abuse since D2R levelsnegatively correlated with both future weight gain and cocaine preference in rats. Finally,using µPET evidence is presented that peripheral leptin signaling affects DA-D2Rinteractions in the striatum and that these effects are dependent upon individualsusceptibility to weight gain and cocaine preference.
The central premise is that leptin is an adiposity signal whose effects are notlimited to homeostatic mechanisms as originally thought, but also to goal-directedbehavior and that this behavior is modulated in part via leptin’s action on striatal D2R.This work leads to a better understanding of peripheral and central nervous systeminteractions involved in energy regulation and motivation and highlights the involvementof such interactions in obesity and cocaine abuse.

Tomy fiancée Margaret, for motivation
my sister Olga, for admirationmy mother Christina, for dedicationmy father Euthymios, for inspiration

v
TABLE OF CONTENTS
List of Figures ...................................................................................................................... vii
List of Abbreviations .......................................................................................................... viii
Acknowledgements............................................................................................................... ix
1. Introduction and Background Review............................................................................11.1 Introduction ...................................................................................................................11.2 Peripheral and Central Regulation of Ingestive Behavior .............................................2
1.2.1 Ingestive Behavior...................................................................................................21.2.2 Homeostatic Mechanisms and Ingestive Behavior .................................................21.2.3 Non-homeostatic Mechanisms and Ingestive Behavior ..........................................3
1.3 Ingestive Behavior Disorders ........................................................................................31.3.1 Overeating and Obesity...........................................................................................31.3.2 Cocaine Abuse and Addiction.................................................................................4
1.4 Leptin.............................................................................................................................51.4.1 Leptin Signaling ......................................................................................................51.4.2 Leptin and Adiposity...............................................................................................51.4.3 Leptin and Ingestive Behavior ................................................................................6
1.5 Dopamine.......................................................................................................................61.5.1 Dopamine Signaling 61.5.2 Mesolimbic Dopamine and Adiposity.....................................................................81.5.3 Mesolimbic Dopamine and Ingestive Behavior ......................................................8
1.6 Leptin and Dopamine Interactions ..............................................................................10
2. Dopamine D2 Receptors and Cocaine Abuse ...............................................................112.1 Cocaine self-administration decreases D2R binding in mice ......................................11
2.1.1 Introduction ...........................................................................................................112.1.2 Methods.................................................................................................................112.1.3 Results ...................................................................................................................142.1.4 Discussion .............................................................................................................15
2.2 D2R DNA transfer decreases cocaine self-administration in rats ...............................162.2.1 Introduction ...........................................................................................................162.2.2 Methods.................................................................................................................172.2.3 Results ...................................................................................................................182.2.4 Discussion .............................................................................................................20
2.3 PET imaging of D2R with [11C]raclopride predicts cocaine preference in rats ..........212.3.1 Introduction ...........................................................................................................212.3.2 Methods.................................................................................................................222.3.3 Results ...................................................................................................................232.3.4 Discussion .............................................................................................................24

vi
3. Dopamine D2 Receptors and Obesity ...........................................................................253.1 Age- & diet-related changes in D2R binding in leptin receptor-deficient obese rats..25
3.1.1 Introduction ...........................................................................................................253.1.2 Methods.................................................................................................................253.1.3 Results ...................................................................................................................293.1.4 Discussion .............................................................................................................37
3.2 Effects of diet on D2R binding in rats susceptible or resistant to diet-inducedobesity................................................................................................................................43
3.2.1 Introduction ...........................................................................................................433.2.2 Methods.................................................................................................................443.2.3 Results ...................................................................................................................463.2.4 Discussion .............................................................................................................50
3.3 PET imaging of D2R with [11C]raclopride predicts weight gain in rats .....................543.3.1 Introduction ...........................................................................................................543.3.2 Methods.................................................................................................................553.3.3 Results ...................................................................................................................553.3.4 Discussion .............................................................................................................56
4. Dopamine D2 Receptor and Leptin Interactions: Effects on Body Weight andCocaine Preference .............................................................................................................57
4.1 Displacement of [11C]raclopride by leptin predicts weight gain and cocainepreference in rats ...............................................................................................................57
4.1.1 Introduction ...........................................................................................................574.1.2 Methods.................................................................................................................574.1.3 Results ...................................................................................................................584.1.4 Discussion .............................................................................................................60
5. Summary and Conclusions5.1 Summary......................................................................................................................635.2 Conclusions .................................................................................................................635.3 Implications .................................................................................................................64
Bibliography .........................................................................................................................66

vii
List of Figures
Figure 1.2.1 Peripheral and central regulation of energy balance ..........................................3Figure 2.1.1
a. Total active lever presses during the last day of CSA for each group ........................15b. Total infusions during the last day of CSA for each group ........................................15c. [3H]spiperone D2R binding by experimental group in the CPu .................................15d. [3H]spiperone D2R binding by experimental group in the CPu .................................15
Figure 2.2.1a. Infusions of 0.3 mg/kg cocaine before and after D2R vector treatment .....................19b. Reinforced responses to 0.3 mg/kg cocaine before and after D2R vector treatment..20
Figure 2.3.1a. D2R Binding Ratio (dorsal striatum/cerebellum) and cocaine preference .................19b. D2R Binding Ratio (ventral striatum/cerebellum) and cocaine preference ................20
Figure 3.1.1 Body Weight over development across groups ................................................33Figure 3.1.2 Food intake of unrestricted fa/fa rats ................................................................33Figure 3.1.3 Locomotor activity across groups ....................................................................33Figure 3.1.4
a. Digital autoradiograms of [3H]spiperone at 4 months and cocaine preference ..........34b. [3H]spiperone binding ratio at 1 and 4 months in the striatum...................................34c. [3H]spiperone binding ratio at 1 and 4 months in the cingulate and frontal cortices ..34
Figure 3.1.5 Regression Plot between weight and D2R binding levels ................................35Figure 3.1.6
a. Insulin concentrations in 4 month old fa/fa and lean rats ...........................................35b. Leptin concentrations in 4 month old fa/fa and lean rats ............................................35
Figure 3.1.7a. [11C]raclopride µPET imaging of fa/fa and lean rats ..................................................36b. [11C]raclopride BP of fa/fa and lean rats.....................................................................36c. [11C]raclopride BP in F and NF fa/fa and lean rats .....................................................36
Figure 3.2.1a. Daily food intake in Osborne-Mendel and S5B/PL rats .............................................48b. Daily caloric intake in Osborne-Mendel and S5B/PL rats..........................................48
Figure 3.2.2 Daily body weight in Osborne-Mendel and S5B/PL rats .................................49Figure 3.2.3 Insulin and leptin concentrations in Osborne-Mendel and S5B/PL rats ..........50Figure 3.2.4 D2R binding in Osborne-Mendel and S5B/PL rats ..........................................50Figure 3.3.1
a. D2R dorsal striatal binding ratio plotted against body weight ....................................56b. D2R ventral striatal binding ratio plotted against body weight ..................................56
Figure 4.1.1a. Percent change in D2R BP in dorsal striatum.............................................................59b. Percent change in D2R BP in dorsal striatum.............................................................59
Figure 4.1.2a. Percent change in D2R BP in dorsal striatum plotted against weight gain.................60b. Percent change in D2R BP in ventral striatum plotted against weight gain ...............60c. Percent change in D2R BP in dorsal striatum plotted against cocaine preference .....60d. Percent change in D2R BP in ventral striatum plotted against cocaine preference ....60

viii
List of Abbreviations
CNS - Central Nervous SystemDA - DopamineD2R - Dopamine D2 ReceptorsANS - Autonomic Nervous SystemCCK - CholecystokininGLP-1 - Glucagon-like Peptide 1GRP - Gastrin-releasing PeptideBBB - Blood Brain BarrierLH - Lateral HypothalamusARC - Arcuate NucleusPVN - Paraventricular NucleusCPP - Conditioned Place PreferenceWHO -World Health OrganizationSAMHSA - Substance Abuse and Mental Health Services AdministrationkDa - KilodaltonOb(lep) - Leptin geneLepR - Leptin receptorJak-Stat - Janus Kinase- Signal Transducer and Activator of TranscriptionERK - Extracellular Signal-regulated KinasePI3K - Phosphoinositide 3-kinasecAMP/PDE3B - cyclic Adenosine Monophosphate/phosphodiesterase 3BNPY - Neuropeptide YAgRP - Agouti-related PeptidePOMC - ProopiomelanocortinVMN - Ventromedial NucleusNTS - Nucleus of the Solitary TractSN - Substantia NigraVTA - Ventral Tegmental AreaNAc - Nucleus AccumbensDOPA - DihydroxyphenylalanineVMAT - Vesicular Monoamine TransporterDAT - Dopamine TransporterD1R - Dopamine D1 ReceptorsD3R - Dopamine D3 ReceptorsD4R - Dopamine D4 ReceptorsD2L - D2 LongD2S - D2 ShortCSA - Cocaine Self-AdministrationPET - Positron Emission TomographyARG - AutoradiographyNAS - National Academy of SciencesNRC - National Research CouncilFR1 - Fixed Ratio 1ROI - Region of InterestCPu - Caudate Putamen

ix
CB - CerebellumANOVA - Analysis of VarianceKO - KnockoutMAP - Maximum a PosterioriPMOD - Pixel-wise ModelingBMI - Body Mass IndexOb U - Obese UnrestrictedOb R - Obese RestrictedLe U - Lean UnrestrictedLe R - Lean RestrictedAPO - ApomorphineST - StriatumCG - Cingulate CortexFC - Frontal CortexEIA - Enzyme ImmunoassayMI - Mutual InformationMRTM0 - Multi-reference Tissue Model 0BP - Binding PotentialNF - Non-fastedF - FastedCTX - CortexAcb - AccumbensBmax - Maximum BindingKd - Receptor AffinityICV - IntracerebroventricularDOPAC - 3,4-dihydroxyphenylacetic AcidOM - Osborne MendelS5B - S5B/PLAL - Ad-libitumR - RestrictedHF - High-fat FedIP - Intraperitoneal

Acknowledgements
First and foremost, I would like to thank my BNL advisor and mentor Dr.Panayotis (Peter) K. Thanos for his inspirational guidance and unremitting support,without which, this dissertation would not be possible. Thank you for shaping me into ascientist.
I am uniquely indebted to my SBU advisor Dr. John K. Robinson as well as mycommittee members Dr. Brenda J. Anderson and Dr. Arthur Aron for their significantmentorship, support and professional guidance. Thank you very much for yourcontributions to my growth as a scientist and educator.
I am very grateful to Dr. Gene-Jack Wang for his intellectual enthusiasm, creativeadvice, support, mentorship and professional guidance. I’ve enjoyed our numerousstimulating discussions and I look forward to many more in the future.
I owe a great deal of gratitude to Dr. Nora D. Volkow for her invaluable advice,contributions and support. Working with Dr. Volkow has been an exceptionally uniqueprivilege and I am very proud, and grateful, for the opportunity.
A very big THANK YOU to the Thanos Lab. In particular, Yianni K. Piyis andLisa Robison for help with autoradiography experiments, Ronald Kim for help withµPET imaging, and Mala Ananth for help with behavioral experiments. Many thanks toColleen Shea, Youwen Xu, Lisa Muench, Michael Schueller, and David Alexoff forcyclotron operations and radiotracer preparation. Thank you very much to ourcollaborators, Drs. Stefany Primeaux and George Bray at Pennington BiomedicalResearch Center for providing the Osborne-Mendel and S5B/PL rat strains and Dr.Hiroyuki Umegaki for providing the D2 adenoviral vector. Many thanks to the staff at theSBU Psychology department, including Marilynn Wollmuth, Judy Thompson, DonnaHildenbrand, Jean Bieselin, Cynthia Forman, Glenn Hudson and Ralph Molaro.
I am very grateful for funding and support provided by the Psychology Programat Stony Brook University, Brookhaven National Laboratory, and the NIH IntramuralResearch Program.
Thank you to John Wiley & Sons (sections 2.2 and 3.1) and The EndocrineSociety (Figure 1.2.1) for granting permission to reproduce previously published contentpresented in this dissertation.
Finally, and most importantly, I am extremely grateful to my fiancée, my sister,parents, and family for their support and the unique and exceptional teachings of lovethroughout the years.
1
Chapter 1
Introduction and Background Review
1.1 IntroductionChronic drug use and overeating are two behaviors that result in devastating
health consequences since they predispose the individual to potentially fatal disorderssuch as drug addiction and obesity. Addiction and obesity are unique cases that resultfrom disturbances in ingestive behavior (Volkow & Wise, 2005). Each disorder isselective to certain individuals, and each is subject to genetic predispositions(differences in peripheral and central nervous system (CNS) mechanisms),environmental factors (availability of drugs or palatable food) (Erlanson-Albertsson &Zetterstrom, 2005; Volkow & Wise, 2005) as well as periods of developmentalvulnerability (Buka et al., 2003; Mennella et al., 2004). Furthermore, drug addictionand obesity share striking similarities in specific brain mechanisms that regulate themotivational aspects leading to each disease and are also characterized by similarbehavioral manifestations such as impulsivity and compulsiveness (Volkow & Wise,2005). Finally, treatment strategies for both disorders are particularly similar andmany prospective medications aimed at regulating drug abuse also regulate obesity andvice-versa (Volkow & Wise, 2005). Since we are currently facing an obesity epidemicand there is a desperate need for medications aimed at treating drug addiction, it isimperative to study these disorders in parallel, since potential discoveries of how theyoverlap may produce significant and specific treatment interventions for both.
Dopamine (DA) is a catecholamine neurotransmitter with a well-documentedrole in motivation and goal-directed behavior. Clinical studies have previouslydocumented low DA D2 receptor (D2R) binding availability in the striatum of obeseindividuals and chronic cocaine users (Wang et al., 2004). These studies havesuggested that low concentrations of D2R or impaired DA-D2R signaling in thestriatum may underlie deficits in goal-directed behaviors that can lead to excessivefood and cocaine seeking/consumption and eventually to obesity and drug addiction(Wang et al., 2004). The goal of this thesis is to examine the relationship betweenstriatal DA-D2R and leptin signaling in rodents, and how this relationship may affectbehaviors relevant to obesity and cocaine abuse. The main idea is that the peripheryprovides energy-store information to motivational brain circuits, which in turn caninitiate the appropriate goal-directed behaviors to increase or decrease energy intake

2
and that deficits in this signal may lead to behavioral disorders like overeating andcocaine abuse.
1.2 Peripheral and Central Regulation of Ingestive Behavior
1.2.1 Ingestive Behavior
The definition of the term “ingestive behavior” is critical for the thematic stanceof this thesis. The English term “ingest” means “to consume regularly”, or “to take up, asof knowledge or beliefs” and is derived from the Latin “ingenium” which is the pastparticiple of “ingerere”. In English, “ingerere” translates as “to put in” (Websters-Merriam). Based on these definitions and etymology, “ingestive behavior” can beinterpreted as any act that involves putting something into one’s body, whether by eating,drinking, injecting, snorting, or even learning. Within this context, the acts of seekingand/or consuming food and drugs of abuse can be thought of as similar processes.Likewise, disorders like obesity and drug addiction that result from repeated consumptionof food and drugs can be thought of as originating from disturbances in ingestivebehavior (Volkow & Wise, 2005). This approach, although crude at first sight is alsobeneficial in that it facilitates the overlapping of insights and constructs from obesity anddrug addiction and therefore may lead to new discoveries for each disorder.
1.2.2 Homeostatic Mechanisms and Ingestive Behavior
Energy homeostasis consists of various interdependent processes that areregulated by the CNS to maintain energy stores such as glycogen in the liver andmuscles, glucose in the blood, and fat in adipose tissue at appropriate levels for givenenvironmental conditions (Woods & D'Alessio, 2008). The CNS accomplishes this byregulating the secretion of specific metabolic hormones primarily via the autonomicnervous system (ANS) (Woods & D'Alessio, 2008). Such signals are broadly separatedinto two main categories: satiety and adiposity signals. Satiety signals include ghrelin,cholecystokinin (CCK), glucagon-like peptide 1 (GLP-1) and gastrin-releasing peptide(GRP). Such signals are phasic in nature. They are synthesized and act directly on thebrain, and also secreted in the periphery, particularly in the digestive tract where they acton vagal afferents to the CNS (Figure 1.2.1) (Woods & D'Alessio, 2008). Adipositysignals are characterized by tonic secretion and include insulin and leptin which enter theCNS by active transport via the blood brain barrier (BBB) and act on specific sites withinkey areas of the brain such as the lateral hypothalamus (LH), the arcuate (ARC), andparaventricular nuclei of the hypothalamus (PVN) (Woods & D'Alessio, 2008).
While involvement of homeostatic mechanisms in feeding cannot be understated,the involvement of such mechanisms in drug use is less clear. The principle ofhomeostasis in drug use may be exemplified by features of drug abuse and addiction suchas withdrawal (i.e. the brain responds to an imbalance in the system which drug usereverts to normal). Indeed, recent studies have examined the contribution of feeding-

3
related homeostatic mechanisms to drug abuse. More recent studies have shown that theadministration of the anorexigenic peptide leptin facilitates the extinction of cocaine self-administration (Gray et al; unpublished results), while administration of the orexigenicpeptide ghrelin augments cocaine conditioned place preference (CPP) (Davis et al.,2007).
Figure 1.2.1 Central regulation of energy balance. Adapted from (Woods & D'Alessio,2008).
1.2.3 Non-homeostatic mechanisms and Ingestive Behavior
Along with the above homeostatic mechanisms, body weight and appetiteregulation are also affected via non-homeostatic mechanisms that are influenced by taste,pleasure, habits, social interactions, convenience, availability, and stress (Strubbe &Woods, 2004). Drug use is thought to be affected by similar non-homeostaticmechanisms (Corwin & Hajnal, 2005). All of the aforementioned factors (with theexception of taste) increase the propensity to drug use and can facilitate the developmentand persistence of addiction (Corwin & Hajnal, 2005).
1.3 Ingestive Behavior Disorders
1.3.1 Overeating and Obesity
Feeding involves one of the most widely studied reward survival mechanisms(Fetissov et al., 2002) and along with the need to reproduce, it can be considered as theunderlying foundation to all other reward-related behaviors. It is believed that this

4
fundamental role of feeding in survival, coupled with excessive food availability andthe type of food consumed (high-fat, high-sugar, high-salt), has led to food over-consumption, thus leading to a major obesity epidemic in the United States (Isasi et al.,2006). Since 1980, the prevalence of obesity has increased dramatically. Thepercentage of overweight adolescents has increased by more than 300 percent and thelatest data from the National Center for Health Statistics show that in the UnitedStates, 60 million people (roughly 30 percent of adults 20 years of age and older) areobese (Ogden et al., 2010). Although one of the national health objectives for the year2010 is to reduce the prevalence of obesity among adults to less than 15%, current dataindicate that the situation is worsening rather than improving (Flegal et al., 2010;Ogden et al., 2010). According to the World Health Organization (WHO) in 2005, therewere about 1.6 billion overweight adults (15 years and above) and at least 400 millionobese adults worldwide (WHO, 2008).
Obesity can originate from one or multiple underlying causes. The two maincauses of obesity are attributed to genetic and environmental factors. In turn these maybe further affected by physical, psychological, and cultural factors. In general, obesityarises from a chronic dysregulation of energy balance, that is, the proportion of energyintake compared to energy expenditure. Energy intake is modulated by the amount andtype of food consumed. Energy expenditure is modulated by metabolism, physicalactivity and lifestyle. For both energy intake and expenditure, this modulation can beoffset by multiple factors, including imbalances in or tolerance to endogenous peptidesand neurotransmitters whose primary or secondary role is normal food intake and/ormetabolic regulation
1.3.2 Cocaine Abuse and Addiction
Drug addiction is a chronic disorder that is characterized by the urge to use oneor more drugs of abuse and the inability to control drug intake and continued useregardless of the destructive consequences involved (Pierce & Kumaresan, 2006). Themajor factor that contributes to this disorder is the powerful reinforcing effect thatcharacterizes drugs of abuse (Pierce & Kumaresan, 2006). This overwhelming powerleads to compulsive drug taking, which in turn constitutes an essential requirement forthe neuronal adaptations that produce addiction (Pierce & Kumaresan, 2006). Thefocus of this thesis is on the psychostimulant cocaine. In 2004, 34.2 million Americansaged 12 and over reported lifetime use of cocaine and 7.8 million reported using crack(cocaine analog) (SAMHSA, 2005). There were an estimated 2.1 million new users ofcocaine in 2007, and most were aged 18 or older although the average age of first usewas 20 years (SAMHSA, 2008).

5
1.4 Leptin
1.4.1 Leptin Signaling
The adiposity signal leptin is a 16 kilodalton (kDa) peptide, identified in 1994,that is secreted primarily from white adipocytes as well as the stomach and other tissues(skeletal muscle, liver, brain) in direct proportion to body fat (Zhang et al., 1995;Margetic et al., 2002). In humans, the gene that encodes leptin (Ob(lep)) is located onchromosome 7 (Maffei et al., 1995). There are three distinct types of leptin receptors; thelong form (LepRb), the short forms (LepRa and LepRc) and the soluble form. In thebrain, leptin receptors are primarily expressed in the ARC. In the periphery, they havebeen localized in the ovary, prostate and testis (Li & Friedman, 1999; Ur et al., 2002;Bates & Myers, 2003). Peripheral circulating leptin is found in two forms, the free activeform of leptin and leptin bound to the soluble form of the leptin receptor which is thoughtto serve as a compensatory feedback system to decrease active circulating leptin levels.Leptin receptors signal through the Janus Kinase- Signal Transducer and Activator ofTranscription (Jak-Stat) (via Stat3 activation) (Hakansson & Meister, 1998; Elias et al.,1999; Munzberg et al., 2003) as well as the Extracellular Signal-regulated Kinase (ERK),Phosphoinositide 3-kinase (PI3K), and the cyclic AdenosineMonophosphate/phosphodiesterase 3B (cAMP/PDE3B) pathways (Niswender et al.,2001; Zhao et al., 2002).
Leptin deficiency is a condition where leptin’s effects on energy balance arecompromised. Leptin deficiency can arise due to random mutations in the Ob(lep), theLepR, or from constant overeating resulting in leptin resistance. Impairment in normalleptin signaling can lead to a variety of symptoms, some of which include overeating,type II diabetes, weight gain, reproductive problems, bone formation deficiency andcardiovascular complications (Sahu, 2003). Obese humans and diet-induced obeseanimals have been shown to exhibit a resistance to leptin transport and/or action (Sahu,2003). In humans, mutations resulting in leptin deficiency are documented but they areextremely rare (Farooqi, 2008). There are several animal models of leptin deficiency.The ob/ob mouse is a naturally occurring spontaneous point mutation in the Ob(lep) thatprevents leptin from being produced. The db/db mouse and the fa/fa rat are naturallyoccurring mutations in the LepR, which prevents proper leptin signaling. Such animalmodels develop obesity-related symptoms as early as three weeks of age which includehyperphagia, hyperglycemia, hyperinsulinemia, hyperleptinemia, glucose intolerance,infertility, hypothermia, impaired wound healing and cardiovascular problems. Ob/oband db/db mice and fa/fa rats show excessive weight gain and adiposity (Zhang et al.,1995).
1.4.2 Leptin and Adiposity
Leptin is secreted from adipose tissue and this secretion depends on both thestatus of long-term fat stores of the organism as well as its short-term metabolic needs(Campfield et al., 1995; Halaas et al., 1995; Considine et al., 1996; Ostlund et al., 1996).Upon secretion, leptin is transported through the BBB (Banks et al., 2006) and acts

6
directly on the ARC via its receptors that are located on neurons expressing theorexigenic peptides Neuropeptide Y (NPY) and Agouti-related peptide (AgRP) and theanorexigenic peptide Pro-opiomelanocortin (POMC) (Hakansson & Meister, 1998; Eliaset al., 1999; Munzberg et al., 2003). Leptin also acts on other brain regions within andoutside the hypothalamus including the ventromedial nucleus (VMN) and the nucleus ofthe solitary tract (NTS).
Leptin’s effects are not purely anorexigenic. Leptin also regulates sympatheticnervous system activity and metabolism specifically by increasing energy expenditureand fat oxidation (Hwa et al., 1997; Shimabukuro et al., 1997; Wang et al., 1999). Finallyleptin regulates adiposity by altering neuroendocrine hormone secretion (Ahima & Flier,2000) and reproduction (Barash et al., 1996; Wade et al., 1997; Gruaz et al., 1998).
1.4.3 Leptin and Ingestive Behavior
The effect of nutritional status on motivation has been well-documented (Bell etal., 1997; Carr, 2007; Figlewicz et al., 2007). These studies have shown that negativeenergy balance states (via food deprivation) are associated with increased motivationtowards rewarding stimuli (i.e. food, drugs). Food deprivation decreases peripheral leptinconcentrations (Thanos et al., 2008) while feeding increases its secretion (Baskin et al.,1999). Exogenous leptin that is administered peripherally or centrally leads to areduction in food intake and body weight while low leptin concentrations in the peripheryor brain cause food intake and body weight to increase (Woods & D'Alessio, 2008).More importantly, leptin administration decreases the effects of negative energy balanceon motivated behavior towards food and drugs (Fulton et al., 2000; Figlewicz et al., 2001;Shalev et al., 2001) that is independent of food consumption (Figlewicz et al., 2001;Getchell et al., 2006). Recent reviews (DiLeone, 2009; Morrison, 2009) further describethese consummatory-independent effects of leptin as being mediated by brain areas thatlie both within and outside the hypothalamus (i.e. LH and the mesolimbic DA system)and that have traditionally been involved in reward seeking. In fact, in one of thesereviews (Morrison, 2009) leptin is described as playing an important role in regulatingsynaptic function, neuronal structure and plasticity, neuroprotection and also cognition.This view further implicates leptin’s role in regulating motivated behaviors relevant toreward seeking via effects on learning and memory.
1.5 Dopamine
1.5.1 Dopamine Signaling
DA is the most abundant catecholamine neurotransmitter in the brain. DAneurons are classified into three main classes based on their projection length:
1) Ultra-short projection class: this class includes amacrine-like neurons in theretina and the olfactory bulb characterized by very short intralaminar dendriticextensions.

7
2) Short projection class: this class comprises three distinct systems: a) DAneurons located in the ARC, which project to the pituitary and median eminence b)DA neurons located in the posterior hypothalamus, the zona incerta and PVN, c) DAneurons located in the NTS and in the periaqueductal gray.
3) Long projection class: this class includes DA neurons that originate in theretrorubal field, the subtantia nigra (SN) and the ventral tegmental area (VTA) andproject to the neostriatum, the limbic cortex, and other limbic areas such as theolfactory tubercle, septal areas, the nucleus accumbens (NAc) and the amygdaloidcomplex.
DA is not capable of crossing the BBB and is synthesized in CNS nerveterminals as a two step process from tyrosine. The first step involves catalysis oftyrosine hydroxylase and results in the production of dihydroxyphenylalanine (DOPA).The second step involves catalysis of DOPA from DOPA decarboxylase and results inthe production of DA.
DA synthesis originates in the cytosol and is then transported into presynapticvesicles by the vesicular monoamine transporter (VMAT). When DA vesicles reachthe presynaptic terminal, DA is released into the synaptic cleft by action potentialsthrough a calcium-dependent mechanism. Voltage-gated calcium channels activationcauses the fusion of the DA-containing vesicles with the presynaptic membrane. Apore forms in the presynaptic membrane from which DA is released into the synapticcleft and then diffuses across the synapse and binds to postsynaptic DA receptors. DAbinding to postsynaptic receptors can be either excitatory or inhibitory. Any excessunbound DA is removed from the synapse into the presynaptic terminal for storage andto be reused by use of a specific reuptake mechanism, the DA transporter (DAT). Inaddition to the DAT, there are specific DA receptors located at the presynapticmembrane that are called autoreceptors. These receptors monitor and modulate therelease and synthesis of DA from the presynaptic terminal and are found at nerveterminals, the soma and dendrites of DA neurons.
The diverse anatomy and distribution of DA neurons suggests that DA isinvolved in diverse brain functions. Indeed, DA regulates a broad range of functionssuch as arterial blood-flow, motor activity, cognition, learning, anxiety, hormonesecretion (Pijl, 2003), feeding, and reinforcement of addictive substances andbehaviors (Volkow et al., 2002a). These functions have been ascribed to the differentDA neuron projections. For instance, DA neurons in the nigrostriatal system areprimarily involved in the initiation and maintenance of motor behavior while DAneurons in mesolimbic and mesocortical systems are involved in rewarding, goal-directed and motivation-dependent behavior. DA neurons in the tuberoinfundibularsystem are primarily involved in regulating pituitary and hypothalamic peptide releasewhich in turn influence homeostatic behaviors such as feeding, drinking and blood-flow regulation.
DA receptors are classified into two main families and each family containsseveral receptor subtypes. The D1-like receptor family contains the D1 (D1R) and D5receptor (D5R) subtypes. The D2-like family contains the D2R, D3 (D3R) and D4receptor (D4R) subtypes. DA autoreceptors also belong to the D2-like receptor
8
family. All DA receptors are metabotropic and are characterized by a seventransmembrane domain.
The D2R was first cloned in 1988 in the rat (Bunzow et al., 1988). D2R show awidespread distribution in the brain with highest to lowest concentrations in thestriatum, midbrain, spinal cord, hypothalamus and hippocampus. There are twoisoforms of the D2R that are termed “long” (D2L) and “short” (D2S). Both isoformsinhibit adenylate cyclase activity and are susceptible to agonist-induceddesensitization. D2S are show greater distribution than D2L in the posterior cerebralcortex, the amygdala, the hypothalamus and the brain stem. On the other hand, D2Lshow greater distribution than D2S in the extrapyramidal basal ganglia.
1.5.2 Mesolimbic Dopamine and Adiposity
Previous studies have shown that the D2R has been associated with obesity.Studies conducted in animal models of obesity (ob/ob mice, fa/fa rats, obesity-proneSprague–Dawley rats and seasonally obese animals) have documented that treatment withDA agonists reverses the obesity, in part by activation of D2R (Pijl, 2003). Furthermore,evidence of the D2R’s involvement in obesity is given by the higher risk of weight gainobserved in patients chronically treated with antipsychotic drugs (D2R antagonists)(Friedman, 2004). Genetic studies have reported decreased D2R efficacy and increasedincidence of obesity in humans (Noble et al., 1994). Finally, morbidly obese humans(Wang et al., 2001) and obese rats (Hajnal et al., 2008) and mice (Huang et al., 2006)show deficits in mesolimbic D2R levels.
1.5.3 Mesolimbic Dopamine and Ingestive Behavior
It has previously been shown that DA mediates food intake through goal-directed mechanisms (McQuade et al., 2004) and that normal DA levels in the brainare indispensable for feeding and survival (Fetissov et al., 2002). For instance, DAsignal impairment in DA-deficient mice causes them to die of starvation by 3 weeks ofage if not treated with DA agonists (Hnasko et al., 2004). Indeed DA cells increasetheir firing rate (increasing DA release in the NAc) when expecting food and theirfiring in turn is influenced by food deprivation (Meguid et al., 2000). While DA hasbeen classically described as a neurotransmitter involved with locomotor activity andreward, more recent work has shown DA to be associated with the prediction ofreward (Schultz et al., 2000), motivation to procure the reward (McClure et al., 2003)and facilitation of conditioned learning (Fenu & Di Chiara, 2003). Thus, a possiblemechanism of DA involvement in food intake and obesity could be that DA signalingis increased in response to food as a stimulus predicting reward, leading to themotivation to procure the food (Fenu & Di Chiara, 2003). In this respect, since eatingis a highly rewarding behavior, DA may be responsible for regulating the reward orreinforcement (Epstein et al., 2007) necessary to maintain, accentuate, or abolishfeeding behavior (Berridge, 1996; Berridge & Robinson, 1998). There is evidencefrom microdialysis studies of lower DA levels in the NAc of ob/ob when compared tocontrols (Fulton et al., 2006) and of attenuated striatal DArgic responses to insulin in

9
fa/fa rats (Orosco et al., 1992). It has also been shown that fa/fa rats have high DATmRNA levels, (Figlewicz et al., 1998) as well as increased sensitivity of DAT for DAuptake (Owens et al., 2005). Furthermore, decreases in striatal DA levels have beenreported in fa/fa rats (Shimizu et al., 1991). Accordingly, subchronic food restriction (1week) has been shown to lead to a decrease in extracellular DA in the NAc (Pothos et al.,1995a; Pothos et al., 1995b). Also chronic food deprivation and diet-induced obesity,two conditions that are characterized by differences in feeding have both been related todecreases in extracellular DA levels in the ventral striatum (Pothos et al., 1998b).Finally, fa/fa ad-libitum fed rats had significantly lower DA metabolites in the striatumcompared to lean rats (Orosco et al., 1986).
The role of D2R in drug reward has been documented by studies showing thatD2-like receptor agonists are self-administered by rodents and non-human primates(Ranaldi et al., 2001) and D2-like receptor agonists decrease cocaine self administration(CSA) (Barrett et al., 2004). Antagonists produce the opposite effect (Caine et al., 2002)and mice lacking the D2R also show increased CSA compared to respective wild-types(Caine et al., 2002).
Genetic studies have found that individuals carrying the Taq 1 A1 allele of theD2R gene have decreased D2R levels (Thompson et al., 1997) (Noble, 2000) though onestudy did not find this association (Laruelle et al., 1998). Individuals with this allele aremore vulnerable to addictive behaviors, compulsive food intake (Noble et al., 1993;Volkow et al., 1999a) and are more likely to be obese (Noble et al., 1994) (Comings &Blum, 2000). It is believed that low D2R levels predispose subjects to search forreinforcers; in the case of drug-addicted subjects for the drug and in the case of obesesubjects for food as a means to temporarily compensate for a decreased sensitivity ofD2R regulated reward circuits (Wang et al., 2004). Treatment strategies aimed atrestricting drug use and pathological eating in drug addicts and obese subjects wouldthus restrict the compensatory effects that excessive drug and food intake have onreward in these individuals. Behaviorally, this could either lead to relapse towardsdrug use and pathological eating or, when this is not possible (i.e. rehabilitation center,diet clinic, etc.), to the adoption of alternative reinforcing behaviors. Specifically,drug addicts in rehabilitation may take on pathological eating, while obese subjects ona diet may take on drug use in an effort to increase feelings of reward. Furthermore,when drugs are not available to cocaine addicts and food is not available to obeseindividuals, the DA system may compensate by increasing D2R levels in an effort toincrease reward and therefore alleviate symptoms associated with decreased rewardsensitivity. Interestingly, inasmuch as cocaine addicts and obese individuals arecharacterized by low D2R levels, abstinence from cocaine and chronic fooddeprivation are both associated with high D2R levels (Volkow et al., 2002c).
Imaging studies have recently corroborated the involvement of D2R in bothdrug abuse and obesity by documenting reductions in D2R levels in the striatum ofcocaine addicts (Volkow et al., 1997), cocaine-exposed non-human primates (Nader etal., 2006), pathologically obese individuals (Wang et al., 2001) and hyperphagic obeserodents (Hamdi et al., 1992; Hajnal et al., 2008; Thanos et al., 2008), while patientswith anorexia nervosa have reported higher than normal striatal D2R availability(Frank et al., 2005). Furthermore, positron emission tomography (PET) imaging
10
studies in humans have corroborated an involvement of D2R both in food reward(Small et al., 2003) as well as in the motivation to procure food (Volkow et al.,2002b). What remains to be elucidated is whether cocaine addicts and obese subjects areborn with inherently lower levels of D2R, or whether the addiction and obesity resultfrom drug use and pathological eating behaviors.
1.6 Leptin and Dopamine InteractionsFeeding can be affected by homeostatic mechanisms such as the “need” to eat,
or non-homeostatic mechanisms such as taste or pleasure (Berthoud & Morrison,2008). In particular, mesolimbic DA has been described as having a central role in thebehavior associated with non-homeostatic feeding (Berridge & Robinson, 1998).Activation of this pathway has been associated with the motivating and rewardingproperties of food as well as drugs (Berridge & Robinson, 1998). Tasty or pleasurablefoods such as a diet high in fat have been shown to interact with and modulate theeffectiveness of the leptin-CNS feedback loop (Lin et al., 2001). Specifically, thisfinding suggests that constant high-fat feeding may result in a loss of adipose signaleffectiveness, which can also affect specific neural circuits like mesolimbic DA, whichmediate motivation and reward. This effect of the environment on specific neuralcircuits is thought to have contributed to the continuously escalating obesity trends ofthe 1990s and 2000s (Hill et al., 2003).
Caloric intake modulates cocaine intake. Specifically, food restriction (whichleads to decreases in leptin) augments CSA (for review please see (Carr, 2007)), whilediet-induced obese rats show impaired acquisition of CSA (Wellman et al., 2007).This latter finding agrees with epidemiological studies which report a 25% decrease inthe odds of developing substance abuse disorders in obese individuals (Simon et al.,2006). The effects of caloric intake on drug intake are thought to be mediated by leptin(Trinko et al., 2007). Food intake results in a temporary increase in blood leptin levels(Baskin et al., 1999) and obese patients and rodents have been shown to exhibit aresistance to leptin transport and/or action (Sahu, 2003), a condition reversed by chronicfood restriction (Thanos et al., 2008). In turn, low levels of circulating leptin are thoughtto underlie increased responding to obtain rewards (Figlewicz & Benoit, 2009). Leptinsignaling directly modulates mesolimbic DA neuron activity and impacts both foodintake and drug addiction-related behaviors (for review please see (Trinko et al., 2007)and (Figlewicz & Benoit, 2009). DA concentration decreases as blood leptin increases(Hagan et al., 1999) and short term leptin treatment decreases both DA release andconcentrations in the NAc (Krugel et al., 2003) and the hypothalamus in a dose-dependent manner (Brunetti et al., 1999). Leptin’s involvement in drug reward has beendocumented by studies showing that it attenuates the propensity to heroin relapsecaused by food restriction (Shalev et al., 2001) and that ob/ob mice show attenuatedamphetamine sensitization, which is reversed by leptin treatment (Fulton et al., 2006).Also, when given cocaine, ob/ob mice show reduced D2R-mediated synaptic currentactivity, an indication of decreased cocaine sensitivity, which leptin also reverses tonormal levels (Roseberry et al., 2007).

11
Chapter 2
Dopamine D2 Receptors and Cocaine Abuse
2.1 CSA decreases D2R binding in mice
2.1.1 Introduction
Cocaine is an indirect-acting monoamine agonist, binding with approximatelyequal affinity at the DA, serotonin and norepinephrine transporters. The downstreameffects of DA mediate the subjective and reinforcing effects of cocaine leading to its highabuse potential (Nader et al., 2006). Cocaine has the common ability to increaseextracellular DA in the NAc (Di Chiara & Imperato, 1988). In fact, a single exposure tococaine or other drugs of abuse induces long-lasting effects on electrophysiological andbehavioral responses, revealing their powerful ability to control brain plasticity(Vanderschuren et al., 1999; Ungless et al., 2001; Faleiro et al., 2003; Saal et al., 2003;Fourgeaud et al., 2004; Valjent et al., 2005). The aim of this study was to evaluate thetime-course changes of D2R binding in mice in response to different lengths of CSAexposure by using in vitro autoradiography (ARG). In so doing, we wanted to seewhether acute and/or prolonged exposure to cocaine decreases D2R binding.
2.1.2 Methods
Animals
Male 3-4 week old C57/BL6 mice (Charles River, Wilmington, MA, USA) wereindividually housed in a 12-hr reverse light-dark cycle (lights off at 0800hr) in acontrolled room (72 ± 2°F and 40-60% humidity). Experiments were conducted duringthe dark cycle from 1200hr to 1500hr. During CSA sessions both water and Purinalaboratory mouse chow was available on an ad-libitum basis. During the food trainingexperiments, water was available ad-libitum but mouse chow was restricted (5 g/day) toencourage operant responding for food pellets. All experiments were conducted inconformity with the National Academy of Sciences Guide for Care and Use ofLaboratory Animals (NAS & NRC, 1996) and Brookhaven National LaboratoryInstitutional Animal Care and Use Committee protocols.

12
DrugsCocaine hydrochloride (Sigma-Aldrich, St. Louis, MO, USA) was prepared by
dissolving it in saline for a dose of 1 mg/kg.
Apparatus
Operant chambers (30 x 25 x 30 cm; Coulbourn Instruments, Allentown, PA,USA) were placed inside sound attenuation cubicles. One side wall contained two leversand a food receptacle in the center. The left lever was designated as the active(reinforced) lever while the right lever was inactive (non-reinforced) lever. Both leverswere situated directly under their respective cue lights. The infusion pump was set at afixed rate of 0.025ml/s for 2s. All CSA experimental variables were programmed usingGraphic State v3.02 software (Coulbourn Instruments, Allentown, PA, USA).
Food Training
Mice were trained daily for at least 3 days (60min/session) using a fixed-ratio 1(FR1) schedule. By pressing the active lever, one food pellet (20mg) was released intothe receptacle as the cue light was illuminated for a 30s timeout period. Pressing theinactive lever had no programmed consequence. Successful lever discrimination wasachieved when mice met previously described criteria of an active/inactive lever pressratio ≥ 2:1 over three consecutive days (Larson & Carroll, 2005). All mice went throughone additional session of food retraining to ensure conditioning met criteria after surgery.
Surgery
Surgery was performed prior to operant training on animals at 4-5 weeks of age.Mice were anesthetized with 100/10 mg/kg Ketamine/Xylazine (Fort Dodge, TX/LloydLaboratories, IA). A four-centimeter (4cm) lateral incision was made along the chest andthe right jugular vein was dissected out and isolated from the surrounding tissue. A 20-gauge heparin tipped, silicon catheter (Instech Solomon, PA) was implanted into thejugular vein and anchored to the surrounding fascia with a 7–0 silk suture (Biosurgery,MA). The venous line was flushed with normal saline to test patency and to compensatefor volumetric blood loss. The distal catheter tubing was subcutaneously routed to thedorsal region of the animal, where it was attached to a backmounted 22-G cannula(Plastics One, VA). The line was flushed daily with saline and filled with heparin (80IU/ml) /cefazolin (200 mg/ml) locking solution (Sigma, USA/G.C. Hanford, NY) toprevent clotting and thrombus formation. Animals were given a one-week recoveryperiod before they are started on the operant conditioning task. Catheter patency wastested every three (3) days with a 0.1 ml infusion of 100/10 mg/kg ketamine/xylazinesolution. The catheter was determined to be patent only if the mouse lost the rightingreflex within 3s of the injection. If the catheter was not patent, the mouse wasimmediately taken out of the study and only data from patent days was used.

13
CSA
After recovery, animals were put on a fixed-ratio food training schedule usingoperant boxes (Coulbourn Instruments, PA) until animals reached a stable FR4 leverpressing for food baseline (achieved a criteria of <20% variation in the mean number offood pellets for 3 consecutive days) before being started on cocaine SA.
After food training, CSA sessions (60 min/day) were started for 2, 10 and 15days. At the start of the first session, mice received one priming infusion of cocaine. Asingle press of the active lever resulted in an immediate delivery of cocaine (1 mg/kg)followed by a 30s timeout period. During the timeout period, the cue light above theactive lever was illuminated and the drug was not available. The inactive lever did nothave a programmed consequence but responses were recorded. A total of 4 groups wereexamined: (1) Sham, (2) 2 days of CSA, (3) 10days of CSA, and (4) 15 days of CSA.Cumulative lever-press and drug infusion data were recorded for each session. All datawere acquired using Graphic State software (Coulbourn Instruments, PA).
Tissue Preparation
Each animal was deeply anesthetized with a mixture of ketamine (100 mg/kg) andxylazine (10 mg/kg). The brain was rapidly removed and frozen in an isopentane and dryice bath and stored in a –800C freezer. The brain was then transferred to a cryostat (LeicaCM3050S), and sections were cut 14 µm thick at –180C. Sections were mounted onFisherbrand, Colorfrost */Plus microscope slides and stored at -800C until binding wasconducted.
D2R ARG
Before binding began slides were gradually brought back to room temperatureand then pre-incubated at room temperature for ten (10) minutes in 50mM Tris-HClbuffer (pH 7.4). The slides were then incubated in total binding buffer (50mM Tris-HCl,0.4 nM [3H]spiperone (Perkin Elmer), 10 µM ketanserin tartrate (Tocris Bioscience)) atroom temperature for one (1) hour. To determine non-specific binding some slides inparallel were incubated for one (1) hour in specific binding buffer in the presence of 10µM haloperidol (Tocris Bioscience). Next, the slides were washed 2 x 10 minutes in ice-cold 50mM Tris-HCl and a 2s dip into ice-cold dH2O.
Data Analysis
After binding was completed, one (1) ml aliquots of incubation solution weretaken and added with five (5) ml of Ultima Gold XR (scintillation solution) and theamount of radioactivity was measured with a liquid scintillation counter. Slides weredried overnight at room temperature in a dessicator and placed in a glass slide cassette forqualitative and quantitative analysis using a β-Imager 2000 (Biospace, Paris,France/Biospace Lab, USA).
Using βvision+ software (Biospace, Paris, France/Biospace Lab, USA), Regionsof Interest (ROIs) were drawn on the left and right: Caudate Putamen (CPu), NAc andCerebellum (CB) for each brain slice. The data was then calibrated using a tissue

14
homogenate standard as µCi/g and then expressed as a ratio of receptor rich/receptor poorbinding (CPu/CB and NAc/CB).
2.1.3 Results
Active Lever Presses
One-way analysis of variance (ANOVA) showed a significant main effectbetween days of CSA in active lever responses with (F(2, 77)=5.75; p=0.005). Pair-wisecomparisons (Holm-Sidak: α=0.05) revealed significantly lower active lever presses at 10day (t=3.16) and 15 days (t= 2.65) compared to 1 day of CSA (Figure 2.1.1a).
Inactive Lever Presses
One-way ANOVA showed no significant main effect between days of CSA inactive lever responses with (F(2, 77)=1.14; p=0.325).
Infusions
One-way ANOVA showed a significant main effect between days of CSA ininfusions with (F(2, 77)=3.35; p=0.04). Pair-wise comparisons (Holm-Sidak: α=0.05)revealed significantly lower infusions at day 10 (t=2.56) compared to day 1 of CSA(Figure 2.1.1b).
Effects of Cocaine Exposure on D2R Binding in the CPu
One-way ANOVA showed a significant main effect in CPu D2R binding[F(3,297) = 28.71; p <0.001]. Pair-wise comparisons (Holm-Sidak: α=0.05) revealed thatD2R binding levels in mice exposed to 10 (t=8.11) and 15 days (t=5.95) of CSA weresignificantly lower than D2R binding in naïve mice. Also, D2R binding levels for miceexposed to 10 (t=6.72) and 15 days (t=4.5) of CSA were significantly lower than D2Rbinding in mice exposed to 1 day of CSA. Finally, D2R binding in mice exposed to 15days of CSA was significantly greater than D2R binding in mice exposed to 10 days ofCSA (t=2.72) (Figure 2.1.1c).
Effects of Cocaine Exposure on D2R Binding in the NAc
One-way ANOVA showed a significant main effect in NAc D2R binding[F(3,297) = 63.06; p <0.001]. Pair-wise comparisons (Holm-Sidak: α=0.05) revealed thatD2R binding levels in mice exposed to 10 (t=9.96) and 15 days (t=10.4) of CSA weresignificantly lower than D2R binding in naïve mice. Also, D2R binding levels for miceexposed to 10 (t=8.99) and 15 days (t=9.25) of CSA were significantly lower than D2Rbinding in mice exposed to 1 day of CSA (Figure 2.1.1d).

15
Figure 2.1.1a Figure 2.1.1b
Figure 2.1.1c Figure 2.1.1d
Figure 2.1.1. (a) Total active lever presses during the last day of CSA for each group. (b)Total infusion during the last day of CSA for each group. (c) [3H]spiperone D2R bindingby experimental group in the CPu. (d) [3H]spiperone D2R binding by experimental groupin the NAc.
2.1.4 Discussion
Here we found that prolonged (10 and 15 days) cocaine exposure decreasedlever pressing and infusions for cocaine in mice as compared to acute 1 day exposure.We saw a similar decline in D2R binding in both the CPu and NAc after 10 and 15days of CSA but not after 1 day. This suggests that D2R deficits observed in humancocaine abusers may arise from continued stimulation of D2R by excess synaptic DA.The constantly elevated levels of DA that remain in the synapse (since cocaine blocksDA reuptake) after 10 and 15 days of repeated cocaine exposure would lead to

16
downregulation of D2R, as we observe. In turn, low D2R levels may lead to increasesin motivation to seek and consume more cocaine.
2.2 D2R DNA transfer decreases CSA in rats
2.2.1 Introduction
The involvement of the mesolimbic DA pathway in the initiation and maintenanceof substance abuse including cocaine, has been generally established (Steketee, 2005).Specifically, among the structures in the mesolimbic reward circuit the NAc is believedto play a critical role in cocaine’s reinforcing effects (Chang et al., 1994; Laurier et al.,1994; Carelli et al., 1999; Nicola & Deadwyler, 2000).
Cocaine’s primary mechanism of action on reward is believed to be its ability toblock DAT, thus rapidly increasing the availability of DA in the synaptic cleft (Ritz et al.,1987). Increased levels of striatal DAT occupancy by cocaine correlate with subjectivereports of “highs” in human subjects (Fowler et al., 2001) , and µdialysis studies showthat both active and passive administration of cocaine lead to elevated levels ofextracellular DA in the NAc of rats and mice (Rouge-Pont et al., 2002). In addition, DAreceptor agonists and antagonists can modulate or disrupt self-administration behavior(Koob et al., 1987; Corrigall & Coen, 1991; Hubner & Moreton, 1991), CPP (Baker etal., 1998; Sora et al., 1998; Vorel et al., 2002), and locomotor responses to cocaine(Baker et al., 1998; Chausmer & Katz, 2001).
The D2R subtype in particular has been suggested as an important component ofthe reinforcing effects of cocaine and other drugs (Rouge-Pont et al., 2002). Low D2Rlevels in ventral striatum (where the NAc is located) have been found in the brains ofcocaine addicted humans, including cocaine abusers (Volkow et al., 1996), and in strainsof rats bred to self-administer large quantities of ethanol (McBride et al., 1993; Thanos etal., 2004), whereas in these same rats the density of D1R and D3R receptor subtypes doesnot appear to differ from levels found in wild type animals (McBride et al., 1997). It hasalso recently been found that mutant mouse strains which do not express the D2R self-administer cocaine at a far greater rate when compared to wild-type animals (Caine et al.,2002). These lines of evidence suggest that the D2R plays a significant role in thereinforcing effects of cocaine and other abused substances, and that D2R levels may beone of the neurobiological variables that modulate the vulnerability of individuals to drugabuse.
In humans, the A1 allele of the D2R gene is associated with alcoholism, cocaineabuse, smoking, methamphetamine abuse, opioid abuse, gambling, obesity, schizophreniaand depression (for review see (Noble, 2003)) and lower D2R in key structures inmesolimbic reward pathways such as the NAc and amygdala (Pohjalainen et al., 1998) .However, some have failed to document such associations (Gelernter et al., 1993; Sery etal., 2001) and therefore the involvement of the A1 allele of the D2R gene remainscontroversial.

17
The previous section reports a downregulation of D2R binding in response tochronic cocaine intake. Previous studies have demonstrated that D2R gene-transfer intothe NAc of the brain significantly attenuated alcohol intake and preference in SpragueDawley rats (Thanos et al., 2001; Thanos et al., 2004); inbred alcohol preferring P rats(Thanos et al., 2004) and in mice (Thanos et al., 2005). Inasmuch as ethanol and cocaineshow overlap in the circuits involved in their rewarding effects (Koob et al., 1987; DiChiara et al., 1992), we hypothesized that upregulation of D2R in the NAc of rats self-administering cocaine would reduce their cocaine intake.
2.2.2 Methods
Animals
Sixteen adult male Sprague-Dawley rats (300-400 g) were individually housed ina controlled environment (222 C, 5010% relative humidity) and subjected to a 24-hour reverse 12 hr light / 12 hr dark cycle (lights off at 0800h) to maintain activity duringthe daytime. Weights were obtained daily and food and water was provided ad libitum.Experiments were conducted in conformity with the National Institutes of Health Guidefor the Care and Use of Laboratory Animals (NAS & NRC, 1996) and BrookhavenNational Laboratory Institutional Animal Care and Use Committee protocols.
Drugs
Cocaine hydrochloride (0.3 mg/kg; Sigma, St. Louis, MO) was dissolved in saline(0.9% NaCl).
Procedures
Rats were trained to lever press for 45 mg food pellets (Bio-Serv, Frenchtown NJ)in operant chambers (Coulbourn Instruments, Allentown PA) on a 2-hour fixed ratio 1(FR-1) schedule daily. Data retrieval and processing was completed using Graphic Statesoftware (Coulbourn Instruments, PA). After reaching a criterion of at least 50 pellets persession for three consecutive days, rats were operated and jugular catheterizationperformed as previously described (Thanos et al., 2007). While rats were anesthetized[ketamine and xylazine (100 mg/kg, 10 mg/kg)] for jugular catheter implantation, theywere also placed in a Kopf stereotaxic apparatus and were implanted unilaterally with a22-gauge guide cannula (Plastics One, Roanoke, VA) into the NAc shell (+1.2 mm AP,+1.4 mm ML, -6.8 mm DV (Paxinos & Watson, 1986). Laterality of cannula placementwas randomly assigned so that half the rats received left NAc implants while the otherhalf received implants into the right NAc. The guide cannula was then secured to theskull with four small stainless steel screws and dental cement.
Following a 1-week recovery from surgery, the rats were re-introduced to theoperant –conditioning apparatus and the food FR1 protocol for 3-4 days before beingstarted on the cocaine protocol. In the cocaine protocol, lever responses were followed byintravenous cocaine infusions. Each daily CSA session lasted two hours and wasconducted at approximately the same time of day (1000 - 1200hrs). Approximately 100l of cocaine solution (0.3 mg/kg) was delivered intravenously following a single press

18
of the reinforced (active) lever, followed by a thirty second timeout period during whichpresses of the active lever were recorded but not reinforced. A second or “dummy” leverwas also provided in the conditioning box, and responses on this lever were recorded buthad no programmed consequences.
After 7 days of CSA, all animals were treated with a microinfusion into the NAcof the control, replication-deficient adenovirus or Null Vector (AdCMV.Null), aspreviously described (Thanos et al., 2001; Thanos et al., 2004), and then returned to thedaily CSA sessions for 1-week. Subsequently, all animals were similarly microinfusedonce into the NAc with the D2R vector [(AdCMV.DRD2), [see previous studies fordetails (Ikari et al., 1995; Umegaki et al., 1997; Ingram et al., 1998; Thanos et al., 2001;Thanos et al., 2004)] and then returned to the CSA for 14 days.
Microinfusion of the vectors was carried out using an automated syringe pump(Razel, Stamford, CT) and a 26-gauge 5 μl Hamilton microsyringe connected to a 28-gauge internal cannula. Each microinfusion administered unilaterally into the NAc shell 2μl of vector [adenoviral vector containing the cDNA for the D2R receptor(AdCMV.D2R) (1010 pfu/ml)] over 10 minutes so as to reduce the risk of procedure-induced lesions. During the control treatment with the Null vector, the same procedurewas followed, except that the solution infused was 0.2M phosphate buffered saline.
Following completion of the behavioral experiments, brains were harvested fromall rats for histological confirmation of the cannula placements. Briefly, each animal wasdeeply anesthetized with ketamine (100 mg/kg) and xylazine (10 mg/kg) and the brainwas rapidly removed and frozen in an isopentane /dry ice bath, and stored in a freezer at -80o C. Next, 20 µm thick coronal sections were cut on a cryostat (Leica CM3050S, LeicaMicrosystems, Nussloch, Germany). Sections were stained with 1% cresyl violet,coverslipped with Permount and allowed to air dry before verification of cannulaplacement in the NAc under light microscopy.
2.2.3 Results
Rats did not show any signs of malaise or weight loss after treatment with thevector and no alterations in general behavior were noted. This was consistent withprevious studies (Thanos et al., 2001; Thanos et al., 2004). Treatment with the D2Rvector produced a significant albeit transient reduction in the number of cocaine infusionsand reinforced lever responses in cocaine-experienced rats. In both the infusion andreinforced lever response data, by post-treatment day 11, most rats had returned tobaseline levels of CSA.
Null & D2R Vector Treatment: Infusions and Lever Responses
Two statistical analyses were conducted. I. A one-way ANOVA compared thenumber of infusions and active lever presses during the three time phases a) days 1 to 7(pre Null Vector treatment); b) days 8-15 (post Null vector treatment) and c) days 16-22(post D2R vector treatment). II. The second analysis, utilized a one-way repeatedmeasures ANOVA to compare infusions and lever presses on individual days.

19
One-way ANOVA
The one-way ANOVA showed a significant main effect between the three phasesof CSA (F (2, 21) = 20.776; p<.001; Figure 2.2.1a). Multiple comparisons (Holm-Sidak)showed that the average number of infusions was not statistically different between preand post null vector treatment (days 1-7 vs. days 8-15; t=1.072; p>0.05; Figure 2.2.1a).On the other hand, the average number of infusions post D2R vector (on days 16-22) wassignificantly lower to both pre Null vector treatment; (days 1-7; t=4.889; p<.001) andpost Null vector (days 8-15; t=6.122; p<.001; Figure 2.2.1a).
Similarly with respect to active lever presses, a one-way ANOVA showed asignificant main effect between the three groups (F (2, 21) = 21.600; p<.001). Multiplecomparisons (Holm-Sidak) showed that the average number of lever presses prior to D2Rvector treatment (days 1-7 vs. days 8-15) did not statistically differ (t=.802; p>0.05). Onthe other hand, the average number of lever presses post D2R vector (days 16-22) wassignificantly lower as compared to both pre Null vector (days 1-7; t=5.172; p<.001) andpost Null vector (days 8-15; t=6.144; p<.001) (Figure 2.2.1b).
One-way Repeated Measures ANOVA
A one-way repeated measures ANOVA showed a significant main effect overtime for cocaine infusions (F (28, 202) = 2.418; p<0.001). Multiple pairwise comparisons(Holm-Sidak method) showed that treatment with the D2R vector significantly attenuatedcocaine infusions (Figure 2.2.1a). We did not find any statistically significant differencein the number of cocaine infusions prior to D2R vector (days 1-15; Figure 2.2.1a).
A one-way repeated measures ANOVA showed a significant main effect overtime for active lever responses (F (28, 202) = 2.387; p<0.001). Multiple pairwisecomparisons (Holm-Sidak method) showed that treatment with the D2R vectorsignificantly attenuated active lever responses to cocaine (Figure 2.2.1b). Since again wedid not find any statistical significance for any day prior to D2R vector (days 1-15).
Figure 2.2.1a

20
Figure 2.2.1b
Figure 2.2.1. (a) Mean (+SEM) infusions of 0.3 mg/kg cocaine before and after treatmentwith the D2R vector. Mean Days: (*) The mean number of infusions on days 16-22 (afterD2R vector treatment) was significantly lower (p<.001) than mean infusions on all otherdays prior to D2R vector treatment. Individual Days: (*) Infusions on days 16-21, 23, 24,26 and 27 were significantly lower compared to infusions on day 15 (p<.001). (b) Mean(+SEM) reinforced (active) lever responses to 0.3 mg/kg cocaine before and aftertreatment with the D2R vector. Mean Days: (*) The mean number of active lever presseson days 16-22 (after D2R vector treatment) was significantly lower (p<0.001) than meaninfusions on all other days prior to D2R vector treatment. Individual Days: (*) LeverPresses on days 16-21 were significantly lower compared to infusions on day 15(p<.001).
2.2.4 Discussion
D2R adenoviral upregulation caused a significant decrease in CSA (infusions andlever responses) for up to 6 days post treatment. More specifically, the D2R vector had arobust (75% decrease) effect in the number of cocaine infusions. This effect was of shortduration and was observed for the first 6 days following D2R vector treatment and thenreturned to baseline levels with the exception of a few sporadic days during the next 6days. The attenuation of cocaine consumption by D2R upregulation was consistent withprevious studies on ethanol consumption, where alcohol consumption was significantlyattenuated. In previous alcohol studies, D2R upregulation attenuated ethanol intake for 8days in Sprague Dawley rats (Thanos et al., 2001; Thanos et al., 2004) and 20 days forthe inbred alcohol preferring P rats (Thanos et al., 2001; Thanos et al., 2004). It has beenpreviously shown that this D2R vector produced significant D2R upregulation for 8 daysbefore returning to baseline by day 10 (Ingram et al., 1998; Ogawa et al. 2000; (Thanoset al., 2001; Thanos et al., 2004).
Several factors may be involved in explaining the difference in the duration ofthis effect of D2R upregulation in cocaine versus alcohol administration. To start with

21
the role of D2R is different in the mechanisms of cocaine and alcohol reward. Previouswork has suggested that ethanol-induced DA release in the NAc is insensitive to DAautoreceptor (D2R and/or D3R) regulation (Adam-Vizi, 1992; Levi & Raiteri, 1993; Yan,2003) whereas, cocaine-induced DA release in the same region is thought to depend onregulation by D2R and D3R (Yan, 2003).
Furthermore, it has been shown that D2R knockout (KO) mice can still be trainedto self-administer cocaine, and do so often at higher rates than wild type mice (Caine &Ralph-Williams, 2002), suggesting that D2R did not represent the only route throughwhich the pharmacologically rewarding effects of cocaine took place. It is not clearhowever what specific route may be involved in CSA in these mice since like alltransgenic animals, D2R KO mice may show compensatory changes in other receptorsand neurotransmitter systems (Bolon, 2004) involved in CSA. In contrast it is muchharder to compensate for the inhibition of the rewarding effects of alcohol on D2R KOmice (Risinger et al., 2000; Thanos et al., 2005).
The findings from this study are consistent with our work and that of othersproposing that D2R play an important role in modulating drug self-administrationbehavior. By increasing the absolute number of D2R in the NAc, we have successfully,if transiently, disrupted CSA. Since the main effect of upregulating D2R in the NAc islikely to be increased transmission along the included DA pathways, analogies related tothe other determinants of synaptic DA transmission in the NAc can be made. Forexample, studies showing that CSA may be triggered by low levels of accumbal DA incocaine-experienced rats (Gerrits et al., 2002) suggest one way that our treatment mightbe decreasing the desire to self-administer cocaine. D2R upregulation could increase theprobability of an interaction between transient DA increases and receptor activation,which would increase the sensitivity to the DA enhancing effects of drugs of abuse. As aresult the amount of drug required to activate reward pathways would be loweredexplaining the decrease in the total amount of cocaine ingested. Alternatively D2Rupregulation may increase the number of constitutively active D2R receptors. However,the mechanism(s) underlying how D2R upregulation decreases CSA requires furtherinvestigation.
2.3 PET imaging of D2R with [11C]raclopride predicts cocaine preference in rats
2.3.1 Introduction
PET imaging provides a non-invasive way of assessing brain function. Throughthe development of µPET scanner, the benefits of this technology have been extended tothe study of rodents. Using PET and µPET imaging, studies have previously reporteddeficits in D2R binding availability in drug-addicted humans (Wang et al., 2004) andcocaine-exposed primates (Nader et al., 2008). In the first two sections, this thesis reportsdownregulated D2R binding in response to chronic cocaine intake in mice and thatupregulation of D2R via gene-transfer techniques can attenuate cocaine intake. Afundamental question that has emerged from these studies is whether D2R deficits are

22
caused exclusively by repeated drug exposure, or whether individuals and animals aregenetically prone to such deficits. If the answer to this question is the latter, then thenotion of using D2R binding availability in conjunction with µPET as a predictivebiomarker for assessing vulnerability to drug abuse becomes apparent. In this paper, weattempted to answer this question by measuring D2R binding availability using µPET in10 drug-naïve adult Sprague-Dawley rats and then correlating these measures withcocaine preference 2 months after scanning. We hypothesized that D2R bindingavailability would negatively correlate with future measures of cocaine preference in ratsand thus could serve as a predictive non-invasive measurement of cocaine abusesusceptibility.
2.3.2 Methods
Animals
Rats between 12-14 weeks of age (n=10) were obtained from Taconic (Taconic,NY) and housed on a reverse 12 hour light/dark cycle with lights off at 7 am. Rats werefed a standard (Purina) laboratory rat chow. Food intake was monitored daily atapproximately 1500h and all rats were weighed every other day immediately after foodmonitoring. All experiments were conducted in conformity with the National Academy ofSciences Guide for the Care and Use of Laboratory Animals (NAS & NRC, 1996) andBrookhaven National Laboratory Institutional Animal Care and Use Committeeprotocols.
In-vivo [11C]raclopride D2R µPET
PET assessment of D2R in these rats was performed using a PET R4 Scanner(CTI Concorde Microsystems, Knoxville, TN). Each rat was briefly anesthetized withisoflurane (~2-3 min) and its lateral tail vein was catheterized. Once awake, each rat wasinjected intravenously with [11C]raclopride (547 ± 72 Ci); specific activity, 10.4 ± 4.3mCi/nmol). Injected volumes were approximately 400µl. 30 minutes later each rat wasanesthetized with isoflurane and placed in a stereotaxic head holder (David KopfInstruments; CA, USA) in a prone position on the bed of the scanner and scanningcommenced. Total acquisition time was 30 min (17 frames: 6 frames, 10 s; 3 frames, 20s; 8 frames, 60 s; 4 frames, 300 s) and data were acquired in fully 3-dimensional modewith maximum axial acceptance angle (+-28 degrees). Images were reconstructed usingthe optimization algorithm maximum a posteriori (MAP) with 30 iterations and asmoothing value of 0.01 mm. Qualitative and quantitative assessment of PET imageswas performed as described previously using the Pixel-wise Modeling (PMOD) softwareenvironment (PMOD Technologies, Zurich Switzerland) (Schiffer et al., 2009).
Cocaine CPP
CPP was assessed two months after µPET scanning. The CPP apparatus(Coulbourn Instruments) contained three compartments and has been previouslydescribed (Thanos et al., 2009). The CPP procedure was modified from (Thanos et al.,2009) and consisted of the following four phases: i) habituation, (ii) pretest, (iii)

23
conditioning, and (iv) test. The habituation phase was administered on the first day. Thisconsisted of transporting the animals to the room where the CPP apparatus was located.30 minutes later the animals were transported back to the animal facility. On the secondday, rats were transported to the CPP procedure room and placed in the middle chamberof the apparatus and were allowed 10 minute access to all chambers. Time spent in eachchamber was recorded. For the next 8 days rats were injected with either cocaine (10mg/kg (IP)) (Sigma-Aldrich (St. Louis, MO) or saline on alternate days. Using preferencemeasurements from the pretest phase, rats were administered cocaine in the non-preferredchamber as observed during pretest. Rats were only allowed access to one of the twochambers each day during the conditioning phase. Daily sessions during this phase lastedfor 30 minutes. The CPP test phase was conducted on day 11 with procedures identical tothe pretest phase. The cocaine preference score was calculated as the percent change intime spent in the cocaine-paired chamber on test day vs. that on pretest day.
2.3.3 Results
Linear regressions analysis (Figures 2.3.1a & 1b) showed that D2R bindingavailability significantly correlated with the CPP score in the ventral but not the dorsalstriatum. The regression was significant at the p=0.003 level with a correlation coefficientof r=0.83. A z-test showed that the correlations between the dorsal and ventral striatumwere significantly different (z=2.94; p2-tail=0.003).
Figure 2.3.1a Figure 2.3.1b
Figure 2.3.1. (a) D2R binding ratio expressed as receptor rich/receptor poor ratio (dorsalstriatum/cerebellum) and plotted against cocaine preference 2 months post scan. (b) D2Rbinding ratio expressed as receptor rich/receptor poor ratio (ventral striatum/cerebellum)and plotted against cocaine preference 2 months post scan.

24
2.3.4 Discussion
We found that rats with the highest binding levels showed the lowest cocainepreference and vice versa. Specifically, we found a significant and strong negativecorrelation between D2R binding availability and future cocaine preference in the ventralbut not the dorsal striatum. These findings suggest that inherent deficits in D2R may leadto cocaine abuse predisposition. Furthermore, since the two correlations weresignificantly different, these results suggest that the ventral striatum plays a primary rolein mediating susceptibility to cocaine abuse. These results suggest the potential for usingD2R binding availability to predict future susceptibility to cocaine abuse in rodents andpotentially non-human primates. Using such a measurement, one can classify rodents andprimates into those that express susceptibility to drug abuse and those that do not. Onecan then use molecular-genetic approaches to investigate gene-expression that may bedifferentially expressed in these animals before and after the drug exposure. Findingsfrom such studies can lead to the development of new treatments for drug addiction.Finally, since PET imaging using [11C]raclopride is a non-invasive research paradigmthat is routinely employed in clinical research, this approach may have the potential to betranslated to humans in order to determine individual susceptibility to cocaine abuse.

25
Chapter 3
Dopamine D2 Receptors and Obesity
3.1 Age- and diet-related changes in D2R binding in leptin receptor-deficientobese rats
3.1.1 Introduction
Obesity is one of the major and fastest growing public health problemsworldwide. It is estimated that in the USA approximately one quarter of adults are obese(Flegal, 2002). The increases in obesity are likely to reflect the interplay betweensusceptibility genes in a changing environment where food is widely available, diverseand highly palatable (Friedman, 2004). Because food intake is regulated not only bynutrient and caloric requirements but also by its reinforcing properties (Carr, 2007) thewide availability and high palatability of food in our environment facilitates overeating.
DA is one of the neurotransmitters modulating the reinforcing properties of food(Carr, 2007). Indeed DA cells fire (increasing DA release in the NAc) when expectingfood and their firing in turn is influenced by food deprivation (Meguid et al., 2000).While DA has been classically described as a neurotransmitter involved with locomotoractivity and reward, more recent work has shown DA to be associated with the predictionof reward (Schultz et al., 2000; Phillips et al., 2007), with the motivation to procure thereward (McClure et al., 2003; Phillips et al., 2007) and with the facilitation ofconditioned learning (Fenu & Di Chiara, 2003). Thus, a possible mechanism of DAinvolvement in food intake and obesity could be that DA signaling is increased inresponse to food as a stimulus predicting reward, leading to the motivation to procure thefood while at the same time facilitating conditioned learning (Fenu & Di Chiara, 2003).PET imaging studies in humans have recently corroborated an involvement of DA both infood reward (Small et al., 2003) as well as in the motivation to procure the food (Volkowet al., 2002b).
The importance of DA’s role in obesity has been supported both by preclinicaland clinical studies (Hamdi et al., 1992; Meguid et al., 2000; Wang et al., 2001). Studiesdone in animal models of obesity (ob/ob mice, obese Zucker rats, obesity-prone Sprague–Dawley rats and seasonally obese animals) have documented reduced DA activity in the
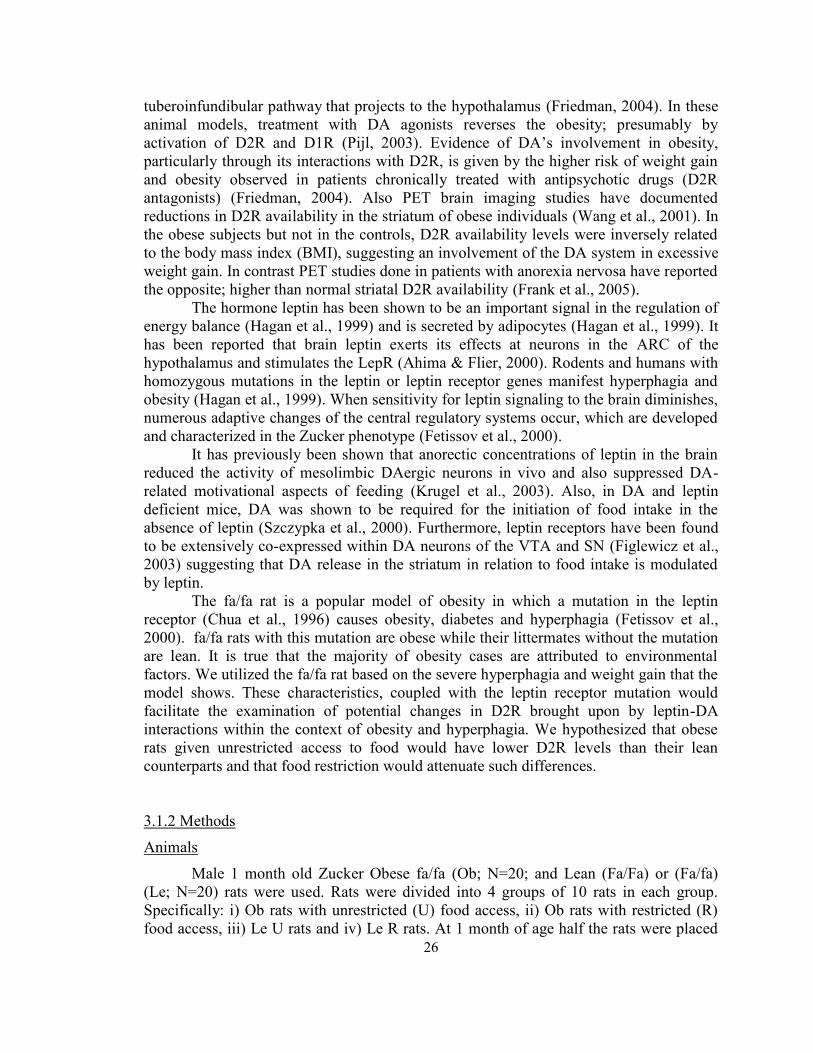
26
tuberoinfundibular pathway that projects to the hypothalamus (Friedman, 2004). In theseanimal models, treatment with DA agonists reverses the obesity; presumably byactivation of D2R and D1R (Pijl, 2003). Evidence of DA’s involvement in obesity,particularly through its interactions with D2R, is given by the higher risk of weight gainand obesity observed in patients chronically treated with antipsychotic drugs (D2Rantagonists) (Friedman, 2004). Also PET brain imaging studies have documentedreductions in D2R availability in the striatum of obese individuals (Wang et al., 2001). Inthe obese subjects but not in the controls, D2R availability levels were inversely relatedto the body mass index (BMI), suggesting an involvement of the DA system in excessiveweight gain. In contrast PET studies done in patients with anorexia nervosa have reportedthe opposite; higher than normal striatal D2R availability (Frank et al., 2005).
The hormone leptin has been shown to be an important signal in the regulation ofenergy balance (Hagan et al., 1999) and is secreted by adipocytes (Hagan et al., 1999). Ithas been reported that brain leptin exerts its effects at neurons in the ARC of thehypothalamus and stimulates the LepR (Ahima & Flier, 2000). Rodents and humans withhomozygous mutations in the leptin or leptin receptor genes manifest hyperphagia andobesity (Hagan et al., 1999). When sensitivity for leptin signaling to the brain diminishes,numerous adaptive changes of the central regulatory systems occur, which are developedand characterized in the Zucker phenotype (Fetissov et al., 2000).
It has previously been shown that anorectic concentrations of leptin in the brainreduced the activity of mesolimbic DAergic neurons in vivo and also suppressed DA-related motivational aspects of feeding (Krugel et al., 2003). Also, in DA and leptindeficient mice, DA was shown to be required for the initiation of food intake in theabsence of leptin (Szczypka et al., 2000). Furthermore, leptin receptors have been foundto be extensively co-expressed within DA neurons of the VTA and SN (Figlewicz et al.,2003) suggesting that DA release in the striatum in relation to food intake is modulatedby leptin.
The fa/fa rat is a popular model of obesity in which a mutation in the leptinreceptor (Chua et al., 1996) causes obesity, diabetes and hyperphagia (Fetissov et al.,2000). fa/fa rats with this mutation are obese while their littermates without the mutationare lean. It is true that the majority of obesity cases are attributed to environmentalfactors. We utilized the fa/fa rat based on the severe hyperphagia and weight gain that themodel shows. These characteristics, coupled with the leptin receptor mutation wouldfacilitate the examination of potential changes in D2R brought upon by leptin-DAinteractions within the context of obesity and hyperphagia. We hypothesized that obeserats given unrestricted access to food would have lower D2R levels than their leancounterparts and that food restriction would attenuate such differences.
3.1.2 Methods
Animals
Male 1 month old Zucker Obese fa/fa (Ob; N=20; and Lean (Fa/Fa) or (Fa/fa)(Le; N=20) rats were used. Rats were divided into 4 groups of 10 rats in each group.Specifically: i) Ob rats with unrestricted (U) food access, ii) Ob rats with restricted (R)food access, iii) Le U rats and iv) Le R rats. At 1 month of age half the rats were placed

27
on restricted food access (70 % of ad-libitum fed animals) and the rest on free access tofood (ad-libitum). Rats were obtained from Harlan (Indianapolis, IN) and housed on areverse 12 hour light/dark cycle with lights off at 7 am. All experiments were conductedin conformity with the National Academy of Sciences Guide for the Care and Use ofLaboratory Animals (NAS & NRC, 1996) and Brookhaven National LaboratoryInstitutional Animal Care and Use Committee protocols.
Behavior Assessment: Food Intake and Weight
Rats were fed a standard (Purina) laboratory rat chow. Food intake wasmonitored daily at 1500h and all rats were weighed every other day. Restricted diet ratswere fed daily at 1500h and the amount of food given was continuously adjusted to 70%of food intake of the ad-lib rats.
Behavior Assessment: Effects of Apomorphine
Rats were placed in an Optical Sensor Plexiglas arena (Minimitter Corporation,Oregon, USA) which consisted of an optical sensor that was securely attached to the wiretop of the animal home cage. Locomotor activity data was collected every two weeksover a period of 4 months. After an initial one-time 60 minute habituation session, eachanimal was given two 60-minute sessions in the same boxes: i) saline and ii)apomorphine (APO) (1 mg/kg) on two consecutive days. Saline injections alwayspreceded APO injections. Optical beam breaks were recorded every minute and the totalnumber of beam breaks for each group of animals was summed into 60 minute sessions.
D2R ARG
Each animal was deeply anesthetized with a mixture of ketamine (100 mg/kg) andxylazine (10 mg/kg). The brain was rapidly removed and frozen in an isopentane and dryice bath and stored in a –800C freezer. The brain was then transferred to a cryostat (LeicaCM3050), and sections were cut 14 µm thick at –180C. Sections were mounted on glassmicroscope slides and stored at -800C until binding was conducted. Slides weregradually brought back to room temperature and then pre-incubated at room temperaturefor ten minutes in 50 mM Tris-HCl buffer (pH 7.4). The slides were then incubated inspecific binding buffer (50 mM Tris-HCl, 0.4 nM [3H]spiperone, 10 µM ketanserintartrate) at room temperature for one hour. To determine non-specific binding some slidesin parallel were incubated for one hour in specific binding buffer in the presence of 10µM haloperidol. Next, the slides were washed 2 x 10 minutes in ice-cold 50 mM Tris-HCl and ice-cold dH2O. Afterwards, 20 µl aliquots of incubation solution were taken andadded with 3 ml of Ultima Gold XR (scintillation solution) and the amount ofradioactivity was measured with a liquid scintillation counter. Slides were then driedovernight in a dessicator and placed in a glass slide cassette for qualitative andquantitative analysis using a β-Imager (Biospace, Paris, France/Capintec, USA). UsingBetavision+ software (Biospace, Paris, France/Capintec, USA), ROI’s were drawn on theleft and right striatum (ST), CB, cingulate (CG) and frontal cortices (FC) of each brainslice. The data was then calibrated using a tissue homogenate standard. Mean values(Ci/g) of the left and right receptor rich regions (ST, CG and FC) for each group were

28
later normalized for receptor poor regions (CB) and the data are reported in respectiveratios (receptor rich/receptor poor).
MRI Imaging
For accurate qualitative and quantitative image analysis using µMRI-µPET imagecoregistration, MR templates from 1 and 4 month old lean Zucker rats were acquired on a4T Siemens scanner using the 2d proton density sequence with the following optimizedparameters: TR/TE =200/20ms, a 256X256 matrix, a field of view of 32x32mm and aslice thickness of 1mm with an in plane spatial resolution 194mm.
D2R PET Imaging
PET assessment of D2R in these rats was performed using a PET R4 Scanner(Concorde Microsystems). Each animal was fasted for 24h before being scanned in thePET. Next each rat was anesthetized and injected intravenously with [11C] raclopride, aDA D2R-specific ligand, and dynamic PET scanning followed for 60 minutes.Raclopride was purchased from Sigma and [11C]raclopride was synthesized as describedpreviously (Volkow et al., 1999b)
Rats were anesthetized with a mixture of ketamine (100mg/kg) and xylazine(10mg/kg) and placed in a stereotaxic head holder (David Kopf Instruments; CA, USA)in a prone position on the bed of the scanner. Next, the lateral tail vein was catheterizedand 250 µl of blood were collected from the rats in EDTAK coated Multivette (Sarstedt,USA) tubes prior to [C11]raclopride administration. Blood samples were centrifuged at3,000 rpm for 10 minutes; plasma was collected and immediately placed on dry ice.Plasma insulin and leptin concentrations were measured in duplicate with commerciallyavailable insulin and leptin enzyme immunoassay (EIA) kits obtained from LincoResearch (Linco Research, Missouri, USA).
Animals were then injected via the same tail vein catheter with [11C]raclopride(424 +/- 49 Ci); specific activity, 1.7-12.3 mCi/nmol). Injected volumes wereapproximately 400 µl. Total acquisition time was 60 min (24 frames: 6 frames, 10 s; 3frames, 20 s; 8 frames, 60 s; 4 frames, 300 s; 3 frames, 600 s), and data were acquired infully 3-dimensional mode with maximum axial acceptance angle (+-28 degrees). Imageswere constructed using Fourier rebinning (Matej et al., 1998) followed by 2-dimensionalfiltered back-projection with a ramp filter cutoff at Nyquist frequency.
In order to control for the effect of 24h fasting of unrestricted rats we scannedthese rats two times separated by 2 weeks. One scan consisted of unrestricted rats withoutany fasting (food always available right up to scan) and the second scan consisted of thesame rats with 24h fasting prior to scan.
PET Analysis
Using the PMOD software suite (PMOD Technologies, Switzerland), PETimages was co-registered with the previously generated MRI templates. Initially the twoimages were co-registered using the method of Mutual Information (MI) (Woods et al.,1992); (Woods et al., 1993) through a MI algorithm implemented within the PMODenvironment, followed by a manual adjustment of the PET image in all three planes

29
(sagittal, coronal, transversal) so that the Harderian glands and ST from both imagingmodalities matched. ROI’s for left and right ST and CB were selected using the µMRI-µPET coregistered Harderian glands as a reference point. Specifically the ST and CB foreach animal were identified as 8 and 12 slices respectively, caudal to the Harderianglands (slice thickness, 1.2 mm). It has been shown previously that the Harderian glands(located just rostral of the brain), because of their uptake of radioactivity, are routinelyused as markers in rodent PET studies (Hume et al., 1996; Kuge et al., 1997; Fukuyamaet al., 1998).
Qualitative assessment of PET images was performed, and representative PETimages of each rat were acquired. The image analysis was performed using the Fusion,PxMOD and Kinetic programs included in the PMOD v. 2.55 software suite. Quantitativeanalysis of the PET images consisted of the MRTM0 Ichise Binding Potential (BP).This multi-reference tissue model provides an accurate noninvasive method of estimatingD2R binding potential without having to sample blood (Ichise et al., 2003).
3.1.3 Results
Body weight
Body weight was examined in each group over the 4-month period. A multifactorthree-way ANOVA revealed significant main effects in body weight with respect toStrain (F=461.683; df=1, 79; p<0.001, Figure 3.1.1), Diet (F=320.027; df=1, 79; p<0.001,Figure 3.1.1), and Age (F=5288.733; df=1, 79; p<0.001; Figure 3.1.1). At 1 month, therewere no significant differences in weight between any of the groups. At 4 months, Ob Urats showed significantly higher weight gain than Le R (t=23.873; p<0.05), Le U(t=26.545; p<0.05) and Ob R (t=28.154; p<0.05). Similarly, at 4 months, Le U and Ob Rshowed significantly higher weight gain compared to Le R, (t=7.441;p<0.05) and(t=5.832; p<0.05) respectively. There were no differences between the Ob R and the LeU rats.
Food Intake
Throughout the study food intake was monitored in the two unrestricted ratgroups. A two-way ANOVA showed significant main effects with respect to Strain(F=39.044; df=1, 39; p<0.001; Figure 3.1.2) and Age (F=272.048; df=1, 39; p<0.001;Figure 3.1.2). At 1 month, there were no differences in food intake between Ob and Lerats. By the fifth week, the rats began to show significant differences in food intake levels(Figure 3.1.2) with the Le rats reaching at peak at 7 weeks while Ob rats reached a peakat around 9 weeks. At 4 months Ob rats had higher food intake levels compared to Le(t=6.477; p<0.05; Figure 3.1.2). Specifically, Ob rats consumed on average an additional10 g of food than Le U rats (30% more). Finally, food intake levels were significantlyhigher at 4 compared to 1 month for both Ob (t=13.722; p<0.05; Figure 3.1.2) and Le rats(t=9.604; p<0.05; Figure 3.1.2).

30
Behavior Assessment: Effects of APO
This behavioral paradigm focuses on revealing behavioral differences inlocomotor activity that are associated with APO administration rather than examiningchanges in general locomotor activity. APO is a nonselective DA agonist thought to bindwith slightly higher affinity to D2-like than D1-like receptors (Jenner, 2003; Dias et al.,2006) and therefore this paradigm provides an additional measure of DA and D2Rfunction in response to experimental treatment. For this reason the data were reported asthe relative percent difference between saline and APO treated sessions for each group at1 and 4 months.
A Three-way ANOVA revealed significant differences in the percent change oflocomotor response to APO (Figure 3.1.3) with respect to Strain (F=13.958; df=1, 95;p<0.001) and Age (F=4.713; df=1, 95; p= 0.033) but not with respect to Diet. Subsequentmultiple comparisons (Holm-Sidak) revealed several key differences. At 1 month, therewere no differences in the percent change of locomotor activity in response to APObetween Ob and Le rats. At 4 months, APO caused a significant percent decrease inlocomotor activity as compared to 1 month levels for all groups. Both unrestricted andrestricted rats were equally affected, but the decline was more pronounced in the Ob.Multiple comparison procedures (Holm-Sidak method) showed that percent changes inAPO compared to saline-paired locomotor activity was lower in the Ob U (t=4.821;p<0.05), Ob R (t=4.712; p<0.05), Le U (t= 3.467; p<0.05) and Le R (t=3.479; p<0.05)rats at 4 compared to 1 month of age and that this decline was more significant for the Ob(37 %) than for the Le (16 %) (see Figure 3.1.3).
D2R ARG: ST
Brain sections were assessed with ARG for striatal D2R binding at 1 and 4months (Figure 3.1.4a). A Three-way ANOVA showed significant differences withrespect to Strain (F= 45.341; df=1, 63; p<0.001, Figure 3.1.4b), Diet (F=38.915; df=1,63; p<0.001, Figure 3.1.4b), and Age (F=41.748; df=1, 63; p<0.001, Figure 3.1.4b).Subsequent multiple pairwise comparison tests (Holm-Sidak method) were used tomeasure the differences of striatal D2R binding data between and within all groups. At 1month, Le U rats had higher D2R binding levels as compared to Ob U rats (t=4.945;p<0.05). All four groups of rats at 4 months of age showed lower D2R binding levelsthan at 1 month. At 4 months, Le U rats had higher D2R binding levels than Ob U rats (t=4.719, p<0.05). Also, Ob R rats had significantly higher D2R levels than Ob U (t=12.237,p<0.05) and Le U (t=9.790; p<0.05). Furthermore, at 4 months Le R rats had higher D2Rlevels than Le U rats (t=12.315, p<0.05) and Ob U rats (t=14.528; p<0.05). Foodrestriction had a significant effect on age related D2R loss for both groups of rats;whereas D2R levels tended to decrease between 1 and 4 months in the unrestricted rats,this loss was attenuated in the restricted rats.
D2R ARG: CG
A one-way ANOVA (F=7.389; df=5, 39; p<0.001) was used to assess differencesin D2R binding in the CG (Figure 3.1.4c). Multiple pai-rwise comparisons (Holm-Sidak)revealed no significant differences at 1 month of age. At 4 months we found significantly

31
lower D2R binding in Ob U compared to 1 month old Ob U (t=4.148; p<0.05) and Le U(t=4.377; p>0.05) rats. Similarly, 4 month old Le U rats showed lower D2R bindingcompared to 1 month old Ob U (4.167; p<0.05) and Le U (t=4.410; p<0.05) rats. Unlikethe unrestricted rats, D2R binding levels did not differ between 1 and 4 months in therestricted fed groups. At 4 months, Ob R and Le R rats showed greater D2R bindingcompared to Ob U (t=2.114; p<0.05) and Le U (t=2.874; p<0.05) rats respectively. Le Rrats also showed greater binding compared to Ob U rats (t=2.973; p<0.05).
D2R ARG: FC
A one-way ANOVA (F=5.608; df=5, 39; p<0.001) was used to assess differencesin D2R binding in the FC (Figure 3.1.4c). Multiple pair-wise comparisons (Holm-Sidak)revealed no significant differences at 1 month of age. At 4 months we found significantlylower D2R binding in Ob U compared to 1 month old Ob U (t=3.876; p<0.05) and Le U(t=3.633;p<0.05) rats. Similarly, 4 month old Le U rats showed lower D2R bindingcompared to 1 month old Ob U (t=3.573; p<0.05) and Le U (t=3.310; p<0.05) rats.Unlike the unrestricted rats, D2R binding levels did not differ between 1 and 4 months inthe restricted fed groups. At 4 months, Le R rats showed greater D2R binding comparedto Le U (t=3.078; p<0.05) and Ob U (3.403;p<0.05). Finally, at 4 months Le U ratsshowed greater D2R binding compared to Ob U (t=2.044; p<0.05).
Weight vs. D2R binding levels
The plot showing the relationship between striatal ARG D2R binding and weightwas fitted with a linear regression model (Figure 3.1.5). The regression model showedsignificant relationship between predicting D2R from weight. Specifically, using the D2Rbinding levels as the dependent variable and weight as the independent, we found ahighly significant regression across groups (r = -0.90; p < 0.0001; Figure 3.1.5).
Insulin
Analysis of the blood samples for insulin levels using a two-way ANOVArevealed significant main effects (Figure 3.1.6a) with respect to Strain (F=279.17; df=1,39; p<0.001), Diet (F=81.64; df=1, 39; p<0.001) and their interaction (F=96.48; df=1, 39;p<0.001). Subsequent pairwise multiple comparisons revealed significantly greaterplasma insulin concentrations in Ob U compared to Ob R (t=13.33; p<0.001) and Le U(t=18.76; p<0.001). Within the two restricted groups, Ob R had higher plasma insulinconcentrations than Le R rats (t=4.87; p<0.001) but there was no significant difference ininsulin concentration between Le U and Le R rats (t=0.56; p=0.58).
Leptin
Analysis of the blood samples for leptin using a two-way ANOVA revealedsignificant main effects (Figure 3.1.6b) with respect to Strain (F=284.26; df=1, 39;p<0.001), Diet (F=77.49; df=1, 39; p<0.001) and their interaction (F=87.67; df=1, 39;p<0.001). Subsequent pairwise multiple comparisons revealed significantly greaterplasma leptin concentrations in Ob U compared to Ob R (t=9.47; p<0.001) and Le U(t=17.24; p<0.001). Within the two restricted groups, Ob R had higher plasma leptin

32
concentrations than Le R rats (t=3.36; p<0.001) but there was no significant difference inleptin concentrations between Le U and Le R rats (t=0.64; p=0.69).
D2R PET Imaging Non-invasive µPET D2R brain imaging was examined at two time points for
each group of rats: 1 and 4 months (Figure 3.1.7a and 7b). A 2-way ANOVA (Figure3.1.7b) showed a main effect for Age (F=199.086; df= 1, 359; p<0.001) and Group(F=18.481; df=3, 359; p<0.001). Since we could not differentiate between Strain and Dietas two independent factors within the 2-way ANOVA design, the subsequent pairwisemultiple comparisons (Holm-Sidak method) assessed a generalized comparison for alldata at 1 and 4 months. This showed significantly greater D2R availability at 1 versus 4months (t=14.762; p<0.001) for all the data irrespective of groups. In order to assessindividual group differences at 1 versus 4 months of age a 1-way ANOVA was conducted(F=48.250; df=5, 359; p<0.001; Figure 3.1.7b) and this yielded greater D2R availabilityin the 1 month old Ob U rats (Figure 3.1.7b) compared to 4 month old Ob U (t=8.503;p<0.001), Le U rats (t=13.534; p<0.001), Ob R (t=7.003; p<0.001) and Le R (t=7.121;p<0.001). The 1-way ANOVA showed greater D2R availability in 1 month old Le U rats(Figure 7b) compared to 4 month old Le U (t=11.851; p<0.001), Le R (t=5.752;p<0.001), Ob U (t=7.258; p<0.001) and Ob R (t=5.790; p<0.001). At 4 months of age,Ob U rats showed significantly greater D2R binding than Le U rats (t=4.593; p<0.001)and showed a trend towards lower D2R binding values than Ob R rats (t=1.861 p=0.06).Also, Le R had significantly greater D2R binding than Le U rats (t=7.618; p<0.001).Finally, 4 month old Ob R rats had greater D2R availability than 4 month old Le U rats(t=6.702; p<0.001; Figure 3.1.7b).
In order to determine whether D2R binding levels in the PET experiment werealtered in response to non-fasted (NF) or 24h fasted (F) conditions in the 4 month old Oband Le ad-lib fed animals, a 2-way multifactor ANOVA (Figure 3.1.7c) showed a maineffect for Group (F=34.77; df= 3; 335; p<0.001) and fed or fasting State (F=14.65; df=1,335; p<0.001). Since we could not differentiate between Strain and Diet as twoindependent factors within the 2-way ANOVA design, the subsequent pairwise multiplecomparisons (Holm-Sidak method) assessed a generalized comparison for all databetween the NF and F state. This showed significantly greater D2R availability in the NFversus F states (t=3.99; p<0.001; Figure 3.1.7c) for all the data irrespective of groups. Inorder to assess individual group differences in the NF versus F state, a 1-way ANOVAwas conducted (F=20.85; df=5, 335; p<0.001; Figure 3.1.7c) and this yielded greaterD2R availability in the NF Ob U rats compared to F Ob U (t=2.47; p<0.01); NF Le U(t=4.67; p<0.001) and F Le U rats (t=7.61; p<0.001). F Ob U rats showed greater D2Ravailability than F Le U rats as well (t=5.15; p<0.001). Also, the F Ob R rats hadsignificantly greater D2R binding availability than F Le U (t=7.51; p<0.001) and NF LeU (t=4.41; p<0.001).
The 1-way ANOVA also showed greater D2R availability in NF Le U vs. F Le Urats (t=2.94; p<0.01). Finally, F Le R rats had higher D2R binding than F Le U (t=8.54;p<0.001), NF Le U (t=5.22; p<0.001) and F Ob U (t=2.73; p<0.01).
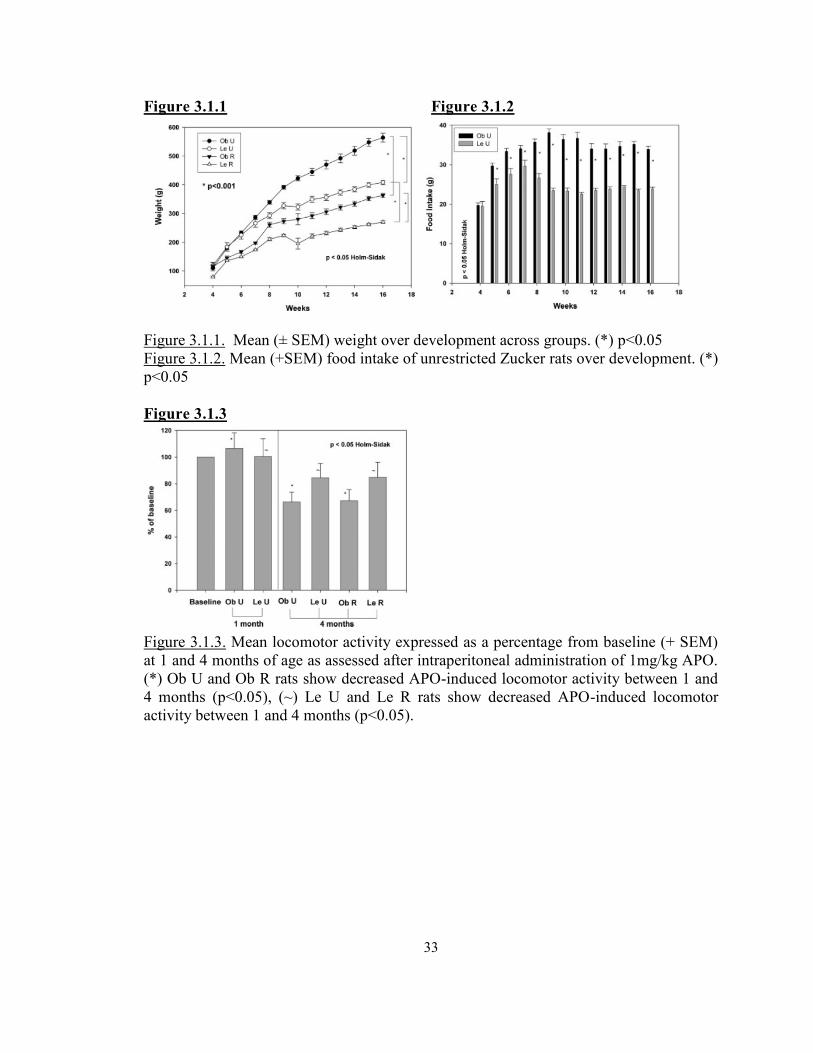
33
Figure 3.1.1 Figure 3.1.2
Figure 3.1.1. Mean (± SEM) weight over development across groups. (*) p<0.05Figure 3.1.2. Mean (+SEM) food intake of unrestricted Zucker rats over development. (*)p<0.05
Figure 3.1.3
Figure 3.1.3. Mean locomotor activity expressed as a percentage from baseline (+ SEM)at 1 and 4 months of age as assessed after intraperitoneal administration of 1mg/kg APO.(*) Ob U and Ob R rats show decreased APO-induced locomotor activity between 1 and4 months (p<0.05), (~) Le U and Le R rats show decreased APO-induced locomotoractivity between 1 and 4 months (p<0.05).

34
Figure 3.1.4
Figure 3.1.4. (a) Digital autoradiograms of [3H]spiperone ARG at 4 months in Ob and LeZucker rats. CTX = cerebral cortex; Acb = accumbens, OT = olfactory tubercle. (b)Mean (+SEM) [3H]spiperone binding ratio (receptor rich/receptor poor) in Ob and LeZucker rats at 1 and 4 months in the striatum. (*) 1 month old Ob U rats show decreasedD2R binding compared to 1 month old Le U rats (p<0.05). (~) 4 month old Ob U ratsshow decreased D2R binding compared to 1 month old Ob U and 4 month old Ob R rats(p<0.05), (^) Le U show decreased D2R binding compared to 1 month old Le U and 4month old Le R rats (p<0.05). ( ) Ob R rats show decreased D2R binding compared to 1month old Ob U rats (p<0.05) ( ) Le R rats show decreased D2R binding compared to 1
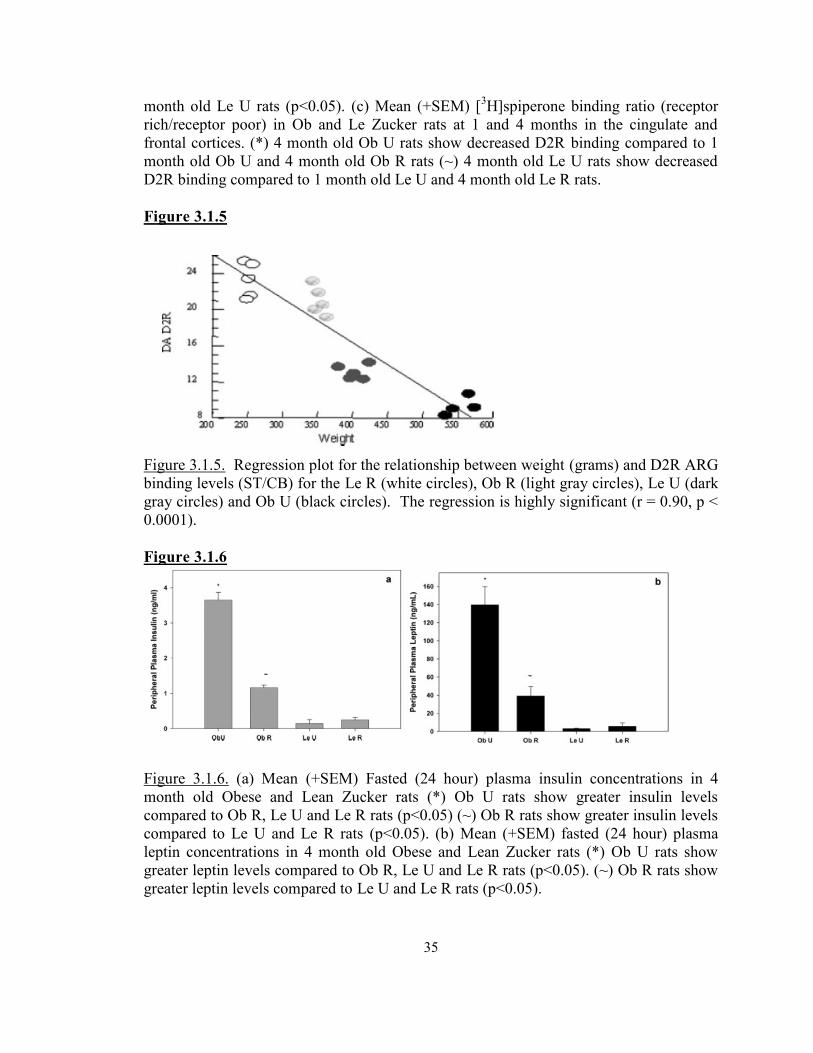
35
month old Le U rats (p<0.05). (c) Mean (+SEM) [3H]spiperone binding ratio (receptorrich/receptor poor) in Ob and Le Zucker rats at 1 and 4 months in the cingulate andfrontal cortices. (*) 4 month old Ob U rats show decreased D2R binding compared to 1month old Ob U and 4 month old Ob R rats (~) 4 month old Le U rats show decreasedD2R binding compared to 1 month old Le U and 4 month old Le R rats.
Figure 3.1.5
Figure 3.1.5. Regression plot for the relationship between weight (grams) and D2R ARGbinding levels (ST/CB) for the Le R (white circles), Ob R (light gray circles), Le U (darkgray circles) and Ob U (black circles). The regression is highly significant (r = 0.90, p <0.0001).
Figure 3.1.6
Figure 3.1.6. (a) Mean (+SEM) Fasted (24 hour) plasma insulin concentrations in 4month old Obese and Lean Zucker rats (*) Ob U rats show greater insulin levelscompared to Ob R, Le U and Le R rats (p<0.05) (~) Ob R rats show greater insulin levelscompared to Le U and Le R rats (p<0.05). (b) Mean (+SEM) fasted (24 hour) plasmaleptin concentrations in 4 month old Obese and Lean Zucker rats (*) Ob U rats showgreater leptin levels compared to Ob R, Le U and Le R rats (p<0.05). (~) Ob R rats showgreater leptin levels compared to Le U and Le R rats (p<0.05).

36
Figure 3.1.7
Figure 3.1.7. (a) [11C]raclopride µPET imaging of Ob and Le Zucker rats at 1 and 4months of age. (b) Mean (+ SEM) [11C]raclopride µPET MRTM0 Ichise BP of Ob andLe Zucker rats at 1 and 4 months of age. (*) 1 month old Ob U rats show greater D2Ravailability compared to 4 month old Ob U and Ob R rats (p<0.05). (~) 1 month old Le Urats show greater D2R binding availability compared to 4 month old Le U and Le R rats(p<0.05). ( ) 4 month old Le U rats show lower D2R availability compared to 4 monthold Le R rats (p<0.05). (c) Mean (+SEM) MRTM0 [11C] raclopride BP in fasted (F) andnon-fasted (NF) 4 month old Obese and Lean Zucker rats. (*) NF Ob U rats show greater

37
D2R availability compared to NF Le U and F Ob U rats (p<0.05). (~) F Ob U rats showgreater D2R availability compared to F Le U rats (p<0.05). ( ) NF Le U rats showedgreater D2R availability compared to F Le U rats (p<0.05). ( ) F Le R rats show greaterD2R availability compared to F Le U rats (p<0.05).
3.1.4 Discussion
Food Intake & Weight gain
The alteration of the leptin signaling pathway, as observed in the Ob Zucker rat,has a profound effect on food intake, weight and locomotor activity. Although at 1 monthwe show no significant difference in weight and food intake between Ob and Le rats, at 4month the differences were very apparent; Ob rats weighed 39 % more and consumed 42% more than their lean counterparts. Since Ob and Le rats differ in a mutation in theleptin gene the differences between Ob and Le highlight the regulatory role of leptin inmaintaining food consumption within a fixed range regardless of food availability. Asexpected food restriction significantly reduced weight at 4 months in the Ob R (comparedto Ob U; 55 % difference) and Le R rats (compared to Le U; 51 % difference), which wasconsistent with previous results (Meguid et al., 2000).
Behavioral Assessment: APO-paired Locomotor Activity
At 1 month, we did not observe differences in the percent change of locomotorresponse to APO administration in Ob and Le unrestricted rats, suggesting that Ob and Lerats at this age may be characterized by similar DA and D2R profiles. On the other hand,weight and food intake in the Ob U rats went up between 1 and 4 months of age to 512 %and 172 % respectively while the percent change in APO-paired locomotor activitydecreased by 38 %. Similarly, Le U rats showed a 343 % and 23 % increase in weightand food intake respectively, while the percent change in APO-paired locomotor activitydeclined by 16 %. Finally, Ob R rats showed a 315 % increase in weight while percentchanges in APO-paired locomotor activity declined by 38 % and Le R rats showed a 226% increase in weight followed by a 16 % percent change decline in APO-pairedlocomotor activity. The difference in the above percent changes in locomotor activity inresponse to APO between the Ob and Le strains (38 % vs. 16 %) regardless of foodrestriction suggests an involvement of LepR deficiency not only in food intake andweight gain but also in locomotor activity tested under administration of the non-selectiveDA agonist APO. This suggests that Ob and Le rats at this age share different DAprofiles and possibly differences in specific DA receptor concentrations. Nevertheless,we do not know if this is attributed to direct effects of leptin, weight or to secondaryeffects of other regulatory messengers (i.e. insulin, glucose, etc.) that differ in these rats.
D2R characterization using µPET and β-Imager ARG
µPET and ARG yielded different results in the characterization of the effects offood restriction on D2R. This is likely to reflect the fact that the two procedures examinedifferently D2R levels. Specifically, µPET is conducted under in-vivo conditions where

38
the animal is alive and therefore D2R binding is subject to several factors beyond ourcontrol. One major factor is competition of endogenous DA with raclopride. Racloprideis in fact highly displaceable by DA (Morris & Yoder, 2007) and therefore any increasesin endogenous DA would likely show up as decreases in D2R binding and vice-versa.Similarly, other endogenous messengers, behavioral status (fed vs. fasted, aroused, etc.)and even anesthesia may compromise binding levels. On the other hand, ARG is doneunder more controlled experimental conditions where, endogenous messengers like DAare removed by pre-washing the slides with specific buffers, thereby reducing variabilityin D2R binding due to endogenous competition. Another major factor that plays a role inthe different results each technique generates is the use of different radioligands. ForµPET imaging we use raclopride whereas for ARG we use spiperone. Unlike raclopride,DA displaces spiperone to a much less extent (Morris & Yoder, 2007). Also, it has beensuggested that the two tracers may bind to D2R differentially (raclopride binds to cells inthe membrane while spiperone may penetrate the cell membrane and bind to internalizedreceptors as well) (Laruelle, 2000). Fasting has been shown to increase endogenous DA(Miklya et al., 2003). For these reasons, binding of [11C]raclopride to striatum is expectedto be sensitive to changes in DA that ensue secondary to fasting whereas ARG would not.By using these two measures in concert, we may be able to use these differences to ouradvantage so that we can obtain a stable measure of D2R binding concentrations usingspiperone and ARG and then using these results go on to hypothesize what happens toDA concentrations using raclopride and µPET. Since D2R binding with ARG has a muchhigher resolution compared to µPET, it allows for greater sensitivity in localization of theD2R within the brain. For these reasons, the discussion that follows regarding the effectsof strain and food restriction on D2R is based primarily on the ARG results and that offood restriction on DA release is based on µPET.
It should be noted that the values for D2R binding availability that we reportreflect the average activity throughout the entire striatum (Figures 3.1.7a) as well aspartial volume and spillover effects which are a limitation of small-animal PET imaging(Thanos et al., 2002) (Laforest et al., 2005) and therefore the reader should take cautionin relying on the µPET images for the accurate representation of D2R bindingavailability. Furthermore, our interpretation is limited by the inability of separating autoand postsynaptic D2R and is primarily based on a static model of the relationshipbetween DAT availability and regulation of D2R by the extracellular DA levels. Finally,the relative difference in tonic vs. phasic release of DA in response to food consumptionin the two strains would further complicate our interpretation. In light of this, thediscussion about the relationship between the observed effects on D2R availability andthe actual release of DA remains speculative and further validation studies are requiredfor the proper characterization of this methodology. Nevertheless, it remains a valuableapproach since it provides a longitudinal approach to the study of DA system functionwithout having to deal with complicated issues like tissue integrity and survival whichare both significant limitations of other approaches (i.e. microdialysis, dissections) to DAsystem function.

39
D2R as a function of strain
It has previously been shown that Zucker rats display a unique DA profile(Meguid et al., 2000) in particular, with regards to D2R levels (Hamdi et al., 1992).These previous findings showed that neither D2R density (Bmax) nor affinity (Kd) weresignificantly different at 1 month of age between Ob and Le Zucker rats (Hamdi et al.,1992). Our results at 1 month of age were not in agreement with these findings, since wefound significantly higher (~20 %) D2R binding in Le U compared to Ob U rats.
The effect of age on D2R has also been previously characterized with somewhatinconsistent findings (Tarazi et al., 1999). Relevant to our findings is a longitudinalstudy, that reported a 51 % increase in D2R levels in Le U rats between 1 and 6 months,while D2R levels remained unchanged for Ob U rats (Hamdi et al., 1992). In contrast,here we show a 56% decline in striatal D2R in Le U rats and a 60% decline in Ob Ubetween 1 and 4 months of age.
At 4 months Le U rats had significantly higher (35 %) striatal D2R binding levelswhen compared to Ob U rats, which is consistent with Hamdi’s findings of higher D2Rlevels in Le U than Ob U rats at 6 months of age (Hamdi et al., 1992). The abovediscrepancies may be explained both by differences in sensitivity (500% higher for ARGusing a β-imager compared to film) (Langlois et al., 2001) as well as differences in theD2R radioligands used. Specifically, in the Hamdi, 1992 article [3H]nemonapride and not[3H]spiperone was used for D2R binding. These two ligands differ significantly in thelabeling of D2R (Vivo et al., 2006). Also, it appears that Hamdi did not utilize a pre-washin his binding protocol to remove D2R bound DA and therefore binding in thatexperiment may have been done in the presence of DA while in our study it was not.
Our findings of low D2R levels in Ob U rats corroborate the findings from recentclinical imaging data showing that obese individuals have reduced D2R binding levelscompared to lean controls (Wang et al., 2001; Wang et al., 2004). Note that humanobesity resembles the unrestricted food condition in the animal model except for the factthat while the Ob Zucker rats have LepR inactivation most obese subjects do not. Similarto the human data (inverse correlation between the D2R striatal levels and the BMI in theobese subjects), we also documented an inverse correlation in the Ob rats between theD2R levels and their weight (Figure 3.1.5). Since we found more D2R binding in Le Urelative to Ob U rats, we may assume that Ob rats experience a greater loss of D2R asthey age, perhaps due to increased weight gain, food intake as well as changes inregulatory messengers like insulin and leptin. The fact that the D2R decline wasdecreased in the Ob R may suggest that the greater D2R loss with age in the Ob Ureflects increased food intake and weight gain as was shown in the imaging study ofmorbidly obese subjects (Wang et al., 2001; Wang et al., 2004)) as well as decreases inleptin and insulin as shown in our experiment (Figures 3.1.6a & 6b). Moreover, foodrestriction also decreased the age-related losses in D2R in Le R rats but had no significanteffect on insulin and leptin. Thus the present findings suggest an effect of food intake onthe age related D2R losses. This is consistent with prior studies showing that foodrestriction alters the effects of aging (Ingram et al., 2001) on motor activity and reward(Carr et al., 2003), and thus an attenuation of age-induced loss of D2R could underlie thebenefits that food restriction has on these behaviors .

40
Previous studies have shown lower DA levels in the hypothalamus of 9 week oldZucker Ob as compared to Le rats in 24 h fasted or non-fasted conditions (Meguid et al.,2000). This is relevant since the lower DA levels in the Ob Zucker rats would result ingreater D2R availability to bind to the [11C]raclopride during the µPET scan. While noeffect was reported from 24h fasting on the DA levels, it is important to note that theMeguid (Meguid et al., 2000) findings were from the hypothalamus and not in thestriatum. It is unclear how the decreased DAergic signaling in Ob rats relates to theirincreased food intake. It has been suggested that weak DAergic signaling, which isinvolved with satiety would result in greater food consumption to bring about satiety inOb than in Le rats (Orosco et al., 1995). However the later interpretation mostly pertainsto the DAergic tuberoinfundibular hypothalamic pathway and not the mesolimbic andstriatonigral DA pathways that target the ventral and the dorsal striatum respectively.Since these pathways have been implicated in reward (and prediction of reward) andmotivation; an alternative suggestion is that deficiency in these pathways may lead topathological eating as a means to compensate for low motivation, reward or saliency.Thus, one of the limitations to interpreting the present finding is that we don’t havemicrodialysis DA data from the striatum of fasted and non-fasted Ob and Le Zucker rats.Future studies will provide us with these answers to whether Ob R rats had higher striatalDA levels than Ob U rats.
DA differences due to 24h fasting for all ad-libitum fed animals (Acute food restriction inchronically ad-lib animals)
In this study, we provide evidence of DA displacement (altered in-vivo D2Rbinding availability) due to feeding. In order to control for changes in D2R bindingavailability attributed to differences in feeding status, the animals were all fasted prior tobeing scanned.
The reason we chose a 24 hour fasting period, is because restricted rats were fedonce every 24 hours and usually consumed all of the food within an hour of being fed. Inthis way, it is as if they were consistently fasted for a period of approximately 24 hours.Fasting both the restricted and ad-libitum fed rats for this amount of time provides a basisfor the direct comparison of changes in D2R binding availability in the four experimentalgroups during a fasting period (much the same way that glucose sensitivity is tested indiabetics). That is, it shows how D2R binding availability is affected in each group, undernormalized conditions, and after food restriction or no food restriction. The caveat here isthat the restricted rats are conditioned to the food restriction while the ad-libitum fed ratsare not. This raises the question of how D2R binding availability of a rodent who is on achronically restricted feeding regiment differs from that of a rodent who is not when bothare in a state of negative energy balance that is brought upon by reduced food intake.Fasting has been shown to increase DA release in the striatum in ad-lib fed Wistar Rats(Miklya et al., 2003). Furthermore, 24h fasting has been shown to decrease the DATmRNA levels (Patterson et al., 1998). DAT is known to regulate the DA signal and inDAT KO mice DA signaling is chronically increased (Gainetdinov et al., 1999). Both ofthese findings support the notion that fasting increases DA. Our data supported this aswell since ad-lib 24h-fasted groups had slightly lower [11C]raclopride binding potential instriatum than the non-fasted (Figure 3.1.7c). Obese Zucker rats are hyperinsulinemic and

41
have high insulin levels (both in Ob Zucker rats and rats receiving insulinintracerebroventricularly (ICV)). Insulin has been associated with increased DAT mRNA(Figlewicz et al., 1998) as well as with increased sensitivity of DAT for DA uptake(Owens et al., 2005). So, the high DAT mRNA and the more efficient DA uptake byDAT associated with hyperinsulinemia in Ob U Zucker rats could translate to lower DAsignaling. Indeed decreases in both striatal DA and 3,4-dihydroxyphenylacetic acid(DOPAC) levels have been reported in Ob Zucker rats (Shimizu et al., 1991). Thiswould explain the higher D2R binding potential that we observed in the unrestricted (ObU and Le U) than in the fasted condition.
In conclusion, these findings may help shed light on how the DA system isfunctioning during fasted states in animals that are on restricted feeding and animals thatare not. In a clinical setting this may translate to an examination of the effects of dietingin obese and lean individuals and the respective DA system responses.
DA differences between chronic food restriction in Ob and Le Zucker rats and acute (24hfasting) food restriction
“Subchronic” food restriction (1 week) has been shown to lead to a decrease inextracellular DA in the NAc (Pothos et al., 1995a; Pothos et al., 1995b). However, more“chronic” food restriction (4 weeks) lead to 32% lower DAT binding levels in thestriatum (Zhen et al., 2006) which would translate to an increase in DA signaling. In ourmodel of chronic (4 months) food restriction, we found significantly greater D2R bindingpotential in Le R compared to Le U rats. While we saw the same effect in D2R in theARG data (lower D2R in Ob U versus Ob R), we failed to see such an association (withµPET) between Ob U and Ob R rats. This may be due to a higher DA signal in the Ob Rthan the Le rats so that it would have a greater effect on the competition with[11C]raclopride for D2R binding, which could account for the lack of difference in µPETdata between Ob U and Ob R even though µPET was able to detect the Le R > Le U seenwith the ARG. Moreover, even though the Ob Zucker rats are characterized by very highinsulin levels (Bray, 1977; Beck et al., 2004), we showed that Ob R rats have lowerinsulin and leptin levels due to the chronic food restriction (~30%) which would alsoserve as potential causes for their greater DA signal.
Previous research has shown that chronic food deprivation and diet-inducedobesity, two conditions that are characterized by differences in feeding, have both beenassociated with decreases in extracellular DA levels in the ventral striatum (Pothos et al.,1998a). Furthermore, in both food-deprived and obese rats, amphetamine-induced DArelease is higher than in controls (Pothos et al., 1998a). Similarly, obese and lean femalead-libitum fed Zucker rats did not differ in striatal DA metabolites at 5 weeks of age butby 16 weeks the obese had significantly lower DA metabolites in the striatum comparedto lean rats (Orosco et al., 1986). Even though this experiment was conducted in femalerats, the ages are almost identical to those examined in our experiment (4 and 16 weeks)and therefore may provide a closely related depiction of what we see in our results. Theabove studies point to a low basal release of DA in chronically food restricted and obeserats and suggest that the low basal DA levels may be due in part to increased storage ofDA in synaptic vesicles. These results are further supported by findings of elevated basalDAT mRNA levels in the VTA (Figlewicz et al., 1998) and striatum (Mortensen &

42
Amara, 2003) in obese Zucker rats compared to lean controls, which suggest that theserats exhibit increased DA clearance and hence, decreased DA signaling. Therefore,elevated DAT in obese rats could serve as a compensatory mechanism to decrease excesssynaptic DA due to feeding and in turn would reduce D2 receptor stimulation (Giros etal., 1996), eventually contributing to the decreased D2R levels we observe. Contrary toobesity, there is evidence to support that chronic food restriction does not lead to DATelevations (Zhen et al., 2006). In this case, food-restricted rats may show the same lowbasal DA release and increased DA storage as obese rats, as well as the increased DArelease from synaptic vesicles in response to feeding but DA clearance would not befacilitated. As opposed to obese rats, DA clearance and possibly D2R stimulation wouldnot be compromised in food-restricted rats. This could potentially account for the D2Relevation we observe in food-restricted rats. The literature points to DA as areward/satiety signal and it has been theorized that the larger the net change of DArelease, the larger the feelings of reward that are associated with the perceived stimulus.It is hypothesized that obese rats have lower DA levels compared to lean rats andtherefore the change in DA signal brought upon by the presence of food or feeding inthese animals may elicit a larger increase (net change) in the DA signal than in controls,thereby increasing the reward attributed to food and would in turn increase food seekingand/or consumption.
Leptin and Dopamine
Our study further supports the above findings, since the significant attenuation ofD2R loss as a response to food restriction is greater in the Ob R than in the Le R group.Specifically, Ob R rats showed that the attenuation of D2R loss by food restriction was40 % greater than for the Le R group. Furthermore, food restriction led to a significantdecrease in plasma leptin concentrations in Ob R compared to Ob U rats, therebysuggesting that leptin inhibits the response of the DA system to chronic food restriction.Under normal circumstances, chronic food deprivation is associated with decreasedcirculating leptin and obesity is associated with leptin resistance. In both cases leptinsignaling is decreased. Findings showing that ob/ob have lower DA levels in the ventralstriatum compared to controls (Fulton et al., 2006) points to an association betweendecreases in leptin-signaling and decreases in DA release. Our results in leptin receptor-deficient Zucker rats which like the ob/ob are characterized by impaired leptin signalingsupport this.
Contrary to this however, an increase in leptin signaling is also associated withdecreases in DA release. Specifically, leptin receptors have been localized on VTA DAneurons (Figlewicz et al., 2003) and peripheral or central leptin administration inhibitsVTA DA neuron firing (Figlewicz et al., 2003; Hommel et al., 2006). This finding is inagreement with evidence that leptin injections into the lateral ventricle were shown todecrease basal and feeding-induced DA release in the ventral striatum (Krugel et al.,2003). It is not clear why normal leptin signaling as well as impairments in leptinsignaling have been associated with the same decreases in DA. Perhaps the decreases inthe DA signal observed in the above studies have to do with secondary or compensatoryeffects of leptin inhibition. In relation to our findings, the above evidence suggests thatleptin-receptor deficient Zucker rats would be resistant to the inhibitory effects of leptin

43
on VTA DA neuron firing. This does not necessarily mean that obese Zucker rats wouldshow increases in DA release in areas downstream of the VTA like the ventral striatum.Alternatively, this scenario correlates with findings of increases in vesicular DA observedin obese rodents (Pothos et al., 1998a). This would in turn explain the lower D2R levelswe observe in the obese Zucker rats.
Here we show behavioral and imaging data that support the notion of lower D2Rlevels in the CNS of Ob than in Le rats and in food unrestricted than food restrictedconditions indicating that both genotype as well as food availability affect D2R levels.We also show attenuation by food restriction of the D2R decline with aging that wasmost accentuated in the Ob than in the Le rats. This finding provides evidence for a roleof leptin in modulating adaptation responses of the DA system with respect to foodrestriction. Finally we provide indirect evidence that fasting enhances DA extracellularlevels which we demonstrate as a relative decrease in [11C]raclopride binding to D2R(more competition from the increase in endogenous DA). Inasmuch as food restrictionattenuates the D2R losses associated with aging this may underlie the salutary effects thatfood restriction has on locomotor activity and on sensitivity to reward in aged animals.
Other factors acting both peripherally and centrally may be involved in thefeeding profile of obese Zucker rats. It would be logical to assume that the leptin receptormutation in these rats may be affecting other peripheral or central signals that areindependent of leptin’s actions. In our experiment we observe that the obese restrictedrats still become obese, even after they were fed 70%. These rats weigh less than Ob Urats but are still obese compared to lean ad-libitum fed controls. In this respect, thechanges in D2R we observe may constitute secondary compensatory effects brought uponby differences in other metabolic signals. This may be further supported by the findingthat food restriction affects D2R in both obese and lean rats, thus pointing to DA changesindependent of obesity.
3.2 Effects of diet on D2R binding in rats susceptible or resistant to diet-inducedobesity
3.2.1 Introduction
Obesity is a complex metabolic state that is associated with increased adiposity,type 2 diabetes mellitus, hyperlipidemia, coronary artery disease, arthritis, gallstones,cancer and psychosocial disability. Obesity is currently the second leading cause ofpreventable death (after smoking) in the United States (Mokdad et al., 2004) and ispredominantly brought on by increased food intake, poor dietary habits and decreasedphysical activity and is modulated by both genetic and/or environmental factors (Mutch& Clement, 2006). Given the soaring percentage of Americans classified as overweightor obese (Mokdad et al., 2000), identifying neurobiological factors associated withbehaviors that results in obesity is of paramount importance.
DA is a neurotransmitter that has been implicated in the motivational and hedonicaspects of eating (Berthoud & Morrison, 2008). Recent evidence suggests that obesity is

44
associated with a hypofunctioning central DA system (Wang et al., 2001; Geiger et al.,2008; Thanos et al., 2008; Davis et al., 2009). Some of these studies have reported lowD2R availability in obese humans (Wang et al., 2001) and rodents (Hamdi et al., 1992;Huang et al., 2006; Hajnal et al., 2008; Thanos et al., 2008; Davis et al., 2009) in brainstructures that are part of the mesocorticolimbic DA system. A more recent studyreported that administration of bromocriptine, a D2R agonist, was associated withincreased D2R binding and decreased obesity-related symptoms (Davis et al., 2009).Similar to obese individuals, alcoholics and drug-addicts also show low D2R availabilityand in rodents low striatal D2R availability is associated with impulsivity (Dalley et al.,2007), which in turn is linked with compulsive behaviors (Belin et al., 2008). Based onthis interpretation, lower levels of D2R in striatum may serve as a potential risk-factor fordietary obesity and eating disorders (Wang et al., 2001), but whether inherently low D2Rlevels lead to compulsive food intake and obesity remains unclear. Accordingly, sincefeeding increases DA levels (Bassareo & Di Chiara, 1999; Gambarana et al., 2003),constantly elevated DA levels may lead to compensatory decreases in D2R, however,whether obesity or compulsive food intake leads to decreased D2R still remains unclear.
When placed on a high-fat diet, Osborne-Mendel (OM) rats consumed the mostcalories and gained the most weight out of six other rat strains including Sprague-Dawley, Hoppert, Wistar-Lewis, Hooded, Gray and S5B/PL (S5B) rats (Schemmel et al.,1970). In the same study, S5B/PL rats consumed the least amount of calories and gainedthe least amount of weight (Schemmel et al., 1970). When given a three macronutrienttaste-preference test, OM rats consumed more calories from a high-fat diet than a low-fat/high-carbohydrate or low-fat/high-protein diet (Nagase et al., 1996; Schaffhauser etal., 2002). When given the same taste-preference test, S5B rats consumed more caloriesfrom a low-fat/high-carbohydrate diet (Nagase et al., 1996; Schaffhauser et al., 2002). Infact, S5B rats decrease the amount of food they consume in order to receive the samecaloric amount as if they were consuming a regular chow diet and thus experience only aslight increase in body weight when placed on a high-fat diet (Bray et al., 1987; Fisler etal., 1993).
The aim of this study was to characterize striatal D2R levels in two rat strains thatdiffer in their propensity to gain-weight and consume a high-fat diet (OM and S5B/PLrats) in three different environmental conditions: regular (low-fat) chow diet, high-fat dietand food restriction. We hypothesized that striatal D2R levels would be lower in OM ratsthan in S5B/PL rats before access to a high-fat diet and that both the high-fat diet andfood restriction would differentially affect D2R levels in the two strains.
3.2.2 Methods
Animals
Male 2 month old Osborne-Mendel (OM; N=12; and S5B/PL (S5B; N=12) ratswere used. Rats from each strain were divided into 3 groups of 4 rats in each group.Specifically OM and S5B rats were put in the following groups for 8 weeks: i)unrestricted (AL) food access, ii) restricted (R) food access (70 % of AL fed animals) andiii) high-fat (HF) food access. Rats were bred at Pennington Biomedical ResearchLaboratory and housed on a reverse 12 hour light/dark cycle with lights off at 7 am. All

45
experiments were conducted in conformity with the National Academy of Sciences Guidefor the Care and Use of Laboratory Animals (NAS & NRC, 1996) and PenningtonBiomedical Research Laboratory Institutional Animal Care and Use Committeeprotocols.
Behavior Assessment – Food Intake and Weight
AL and R rats were fed a standard (Purina) low fat (LF) rat chow. HF rats werefed a diet of chow consisting of 30% fat. Food intake and body weight was monitoredthree times a week at 0900h. Rats were fed daily at 0900h and the amount of food givenwas continuously adjusted to 70% of food intake consumed by AL rats.
Plasma Insulin and Leptin
Using retro-orbital punctures, approximately 100 µl of blood was collected inglass capillary tubes. Blood samples were kept on ice until they were centrifuged at 3,000rpm for 10 minutes; plasma was collected and immediately stored at -80C. Plasma insulinand leptin concentrations were measured in duplicate with commercially available insulinand leptin EIA kits obtained from Linco Research (Linco Research, Missouri, USA).
In-vitro [3H]spiperone ARG
Each animal was deeply anesthetized with a mixture of ketamine (100 mg/kg) andxylazine (10 mg/kg). The brain was rapidly removed and frozen in an isopentane and dryice bath and stored in a –800C freezer. The brain was then transferred to a cryostat (LeicaCM3050S), and sections were cut 14µm thick at –180C. Sections were mounted onFisherbrand, Colorfrost */Plus microscope slides and stored at -800C until binding wasconducted. Slides were gradually brought back to room temperature and then pre-incubated at room temperature for ten (10) minutes in 50 mM Tris-HCl buffer (pH 7.4).The slides were then incubated in specific binding buffer (50 mM Tris-HCl, 0.4 nM[3H]Spiperone (Perkin Elmer), 10 µM ketanserin tartrate (Tocris Bioscience) at roomtemperature for one (1) hour. To determine non-specific binding some slides in parallelwere incubated for one (1) hour in specific binding buffer in the presence of 10 µMhaloperidol (Tocris Bioscience). Next, the slides were washed 2 x 10 minutes in ice-cold50 mM Tris-HCl and ice-cold dH2O. Afterwards, one (1) ml aliquots of incubationsolution were taken and added with five (5) ml of Ultima Gold XR (scintillation solution)and the amount of radioactivity was measured with a liquid scintillation counter. Slideswere then dried overnight at room temperature in a dessicator and placed in a glass slidecassette for qualitative and quantitative analysis using a β-Imager 2000 (Biospace, Paris,France). Using Betavision+ software (Biospace, Paris, France), Region of Interests(ROI’s) were drawn on the left and right caudate putamen (CPu) and NAc and of eachbrain slice. The data was then calibrated using a tissue homogenate standard. Meanvalues (Ci/g) of the left and right receptor rich regions (CPu, NAc) for each group arereported.

46
3.2.3 Results
Food Intake
A 2-way repeated measures ANOVA showed significant main effects for thefactors Group (F=57.18;dF=5,191; p<.001), Time (F=3.80;dF=7,191; p<.001) and theirinteraction Group x Time (F=2.85;dF=35,191; p<.001). Pair-wise comparisons (Holm-Sidak: p<.05) (Figure 3.2.1a) showed that at the end of the study period OM-HF rats hadsignificantly greater food intake compared to S5B-R (t=7.69), OM-R (t=6.36) and S5B-HF (t=3.26). OM-AL rats ate significantly more than S5B-R (t=8.24), OM-R (t=6.91) andS5B-HF (t=3.81) rats. Also S5B-AL rats ate significantly more compared to S5B-R(t=7.84), OM-R (t=6.51) and S5B-HF (t=3.41) rats. Finally, S5B-HF rats ate significantlymore than S5B-R rats (t=4.43) and OM-R (t=3.10) rats.
Caloric Intake
A 2-way repeated measures ANOVA showed significant main effects for thefactors Group (F=79.94;dF=5,191; p<.001), Time (F=3.65;dF=7,191; p=.001) and theirinteraction Group x Time (F=2.63;dF=35,191; p<.001). Pair-wise comparisons (Holm-Sidak: p<.05) (Figure 3.2.1b) showed that at the end of the treatment period OM-HF ratshad greater caloric intake compared to S5B-R (t=12.36), OM-R (t=11.27), OM-AL(t=5.59) and S5B-HF (t=5.91) rats. OM-AL rats ate significantly more calories than S5B-R (t=6.78) and OM-R (t=5.69) rats. Also S5B-AL rats ate significantly more caloriescompared to S5B-R (t=6.45) and OM-R (t=5.36) rats. Finally, S5B-HF rats atesignificantly more calories than S5B-R rats (t=8.87) and OM-R rats (t=7.77), andsignificantly less calories than OM-HF (t=3.49) rats.
Body weight
A 2-way repeated measures ANOVA showed significant main effects for thefactors Group (F=58.14;dF=5,191; p<.001), Time (F=1222.19;dF=7,191; p<.001) andtheir interaction Group x Time (F=31.34;dF=35,191; p<.001). Pair-wise comparisons(Holm-Sidak: p<.05) (Figure 3.2.2) showed that at the end of the study period OM-HFrats had significantly greater body weight compared to OM-AL (t=2.36), S5B-AL(t=9.29), S5B-R (t=17.59), OM-R (t=10.79) and S5B-HF (t=10.27). OM-AL ratsweighed significantly more than S5B-R (t=15.23), OM-R (t=8.44), S5B-HF (t=7.92) andS5B-AL (t=6.93) rats. Also S5B-AL rats weighed significantly more compared to S5B-Rrats (t=8.3), S5B-HF weighed significantly more than S5B-R rats (t=7.31) and OM-R ratsweighed significantly more than S5B-R rats (t=6.79).
Leptin
A 2-way ANOVA showed significant main effects for the factors Strain(F=24.29;dF=1,71; p<.001), Diet (F=15.42;dF=2,71; p<.001) and their interaction Strainx Diet (F=17.97;dF=2,71; p<.001). Pair-wise comparisons (Holm-Sidak: p<.05) (Figure3.2.3) showed that OM-HF rats had significantly greater leptin levels compared to OM-R(t=7.99), OM-AL (t=3.84) and S5B-HF rats (t=6.44). Also OM-AL rats had significantlygreater leptin levels than OM-R rats (t=4.15) and S5B-AL rats (t=3.93).

47
Insulin
A 2-way ANOVA showed significant main effects for the factors Strain(F=34.72;dF=1,71; p<.001), Diet (F=27.04;dF=2,71; p<.001) but not their interactionStrain x Diet (F=5.40;dF=2,71; p=.007). Pair-wise comparisons (Holm-Sidak: p<.05)(Figure 3.2.3) showed that S5B-HF rats had significantly greater insulin levels than S5B-R rats (t=6.69) and S5B-AL (t=5.89) rats. OM-HF rats had significantly greater insulinlevels compared to OM-R (t=3.38) rats. OM-AL rats had significantly greater insulinlevels than S5B-AL (t=5.29) rats. Finally, OM-R rats had significantly greater insulinlevels than S5B-R (t=4.11) rats.
D2R ARG
A 2-way ANOVA showed significant main effects for the factors Group(F=317.01;dF=5,1861; p<.001), Brain Region (F=202.45;dF=6,1861; p<.001) and theirinteraction Group x Brain Region (F=8.58;dF=30,1861; p<.001).
Differences between groups
Pair-wise comparisons (Holm-Sidak: p<.05) between groups were performed(Figure 3.2.4). CPu: S5B-AL rats had greater D2R binding compared to S5B-R (t=6.58),S5B-HF (t=10.79), OM-AL (t=1.972), OM-R (t=4.87) and OM-HF (t=13.53) rats. S5B-Rrats had greater D2R binding compared to S5B-HF (t=3.39) and OM-HF (t=6.57) rats.Also S5B-HF rats had greater D2R binding compared to OM-HF rats (t=3.52). OM-ALrats had greater D2R binding compared to OM-R (t=2.83), OM-HF (t=11.84) and S5B-HF (t=8.92) rats. OM-R rats had greater D2R binding compared to OM-HF (t=9.59) andS5B-HF (t=6.42) rats. NAc: S5B-AL rats had greater D2R binding compared to S5B-R(t=9.37), S5B-HF (t=14.28), OM-AL (t=6.90), OM-R (t=12.47) and OM-HF (t=17.33)rats. S5B-R rats had greater D2R binding compared to S5B-HF rats (t=3.92) and OM-HFrats (t=7.68). OM-AL rats had greater D2R binding compared to OM-R (t=5.51), OM-HF(t=12.11), S5B-R (t=3.77) and S5B-HF (t=8.41) rats. OM-R rats had greater D2R bindingcompared to OM-HF (t=7.88) and S5B-HF rats (t=3.70). Finally, S5B-HF hadsignificantly greater D2R binding compared to OM-HF rats (t=4.16).
Differences within groups
S5B-AL rats showed greater D2R binding in the NAc compared CPu (t=9.46).S5B-R rats showed greater D2R binding in the NAc compared to CPu (t=3.14). S5B-HFrats showed no significant differences between the two brain regions.
OM-AL rats showed greater D2R binding in the NAc compared to CPu (t=4.96).OM-R rats showed greater D2R binding in the NAc compared CPu (t=3.73). OM-HF ratsshowed no significant differences between any of the two brain regions.

48
Figure 3.2.1a
Figure 3.2.1b
Figure 3.2.1. (a) Mean (+SEM) daily food intake in OM and S5B/PL ad-libitum,restricted and high-fat diet fed rats. (b) Mean (+SEM) daily caloric intake in OM andS5B/PL ad-libitum, restricted and high-fat diet fed rats.

49
Figure 3.2.2
Figure 3.2.2. Mean (+SEM) daily body weight in OM and S5B/PL ad-libitum, restrictedand high-fat diet fed rats.
Figure 3.2.3
Figure 3.2.3. Mean (+SEM) insulin and leptin plasma concentrations in OM and S5B/PLad-libitum, restricted and high-fat diet fed rats.

50
Figure 3.2.4
Figure 3.2.4. Mean (+SEM) D2R binding in OM and S5B/PL ad-libitum, restricted andhigh-fat diet fed rats.
3.2.4 Discussion
Food Intake and Body Weight
When exposed to a low-fat diet, OM and S5B/PL rats showed no difference in theamount of food consumed at 8 weeks even though OM rats weighed approximately 23%more than S5B/PL rats. When fed a high-fat diet OM rats consumed approximately 16%more food, 16% more calories and weighed 34% more than S5B/PL rats. S5B/PL rats feda high-fat diet also showed about 16% greater food and 12% more calorie intake thansimilarly aged S5B/PL rats placed on a low-fat diet. On the other hand, calories and theamount of low-fat and high-fat food consumed by OM rats was approximately the same.Food restriction led to a significant decrease in body weight in both OM and S5B/PL rats(approximately 29% and 36% from low-fat diet fed rats respectively). At 8 weeks, foodrestricted OM rats had similar body weight levels as low-fat and high-fat diet fed S5B/PLrats.
The increased caloric intake in OM-HF compared to OM-AL rats and the fact thatlow-fat diet fed OM rats weighed 23% more than S5B/PL rats, while both groupsconsumed the same amount of food and calories, suggests that OM rats are characterizedby both a susceptibility to consume high-fat food as well as metabolic disturbances thatlead to a predisposition in gaining weight outside the context of caloric intake. On theother hand, the decreased food intake of high-fat diet exposed S5B/PL rats suggests thatthey are selectively resistant to consuming a high-fat diet.
OM rats have abnormal insulin levels that don’t normalize with food restrictionwhereas they also have high levels of leptin but these high leptin levels decrease whenrats are placed on the restricted diet. The high insulin levels observed in the OM rats forall conditions or the S5B for the fat diet are consistent with insensitivity to insulin. In thecase of the OM rats the fact that they don’t decrease insulin levels even with food

51
restriction suggests a fundamental deficit in insulin regulation. Indeed early onset ofinsulin resistance in OM rats has been previously suggested (Petrescu et al., 2008). Theresponse to leptin in the OM rats is also unique in that whereas food restriction results inleptin increases in the case of the OM rats it led to a decrease in concentration.
Low D2R binding after exposure to low-fat food is associated with increased bodyweight and elevated circulating leptin but not feeding
The susceptibility to weight gain in OM-AL rats was associated with the lowerD2R binding as compared to S5B-AL rats in the CPu and NAc. This finding agrees withprevious studies reporting associations between reduced striatal D2R binding andincreased body weight in both humans (Wang et al., 2001) and rodents (Hamdi et al.,1992; Huang et al., 2006; Hajnal et al., 2008; Thanos et al., 2008; Davis et al., 2009).However the small sample sizes (4 per cell) precludes us to make a generalization ofthese findings and require confirmation in a larger sample. Nonetheless the fact that forboth strains the high fat diet was associated with lower D2 receptors suggest thatmetabolic responses triggered by high fat consumption such as insulin insensitivity ofhigh leptin levels may contribute to the D2R downregulation.
Since the insulin levels don’t differ from the OM in restricted versus high fat dietwhereas high fat food does. One could speculate that the downregulation of D2R with fatdiets is in part mediated by high leptin levels (note that leptin is high despite heavyweight which is likely to reflect insensitivity). Note also that the high leptin levels couldalso explain the lower D2R in food restriction for the S5B, though it wouldn’t explain thelower D2R in food restriction for the S5B. Though it wouldn’t explain the lower D2R inOM with food restriction since leptin values are lower than with all. Thus based on thesefindings the association between leptin and D2R needs further evaluation.
Indeed previous studies have reported that OM rats are less sensitive to leptinsignaling (Ishihara et al., 2004) and show reduced leptin receptor (LepR) mRNA levels inthe hypothalamus (Madiehe et al., 2000). The potential role of leptin in D2R regulationis consistent with our findings and that of others showing reduced striatal D2R bindingand DA signaling in hyperinsulinemic and hyperleptinemic LepR deficient (fa/fa) rats(Hamdi et al., 1992; Thanos et al., 2008). A regulatory role for peripheral leptin is furthersupported by studies demonstrating reduced extracellular NAc DA levels after leptininfusion (ICV) (Krugel et al., 2003), reduced firing of DA neurons in response tointravenous leptin (Hommel et al., 2006) and decreases in D2R binding in response toperipherally administered leptin in mice (Pfaffly et al., 2010). LepR are co-expressed onDA neurons of the VTA (Figlewicz et al., 2003; Fulton et al., 2006; Hommel et al., 2006)and these receptors are behaviorally relevant to feeding (Hommel et al., 2006). Likeleptin, insulin has also been reported to play a modulatory role on striatal DA. Insulinreceptors are also co-expressed on VTA DA neurons (Figlewicz et al., 2003). Also,hypoinsulinemic rats are characterized by decreased DAT cell-surface expression(Williams et al., 2007) and reduced amphetamine-induced striatal DA release (Sevak etal., 2007), while insulin infusion (ICV) increased DAT mRNA and functional activity(Figlewicz et al., 2003).
Previous studies have also documented involvement of other neurotransmitters inthe susceptibility to weight gain in OM rats such as increases in µ-opioid receptors
52
(Barnes et al., 2006), NPY, and corticotropin releasing hormone (CRH) mRNA(Schaffhauser et al., 2002) in the hypothalamus. Lower levels of extracellularnorepinephrine and serotonin in the hypothalamus have also been reported in OM rats(Shimizu et al., 1994).
Within the above context, our data suggest that the OM rat is an example of howlow striatal D2R levels (including NAc) can serve as risk factors for predispositiontowards weight gain that is independent of caloric intake. In support of this view, a recentstudy reported that postnatally derived (P0-P1) VTA neurons from inbred obesity-pronerats showed reduced DA exocytosis (decreased DA quantal size) (Geiger et al., 2008)suggesting that the reduced D2R binding we observe in OM-AL rats may be aconsequence of impaired presynaptic DA signaling that originates from the VTA,possibly due to elevated circulating leptin levels and thus inhibitory effects of leptin onmidbrain DA neurons. D2R regulate and are regulated by DA signaling and therefore ourresults, taken together with the above findings suggest that OM rats may also becharacterized by reduced activity of mesolimbic DA. Since, acute feeding increases DArelease and turnover in mesolimbic DA areas (Hernandez & Hoebel, 1988; 1990;Yoshida et al., 1992), one can hypothesize that such disturbances may lead to apredisposition towards hyperphagia as a compensatory mechanism to increase DA levelsand reach satiety. This view is supported by findings demonstrating that 15-week oldinbred obesity-prone rats showed significantly reduced basal NAc DA levels and reducedevoked DA release in mesolimbic DA regions, and these findings were coupled withincreased low-fat food intake (~14%) compared to obesity-resistant rats (Geiger et al.,2008). Our findings in 16 week old rats do not support this view since we found reducedD2R binding in OM rats that was not associated with respective differences in food orcaloric intake. Our data in low-fat diet fed rats support the notion that leptin and insulinare involved in regulating D2R and that this regulation happens outside the context offeeding.
Reductions in D2R binding after exposure to high-fat food are associated with elevatedcirculating leptin: potential effects of palatability
A previous study showed reduced striatal D2R binding in obesity-prone miceafter exposure to a high-fat diet (40% fat) for 6 weeks (Huang et al., 2006). Anotherstudy showed that mice exposed for twenty days of high-fat diet consumptionsignificantly increased D2R and decreased DAT density in the dorsal and ventral parts ofthe caudal caudate putamen (D2R: 32% and 35% respectively, DAT: 33.3% and 28.8%respectively) compared with low-fat diet (South & Huang, 2008). In addition, in thisstudy it was reported that high-fat feeding also increased D2 binding in the NAc shell(36%) and that D2R and DAT density remained unchanged following reversal of thediets from high-fat to low-fat diet (South and Huang, 2008). It is unclear whether thischange in D2R levels was accompanied by elevated or decreased leptin or insulin levelssince these were not reported. At 8 weeks of treatment, S5B-HF rats showed lower D2Rbinding (60% decrease in NAc), and consumed less food (16%) but more calories (12%)than S5B-AL rats. OM-HF rats showed lower D2R binding (74% decrease in NAc), aninsignificant difference in food intake (~3% greater), but greater caloric intake (28%)than OM-AL rats. The fact that exposure to high-fat food decreased D2R binding for both

53
OM and S5B/PL rats and that these differences were paralleled by increases in calories offat (not grams of food) consumed suggests that the decreases in D2R may have beenmediated by the type of calories consumed, taste and/or changes in leptin and insulinbrought upon by exposure to high-fat food. Although OM-HF and S5B-HF rats had 45%and 29% greater leptin and 14% and 160% greater insulin levels than OM-AL and S5B-AL rats respectively, the increases in leptin in S5B-HF rats and insulin in OM-HF ratswere not significant. The fact that we observed a more pronounced decrease in D2Rbinding in OM-HF compared to S5B-HF rats and from low-fat diet fed rats suggests thatOM rats may be more susceptible to decreases in D2R binding brought upon by exposureto a high-fat diet. It is unclear whether this susceptibility is guided by the greater caloricintake, type of calories, palatability of the high-fat diet or further elevated leptin andinsulin levels. Insulin is unlikely since OM-HF and S5B-HF rats showed similar levels ofcirculating insulin. Leptin is more likely since the difference in circulating leptin betweenOM and S5B rats increased after a high-fat diet. Along with leptin, high-fat food intakewas also different between OM-HF and S5B-HF rats and this is another factor that maybe associated with greater reduction of D2R in OM-HF rats. However, increased high-fatfood intake is expected to lead to elevated leptin circulating levels and since leptin signalsfat stores from the periphery to the brain, it is likely that effects of high-fat food on D2Rare mediated in part by leptin. Finally palatability may be a factor affecting D2Rdifferently in the two strains. In support of palatability as a potential modulator of D2R,OM and S5B/PL rats have been shown to differ in sensitivity to taste responses towardsfat (Gilbertson et al., 2005) and as described earlier, OM rats readily prefer a high-fat dietover a low-fat/high-carbohydrate and low-fat/high-protein diet while S5B/PL rats do not(Nagase et al., 1996; Schaffhauser et al., 2002). Furthermore, a recent study showed thatsham-feeding of fat (100% corn oil) increases NAc DA levels in rats (Liang et al., 2006).It is therefore likely that constant increases in DA levels in response to fat taste may leadto the downregulation in D2R we observed. Such DA increases have been interpreted asbeing indicative of associating the palatability of food with its post-ingestiveconsequences (Fenu et al., 2001; Di Chiara & Bassareo, 2007) and therefore interactionsbetween the gut and the brain. More specifically the relationship of taste, energy-relatedmessengers like leptin, and mesocorticolimbic DA may be instrumental in thedevelopment of eating patterns and habits, and therefore disturbances in these factorsmay lead to eating disorders and obesity.
Food restriction normalizes D2R differences in OM and S5B/OL rats and these changesare associated with decreases in circulating leptin
Eight weeks of food restriction decreased D2R binding in the CPu and NAccompared to ad-libitum feeding in both OM and S5B/PL rats. Previous studies havereported reduced basal NAc DA levels in food restricted rats characterized by a 20%reduction in weight (Pothos et al., 1995a; Pothos et al., 1995b) which was similar to theweight reduction seen in our study (OM-R and S5B-R rats showed a 29% and 36%reduction in body weight respectively). However this differs from our prior finding inzucker rats in which we showed that food restriction led to a decrease in D2Rdownregualtion. The differences between both findings are unclear and merit furtherevaluation. Although food restriction decreased D2R in both OM-R and S5B-R rats, the

54
decrease was more pronounced in S5B-R rats. This finding was expected since these ratsare less susceptible to the effects of starvation than their obesity-prone counterparts(Sakaguchi et al., 1988). Unlike OM-AL and S5B-AL rats that differed in D2R binding,we found no differences in D2R binding between OM-R and S5B-R rats. Since OM-Rand S5B-R rats were exposed to the same, albeit less, low-fat diet as OM-AL and S5B-AL rats, and we did not find an association between food intake and D2R binding in ALrats, the 8% greater food intake in OM-R compared to S5B-R rats is unlikely to be thecause for their D2R profiles. Our results suggest the more likely cause for the D2Rbinding levels we report in OM-R and S5B-R rats is leptin. Specifically, food restrictiondecreased leptin levels in OM-R rats to comparable levels of S5B-R rats. Therefore,lower circulating leptin levels in OM-R, or increased efficiency of leptin signaling mayaccount for the respective changes in D2R we observed.
Our findings suggest that low striatal D2R levels in OM and S5B rats potentiallyreflected elevated circulating leptin levels. Inasmuch as OM rats had higher leptin andinsulin levels the latter of which did not normalize with food restriction suggest that thesemay serve as risk factor towards weight gain irrespective of feeding. Conversely, higherstriatal D2R levels in S5B/PL rats may play a protective role against excessive feeding,weight-gain and high-fat food consumption. This resistance in S5B/PL rats to consumethe high-fat diet was also coupled with lower circulating leptin levels, which suggests arole for peripheral leptin in striatal D2R regulation. Food restriction, which decreasedcirculating leptin in OM rats to those comparable of S5B/PL rats, also reversed thedifference in D2R binding between the two strains. High-fat fed OM rats showedsignificantly lower D2R binding and higher circulating leptin concentrations compared toS5B/PL rats, suggesting that the difference in D2R binding between high-fat fed OM andS5B/PL rats may also be mediated via leptin and /or insulin. Compared to low-fat fedrats, S5B/PL rats exposed to a high-fat diet showed increases in caloric intake anddecreased D2R binding while leptin did not change, suggesting that these rats may bemore sensitive to taste or post-ingestive effects of fat.
A limitation of this study however is that the focus was on the striatum and we didnot assess D2R binding in other areas of the mesocorticolimbic DA system (i.e. VTA,SN, prefrontal cortex) as well as regions involved in food-related homeostasis (i.e.hypothalamus). Future studies are aimed at examining D2R binding in these regions andthat the samples for any one group were small and thus further studies are warranted toreplicate these findings. Our findings support a role for peripheral messengers like leptinin regulating D2R levels.
3.3 PET imaging of D2R with [11C]raclopride predicts weight gain in rats
3.3.1 Introduction
Using PET and µPET imaging, studies have previously reported deficits in D2Rbinding availability in obese humans (Wang et al., 2001) and genetically obese rats

55
(Thanos et al., 2008). A fundamental question that has emerged from these studies iswhether such deficits are caused by constant overeating in obesity, or whether thespecific individuals and animals are genetically prone to such deficits. If the answer tothis question is the latter, then the notion of using D2R binding availability as a predictivebiomarker for assessing vulnerability to obesity becomes apparent. In this paper, weattempted to answer this question by measuring D2R binding availability using µPET in10 non-obese adult Sprague-Dawley rats and then correlating these measures with bodyweight 2 months after scanning. We hypothesized that D2R binding availability wouldnegatively correlate with future measures of body weight in rats and thus could serve as apredictive non-invasive measurement of weight gain susceptibility.
3.3.2 Methods
Animals
Rats between 12-14 weeks of age (n=10) were obtained from Taconic (Taconic,NY) and housed on a reverse 12 hour light/dark cycle with lights off at 7 am. Rats werefed a standard (Purina) laboratory rat chow. Food intake was monitored daily atapproximately 1500h and all rats were weighed every other day immediately after foodmonitoring. All experiments were conducted in conformity with the National Academy ofSciences Guide for the Care and Use of Laboratory Animals (NAS & NRC, 1996) andBrookhaven National Laboratory Institutional Animal Care and Use Committeeprotocols.
In-vivo [11C]raclopride D2R µPET
PET assessment of D2R in these rats was performed using a PET R4 Scanner(CTI Concorde Microsystems, Knoxville, TN). Each rat was briefly anesthetized withisoflurane (~2-3 min) and its lateral tail vein was catheterized. Once awake, each rat wasinjected intravenously with [11C]raclopride (547 ± 72 Ci); specific activity, 10.4 ± 4.3mCi/nmol). Injected volumes were approximately 400 µl. 30 minutes later each rat wasanesthetized with isoflurane and placed in a stereotaxic head holder (David KopfInstruments; CA, USA) in a prone position on the bed of the scanner and scanningcommenced. Total acquisition time was 30 min (17 frames: 6 frames, 10 s; 3 frames, 20s; 8 frames, 60 s; 4 frames, 300 s) and data were acquired in fully 3-dimensional modewith maximum axial acceptance angle (+-28 degrees). Images were reconstructed usingthe optimization algorithm MAP with 30 iterations and a smoothing value of 0.01 mm.Qualitative and quantitative assessment of PET images was performed as describedpreviously using the PMOD software environment (PMOD Technologies, ZurichSwitzerland) (Schiffer et al., 2009). Food intake and body weight was measured up to 2months after scanning.
3.3.3 Results
A linear regression analysis comparing D2R binding availability (binding ratio)and body weight in the dorsal and ventral striatum 2 months after scanning was
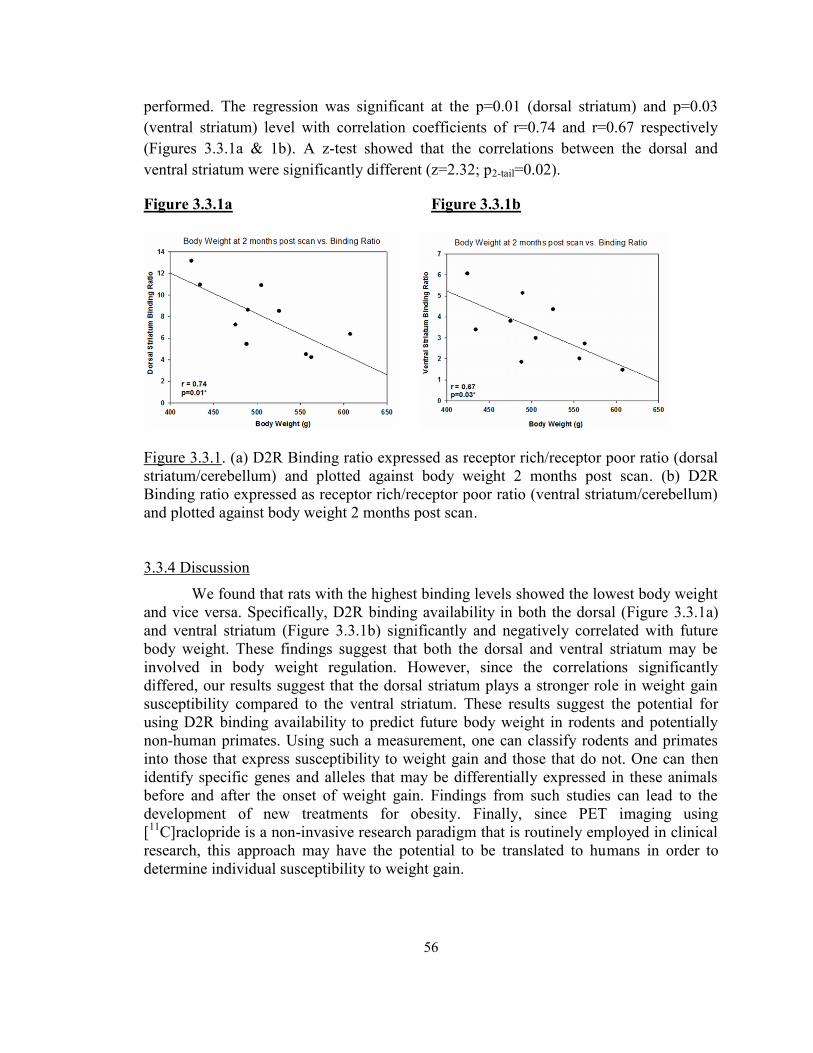
56
performed. The regression was significant at the p=0.01 (dorsal striatum) and p=0.03(ventral striatum) level with correlation coefficients of r=0.74 and r=0.67 respectively(Figures 3.3.1a & 1b). A z-test showed that the correlations between the dorsal andventral striatum were significantly different (z=2.32; p2-tail=0.02).
Figure 3.3.1a Figure 3.3.1b
Figure 3.3.1. (a) D2R Binding ratio expressed as receptor rich/receptor poor ratio (dorsalstriatum/cerebellum) and plotted against body weight 2 months post scan. (b) D2RBinding ratio expressed as receptor rich/receptor poor ratio (ventral striatum/cerebellum)and plotted against body weight 2 months post scan.
3.3.4 Discussion
We found that rats with the highest binding levels showed the lowest body weightand vice versa. Specifically, D2R binding availability in both the dorsal (Figure 3.3.1a)and ventral striatum (Figure 3.3.1b) significantly and negatively correlated with futurebody weight. These findings suggest that both the dorsal and ventral striatum may beinvolved in body weight regulation. However, since the correlations significantlydiffered, our results suggest that the dorsal striatum plays a stronger role in weight gainsusceptibility compared to the ventral striatum. These results suggest the potential forusing D2R binding availability to predict future body weight in rodents and potentiallynon-human primates. Using such a measurement, one can classify rodents and primatesinto those that express susceptibility to weight gain and those that do not. One can thenidentify specific genes and alleles that may be differentially expressed in these animalsbefore and after the onset of weight gain. Findings from such studies can lead to thedevelopment of new treatments for obesity. Finally, since PET imaging using[11C]raclopride is a non-invasive research paradigm that is routinely employed in clinicalresearch, this approach may have the potential to be translated to humans in order todetermine individual susceptibility to weight gain.
57
Chapter 4
Dopamine, Dopamine D2 Receptor, and Leptin Interactions
4.1 Displacement of [11C]raclopride by leptin predicts weight gain and cocainepreference in rats
4.1.1 Introduction
PET studies in humans have corroborated an involvement of D2R both in foodreward (Small et al., 2003) as well as in the motivation to procure food (Volkow et al.,2002b). Such studies have also corroborated the involvement of D2R in obesity bydocumenting reductions in striatal D2R availability in the striatum of pathologicallyobese individuals (Wang et al., 2001), while patients with anorexia nervosa have reportedhigher than normal striatal D2R availability (Frank et al., 2005). Using µPET, section 3.1reported that obese Zucker fa/fa rats show reduced striatal D2R availability compared tolean rats. Since fa/fa rats are leptin-resistant and morbidly obese, and since the morbidlyobese humans from the (Wang et al., 2001) study were more than likely to have beenleptin-resistant, it is currently unknown whether it is the obesity itself or diminishedleptin signaling that leads to decreased D2R availability. The aim of the experiments inthis chapter was to document a role for leptin in modulating striatal DA-D2R interactionsin-vivo. The main hypothesis was that changes in leptin signaling affect DA-D2Rinteractions in the striatum and thereby can increase motivation and sensitivity to foodseeking, since leptin signals peripheral energy stores to the brain. The central premise isthat leptin is an adiposity signal whose effects are not only limited to homeostaticmechanisms, but also to goal-directed behavior such as food seeking.
4.1.2 Methods
Animals
Rats were obtained from Taconic (Taconic, NY) and housed on a reverse 12 hourlight/dark cycle with lights off at 7 am. Rats were fed a standard (Purina) laboratory ratchow. Food intake was monitored daily at approximately 1500h and all rats wereweighed every other day immediately after food monitoring. All experiments were
58
conducted in conformity with the National Academy of Sciences Guide for the Care andUse of Laboratory Animals (NAS & NRC, 1996) and Brookhaven National LaboratoryInstitutional Animal Care and Use Committee protocols.
In-vivo [11C]raclopride D2R µPET
Raclopride was purchased from Sigma and [11C]raclopride was synthesized asdescribed previously (Volkow et al., 1999b). PET assessment of D2R in these rats wasperformed using a PET R4 Scanner (CTI Concorde Microsystems, Knoxville, TN).Each rat was scanned twice. Scan 1 (baseline): Each rat was briefly anesthetized withisoflurane (~2-3 min) and its lateral tail vein was catheterized. Once awake, each rat wasinjected intravenously with (565 ± 54 Ci ); specific activity, 12.7 ± 1.8 mCi/nmol)[11C]raclopride. Injected volumes were approximately 400 µl. 30 minutes later each ratwas anesthetized with isoflurane and placed in a stereotaxic head holder (David KopfInstruments; CA, USA) in a prone position on the bed of the scanner and scanningcommenced. Total acquisition time was 30 min (17 frames: 6 frames, 10 s; 3 frames, 20s; 8 frames, 60 s; 4 frames, 300 s) and data were acquired in fully 3-dimensional modewith maximum axial acceptance angle (+-28 degrees). Images were reconstructed using aMAP algorithm (as described in 2.3). Scan 2 (challenge): These procedures wereidentical to Scan 1 with the exception of an intraperitoneal (IP) injection of either salineor rat recombinant leptin (Sigma-Aldrich, St.Louis, MO) at doses of 20, 40 and 80 µg/kgimmediately prior to [11C]raclopride administration. Since raclopride is highly sensitiveto displacement by endogenous DA, we measured the percent change in D2R bindingbetween the two scans (as an indicative measure of D2R binding displacement inresponse to leptin). Qualitative and quantitative assessment of PET images wasperformed as described previously (Thanos et al., 2008).
4.1.3 Results
Effects of Leptin on D2R Binding Displacement in the Dorsal Striatum
One-way ANOVA showed a significant main effect [(F(3, 19)=3.28; p=0.048)].Pair-wise comparisons (Holm-Sidak; α=0.05) showed that compared to saline, 20(t=2.52; p=0.023) and 40 µg/kg (t=2.53; p=0.022) of leptin significantly decreased[11C]raclopride displacement by ~30% in the dorsal striatum: 80 µg/kg leptin did notaffect [11C]raclopride displacement in the dorsal striatum (t=0.72; p=0.48) (Figure4.1.1a).
Effects of Leptin on D2R Binding Displacement in the Ventral Striatum
One-way ANOVA showed a significant main effect [(F(3, 19)=1.39; p=0.284)].No significant effects among any groups were observed in the ventral striatum (Figure4.1.1b).

59
Correlation between Leptin-induced alterations in D2R Binding Displacement andPropensity to Gain Weight
Linear regression analyses comparing D2R binding displacement (% change inbinding ratio between the 80 µg/kg leptin challenge scan and the baseline scan) and bodyweight in the dorsal and ventral striatum 2 months after scanning were performed. Theregressions were significant at the p=0.03 (dorsal striatum) and p=0.03 (ventral striatum)level with correlation coefficients of r=0.91 and r=0.91 respectively (Figures 4.1.2a &2b).
Correlation between Leptin-induced alterations in D2R Binding Displacement andCocaine Preference
Linear regression analyses comparing D2R binding displacement (% change inbinding ratio between the 80 µg/kg leptin challenge scan and the baseline scan) andcocaine preference in the dorsal and ventral striatum 2 months after scanning wereperformed. The regressions were not significant with p=0.18 (dorsal striatum) and p=0.22(ventral striatum) correlation coefficients of r=0.70 and r=0.66 respectively (Figures4.1.2c & 2d).
Figure 4.1.1a Figure 4.1.1b
Figure 4.1.1. (a) Percent change in D2R BP between challenge (leptin or saline) andbaseline scans in the dorsal striatum. (b) Percent change in D2R BP between challenge(leptin or saline) and baseline scans in the ventral striatum.

60
Figure 4.1.2a Figure 4.1.2b
Figure 4.1.2c Figure 4.1.2d
Figure 4.1.2. Percent change in D2R BP between challenge (leptin or saline) and baselinescans in the dorsal striatum (a) and ventral striatum (b) plotted against total weight gain 2months post scan. (b) Percent change in D2R BP between challenge (leptin or saline) andbaseline scans in the dorsal striatum (c) and ventral striatum (d) plotted against cocainepreference 2 months post scan.
4.1.4 Discussion
The above results suggest that low peripheral leptin concentrations lead toincreases in striatal DA-D2R stimulation while higher doses produce variable effects onDA-D2R stimulation and that these effects depend on individual susceptibility to weightgain but not cocaine preference.
Repeated Imaging with [11C]raclopride using a Test/Retest Paradigm Decreases DA-D2RBinding
Saline-treated rats showed a ~45% and ~120% increase in BP in the dorsal andventral striatum respectively (Figure 4.1.1a & b). [11C]raclopride is highly displaceableby DA (Morris & Yoder, 2007) and therefore test-retest decreases/increases in BP are
61
thought to reflect increases/decreases in D2R stimulation by DA (via DA-raclopridecompetition for D2R binding sites). Therefore, outside the context of leptin, this specifictest-retest imaging paradigm decreases DA-D2R binding in both the dorsal and ventralstriatum, possibly due to repeated exposure to anesthesia. Future studies aimed at usingsimilar techniques should take potential anesthesia issues into account in the imagingdesign.
Effects of Leptin on DA-D2R Binding in the Dorsal and Ventral Striatum are Dependenton Dose and Individual Susceptibility to Weight Gain but not Cocaine Preference
In contrast, 20 and 40 µg/kg leptin significantly decreased BP by ~30% in thedorsal striatum but did not affect BP in the ventral striatum. These findings are directlyopposite to the binding response seen when rats were challenged with saline and suggestthat leptin, at these doses, produces an increase in DA-D2R binding in both the dorsaland ventral striatum, (albeit this effect is more pronounced in the dorsal striatum).Interestingly, similar leptin doses decrease feeding in mice (Harris et al., 1998). Inaccordance with this, increased D2R stimulation is considered to have anorexigeniceffects as D2R agonists decrease feeding and adiposity (Davis et al., 2009). Taking bothof these into account, we conclude that the anorectic effects of DA (via D2R stimulation)are mediated in part by peripheral leptin. This is a compelling argument as it highlightsthe crosstalk between the CNS and the periphery and provides a potential mechanismrelating ingestive behavior to energy homeostasis. Furthermore, since the increase in DA-D2R stimulation was more pronounced in the dorsal striatum, it is possible that the dorsalstriatum is more involved in leptin-DA interactions that mediate ingestive behavior thanthe ventral striatum.
The uniform effect of 20 and 40 µg/kg leptin at decreasing D2R BP was not seenat the highest dose. In fact, 80 µg/kg leptin produced variable results in both the dorsaland ventral striatum with some rats showing increases and others decreases in BP. Linearregression analysis was carried out in an attempt to explain this variability (Figure 4.1.2)and showed that leptin was able to decrease BP in rats that showed the least amount ofweight gain at 1 and 2 months after scanning but increased BP in rats that showed thegreatest weight gain at these same time points. It is possible that at this dose, leptinproduces differential effects on D2R binding and that the direction of the effect isdetermined by individual susceptibility to weight gain. Interestingly, 80 µg/kg leptinapproximates the plasma leptin concentrations of obese rats (Michaelides et al., 2006),concentrations which are also characteristic of leptin resistance. Rodents with suchelevated leptin concentrations are characterized by increased feeding and adiposity.These results suggest that during leptin resistance or situations where there are highlyelevated blood leptin concentrations, leptin signaling works to decrease D2R binding israts that have some type of resistance to weight gain, while in others such leptin plasmaconcentrations may induce opposite effects on striatal DA, that lead to increased D2Rbinding and hence decreases in D2R stimulation by DA. This is a very compellingargument since it describes a potential mechanism that may explain in part individualdifferences in weight gain and food reward. Accordingly, striatal DA-D2R deficitspreviously observed in obese individuals may be influenced by individual differences in

62
leptin metabolism. Furthermore, D2R BP changes in response to leptin may be used topredict susceptibility to weight gain in normal subjects.
The adopted imaging paradigm allows for indirect measures of synaptic DAlevels using a within-subject in-vivo design. This approach allows for an attenuation ofvariability attributed to comparisons between different animals. Also, unlike µdialysis,which provides indirect measures of extracellular DA levels, this approach is completelynon-invasive. Furthermore, since µPET imaging is reproducible animals can be scannedrepeatedly over a longitudinal timeframe in order to examine changes in synaptic DAlevels due to chronic effects of leptin administration. Another notable strength of thisapproach is the fact that we were able to discriminate between dorsal and ventral regionsof the striatum by combining the use of a sophisticated iterative reconstruction algorithmwith analysis procedures where µPET images were coregistered to a rodent MRI templateset in stereotaxic coordinates. This way we were able to approximate pixels to specificcoordinates that are routinely used for targeting these brain structures. Other notablestrengths have to do with the doses of leptin administered. Most published studies haveutilized supraphysiological leptin doses (in mg range), directly administering these to theCNS (this is a requirement for sufficient diffusion of the peptide through the brain to thetarget of interest). On the other hand, we used an administration approach that moreclosely resembles physiological circulating leptin concentrations (in µg range) as well asits action in the periphery (it is thought to be released in the periphery and transported tothe CNS). However, although this specific imaging paradigm has significant strengths,there are also some limitations of the approach that should be mentioned. First, there isno direct quantification of DA using this approach. Alternatively, changes in DA areinferred based upon [11C]raclopride dynamics. Although the short time-course of thespecific paradigm (imaging window of ~2 hours) accounts for discrepancies in[11C]raclopride due to leptin-induced changes in receptor density, we cannot exclude thenotion that [11C]raclopride dynamics may be influenced by other factors such as receptoraffinity and internalization. Another general experimental limitation is that there is noexamination of food seeking behavior or direct quantification of adiposity. In particular,ingestive behavior is characterized by various components (i.e. motivation to eat, seekingfood, consuming food, sensory aspects of feeding, etc.) and we cannot detail the exactinvolvement of leptin-DA interactions in such components using this specific approach.Future studies will focus on bridging the imaging data with a more thorough behavioralapproach that will also extend to cocaine seeking. Finally, our findings may apply toother peripheral messengers involved in metabolism (i.e. insulin) and therefore futurestudies should be aimed at examining associations between such peripheral messengersand central neurotransmitters involved in ingestive behavior. Nevertheless, given theabove findings, leptin-DA interactions relevant to feeding and drug addiction should beinvestigated further as well as in other contexts where DA has been traditionally believedto play a role in such as depression, attention-deficit hyperactivity disorder, Parkinson’sdisease and others.

63
Chapter 5
Summary and Conclusions
5.1 SummaryThis thesis presents evidence that inherent striatal DA-D2R signaling deficits
correlate with increased susceptibility to weight gain and cocaine preference. Thedeficits observed in the dorsal striatum strongly correlated to weight gain, while thoseobserved in the ventral striatum strongly correlated with cocaine preference. D2R werealso found to decrease in response to energy intake (high-fat diet) and cocaine intakesimilarly in both the dorsal and ventral striatum. Approaches that increase striatal D2Rsignaling were found to decrease feeding, adiposity and cocaine intake. Changes inD2R occur in response to changes in leptin signaling and were found to be context-dependent, in particular being affected by food availability, body weight and leptinresistance. Leptin was found to exert a biphasic effect on striatal DA-D2R signaling.In particular, lower doses increased DA-D2R signaling, while higher doses producedvariable effects on DA-D2R signaling. Finally, the variability in DA-D2R signalingattributed to leptin administration significantly correlated with weight gain but notcocaine preference.
5.2 ConclusionsThe experiments described in Chapter 2 show that ventral striatal D2R negatively
correlate with future cocaine preference, while dorsal striatal D2R do not. This suggeststhat D2R deficits previously observed in cocaine abusers may precede cocaine use andpotentially originate in the ventral striatum. Furthermore, these results suggest thatmeasuring D2R binding non-invasively through the use of PET imaging may be used topredict future cocaine abuse. The experiments described in this chapter also show thatcocaine intake leads to decreases in dorsal and ventral striatal D2R, while geneticupregulation of D2R in the ventral striatum decreases cocaine intake. These findingssuggest that striatal D2R play a significant role in cocaine abuse and in particular seem tobe involved in both the initiation as well as maintenance of cocaine abuse. Finally, theyare one of several likely factors involved in cocaine abuse since genetic upregulation of

64
D2R attenuated, but did not abolish cocaine intake. Future studies assessing the efficacyof more advanced gene therapy approaches should shed further light on the exact role ofD2R on cocaine intake.
Chapter 3 experiments focused on examining the involvement of striatal D2R inobesity and weight gain. These experiments showed that both dorsal and ventral striatalD2R negatively correlate with future weight gain, albeit this effect is stronger in thedorsal striatum. Like in relation to cocaine abuse, this result suggests that D2R deficitspreviously observed in obese individuals may precede the obesity. Furthermore, since thecorrelations effect was more pronounced in the dorsal striatum it seems that this regionmay play a significant role in mediating ingestive behavior and/or metabolism and weightgain, while ventral striatal D2R may be more involved in mediating the rewarding effectsof cocaine. Nevertheless, our results suggest that D2R binding using PET can be used asa measure to predict future weight gain susceptibility. Results from this chapter also showthat genetic and high-fat diet induced obesity both lead to similar declines in D2R. Inthese models of obesity, low leptin signaling was especially deemed important for theobserved D2R declines. Finally, in another recent study we showed that D2R stimulationimproved leptin signaling, decreased feeding and adiposity (Davis et al., 2009).
Finally, Chapter 4 experiments assessed whether peripheral leptin and centralD2R interact and whether this interaction is relevant in obesity and/or cocaine abuse.These experiments showed that peripheral administration of leptin at doses which inhibitfeeding lead to increases in D2R stimulation by DA ([11C]raclopride D2R bindingdeclined). This finding is consistent with findings from the literature that support lowtonic DA levels as leading to increased sensitivity or predisposition to consume food. Onthe other hand, higher leptin doses, similar to circulating leptin levels found in obesity,lead to variable effects on DA-D2R stimulation, with rats that gained the lowest futurebody weight showing increases in DA-D2R stimulation while those that gained the mostshowed decreases in DA-D2R stimulation. These effects were similar for both the dorsaland ventral striatum. Finally, this variability in DA-D2R stimulation by high leptin levelsdid not correlate with cocaine preference.
In sum, striatal D2R plays an important role in modulating responses to weightgain and cocaine preference. The above findings imply a novel role for D2R in regulatinghomeostasis via effects on peripheral homeostatic messengers like the adipose hormoneleptin. Finally, the experiments show that D2R may serve as both a promising target fordrugs aimed at obesity and addiction as well as a kind of biomarker to predict futuresusceptibility to obesity and substance abuse.
5.3 ImplicationsThis thesis argues that leptin, a peptide/hormone that conveys the status of
long-term energy (fat) stores in the body to the brain differentially modulates brainmechanisms that have been previously implicated in mediating the rewarding andmotivational properties involved in seeking and consuming food and drugs of abuse.These differential effects were found to depend on individual differences insusceptibility and resistance to weight gain but not cocaine preference. Under normal

65
physiological conditions, low leptin levels signal to the brain that energy stores areinadequate while high leptin levels indicate that energy requirements are met. Themain outcome that underlies the experimental findings described in this thesis is thatstriatal D2R mediate weight gain as well as cocaine preference and that this effectdepends in part on peripheral leptin concentrations. Consequently, leptin-responsivestriatal DA neurons may receive signals and initiate the goal-directed behaviorrequired for seeking food and increasing or decreasing adiposity but leptin’s effects oncocaine abuse may not be as strong. The direct interaction between an adiposity signalsuch as leptin and striatal D2R has not previously been investigated. Futureexperiments studying this relationship will lead to a better understanding of DA andD2R-related mechanisms in energy regulation and how these may be related tocompulsive behavior such as overeating and cocaine abuse. In turn, increasedunderstanding of such mechanisms may lead to drug treatments for obesity and drugaddiction.

66
Bibliography
Adam-Vizi, V. (1992) External Ca(2+)-independent release of neurotransmitters. JNeurochem, 58, 395-405.
Ahima, R.S. & Flier, J.S. (2000) Leptin. Annu Rev Physiol, 62, 413-437.
Baker, D.A., Fuchs, R.A., Specio, S.E., Khroyan, T.V. & Neisewander, J.L. (1998)Effects of intraaccumbens administration of SCH-23390 on cocaine- inducedlocomotion and conditioned place preference. Synapse, 30, 181-193.
Banks, W.A., Farr, S.A. & Morley, J.E. (2006) The effects of high fat diets on theblood-brain barrier transport of leptin: failure or adaptation? Physiol Behav,88, 244-248.
Barash, I.A., Cheung, C.C., Weigle, D.S., Ren, H., Kabigting, E.B., Kuijper, J.L.,Clifton, D.K. & Steiner, R.A. (1996) Leptin is a metabolic signal to thereproductive system. Endocrinology, 137, 3144-3147.
Barnes, M.J., Holmes, G., Primeaux, S.D., York, D.A. & Bray, G.A. (2006)Increased expression of mu opioid receptors in animals susceptible to diet-induced obesity. Peptides, 27, 3292-3298.
Barrett, A.C., Miller, J.R., Dohrmann, J.M. & Caine, S.B. (2004) Effects ofdopamine indirect agonists and selective D1-like and D2-like agonists andantagonists on cocaine self-administration and food maintained respondingin rats. Neuropharmacology, 47 Suppl 1, 256-273.
Baskin, D.G., Breininger, J.F., Bonigut, S. & Miller, M.A. (1999) Leptin binding inthe arcuate nucleus is increased during fasting. Brain Research, 828, 154-158.
Bassareo, V. & Di Chiara, G. (1999) Differential responsiveness of dopaminetransmission to food-stimuli in nucleus accumbens shell/core compartments.Neuroscience, 89, 637-641.
Bates, S. & Myers, M.J. (2003) The role of leptin signaling in feeding andneuroendocrine function. Trends in endocrinology and metabolism, 14, 447-452.

67
Beck, B., Max, J.P., Fernette, B. & Richy, S. (2004) Adaptation of ghrelin levels tolimit body weight gain in the obese Zucker rat. Biochem Biophys ResCommun, 318, 846-851.
Belin, D., Mar, A.C., Dalley, J.W., Robbins, T.W. & Everitt, B.J. (2008) Highimpulsivity predicts the switch to compulsive cocaine-taking. Science, 320,1352-1355.
Bell, S.M., Stewart, R.B., Thompson, S.C. & Meisch, R.A. (1997) Food-deprivationincreases cocaine-induced conditioned place preference and locomotoractivity in rats. Psychopharmacology (Berl), 131, 1-8.
Berridge, K.C. (1996) Food reward: brain substrates of wanting and liking.Neurosci Biobehav Rev, 20, 1-25.
Berridge, K.C. & Robinson, T.E. (1998) What is the role of dopamine in reward:hedonic impact, reward learning, or incentive salience? Brain Res Rev, 28,309-369.
Berthoud, H.R. & Morrison, C. (2008) The brain, appetite, and obesity. Annu RevPsychol, 59, 55-92.
Bolon, B. (2004) Genetically engineered animals in drug discovery and development:a maturing resource for toxicologic research. Basic Clin Pharmacol Toxicol,95, 154-161.
Bray, G.A. (1977) The Zucker-fatty rat: a review. Fed Proc, 36, 148-153.
Bray, G.A., Teague, R.J. & Lee, C.K. (1987) Brain uptake of ketones in rats withdiffering susceptibility to dietary obesity. Metabolism, 36, 27-30.
Brunetti, L., Michelotto, B., Orlando, G. & Vacca, M. (1999) Leptin inhibitsnorepinephrine and dopamine release from rat hypothalamic neuronalendings. Eur J Pharmacol, 372, 237-240.
Buka, S.L., Shenassa, E.D. & Niaura, R. (2003) Elevated risk of tobacco dependenceamong offspring of mothers who smoked during pregnancy: a 30-yearprospective study. Am J Psychiatry, 160, 1978-1984.
Bunzow, J.R., Van Tol, H.H., Grandy, D.K., Albert, P., Salon, J., Christie, M.,Machida, C.A., Neve, K.A. & Civelli, O. (1988) Cloning and expression of arat D2 dopamine receptor cDNA. Nature, 336, 783-787.

68
Caine, S.B., Negus, S.S., Mello, N.K., Patel, S., Bristow, L., Kulagowski, J., Vallone,D., Saiardi, A. & Borrelli, E. (2002) Role of dopamine D2-like receptors incocaine self-administration: studies with D2 receptor mutant mice and novelD2 receptor antagonists. J Neurosci, 22, 2977-2988.
Caine, S.B. & Ralph-Williams, R.J. (2002) Behavioral pharmacologists: Don't justsay "no" to knockout mice. Commentary on Stephens et al. 'Studying theneurobiology of stimulant and alcohol abuse and dependence in geneticallymanipulated mice'. Behavioral Pharmacology, 13, 349-352.
Campfield, L.A., Smith, F.J., Guisez, Y., Devos, R. & Burn, P. (1995) Recombinantmouse OB protein: evidence for a peripheral signal linking adiposity andcentral neural networks. Science, 269, 546-549.
Carelli, R.M., Ijames, S., Konstantopoulos, J. & Deadwyler, S.A. (1999)Examination of factors mediating the transition to behaviorally correlatednucleus accumbens cell firing during cocaine self- administration sessions inrats. Behav Brain Res, 104, 127-139.
Carr, K.D. (2007) Chronic food restriction: enhancing effects on drug reward andstriatal cell signaling. Physiol Behav, 91, 459-472.
Carr, K.D., Tsimberg, Y., Berman, Y. & Yamamoto, N. (2003) Evidence ofincreased dopamine receptor signaling in food-restricted rats. Neuroscience,119, 1157-1167.
Chang, J.Y., Sawyer, S.F., Lee, R.S. & Woodward, D.J. (1994) Electrophysiologicaland pharmacological evidence for the role of the nucleus accumbens incocaine self-administration in freely moving rats. J Neurosci, 14, 1224-1244.
Chausmer, A.L. & Katz, J.L. (2001) The role of D2-like dopamine receptors in thelocomotor stimulant effects of cocaine in mice. Psychopharmacology (Berl),155, 69-77.
Chua, S.J., Chung, W., Wu-Peng, S., Zhang, Y., Liu, S., Tartaglia, L. & Leibel, R.(1996) Phenotypes of Mouse diabetes and Rat fatty Due to Mutations in theOB (Leptin) Receptor. Science, 271, 994-996.
Comings, D.E. & Blum, K. (2000) Reward deficiency syndrome: genetic aspects ofbehavioral disorders. Prog Brain Res, 126, 325-341.
Considine, R.V., Sinha, M.K., Heiman, M.L., Kriauciunas, A., Stephens, T.W.,Nyce, M.R., Ohannesian, J.P., Marco, C.C., McKee, L.J., Bauer, T.L. & et al.(1996) Serum immunoreactive-leptin concentrations in normal-weight andobese humans. N Engl J Med, 334, 292-295.

69
Corrigall, W.A. & Coen, K.M. (1991) Cocaine self-administration is increased byboth D1 and D2 dopamine antagonists. Pharmacol Biochem Behav, 39, 799-802.
Corwin, R.L. & Hajnal, A. (2005) Too much of a good thing: neurobiology of non-homeostatic eating and drug abuse. Physiol Behav, 86, 5-8.
Dalley, J.W., Fryer, T.D., Brichard, L., Robinson, E.S., Theobald, D.E., Laane, K.,Pena, Y., Murphy, E.R., Shah, Y., Probst, K., Abakumova, I., Aigbirhio, F.I.,Richards, H.K., Hong, Y., Baron, J.C., Everitt, B.J. & Robbins, T.W. (2007)Nucleus accumbens D2/3 receptors predict trait impulsivity and cocainereinforcement. Science, 315, 1267-1270.
Davis, K.W., Wellman, P.J. & Clifford, P.S. (2007) Augmented cocaine conditionedplace preference in rats pretreated with systemic ghrelin. Regul Pept, 140,148-152.
Davis, L.M., Michaelides, M., Cheskin, L.J., Moran, T.H., Aja, S., Watkins, P.A.,Pei, Z., Contoreggi, C., McCullough, K., Hope, B., Wang, G.J., Volkow, N.D.& Thanos, P.K. (2009) Bromocriptine administration reduces hyperphagiaand adiposity and differentially affects dopamine D2 receptor andtransporter binding in leptin-receptor-deficient Zucker rats and rats withdiet-induced obesity. Neuroendocrinology, 89, 152-162.
Di Chiara, G., Acquas, E. & Carboni, E. (1992) Drug motivation and abuse: aneurobiological perspective. Ann. NY Acad. Sci., 654, 207-219.
Di Chiara, G. & Bassareo, V. (2007) Reward system and addiction: what dopaminedoes and doesn't do. Curr Opin Pharmacol, 7, 69-76.
Di Chiara, G. & Imperato, A. (1988) Drugs abused by humans preferentiallyincrease synaptic dopamine concentrations in the mesolimbic system of freelymoving rats. Proc Natl Acad Sci U S A, 85, 5274-5278.
Dias, F.R., Carey, R.J. & Carrera, M.P. (2006) Conditioned locomotion induced byunilateral intrastriatal administration of apomorphine: D(2) receptoractivation is critical but not the expression of the unconditioned response.Brain Res, 1083, 85-95.
DiLeone, R.J. (2009) The influence of leptin on the dopamine system andimplications for ingestive behavior. Int J Obes (Lond), 33 Suppl 2, S25-29.
Elias, C.F., Aschkenasi, C., Lee, C., Kelly, J., Ahima, R.S., Bjorbaek, C., Flier, J.S.,Saper, C.B. & Elmquist, J.K. (1999) Leptin differentially regulates NPY and
70
POMC neurons projecting to the lateral hypothalamic area. Neuron, 23, 775-786.
Epstein, L.H., Leddy, J.J., Temple, J.L. & Faith, M.S. (2007) Food reinforcementand eating: a multilevel analysis. Psychol Bull, 133, 884-906.
Erlanson-Albertsson, C. & Zetterstrom, R. (2005) The global obesity epidemic:snacking and obesity may start with free meals during infant feeding. ActaPaediatr, 94, 1523-1531.
Faleiro, M.L., Andrew, P.W. & Power, D. (2003) Stress response of Listeriamonocytogenes isolated from cheese and other foods. Int J Food Microbiol,84, 207-216.
Farooqi, I.S. (2008) Monogenic human obesity. Front Horm Res, 36, 1-11.
Fenu, S., Bassareo, V. & Di Chiara, G. (2001) A role for dopamine D1 receptors ofthe nucleus accumbens shell in conditioned taste aversion learning. JNeurosci, 21, 6897-6904.
Fenu, S. & Di Chiara, G. (2003) Facilitation of conditioned taste aversion learningby systemic amphetamine: role of nucleus accumbens shell dopamine D1receptors. Eur J Neurosci, 18, 2025-2030.
Fetissov, S.O., Meguid, M.M., Sato, T. & Zhang, L.H. (2002) Expression ofdopaminergic receptors in the hypothalamus of lean and obese Zucker ratsand food intake. Am J Physiol Regul Integr Comp Physiol, 283, R905-910.
Fetissov, S.O., Meguid, M.M., Shafiroff, M., Miyata, G. & Torelli, G.F. (2000)Dopamine in the VMN of the Hypothalamus is Important for DiurnalDistribution of Eating in Obese Male Zucker Rats. Nutrition, 16, 65-66.
Figlewicz, D.P. & Benoit, S.C. (2009) Insulin, leptin, and food reward: update 2008.Am J Physiol Regul Integr Comp Physiol, 296, R9-R19.
Figlewicz, D.P., Evans, S.B., Murphy, J., Hoen, M. & Baskin, D.G. (2003)Expression of receptors for insulin and leptin in the ventral tegmentalarea/substantia nigra (VTA/SN) of the rat. Brain Res, 964, 107-115.
Figlewicz, D.P., Higgins, M.S., Ng-Evans, S.B. & Havel, P.J. (2001) Leptin reversessucrose-conditioned place preference in food-restricted rats. Physiol Behav,73, 229-234.
Figlewicz, D.P., MacDonald Naleid, A. & Sipols, A.J. (2007) Modulation of foodreward by adiposity signals. Physiol Behav, 91, 473-478.

71
Figlewicz, D.P., Patterson, T.A., Johnson, L.B., Zavosh, A., Israel, P.A. & Szot, P.(1998) Dopamine transporter mRNA is increased in the CNS of Zucker fatty(fa/fa) rats. Brain Res Bull, 46, 199-202.
Fisler, J.S., Underberger, S.J., York, D.A. & Bray, G.A. (1993) d-fenfluramine in arat model of dietary fat-induced obesity. Pharmacol Biochem Behav, 45, 487-493.
Flegal, C., Ogden, Johnson. (2002) Prevalence and trends in obesity among USadults, 1999-2000. Journal of the American Medical Association, 288, 1723-1727.
Flegal, K.M., Carroll, M.D., Ogden, C.L. & Curtin, L.R. (2010) Prevalence andtrends in obesity among US adults, 1999-2008. Jama, 303, 235-241.
Fourgeaud, L., Mato, S., Bouchet, D., Hemar, A., Worley, P.F. & Manzoni, O.J.(2004) A single in vivo exposure to cocaine abolishes endocannabinoid-mediated long-term depression in the nucleus accumbens. J Neurosci, 24,6939-6945.
Fowler, J.S., Volkow, N.D., Wang, G.J., Gatley, S.J. & Logan, J. (2001)[(11)]Cocaine: PET studies of cocaine pharmacokinetics, dopaminetransporter availability and dopamine transporter occupancy. Nucl MedBiol, 28, 561-572.
Frank, G.K., Bailer, U.F., Henry, S.E., Drevets, W., Meltzer, C.C., Price, J.C.,Mathis, C.A., Wagner, A., Hoge, J., Ziolko, S., Barbarich-Marsteller, N.,Weissfeld, L. & Kaye, W.H. (2005) Increased dopamine D2/D3 receptorbinding after recovery from anorexia nervosa measured by positron emissiontomography and [11c]raclopride. Biol Psychiatry, 58, 908-912.
Friedman, J. (2004) Modern science versus the stigma of obesity. Nat Med, 10, 563-569.
Fukuyama, H., Hayashi, T., Katsumi, Y., Tsukada, H. & Shibasaki, H. (1998) Issuesin measuring glucose metabolism of rat brain using PET: the effect ofharderian glands on the frontal lobe. Neurosci Lett, 255, 99-102.
Fulton, S., Pissios, P., Manchon, R.P., Stiles, L., Frank, L., Pothos, E.N., Maratos-Flier, E. & Flier, J.S. (2006) Leptin regulation of the mesoaccumbensdopamine pathway. Neuron, 51, 811-822.
Fulton, S., Woodside, B. & Shizgal, P. (2000) Modulation of brain reward circuitryby leptin. Science, 287, 125-128.

72
Gainetdinov, R.R., Jones, S.R. & Caron, M.G. (1999) Functionalhyperdopaminergia in dopamine transporter knock-out mice. BiolPsychiatry, 46, 303-311.
Gambarana, C., Masi, F., Leggio, B., Grappi, S., Nanni, G., Scheggi, S., De Montis,M.G. & Tagliamonte, A. (2003) Acquisition of a palatable-food-sustainedappetitive behavior in satiated rats is dependent on the dopaminergicresponse to this food in limbic areas. Neuroscience, 121, 179-187.
Geiger, B.M., Behr, G.G., Frank, L.E., Caldera-Siu, A.D., Beinfeld, M.C.,Kokkotou, E.G. & Pothos, E.N. (2008) Evidence for defective mesolimbicdopamine exocytosis in obesity-prone rats. Faseb J, 22, 2740-2746.
Gelernter, J., Goldman, D. & Risch, N. (1993) The A1 allele at the D2 dopaminereceptor gene and alcoholism. A reappraisal. Jama, 269, 1673-1677.
Gerrits, M.A., Petromilli, P., Westenberg, H.G., Di Chiara, G. & van Ree, J.M.(2002) Decrease in basal dopamine levels in the nucleus accumbens shellduring daily drug-seeking behaviour in rats. Brain Res, 924, 141-150.
Getchell, T.V., Kwong, K., Saunders, C.P., Stromberg, A.J. & Getchell, M.L. (2006)Leptin regulates olfactory-mediated behavior in ob/ob mice. Physiol Behav,87, 848-856.
Gilbertson, T.A., Liu, L., Kim, I., Burks, C.A. & Hansen, D.R. (2005) Fatty acidresponses in taste cells from obesity-prone and -resistant rats. Physiol Behav,86, 681-690.
Giros, B., Jaber, M., Jones, S.R., Wightman, R.M. & Caron, M.G. (1996)Hyperlocomotion and indifference to cocaine and amphetamine in micelacking the dopamine transporter. Nature, 379, 606-612.
Gruaz, N.M., Lalaoui, M., Pierroz, D.D., Englaro, P., Sizonenko, P.C., Blum, W.F.& Aubert, M.L. (1998) Chronic administration of leptin into the lateralventricle induces sexual maturation in severely food-restricted female rats. JNeuroendocrinol, 10, 627-633.
Hagan, M., Havel, P., Seeley, R., Woods, S., Ekhator, N., Baker, D., Hill, K.,Wortman, M., Miller, A., Gingerich, R. & Geracioti, T. (1999) Cerebrospinalfluid and plasma leptin measurements: covariability with dopamine andcortisol in fasting humans. Journal of Clinical Endocrinology andMetabolism, 84, 3579-3585.

73
Hajnal, A., Margas, W.M. & Covasa, M. (2008) Altered dopamine D2 receptorfunction and binding in obese OLETF rat. Brain Res Bull, 75, 70-76.
Hakansson, M.L. & Meister, B. (1998) Transcription factor STAT3 in leptin targetneurons of the rat hypothalamus. Neuroendocrinology, 68, 420-427.
Halaas, J.L., Gajiwala, K.S., Maffei, M., Cohen, S.L., Chait, B.T., Rabinowitz, D.,Lallone, R.L., Burley, S.K. & Friedman, J.M. (1995) Weight-reducing effectsof the plasma protein encoded by the obese gene. Science, 269, 543-546.
Hamdi, A., Porter, J. & Prasad, C. (1992) Decreased striatal D2 dopamine receptorsin obese Zucker rats: changes during aging. Brain Res, 589, 338-340.
Harris, R.B., Zhou, J., Redmann, S.M., Jr., Smagin, G.N., Smith, S.R., Rodgers, E.& Zachwieja, J.J. (1998) A leptin dose-response study in obese (ob/ob) andlean (+/?) mice. Endocrinology, 139, 8-19.
Hernandez, L. & Hoebel, B.G. (1988) Feeding and hypothalamic stimulationincrease dopamine turnover in the accumbens. Physiol Behav, 44, 599-606.
Hernandez, L. & Hoebel, B.G. (1990) Feeding can enhance dopamine turnover inthe prefrontal cortex. Brain Res Bull, 25, 975-979.
Hill, J.O., Wyatt, H.R., Reed, G.W. & Peters, J.C. (2003) Obesity and theenvironment: where do we go from here? Science, 299, 853-855.
Hnasko, T.S., Szczypka, M.S., Alaynick, W.A., During, M.J. & Palmiter, R.D. (2004)A role for dopamine in feeding responses produced by orexigenic agents.Brain Res, 1023, 309-318.
Hommel, J.D., Trinko, R., Sears, R.M., Georgescu, D., Liu, Z.W., Gao, X.B.,Thurmon, J.J., Marinelli, M. & DiLeone, R.J. (2006) Leptin receptorsignaling in midbrain dopamine neurons regulates feeding. Neuron, 51, 801-810.
Huang, X.F., Zavitsanou, K., Huang, X., Yu, Y., Wang, H., Chen, F., Lawrence, A.J.& Deng, C. (2006) Dopamine transporter and D2 receptor binding densitiesin mice prone or resistant to chronic high fat diet-induced obesity. BehavBrain Res, 175, 415-419.
Hubner, C.B. & Moreton, E.J. (1991) Effects of Selective D1 and D2 DopamineAntagonists on Cocaine Self-Administration in the Rat.Psychopharmacology, 105, 151-156.

74
Hume, S.P., Lammertsma, A.A., Myers, R., Rajeswaran, S., Bloomfield, P.M.,Ashworth, S., Fricker, R.A., Torres, E.M., Watson, C. & Jones, T. (1996) Thepotential of High-resolution Positron Emission Tomography to monitorstriatal dopaminergic function in rat models of disease. J Neurosci Methods,67, 103-112.
Hwa, J.J., Fawzi, A.B., Graziano, M.P., Ghibaudi, L., Williams, P., Van Heek, M.,Davis, H., Rudinski, M., Sybertz, E. & Strader, C.D. (1997) Leptin increasesenergy expenditure and selectively promotes fat metabolism in ob/ob mice.Am J Physiol, 272, R1204-1209.
Ichise, M., Liow, J.S., Lu, J.Q., Takano, A., Model, K., Toyama, H., Suhara, T.,Suzuki, K., Innis, R.B. & Carson, R.E. (2003) Linearized reference tissueparametric imaging methods: application to [11C]DASB positron emissiontomography studies of the serotonin transporter in human brain. J CerebBlood Flow Metab, 23, 1096-1112.
Ikari, H., Zhang, L., Chernak, J., Mastrangeli, A., Kato, S., Kuo, H., Crystal, R.,Ingram, D. & Roth, G. (1995) Adenovirus-mediated gene transfer ofdopamine D2 receptor cDNA into rat striatum. Brain Res Mol Brain Res, 34,315-320.
Ingram, D., Ikari, H., Umegaki, H., Chernak, J. & Roth, G. (1998) Application ofgene therapy to treat age-related loss of dopamine D2 receptor. ExpGerontol, 33, 793-804.
Ingram, D.K., Chefer, S., Matochik, J., Moscrip, T.D., Weed, J., Roth, G.S.,London, E.D. & Lane, M.A. (2001) Aging and caloric restriction innonhuman primates: behavioral and in vivo brain imaging studies. Ann N YAcad Sci, 928, 316-326.
Isasi, C.R., Soroudi, N. & Wylie-Rosett, J. (2006) Youth WAVE Screener:addressing weight-related behaviors with school-age children. Diabetes Educ,32, 415-422.
Ishihara, Y., White, C.L., Kageyama, H., Kageyama, A., York, D.A. & Bray, G.A.(2004) Effects of diet and time of the day on serum and CSF leptin levels inOsborne-Mendel and S5B/Pl rats. Obes Res, 12, 1067-1076.
Jenner, P. (2003) Dopamine agonists, receptor selectivity and dyskinesia inductionin Parkinson's disease. Curr Opin Neurol, 16 Suppl 1, S3-7.
Koob, G., Vaccarino, F.G., Amalric, M. & Bloom, F.E. (1987) Positivereinforcement properties of drugs: search for neural substrates, in BrainReward Systems and Abuse. Raven Press, New York.

75
Krugel, U., Schraft, T., Kittner, H., Kiess, W. & Illes, P. (2003) Basal and feeding-evoked dopamine release in the rat nucleus accumbens is depressed by leptin.Eur J Pharmacol, 482, 185-187.
Kuge, Y., Minematsu, K., Hasegawa, Y., Yamaguchi, T., Mori, H., Matsuura, H.,Hashimoto, N. & Miyake, Y. (1997) Positron emission tomography forquantitative determination of glucose metabolism in normal and ischemicbrains in rats: an insoluble problem by the Harderian glands. J Cereb BloodFlow Metab, 17, 116-120.
Laforest, R., Sharp, T.L., Engelbach, J.A., Fettig, N.M., Herrero, P., Kim, J., Lewis,J.S., Rowland, D.J., Tai, Y.C. & Welch, M.J. (2005) Measurement of inputfunctions in rodents: challenges and solutions. Nucl Med Biol, 32, 679-685.
Langlois, X., te Riele, P., Wintmolders, C., Leysen, J.E. & Jurzak, M. (2001) Use ofthe beta-imager for rapid ex vivo autoradiography exemplified with centralnervous system penetrating neurokinin 3 antagonists. J Pharmacol ExpTher, 299, 712-717.
Larson, E.B. & Carroll, M.E. (2005) Wheel running as a predictor of cocaine self-administration and reinstatement in female rats. Pharmacol Biochem Behav,82, 590-600.
Laruelle, M. (2000) Imaging synaptic neurotransmission with in vivo bindingcompetition techniques: a critical review. J Cereb Blood Flow Metab, 20,423-451.
Laruelle, M., Gelernter, J. & Innis, R.B. (1998) D2 receptors binding potential is notaffected by Taq1 polymorphism at the D2 receptor gene. Mol Psychiatry, 3,261-265.
Laurier, L.G., Corrigall, W.A. & George, S.R. (1994) Dopamine Receptor Density,Sensitivity and mRNA Levels are Altered Following Self-Administration ofCocaine in the Rat. Brain Research, 634, 31-40.
Levi, G. & Raiteri, M. (1993) Carrier-mediated release of neurotransmitters.Trends Neurosci, 16, 415-419.
Li, C. & Friedman, J.M. (1999) Leptin receptor activation of SH2 domaincontaining protein tyrosine phosphatase 2 modulates Ob receptor signaltransduction. Proc Natl Acad Sci U S A, 96, 9677-9682.

76
Liang, N.C., Hajnal, A. & Norgren, R. (2006) Sham feeding corn oil increasesaccumbens dopamine in the rat. Am J Physiol Regul Integr Comp Physiol,291, R1236-1239.
Lin, L., Martin, R., Schaffhauser, A.O. & York, D.A. (2001) Acute changes in theresponse to peripheral leptin with alteration in the diet composition. Am JPhysiol Regul Integr Comp Physiol, 280, R504-509.
Madiehe, A.M., Schaffhauser, A.O., Braymer, D.H., Bray, G.A. & York, D.A. (2000)Differential expression of leptin receptor in high- and low-fat-fed Osborne-Mendel and S5B/Pl rats. Obes Res, 8, 467-474.
Maffei, M., Halaas, J., Ravussin, E., Pratley, R.E., Lee, G.H., Zhang, Y., Fei, H.,Kim, S., Lallone, R., Ranganathan, S. & et al. (1995) Leptin levels in humanand rodent: measurement of plasma leptin and ob RNA in obese and weight-reduced subjects. Nat Med, 1, 1155-1161.
Margetic, S., Gazzola, C., Pegg, G.G. & Hill, R.A. (2002) Leptin: a review of itsperipheral actions and interactions. Int J Obes Relat Metab Disord, 26, 1407-1433.
Matej, S., Karp, J.S., Lewitt, R.M. & Becher, A.J. (1998) Performance of theFourier rebinning algorithm for PET with large acceptance angles. PhysMed Biol, 43, 787-795.
McBride, W.J., Chernet, E., Russell, R.N., Chamberlain, J.K., Lumeng, L. & Li,T.K. (1997) Regional CNS densities of serotonin and dopamine receptors inhigh alcohol-drinking (HAD) and low alcohol-drinking (LAD) rats. Alcohol,14, 603-609.
McBride, W.J., Murphy, J.M., Gatto, G.J., Levy, A.D., Yoshimoto, K., Lumeng, L.& Li, T.K. (1993) CNS Mechanisms of Alcohol Self-Administration. AlcoholAlcohol, 2, 461-467.
McClure, S.M., Daw, N.D. & Montague, P.R. (2003) A computational substrate forincentive salience. Trends Neurosci, 26, 423-428.
McQuade, J.A., Benoit, S.C., Xu, M., Woods, S.C. & Seeley, R.J. (2004) High-fatdiet induced adiposity in mice with targeted disruption of the dopamine-3receptor gene. Behav Brain Res, 151, 313-319.
Meguid, M.M., Fetissov, S.O., Blaha, V. & Yang, Z.J. (2000) Dopamine andserotonin VMN release is related to feeding status in obese and lean Zuckerrats. Neuroreport, 11, 2069-2072.

77
Mennella, J.A., Griffin, C.E. & Beauchamp, G.K. (2004) Flavor programmingduring infancy. Pediatrics, 113, 840-845.
Michaelides, M., Zong, H., Kurland, I., Pessin, J., Wang, G., Thanos, P. & Volkow,N. (2006) Peripheral Hormone Concentrations and Food Intake Regulationin Obese (fa/fa) (Ob) and Lean (Le) Zucker Rats under Different FeedingRegiments Obesity, 14 A131.
Miklya, I., Knoll, B. & Knoll, J. (2003) An HPLC tracing of the enhancer regulationin selected discrete brain areas of food-deprived rats. Life Sci, 72, 2923-2930.
Mokdad, A.H., Marks, J.S., Stroup, D.F. & Gerberding, J.L. (2004) Actual causes ofdeath in the United States, 2000. Jama, 291, 1238-1245.
Mokdad, A.H., Serdula, M.K., Dietz, W.H., Bowman, B.A., Marks, J.S. & Koplan,J.P. (2000) The continuing epidemic of obesity in the United States. Jama,284, 1650-1651.
Morris, E.D. & Yoder, K.K. (2007) Positron emission tomography displacementsensitivity: predicting binding potential change for positron emissiontomography tracers based on their kinetic characteristics. J Cereb BloodFlow Metab, 27, 606-617.
Morrison, C.D. (2009) Leptin signaling in brain: A link between nutrition andcognition? Biochim Biophys Acta, 1792, 401-408.
Mortensen, O.V. & Amara, S.G. (2003) Dynamic regulation of the dopaminetransporter. Eur J Pharmacol, 479, 159-170.
Munzberg, H., Huo, L., Nillni, E.A., Hollenberg, A.N. & Bjorbaek, C. (2003) Role ofsignal transducer and activator of transcription 3 in regulation ofhypothalamic proopiomelanocortin gene expression by leptin.Endocrinology, 144, 2121-2131.
Mutch, D.M. & Clement, K. (2006) Unraveling the genetics of human obesity. PLoSGenet, 2, e188.
Nader, M.A., Czoty, P.W., Gould, R.W. & Riddick, N.V. (2008) Review. Positronemission tomography imaging studies of dopamine receptors in primatemodels of addiction. Philos Trans R Soc Lond B Biol Sci, 363, 3223-3232.
Nader, M.A., Morgan, D., Gage, H.D., Nader, S.H., Calhoun, T.L., Buchheimer, N.,Ehrenkaufer, R. & Mach, R.H. (2006) PET imaging of dopamine D2receptors during chronic cocaine self-administration in monkeys. NatNeurosci, 9, 1050-1056.

78
Nagase, H., Bray, G.A. & York, D.A. (1996) Pyruvate and hepatic pyruvatedehydrogenase levels in rat strains sensitive and resistant to dietary obesity.American Journal of Physiology- Regulatory, Integrative and ComparativePhysiology, 270, 489-495.
NAS & NRC (1996) Guide for the Care and Use of Laboratory Animals. NationalAcademy Press, Washington D.C.
Nicola, S. & Deadwyler, S. (2000) Firing Rate of Nucleus Accumbens Neurons isDopamine-dependent and Reflects the Timing of Cocaine-seeking Behaviorin Rats on a Progressive Ration Schedule of Reinforcement. The Journal ofNeuroscience, 20, 5526-5537.
Niswender, K.D., Morton, G.J., Stearns, W.H., Rhodes, C.J., Myers, M.G., Jr. &Schwartz, M.W. (2001) Intracellular signalling. Key enzyme in leptin-induced anorexia. Nature, 413, 794-795.
Noble, E.P. (2000) Addiction and its reward process through polymorphisms of theD2 dopamine receptor gene: a review. Eur Psychiatry, 15, 79-89.
Noble, E.P. (2003) D2 dopamine receptor gene in psychiatric and neurologicdisorders and its phenotypes. Am J Med Genet B Neuropsychiatr Genet, 116,103-125.
Noble, E.P., Blum, K., Khalsa, M.E., Ritchie, T., Montgomery, A., Wood, R.C.,Fitch, R.J., Ozkaragoz, T., Sheridan, P.J., Anglin, M.D. & et al. (1993) Allelicassociation of the D2 dopamine receptor gene with cocaine dependence. DrugAlcohol Depend, 33, 271-285.
Noble, E.P., Noble, R.E., Ritchie, T., Syndulko, K., Bohlman, M.C., Noble, L.A.,Zhang, Y., Sparkes, R.S. & Grandy, D.K. (1994) D2 dopamine receptor geneand obesity. Int J Eat Disord, 15, 205-217.
Ogden, C.L., Carroll, M.D., Curtin, L.R., Lamb, M.M. & Flegal, K.M. (2010)Prevalence of high body mass index in US children and adolescents, 2007-2008. Jama, 303, 242-249.
Orosco, M., Rouch, C., Gripois, D., Blouquit, M.F., Roffi, J., Jacquot, C. & Cohen,Y. (1992) Striatal dopamine metabolism is differentially affected by insulinaccording to the genotype in Zucker rats: a microdialysis study.Psychoneuroendocrinology, 17, 443-452.

79
Orosco, M., Rouch, C., Meile, M. & Nicolaidis, S. (1995) Spontaneous feeding-related monoamine changes in rostromedial hypothalamus of the obeseZucker rat: a microdialysis study. Physiol Behav, 57, 1103-1106.
Orosco, M., Trouvin, J.H., Cohen, Y. & Jacquot, C. (1986) Ontogeny of brainmonoamines in lean and obese female Zucker rats. Physiol Behav, 36, 853-856.
Ostlund, R.E., Jr., Yang, J.W., Klein, S. & Gingerich, R. (1996) Relation betweenplasma leptin concentration and body fat, gender, diet, age, and metaboliccovariates. J Clin Endocrinol Metab, 81, 3909-3913.
Owens, W.A., Sevak, R.J., Galici, R., Chang, X., Javors, M.A., Galli, A., France,C.P. & Daws, L.C. (2005) Deficits in dopamine clearance and locomotion inhypoinsulinemic rats unmask novel modulation of dopamine transporters byamphetamine. J Neurochem, 94, 1402-1410.
Patterson, T.A., Brot, M.D., Zavosh, A., Schenk, J.O., Szot, P. & Figlewicz, D.P.(1998) Food deprivation decreases mRNA and activity of the rat dopaminetransporter. Neuroendocrinology, 68, 11-20.
Paxinos, G. & Watson, C. (1986) The Rat Brain in Sterotaxic Coordinates.Academic Press, New York.
Petrescu, O., Cheema, A.F., Fan, X., Bradbury, M.W. & Berk, P.D. (2008)Differences in adipocyte long chain fatty acid uptake in Osborne-Mendel andS5B/Pl rats in response to high-fat diets. Int J Obes (Lond), 32, 853-862.
Pfaffly, J., Michaelides, M., Wang, G.J., Pessin, J.E., Volkow, N.D. & Thanos, P.K.(2010) Leptin increases striatal dopamine D2 receptor binding in leptin-deficient obese (ob/ob) mice. Synapse, 64, 503-510.
Phillips, P.E., Walton, M.E. & Jhou, T.C. (2007) Calculating utility: preclinicalevidence for cost-benefit analysis by mesolimbic dopamine.Psychopharmacology (Berl), 191, 483-495.
Pierce, R.C. & Kumaresan, V. (2006) The mesolimbic dopamine system: the finalcommon pathway for the reinforcing effect of drugs of abuse? NeurosciBiobehav Rev, 30, 215-238.
Pijl, H. (2003) Reduced dopaminergic tone in hypothalamic neural circuits:expression of a "thrifty" genotype underlying the metabolic syndrome? EurJ Pharmacol, 480, 125-131.

80
Pohjalainen, T., Rinne, J.O., Nagren, K., Lehikoinen, P., Anttila, K., Syvalahti, E.K.& Hietala, J. (1998) The A1 allele of the human D2 dopamine receptor genepredicts low D2 receptor availability in healthy volunteers. Mol Psychiatry,3, 256-260.
Pothos, E.N., Creese, I. & Hoebel, B.G. (1995a) Restricted eating with weight lossselectively decreases extracellular dopamine in the nucleus accumbens andalters dopamine response to amphetamine, morphine, and food intake. JNeurosci, 15, 6640-6650.
Pothos, E.N., Davila, V. & Sulzer, D. (1998a) Presynaptic recording of quanta frommidbrain dopamine neurons and modulation of the quantal size. J Neurosci,18, 4106-4118.
Pothos, E.N., Hernandez, L. & Hoebel, B.G. (1995b) Chronic food deprivationdecreases extracellular dopamine in the nucleus accumbens: implications fora possible neurochemical link between weight loss and drug abuse. Obes Res,3 Suppl 4, 525S-529S.
Pothos, E.N., Sulzer, D. & Hoebel, B.G. (1998b) Plasticity of quantal size in ventralmidbrain dopamine neurons: possible implications for the neurochemistry offeeding and reward. Appetite, 31, 405.
Ranaldi, R., Wang, Z. & Woolverton, W.L. (2001) Reinforcing effects of D2dopamine receptor agonists and partial agonists in rhesus monkeys. DrugAlcohol Depend, 64, 209-217.
Risinger, F.O., Freeman, P.A., Rubinstein, M., Low, M.J. & Grandy, D.K. (2000)Lack of operant ethanol self-administration in dopamine D2 receptorknockout mice. Psychopharmacology (Berl), 152, 343-350.
Ritz, M.C., Lamb, R.J., Goldberg, S.R. & Kuhar, M.J. (1987) Cocaine receptors ondopamine transporters are related to self-administration of cocaine. Science,237, 1219-1223.
Roseberry, A.G., Painter, T., Mark, G.P. & Williams, J.T. (2007) Decreasedvesicular somatodendritic dopamine stores in leptin-deficient mice. JNeurosci, 27, 7021-7027.
Rouge-Pont, F., Usiello, A., Benoit-Marand, M., Gonon, F., Piazza, P.V. & Borrelli,E. (2002) Changes in extracellular dopamine induced by morphine andcocaine: crucial control by D2 receptors. J Neurosci, 22, 3293-3301.

81
Saal, D., Dong, Y., Bonci, A. & Malenka, R.C. (2003) Drugs of abuse and stresstrigger a common synaptic adaptation in dopamine neurons. Neuron, 37,577-582.
Sahu, A. (2003) Leptin signaling in the hypothalamus: emphasis on energyhomeostasis and leptin resistance. Front Neuroendocrinol, 24, 225-253.
Sakaguchi, T., Arase, K., Fisler, J.S. & Bray, G.A. (1988) Effect of starvation andfood intake on sympathetic activity. Am J Physiol, 255, R284-288.
SAMHSA (2005) Results from the 2005 National Survey on Drug Use and Health:National Findings SAMHSA. Substance Abuse and Mental Health ServicesAdministration, Rockville, MD.
SAMHSA (2008) Results from the 2007 National Survey on Drug Use and Health:National Findings. (Office of Applied Studies, NSDUH Series H-34, DHHSPublication No. SMA 08-4343), Rockville, MD.
Schaffhauser, A.O., Madiehe, A.M., Braymer, H.D., Bray, G.A. & York, D.A. (2002)Effects of a high-fat diet and strain on hypothalamic gene expression in rats.Obes Res, 10, 1188-1196.
Schemmel, R., Mickelsen, O. & Gill, J.L. (1970) Dietary obesity in rats: Body weightand body fat accretion in seven strains of rats. J Nutr, 100, 1041-1048.
Schiffer, W.K., Liebling, C.N., Reiszel, C., Hooker, J.M., Brodie, J.D. & Dewey, S.L.(2009) Cue-induced dopamine release predicts cocaine preference: positronemission tomography studies in freely moving rodents. J Neurosci, 29, 6176-6185.
Schultz, W., Tremblay, L. & Hollerman, J.R. (2000) Reward processing in primateorbitofrontal cortex and basal ganglia. Cereb Cortex, 10, 272-284.
Sery, O., Vojtova, V. & Zvolsky, P. (2001) The association study of DRD2, ACE andAGT gene polymorphisms and metamphetamine dependence. Physiol Res,50, 43-50.
Sevak, R.J., Koek, W., Galli, A. & France, C.P. (2007) Insulin replacement restoresthe behavioral effects of quinpirole and raclopride in streptozotocin-treatedrats. J Pharmacol Exp Ther, 320, 1216-1223.
Shalev, U., Yap, J. & Shaham, Y. (2001) Leptin attenuates acute food deprivation-induced relapse to heroin seeking. J Neurosci, 21, RC129.

82
Shimabukuro, M., Koyama, K., Chen, G., Wang, M.Y., Trieu, F., Lee, Y., Newgard,C.B. & Unger, R.H. (1997) Direct antidiabetic effect of leptin throughtriglyceride depletion of tissues. Proc Natl Acad Sci U S A, 94, 4637-4641.
Shimizu, H., Fisler, S. & Bray, G.A. (1994) Extracellular hypothalamic monoaminesmeasured by in vivo microdialysis in a rat model of dietary fat-inducedobesity. Obes Res, 2, 100-109.
Shimizu, H., Shimomura, Y., Takahashi, M., Uehara, Y., Fukatsu, A. & Sato, N.(1991) Altered ambulatory activity and related brain monoamine metabolismin genetically obese Zucker rats. Exp Clin Endocrinol, 97, 39-44.
Simon, G.E., Von Korff, M., Saunders, K., Miglioretti, D.L., Crane, P.K., van Belle,G. & Kessler, R.C. (2006) Association between obesity and psychiatricdisorders in the US adult population. Arch Gen Psychiatry, 63, 824-830.
Small, D.M., Jones-Gotman, M. & Dagher, A. (2003) Feeding-induced dopaminerelease in dorsal striatum correlates with meal pleasantness ratings inhealthy human volunteers. Neuroimage, 19, 1709-1715.
Sora, I., Wichems, C., Takahashi, N., Li, X.F., Zeng, Z., Revay, R., Lesch, K.P.,Murphy, D.L. & Uhl, G.R. (1998) Cocaine reward models: conditioned placepreference can be established in dopamine- and in serotonin-transporterknockout mice. Proc Natl Acad Sci U S A, 95, 7699-7704.
South, T. & Huang, X.F. (2008) High-fat diet exposure increases dopamine D2receptor and decreases dopamine transporter receptor binding density in thenucleus accumbens and caudate putamen of mice. Neurochem Res, 33, 598-605.
Steketee, J.D. (2005) Cortical mechanisms of cocaine sensitization. Crit RevNeurobiol, 17, 69-86.
Strubbe, J.H. & Woods, S.C. (2004) The timing of meals. Psychol Rev, 111, 128-141.
Szczypka, M.S., Rainey, M.A. & Palmiter, R.D. (2000) Dopamine is required forhyperphagia in Lep(ob/ob) mice. Nat Genet, 25, 102-104.
Tarazi, F.I., Tomasini, E.C. & Baldessarini, R.J. (1999) Postnatal development ofdopamine D1-like receptors in rat cortical and striatolimbic brain regions:An autoradiographic study. Dev Neurosci, 21, 43-49.
Thanos, P., Bermeo, C., Rubinstein, M., Suchland, K., Wang, G., Grandy, D. &Volkow, N. (2009) Conditioned place preference and locomotor activity in

83
response to methylphenidate, amphetamine and cocaine in mice lackingdopamine D4 receptors. J Psychopharmacol.
Thanos, P., Michaelides, M., Piyis, Y., Wang, G. & Volkow, N. (2008) Foodrestriction markedly increases dopamine D2 receptor (D2R) in a rat model ofobesity as assessed with in-vivo muPET imaging ([(11)C] raclopride) and in-vitro ([(3)H] spiperone) autoradiography. Synapse, 62, 50-61.
Thanos, P.K., Michaelides, M., Benveniste, H., Wang, G.J. & Volkow, N.D. (2007)Effects of chronic oral methylphenidate on cocaine self-administration andstriatal dopamine D2 receptors in rodents. Pharmacol Biochem Behav, 87,426-433.
Thanos, P.K., Rivera, S.N., Weaver, K., Grandy, D.K., Rubinstein, M., Umegaki, H.,Wang, G.J., Hitzemann, R. & Volkow, N.D. (2005) Dopamine D2R DNAtransfer in dopamine D2 receptor-deficient mice: effects on ethanol drinking.Life Sci, 77, 130-139.
Thanos, P.K., Taintor, N.B., Alexoff, D., Vaska, P., Logan, J., Grandy, D.K., Fang,Y., Lee, J.H., Fowler, J.S. & Volkow, N.D. (2002) In vivo comparativeimaging of dopamine D2 knockout and wild-type mice with (11)C-racloprideand microPET. J Nucl Med, 43, 1570-1577.
Thanos, P.K., Taintor, N.B., Rivera, S.N., Umegaki, H., Ikari, H., Roth, G., Ingram,D.K., Hitzemann, R., Fowler, J.S., Gatley, S.J., Wang, G.J. & Volkow, N.D.(2004) DRD2 gene transfer into the nucleus accumbens core of the alcoholpreferring and nonpreferring rats attenuates alcohol drinking. Alcohol ClinExp Res, 28, 720-728.
Thanos, P.K., Volkow, N.D., Freimuth, P., Umegaki, H., Ikari, H., Roth, G., Ingram,D.K. & Hitzemann, R. (2001) Overexpression of dopamine D2 receptorsreduces alcohol self-administration. J Neurochem, 78, 1094-1103.
Thompson, J., Thomas, N., Singleton, A., Piggott, M., Lloyd, S., Perry, E.K., Morris,C.M., Perry, R.H., Ferrier, I.N. & Court, J.A. (1997) D2 dopamine receptorgene (DRD2) Taq1 A polymorphism: reduced dopamine D2 receptor bindingin the human striatum associated with the A1 allele. Pharmacogenetics, 7,479-484.
Trinko, R., Sears, R.M., Guarnieri, D.J. & DiLeone, R.J. (2007) Neural mechanismsunderlying obesity and drug addiction. Physiol Behav, 91, 499-505.
Umegaki, H., Chernak, J., Ikari, H., Roth, G. & Ingram, D. (1997) Rotationalbehavior produced by adenovirus-mediated gene transfer of dopamine D2receptor into rat striatum. Neuroreport, 8, 3553-3558.

84
Ungless, M.A., Whistler, J.L., Malenka, R.C. & Bonci, A. (2001) Single cocaineexposure in vivo induces long-term potentiation in dopamine neurons.Nature, 411, 583-587.
Ur, E., Wilkinson, D.A., Morash, B.A. & Wilkinson, M. (2002) Leptinimmunoreactivity is localized to neurons in rat brain. Neuroendocrinology,75, 264-272.
Valjent, E., Pascoli, V., Svenningsson, P., Paul, S., Enslen, H., Corvol, J.C.,Stipanovich, A., Caboche, J., Lombroso, P.J., Nairn, A.C., Greengard, P.,Herve, D. & Girault, J.A. (2005) Regulation of a protein phosphatase cascadeallows convergent dopamine and glutamate signals to activate ERK in thestriatum. Proc Natl Acad Sci U S A, 102, 491-496.
Vanderschuren, L.J., Schoffelmeer, A.N., Mulder, A.H. & De Vries, T.J. (1999)Dopaminergic mechanisms mediating the long-term expression of locomotorsensitization following pre-exposure to morphine or amphetamine.Psychopharmacology (Berl), 143, 244-253.
Vivo, M., Lin, H. & Strange, P.G. (2006) Investigation of cooperativity in thebinding of ligands to the D(2) dopamine receptor. Mol Pharmacol, 69, 226-235.
Volkow, N., Wang, G., Fowler, J., Logan, J., Gatley, S., Wong, C., Hitzemann, R. &Pappas, N. (1999a) Reinforcing effects of psychostimulants in humans areassociated with increase in brain dopamine and occupancy of D2 receptors. JPharmacol Exp Ther, 291, 409-415.
Volkow, N.D., Ding, Y., Fowler, J. & Wang, G. (1996) Cocaine addiction: hypothesisderived from imaging studies with PET. J Addict Dis, 15, 55-71.
Volkow, N.D., Fowler, J.S. & Wang, G.-J.a. (2002a) Role of dopamine in drugreinforcement and addiction in humans: results from imaging studies.Behavioral Pharmacology, 13, 355-366.
Volkow, N.D., Wang, G.J., Fowler, J.S., Logan, J., Gatley, S.J., Gifford, A.,Hitzemann, R., Ding, Y.S. & Pappas, N. (1999b) Prediction of reinforcingresponses to psychostimulants in humans by brain dopamine D2 receptorlevels. Am J Psychiatry, 156, 1440-1443.
Volkow, N.D., Wang, G.J., Fowler, J.S., Logan, J., Gatley, S.J., Hitzemann, R.,Chen, A.D., Dewey, S.L. & Pappas, N. (1997) Decreased striataldopaminergic responsiveness in detoxified cocaine-dependent subjects.Nature, 386, 830-833.

85
Volkow, N.D., Wang, G.J., Fowler, J.S., Logan, J., Jayne, M., Franceschi, D., Wong,C., Gatley, S.J., Gifford, A.N., Ding, Y.S. & Pappas, N. (2002b)"Nonhedonic" food motivation in humans involves dopamine in the dorsalstriatum and methylphenidate amplifies this effect. Synapse, 44, 175-180.
Volkow, N.D., Wang, G.J., Fowler, J.S. & Telang, F. (2008) Overlapping neuronalcircuits in addiction and obesity: evidence of systems pathology. Philos TransR Soc Lond B Biol Sci, 363, 3191-3200.
Volkow, N.D., Wang, G.J., Fowler, J.S., Thanos, P.P., Logan, J., Gatley, S.J.,Gifford, A., Ding, Y.S., Wong, C. & Pappas, N. (2002c) Brain DA D2receptors predict reinforcing effects of stimulants in humans: replicationstudy. Synapse, 46, 79-82.
Volkow, N.D. & Wise, R.A. (2005) How can drug addiction help us understandobesity? Nat Neurosci, 8, 555-560.
Vorel, S.R., Ashby, C.R., Jr., Paul, M., Liu, X., Hayes, R., Hagan, J.J., Middlemiss,D.N., Stemp, G. & Gardner, E.L. (2002) Dopamine D3 receptor antagonisminhibits cocaine-seeking and cocaine-enhanced brain reward in rats. JNeurosci, 22, 9595-9603.
Wade, G.N., Lempicki, R.L., Panicker, A.K., Frisbee, R.M. & Blaustein, J.D. (1997)Leptin facilitates and inhibits sexual behavior in female hamsters. Am JPhysiol, 272, R1354-1358.
Wang, G., Volkow, N., Logan, J., Pappas, N., Wong, C., Zhu, W., Netusil, N. &Fowler, J. (2001) Brain dopamine and obesity. Lancet, 357, 354-357.
Wang, G.J., Volkow, N.D., Thanos, P.K. & Fowler, J.S. (2004) Similarity betweenobesity and drug addiction as assessed by neurofunctional imaging: aconcept review. J Addict Dis, 23, 39-53.
Wang, T., Hartzell, D.L., Rose, B.S., Flatt, W.P., Hulsey, M.G., Menon, N.K.,Makula, R.A. & Baile, C.A. (1999) Metabolic responses tointracerebroventricular leptin and restricted feeding. Physiol Behav, 65, 839-848.
Wellman, P.J., Nation, J.R. & Davis, K.W. (2007) Impairment of acquisition ofcocaine self-administration in rats maintained on a high-fat diet. PharmacolBiochem Behav, 88, 89-93.
WHO (2008) Fact sheet: obesity and overweight. World Health Organization.

86
Williams, J.M., Owens, W.A., Turner, G.H., Saunders, C., Dipace, C., Blakely, R.D.,France, C.P., Gore, J.C., Daws, L.C., Avison, M.J. & Galli, A. (2007)Hypoinsulinemia regulates amphetamine-induced reverse transport ofdopamine. PLoS Biol, 5, 2369-2378.
Woods, R.P., Cherry, S.R. & Mazziotta, J.C. (1992) Rapid automated algorithm foraligning and reslicing PET images. Journal of Computer AssistedTomography, 16, 620-633.
Woods, R.P., Mazziotta, J.C. & Cherry, S.R. (1993) MRI-PET registration withautomated algorithm. Journal of Computer Assisted Tomography, 17, 536-546.
Woods, S.C. & D'Alessio, D.A. (2008) Central control of body weight and appetite. JClin Endocrinol Metab, 93, S37-50.
Yan, Q.S. (2003) Involvement of non-exocytotic mechanisms in ethanol-induced invivo dopamine release: comparisons with cocaine. Eur J Pharmacol, 477, 37-44.
Yoshida, M., Yokoo, H., Mizoguchi, K., Kawahara, H., Tsuda, A., Nishikawa, T. &Tanaka, M. (1992) Eating and drinking cause increased dopamine release inthe nucleus accumbens and ventral tegmental area in the rat: measurementby in vivo microdialysis. Neurosci Lett, 139, 73-76.
Zhang, L., Ravipati, A., Joseph, J. & Roth, G.S. (1995) Aging-related changes in ratstriatal D2 receptor mRNA-containing neurons: a quantitativenonradioactive in situ hybridization study. J Neurosci, 15, 1735-1740.
Zhao, A.Z., Huan, J.N., Gupta, S., Pal, R. & Sahu, A. (2002) A phosphatidylinositol3-kinase phosphodiesterase 3B-cyclic AMP pathway in hypothalamic actionof leptin on feeding. Nat Neurosci, 5, 727-728.
Zhen, J., Reith, M.E. & Carr, K.D. (2006) Chronic food restriction and dopaminetransporter function in rat striatum. Brain Res, 1082, 98-101.