stored product protection - usda
TRANSCRIPT

Kansas State University Agricultural Experiment Station and Cooperative Extension Service
David W. HagstrumThomas W. Phillips
Gerrit Cuperus
Stored Product Protection

Stored Product Protection i
David W. HagstrumThomas W. Phillips
Gerrit Cuperus
Stored Product Protection
Copyright © 2012 Kansas State University
S156 ISBN 978-0-9855003-0-6

Stored Product Protection iii
Part I – Ecology of Storage Systems
1. Introduction 1David W. Hagstrum, Thomas W. Phillips, and Gerrit Cuperus
2. Biology, Behavior, and Ecology of Stored Grain and Legume Insects 7Linda J. Mason and Marissa McDonough
3. Biology, Behavior, and Ecology of Stored Fruit and Nut Insects 21Charles S. Burks and Judy A. Johnson
4. Biology, Behavior, and Ecology of Insects in Processed Commodities 33Rizana M. Mahroof and David W. Hagstrum
5. Biology, Behavior, and Ecology of Pests in Other Durable Commodities 45Peter A. Edde, Marc Eaton, Stephen A. Kells, and Thomas W. Phillips
6. Molds and Mycotoxins in Stored Products 63Charles Woloshuk and Ernesto Moreno Martínez
7. Vertebrates in Stored Products 69Stephen A. Kells
Part II – Management: Prevention Methods
8. Food Plant Sanitation, Pest Exclusion, and Facility Design 85Jerry W. Heaps
9. Chemical Control in Stored Products 95Frank H. Arthur and Bhadriraju Subramanyam
10. Drying, Handling, and Storage of Raw Commodities 101Carol Jones, Mark Casada, and Otto J. Loewer
Table of Contents
iv K-State Research and Extension
Table of Contents
11. Grain Aeration 121Shlomo Navarro, Ronald T. Noyes, Mark Casada, and Frank H. Arthur
12. Insect-Resistant Packaging 135Michael A. Mullen, Jade M. Vardeman, and Jim Bagwell
13. Resistance Management 143George Opit, Patrick J. Collins, and Gregory J. Daglish
Part III – Management: Monitoring-Based Methods
14. Fumigation 157Thomas W. Phillips, Ellen M. Thoms, Joe DeMark, and Spencer Walse
15. Extreme Temperatures 179Paul Fields, Bhadriraju Subramanyam, and Raj Hulasare
16. Controlled or Modified Atmospheres 191Shlomo Navarro, Blaine Timlick, Colin J. Demianyk, and Noel D.G. White
17. Biological Control: Insect Pathogens, Parasitoids, and Predators 203Paul W. Flinn and Matthias Schöller
Part IV – Management: Decision Making
18. Insect Pest Management for Raw Commodities During Storage 213David W. Hagstrum and Paul W. Flinn
19. Insect Pest Management Decisions in Food Processing Facilities 219James Campbell, Joel Perez-Mendoza, and Jeff Weier
20. Organic Approaches and Regulations for Stored Product Pest Management 233Matthew J. Grieshop, D. Ted Rogers, and Frank H. Arthur
21. Trapping and Interpreting Captures of Stored Grain Insects 243Michael D. Toews and Christian Nansen
22. Acoustic Monitoring of Insects 263Richard Mankin and David W. Hagstrum
23. Temperature Monitoring 271Fuji Jian and Digvir S. Jayas
24. Monitoring for Spoilage and Mycotoxins 283Ernesto Moreno Martínez and Charles Woloshuk
25. Role of Extension Educators and Consultants 289David W. Hagstrum and Bhadriraju Subramanyam
26. Quarantine 297Scott W. Myers and David W. Hagstrum

Stored Product Protection v
Table of Contents
Part V – Management: Economics, Regulations, and Marketing
27. Economics of Commodity Storage 305Corinne Alexander and Phil Kenkel
28. Economics of IPM Decisions 317Brian D. Adam and Corinne Alexander
29. Economics of Commodity Grading and Segregation 327Phil Kenkel and Brian D. Adam
30. Food Safety Requirements 331Pamela Peckman and Tim Pettitt
31. Liability Basics and the Importance of Risk Management 337Michael T. Olexa, Zach Broome, Derrill McAteer and Gregory Steube
Author Directory 345

vi K-State Research and Extension
Table of Contents

Stored Product Protection This book is a practical guide to protecting grains and other raw
commodities, food processing facilities, finished food, and durable plant and animal products from insects, molds, and vertebrate pests.
The 31-chapter training manual is an updated companion to the 1995 Oklahoma State publication, E912, Stored Product Management. All-new
chapters from the world’s leading experts will give readers an understanding of pest biology, behavior, and ecology in the marketing system; pest
management methods; and relevant economic and regulatory considerations. Edited by David W. Hagstrum, Thomas W. Phillips and Gerrit Cuperus, this should
be a valuable reference for anyone involved in stored product protection.
S156 ISBN 978-0-9855003-0-6

Stored Product Protection 121
Aeration is the forced movement of ambient air by fan power through a grain bulk to improve grain storability. Aeration is primarily used for cooling, but additional objectives are to equalize grain tempera-ture throughout the bulk, promote limited drying, and remove fumigant residues and odors. Aeration is distinguished from “passive” or “natural” ventila-tion, which takes place in corn cribs, where sidewall wind pressures force ambient air through the grain, causing slow natural drying of damp unshelled corn, or in grain bins where roof wind forces create suction convection currents between roof vents and base fan openings. Aeration flow rates should be distin-guished from recirculated fumigation, which uses very low airflow rates, and from drying, which uses very high airflow rates compared to aeration.
Aeration is widely used in stored grain management programs in the United States. Pioneering engineer-ing work of U.S researchers such as Foster (1953), Robinson et al. (1951), Shedd (1953), and Holman (1966) and research on technological aspects of aera-tion by Hukill (1953), and more recently by Cuperus et al. (1986), Arthur and Casada (2005, 2010), and Reed (2006), form the basis of modern grain aera-tion systems. Aeration technology is used to modify the grain bulk microclimate to reduce or eliminate the development of harmful or damaging organisms in the grain by reducing and maintaining grain tem-peratures at safe levels below humidity levels which support microflora activity. Aeration helps sustain favorable storage conditions for the safe preservation of grain quality.
Substantial storage losses can be caused by micro-flora that flourish in moist grain and insects that can be destructive if preventive measures are not taken. These losses should be considered a result of interac-tions between components of the ecosystem, affected by grain and ambient weather conditions. Interac-tions between damaging pests, the grain, and other physical components of the system form a dynamic infrastructure, with each component continuously affecting the others. The role of aeration in this eco-system is to uniformly “condition” the stored grain to a desirable low temperature and maintain desirable conditions in the grain bulk by moving the sufficient air volumes of suitable quality through the grain mass (Navarro and Noyes 2002a).
The purpose of this chapter is to guide grain manag-ers on the concept of using aeration to preserve grain quality and manage insect populations in conven-tional farm and commercial grain storages.
Aeration Objectives The objective of aeration is to maintain the quality of bulk grain in storage. Although aeration can improve storage conditions, aeration does not improve intrin-sic quality attributes of grain.
Cooling the grain bulk for pest suppression – Cooling grain is the primary objective of grain aeration (Reed and Arthur 2000, Reed and Harner 1998a) when discussing pest suppression.
11 Grain Aeration
Shlomo Navarro Ronald T. NoyesMark CasadaFrank H. Arthur
122 K-State Research and Extension
Part II | Management: Prevention Methods
Stored grain insects are of tropical or subtropical origin and require fairly high temperatures, typically 75° to 90°F (24° to 32°C) for development. Grain-infesting insects are sensitive to low temperatures. Stored product insect development is generally stopped below 60°F (16°C); there is little insect survival above 110°F (43°C). In the southwestern and south-central U.S., temperatures of wheat, rice, and sorghum at harvest can range from 90° to 110°F (32° to 43°C), depending on the specific crop and location. During fall harvest in the northern U.S., grain temperatures around 50° to 65°F (10° to 18°C) are typical.
At temperatures below 70°F (21°C), population growth of most storage insects is significantly sup-pressed. Grain temperatures of 60° to 70°F (16° to 21°C) are considered “safe” for insect management, because feeding and breeding are slow. Complete life cycles at these temperatures take three months or more, so insect population growth remains insignifi-cant. Insect damage caused under these low temper-ature conditions is minimal (Flinn et al. 1997).
The crucial control parameter for mite pests is not temperature, but establishing an equilibrium relative humidity (ERH) below about 65%. About 12.5% moisture content (MC) for wheat at 77°F (25°C) suppresses mite development (Cunnington 1984, Navarro et al. 2002). Temperatures required to sup-press mite development in damp grain (14% to 16% moisture content wet-basis) are obtain-able in temperate climates. Maintaining low uni-form grain temperatures is too expensive at the bulk periphery when mean ambient temperatures are favorable for mite development. Although cooling moist grain is unlikely to prevent moderate mite infestation, aeration is expected to minimize “hot spots” and heavy mite populations associated with them.
Suppression of microfloral growth – Low temperatures are required to prevent mold damage in moist grain. Temperatures below 40°F (5°C) are needed for the suppression of most mold develop-ment. For suppression of Penicillium molds, tempera-tures must be below 0°C. Most fungi do not grow at relative humidities below 70%, which is equivalent to roughly 13% moisture content for cereal grains at typical storage temperatures. The moisture content threshold is lower for oilseeds. In practice, mold growth is dependent mainly upon interstitial air humidity. Although cooling grain may not seem like
an efficient method for controlling mold, at lower grain temperatures, mold damage is reduced.
Maintenance of seed and grain quality – Low kernel temperatures are desirable for better maintenance of seed and grain quality. Studies have shown that the lower the temperature (within certain limits), the longer the seeds maintain full viability. A rule of thumb (Harrington 1973) states that a seed’s life span in storage is doubled for each 9°F (5°C) decrease in temperature (within the range of 32° to 122°F (0° to 50°C) and for each 1 percent decrease in seed moisture (within the range of 5% to 14%). Seeds are commonly stored with equilibrium rela-tive humidity from 30% to 40% with good results. For extended storage times of seeds, Vertucci and Roos (1990) recommend the best storage moisture content is between 19% and 27% equilibrium relative humidity.
Equalization of temperature through-out the grain bulk – Because of self-insulating properties, grain placed in storage during summer harvest retains initial harvest temperatures for a long time before cool weather arrives in the fall (except for grain near bin walls, exposed conical base, or the surface). It is recommended that harvest heat be removed by nighttime suction aeration as soon as ambient temperatures are 15° to 20°F below internal grain mass temperatures to minimize insect activ-ity at or near the grain surface. The initial cooling should be followed by additional aeration when gen-erally lower ambient temperatures will allow cooling the entire grain mass below 70°F.
Prevention of moisture migration in the grain bulk – As the ambient temperature drops during the cool season, the surface (and peripheral) layers of the grain become considerably cooler than the internal grain mass. Temperature gradients are established in the grain bulks that can lead to convection currents that circulate air through the intergranular spaces. In large bulks, the cold dense air settles along the outer walls. The warmer air (which contains more moisture than cool air) moves toward the colder upper surface of the grain bulk. When the warm air reaches the cool layers of the grain bulk, moisture condenses and creates wet layers or spots in the grain. Recent studies (Montross et al. 2002, Montross and Maier 2001) suggest a new moisture equilibration theory for the mechanisms involved in this moisture movement in a non-aerated grain mass. Using the finite-element model

Stored Product Protection 123
Chapter 11 | Grain Aeration
they developed, additional large-scale trials will be required to demonstrate the effect of significant temperature gradients on moisture condensation due to convection currents that carry moisture into the cool layers of the grain bulk. On the other hand, the traditional natural convection hypothesis suggests that the natural convection currents in the grain bulk alone are sufficient to cause large amounts of mois-ture to “migrate” to cooler layers or the cooler surface grain, where the air cools to “dew point” and deposits excess moisture, slowly increasing the grain moisture content in the upper parts of the grain bulk.
Prevention of head-space and down spout condensation – Under-roof condensation is a different natural process than moisture migra-tion within the grain bulk. Condensate that drips on the grain involves moisture in humid air, which accumulates in the head-space above the grain bulk and condenses on the under-surface of the bin roof. Bins with sufficient roof vents and open eave gaps (spacing of 1/2 to 1 inch) between sidewall and roof, generally have enough natural ventilation to avoid under-roof condensate. Condensate is especially problematic in bins with eave gaps that are perma-nently sealed to prevent fumigant gas losses and easy grain access for insects.
Prevention of biological heating of dry grain – In grain bulks where infestation is localized, insect populations develop in small pockets of grain. The lesser grain borer and the three primary weevil species found in grains in the United States — the rice weevil, the maize weevil, and the granary weevil — are characteristic species that develop local-ized infestations in bulk grains, creating hot spots. Temperatures of heavily infested grain undergoing widespread heating are typically about 100° to 110°F (38° to 43°C). When heavy infestations are discov-ered, the grain should be fumigated immediately to stop insect activity. Then aeration should be used to cool the grain bulk.
Prevention of spontaneous heating of moist grain – In warm moist grain (equilibrium relative humidity greater than 70%), respiration can become very intensive due to mold development. High levels of respiration produce a phenomenon called “spontaneous heating.” Heating of the grain bulk is detrimental to grain quality. In spontaneous heating, hot spot temperatures can easily reach 135°to140°F (57° to 60°C) creating steep temperature gradients between heated and surrounding cool grain. In
bulks containing oil rich seeds such as cottonseeds, soybeans, and sunflower seeds at sufficiently high moisture conditions, very high temperatures are generated and “spontaneous combustion” can occur, starting a fire. Do not operate aeration fans if fire is detected (by the smell of smoke or burning grain in the exhaust air stream) in a grain bulk.
Limited grain drying by aeration – A small, but significant drying effect (from 1/4% to 1/2% moisture loss per aeration cooling cycle) is typically experienced, and during long-term aeration (mul-tiple cooling cycles) up to 2% moisture reduction may occur while cooling large grain bulks. Because of the very low flow rates during aeration, the drying front moves slowly, and this small drying effect is usually limited to the grain near the entrance of the aeration air. This grain moisture loss is reflected in a corresponding shrinkage or market weight loss in the grain bulk. This must be considered in grain manage-ment as a cost for keeping grain safe for marketing. Aeration moisture shrinkage as well as “invisible” handling loss will affect facility records significantly and should be considered when grain receipt and delivery records from storage facilities or sites do not tally.
Removal of fumigant residues and odors – The release or desorption of fumigants at the end of a fumigation can be achieved with relatively low air flow rates. The aeration system can be operated intermittently (in pulses) to flush gas vapors from the grain bulk and storage. Aeration systems can be operated for 10 to 15 minutes every two to three hours to allow interstitial air space to reach equilib-rium with the concentration of the fumigant in the grain. Thus, the aeration system can be operated sev-eral times to ventilate the storage. Storage odors also can develop in a grain bulk due to hot spots contain-ing insects or moldy grain. Sour odors result from anaerobic activity in the process of fermentation at high moisture contents (above 18% for cereals). At moderate moisture levels (14% to 18% moisture content for cereals), musty odors in grain are usually caused by the growth of certain molds. Other odors occasionally found in grain are considered commer-cially objectionable foreign odors (COFO) because they are odors that are foreign to grain and render it unfit for normal commercial usage. Most odors can be reduced using aeration; however residual odors may linger after repeated aeration cycles. Commer-cial applications based on pilot laboratory studies
124 K-State Research and Extension
Part II | Management: Prevention Methods
have used aeration combined with ozone treatment to reduce off odors in grain (personal communica-tion Carlos Campabadal).
Aeration System DesignIn a typical aeration system, the basic components are a bin with perforated in-floor or on-floor ducts; a fan connected to the plenum or duct system to force the air through the grain; and one or more roof vents for exhaust or air intake. Many variations of the typi-cal aeration system are used in practice.
Resistance of grain to airflow – Cereals, oil-seeds, and granular animal feeds have an intergranu-lar porosity or void space that ranges between 35% and 45% of the bulk volume. Two different grain types may have similar porosities but the surface area per unit volume for small-seeded grain would be larger than for the large-seeded grain, e.g., sorghum seeds are smaller and the kernel surface area is larger than for maize. At the same superficial airflow rate (i.e., the same cfm/bu), the specific air veloc-ity through sorghum is much higher than through maize, which has large intergranular void openings and shorter interstitial path lengths for airflow. The increased velocity over larger surface areas and the longer air paths through smaller interstices cause the higher resistance for sorghum than maize even though the percent air volumes in the masses are about the same. In a typical aeration operation, the resistance (expressed in inches of water static pres-sure) to airflow through the grain is the most signifi-cant design factor.
Airflow path in the bulk – Many of the recom-mendations on design and operation of ducts for grain aeration systems are empirical rules for duct spacing and air velocities in the ducts. The aim is to keep air paths through the grain as nearly equal in length as possible. If there is a path that is signifi-cantly shorter than the others, an excessive amount of air will flow through the shorter air path. The longest path should be less than 1.5 times the length of the shortest path, though larger variations in path lengths may be used with satisfactory results in small dry grain bins.
Fan characteristics – The performance of fans is graphically represented by plotting airflow rate on the ordinate, and static pressure on the abscissa. The graph of this relationship between airflow rate
and airflow resistance for a specific fan is called the system curve. Fans with certified (measured) fan per-formance curves should be used for designing grain aeration systems. The performance of similar size fans from different manufacturers can vary widely. For example, against a resistance of 2.4 inches of water (600 Pa), fan A provides a measured flow rate of 1,695 cfm (800 L/s), fan B, 2,755 cfm (1300 L/s), and fan C, 5,509 cfm (2600 L/s), which at this air-flow resistance is more than three times higher than the airflow rate of fan A (5,509/1,695 = 3.25). A high-speed vane-axial fan may be suitable for corn, but a low-speed centrifugal fan may be needed for sorghum or wheat on the same size bin because of higher static pressure required for the airflow rate for which it was designed.
Aeration System Design ConsiderationsAirflow rates – For upright storages (concrete silos and tall steel bins) airflow rates of 0.05 to 0.10 cfm/bu [3 to 6 (m3/h)/tonne] and for horizontal storages airflow rates of 0.10 to 0.20 cfm/bu [6 to 12 (m3/h)/tonne] are typically used. Higher airflow rates (0.20 to 0.25 cfm/bu), which will cool grain faster, are needed in southern regions with limited cool weather conditions. Central U.S. systems may find that 0.15 to 0.20 cfm/bu works well, while 0.1 to 0.15 cfm/bu in northern states may be sufficient due to early long periods of cool weather.
Aeration speed is analogous to grain quality insur-ance. Slow cooling may cost less, but if grain spoils, slow cooling is false economy. Good aeration economy is what provides grain managers with high quality grain in any geographic location.
Because airflow and power requirements for grain depths exceeding 100 ft (30 m) become excessive, reduced airflow rates of 0.03 to 0.05 cfm/bu [2 to 3 (m3/h)/tonne] may be required. Doubling the airflow rate triples the required static pressure while fan power is increased by over four times.
An excellent alternative to consider on concrete silos with strong roof structures is to use a two-fan, “push-pull’ system. With a roof-mounted fan pushing air down and a duplicate-base mounted fan pulling air down, each fan only has to overcome the resis-tance of half the grain depth. Higher airflow can be achieved at reasonable static pressures and costs.

Stored Product Protection 125
Chapter 11 | Grain Aeration
Air duct velocities – To minimize friction loss in ducts, a compromise between duct diameter and air velocity is made. In aeration ducts, maximum veloc-ity should be at or below 2,000 ft/min (600 m/min). For transition and supply ducts up to 20 ft (6 m) long, velocity could be 2,500 ft/min (750 m/min) or less. Transition ducts should have a taper (slope) of 20° or less. For 45 to 90° elbows, the centerline radius of curvature should be at least 1.5 times and preferably 2.0 times duct diameter. Joining two 45° elbows to make a 90° elbow is acceptable practice.
Air distribution systems – The ratio of length of the longest airflow path to the shortest airflow path should be 1.5:1. Positive pressure systems have a more uniform airflow distribution and are preferred over negative pressure systems in horizontal storages. The exit velocity from the perforations should not exceed 30 ft/min (9 m/min).
Intakes and exhaust – In general, roof vents should be equally spaced around the circumference of the roof at about 1/3 to 1/2 the distance up the slope from the lower edge. Bins with sealed eaves need roof ventilators spaced around the roof , which pro-vide at least 1 square foot of roof vent opening per 800 to 1,000 cfm of airflow with a minimum of two vents per bin. Bins should have at least one vent near the peak to provide natural ventilation from lower vents to upper vent. This will minimize moist air accumulating in bin peak and going up downspouts. Downspouts should have gravity flap valves to minimize moist air entry during pressure (up-flow) aeration, which causes condensate dripping into the grain. One or more vents should be located near the peak to minimize moist air condensation in down spouts used for filling the storage. The vent cross sec-tion area should be sized preferably for an air veloc-ity of 1,000 ft/min (300 m/min), with a maximum velocity of 1,500 ft/min (450 m/min). The pressure difference between the headspace of a storage bin or silo and outside should not exceed 0.12 inch water column (30 Pa) during either pressure or suction aeration. Higher pressure differences may cause structural damage and is an indication of inadequate exhaust area.
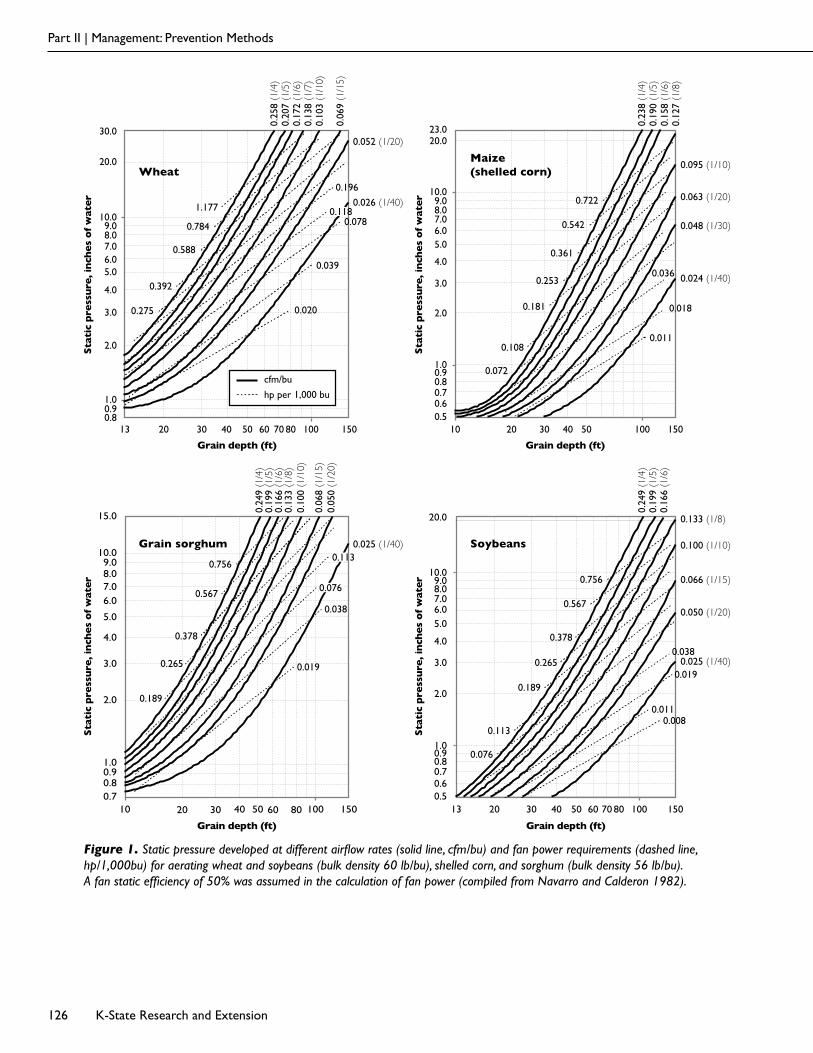
Estimate static pressure and fan power requirements – To select the proper aeration fan for the system to be operated at a specific airflow rate [cfm/bu - (m3/h)/tonne], knowledge of static pressure requirements is essential. Figure 1 provides static pressure (inches of water column) and fan
power requirements (hp/1,000 bu) vs. depth (ft) for wheat, maize (shelled corn), sorghum and soybeans, respectively (Navarro and Noyes 2002a).
A Windows program called FANS (Minnesota Extension Service 1996), provides valuable design assistance for fan type, size, and power selections and static pressure required based on desired airflow, bin diameter, grain depth and grain type. This software contains performance data on over 200 fans listed by manufacturer and fan horsepower. The National Institute of Agricultural Technologies of Argentina (INTA) has also developed software, named AireAr, for sizing and selecting grain aeration fans (Bartosik et al. 2009). The user can select, round flat bottom or coned bottom, and between leveled grain surface or grain peak, and enter its dimensions as well as the grain depth.
Aeration System OperationDirection of air flow – The question of whether air should be pushed or pulled (sucked) through grain is a subject of controversy that has caused much discussion. As with most processes, there are significant advantages and disadvantages in selecting a specific aeration method. The designs of aeration systems involve many variables, so it is important to recognize when the advantages of up flow versus down flow, or pressure versus suction, outweigh the disadvantages. Either pressure or suction airflow could be used in most grain storage structures, and most aeration systems can be adapted for pressure or suction airflow depending on the specific situation.
There are two conditions where pressure airflow should be used: (1) in regions where aeration roof vents can become iced over because of freezing rain or heavy snow and (2) when warm grain has been loaded on top of cool grain. Suction systems are not used in the central and northern U.S. Corn Belt because of the many roof collapses that occurred from 1950 to 1970 before the grain industry recog-nized that suction airflow was not satisfactory.
Situations that are frequently encountered conform to the following guidelines:
• Suction airflow provides quick early cooling of the top of grain where insect populations are heaviest.
126 K-State Research and Extension
Part II | Management: Prevention Methods
Figure 1. Static pressure developed at different airflow rates (solid line, cfm/bu) and fan power requirements (dashed line, hp/1,000bu) for aerating wheat and soybeans (bulk density 60 lb/bu), shelled corn, and sorghum (bulk density 56 lb/bu). A fan static efficiency of 50% was assumed in the calculation of fan power (compiled from Navarro and Calderon 1982).
1.0
10.0
10020 30 40 50 150
0.90.8
3.0
7.06.0
4.0
5.0
8.09.0
20.0
Grain depth (ft)
30.0
2.0
Wheat
13 60 70 80
0.052 (1/20)
0.026 (1/40)
cfm/bu
hp per 1,000 bu
1.177
0.784
0.588
0.392
0.275
0.25
8 (1
/4)
0.20
7 (1
/5)
0.17
2 (1
/6)
0.13
8 (1
/7)
0.10
3 (1
/10)
0.06
9 (1
/15)
0.196
0.078
0.039
0.020
0.118
Sta
tic
pre
ssu
re, i
nch
es
of
wat
er
1.0
10.0
10 10020 30 40 50 60 80 1500.7
0.90.8
2.0
3.0
7.06.0
5.0
8.09.0
15.0
4.0
Grain depth (ft)
Grain sorghum 0.025 (1/40)
0.24
9 (1
/4)
0.19
9 (1
/5)
0.16
6 (1
/6)
0.13
3 (1
/8)
0.10
0 (1
/10)
0.06
8 (1
/15)
0.05
0 (1
/20)
0.756
0.567
0.378
0.265
0.189
0.038
0.019
0.113
0.076
Sta
tic
pre
ssu
re, i
nch
es
of
wat
er
1.0
10.0
10 10020 30 40 50 1500.5
0.7
0.90.8
0.6
2.0
3.0
7.06.0
4.0
5.0
8.09.0
20.023.0
Grain depth (ft)
Maize(shelled corn)
0.095 (1/10)
0.024 (1/40)
0.063 (1/20)
0.048 (1/30)
0.23
8 (1
/4)
0.19
0 (1
/5)
0.15
8 (1
/6)
0.12
7 (1
/8)
0.722
0.542
0.361
0.253
0.181
0.072
0.108
0.036
0.018
0.011
Sta
tic
pre
ssu
re, i
nch
es
of
wat
er
1.0
10.0
10020 40 50 60 70 80 1503013
0.7
0.90.8
2.0
3.0
7.06.05.0
8.09.0
4.0
0.60.5
20.0
Grain depth (ft)
Soybeans 0.100 (1/10)
0.025 (1/40)
0.066 (1/15)
0.050 (1/20)
0.133 (1/8)
0.24
9 (1
/4)
0.19
9 (1
/5)
0.16
6 (1
/6)
0.756
0.567
0.378
0.265
0.189
0.113
0.076
0.038
0.019
0.0110.008
Sta
tic
pre
ssu
re, i
nch
es
of
wat
er

Stored Product Protection 127
Chapter 11 | Grain Aeration
• Suction airflow should be used to aerate warm grain when aeration is started during cool weather, for grain stored in metal bins, or to prevent excess condensation under the headspace roof.
• Suction airflow should be used in tropical or subtropical humid climates when cool weather conditions are marginal for insect control.
• Pressure airflow should be preferred in large flat storages for uniform airflow.
• Pressure airflow is required when loading warm grain on top of grain already cooled such as (a) when loading warm grain from a dryer on top of aerated grain in a storage bin or (b) when load-ing warm grain delivered to an elevator on top of a bin that has been previously cooled.
• Pressure aeration can usually be performed regardless of the air humidity because the mechanical fan compression heat reduces the relative humidity of air entering the grain mass somewhat, depending on storage and fan sys-tems. Heat of compression adds about 0.75 to 1°F per inch static pressure.
• Pressure airflow minimizes or eliminates the risk of roof collapse from icing of aeration vents.
Aeration control equipment – Essentially, aeration controllers are electrical system control devices designed to provide automatic starting and stopping of aeration fans based on selected tem-perature and humidity levels deemed suitable for the aeration program. Existing control systems may be categorized as follows: simple mechani-cal time controllers; thermostats without relative humidity control; complex electro-mechanical controllers with humidity control; temperature dif-ference controllers; wet bulb temperature controllers; proportional time controllers; and microprocessor and computer-based temperature monitoring and aeration control systems.
Selecting aeration controllers – Use of auto-matic aeration controllers that minimize exces-sive aeration will result in savings by more precise minimum cooling cycles, which will reduce grain market weight loss, grain damage due to spoilage (self-heating) and insect infestation, end-use quality loss, and aeration fan electrical operating costs (Reed and Harner 1998b). As long as grain temperature control is the primary objective, a simple low-cost
electromechanical aeration controller may suffice to control all the fans at one installation (assuming all fans are either suction or pressure). The payback on such a low-cost ($500 to $1,500) aeration controller is usually less than one year.
For systems where grain has to be dried in storage (in-bin drying), conditioned to a specific end use (e.g., popcorn to optimize popping volume) or mar-ket moisture content (e.g., soybeans harvested too dry), or where weather conditions are highly variable, a microprocessor-based aeration and low-tempera-ture drying controller is preferred. The payback on such a controller ($1,500 to $3,000) is usually less than one year when critical end-use quality factors are considered.
Operating aeration based on humidity controls may reduce the aeration fan operating time excessively. If humidity control is used, the aeration management plan must provide adequate fan operating time to complete the aeration cycle within a target time; fan-operating time should be monitored and the control scheme modified as needed during the aeration season to insure adequate, timely grain cooling.
Monitoring ambient air and use of comput-er aid to predict aeration system perfor-mance – One reason automatic aeration controllers have often been abandoned by stored grain managers soon after installation is the inadequacy of the fan control strategy to accommodate local weather con-ditions. Before implementing any automatic control strategy, local historic weather records should be evaluated to determine whether a planned strategy guarantees sufficient fan operation to achieve desired control objectives. Ten years of historic weather records are a minimum for evaluation; 20 to 30 years is recommended (Arthur et al. 1998, Arthur and Siebenmorgen 2005).
Computers are an ideal platform with which to model grain storage management systems and strate-gies (Arthur et al. 2001). Computer models can be utilized to study the physical and biological param-eters involved in grain storage and establish realistic operating parameters to implement best stored-grain-quality management practices. Numerous computer programs have been developed throughout the world for this purpose.
Time required for cooling – A family of curves to describe several variations of temperature change

128 K-State Research and Extension
Part II | Management: Prevention Methods
from 77°, 86°, 95°, and 104°F (25°, 30°, 35° and 40°C) to ambient temperatures of 50°, 59°, and 68°F (10°, 15° and 20°C) at 64% relative humidity is pre-sented in Figure 2. This family of curves clearly indi-cates that by reducing or increasing the airflow rate beyond certain limits, the aeration time needed to cool grain satisfactorily may exceed practical limits.
At a low airflow rate, below 0.017 cfm/bu [1.0 (m3/h)/tonne], the aeration time will exceed 600 to 700 h, which is not practical for grain cooling, espe-cially in geographical regions with marginal ambient temperature conditions. If airflow rates are increased above 0.15 cfm/bu [10 (m3/h)/tonne], cooling capac-ity becomes progressively less effective. At higher aeration airflow rates, which are needed where the
Figure 2. Calculated family of curves showing the aeration time needed for reducing wheat (at 12% moisture content wet-basis) temperature from 77°, 86°, 95°, and 104°F to ambient temperatures of 50°, 59°, and 68°F at 64% relative humidity (Navarro and Noyes 2002a).
0.017 0.05 0.10 0.15 0.20 0.25
400
350
300
250
200
150
100
50
Ho
urs
of
fan
op
era
tio
n
From 77° to 50°F
From 77° to 59°F
From 77° to 68°F
From 86° to 50°F
From 86° to 59°F
From 86° to 68°F
From 95° to 50°F
From 95° to 59°F
From 95° to 68°F
From 104° to 50°F
From 104° to 59°F
From 104° to 68°F
Airflow rate (cfm/bu)

Stored Product Protection 129
Chapter 11 | Grain Aeration
hours of cooling weather are marginal, for each increment in airflow rate, the cooling time becomes less pronounced (the lines are asymptotic).
The initial grain temperature and ambient air con-ditions are the primary factors that influence the curves shown in Figure 2.
Steel bin roof venting – Moisture condenses inside cold spouts and runs back onto the surface grain. Installing one or two vents close to the center fill point will help minimize condensation in the bin fill pipe. In pressure aeration, the roof vent system must be designed with sufficient cross-sectional area to allow adequate exhaust or inlet air volume to maintain vent throughput velocities of 1,000 to 1,300 fpm (300 to 400 m/min).
The vent opening area should be divided into several equally spaced vent units based on the customary design practices in the area.
Roof exhaust fans to minimize condensa-tion – To minimize humid exhaust air roof con-densation during up-flow or pressure aeration, high volume propeller type roof exhaust fans can be installed. Roof exhausters should be sized to provide a total air volume of 1.5 to 2 times the aeration fan system airflow in order to draw in excess ambient air to dilute moist exhaust air, lowering the dew point of the total air mass exhausting through the roof fans. When roof fans are used, fresh air is pulled in through the roof vents, mixed with the cooling air moving upward through the surface grain and exhausted through the roof fans. Thus, the drier, diluted air mass that contacts the under side of bin roof sheets is less likely to experience condensation.
If roof vents are mounted about 1/3 of the roof slope distance from the peak, roof exhaust fans should be spaced about 2/3 to 3/4 of the roof slope distance from the peak, and mounted symmetrically around the roof. If two fans are used, they should be placed opposite each other on the roof. Three fans should be spaced 120 degrees apart, four fans, 90 degrees apart, six fans at 60 degree intervals and eight fans, 45 degree angular spacing.
A major problem can occur when roof fans becomes imbalanced, the vibration can cause serious structural damage to steel bin roofs, causing water leakage and grain spoilage. Roof mounted fans must be checked for fan blade balance and vibration before each stor-
age season, as well as periodically during the aeration season.
Chilling Grain with Refrigerated AirThere are some storage situations where ambient air conditions are not suitable to cool grain. For these situations, refrigerated air units for chilling grain have been developed for commodities that justify the added expense of refrigerated aeration. In refriger-ated aeration, ambient air is passed through the evaporator coil and a secondary reheat coil of the refrigeration unit, and then is blown into the grain bulk using the existing aeration system. Passage through the secondary reheating coil adjusts the air relative humidity to 60% to 75% to match the target moisture content of the dry grain. The amount of reheating and the final air temperature are adjust-able by the operator to achieve the desired aeration conditions.
Evaluation of Aeration System EfficiencyAeration efficiency includes uniform air distribu-tion through the stored product, sufficient airflow to maintain temperature and moisture, and mini-mal energy loss due to improper selection of fans, motors, and ducts. Aeration systems may perform less efficiently than originally planned; low system efficiency often goes undiscovered until long periods of aeration have failed to produce the desired cooling results. Many factors may be involved in the mal-function of an aeration system. The main problems are faulty system design, improper system operation, excessive dockage accumulation in certain regions of the grain bulk, faulty fans, rusted out sections of transition ducts causing air leaks, molded grain layers from moisture migration which restricts airflow or gradual duct blockage by foreign material and fines.
Aeration system efficiency should be tested when a new installation is first operated or any time mea-sured cooling times are longer than those calcu-lated initially. Aeration system efficiency should be rechecked after any major change, such as installing a new fan, improving aeration ducts, or when storing grain different than the type or quality of the grain for which the aeration system was designed. Mea-

130 K-State Research and Extension
Part II | Management: Prevention Methods
surement of the airflow rate and static pressure of the system are important procedures in evaluating the aeration system efficiency.
Measurement of static pressure – The U-tube manometer is probably the simplest device for mea-suring static pressure. The U-tube is a glass or plastic tube partially filled with water or special gauge oil (for low temperatures) in which the pressure is read directly in inches, cm or mm of water column. The reading is taken by measuring the difference in the liquid levels of the two parallel tubes to determine the aeration system resistance pressure. The internal diameter of the tube should be at least 0.2 to 0.24 inch (5 to 6 mm), and the walls perfectly clean. A small diameter hole (0.06 to 0.2 inch) (1.5 to 5 mm) should be drilled in the side of the airflow transition or connection duct (Figure 3). This static pressure access hole should be connected to the U-tube with a flexible connecting tube. One end of the U-tube must be open to atmosphere when reading static pressure.
8
0
12
4
4
8
12
Flexible tube
Water
Supply duct
12 inch watercolumn
Figure 3. Static pressure measurement using U-tube manometer.
Measurement of airflow rate – For conve-nience in the United States, the unit of measure for airflow used here will be (ft3/min)/bu (cfm/bu). The
volume of airflow may be determined by multiplying the average velocity (ft/min) by the cross-sectional area (ft2), at the same point of airflow measurement. The unit volume of air, ft3/min (cfm), divided by the unit of grain volume (bushels = 1.244 ft3) of the commodity will give the airflow rate in cfm/bu.
A straight section of the supply duct, at a speci-fied distance (usually in numbers of pipe diameters, e.g. 10 pipe diameters of straight pipe) downstream from the fan provides a preferred airflow measure-ment position. But, in practice, convenience governs the position at which measurements are made to determine airflow rate; air velocity readings can also be taken in front of the fan entry orifice, a roof door opening or roof vent in vertical bins. Thermo-anemometers (also called hot-wire anemometers), if properly calibrated, are suitable for airflow mea-surement. They are suited primarily for measuring relatively low velocities such as 10 to 2,000 ft/min. Windmill or rotary vane anemometers are also used for taking a series of grid pattern readings across fan openings to determine the average air velocity enter-ing or exiting the fan; the average air velocity multi-plied by the fan opening cross-section area gives an estimate of air volume.
Fan efficiency – Although fans are selected on the basis of performance ratings and the recommended fan selection range is supplied by most manufac-turers, their “installed” operating performance and efficiency may be substantially different than that listed in the manufacturer’s fan performance charts. Therefore, during the first operating stages of a new installation fan efficiency should be evaluated. With the difficulties and inaccuracies that may occur in determining fan efficiency under field conditions, early fan performance testing provides an excellent initial evaluation to ensure that the fan performs as designed. Such evaluations may be performed in an installation where the required power to operate the system is significantly greater than those specified in Figure 1. Standard fan performance data obtained from tests conducted at officially approved “certifica-tion” laboratories are sometimes available and should be more accurate than field evaluations under similar static pressures.
Using modern aerodynamic science and technology, manufacturers have developed, high performance fans with efficiencies as high as 80%. Conversely, poorly designed, improperly manufactured, or poorly selected fans may have efficiencies as low as 15% to

Stored Product Protection 131
Chapter 11 | Grain Aeration
20%. Low fan efficiency will result in aeration system failure and serious monetary losses.
Air distribution throughout the bulk – As air from the aeration system is dispersed through the aeration ducts into the grain mass, airflow near the duct surfaces is relatively high. But in regions at floor level farthest from the ducts, in corners and on the floor half way between aeration ducts in flat-bottomed structures, airflow rate is considerably reduced, thus, in flat storage warehouses and large flat bottom bolted steel bins an overall increase in airflow rate is recommended to provide adequate airflow to the floor areas that are farthest away from aeration ducts.
Example: A 40 ft diameter flat bottom bin has a floor surface area of 1,256 sq ft; at a depth of 20 ft level full, contains 25,132 cu ft or about 20,000 bu of grain. Although an airflow rate of 0.1 cfm/bu might be minimally sufficient for flat bottom bins with aeration ducts which cover only 6% to 8% of the total floor area, it is advisable to use 50% to 100% more aeration airflow. Thus, using a minimum area of aeration duct, design airflow of 0.20 cfm/bu is recommended, so the airflow to be produced by fans is 4,000 cfm. To limit air velocity to 30 ft/min (the recommended maximum duct entry or exhaust air velocity), the minimum aeration duct surface needed would be 133 sq ft (about 10% of the total bin floor area).
Due to higher particle surface friction, smaller size and lower mass, dockage with higher moisture has less spreading capability, so it accumulates directly below the loading port, forming a column of a dense higher moisture mixture of grain and high dockage (column of fines) that causes increased resistance to airflow. Where feasible, cleaning the grain before storage to remove foreign material, fine particles and dockage is encouraged. A mechanical spreader to distribute fines with the grain is recommended, to minimize the center column of fines.
By measuring the pressures developed in the bulk of the grain, a low pressure/low airflow map of the grain can be made to locate the high dockage spots (Navarro and Noyes 2002b). In up-flow aeration, higher pressures are encountered below the spot with very low pressures within and immediately above it. A method of minimizing the development of these dense central hot spots in grain where grain and fines are not mechanically distributed is by “coring”
(operating the unload conveyor to withdraw the col-umn of grain and fines directly under the fill point) the central dense column of grain and fines where high dockage accumulates in the grain bulk.
Uniform spreading to eliminate a column of dock-age and foreign material at the center of bins is part of best grain storage practice. Suitable distribution of all the grain components during the loading process is desirable for satisfactory aeration of grain bulks. Grain spreaders or distributors are installed just below grain bin loading ports. Grain spreaders are usually mechanically powered devices designed to spread the mixture of grain, dockage and foreign material across at least half of the bin diameter. Even inverted cone sheet metal spreaders which have a center opening to allow a minor part of the grain flow to drop through the center will help spread dockage and fine material, minimizing the central column of fines. Performance of grain spreaders varies for different designs and even the best do not distribute fines completely uniformly (Chang et al. 1983).
Efficacy of Aeration for Insect ControlField trials – As mentioned previously, the opti-mum temperature range for development of most stored grain insects is about 75° to 90°F (24°C to 32°C) (Fields 1992), but the preferred lower and upper limits vary with species. However, about 60°F (16°C) is the lower limit of development for most of the important pest species in the U.S. Aeration generally involves cooling to or below this threshold, often in a series of steps or time cycles depending on the initial temperature of the grain when it is loaded into storage and the ambient temperatures at the time (Arthur and Casada 2005)
In the U.S., grain crops such as wheat, corn, rice, and sorghum are harvested and stored at different times of the year. As ambient temperatures cool, the top surface and peripheral regions of the grain mass will begin to cool, while most of the grain mass will retain heat and cool much more slowly. This allows for not only insect pest population development but also promotes mold and fungal development because of the temperature differences within the grain mass. Depending on the specifics of the crops, the geo-graphic region, and the size of the storage bin, it may

132 K-State Research and Extension
Part II | Management: Prevention Methods
take weeks or even months for temperatures in the central section of the grain to be cooled to the devel-opmental threshold of 60°F (Arthur et al. 2011).
Automatic control systems – During the last 20 to 30 years several new studies have refined aera-tion through the use of various types of controllers, which essentially set activation temperatures so that fans will operate only when ambient temperatures are within these set points, thereby cooling the grain through a progressive cooling front that moves either upward or downward in the grain mass (often referred to as pressure or suction aeration, respec-tively). Grain temperatures can be monitored so that once the grain mass is cooled, the fans can be turned off. This allows for a stepwise progressive cooling approach, which can be especially useful for stored wheat. An important point that should be monitored on pressure aeration systems is that the aeration fan adds several degrees of heat to the air (heat of compression, about 0.75 to 1oF rise per inch of static pressure), so the grain does not receive humid ambi-ent air as it does in suction aeration. The air tempera-ture increase due to the heat of compression must be considered when using pressure (up-flow) aeration, especially when cooling small grains in deep bins.
An initial cooling of the wheat mass from harvest grain temperatures in the 90°s to the mid-70°s, fol-lowed by cooling to 60°F in early autumn, will likely result in lower insect populations compared to wait-ing two to three months longer before cooling the grain to 60°F (Arthur and Casada 2005). Because the majority of insects infest grain near the grain surface, suction cooling at night during the summer can effectively cool the top 3 to 6 feet of grain by 15° to 20°F within three to five weeks of harvest in most regions, thus dramatically slowing insect population buildup.
Although aeration can be accomplished through manual means, controlled aeration is a low-cost management option and can cool stored grains more effectively than can be accomplished manually, there-by resulting in lower insect pest populations.
Manual control strategies – In the past two decades, TV and Internet weather information has become more accurate and accessible. Grain manag-ers who prefer to manually control their aeration systems now have excellent predictive weather data to use for manually operating their control systems. By watching Internet weather on hourly predictions,
aeration fans can be operated during optimum ambi-ent weather conditions.
Producers and small elevator grain managers can keep track of the start and stop times they use each day, and thus can develop fan operating time data to allow them to estimate when a cooling front should be complete. At 0.1 cfm per bushel with fines spread and surface rounded (not peaked), an aeration front can be expected to break through in about 50 to 75 hours with the trailing edge (completion) in 125 to 150 hours. At 0.2 cfm per bushel, the times will be about half of the times for 0.1 cfm/bu. Suction aeration system operators can monitor exhaust air at the fan discharge to document the exhaust air temperature profile to see when the leading and trailing edges of the cooling zone pass. Although not as convenient, pressure (up-flow) cooling exhaust temperatures can be monitored at roof doors, fill points or roof vent exhausts. If a thermometer with long remote bulb is used, the temperature readings may be available at the side of the bin wall ladder near ground level.
Models predicting efficacy – Historical weather data can be used to help predict cooling patterns in different geographical regions of the U.S., and can be integrated with insect population models to show how aeration can help limit insect pest populations (Arthur et al. 2011, Arthur and Siebenmorgen 2005, Arthur and Flinn 2000). These predictive models are useful tools for demonstrating the impact of aeration on insect pest populations in grain and in commer-cial silos, and how aeration can be integrated with other control options (Flinn et al. 2007).
Although aeration has been utilized in grain man-agement for many years, new research is refining methods and techniques. Management concepts originally developed for stored wheat and stored corn are being applied to other grains (Arthur et al. 2008). Some modifications may be necessary because of the peculiarities of the rice system compared to wheat and corn, but a web-based expert system has been developed that allows user groups to examine how aeration could be useful for rice stored in the different geographic regions of the south-central U.S. (Arthur et al. 2011). Initial cooling cycles in warm-weather regions of the U.S. may help reduce insect pest populations, even if the target of 60°F cannot be initially achieved (Butts et al. 2006). Airflow direction may also be important, and a recent study showed that overall insect populations in the upper

Stored Product Protection 133
Chapter 11 | Grain Aeration
surface zone of stored wheat were lower in suction versus pressure aeration (Arthur and Casada 2010).
Compatibility with Other Pest Management MethodsAeration is a vital component for insect pest man-agement in stored grains, but it has limitations. Residual grain in and around storage bins can be important sources of infestation (Reed et al. 2003), and if initial populations are excessive, the effective-ness of aeration will be limited unless those popula-tions are eliminated through fumigation. Depending on the pest species, the grain crop, and the geograph-ic area of the United States, grain protectants and/or fumigants might be required along with aeration to prevent economic damage (Flinn et al. 2004). Yearly variations in temperature cycles may also be impor-tant, and although historical weather data can be used to help produce guidelines, it may not be pos-sible to define absolute rules that will be applicable to each and every storage situation.
AcknowledgmentsThe authors thank Chris Butts, Ph.D., agricultural engineer, National Peanut Research Laboratory, Dawson, Georgia, for reviewing the manuscript and for his useful comments.
ReferencesArthur, F. H. and M. E. Casada. 2005. Feasibility of summer
aeration for management of wheat stored in Kansas. Appl. Eng. Agric. 21: 1027-1038.
Arthur, F. H. and M. E. Casada. 2010. Directional flow of sum-mer aeration to manage insect pests in stored wheat. Appl. Eng. Agric. 26: 115-122.
Arthur, F. H. and T. J. Siebenmorgen. 2005. Historical weather data and aeration management for stored rice in Arkansas. Appl. Eng. Agric. 21: 1017-1020.
Arthur, F. H., J. E. Throne, D. E. Maier, and M. D. Montross. 1998. Initial cooling cycles for corn stored in the southern United States: Aeration strategies based on weather data. American Entomol. 44: 118-123.
Arthur, F. H., J. E. Throne, D. E. Maier, and M. D. Montross. 2001. Impact of aeration on maize weevil (Coleoptera: Curculionidae) populations in corn stored in the northern United States: simulation studies. American Entomol. 47: 104-110.
Arthur, F. H., Y. Yang, and L. T. Wilson. 2011. Utilization of a web-based model for aeration management in stored rough rice. J. Econ. Entomol. 104: 702-708.
Arthur, F. H., Y. Yang, L. T. Wilson, and T. J. Siebenmorgen. 2008. Feasibility of automatic aeration for insect pest man-agement for rice stored in east Texas. Appl. Eng. in Agric. 24: 345-350.
Arthur, F. H. and P. W. Flinn. 2000. Aeration management for stored hard red winter wheat: simulated impact on rusty grain beetle (Coleoptera: Cucujidae) populations. J. Econ. Entomol. 93: 1364-1372.
Butts, C. L., J. W. Dorner, S. L. Brown, and F. H. Arthur. 2006. Aerating farmer stock peanut storage in the southeastern U. S. Trans. ASAE 49: 457-465.
Bartosik, R., J. Rodriguez, D. de la Torre, and L. Cardoso. 2009. “AireAr: A New Software for Sizing Aeration Fans.” Inter-national Commission of Agricultural and Biological Engi-neers, Section V. Conference “Technology and Manage-ment to Increase the Efficiency in Sustainable Agricultural Systems,” Rosario, Argentina, 1-4 September 2009. http://online.inta.gov.ar:8080/aireAr/login
Chang, C. S., H. H. Converse, and C. R. Martin. 1983. Bulk Properties of Grain as Affected by Self-Propelled Rotation-al Type Grain Spreaders. Trans. ASAE 26(5): 1543-1550.
Cunnington, A. M. 1984. Resistance of the grain mite, Acarus siro L. (Acarina, Acaridae) to unfavourable physical condi-tions beyond the limit of the development. Agric. Ecosys-tems Environ. 11: 319-339.
Cuperus, G. W., C. K. Prickett, P. D. Bloome, and J. T. Pitts. 1986. Insect populations in aerated and unaerated stored wheat in Oklahoma. J. Kans. Entomol. Soc. 59: 620-627.
Fields, P. G. 1992. The control of stored product insects and mites with extreme temperatures. J. Stored Prod. Res. 28:89-118.
Flinn, P. W., Bh. Subramanyam, and F. H. Arthur. 2004. Com-parison of aeration and spinosad for suppressing insects in stored wheat. J. Econ. Entomol. 97: 1465-1473.
Flinn, P. W., D. W. Hagstrum, and W. E. Muir. 1997. Effects of time of aeration, bin size, and latitude on insect populations in stored wheat: a simulation study. J. Econ. Entomol. 90: 646-651.
Flinn, P. W., D. W. Hagstrum, C. R. Reed, and T. W. Phillips. 2007. Stored Grain Advisor Pro: Decision support system for insect management in commercial grain elevators. J. Stored Prod. Res. 43: 375-383.
Foster, G. W. 1953. Minimum airflow requirements for drying grain with unheated air. Agric. Eng. 34: 681-684.
Harrington, J. F. 1973. Problems of seed storage, pp. 251.-263. In: W. Heydecker (Ed.), Seed Ecology, Pennsylvania State Univ. Press, University Park, PA, and London.
Holman, L.E. 1966. Aeration of grain in commercial storages. Marketing Research Report No. 178. Agricultural Mar-keting Service, Res. Div. U.S. Department of Agriculture, Washington, D.C., 46 p.
Hukill, W.V. 1953. Grain cooling by air. Agr. Eng. 34(7): 456-458.

134 K-State Research and Extension
Part II | Management: Prevention Methods
Minnesota Extension Service. 1996. Department of Biosystems and Agricultural Engineering, University of Minnesota, St. Paul, MN. http://www.bbe.umn.edu/prod/groups/cfans/@pub/@cfans/@bbe/documents/asset/cfans_asset_290086.exe
Montross, M. D. and D. E. Maier. 2001. A new moisture equili-bration theory to predict moisture movement in a non-aerated grain mass. ASAE Paper no. 016110, ASABE, St. Joseph, Michigan. www.asabe.org
Montross, M. D., D. E. Maier, and K. Haghighi. 2002. Valida-tion of a finite–element stored grain ecosystem model. Trans. of the ASAE 45(5): 1465–1474.
Navarro, S. and M. Calderon. 1982. Aeration of Grain in Sub-tropical Climates. FAO Agricultural Services Bulletin No. 52. Rome, Italy, 119 p.
Navarro, S. and R. Noyes. 2002a. (Eds.) The Mechanics and Physics of Modern Grain Aeration Management. CRC Press, Boca Raton, FL 647 pp.
Navarro, S. and R. Noyes. 2002b. Evaluating aeration system efficiency, pp. 561-584. In: Navarro, S. and R. Noyes (Eds.) The Mechanics and Physics of Modern Grain Aeration Management. CRC Press, Boca Raton, FL.
Navarro, S., R. Noyes, and D. S. Jayas. 2002. Stored grain eco-system and heat, and moisture transfer in grain bulks, pp. 35-78. In: S. Navarro and R. Noyes (Eds.), The Mechanics and Physics of Modern Grain Aeration Management. CRC Press, Boca Raton, FL.
Reed, C. R. 2006. Aeration. Pages 141-180 In: Managing Stored Grain to Preserve Quality and Value. AACC International, St. Paul, MN.
Reed, C. and F. H. Arthur. 2000. Aeration, p. 51-72. In: Bh. Subramanyam and D. W. Hagstrum (Eds.), Alternatives to Pesticides in Stored-Product IPM. Kluwer Academic Publishers, New York.
Reed, C. and J. Harner. 1998a. Cooling of stored wheat in mul-tiple or single cycles using automatic aeration controllers. Appl. Eng. Agric. 14: 495-500.
Reed, C. and J. Harner. 1998b. Thermostatically controlled aeration for insect control in stored hard red winter wheat. Appl. Eng. Agric. 14: 501-505.
Reed, C. R, D. W. Hagstrum, P. W. Flinn, and R. F. Allen. 2003. Wheat in bins and discharge spouts, and grain residues on floors of empty bins in concrete grain elevators as habitats for stored-grain beetles and their natural enemies. J. Econ. Entomol. 96: 996-1004.
Robinson, R. N., W. V. Hukill, and G. H. Foster. 1951. Mechan-ical ventilation of stored grain. Agr. Eng. 32(11): 606-608.
Shedd, C.K. 1953. Resistance of grain and seeds to airflow. Trans. ASAE. 34: 616-619.
Vertucci, C. W. and E. E. Roos. 1990. Theoretical basis of proto-cols for seed storage. Plant Physiol. 94(3): 1019-1023.
Publications from Kansas State University are available at: www.ksre.ksu.edu
Publications are reviewed or revised annually by appropriate faculty to reflect current research and practice. Date shown is that of publication or last revision. Contents of this publication may be freely reproduced for educational purposes. All other rights reserved. In each case, credit the authors, Stored Product Protec-tion, Kansas State University, September 2012.
Kansas State University Agricultural Experiment Station and Cooperative Extension ServiceK-State Research and Extension is an equal opportunity provider and employer. Issued in furtherance of Cooperative Extension Work, Acts of May 8 and June 30, 1914, as amended. Kansas State University, County Extension Councils, Extension Districts, and United States Department of Agriculture Cooperating, Gary Pierzynski, Interim Director. S156 – 11 September 2012