stormwater capacity analysis for spout run …...stormwater capacity analysis for spout run...
TRANSCRIPT

Lee Hwy
Arlington Blvd
395
66
Palisades
PimmitRun
LittlePimmit Run,
Mainstem
Stohman'sRun
GulfBranch
DonaldsonRunLittle
Pimmit Run,E. Branch
Pimmit RunTributary Little
Pimmit Run,W. Branch
RixeyBranch
WindyRun
SpoutRun
Four MileRun, UpperMainstem 1
ColonialVillageBranch
Rosslyn
CrossmanRun
WestoverBranch
LubberRun
TorreysonRun
RockyRun
Cemetery/PentagonFour Mile
Run, UpperMainstem 2
Lower LongBranchDoctor's
Branch
UpperLong
Branch
NationalAirport
ArlingtonForestBranch
RoachesRun
Four MileRun, MiddleMainstem
ArlingtonBranch
VirginiaHighlandsBailey's
BranchNauckBranch
Four MileRun, LowerMainstemLucky
RunFairlington/Bradlee
Potomac River
Stormwater Capacity Analysis for Spout Run Watershed
Prepared for Arlington County,
Virginia
January 22, 2013
15010 Conference Center Drive Suite 200
Chantilly, VA 20151

Stormwater Capacity Analysis for Spout Run Watershed: Contents This capacity analysis comprises the material below. Earlier technical memorandums—on GIS data gaps and stormwater capacity, for example—were presented as appendixes to subsequent memorandums; the outline below shows the relationship among the watershed‐specific memorandums.
Design Iterations
Appendix A: Stormwater Capacity Analysis
Appendix A: GIS Data Gaps in the Storm Sewer System
Appendix B: Arlington County Soil Profile Assumptions Used in PCSWMM File
Appendix C: Hyetograph Data
Appendix B: GIS Updates from March 2012 and Rim Updates from September 2012


Design Iterations

1
T E C H N I C A L M E M O R A N D U M
Stormwater Capacity Analysis for Spout Run Watershed: Design Iterations, Arlington County, Virginia PREPARED FOR: Arlington County, Virginia
PREPARED BY: CH2M HILL
COPIES: Tara Ajello/CH2M HILL Rita Fordiani/CH2M HILL
DATE: January 22, 2013
PROJECT NUMBER: 240033.T5.SP.05.01
Contents Executive Summary ............................................................................................................................ 5 1 Introduction and Project Objectives ...................................................................................... 11 2 Background ............................................................................................................................... 11
2.1 Existing System Versus Modeled System ................................................................... 11 2.2 Data Sources and Review ............................................................................................. 12 2.3 Hydrologic and Hydraulic Modeling ......................................................................... 17
3 Technical Approach ................................................................................................................. 17 4 Results ....................................................................................................................................... 18
4.1 PCSWMM Terminology ................................................................................................ 18 4.2 June 2006 Event .............................................................................................................. 21 4.3 10yr-24hr SCS Type II Storm ........................................................................................ 67
5 Summary ................................................................................................................................... 85
Appendixes
A Stormwater Capacity Analysis for Spout Run Watershed, Arlington County, Virginia (Task 2)
B GIS Updates from March 2012 and Rim Updates from September 2012
Tables
1 Comparison of Existing Spout Run Stormwater System and Modeled System ............. 11 2 June 2006 Storm Event: Final Iteration Results Summary ................................................. 23 3 10-yr, 24-hr SCS Type II Storm Event: Final Iteration Results Summary ........................ 69
Figures
1 June 2006 Storm .......................................................................................................................... 7 2 10-yr 24-hr Storm ....................................................................................................................... 9

STORMWATER CAPACITY ANALYSIS FOR SPOUT RUN WATERSHED: DESIGN ITERATIONS, ARLINGTON COUNTY, VIRGINIA
2
3 Existing Stormwater Collection System ................................................................................ 13 4 Modeled Stormwater Collection System .............................................................................. 15 5 Spout Run Branches ................................................................................................................. 19 6 Recommended Additional Capacity for the June 2006 Storm Event ................................ 39 7 Fairfax Dr. from N. Monroe St. to N. Kenmore St. for the June 2006 Storm Event ......... 41 8 N. Woodrow St. to 19th Rd. N. for the June 2006 Storm Event ......................................... 43 9 19th Rd. N. to 18th St. N. (West Pipe) for the June 2006 Storm Event .............................. 45 10 20th St. N. to 19th Rd. N. (East Pipe) for the June 2006 Storm Event ................................ 47 11 19th Rd. N. to 18th St. N. (East Pipe) for the June 2006 Storm Event ................................ 49 12 18th St. N. to 16th St. N. for the June 2006 Storm Event ..................................................... 51 13 N. Taylor St. from 19th Rd. N. to 16th St. N. for the June 2006 Storm Event ................... 53 14 20th St. N. to 19th St. N. for the June 2006 Storm Event ..................................................... 55 15 19th. St. N. to 18th St. N. for the June 2006 Storm Event .................................................... 57 16 N. Quincy St. to N. Monroe St. for the June 2006 Storm Event ......................................... 59 17 N. Monroe St. to Kirkwood Rd. for the June 2006 Storm Event ........................................ 61 18 Lee Hwy from N. Kenmore St. to Kirkwood Rd. for the June 2006 Storm Event ........... 63 19 N. Highland St. to Kirkwood Rd. for the June 2006 Storm Event ..................................... 65 20 Recommended Additional Capacity for 10yr-24hr Storm Event ...................................... 85 21 N. Quincy St. and 10th St. N. to N. Monroe St. for the 10-yr 24-hr Storm Event ............ 87 22 9th St. N. from N. Randolph St. to N. Oakland St. for the 10-yr 24-hr Storm Event ...... 89 23 9th St. N. and N. Monroe St. to Fairfax Dr. for the 10-yr 24-hr Storm Event ................... 91 24 Fairfax Dr. from N. Monroe St. to N. Kenmore St. for the 10-yr 24-hr Storm Event ...... 93 25 Kirkwood Rd. from N. Kenmore St. to Washington Blvd. for the 10-yr 24-hr
Storm Event ............................................................................................................................... 95 26 Kirkwood Rd. from Washington Blvd. to 14th St. N. for the 10-yr 24-hr
Storm Event ............................................................................................................................... 97 27 Kirkwood Rd. from 14th St. N. to 18th St. N. for the 10-yr 24-hr Storm Event ............... 99 28 N. Herndon St. to Kirkwood Rd. for the 10-yr 24-hr Storm Event .................................. 101 29 N. Woodrow St. to 19th Rd. N. for the 10-yr 24-hr Storm Event ..................................... 103 30 19th Rd. N. to 18th St. N. (West Pipe) for the 10-yr 24-hr Storm Event .......................... 105 31 20th St. N. to 19th Rd. N. (East Pipe) for the 10-yr 24-hr Storm Event ........................... 107 32 19th Rd. N. to 18th St. N. (East Pipe) for the 10-yr 24-hr Storm Event ........................... 109 33 19th Rd. N. to 18th St. N. (Link) for the 10-yr 24-hr Storm Event ................................... 111 34 18th St. N. to 16th St. N. for the 10-yr 24-hr Storm Event ................................................. 113 35 N. Taylor St. from 19th Rd. N. to 16th St. N. for the 10-yr 24-hr Storm Event .............. 115 36 I-66 from 16th St. N. to N. Nelson St. for the 10-yr 24-hr Storm Event ........................... 117 37 I-66 and Kirkwood Rd. to 18th St. N. for the 10-yr 24-hr Storm Event ........................... 119 38 N. Nelson St. to I-66 for the 10-yr 24-hr Storm Event ....................................................... 121 39 I-66 from 18th St. N. to Kirkwood Rd. (West Pipe) for the 10-yr 24-hr
Storm Event ............................................................................................................................. 123 40 20th St. N. to 19th St. N. for the 10-yr 24-hr Storm Event ................................................. 125 41 19th. St. N. to 18th St. N. for the 10-yr 24-hr Storm Event ................................................ 127 42 Kirkwood Rd. to I-66 (West Pipe) for the 10-yr 24-hr Storm Event ................................ 129 43 N. Quincy St. to N. Monroe St. for the 10-yr 24-hr Storm Event ..................................... 131 44 N. Monroe St. to Kirkwood Rd. for the 10-yr 24-hr Storm Event .................................... 133 45 Lee Hwy from N. Kenmore St. to Kirkwood Rd. for the 10-yr 24-hr
Storm Event ............................................................................................................................. 135

STORMWATER CAPACITY ANALYSIS FOR SPOUT RUN WATERSHED: DESIGN ITERATIONS, ARLINGTON COUNTY, VIRGINIA
3
46 Kirkwood Rd. to I-66 (East Pipe) for the 10-yr 24-hr Storm Event ................................. 137 47 N. Highland St. to Kirkwood Rd. for the 10-yr 24-hr Storm Event ................................ 139

STORMWATER CAPACITY ANALYSIS FOR SPOUT RUN WATERSHED: DESIGN ITERATIONS, ARLINGTON COUNTY, VIRGINIA
5
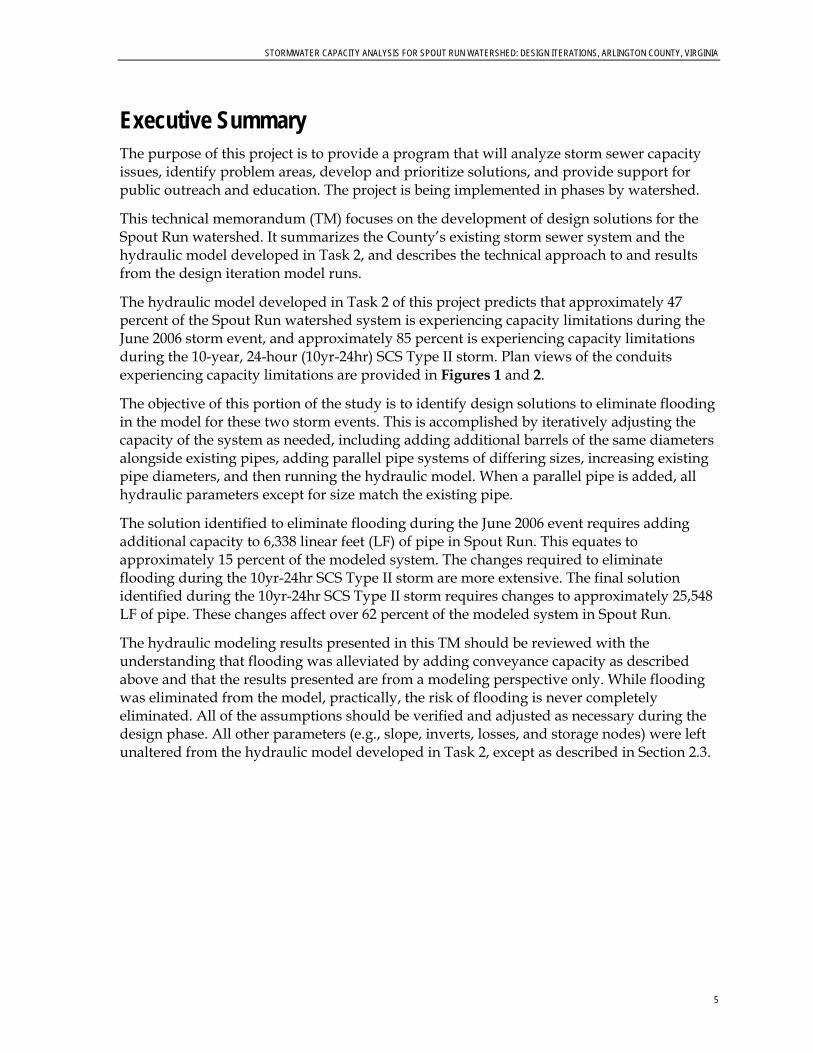
Executive Summary The purpose of this project is to provide a program that will analyze storm sewer capacity issues, identify problem areas, develop and prioritize solutions, and provide support for public outreach and education. The project is being implemented in phases by watershed.
This technical memorandum (TM) focuses on the development of design solutions for the Spout Run watershed. It summarizes the County’s existing storm sewer system and the hydraulic model developed in Task 2, and describes the technical approach to and results from the design iteration model runs.
The hydraulic model developed in Task 2 of this project predicts that approximately 47 percent of the Spout Run watershed system is experiencing capacity limitations during the June 2006 storm event, and approximately 85 percent is experiencing capacity limitations during the 10-year, 24-hour (10yr-24hr) SCS Type II storm. Plan views of the conduits experiencing capacity limitations are provided in Figures 1 and 2.
The objective of this portion of the study is to identify design solutions to eliminate flooding in the model for these two storm events. This is accomplished by iteratively adjusting the capacity of the system as needed, including adding additional barrels of the same diameters alongside existing pipes, adding parallel pipe systems of differing sizes, increasing existing pipe diameters, and then running the hydraulic model. When a parallel pipe is added, all hydraulic parameters except for size match the existing pipe.
The solution identified to eliminate flooding during the June 2006 event requires adding additional capacity to 6,338 linear feet (LF) of pipe in Spout Run. This equates to approximately 15 percent of the modeled system. The changes required to eliminate flooding during the 10yr-24hr SCS Type II storm are more extensive. The final solution identified during the 10yr-24hr SCS Type II storm requires changes to approximately 25,548 LF of pipe. These changes affect over 62 percent of the modeled system in Spout Run.
The hydraulic modeling results presented in this TM should be reviewed with the understanding that flooding was alleviated by adding conveyance capacity as described above and that the results presented are from a modeling perspective only. While flooding was eliminated from the model, practically, the risk of flooding is never completely eliminated. All of the assumptions should be verified and adjusted as necessary during the design phase. All other parameters (e.g., slope, inverts, losses, and storage nodes) were left unaltered from the hydraulic model developed in Task 2, except as described in Section 2.3.


FIGURE 1June 2006 StormSpout Run WatershedArlington County Storm Capacity Analysis
H:\ARLINGTONVACOUNTYOF\392309STORMWATERCAP\WSSPOUT\WORKINGGIS\LAYOUT\INTERNAL\DESIGN_ITERATIONS\FIGURE1_2006_STORM_EVENT_CONVEYANCE_CAPACITY.MXD FCAIN 7/2/2012 9:22:03 AM
VICINITY MAP
N Pershing Dr
Lorcom Ln
Wilson Blvd
N George Mason Dr
26th St N
N Monroe St
N Highl and St15th St N
N Bar ton St
16th St N
10th St N
Spout Run Pkwy
N Harrison St
Clarendon Blvd
George Washington Memorial Pkwy
Fairfax Dr
Wilson Blvd
Mili t ary Rd
Kirkw
ood R
d
N Utah St
N Staffo rd St
N Quincy St
Canal Rd NW
N Glebe Rd
Washington Blvd
Washington Blvd
Old Dominion Dr
Arlington Blvd
Lee Hwy
66
LegendFloodedInsufficient FreeboardSurchargedSufficient Conveyance CapacityStreamsRoadsModeled (Revised) Watershed Boundary
0 1,200600Feet


FIGURE 210-yr 24-hr StormSpout Run WatershedArlington County Storm Capacity Analysis
H:\ARLINGTONVACOUNTYOF\392309STORMWATERCAP\WSSPOUT\WORKINGGIS\LAYOUT\INTERNAL\DESIGN_ITERATIONS\FIGURE2_10YR24HR_STORM_EVENT_CONVEYANCE_CAPACITY.MXD FCAIN 7/2/2012 9:23:29 AM
VICINITY MAP
N Pershing Dr
Lorcom Ln
N George Mason Dr
26th St N
N Monroe St
N Highl and St15th St N
N Bar ton St
16th St N
10th St N
Spout Run Pkwy
N Harrison St
Clarendon Blvd
George Washington Memorial Pkwy
Fairfax Dr
Wilson Blvd
Mili t ary Rd
Kirkw
ood R
d
N Utah St
N Staffo rd St
N Quincy St
Canal Rd NW
N Glebe Rd
Washington Blvd
Washington Blvd
Old Dominion Dr
Arlington Blvd
Lee Hwy
66
LegendFloodedInsufficient FreeboardSurchargedSufficient Conveyance CapcityStreamsRoadsModeled (Revised) Watershed Boundary
0 1,200600Feet


STORMWATER CAPACITY ANALYSIS FOR SPOUT RUN WATERSHED: DESIGN ITERATIONS, ARLINGTON COUNTY, VIRGINIA
11
1 Introduction and Project Objectives The work described in this TM is one of the elements of a storm sewer capacity analysis project. In discussions with representatives from Arlington County, it is understood that the County is undertaking a larger effort to update and combine the 1996 Storm Water Master Plan and the 2001 Watershed Management Plan. This TM addresses the final task (Task 4) of suggesting design solutions to the capacity problems previously identified in the modeling in Task 2 of the overall project.
2 Background 2.1 Existing System Versus Modeled System The stormwater collection system elements include the following:
Closed conduits, such as gravity sewers and culverts
Stream channel segments and ditches (stream segments connected to 36-inch-diameter conveyances were included in the model; no ditch segments were included in the model)
One pond (not modeled)
Drainage inlets and junctions, such as roadside curb inlets, manholes, catchbasins, and yard and grate inlets
Elements of the ArcGIS existing stormwater collection system and the corresponding stormwater model developed for the Spout Run watershed are summarized in Table 1. The modeling effort includes the storm sewer network of pipes 36 inches in diameter and larger. The table reflects updated GIS information provided by the County in March 2012. This is discussed in greater detail in Section 2.2.
TABLE 1 Comparison of Existing Spout Run Stormwater System and Modeled System
Stormwater System Element Existing Modeled
Drainage area (acres) 1,123 1,071 Number of conveyance segments in stormwater systema 2,396 381 Total length of conveyance segments in stormwater system (linear feet)b
179,894 44,873
Size range (in.)c 4–125 30–120 Number of circular pipe segments 2,242 316 Number of noncircular pipe segments 60 38 Number of stream channel and ditch segments 81 21 Total length of stream channel segments (linear feet) 9,445 3,462 Number of other segments 13 0 Total length of other segments (linear feet) 489 0
STORMWATER CAPACITY ANALYSIS FOR SPOUT RUN WATERSHED: DESIGN ITERATIONS, ARLINGTON COUNTY, VIRGINIA
12
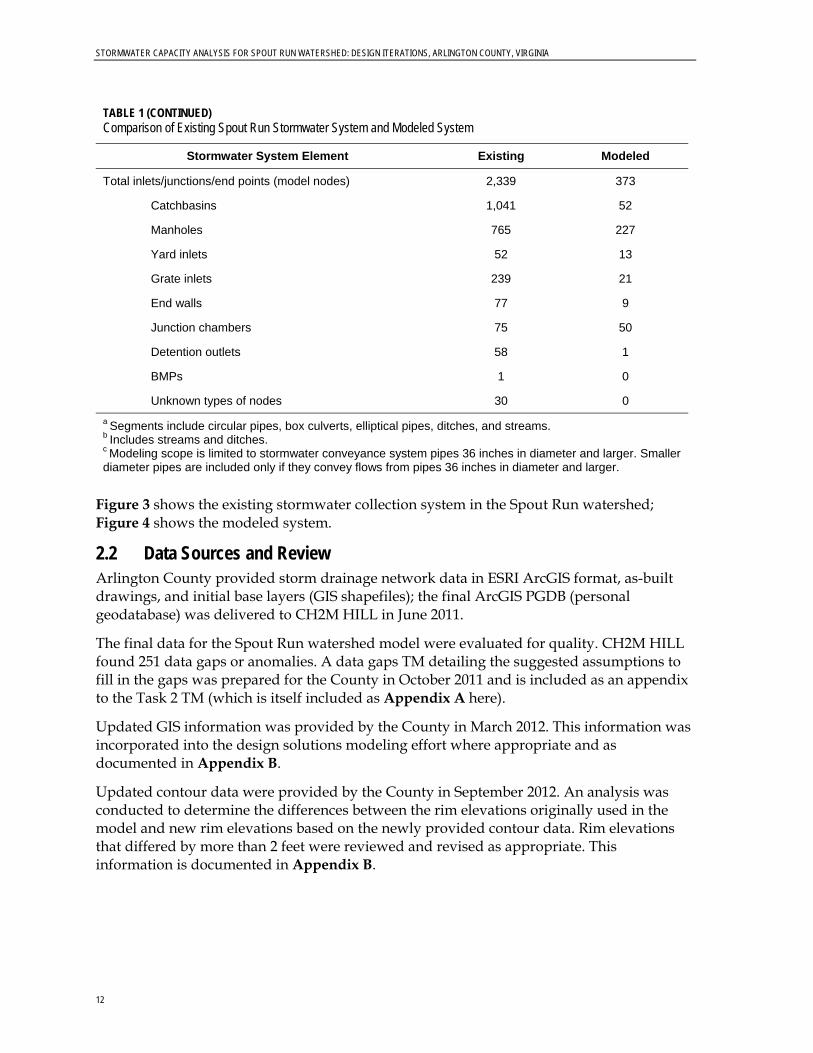
TABLE 1 (CONTINUED) Comparison of Existing Spout Run Stormwater System and Modeled System
Stormwater System Element Existing Modeled
Total inlets/ junctions/ end points (model nodes) 2,339 373 Catchbasins 1,041 52 Manholes 765 227 Yard inlets 52 13 Grate inlets 239 21 End walls 77 9 Junction chambers 75 50 Detention outlets 58 1 BMPs 1 0 Unknown types of nodes 30 0 a Segments include circular pipes, box culverts, elliptical pipes, ditches, and streams. b Includes streams and ditches. c Modeling scope is limited to stormwater conveyance system pipes 36 inches in diameter and larger. Smaller diameter pipes are included only if they convey flows from pipes 36 inches in diameter and larger.
Figure 3 shows the existing stormwater collection system in the Spout Run watershed; Figure 4 shows the modeled system.
2.2 Data Sources and Review Arlington County provided storm drainage network data in ESRI ArcGIS format, as-built drawings, and initial base layers (GIS shapefiles); the final ArcGIS PGDB (personal geodatabase) was delivered to CH2M HILL in June 2011.
The final data for the Spout Run watershed model were evaluated for quality. CH2M HILL found 251 data gaps or anomalies. A data gaps TM detailing the suggested assumptions to fill in the gaps was prepared for the County in October 2011 and is included as an appendix to the Task 2 TM (which is itself included as Appendix A here).
Updated GIS information was provided by the County in March 2012. This information was incorporated into the design solutions modeling effort where appropriate and as documented in Appendix B.
Updated contour data were provided by the County in September 2012. An analysis was conducted to determine the differences between the rim elevations originally used in the model and new rim elevations based on the newly provided contour data. Rim elevations that differed by more than 2 feet were reviewed and revised as appropriate. This information is documented in Appendix B.
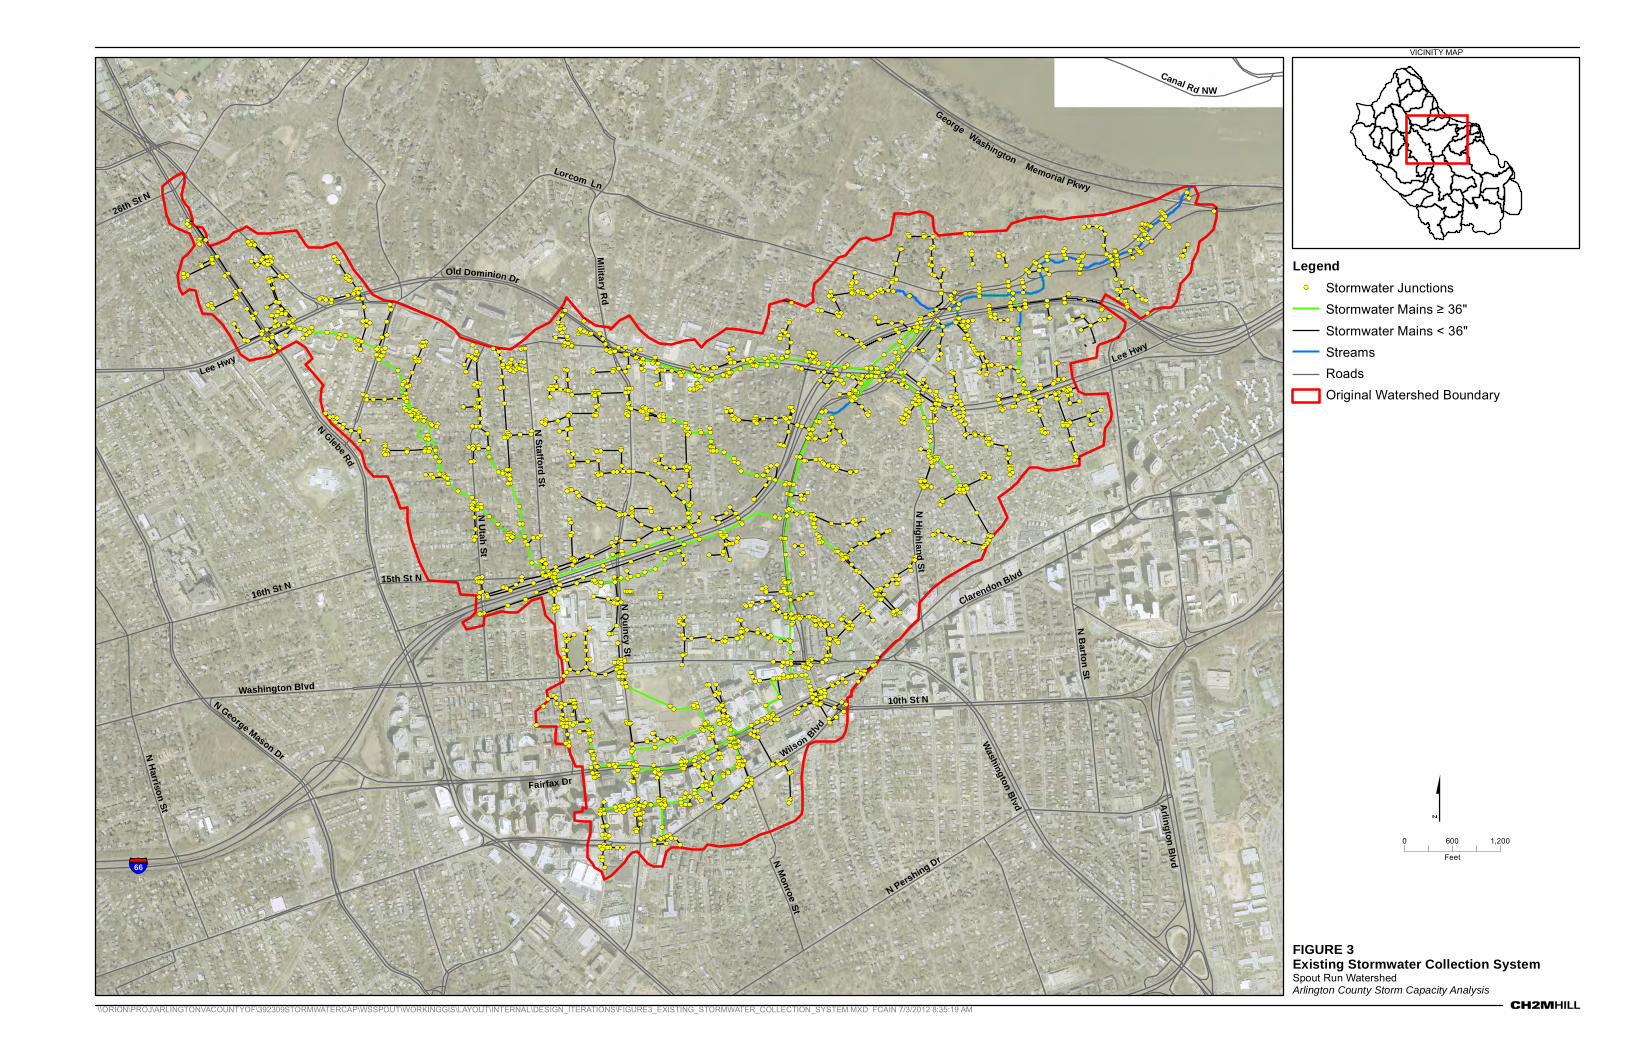
FIGURE 3Existing Stormwater Collection SystemSpout Run WatershedArlington County Storm Capacity Analysis
\\ORION\PROJ\ARLINGTONVACOUNTYOF\392309STORMWATERCAP\WSSPOUT\WORKINGGIS\LAYOUT\INTERNAL\DESIGN_ITERATIONS\FIGURE3_EXISTING_STORMWATER_COLLECTION_SYSTEM.MXD FCAIN 7/3/2012 8:35:19 AM
VICINITY MAP
N Pershing Dr
Lorcom Ln
N George Mason Dr
26th St N
N Monroe St
N Highl and St
15th St N
N Bar ton St
16th St N
10th St N
N Harrison St
Clarendon Blvd
George Washington Memorial Pkwy
Fairfax Dr
Wilson Blvd
Mili t ary Rd
N Utah St
N Staffo rd St
N Quincy St
Canal Rd NW
N Glebe Rd
Washington Blvd
Washington Blvd
Old Dominion Dr
Arlington Blvd
Lee Hwy
Lee Hwy
66
LegendStormwater JunctionsStormwater Mains ≥ 36"Stormwater Mains < 36"StreamsRoadsOriginal Watershed Boundary
0 1,200600Feet


FIGURE 4Modeled Stormwater Collection SystemSpout Run WatershedArlington County Storm Capacity Analysis
H:\ARLINGTONVACOUNTYOF\392309STORMWATERCAP\WSSPOUT\WORKINGGIS\LAYOUT\INTERNAL\DESIGN_ITERATIONS\FIGURE4_MODELED_STORMWATER_COLLECTION_SYSTEM.MXD FCAIN 7/2/2012 9:25:03 AM
VICINITY MAP
N Pershing Dr
Lorcom Ln
Wilson Blvd
N George Mason Dr
26th St N
N Monroe St
N Highl and St15th St N
N Bar ton St
16th St N
10th St N
Spout Run Pkwy
N Harrison St
Clarendon Blvd
George Washington Memorial Pkwy
Fairfax Dr
Wilson Blvd
Mili t ary Rd
Kirkw
ood R
d
N Utah St
N Staffo rd St
N Quincy St
Canal Rd NW
N Glebe Rd
Washington Blvd
Washington Blvd
Old Dominion Dr
Arlington Blvd
Lee Hwy
66
LegendModeled Stormwater JunctionsModeled Stormwater Mains ≥ 36"StreamsRoadsModeled (Revised) Watershed Boundary
0 1,200600Feet


STORMWATER CAPACITY ANALYSIS FOR SPOUT RUN WATERSHED: DESIGN ITERATIONS, ARLINGTON COUNTY, VIRGINIA
17
2.3 Hydrologic and Hydraulic Modeling The hydrologic modeling task includes several steps: defining subwatershed boundaries, identifying hydrologic node connections, estimating hydrologic parameters for each subwatershed, and identifying rainfall distributions to analyze. ArcHydro Tools 9.2 and HEC-GeoHMS were used to delineate the subwatersheds and determine hydrologic parameters. The County chose two events for these modeling activities: the June 2006 storm event and the 10yr-24hr SCS Type II distribution.
The hydraulic modeling task includes three steps: (1) importing the stormwater network and physical data into PCSWMM version 2011, the stormwater management model selected for this project; (2) defining the boundary conditions for each hydrologic scenario; and (3) evaluating the hydraulic performance of the stormwater drainage system for the two storm event scenarios. Figure 1 and Figure 2 identify the areas from the Task 2 capacity analysis TM (Appendix A) where there was flooding in the June 2006 storm and the SCS Type II 10yr-24hr storm, respectively.
3 Technical Approach The model developed during Task 2 using the methodology described in Section 2.3 served as the basis for the iterative design modeling described in this TM. Design iterations were run for the June 2006 and the 10yr-24hr SCS Type II storms. The goal of Task 4 is to eliminate all flooding and rim conditions in the existing conditions model, but not necessarily insufficient freeboard (less than 1 foot of separation between the ground elevation and the hydraulic grade line, or HGL) or surcharge conditions. The general objective is to strategically add additional barrels or parallel pipes to the existing system. For convention, adding an additional barrel is adding an identical conduit (identical for every parameter: size, slope, etc.); adding a parallel pipe is adding a conduit that differs from the existing system, typically by having a different size or other parameter, such as slope. The following approach was used to optimize the capacity needed to eliminate system flooding:
1. Start with the base model that includes storage in the most-upstream nodes as developed in the Task 2 capacity analysis. It is assumed that capacity issues in the minor systems will be addressed and that the flows entering the modeled system should remain as currently modeled.
2. Add pipe barrels (identical conduits). For reconstructing existing sewer systems, it is often easier to expand a system either vertically or horizontally. Arlington County has requested that we first consider horizontal expansion by adding an additional barrel or parallel pipe to increase conveyance of the existing system. Pipe barrels were added according to the following:
Connect additional barrels to existing manhole structures. Start with an equivalent diameter in the flooded area. Match existing inverts to ensure hydraulic continuity at the downstream end of each modified section. If multiple barrels already exist, the lowest invert should be used for any added barrels.
If too little or too much capacity is provided by the additional barrel, change the additional barrel to a parallel conduit and increase or decrease the diameter as
STORMWATER CAPACITY ANALYSIS FOR SPOUT RUN WATERSHED: DESIGN ITERATIONS, ARLINGTON COUNTY, VIRGINIA
18
needed. Avoid altering the existing system. If the diameter of the parallel conduit required is 12 inches or smaller, then increasing the existing system diameter may be considered instead.
Do not add additional model nodes unless absolutely necessary.
3. Begin adding pipe barrels/parallel conduits immediately downstream of a flooded node or conduit and work upstream. Try not to exceed the diameter of the most downstream conduit. Try to minimize diameter changes and work only as far upstream as needed for the flooded segment.
4. Do not be concerned about minimum cover beyond a minimum of at least 3 inches. However, do check pipe daylighting; make a round pipe rectangular as needed. As pipe size is increased, examine any downstream stream cross sections to ensure no flow is lost; if it is, consider extending the cross-section geometry based on contours.
4 Results To better display the results, Spout Run was split into three branches, shown in Figure 5:
North South West
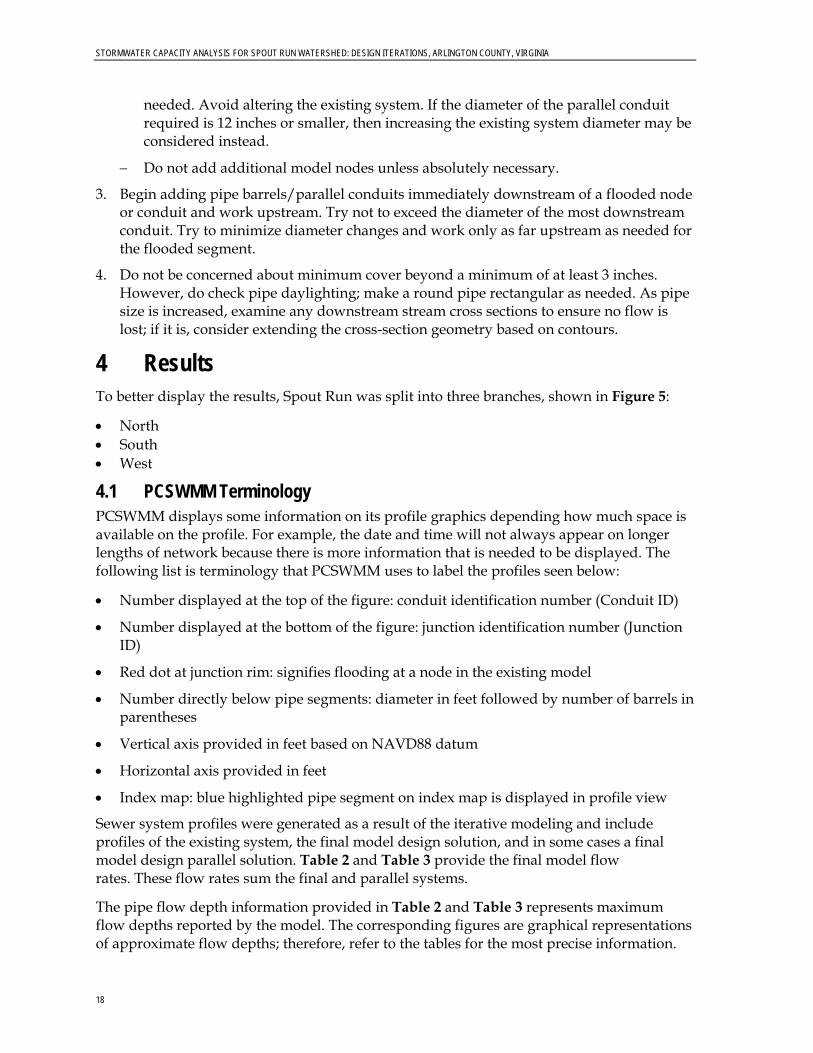
4.1 PCSWMM Terminology PCSWMM displays some information on its profile graphics depending how much space is available on the profile. For example, the date and time will not always appear on longer lengths of network because there is more information that is needed to be displayed. The following list is terminology that PCSWMM uses to label the profiles seen below:
Number displayed at the top of the figure: conduit identification number (Conduit ID)
Number displayed at the bottom of the figure: junction identification number (Junction ID)
Red dot at junction rim: signifies flooding at a node in the existing model
Number directly below pipe segments: diameter in feet followed by number of barrels in parentheses
Vertical axis provided in feet based on NAVD88 datum
Horizontal axis provided in feet
Index map: blue highlighted pipe segment on index map is displayed in profile view
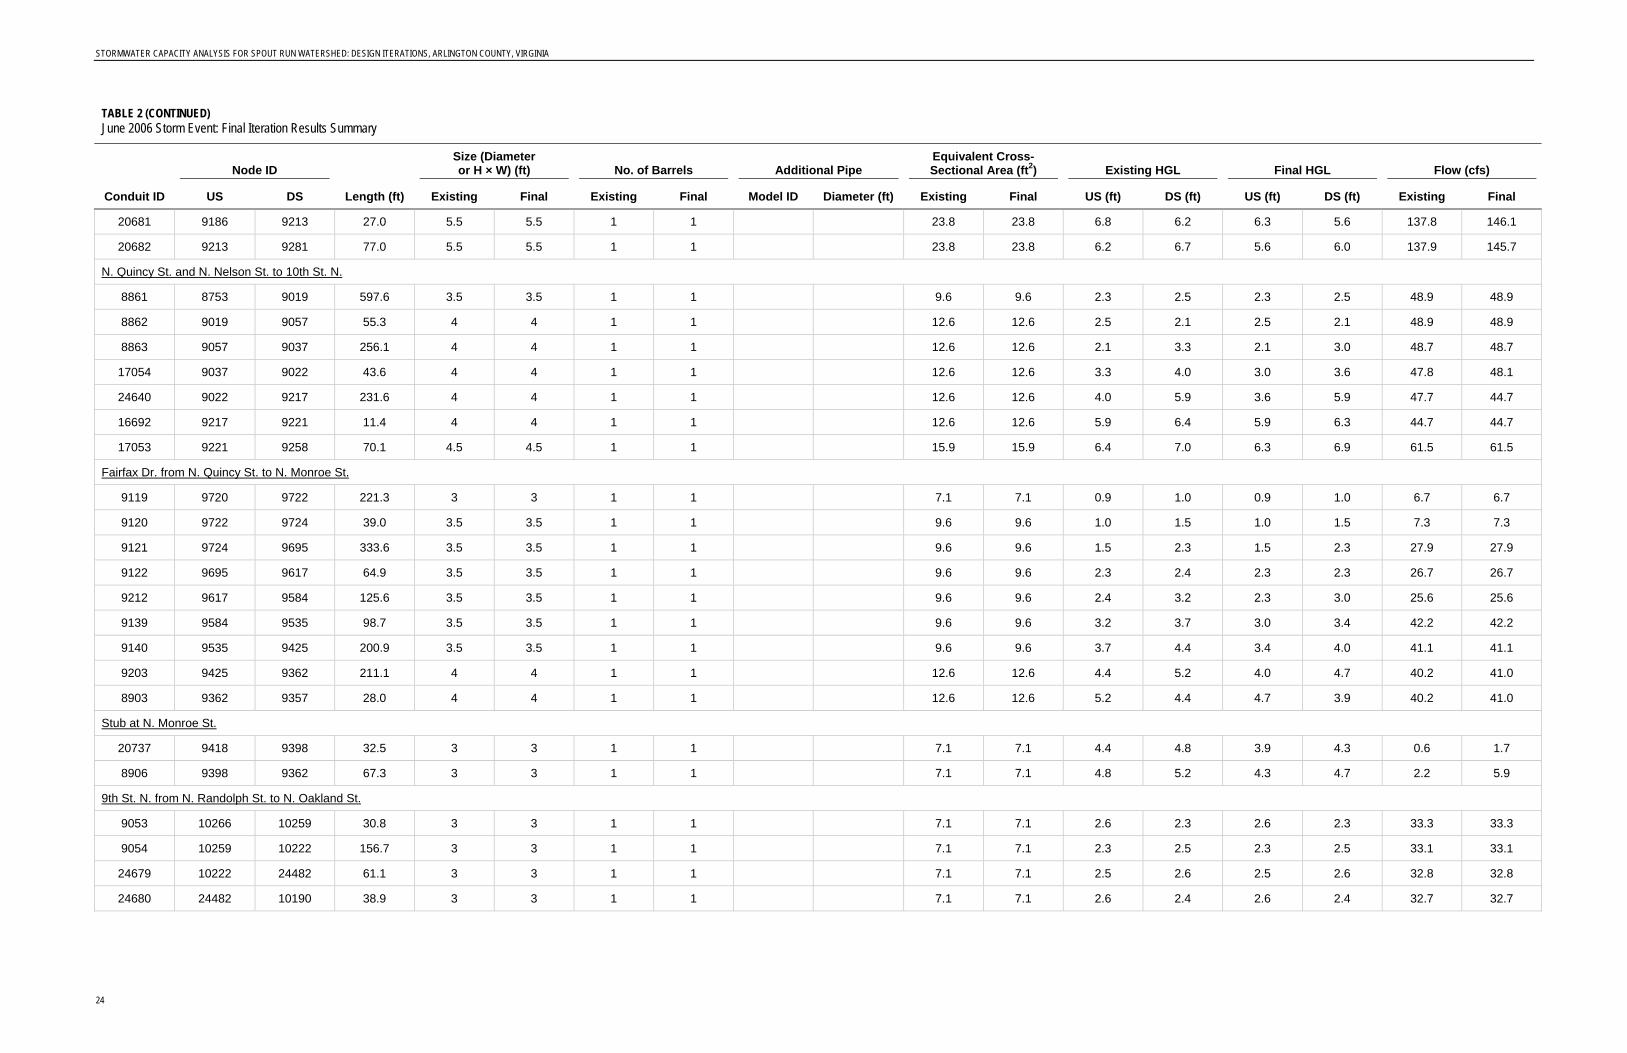
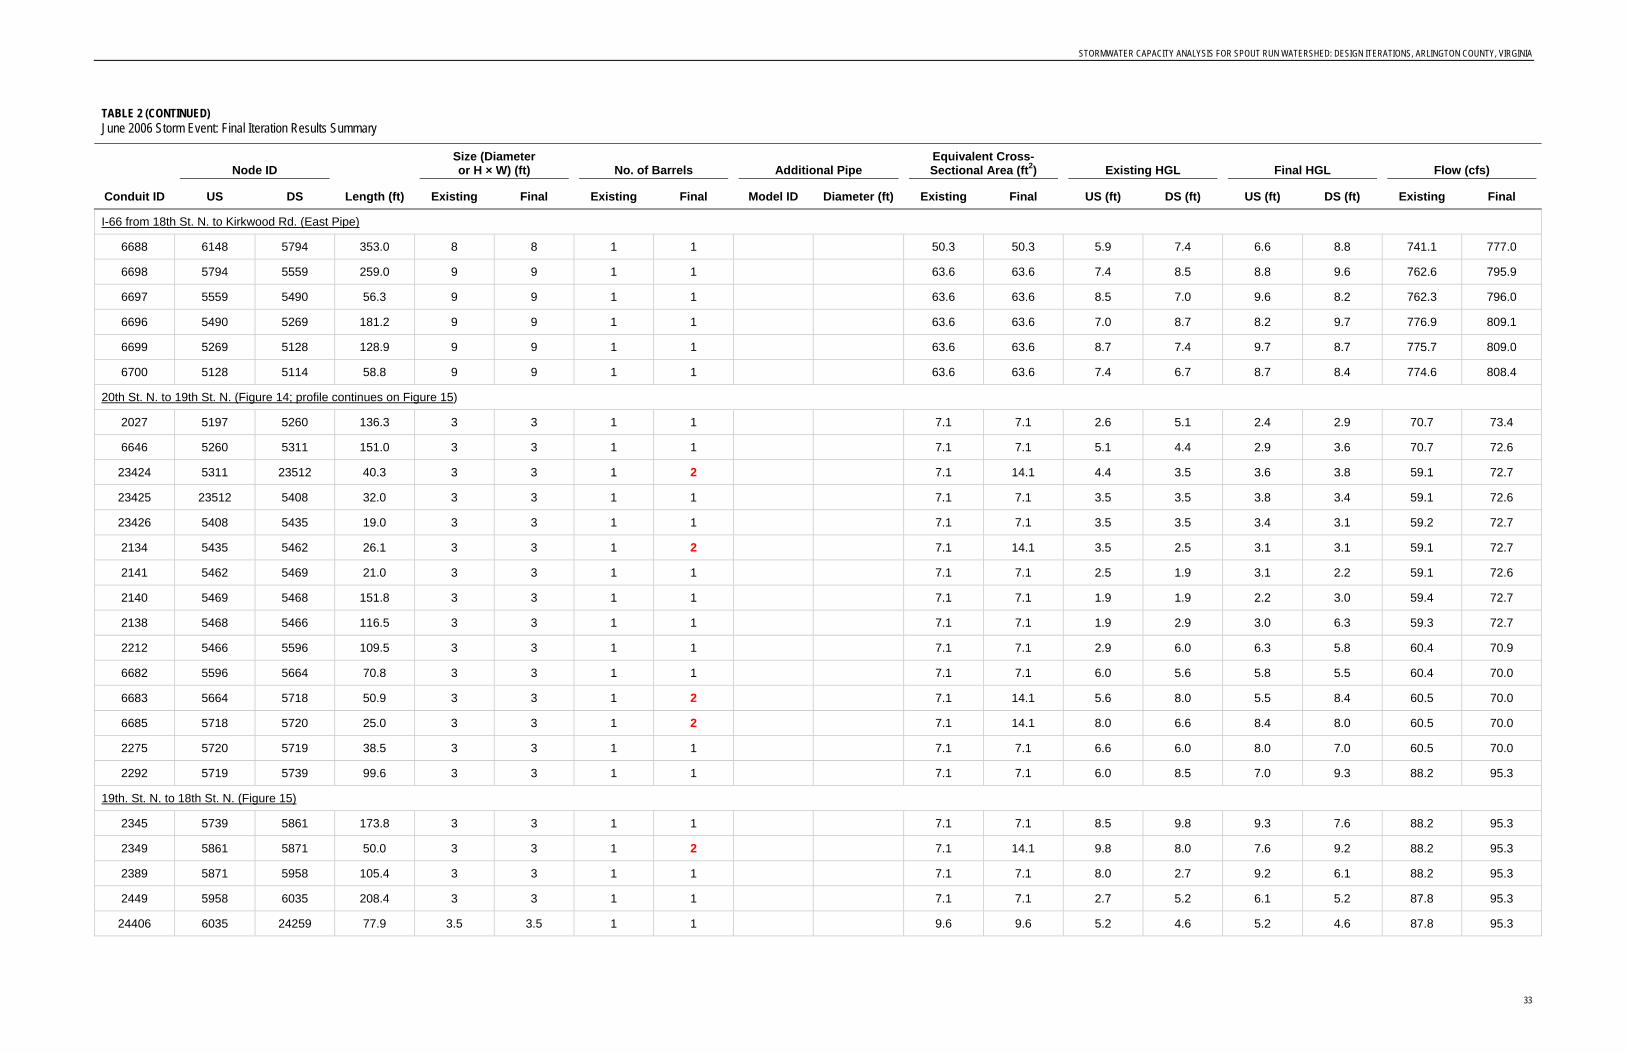
Sewer system profiles were generated as a result of the iterative modeling and include profiles of the existing system, the final model design solution, and in some cases a final model design parallel solution. Table 2 and Table 3 provide the final model flow rates. These flow rates sum the final and parallel systems.
The pipe flow depth information provided in Table 2 and Table 3 represents maximum flow depths reported by the model. The corresponding figures are graphical representations of approximate flow depths; therefore, refer to the tables for the most precise information.

FIGURE 5Spout Run BranchesSpout Run WatershedArlington County Storm Capacity Analysis
H:\ARLINGTONVACOUNTYOF\392309STORMWATERCAP\WSSPOUT\WORKINGGIS\LAYOUT\INTERNAL\DESIGN_ITERATIONS\FIGURE5_SPOUT_RUN_BRANCHES.MXD FCAIN 7/25/2012 12:52:30 PM
VICINITY MAP
N Pershing Dr
Lorcom Ln
Wilson Blvd
N George Mason Dr
26th St N
N Monroe St
N Highl and St15th St N
N Bar ton St
16th St N
10th St N
Spout Run Pkwy
N Harrison St
Clarendon Blvd
George Washington Memorial Pkwy
Fairfax Dr
Wilson Blvd
Mili t ary Rd
Kirkw
ood R
d
N Utah St
N Staffo rd St
N Quincy St
Canal Rd NW
N Glebe Rd
Washington Blvd
Washington Blvd
Old Dominion Dr
Arlington Blvd
Lee Hwy
66
LegendWest BranchSouth BranchNorth BranchRoadsModeled (Revised) Watershed Boundary
0 1,200600Feet


STORMWATER CAPACITY ANALYSIS FOR SPOUT RUN WATERSHED: DESIGN ITERATIONS, ARLINGTON COUNTY, VIRGINIA
21
4.2 June 2006 Event For the June 2006 event, capacity was added to 66 pipes (6,338 LF of pipe in total). This equates to approximately 15 percent of the modeled pipe network in Spout Run.
Changes to diameter and the existing and resulting flows are summarized in Table 2. A map showing the June 2006 storm upgrade locations throughout the watershed is included in Figure 6. Profiles showing the existing conditions and final results are shown in Figure 7 through Figure 19. Profiles were displayed only for segments of the stormwater network where any of the following conditions were met:
Pipe size was increased An identical barrel was added to the system An additional pipe was added to the system
The existing model profile depicts the peak water surface elevation with solid blue fill and peak HGL with a dark blue line. The HGL represents the sum of the pressure head and the elevation head along the profile. Flooded nodes in the existing condition model are annotated with a red dot behind the junction rim. The final profile also displays the existing system HGL with a dark green line for reference.


STORMWATER CAPACITY ANALYSIS FOR SPOUT RUN WATERSHED: DESIGN ITERATIONS, ARLINGTON COUNTY, VIRGINIA
23
TABLE 2 June 2006 Storm Event: Final Iteration Results Summary
Conduit ID
Node ID
Length (ft)
Size (Diameter or H × W) (ft) No. of Barrels Additional Pipe
Equivalent Cross-Sectional Area (ft2) Existing HGL Final HGL Flow (cfs)
US DS Existing Final Existing Final Model ID Diameter (ft) Existing Final US (ft) DS (ft) US (ft) DS (ft) Existing Final
South Branch
N. Randolph St. and Fairfax Dr. to N. Quincy St. 8875 9180 9286 111.0 3 3 1 1 7.1 7.1 3.0 2.5 3.0 2.5 39.7 39.7 8876 9286 9317 41.5 3 3 1 1 7.1 7.1 2.5 2.3 2.5 2.3 39.3 39.3 8877 9317 9370 84.8 3 3 1 1 7.1 7.1 2.3 2.9 2.3 2.9 38.9 38.9 9136 9370 9496 143.5 3 3 1 1 7.1 7.1 2.9 3.7 2.9 3.7 38.5 38.5 9088 9496 9546 44.1 3 3 1 1 7.1 7.1 3.7 2.7 3.7 2.7 38.5 38.5 9089 9546 9597 50.0 3 3 1 1 7.1 7.1 2.7 3.2 2.7 3.2 38.4 38.4 9090 9597 9657 67.2 3.5 3.5 1 1 9.6 9.6 3.2 2.2 3.2 2.2 38.4 38.4 9091 9657 9694 33.2 3.5 3.5 1 1 9.6 9.6 2.2 2.2 2.2 2.2 38.4 38.4 9092 9694 9701 11.1 3.5 3.5 1 1 9.6 9.6 2.2 2.1 2.2 2.1 38.4 38.4 9093 9701 9700 12.5 4 4 1 1 12.6 12.6 2.1 2.3 2.1 2.3 38.4 38.4 9102 9700 9677 142.8 4 4 1 1 12.6 12.6 2.3 2.5 2.3 2.5 42.6 42.6 9103 9677 9670 52.4 4 4 1 1 12.6 12.6 2.5 2.7 2.5 2.7 42.7 42.7 9104 9670 9666 43.2 4 4 1 1 12.6 12.6 2.7 2.9 2.7 2.9 42.9 42.9 9105 9666 9656 156.3 4 4 1 1 12.6 12.6 2.9 4.0 2.9 3.9 76.8 76.8 9106 9656 9652 46.3 4 4 1 1 12.6 12.6 4.0 4.0 3.9 3.9 76.3 76.3
N. Quincy St. and 10th St. N. to N. Monroe St. 9108 9652 9498 153.1 4.5 4.5 1 1 15.9 15.9 4.0 4.2 3.9 3.8 75.9 75.9 9109 9498 9471 36.0 4.5 4.5 1 1 15.9 15.9 4.2 4.0 3.8 3.6 75.7 75.6 9107 9471 9443 270.7 4.5 4.5 1 1 15.9 15.9 4.0 4.6 3.6 4.2 75.8 75.2 9138 9443 9375 260.8 4.5 4.5 1 1 15.9 15.9 4.6 5.9 4.2 5.4 73.1 73.9 8944 9375 9269 375.6 5 5 1 1 19.6 19.6 5.9 6.4 5.4 6.2 99.3 94.7 8886 9269 9258 93.1 5 5 1 1 19.6 19.6 6.4 7.0 6.2 6.9 99.3 94.7 8908 9258 9250 21.9 5.5 5.5 1 1 23.8 23.8 7.0 7.0 6.9 6.8 137.8 146.1 8909 9250 9210 122.6 5.5 5.5 1 1 23.8 23.8 7.0 7.1 6.8 6.8 137.8 146.0 8910 9210 9187 50.6 5.5 5.5 1 1 23.8 23.8 7.1 7.1 6.8 6.7 137.8 146.1 8913 9187 9186 49.5 5.5 5.5 1 1 23.8 23.8 7.1 6.8 6.7 6.3 137.8 146.1
STORMWATER CAPACITY ANALYSIS FOR SPOUT RUN WATERSHED: DESIGN ITERATIONS, ARLINGTON COUNTY, VIRGINIA
24
TABLE 2 (CONTINUED) June 2006 Storm Event: Final Iteration Results Summary
Conduit ID
Node ID
Length (ft)
Size (Diameter or H × W) (ft) No. of Barrels Additional Pipe
Equivalent Cross-Sectional Area (ft2) Existing HGL Final HGL Flow (cfs)
US DS Existing Final Existing Final Model ID Diameter (ft) Existing Final US (ft) DS (ft) US (ft) DS (ft) Existing Final
20681 9186 9213 27.0 5.5 5.5 1 1 23.8 23.8 6.8 6.2 6.3 5.6 137.8 146.1 20682 9213 9281 77.0 5.5 5.5 1 1 23.8 23.8 6.2 6.7 5.6 6.0 137.9 145.7
N. Quincy St. and N. Nelson St. to 10th St. N. 8861 8753 9019 597.6 3.5 3.5 1 1 9.6 9.6 2.3 2.5 2.3 2.5 48.9 48.9 8862 9019 9057 55.3 4 4 1 1 12.6 12.6 2.5 2.1 2.5 2.1 48.9 48.9 8863 9057 9037 256.1 4 4 1 1 12.6 12.6 2.1 3.3 2.1 3.0 48.7 48.7 17054 9037 9022 43.6 4 4 1 1 12.6 12.6 3.3 4.0 3.0 3.6 47.8 48.1 24640 9022 9217 231.6 4 4 1 1 12.6 12.6 4.0 5.9 3.6 5.9 47.7 44.7 16692 9217 9221 11.4 4 4 1 1 12.6 12.6 5.9 6.4 5.9 6.3 44.7 44.7 17053 9221 9258 70.1 4.5 4.5 1 1 15.9 15.9 6.4 7.0 6.3 6.9 61.5 61.5
Fairfax Dr. from N. Quincy St. to N. Monroe St. 9119 9720 9722 221.3 3 3 1 1 7.1 7.1 0.9 1.0 0.9 1.0 6.7 6.7 9120 9722 9724 39.0 3.5 3.5 1 1 9.6 9.6 1.0 1.5 1.0 1.5 7.3 7.3 9121 9724 9695 333.6 3.5 3.5 1 1 9.6 9.6 1.5 2.3 1.5 2.3 27.9 27.9 9122 9695 9617 64.9 3.5 3.5 1 1 9.6 9.6 2.3 2.4 2.3 2.3 26.7 26.7 9212 9617 9584 125.6 3.5 3.5 1 1 9.6 9.6 2.4 3.2 2.3 3.0 25.6 25.6 9139 9584 9535 98.7 3.5 3.5 1 1 9.6 9.6 3.2 3.7 3.0 3.4 42.2 42.2 9140 9535 9425 200.9 3.5 3.5 1 1 9.6 9.6 3.7 4.4 3.4 4.0 41.1 41.1 9203 9425 9362 211.1 4 4 1 1 12.6 12.6 4.4 5.2 4.0 4.7 40.2 41.0 8903 9362 9357 28.0 4 4 1 1 12.6 12.6 5.2 4.4 4.7 3.9 40.2 41.0
Stub at N. Monroe St. 20737 9418 9398 32.5 3 3 1 1 7.1 7.1 4.4 4.8 3.9 4.3 0.6 1.7 8906 9398 9362 67.3 3 3 1 1 7.1 7.1 4.8 5.2 4.3 4.7 2.2 5.9
9th St. N. from N. Randolph St. to N. Oakland St. 9053 10266 10259 30.8 3 3 1 1 7.1 7.1 2.6 2.3 2.6 2.3 33.3 33.3 9054 10259 10222 156.7 3 3 1 1 7.1 7.1 2.3 2.5 2.3 2.5 33.1 33.1 24679 10222 24482 61.1 3 3 1 1 7.1 7.1 2.5 2.6 2.5 2.6 32.8 32.8 24680 24482 10190 38.9 3 3 1 1 7.1 7.1 2.6 2.4 2.6 2.4 32.7 32.7

STORMWATER CAPACITY ANALYSIS FOR SPOUT RUN WATERSHED: DESIGN ITERATIONS, ARLINGTON COUNTY, VIRGINIA
25
TABLE 2 (CONTINUED) June 2006 Storm Event: Final Iteration Results Summary
Conduit ID
Node ID
Length (ft)
Size (Diameter or H × W) (ft) No. of Barrels Additional Pipe
Equivalent Cross-Sectional Area (ft2) Existing HGL Final HGL Flow (cfs)
US DS Existing Final Existing Final Model ID Diameter (ft) Existing Final US (ft) DS (ft) US (ft) DS (ft) Existing Final
9056 10190 10178 128.1 3 3 1 1 7.1 7.1 2.4 2.5 2.4 2.5 32.7 32.7 9057 10178 10193 84.6 3 3 1 1 7.1 7.1 2.5 1.7 2.5 1.7 32.6 32.6 9058 10193 10186 53.9 3.08×5a 3.08×5a 1 1 12.1 12.1 1.7 1.7 1.7 1.7 32.6 32.6 22570 10186 22803 80.0 3.08×5a 3.08×5a 1 1 12.1 12.1 1.7 1.9 1.7 1.9 32.7 32.7 22571 22803 10172 121.1 3.08×5a 3.08×5a 1 1 12.1 12.1 1.9 2.2 1.9 2.2 32.9 32.9 9060 10172 10171 8.5 4 4 1 1 12.6 12.6 2.2 3.8 2.2 3.8 32.3 32.4 22664 10171 22872 8.2 4.5 4.5 1 1 15.9 15.9 3.8 4.3 3.8 4.3 32.3 32.5 24659 22872 10168 39.5 4.5 4.5 1 1 15.9 15.9 4.3 4.4 4.3 4.4 91.5 91.5 9062 10168 10156 207.5 4.5 4.5 1 1 15.9 15.9 4.4 4.3 4.4 4.3 90.8 90.8 9063 10156 10086 131.3 4.5 4.5 1 1 15.9 15.9 4.3 4.1 4.3 4.1 90.1 90.1
9th St. N. and N. Monroe St. to Fairfax Dr. 23470 10086 23554 72.8 4.5 4.5 1 1 15.9 15.9 4.1 4.3 4.1 4.2 88.0 88.0 23471 23554 9957 175.5 4.5 4.5 1 1 15.9 15.9 4.3 5.0 4.2 4.9 84.7 86.2 9173 9957 9899 76.2 4.5 4.5 1 1 15.9 15.9 5.0 5.1 4.9 5.0 84.7 85.9 9174 9899 9790 175.3 4.5 4.5 1 1 15.9 15.9 5.1 5.4 5.0 5.3 84.8 86.2 9175 9790 9746 72.1 4.5 4.5 1 1 15.9 15.9 5.4 6.2 5.3 6.1 85.4 86.7 24685 9746 24487 156.4 4.5 4.5 1 1 15.9 15.9 6.2 6.4 6.1 6.3 85.4 86.7 24686 24487 9623 55.4 4.5 4.5 1 1 15.9 15.9 6.4 6.3 6.3 6.2 111.7 113.0 9168 9623 9569 61.7 5 5 1 1 19.6 19.6 6.3 5.6 6.2 5.4 146.7 147.9 9169 9569 9442 131.3 5 5 1 1 19.6 19.6 5.6 5.8 5.4 5.6 146.7 147.9 9205 9442 9412 29.3 5 5 1 1 19.6 19.6 5.8 5.2 5.6 5.0 146.7 147.9 9204 9412 9391 35.2 5 5 1 1 19.6 19.6 5.2 4.3 5.0 3.9 146.7 147.9 8905 9391 9357 61.2 5 5 1 1 19.6 19.6 4.3 4.4 3.9 3.9 146.2 148.0 8904 9357 9281 107.8 5.5 5.5 1 1 23.8 23.8 4.4 6.7 3.9 6.0 198.7 203.2
N. Pollard St. to 9th St. N. 22663 10529 22789 133.7 3 3 1 1 7.1 7.1 1.6 1.3 1.6 1.3 22.4 22.4 22662 22789 22872 287.9 3 3 1 1 7.1 7.1 1.3 4.3 1.3 4.3 22.3 22.3

STORMWATER CAPACITY ANALYSIS FOR SPOUT RUN WATERSHED: DESIGN ITERATIONS, ARLINGTON COUNTY, VIRGINIA
26
TABLE 2 (CONTINUED) June 2006 Storm Event: Final Iteration Results Summary
Conduit ID
Node ID
Length (ft)
Size (Diameter or H × W) (ft) No. of Barrels Additional Pipe
Equivalent Cross-Sectional Area (ft2) Existing HGL Final HGL Flow (cfs)
US DS Existing Final Existing Final Model ID Diameter (ft) Existing Final US (ft) DS (ft) US (ft) DS (ft) Existing Final
Fairfax Dr. from N. Monroe St. to N. Kenmore St. (Figure 7) 8916 9281 9226 301.6 6×8 6×8 1 2 48.0 96.0 6.7 7.0 6.0 7.7 351.4 363.9 24636 9226 24445 82.1 6×8 6×8 1 1 48.0 48.0 7.0 6.6 7.7 7.2 351.2 363.6 24637 24445 9158 69.0 6×8 6×8 1 1 48.0 48.0 6.6 6.2 7.2 6.8 351.2 363.8 24638 9158 24446 88.9 6×8 6×8 1 1 48.0 48.0 6.2 5.8 6.8 6.5 395.3 408.7 24639 24446 9002 157.1 6×8 6×8 1 1 48.0 48.0 5.8 6.7 6.5 7.1 391.8 401.8 8919 9002 8871 208.2 5.5 5.5 1 1 23.8 23.8 6.7 8.6 7.1 8.9 236.7 242.2
Kirkwood Rd. from N. Kenmore St. to Washington Blvd. 8918 9002 8871 208.0 4.5 4.5 1 1 15.9 15.9 6.7 8.6 7.1 8.9 149.6 154.0 24623 8871 24431 250.0 7×9 7×9 1 1 63.0 63.0 8.6 8.8 8.9 9.0 382.6 389.2 24619 24431 24432 28.0 7×9 7×9 1 1 63.0 63.0 8.8 8.0 9.0 8.2 382.6 389.3 24620 24432 24433 56.0 7×9 7×9 1 1 63.0 63.0 8.0 8.7 8.2 8.9 382.7 389.6 24621 24433 24434 155.0 7×9 7×9 1 1 63.0 63.0 8.7 9.3 8.9 9.4 382.7 389.5 24622 24434 8616 31.6 8 8 1 1 50.3 50.3 9.3 8.8 9.4 8.9 416.1 426.4 20686 8616 8603 10.4 8 8 1 1 50.3 50.3 8.8 6.8 8.9 6.9 452.2 462.4 16666 8603 8453 148.8 8 8 1 1 50.3 50.3 6.8 6.8 6.9 7.0 449.8 456.7
Kirkwood Rd. from Washington Blvd. to 14th St. N. 16669 8453 8430 36.8 5×7 5×7 2 2 70.0 70.0 6.8 9.0 7.0 9.2 450.8 454.4 8713 8430 8323 112.8 7 7 1 1 38.5 38.5 9.0 9.2 9.2 9.3 472.1 475.3 8714 8323 8185 152.0 7 7 1 1 38.5 38.5 9.2 8.5 9.3 8.6 472.1 475.3 8753 8185 7917 275.7 7 7 1 1 38.5 38.5 8.5 8.2 8.6 8.3 519.1 521.1 8754 7917 7849 53.0 7 7 1 1 38.5 38.5 8.2 7.8 8.3 7.9 562.1 563.6 25069 7849 7661 175.6 7 7 1 1 38.5 38.5 7.8 8.1 7.9 8.1 578.5 579.4 8757 7661 7594 82.4 7 7 1 1 38.5 38.5 8.1 7.3 8.1 7.4 578.5 579.4 20299 7594 7420 150.9 7 7 1 1 38.5 38.5 7.3 5.4 7.4 5.4 578.5 579.4

STORMWATER CAPACITY ANALYSIS FOR SPOUT RUN WATERSHED: DESIGN ITERATIONS, ARLINGTON COUNTY, VIRGINIA
27
TABLE 2 (CONTINUED) June 2006 Storm Event: Final Iteration Results Summary
Conduit ID
Node ID
Length (ft)
Size (Diameter or H × W) (ft) No. of Barrels Additional Pipe
Equivalent Cross-Sectional Area (ft2) Existing HGL Final HGL Flow (cfs)
US DS Existing Final Existing Final Model ID Diameter (ft) Existing Final US (ft) DS (ft) US (ft) DS (ft) Existing Final
Kirkwood Rd. from 14th St. N. to 18th St. N. 3192 7420 7091 340.0 7 7 1 1 38.5 38.5 5.4 5.5 5.4 5.5 594.8 594.9 3046 7091 6860 202.8 7 7 1 1 38.5 38.5 5.5 5.8 5.5 5.8 595.1 595.2 25074 6860 6437 374.9 8 8 1 1 50.3 50.3 5.8 6.2 5.8 6.2 614.4 614.6 21901 6437 6280 180.0 8 8 1 1 50.3 50.3 6.2 6.2 6.2 6.4 712.9 711.5 6687 6280 6148 133.0 8 8 1 1 50.3 50.3 6.2 5.9 6.4 6.6 713.3 711.1
Stub at Kirkwood Rd. 24609 8831 24423 46.9 3 3 1 1 7.1 7.1 2.6 2.3 2.6 2.3 50.9 50.9 24610 24423 24424 45.7 3 3 1 1 7.1 7.1 2.3 2.4 2.3 2.4 50.9 50.9 24611 24424 24425 67.5 3 3 1 1 7.1 7.1 2.4 2.3 2.4 2.3 50.9 50.9 24612 24425 24426 86.8 3 3 1 1 7.1 7.1 2.3 2.6 2.3 2.6 50.9 50.9 24613 24426 24427 49.4 3 3 1 1 7.1 7.1 2.6 2.3 2.6 2.3 50.8 50.8 24614 24427 24435 79.5 3 3 1 1 7.1 7.1 2.3 3.3 2.3 3.5 50.8 50.8 24624 24435 8616 55.8 3 3 1 1 7.1 7.1 3.3 8.8 3.5 8.9 50.3 50.4
Stub Between Washington Blvd. and 13th. St. N. 20673 8132 8185 235.4 4.5 4.5 1 1 15.9 15.9 1.4 8.5 1.4 8.6 52.3 52.3
Stub at 13th St. N. 8746 7879 7886 28.9 3 3 1 1 7.1 7.1 4.8 5.0 4.7 5.0 48.7 49.4 8747 7886 7899 9.2 3 3 1 1 7.1 7.1 5.0 4.5 5.0 4.5 48.7 49.5 8748 7899 7914 20.6 3 3 1 1 7.1 7.1 4.5 4.4 4.5 4.4 48.7 49.4 8749 7914 7923 25.1 3 3 1 1 7.1 7.1 4.4 4.6 4.4 4.6 48.3 49.2 8750 7923 7917 21.9 3 3 1 1 7.1 7.1 4.6 8.2 4.6 8.3 48.2 48.9
N. Herndon St. to Kirkwood Rd. 24654 7099 7051 65.1 3 3 1 1 7.1 7.1 1.7 2.9 1.7 2.9 82.6 82.6 6726 7051 7047 21.3 3 3 1 1 7.1 7.1 2.9 1.9 2.9 1.9 82.5 82.5 6728 7047 6821 282.8 3 3 1 1 7.1 7.1 1.9 2.4 1.9 2.4 82.0 82.0 2903 6821 6780 42.7 3 3 1 1 7.1 7.1 2.4 3.1 2.4 3.1 93.7 93.7 24651 6780 24457 92.4 3 3 1 1 7.1 7.1 3.1 3.9 3.1 3.9 92.9 92.9

STORMWATER CAPACITY ANALYSIS FOR SPOUT RUN WATERSHED: DESIGN ITERATIONS, ARLINGTON COUNTY, VIRGINIA
28
TABLE 2 (CONTINUED) June 2006 Storm Event: Final Iteration Results Summary
Conduit ID
Node ID
Length (ft)
Size (Diameter or H × W) (ft) No. of Barrels Additional Pipe
Equivalent Cross-Sectional Area (ft2) Existing HGL Final HGL Flow (cfs)
US DS Existing Final Existing Final Model ID Diameter (ft) Existing Final US (ft) DS (ft) US (ft) DS (ft) Existing Final
24652 24457 24458 48.6 3 3 1 1 7.1 7.1 3.9 4.1 3.9 4.1 92.9 92.9 24653 24458 6518 115.3 3 3 1 1 7.1 7.1 4.1 3.7 4.1 3.7 92.9 92.9 2711 6518 6515 7.1 3.5 3.5 1 1 9.6 9.6 3.7 2.3 3.7 2.3 92.9 92.9 2710 6515 6471 106.7 3.5 3.5 1 1 9.6 9.6 2.3 2.2 2.3 2.2 93.1 93.1 2683 6471 6449 142.4 3.5 3.5 1 1 9.6 9.6 2.2 4.6 2.2 4.6 92.8 92.8 6718 6449 6437 32.9 3.5 3.5 1 1 9.6 9.6 4.6 6.2 4.6 6.2 92.8 92.8
West Branch Lee Hwy to N. Woodrow St.
5028 3849 3894 72.5 4×4 4×4 1 1 16.0 16.0 6.9 6.2 6.9 6.2 106.1 106.1 5033 3894 3914 17.1 4×4 4×4 1 1 16.0 16.0 6.2 6.0 6.2 6.0 124.0 124.0 6515 3914 3937 77.1 3.5 3.5 1 1 9.6 9.6 6.0 3.8 6.0 3.8 124.0 124.0 5039 3937 3964 65.4 3.5 3.5 1 1 9.6 9.6 3.8 2.8 3.8 2.8 124.2 124.1 5049 3964 3993 65.4 3.5 3.5 1 1 9.6 9.6 2.8 2.4 2.8 2.4 124.3 124.2 5051 3993 4003 216.8 3.5 3.5 1 1 9.6 9.6 2.4 2.8 2.4 2.3 124.3 123.5 20440 4003 4035 165.8 3.5 3.5 1 1 9.6 9.6 2.8 10.2 2.3 5.3 123.5 122.0 1333 4035 4048 70.7 4 4 1 1 12.6 12.6 10.2 10.4 5.3 4.6 123.5 122.0
N. Woodrow St. to 19th Rd. N. (Figure 8; profile continues on Figures 9 and 10) 1364 4048 4108 157.9 4 4 1 1 12.6 12.6 10.4 8.4 4.6 7.8 123.5 121.5 24343 4108 24212 16.7 4 4 1 1 12.6 12.6 8.4 6.7 7.8 6.2 155.6 153.5 24345 24212 4122 39.2 4 4 1 1 12.6 12.6 6.7 6.3 6.2 2.2 141.2 153.5 1424 4122 4204 215.0 4 4 1 2 12.6 25.1 6.3 10.9 2.2 10.4 194.6 209.9 1479 4204 4279 70.3 4.5 4.5 1 2 15.9 31.8 10.9 10.6 10.4 10.1 201.9 232.4 1531 4279 4359 64.2 4.5 4.5 1 1 15.9 15.9 10.6 13.6 10.1 10.6 207.5 239.0 1631 4359 4529 276.2 4.5 4.5 1 1 15.9 15.9 13.6 6.2 10.6 3.5 216.2 247.6 1723 4529 4722 185.7 4.5 4.5 1 2 15.9 31.8 6.2 3.3 3.5 2.4 182.6 246.9 1816 4722 4890 150.6 4.5 4.5 1 2 15.9 31.8 3.3 4.6 2.4 5.3 182.9 246.6

STORMWATER CAPACITY ANALYSIS FOR SPOUT RUN WATERSHED: DESIGN ITERATIONS, ARLINGTON COUNTY, VIRGINIA
29
TABLE 2 (CONTINUED) June 2006 Storm Event: Final Iteration Results Summary
Conduit ID
Node ID
Length (ft)
Size (Diameter or H × W) (ft) No. of Barrels Additional Pipe
Equivalent Cross-Sectional Area (ft2) Existing HGL Final HGL Flow (cfs)
US DS Existing Final Existing Final Model ID Diameter (ft) Existing Final US (ft) DS (ft) US (ft) DS (ft) Existing Final
19th Rd. N. to 18th St. N. (West Pipe) (Figure 9; profile continues on Figure 12) 1836 4890 4925 23.0 4.5 4.5 1 2 15.9 31.8 4.6 4.0 5.3 5.3 137.9 188.2 1867 4925 4979 51.4 4.5 4.5 1 1 15.9 15.9 4.0 4.9 5.3 5.0 137.7 188.3 1939 4979 5125 133.2 4.5 4.5 1 1 15.9 15.9 4.9 6.3 5.0 3.8 153.9 205.2 1960 5125 5159 43.5 4.5 4.5 1 1 15.9 15.9 6.3 7.7 3.8 5.1 120.5 147.4 1990 5159 5203 81.1 4.5 4.5 1 1 15.9 15.9 7.7 7.2 5.1 4.2 120.5 147.3 2023 5203 5254 78.7 5 5 1 1 19.6 19.6 7.2 6.6 4.2 3.2 138.4 162.0 20429 5254 5572 304.3 3.5 3.5 1 2 9.6 19.2 6.6 6.9 3.2 4.7 92.1 167.2 2253 5572 5683 116.5 4.5 4.5 1 2 15.9 31.8 6.9 6.1 4.7 5.1 144.3 210.6 2256 5683 5688 26.4 4.5 4.5 1 2 15.9 31.8 6.1 5.9 5.1 4.7 138.9 237.4 24370 5688 24235 21.2 4.5 4.5 1 2 15.9 31.8 5.9 5.4 4.7 4.1 137.1 237.2 24371 24235 5716 73.4 4.5 4.5 1 2 15.9 31.8 5.4 7.3 4.1 5.9 136.9 236.5 2320 5716 5801 81.9 4.5 4.5 1 2 15.9 31.8 7.3 6.3 5.9 5.0 143.6 287.9 2343 5801 5858 73.8 4.5 4.5 1 2 15.9 31.8 6.3 6.8 5.0 5.5 143.6 287.9 2434 5858 6017 158.5 4.5 4.5 1 2 15.9 31.8 6.8 6.7 5.5 5.4 143.6 287.9
20th St. N. to 19th Rd. N. (East Pipe) (Figure 10; profile continues on Figure 11) 1829 4890 4907 38.9 2.75 2.75 1 1 5.9 5.9 4.6 3.0 5.3 2.6 49.1 58.7 1953 4907 5151 221.4 3.5 3.5 1 1 9.6 9.6 3.0 7.1 2.6 4.5 78.9 85.7 1980 5151 5188 93.9 4.5 4.5 1 1 15.9 15.9 7.1 6.5 4.5 4.1 112.4 142.0 1998 5188 5217 45.2 4.5 4.5 1 1 15.9 15.9 6.5 6.6 4.1 3.9 121.8 149.8 2022 5217 5254 31.4 4.5 4.5 1 2 15.9 31.8 6.6 6.6 3.9 3.2 97.1 149.7 2031 5254 5266 12.6 4.5 4.5 1 2 15.9 31.8 6.6 6.3 3.2 2.6 138.1 143.8 2060 5266 5317 95.6 4.5 4.5 1 2 15.9 31.8 6.3 6.6 2.6 3.6 129.4 143.4 2075 5317 5342 21.2 4.5 4.5 1 2 15.9 31.8 6.6 6.3 3.6 3.7 129.5 142.8
19th Rd. N. to 18th St. N. (East Pipe) (Figure 11; profile continues on Figure 12) 2159 5342 5511 138.2 4.5 4.5 1 1 15.9 15.9 6.3 6.1 3.7 3.7 129.4 142.6 2196 5511 5572 50.2 4.5 4.5 1 1 15.9 15.9 6.1 6.9 3.7 4.7 129.4 142.4 6561 5572 5577 33.4 3.5 3.5 1 2 9.6 19.2 6.9 2.9 4.7 1.7 78.3 97.6

STORMWATER CAPACITY ANALYSIS FOR SPOUT RUN WATERSHED: DESIGN ITERATIONS, ARLINGTON COUNTY, VIRGINIA
30
TABLE 2 (CONTINUED) June 2006 Storm Event: Final Iteration Results Summary
Conduit ID
Node ID
Length (ft)
Size (Diameter or H × W) (ft) No. of Barrels Additional Pipe
Equivalent Cross-Sectional Area (ft2) Existing HGL Final HGL Flow (cfs)
US DS Existing Final Existing Final Model ID Diameter (ft) Existing Final US (ft) DS (ft) US (ft) DS (ft) Existing Final
6560 5577 5687 153.9 3.5 3.5 1 2 9.6 19.2 2.9 4.6 1.7 3.0 77.7 98.0 20408 5687 5716 32.2 3 3 1 2 7.1 14.1 4.6 7.3 3.0 5.9 67.9 97.0 6557 5716 5791 80.0 3 3 1 1 7.1 7.1 7.3 4.8 5.9 2.4 64.1 54.2 6558 5791 5850 72.1 3 3 1 1 7.1 7.1 4.8 4.5 2.4 2.3 61.6 54.2 6559 5850 6017 167.2 3 3 1 1 7.1 7.1 4.5 6.7 2.3 5.4 57.8 54.2
19th Rd. N. to 18th St. N. (Link) 1954 5125 5151 51.7 4 4 1 1 12.6 12.6 6.3 7.1 3.8 4.5 34.3 58.0
18th St. N. to 16th St. N. (Figure 12) 2454 6017 6042 53.8 5 5 1 2 19.6 39.3 6.7 5.3 5.4 4.4 201.4 341.8 2459 6042 6052 20.0 5.5 5.5 1 2 23.8 47.5 5.3 4.9 4.4 4.0 200.5 341.8 2467 6052 6069 37.8 5.5 5.5 1 2 23.8 47.5 4.9 5.2 4.0 4.2 200.4 341.8 2512 6069 6136 62.8 5.5 5.5 1 2 23.8 47.5 5.2 5.3 4.2 4.4 200.4 341.6 2571 6136 6241 158.1 5.5 5.5 1 2 23.8 47.5 5.3 4.4 4.4 3.7 200.5 341.6 2611 6241 6314 194.5 5.5 5.5 1 2 23.8 47.5 4.4 4.4 3.7 3.8 221.1 358.4 2630 6314 6361 67.6 5.5 5.5 1 2 23.8 47.5 4.4 3.1 3.8 2.5 221.0 358.4 2659 6361 6415 81.2 5.5 5.5 1 2 23.8 47.5 3.1 4.8 2.5 3.5 221.3 358.4 2733 6415 6542 177.4 5.5 5.5 1 2 23.8 47.5 4.8 5.4 3.5 3.6 267.2 395.3 2804 6542 6652 147.3 5.5 5.5 1 2 23.8 47.5 5.4 6.4 3.6 4.3 266.0 393.9 6594 6652 6775 175.3 5.25×8.17a 5.25×8.17a 1 2 33.7 67.4 6.4 6.5 4.3 5.6 266.0 387.0 2891 6775 6806 35.6 5.25×8.17a 5.25×8.17a 1 2 33.7 67.4 6.5 6.1 5.6 5.5 251.3 387.2 2907 6806 6829 29.4 5.25×8.17a 5.25×8.17a 1 2 33.7 67.4 6.1 6.6 5.5 6.2 251.3 386.2 6600 6829 6827 6.6 5.5 5.5 1 2 23.8 47.5 6.6 4.0 6.2 4.8 251.3 386.2 6601 6827 6819 146.6 5.5 5.5 1 2 23.8 47.5 4.0 6.1 4.8 8.9 251.3 385.3
N. Taylor St. from 19th Rd. N. to 16th St. N. (Figure 13) 2317 5681 5798 114.5 3 3 1 1 7.1 7.1 1.7 2.2 1.7 2.0 50.2 50.2 2404 5798 5979 222.4 3 3 1 1 7.1 7.1 2.2 6.5 2.0 5.2 48.8 49.2 2424 5979 5999 52.2 3 3 1 1 7.1 7.1 6.5 5.3 5.2 4.8 48.9 49.2 2438 5999 6021 65.9 3 3 1 1 7.1 7.1 5.3 5.3 4.8 4.5 48.9 49.2

STORMWATER CAPACITY ANALYSIS FOR SPOUT RUN WATERSHED: DESIGN ITERATIONS, ARLINGTON COUNTY, VIRGINIA
31
TABLE 2 (CONTINUED) June 2006 Storm Event: Final Iteration Results Summary
Conduit ID
Node ID
Length (ft)
Size (Diameter or H × W) (ft) No. of Barrels Additional Pipe
Equivalent Cross-Sectional Area (ft2) Existing HGL Final HGL Flow (cfs)
US DS Existing Final Existing Final Model ID Diameter (ft) Existing Final US (ft) DS (ft) US (ft) DS (ft) Existing Final
2443 6021 6027 24.0 3 3 1 1 7.1 7.1 5.3 5.6 4.5 4.8 48.9 49.2 2473 6027 6077 48.2 3.5 3.5 1 2 9.6 19.2 5.6 5.1 4.8 5.0 48.9 49.2 2513 6077 6138 58.4 3.5 3.5 1 1 9.6 9.6 5.1 3.3 5.0 3.3 100.4 100.8 6596 6138 6407 310.1 3.5 3.5 1 1 9.6 9.6 3.3 2.0 3.3 2.0 99.6 100.0 6595 6407 6640 220.7 3.5 3.5 1 1 9.6 9.6 2.0 2.2 2.0 2.3 99.6 100.0 6591 6640 6819 161.3 3.5 3.5 1 1 9.6 9.6 2.2 6.1 2.3 8.9 99.6 99.6
I-66 from 16th St. N. to N. Nelson St. 6592 6819 6960 108.0 7 7 1 1 38.5 38.5 6.1 5.0 8.9 7.1 384.1 491.7 3097 6960 7208 233.8 7 7 1 1 38.5 38.5 5.0 5.5 7.1 7.4 383.7 490.6 3124 7208 7277 157.5 7 7 1 1 38.5 38.5 5.5 5.0 7.4 6.0 383.8 490.6 3147 7277 7331 85.5 7 7 1 1 38.5 38.5 5.0 4.6 6.0 5.3 383.9 490.6 3168 7331 7377 99.8 7.5 7.5 1 1 44.2 44.2 4.6 4.4 5.3 4.9 416.9 517.6 6597 7377 7079 902.5 8 8 1 1 50.3 50.3 4.4 7.7 4.9 10.2 450.6 538.3 3039 7079 6988 316.1 8 8 1 1 50.3 50.3 7.7 7.1 10.2 8.9 439.2 539.6 2993 6988 6844 338.7 9 9 1 1 63.6 63.6 7.1 7.8 8.9 9.2 445.0 544.0 2978 6844 6955 169.7 9 9 1 1 63.6 63.6 7.8 7.7 9.2 8.9 483.6 569.7
14th St. N. from N. Quincy St. to N. Nelson St. 21783 7407 7443 89.7 5×7 5×7 1 1 35.0 35.0 0.4 0.4 0.4 0.4 15.0 15.0 24403 7443 24258 173.4 5×7 5×7 1 1 35.0 35.0 0.4 1.3 0.4 1.4 14.9 14.9 22405 24258 7384 168.5 7 6 1 1 38.5 28.3 1.3 1.3 1.4 1.3 46.2 46.1 3172 7384 7368 37.2 7 7 1 1 38.5 38.5 1.3 1.6 1.3 1.6 46.1 46.1 3165 7368 7364 98.7 7 7 1 1 38.5 38.5 1.6 1.3 1.6 1.3 46.1 46.1 3163 7364 7337 93.7 7 7 1 1 38.5 38.5 1.3 0.7 1.3 0.7 46.1 46.1 3150 7337 7298 138.8 8×9 8×9 1 1 72.0 72.0 0.7 2.1 0.7 2.1 46.1 46.1 3131 7298 7270 179.1 7 7 1 1 38.5 38.5 2.1 1.0 2.1 1.0 45.9 45.9 3120 7270 7158 95.0 7 7 1 1 38.5 38.5 1.0 1.2 1.0 1.2 45.9 45.9 3072 7158 7040 107.5 7 7 1 1 38.5 38.5 1.2 3.8 1.2 4.9 45.9 45.9 3019 7040 6955 102.3 7 7 1 1 38.5 38.5 3.8 7.7 4.9 8.9 91.7 91.3

STORMWATER CAPACITY ANALYSIS FOR SPOUT RUN WATERSHED: DESIGN ITERATIONS, ARLINGTON COUNTY, VIRGINIA
32
TABLE 2 (CONTINUED) June 2006 Storm Event: Final Iteration Results Summary
Conduit ID
Node ID
Length (ft)
Size (Diameter or H × W) (ft) No. of Barrels Additional Pipe
Equivalent Cross-Sectional Area (ft2) Existing HGL Final HGL Flow (cfs)
US DS Existing Final Existing Final Model ID Diameter (ft) Existing Final US (ft) DS (ft) US (ft) DS (ft) Existing Final
I-66 and Kirkwood Rd. to 18th St. N. 2977 6955 6874 200.3 9 9 1 1 63.6 63.6 7.7 7.3 8.9 8.2 574.8 655.9 2931 6874 6762 279.1 9 9 1 1 63.6 63.6 7.3 6.0 8.2 6.5 640.3 721.4 2869 6762 6630 287.9 9 9 1 1 63.6 63.6 6.0 7.2 6.5 9.9 658.4 739.4 2793 6630 6546 458.1 9 9 1 1 63.6 63.6 7.2 8.5 9.9 10.2 657.4 738.6 2752 6546 6568 61.7 9 9 1 1 63.6 63.6 8.5 7.3 10.2 9.2 656.8 738.6 6721 6568 6541 98.5 9 9 1 1 63.6 63.6 7.3 8.4 9.2 9.9 656.8 738.6 25072 6541 24828 90.3 8 8 1 1 50.3 50.3 8.4 5.8 9.9 6.5 676.1 757.9 25076 24828 24829 179.9 8 8 1 1 50.3 50.3 5.8 6.5 6.5 7.3 676.5 757.6 25077 24829 6148 134.9 8 8 1 1 50.3 50.3 6.5 5.9 7.3 6.6 677.0 757.4
N. Nelson St. to I-66 2648 6359 6389 79.3 3 3 1 1 7.1 7.1 3.0 2.9 3.0 2.9 52.3 52.3 2693 6389 6489 97.6 3 3 1 1 7.1 7.1 2.9 2.1 2.9 2.1 59.3 59.3 2819 6489 6670 153.6 3 3 1 1 7.1 7.1 2.1 3.3 2.1 3.3 59.3 59.3 20378 6670 6697 26.1 3 3 1 1 7.1 7.1 3.3 2.1 3.3 2.1 59.3 59.3 2860 6697 6750 59.7 3.5 3.5 1 1 9.6 9.6 2.1 3.0 2.1 3.0 59.3 59.3 20379 6750 6795 62.8 3.5 3.5 1 1 9.6 9.6 3.0 2.5 3.0 2.5 59.3 59.3 20380 6795 6874 72.4 3.5 3.5 1 1 9.6 9.6 2.5 7.3 2.5 8.2 66.9 66.9
Stub at Intersection of 19th St. N. and N. Upton St. 2260 5693 5683 15.5 3 3 1 1 7.1 7.1 3.6 6.1 2.3 5.1 33.2 33.2
North Branch I-66 from 18th St. N. to Kirkwood Rd. (West Pipe)
25078 6148 24830 355.1 8 8 1 1 50.3 50.3 5.9 6.9 6.6 8.4 738.3 785.0 25080 24830 24831 259.3 9 9 1 1 63.6 63.6 6.9 8.0 8.4 9.6 738.1 775.6 25081 24831 5409 122.7 9 9 1 1 63.6 63.6 8.0 7.6 9.6 9.3 737.8 775.3 25082 5409 24843 113.9 9 9 1 1 63.6 63.6 7.6 8.7 9.3 10.0 771.7 810.5 25083 24843 24844 129.3 9 9 1 1 63.6 63.6 8.7 7.5 10.0 9.0 771.3 810.5 25084 24844 5114 63.2 9 9 1 1 63.6 63.6 7.5 6.7 9.0 8.4 770.8 809.8 20310 5114 4969 392.4 Stream Stream 1 1 6.7 10.4 8.4 11.9 1532.7 1620.1
STORMWATER CAPACITY ANALYSIS FOR SPOUT RUN WATERSHED: DESIGN ITERATIONS, ARLINGTON COUNTY, VIRGINIA
33
TABLE 2 (CONTINUED) June 2006 Storm Event: Final Iteration Results Summary
Conduit ID
Node ID
Length (ft)
Size (Diameter or H × W) (ft) No. of Barrels Additional Pipe
Equivalent Cross-Sectional Area (ft2) Existing HGL Final HGL Flow (cfs)
US DS Existing Final Existing Final Model ID Diameter (ft) Existing Final US (ft) DS (ft) US (ft) DS (ft) Existing Final
I-66 from 18th St. N. to Kirkwood Rd. (East Pipe) 6688 6148 5794 353.0 8 8 1 1 50.3 50.3 5.9 7.4 6.6 8.8 741.1 777.0 6698 5794 5559 259.0 9 9 1 1 63.6 63.6 7.4 8.5 8.8 9.6 762.6 795.9 6697 5559 5490 56.3 9 9 1 1 63.6 63.6 8.5 7.0 9.6 8.2 762.3 796.0 6696 5490 5269 181.2 9 9 1 1 63.6 63.6 7.0 8.7 8.2 9.7 776.9 809.1 6699 5269 5128 128.9 9 9 1 1 63.6 63.6 8.7 7.4 9.7 8.7 775.7 809.0 6700 5128 5114 58.8 9 9 1 1 63.6 63.6 7.4 6.7 8.7 8.4 774.6 808.4
20th St. N. to 19th St. N. (Figure 14; profile continues on Figure 15) 2027 5197 5260 136.3 3 3 1 1 7.1 7.1 2.6 5.1 2.4 2.9 70.7 73.4 6646 5260 5311 151.0 3 3 1 1 7.1 7.1 5.1 4.4 2.9 3.6 70.7 72.6 23424 5311 23512 40.3 3 3 1 2 7.1 14.1 4.4 3.5 3.6 3.8 59.1 72.7 23425 23512 5408 32.0 3 3 1 1 7.1 7.1 3.5 3.5 3.8 3.4 59.1 72.6 23426 5408 5435 19.0 3 3 1 1 7.1 7.1 3.5 3.5 3.4 3.1 59.2 72.7 2134 5435 5462 26.1 3 3 1 2 7.1 14.1 3.5 2.5 3.1 3.1 59.1 72.7 2141 5462 5469 21.0 3 3 1 1 7.1 7.1 2.5 1.9 3.1 2.2 59.1 72.6 2140 5469 5468 151.8 3 3 1 1 7.1 7.1 1.9 1.9 2.2 3.0 59.4 72.7 2138 5468 5466 116.5 3 3 1 1 7.1 7.1 1.9 2.9 3.0 6.3 59.3 72.7 2212 5466 5596 109.5 3 3 1 1 7.1 7.1 2.9 6.0 6.3 5.8 60.4 70.9 6682 5596 5664 70.8 3 3 1 1 7.1 7.1 6.0 5.6 5.8 5.5 60.4 70.0 6683 5664 5718 50.9 3 3 1 2 7.1 14.1 5.6 8.0 5.5 8.4 60.5 70.0 6685 5718 5720 25.0 3 3 1 2 7.1 14.1 8.0 6.6 8.4 8.0 60.5 70.0 2275 5720 5719 38.5 3 3 1 1 7.1 7.1 6.6 6.0 8.0 7.0 60.5 70.0 2292 5719 5739 99.6 3 3 1 1 7.1 7.1 6.0 8.5 7.0 9.3 88.2 95.3
19th. St. N. to 18th St. N. (Figure 15) 2345 5739 5861 173.8 3 3 1 1 7.1 7.1 8.5 9.8 9.3 7.6 88.2 95.3 2349 5861 5871 50.0 3 3 1 2 7.1 14.1 9.8 8.0 7.6 9.2 88.2 95.3 2389 5871 5958 105.4 3 3 1 1 7.1 7.1 8.0 2.7 9.2 6.1 88.2 95.3 2449 5958 6035 208.4 3 3 1 1 7.1 7.1 2.7 5.2 6.1 5.2 87.8 95.3 24406 6035 24259 77.9 3.5 3.5 1 1 9.6 9.6 5.2 4.6 5.2 4.6 87.8 95.3
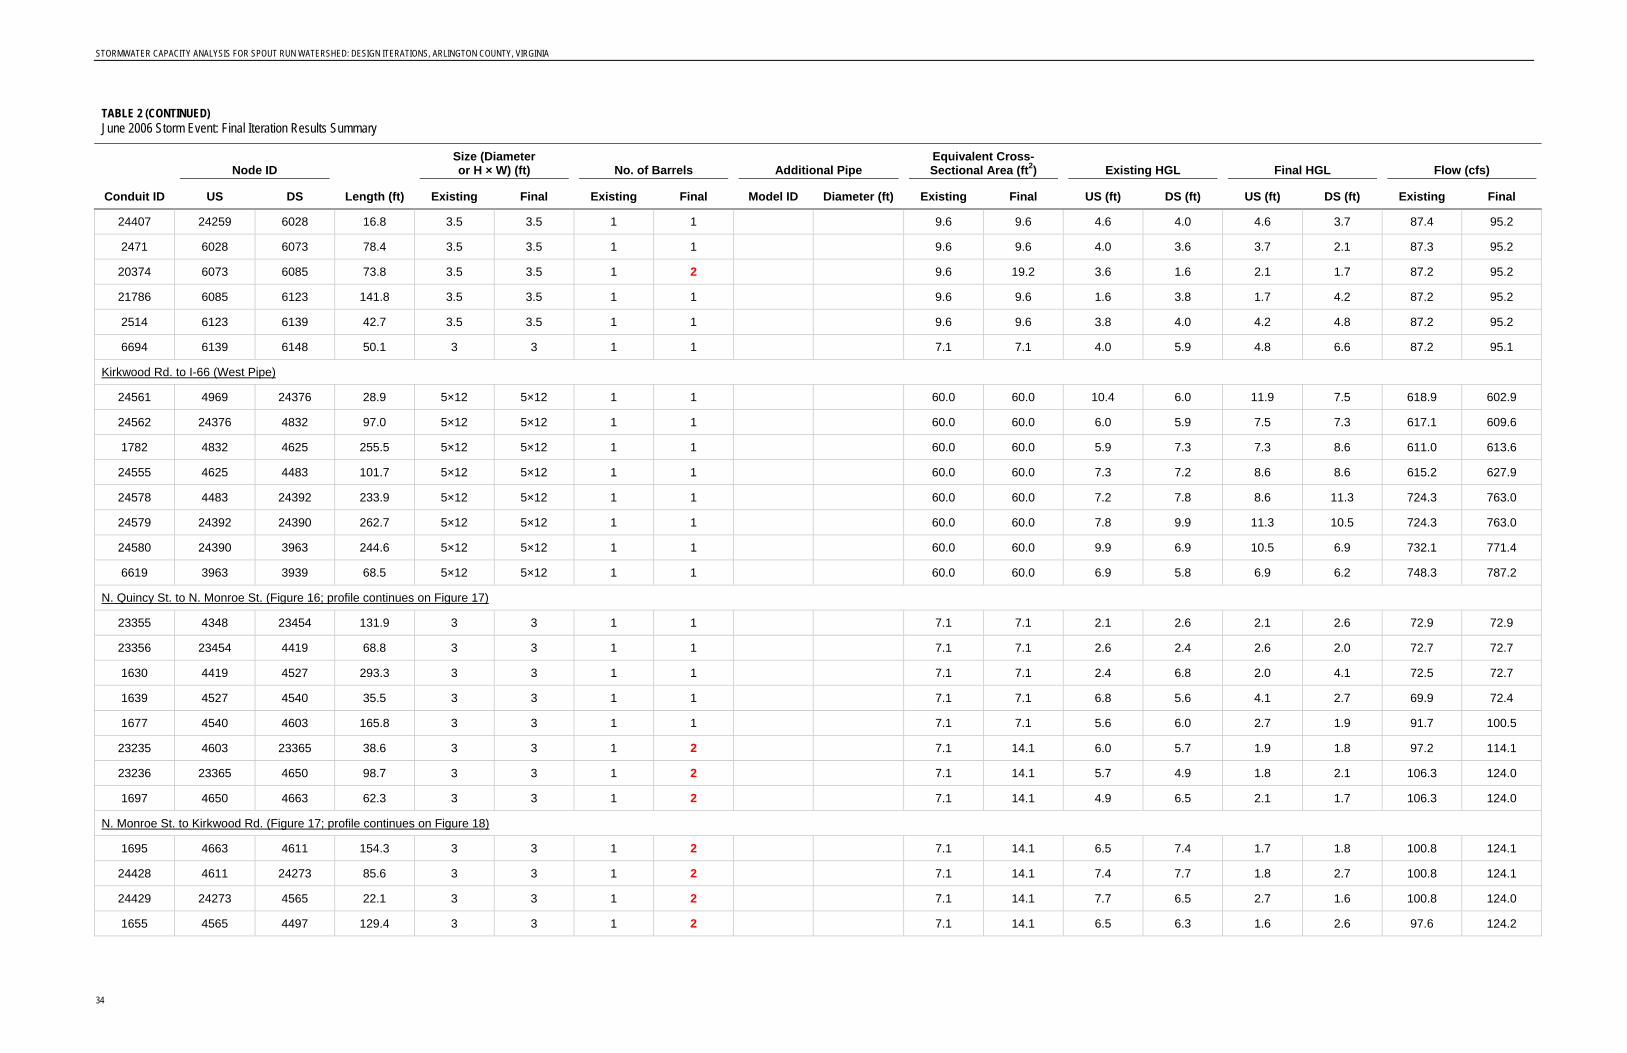
STORMWATER CAPACITY ANALYSIS FOR SPOUT RUN WATERSHED: DESIGN ITERATIONS, ARLINGTON COUNTY, VIRGINIA
34
TABLE 2 (CONTINUED) June 2006 Storm Event: Final Iteration Results Summary
Conduit ID
Node ID
Length (ft)
Size (Diameter or H × W) (ft) No. of Barrels Additional Pipe
Equivalent Cross-Sectional Area (ft2) Existing HGL Final HGL Flow (cfs)
US DS Existing Final Existing Final Model ID Diameter (ft) Existing Final US (ft) DS (ft) US (ft) DS (ft) Existing Final
24407 24259 6028 16.8 3.5 3.5 1 1 9.6 9.6 4.6 4.0 4.6 3.7 87.4 95.2 2471 6028 6073 78.4 3.5 3.5 1 1 9.6 9.6 4.0 3.6 3.7 2.1 87.3 95.2 20374 6073 6085 73.8 3.5 3.5 1 2 9.6 19.2 3.6 1.6 2.1 1.7 87.2 95.2 21786 6085 6123 141.8 3.5 3.5 1 1 9.6 9.6 1.6 3.8 1.7 4.2 87.2 95.2 2514 6123 6139 42.7 3.5 3.5 1 1 9.6 9.6 3.8 4.0 4.2 4.8 87.2 95.2 6694 6139 6148 50.1 3 3 1 1 7.1 7.1 4.0 5.9 4.8 6.6 87.2 95.1
Kirkwood Rd. to I-66 (West Pipe) 24561 4969 24376 28.9 5×12 5×12 1 1 60.0 60.0 10.4 6.0 11.9 7.5 618.9 602.9 24562 24376 4832 97.0 5×12 5×12 1 1 60.0 60.0 6.0 5.9 7.5 7.3 617.1 609.6 1782 4832 4625 255.5 5×12 5×12 1 1 60.0 60.0 5.9 7.3 7.3 8.6 611.0 613.6 24555 4625 4483 101.7 5×12 5×12 1 1 60.0 60.0 7.3 7.2 8.6 8.6 615.2 627.9 24578 4483 24392 233.9 5×12 5×12 1 1 60.0 60.0 7.2 7.8 8.6 11.3 724.3 763.0 24579 24392 24390 262.7 5×12 5×12 1 1 60.0 60.0 7.8 9.9 11.3 10.5 724.3 763.0 24580 24390 3963 244.6 5×12 5×12 1 1 60.0 60.0 9.9 6.9 10.5 6.9 732.1 771.4 6619 3963 3939 68.5 5×12 5×12 1 1 60.0 60.0 6.9 5.8 6.9 6.2 748.3 787.2
N. Quincy St. to N. Monroe St. (Figure 16; profile continues on Figure 17) 23355 4348 23454 131.9 3 3 1 1 7.1 7.1 2.1 2.6 2.1 2.6 72.9 72.9 23356 23454 4419 68.8 3 3 1 1 7.1 7.1 2.6 2.4 2.6 2.0 72.7 72.7 1630 4419 4527 293.3 3 3 1 1 7.1 7.1 2.4 6.8 2.0 4.1 72.5 72.7 1639 4527 4540 35.5 3 3 1 1 7.1 7.1 6.8 5.6 4.1 2.7 69.9 72.4 1677 4540 4603 165.8 3 3 1 1 7.1 7.1 5.6 6.0 2.7 1.9 91.7 100.5 23235 4603 23365 38.6 3 3 1 2 7.1 14.1 6.0 5.7 1.9 1.8 97.2 114.1 23236 23365 4650 98.7 3 3 1 2 7.1 14.1 5.7 4.9 1.8 2.1 106.3 124.0 1697 4650 4663 62.3 3 3 1 2 7.1 14.1 4.9 6.5 2.1 1.7 106.3 124.0
N. Monroe St. to Kirkwood Rd. (Figure 17; profile continues on Figure 18) 1695 4663 4611 154.3 3 3 1 2 7.1 14.1 6.5 7.4 1.7 1.8 100.8 124.1 24428 4611 24273 85.6 3 3 1 2 7.1 14.1 7.4 7.7 1.8 2.7 100.8 124.1 24429 24273 4565 22.1 3 3 1 2 7.1 14.1 7.7 6.5 2.7 1.6 100.8 124.0 1655 4565 4497 129.4 3 3 1 2 7.1 14.1 6.5 6.3 1.6 2.6 97.6 124.2
STORMWATER CAPACITY ANALYSIS FOR SPOUT RUN WATERSHED: DESIGN ITERATIONS, ARLINGTON COUNTY, VIRGINIA
35
TABLE 2 (CONTINUED) June 2006 Storm Event: Final Iteration Results Summary
Conduit ID
Node ID
Length (ft)
Size (Diameter or H × W) (ft) No. of Barrels Additional Pipe
Equivalent Cross-Sectional Area (ft2) Existing HGL Final HGL Flow (cfs)
US DS Existing Final Existing Final Model ID Diameter (ft) Existing Final US (ft) DS (ft) US (ft) DS (ft) Existing Final
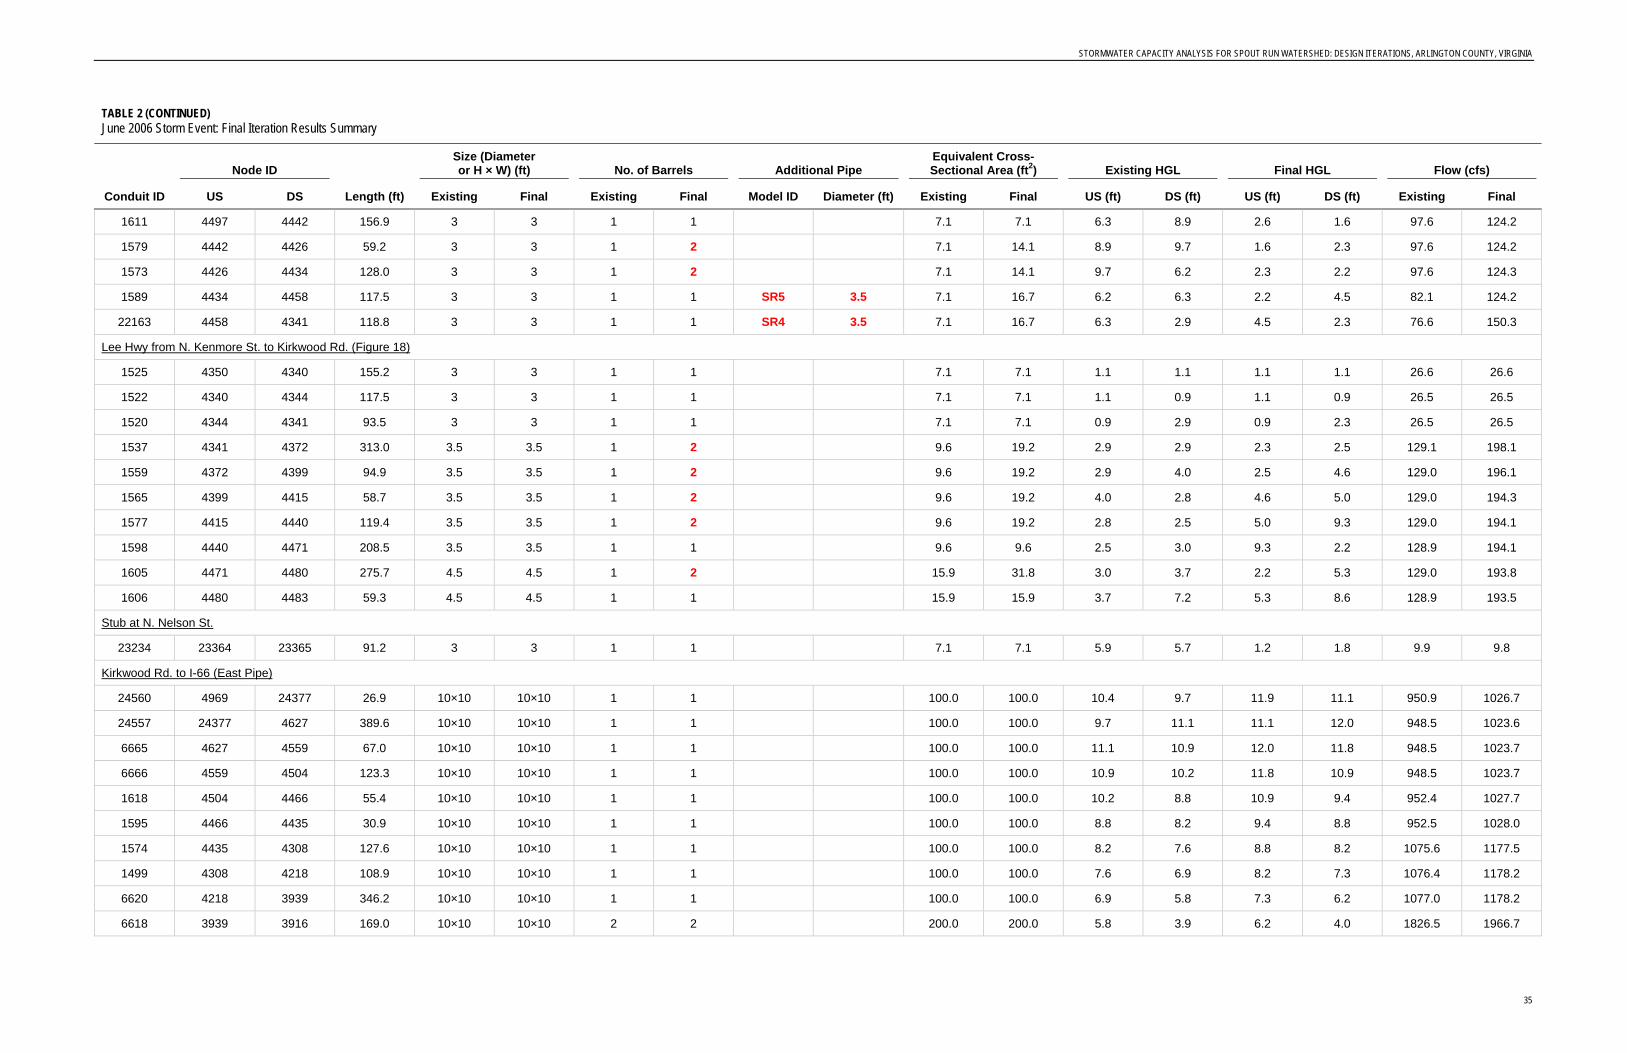
1611 4497 4442 156.9 3 3 1 1 7.1 7.1 6.3 8.9 2.6 1.6 97.6 124.2 1579 4442 4426 59.2 3 3 1 2 7.1 14.1 8.9 9.7 1.6 2.3 97.6 124.2 1573 4426 4434 128.0 3 3 1 2 7.1 14.1 9.7 6.2 2.3 2.2 97.6 124.3 1589 4434 4458 117.5 3 3 1 1 SR5 3.5 7.1 16.7 6.2 6.3 2.2 4.5 82.1 124.2 22163 4458 4341 118.8 3 3 1 1 SR4 3.5 7.1 16.7 6.3 2.9 4.5 2.3 76.6 150.3
Lee Hwy from N. Kenmore St. to Kirkwood Rd. (Figure 18) 1525 4350 4340 155.2 3 3 1 1 7.1 7.1 1.1 1.1 1.1 1.1 26.6 26.6 1522 4340 4344 117.5 3 3 1 1 7.1 7.1 1.1 0.9 1.1 0.9 26.5 26.5 1520 4344 4341 93.5 3 3 1 1 7.1 7.1 0.9 2.9 0.9 2.3 26.5 26.5 1537 4341 4372 313.0 3.5 3.5 1 2 9.6 19.2 2.9 2.9 2.3 2.5 129.1 198.1 1559 4372 4399 94.9 3.5 3.5 1 2 9.6 19.2 2.9 4.0 2.5 4.6 129.0 196.1 1565 4399 4415 58.7 3.5 3.5 1 2 9.6 19.2 4.0 2.8 4.6 5.0 129.0 194.3 1577 4415 4440 119.4 3.5 3.5 1 2 9.6 19.2 2.8 2.5 5.0 9.3 129.0 194.1 1598 4440 4471 208.5 3.5 3.5 1 1 9.6 9.6 2.5 3.0 9.3 2.2 128.9 194.1 1605 4471 4480 275.7 4.5 4.5 1 2 15.9 31.8 3.0 3.7 2.2 5.3 129.0 193.8 1606 4480 4483 59.3 4.5 4.5 1 1 15.9 15.9 3.7 7.2 5.3 8.6 128.9 193.5
Stub at N. Nelson St. 23234 23364 23365 91.2 3 3 1 1 7.1 7.1 5.9 5.7 1.2 1.8 9.9 9.8
Kirkwood Rd. to I-66 (East Pipe) 24560 4969 24377 26.9 10×10 10×10 1 1 100.0 100.0 10.4 9.7 11.9 11.1 950.9 1026.7 24557 24377 4627 389.6 10×10 10×10 1 1 100.0 100.0 9.7 11.1 11.1 12.0 948.5 1023.6 6665 4627 4559 67.0 10×10 10×10 1 1 100.0 100.0 11.1 10.9 12.0 11.8 948.5 1023.7 6666 4559 4504 123.3 10×10 10×10 1 1 100.0 100.0 10.9 10.2 11.8 10.9 948.5 1023.7 1618 4504 4466 55.4 10×10 10×10 1 1 100.0 100.0 10.2 8.8 10.9 9.4 952.4 1027.7 1595 4466 4435 30.9 10×10 10×10 1 1 100.0 100.0 8.8 8.2 9.4 8.8 952.5 1028.0 1574 4435 4308 127.6 10×10 10×10 1 1 100.0 100.0 8.2 7.6 8.8 8.2 1075.6 1177.5 1499 4308 4218 108.9 10×10 10×10 1 1 100.0 100.0 7.6 6.9 8.2 7.3 1076.4 1178.2 6620 4218 3939 346.2 10×10 10×10 1 1 100.0 100.0 6.9 5.8 7.3 6.2 1077.0 1178.2 6618 3939 3916 169.0 10×10 10×10 2 2 200.0 200.0 5.8 3.9 6.2 4.0 1826.5 1966.7
STORMWATER CAPACITY ANALYSIS FOR SPOUT RUN WATERSHED: DESIGN ITERATIONS, ARLINGTON COUNTY, VIRGINIA
36
TABLE 2 (CONTINUED) June 2006 Storm Event: Final Iteration Results Summary
Conduit ID
Node ID
Length (ft)
Size (Diameter or H × W) (ft) No. of Barrels Additional Pipe
Equivalent Cross-Sectional Area (ft2) Existing HGL Final HGL Flow (cfs)
US DS Existing Final Existing Final Model ID Diameter (ft) Existing Final US (ft) DS (ft) US (ft) DS (ft) Existing Final
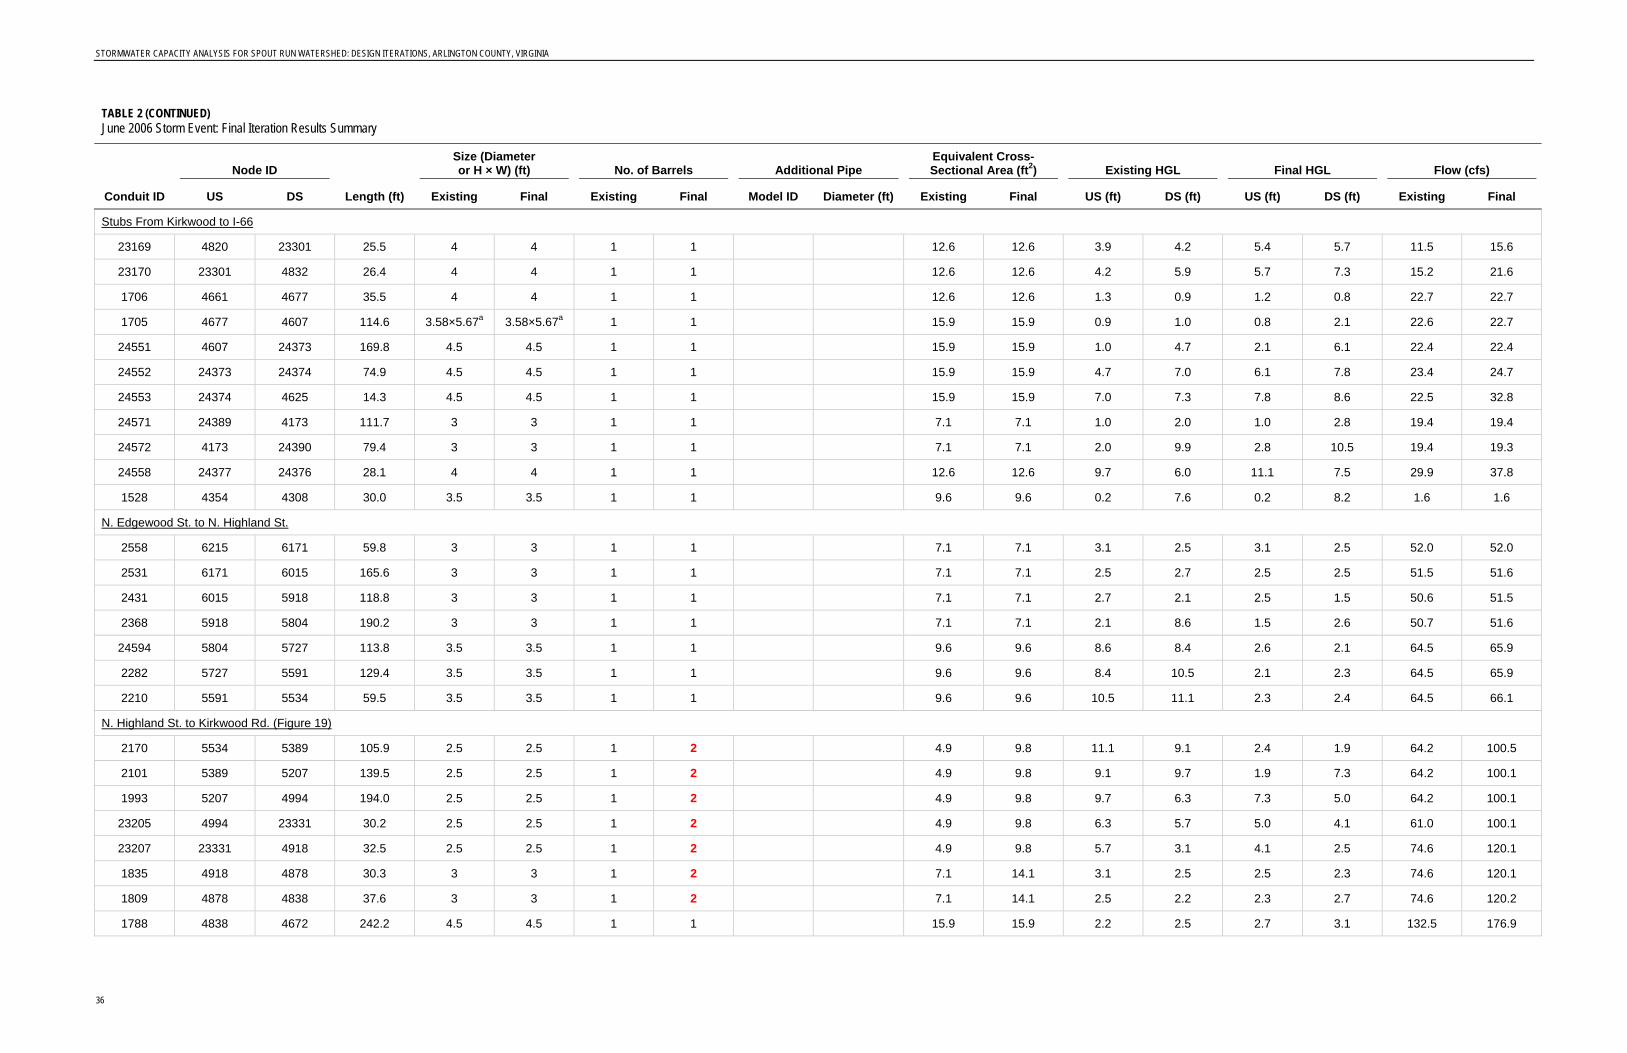
Stubs From Kirkwood to I-66 23169 4820 23301 25.5 4 4 1 1 12.6 12.6 3.9 4.2 5.4 5.7 11.5 15.6 23170 23301 4832 26.4 4 4 1 1 12.6 12.6 4.2 5.9 5.7 7.3 15.2 21.6 1706 4661 4677 35.5 4 4 1 1 12.6 12.6 1.3 0.9 1.2 0.8 22.7 22.7 1705 4677 4607 114.6 3.58×5.67a 3.58×5.67a 1 1 15.9 15.9 0.9 1.0 0.8 2.1 22.6 22.7 24551 4607 24373 169.8 4.5 4.5 1 1 15.9 15.9 1.0 4.7 2.1 6.1 22.4 22.4 24552 24373 24374 74.9 4.5 4.5 1 1 15.9 15.9 4.7 7.0 6.1 7.8 23.4 24.7 24553 24374 4625 14.3 4.5 4.5 1 1 15.9 15.9 7.0 7.3 7.8 8.6 22.5 32.8 24571 24389 4173 111.7 3 3 1 1 7.1 7.1 1.0 2.0 1.0 2.8 19.4 19.4 24572 4173 24390 79.4 3 3 1 1 7.1 7.1 2.0 9.9 2.8 10.5 19.4 19.3 24558 24377 24376 28.1 4 4 1 1 12.6 12.6 9.7 6.0 11.1 7.5 29.9 37.8 1528 4354 4308 30.0 3.5 3.5 1 1 9.6 9.6 0.2 7.6 0.2 8.2 1.6 1.6
N. Edgewood St. to N. Highland St. 2558 6215 6171 59.8 3 3 1 1 7.1 7.1 3.1 2.5 3.1 2.5 52.0 52.0 2531 6171 6015 165.6 3 3 1 1 7.1 7.1 2.5 2.7 2.5 2.5 51.5 51.6 2431 6015 5918 118.8 3 3 1 1 7.1 7.1 2.7 2.1 2.5 1.5 50.6 51.5 2368 5918 5804 190.2 3 3 1 1 7.1 7.1 2.1 8.6 1.5 2.6 50.7 51.6 24594 5804 5727 113.8 3.5 3.5 1 1 9.6 9.6 8.6 8.4 2.6 2.1 64.5 65.9 2282 5727 5591 129.4 3.5 3.5 1 1 9.6 9.6 8.4 10.5 2.1 2.3 64.5 65.9 2210 5591 5534 59.5 3.5 3.5 1 1 9.6 9.6 10.5 11.1 2.3 2.4 64.5 66.1
N. Highland St. to Kirkwood Rd. (Figure 19) 2170 5534 5389 105.9 2.5 2.5 1 2 4.9 9.8 11.1 9.1 2.4 1.9 64.2 100.5 2101 5389 5207 139.5 2.5 2.5 1 2 4.9 9.8 9.1 9.7 1.9 7.3 64.2 100.1 1993 5207 4994 194.0 2.5 2.5 1 2 4.9 9.8 9.7 6.3 7.3 5.0 64.2 100.1 23205 4994 23331 30.2 2.5 2.5 1 2 4.9 9.8 6.3 5.7 5.0 4.1 61.0 100.1 23207 23331 4918 32.5 2.5 2.5 1 2 4.9 9.8 5.7 3.1 4.1 2.5 74.6 120.1 1835 4918 4878 30.3 3 3 1 2 7.1 14.1 3.1 2.5 2.5 2.3 74.6 120.1 1809 4878 4838 37.6 3 3 1 2 7.1 14.1 2.5 2.2 2.3 2.7 74.6 120.2 1788 4838 4672 242.2 4.5 4.5 1 1 15.9 15.9 2.2 2.5 2.7 3.1 132.5 176.9
STORMWATER CAPACITY ANALYSIS FOR SPOUT RUN WATERSHED: DESIGN ITERATIONS, ARLINGTON COUNTY, VIRGINIA
37
TABLE 2 (CONTINUED) June 2006 Storm Event: Final Iteration Results Summary
Conduit ID
Node ID
Length (ft)
Size (Diameter or H × W) (ft) No. of Barrels Additional Pipe
Equivalent Cross-Sectional Area (ft2) Existing HGL Final HGL Flow (cfs)
US DS Existing Final Existing Final Model ID Diameter (ft) Existing Final US (ft) DS (ft) US (ft) DS (ft) Existing Final
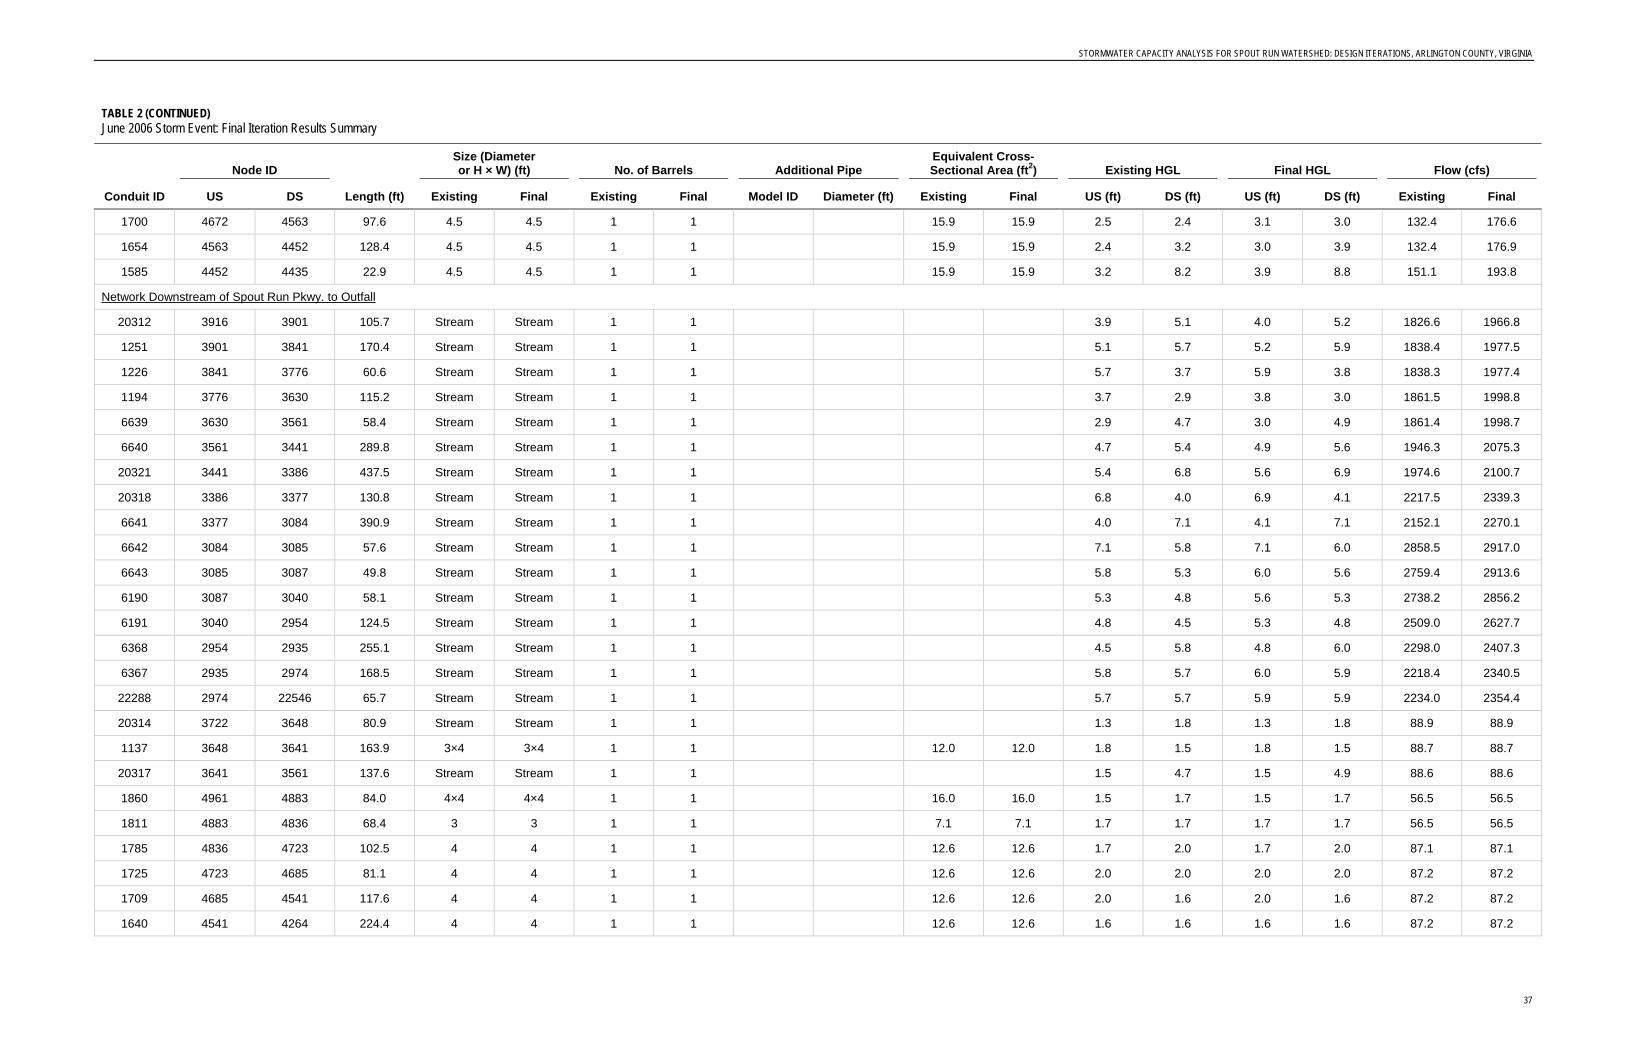
1700 4672 4563 97.6 4.5 4.5 1 1 15.9 15.9 2.5 2.4 3.1 3.0 132.4 176.6 1654 4563 4452 128.4 4.5 4.5 1 1 15.9 15.9 2.4 3.2 3.0 3.9 132.4 176.9 1585 4452 4435 22.9 4.5 4.5 1 1 15.9 15.9 3.2 8.2 3.9 8.8 151.1 193.8
Network Downstream of Spout Run Pkwy. to Outfall 20312 3916 3901 105.7 Stream Stream 1 1 3.9 5.1 4.0 5.2 1826.6 1966.8 1251 3901 3841 170.4 Stream Stream 1 1 5.1 5.7 5.2 5.9 1838.4 1977.5 1226 3841 3776 60.6 Stream Stream 1 1 5.7 3.7 5.9 3.8 1838.3 1977.4 1194 3776 3630 115.2 Stream Stream 1 1 3.7 2.9 3.8 3.0 1861.5 1998.8 6639 3630 3561 58.4 Stream Stream 1 1 2.9 4.7 3.0 4.9 1861.4 1998.7 6640 3561 3441 289.8 Stream Stream 1 1 4.7 5.4 4.9 5.6 1946.3 2075.3 20321 3441 3386 437.5 Stream Stream 1 1 5.4 6.8 5.6 6.9 1974.6 2100.7 20318 3386 3377 130.8 Stream Stream 1 1 6.8 4.0 6.9 4.1 2217.5 2339.3 6641 3377 3084 390.9 Stream Stream 1 1 4.0 7.1 4.1 7.1 2152.1 2270.1 6642 3084 3085 57.6 Stream Stream 1 1 7.1 5.8 7.1 6.0 2858.5 2917.0 6643 3085 3087 49.8 Stream Stream 1 1 5.8 5.3 6.0 5.6 2759.4 2913.6 6190 3087 3040 58.1 Stream Stream 1 1 5.3 4.8 5.6 5.3 2738.2 2856.2 6191 3040 2954 124.5 Stream Stream 1 1 4.8 4.5 5.3 4.8 2509.0 2627.7 6368 2954 2935 255.1 Stream Stream 1 1 4.5 5.8 4.8 6.0 2298.0 2407.3 6367 2935 2974 168.5 Stream Stream 1 1 5.8 5.7 6.0 5.9 2218.4 2340.5 22288 2974 22546 65.7 Stream Stream 1 1 5.7 5.7 5.9 5.9 2234.0 2354.4 20314 3722 3648 80.9 Stream Stream 1 1 1.3 1.8 1.3 1.8 88.9 88.9 1137 3648 3641 163.9 3×4 3×4 1 1 12.0 12.0 1.8 1.5 1.8 1.5 88.7 88.7 20317 3641 3561 137.6 Stream Stream 1 1 1.5 4.7 1.5 4.9 88.6 88.6 1860 4961 4883 84.0 4×4 4×4 1 1 16.0 16.0 1.5 1.7 1.5 1.7 56.5 56.5 1811 4883 4836 68.4 3 3 1 1 7.1 7.1 1.7 1.7 1.7 1.7 56.5 56.5 1785 4836 4723 102.5 4 4 1 1 12.6 12.6 1.7 2.0 1.7 2.0 87.1 87.1 1725 4723 4685 81.1 4 4 1 1 12.6 12.6 2.0 2.0 2.0 2.0 87.2 87.2 1709 4685 4541 117.6 4 4 1 1 12.6 12.6 2.0 1.6 2.0 1.6 87.2 87.2 1640 4541 4264 224.4 4 4 1 1 12.6 12.6 1.6 1.6 1.6 1.6 87.2 87.2
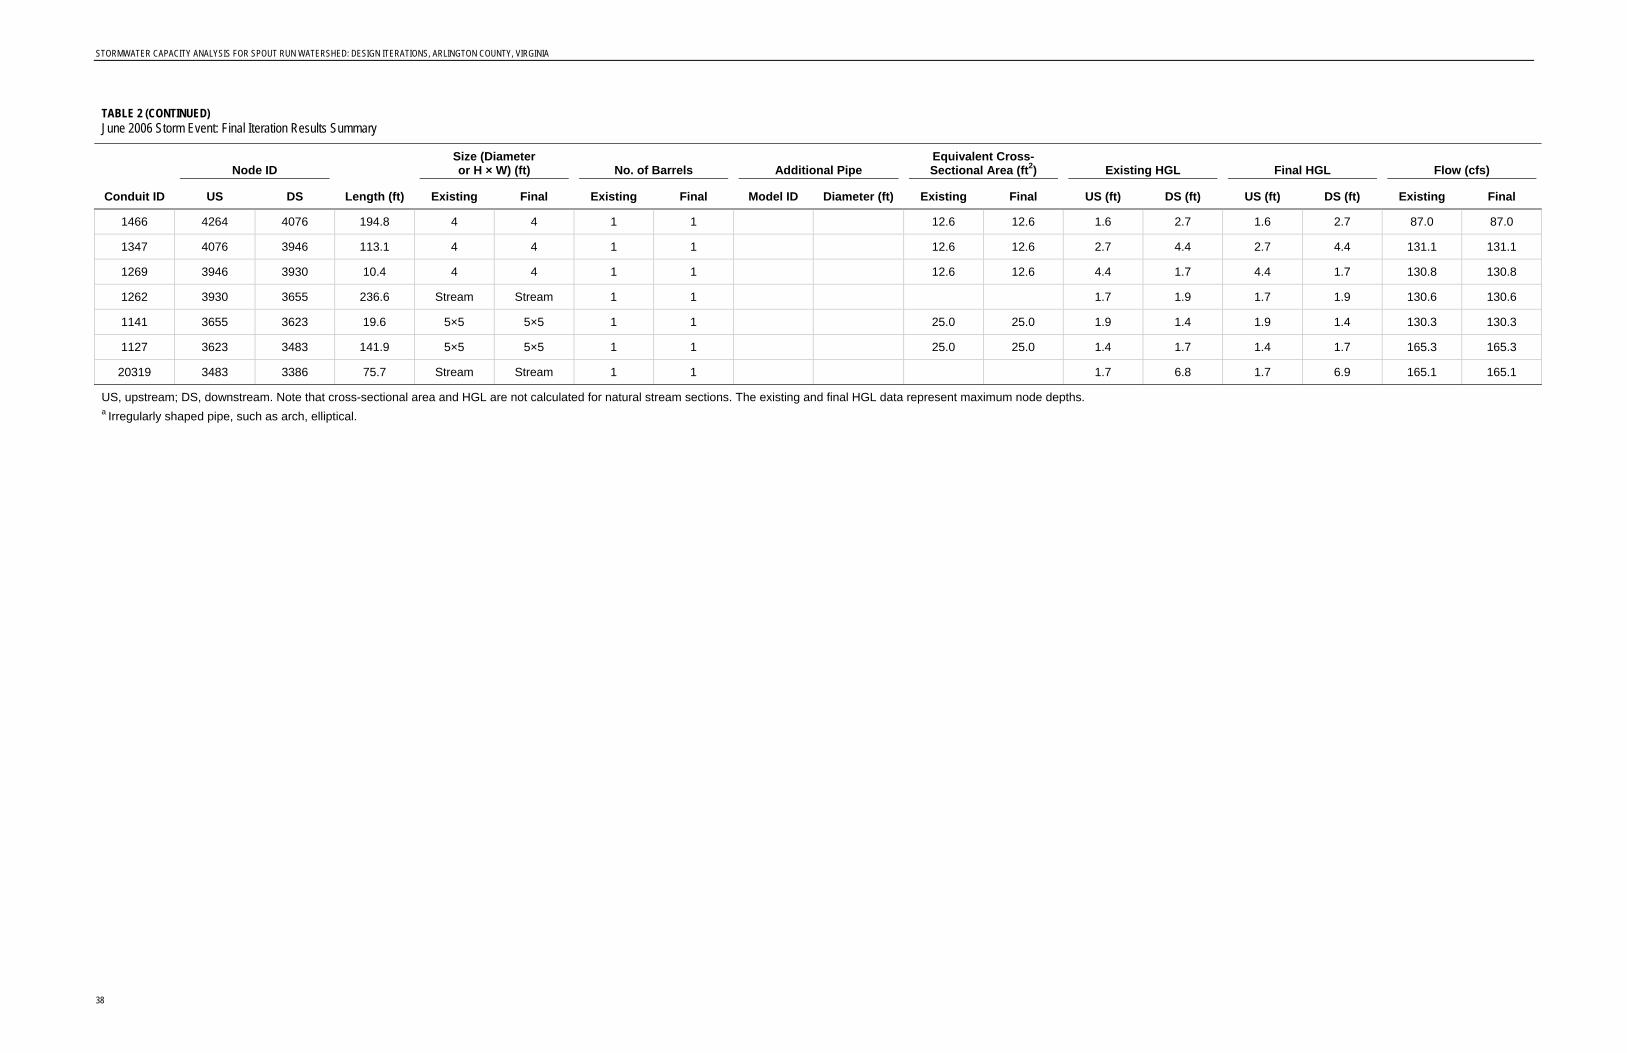
STORMWATER CAPACITY ANALYSIS FOR SPOUT RUN WATERSHED: DESIGN ITERATIONS, ARLINGTON COUNTY, VIRGINIA
38
TABLE 2 (CONTINUED) June 2006 Storm Event: Final Iteration Results Summary
Conduit ID
Node ID
Length (ft)
Size (Diameter or H × W) (ft) No. of Barrels Additional Pipe
Equivalent Cross-Sectional Area (ft2) Existing HGL Final HGL Flow (cfs)
US DS Existing Final Existing Final Model ID Diameter (ft) Existing Final US (ft) DS (ft) US (ft) DS (ft) Existing Final
1466 4264 4076 194.8 4 4 1 1 12.6 12.6 1.6 2.7 1.6 2.7 87.0 87.0 1347 4076 3946 113.1 4 4 1 1 12.6 12.6 2.7 4.4 2.7 4.4 131.1 131.1 1269 3946 3930 10.4 4 4 1 1 12.6 12.6 4.4 1.7 4.4 1.7 130.8 130.8 1262 3930 3655 236.6 Stream Stream 1 1 1.7 1.9 1.7 1.9 130.6 130.6 1141 3655 3623 19.6 5×5 5×5 1 1 25.0 25.0 1.9 1.4 1.9 1.4 130.3 130.3 1127 3623 3483 141.9 5×5 5×5 1 1 25.0 25.0 1.4 1.7 1.4 1.7 165.3 165.3 20319 3483 3386 75.7 Stream Stream 1 1 1.7 6.8 1.7 6.9 165.1 165.1
US, upstream; DS, downstream. Note that cross-sectional area and HGL are not calculated for natural stream sections. The existing and final HGL data represent maximum node depths. a Irregularly shaped pipe, such as arch, elliptical.

FIGURE 6Recommended Additional Capacityfor the June 2006 StormSpout Run WatershedArlington County Storm Capacity Analysis
H:\ARLINGTONVACOUNTYOF\392309STORMWATERCAP\WSSPOUT\WORKINGGIS\LAYOUT\INTERNAL\DESIGN_ITERATIONS\FIGURE6_RECOMMENDED_ADDITIONAL_CAPACITY_JUNE_2006_STORM.MXD FCAIN 12/10/2012 9:11:40 AM
VICINITY MAP
N Pershing Dr
Lorcom Ln
Wilson Blvd
N George Mason Dr
26th St N
N Monroe St
N Highl and St15th St N
N Bar ton St
16th St N
10th St N
Spout Run Pkwy
N Harrison St
Clarendon Blvd
George Washington Memorial Pkwy
Fairfax Dr
Wilson Blvd
Mili t ary Rd
Kirkw
ood R
d
N Utah St
N Staffo rd St
N Quincy St
Canal Rd NW
N Glebe Rd
Washington Blvd
Washington Blvd
Old Dominion Dr
Arlington Blvd
Lee Hwy
66
LegendModeled Stormwater Mains withRecommended Additional CapacityModeled Stormwater Mainswith Sufficient Existing CapacityStreamsRoadsModeled (Revised) Watershed Boundary
0 1,200600Feet

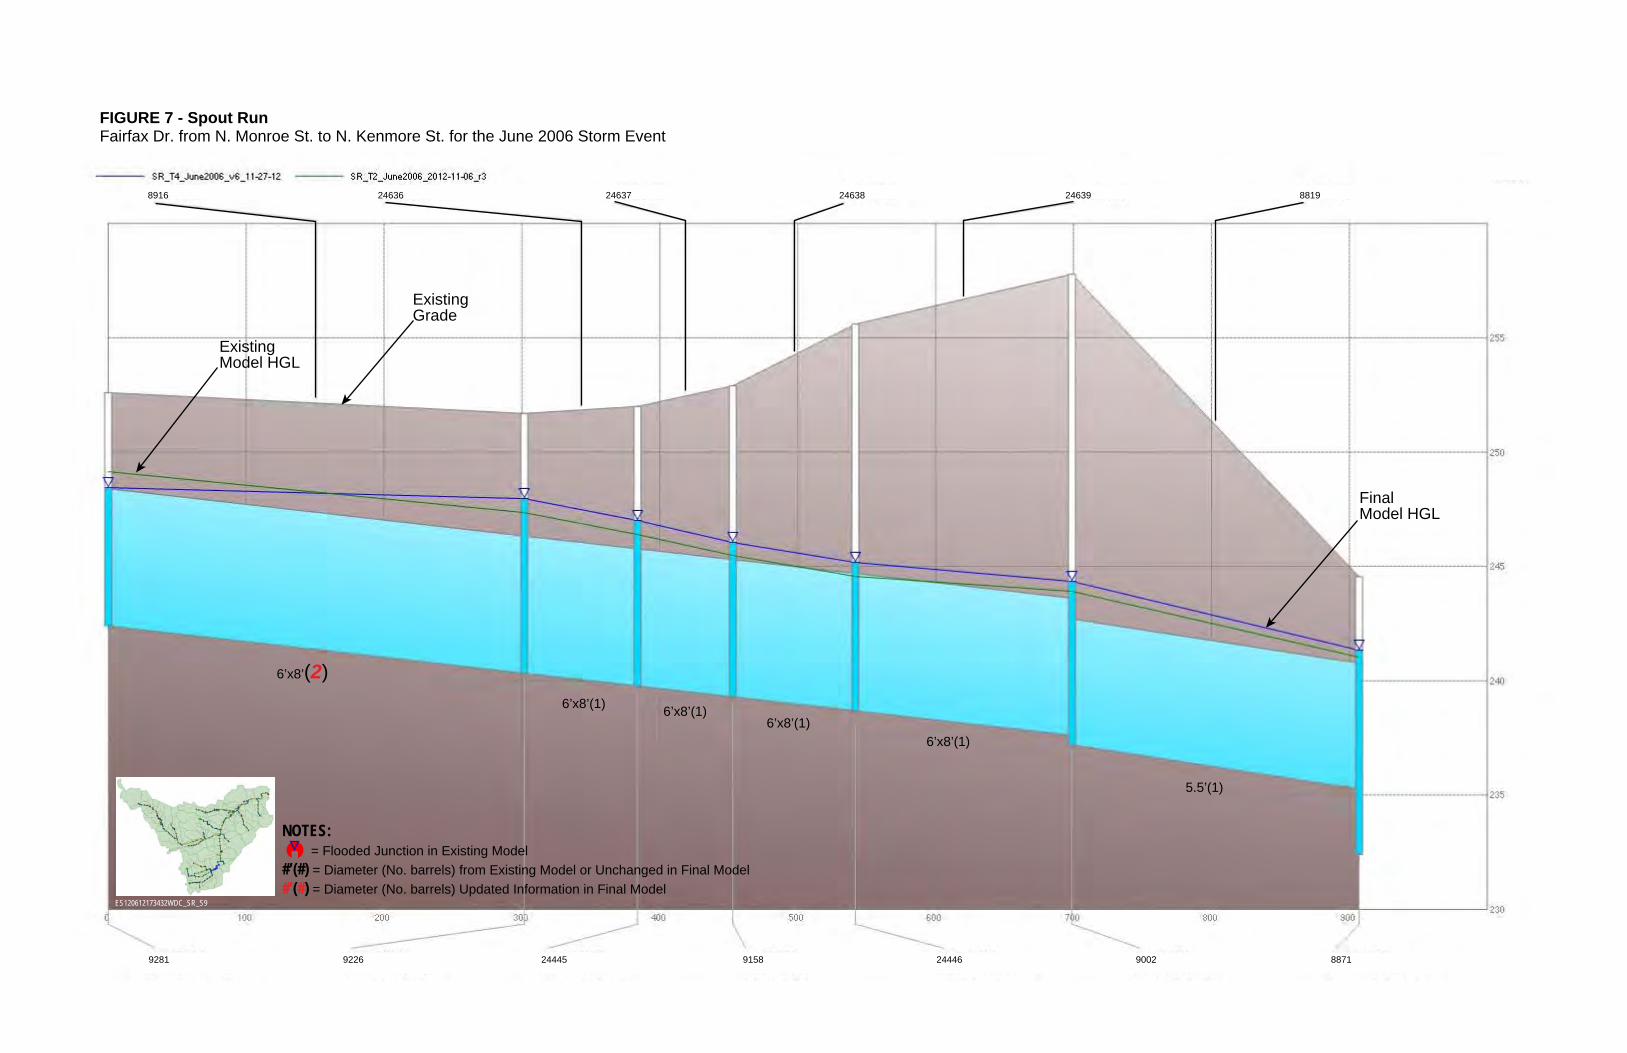
FIGURE 7 - Spout RunFairfax Dr. from N. Monroe St. to N. Kenmore St. for the June 2006 Storm Event
6’x8’(1)
6’x8’(1)
5.5’(1)
6’x8’(1)6’x8’(1)
6’x8’(2)
ExistingModel HGL
ExistingGrade
FinalModel HGL
ES120612173432WDC_SR_S9
NOTES: = Flooded Junction in Existing Model #’(#) = Diameter (No. barrels) from Existing Model or Unchanged in Final Model#’(#) = Diameter (No. barrels) Updated Information in Final Model
8916
9281 9158 8871900224446244459226
24636 24638 88192463924637

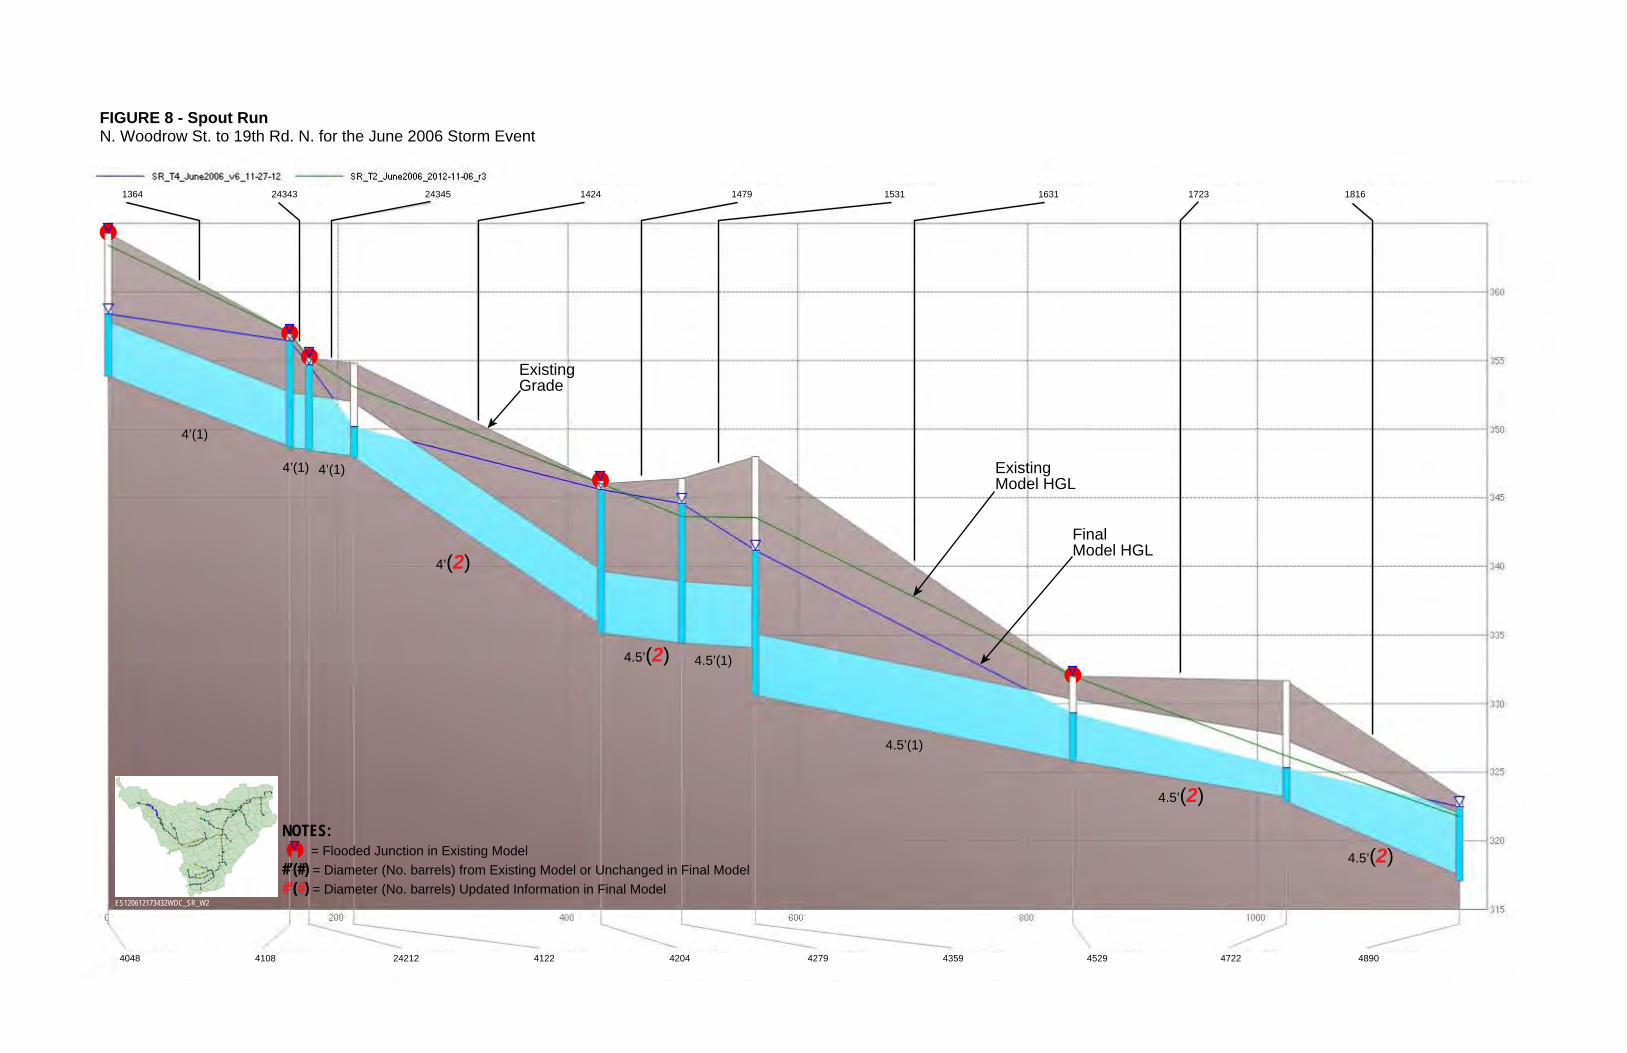
FIGURE 8 - Spout RunN. Woodrow St. to 19th Rd. N. for the June 2006 Storm Event
4’(1)
4.5’(2) 4.5’(1)
4.5’(2)
4.5’(2)
4.5’(1)
4’(1)4’(1)
4’(2)
ExistingModel HGL
ExistingGrade
FinalModel HGL
ES120612173432WDC_SR_W2
NOTES: = Flooded Junction in Existing Model #’(#) = Diameter (No. barrels) from Existing Model or Unchanged in Final Model#’(#) = Diameter (No. barrels) Updated Information in Final Model
1364 1531 181617231631147914242434524343
4048 4279 4722 48904529435942044122242124108


FIGURE 9 - Spout Run19th Rd. N. to 18th St. N. (West Pipe) for the June 2006 Storm Event
4.5’(2)
3.5’(2)
4.5’(2)
4.5’(2)4.5’(2)
4.5’(2)
4.5’(2)4.5’(2)
4.5’(2)
4.5’(1)
5’(1)
4.5’(1)
4.5’(1)4.5’(1)
ExistingModel HGL
ExistingGrade
FinalModel HGL
ES120612173432WDC_SR_W3
NOTES: = Flooded Junction in Existing Model #’(#) = Diameter (No. barrels) from Existing Model or Unchanged in Final Model#’(#) = Diameter (No. barrels) Updated Information in Final Model
1836 2023 20429 2320 243423432437124370225622531990196019391867
4890 5254 5572 5858 601758015716242355688568352035159512549794925

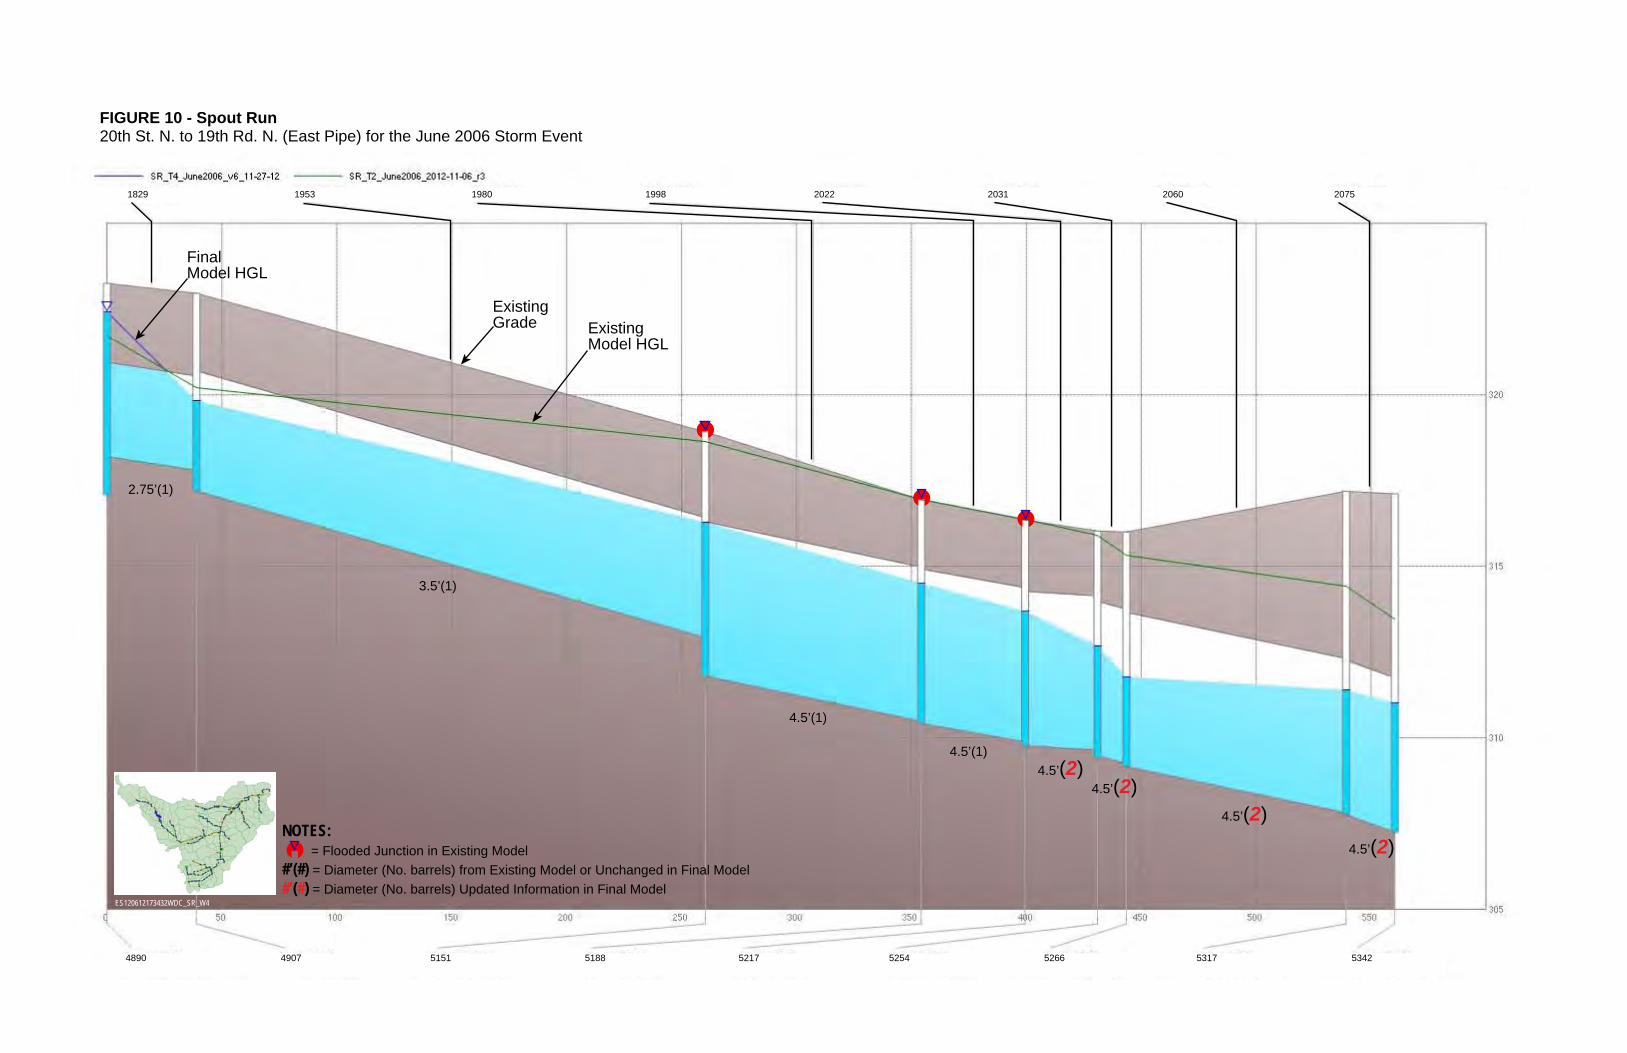
FIGURE 10 - Spout Run20th St. N. to 19th Rd. N. (East Pipe) for the June 2006 Storm Event
2.75’(1)
3.5’(1)
4.5’(1)
4.5’(1)
ExistingModel HGL
ExistingGrade
FinalModel HGL
ES120612173432WDC_SR_W4
NOTES: = Flooded Junction in Existing Model #’(#) = Diameter (No. barrels) from Existing Model or Unchanged in Final Model#’(#) = Diameter (No. barrels) Updated Information in Final Model
1829 1998 2060 20752031202219801953
4890 5254 5342531752665217518851514907
4.5’(2)4.5’(2)
4.5’(2)4.5’(2)

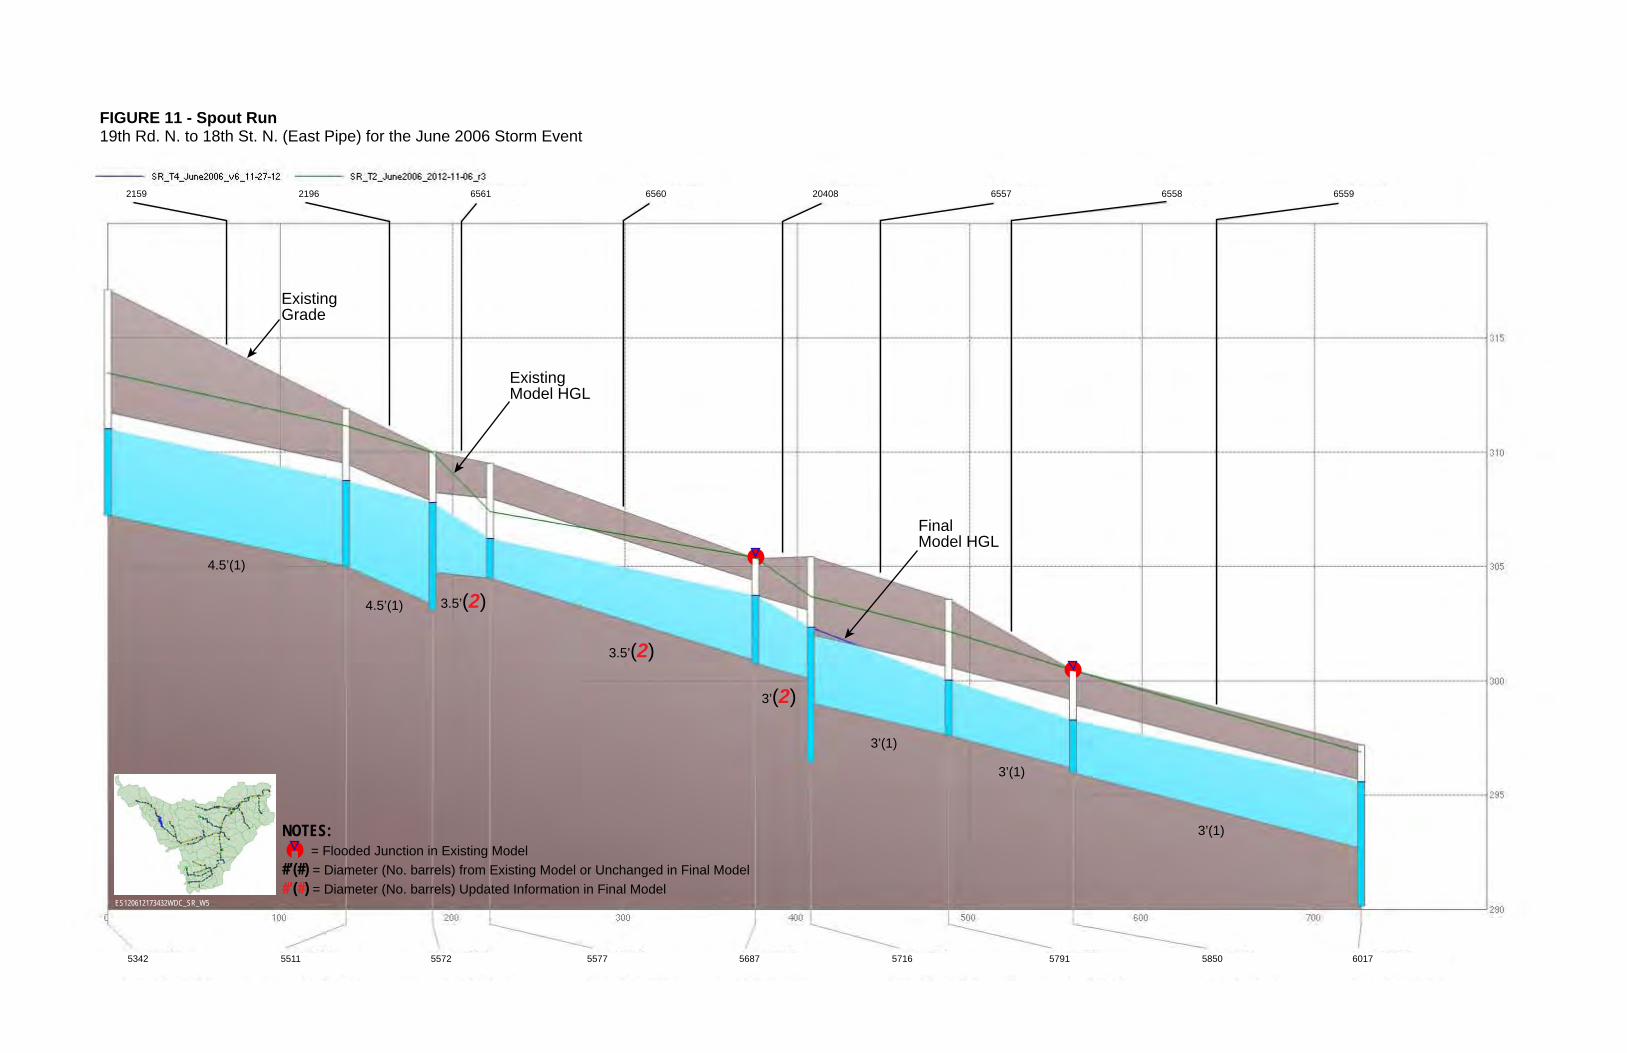
FIGURE 11 - Spout Run19th Rd. N. to 18th St. N. (East Pipe) for the June 2006 Storm Event
3.5’(2)
3.5’(2)
3’(1)3’(1)
3’(1)
4.5’(1)
4.5’(1)
ExistingModel HGL
ExistingGrade
FinalModel HGL
ES120612173432WDC_SR_W5
NOTES: = Flooded Junction in Existing Model #’(#) = Diameter (No. barrels) from Existing Model or Unchanged in Final Model#’(#) = Diameter (No. barrels) Updated Information in Final Model
5342 5687 6017585057915716557755725511
2159 20408 655965586557656065612196
3’(2)

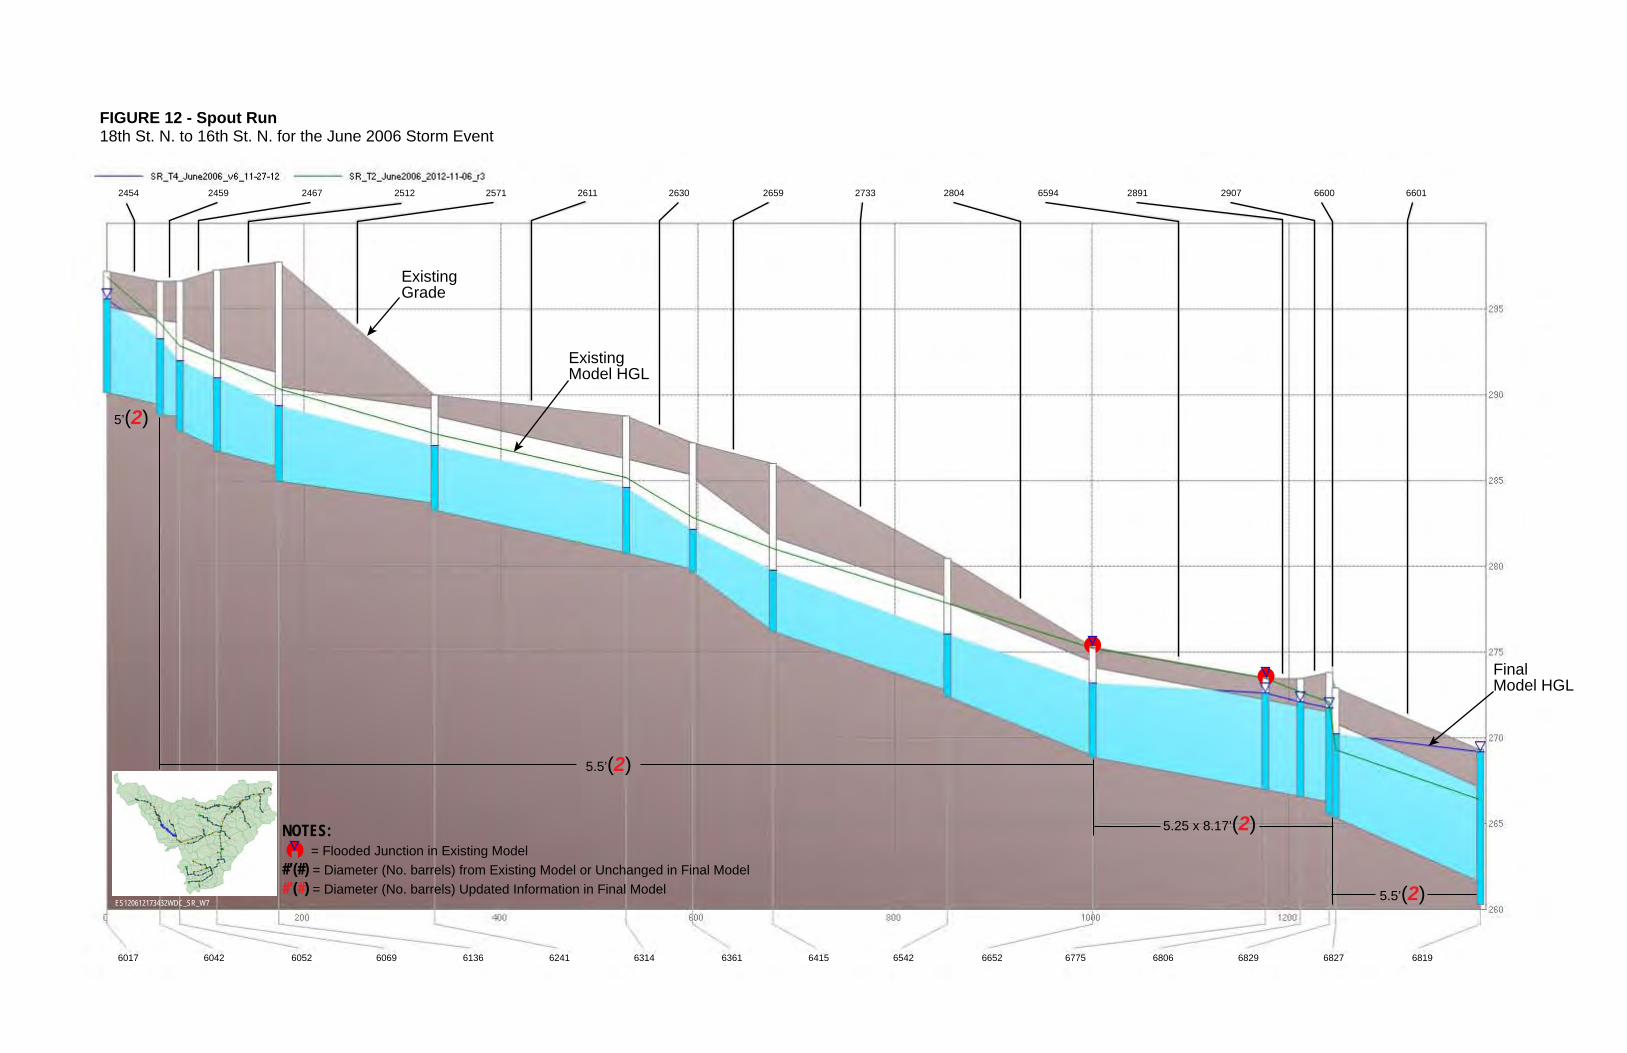
FIGURE 12 - Spout Run18th St. N. to 16th St. N. for the June 2006 Storm Event
5.25 x 8.17’(2)
5’(2)
5.5’(2)
5.5’(2)
ExistingModel HGL
ExistingGrade
FinalModel HGL
ES120612173432WDC_SR_W7
NOTES: = Flooded Junction in Existing Model #’(#) = Diameter (No. barrels) from Existing Model or Unchanged in Final Model#’(#) = Diameter (No. barrels) Updated Information in Final Model
6017 6361 6806 6819682768296775665265426415631462416136606960526042
2454 2659 6601660029072891659428042733263026112571251224672459

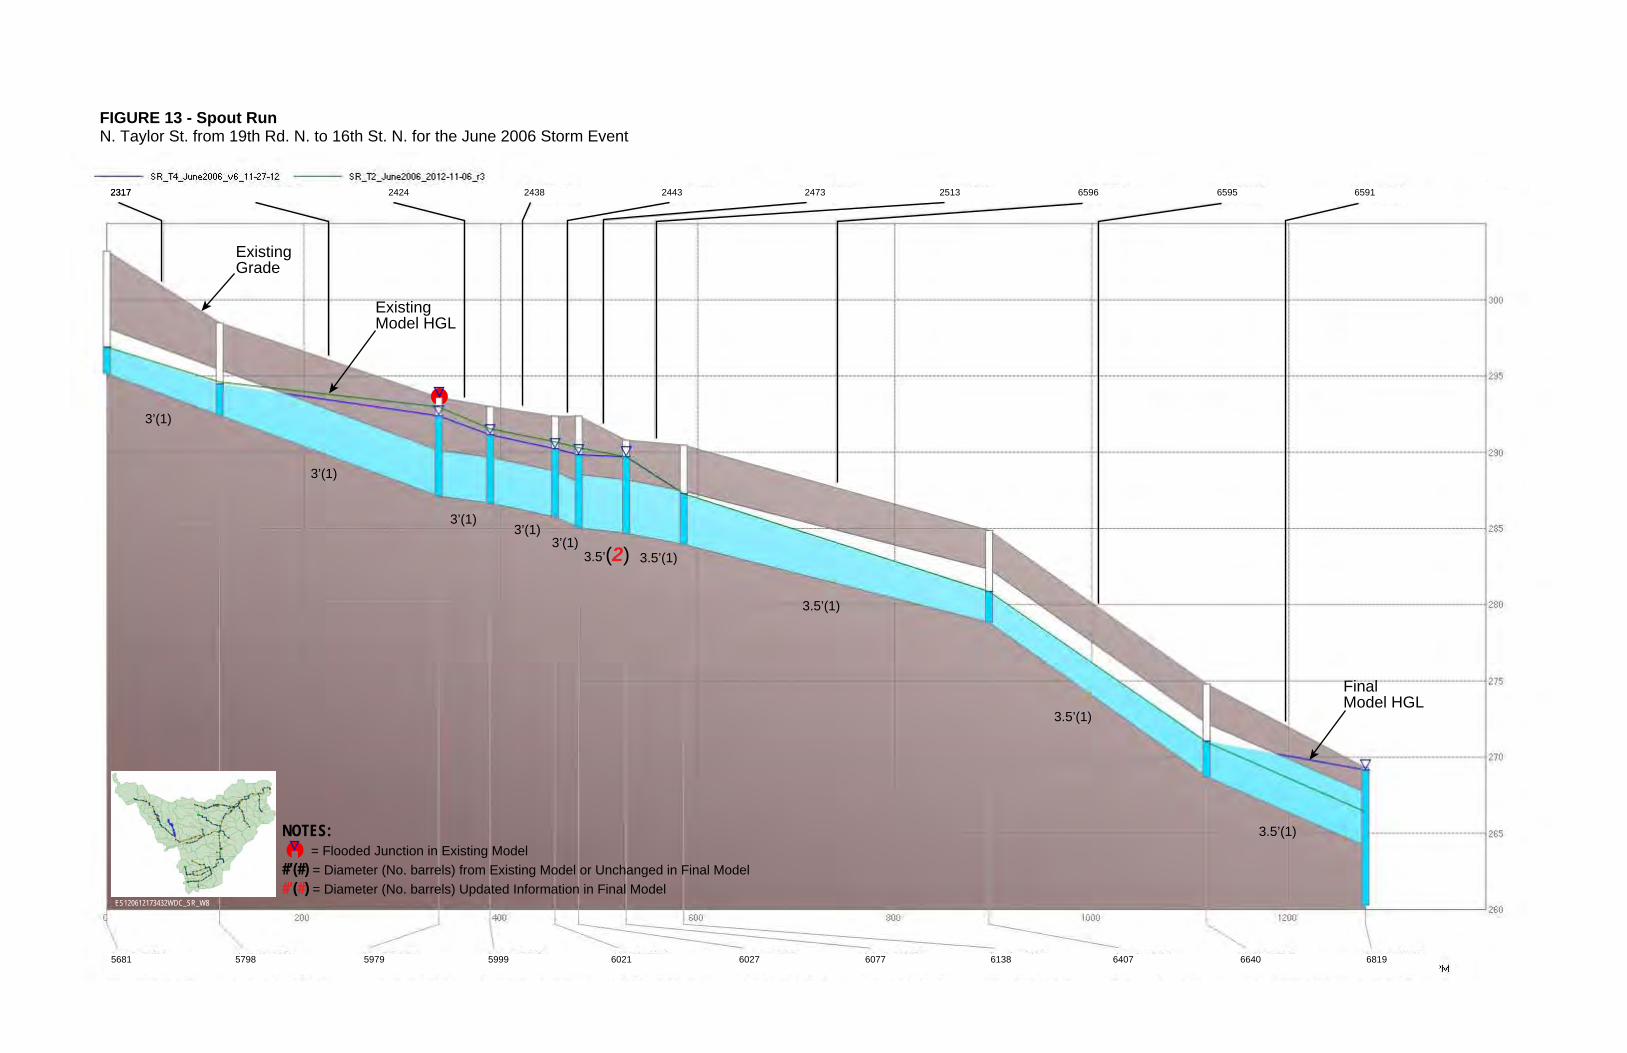
FIGURE 13 - Spout RunN. Taylor St. from 19th Rd. N. to 16th St. N. for the June 2006 Storm Event
3.5’(2)
3’(1)
3’(1)3’(1)
3’(1)
3’(1)
3.5’(1)
3.5’(1)
3.5’(1)
3.5’(1)
ExistingModel HGL
ExistingGrade
FinalModel HGL
ES120612173432WDC_SR_W8
NOTES: = Flooded Junction in Existing Model #’(#) = Diameter (No. barrels) from Existing Model or Unchanged in Final Model#’(#) = Diameter (No. barrels) Updated Information in Final Model
5681 6027 6640 68196407613860776021599959795798
2317 2424 2473 6595 659165962513244324382317


FIGURE 14 - Spout Run20th St. N. to 19th St. N. for the June 2006 Storm Event
3’(2)
3’(2)3’(2)
3’(2)
3’(1)
3’(1)
3’(1)
3’(1)
3’(1)
3’(1)
3’(1)
3’(1)
3’(1)
3’(1)
3’(1)
ExistingModel HGL
ExistingGrade
FinalModel HGL
ES120612173432WDC_SR_C3
NOTES: = Flooded Junction in Existing Model #’(#) = Diameter (No. barrels) from Existing Model or Unchanged in Final Model#’(#) = Diameter (No. barrels) Updated Information in Final Model
2027 2140 2292227566856683668222122138214121342342623425234246646
5408 5466 5719 57395720571856645596546854695462543523512531152605197

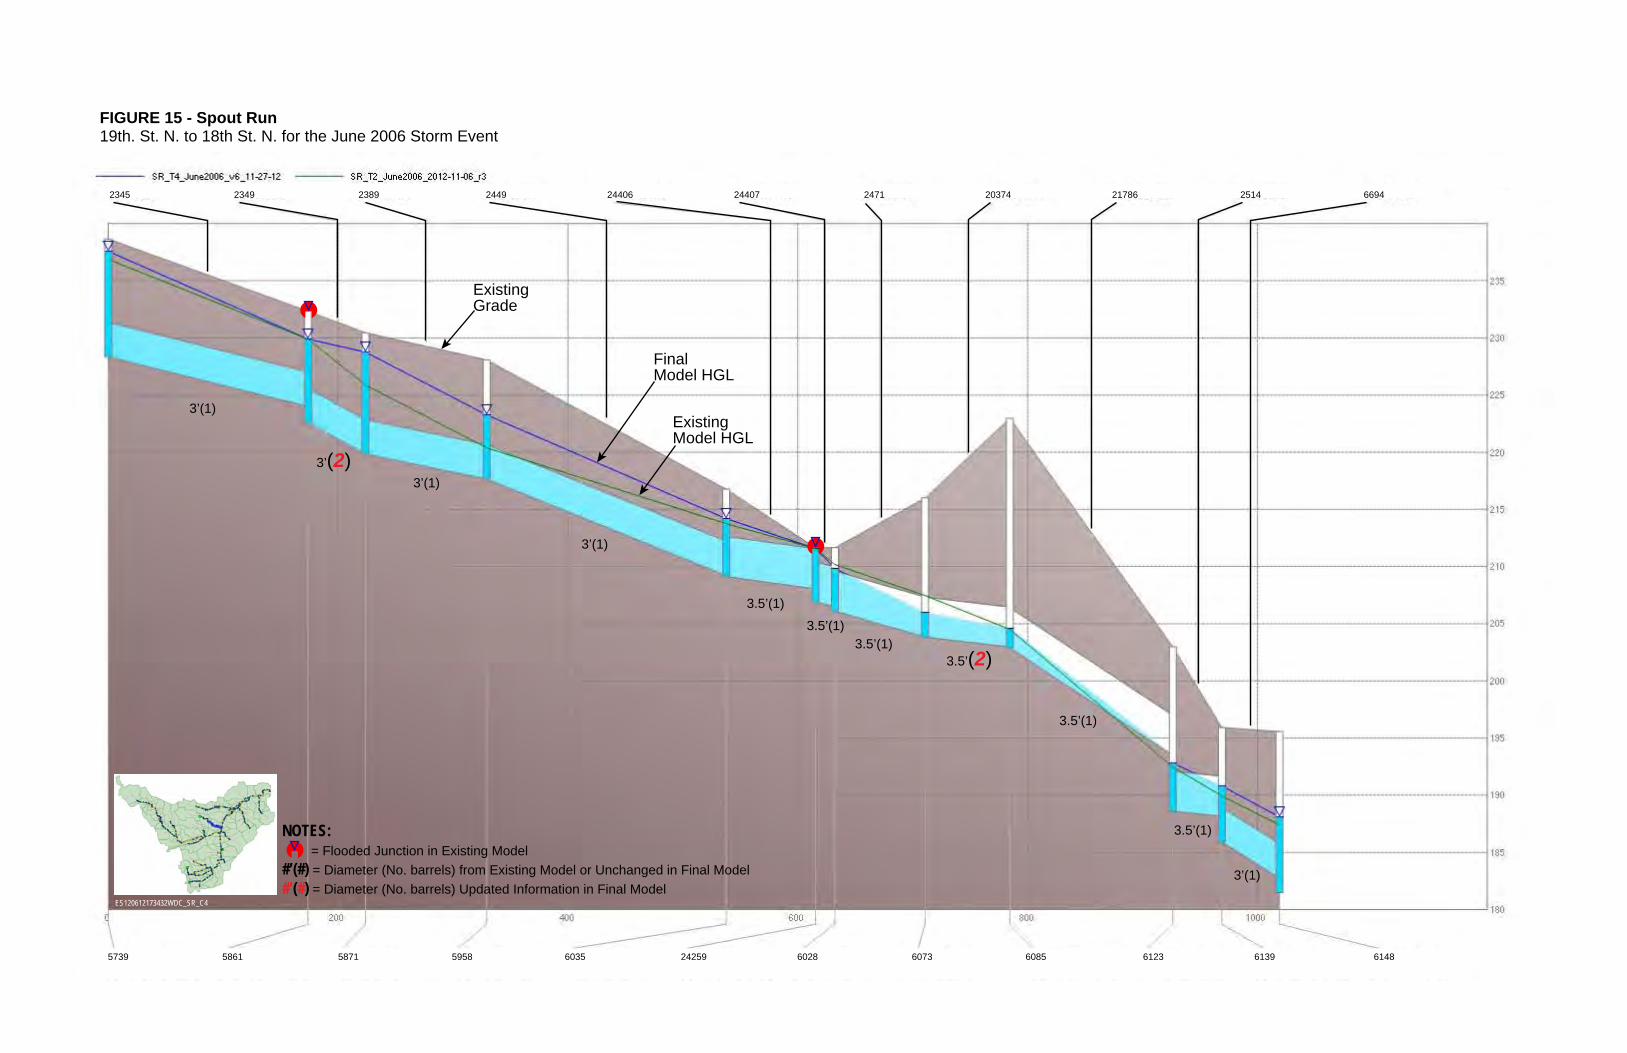
FIGURE 15 - Spout Run19th. St. N. to 18th St. N. for the June 2006 Storm Event
3’(2)
3.5’(2)
3’(1)
3’(1)
3’(1)
3’(1)
3.5’(1)
3.5’(1)3.5’(1)
3.5’(1)
3.5’(1)
ExistingModel HGL
ExistingGrade
FinalModel HGL
ES120612173432WDC_SR_C4
NOTES: = Flooded Junction in Existing Model #’(#) = Diameter (No. barrels) from Existing Model or Unchanged in Final Model#’(#) = Diameter (No. barrels) Updated Information in Final Model
2345 24407 2514 66942178620374247124406244923892349
5861 5871 6028 6139 614861236085607324259603559585739

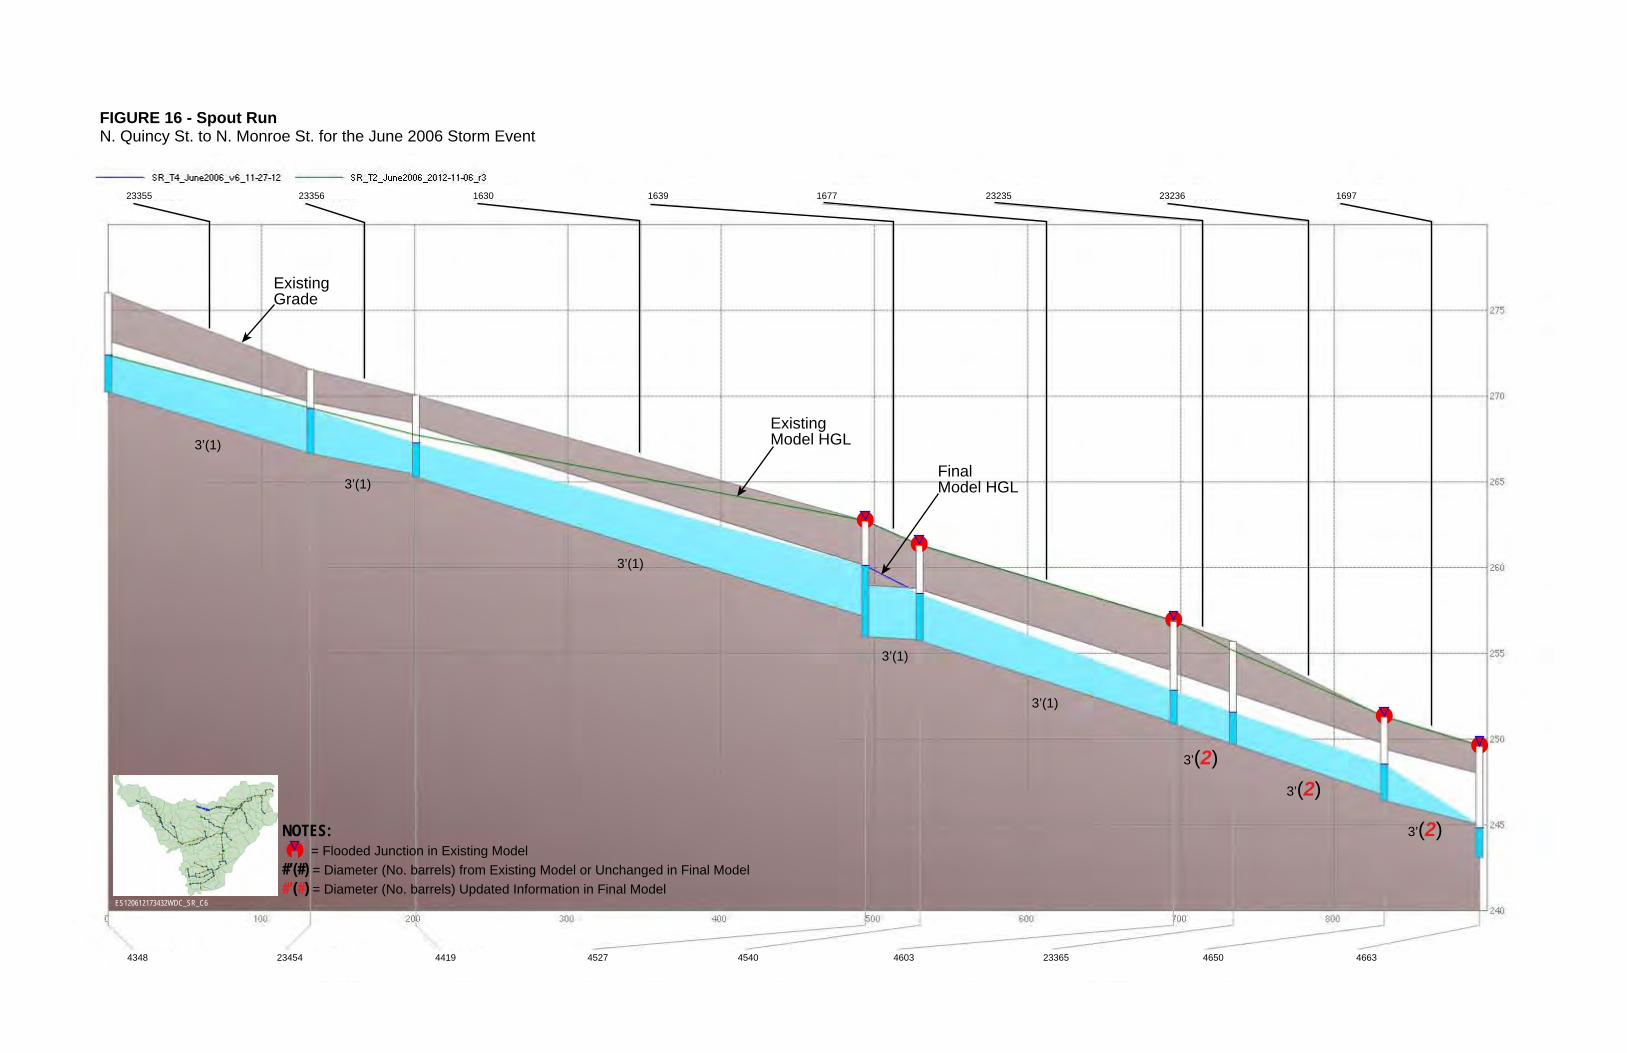
FIGURE 16 - Spout RunN. Quincy St. to N. Monroe St. for the June 2006 Storm Event
3’(2)
3’(2)3’(2)
3’(1)
3’(1)
3’(1)
3’(1)
3’(1)
ExistingModel HGL
ExistingGrade
FinalModel HGL
ES120612173432WDC_SR_C6
NOTES: = Flooded Junction in Existing Model #’(#) = Diameter (No. barrels) from Existing Model or Unchanged in Final Model#’(#) = Diameter (No. barrels) Updated Information in Final Model
23355 1639 169723236232351677163023356
4348 4527 23365 4663465046034540441923454

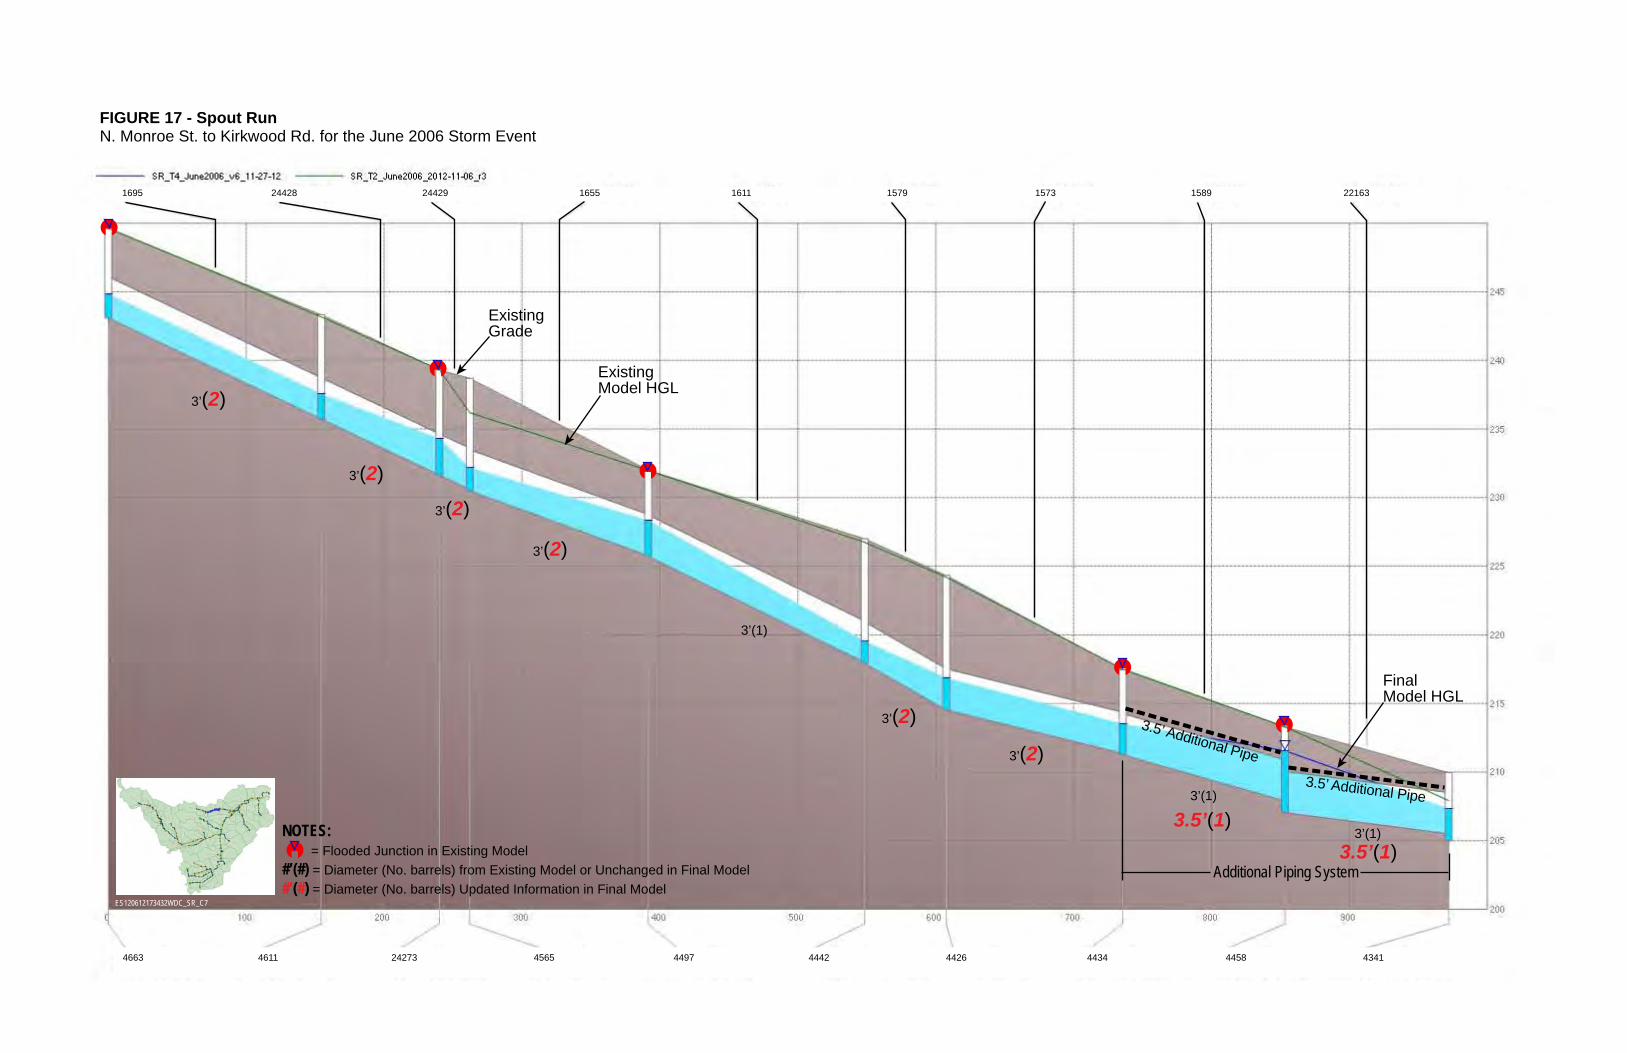
FIGURE 17 - Spout RunN. Monroe St. to Kirkwood Rd. for the June 2006 Storm Event
3’(2)
3’(2)
3’(2)
3.5’(1)3.5’(1)
3’(2)
3’(2)3’(2)
3’(1)
3’(1)
3’(1)
ExistingModel HGL
ExistingGrade
FinalModel HGL
ES120612173432WDC_SR_C7
NOTES: = Flooded Junction in Existing Model #’(#) = Diameter (No. barrels) from Existing Model or Unchanged in Final Model#’(#) = Diameter (No. barrels) Updated Information in Final Model
Additional Piping System
3.5’ Additional Pipe3.5’ Additional Pipe
1695 1579 2216315891573161116552442924428
4663 4611 4497 4458 4341443444264442456524273

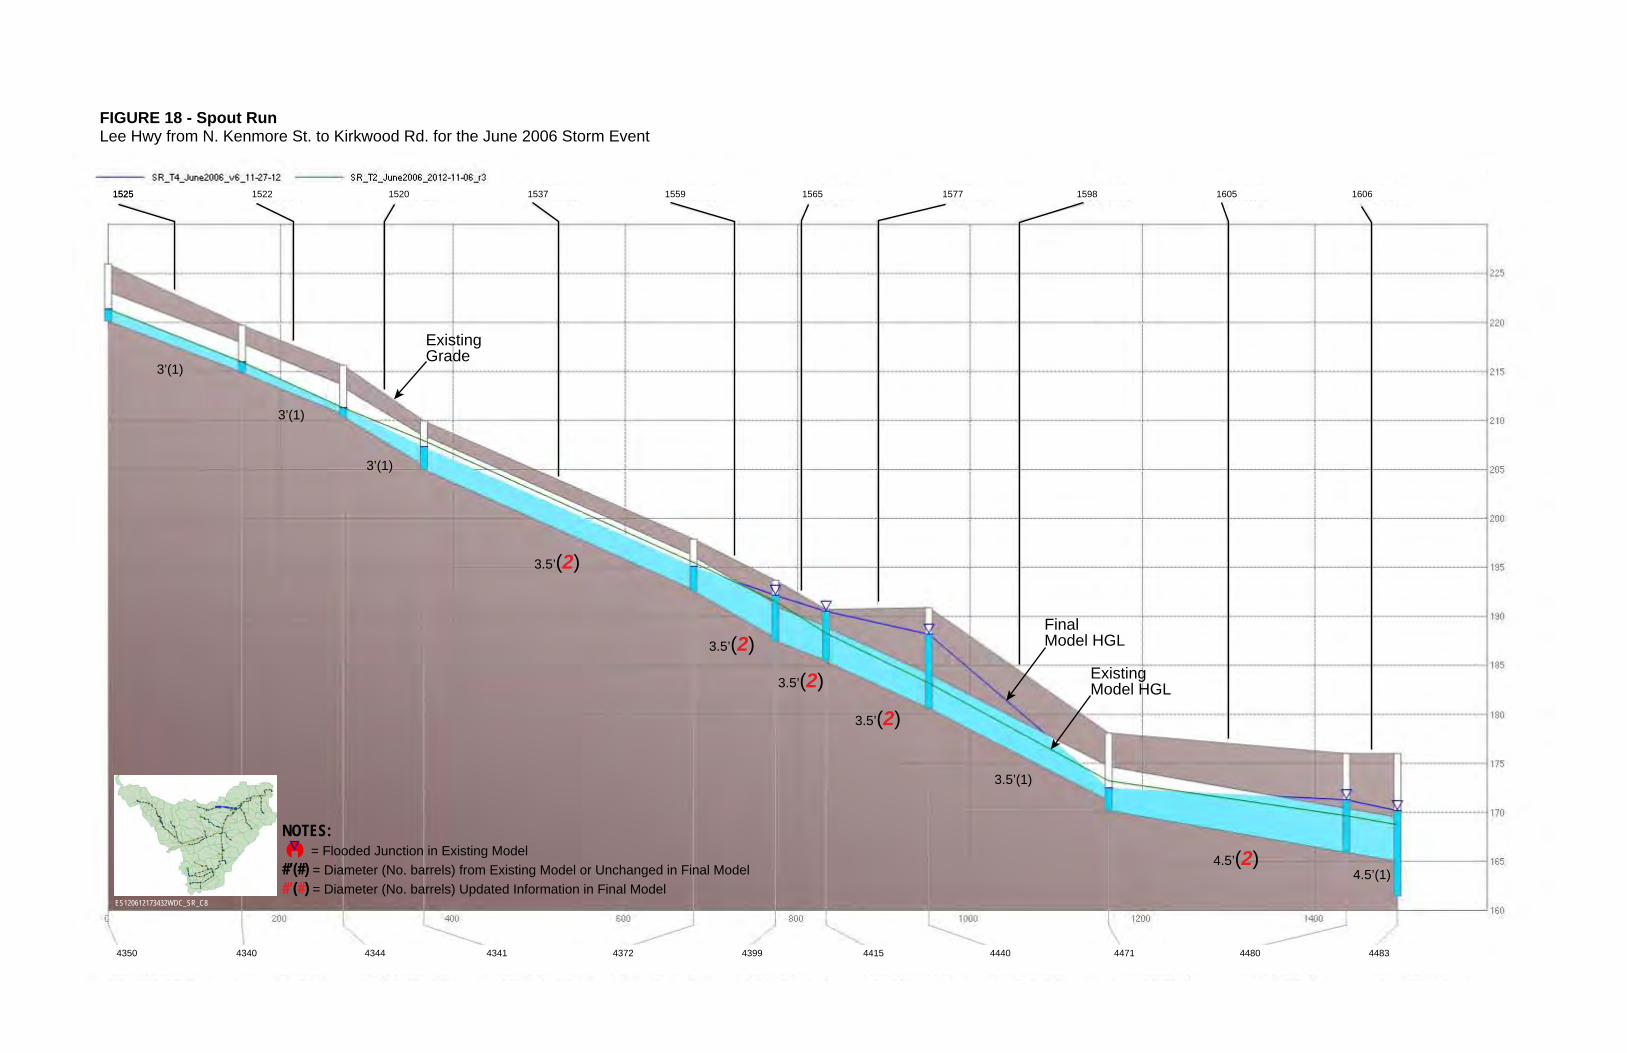
FIGURE 18 - Spout RunLee Hwy from N. Kenmore St. to Kirkwood Rd. for the June 2006 Storm Event
4.5’(2)
3.5’(2)
3.5’(2)3.5’(2)
3.5’(2)
4.5’(1)
3’(1)
3’(1)
3’(1)
3.5’(1)
ExistingModel HGL
ExistingGrade
FinalModel HGL
ES120612173432WDC_SR_C8
NOTES: = Flooded Junction in Existing Model #’(#) = Diameter (No. barrels) from Existing Model or Unchanged in Final Model#’(#) = Diameter (No. barrels) Updated Information in Final Model
15251525 1537 1598 1605 160615771565155915201522
4350 4372 4480 44834471444044154399434143444340

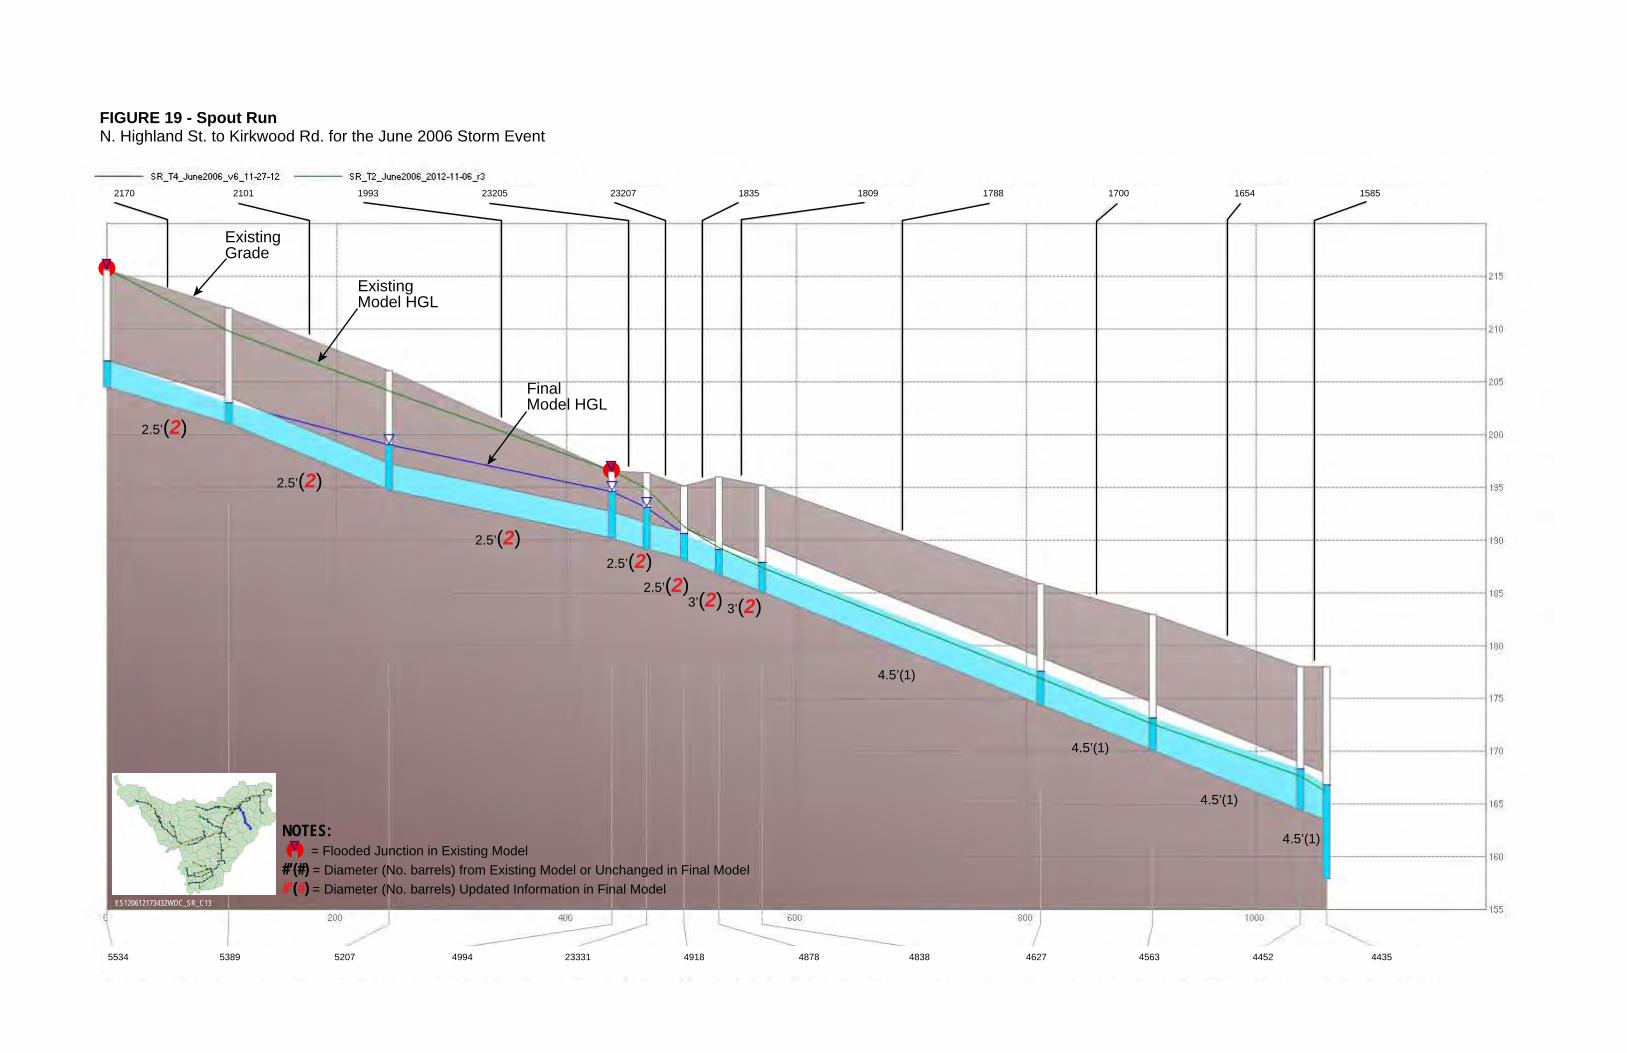
FIGURE 19 - Spout RunN. Highland St. to Kirkwood Rd. for the June 2006 Storm Event
3’(2) 3’(2)
2.5’(2)
2.5’(2)2.5’(2)
2.5’(2)
2.5’(2)
4.5’(1)
4.5’(1)
4.5’(1)
4.5’(1)
ExistingModel HGL
ExistingGrade
FinalModel HGL
ES120612173432WDC_SR_C13
NOTES: = Flooded Junction in Existing Model #’(#) = Diameter (No. barrels) from Existing Model or Unchanged in Final Model#’(#) = Diameter (No. barrels) Updated Information in Final Model
2170 1835 15851654170017881809232072320519932101
5534 4878 44354452456346274838491823331499452075389

STORMWATER CAPACITY ANALYSIS FOR SPOUT RUN WATERSHED: DESIGN ITERATIONS, ARLINGTON COUNTY, VIRGINIA
67
4.3 10yr-24hr SCS Type II Storm For the 10-yr 24-hr SCS Type II storm, additional capacity was added to 206 conduits (25,548 LF of pipe in total). This equates to approximately 62 percent of the modeled pipe network in Spout Run.
Changes to diameter and the existing and resulting flows are summarized in Table 3.A map showing the 10yr-24hr storm upgrade locations throughout the watershed is included in Figure 20. Profiles showing the existing conditions and final results are shown in Figure 21 through Figure 47. Profiles were displayed only for segments of the stormwater network where any of the following conditions were met:
Pipe size was increased An identical barrel was added to the system An additional pipe was added to the system
The existing model profile depicts the peak water surface elevation with solid blue fill and peak HGL with a dark blue line. The HGL represents the sum of the pressure head and the elevation head along the profile. Flooded nodes in the existing conditions model are annotated with a red dot behind the junction rim. The final profile displays the existing system HGL with a dark green line for reference.


STORMWATER CAPACITY ANALYSIS FOR SPOUT RUN WATERSHED: DESIGN ITERATIONS, ARLINGTON COUNTY, VIRGINIA
69
TABLE 3 10-yr, 24-hr SCS Type II Storm Event: Final Iteration Results Summary
Conduit ID
Node ID
Length (ft)
Size (Diameter or H × W) (ft) No. of Barrels Additional Pipe
Equivalent Cross-Sectional Area (ft2) Existing HGL Final HGL Flow (cfs)
US DS Existing Final Existing Final Model ID Diameter (ft) Existing Final US (ft) DS (ft) US (ft) DS (ft) Existing Final
South Branch
N. Randolph St. and Fairfax Dr. to N. Quincy St. 8875 9180 9286 111.0 3 3 1 1 7.1 7.1 4.9 5.0 4.4 3.8 45.3 44.0 8876 9286 9317 41.5 3 3 1 1 7.1 7.1 5.0 4.8 3.8 3.6 45.3 44.0 8877 9317 9370 84.8 3 3 1 1 7.1 7.1 4.8 5.1 3.6 4.1 45.3 44.0 9136 9370 9496 143.5 3 3 1 1 7.1 7.1 5.1 6.4 4.1 5.2 45.3 44.0 9088 9496 9546 44.1 3 3 1 1 7.1 7.1 6.4 5.7 5.2 4.3 45.3 44.0 9089 9546 9597 50.0 3 3 1 1 7.1 7.1 5.7 6.8 4.3 4.9 45.3 44.0 9090 9597 9657 67.2 3.5 3.5 1 1 9.6 9.6 6.8 6.8 4.9 4.2 45.3 44.1 9091 9657 9694 33.2 3.5 3.5 1 1 9.6 9.6 6.8 7.6 4.2 4.6 45.9 44.5 9092 9694 9701 11.1 3.5 3.5 1 1 9.6 9.6 7.6 7.8 4.6 4.8 46.4 44.9 9093 9701 9700 12.5 4 4 1 1 12.6 12.6 7.8 8.5 4.8 5.5 46.9 45.4 9102 9700 9677 142.8 4 4 1 1 12.6 12.6 8.5 8.6 5.5 5.8 51.8 51.5 9103 9677 9670 52.4 4 4 1 1 12.6 12.6 8.6 8.9 5.8 6.1 53.3 53.2 9104 9670 9666 43.2 4 4 1 1 12.6 12.6 8.9 9.0 6.1 6.2 53.7 53.9 9105 9666 9656 156.3 4 4 1 1 12.6 12.6 9.0 9.6 6.2 6.4 96.8 104.8 9106 9656 9652 46.3 4 4 1 1 12.6 12.6 9.6 10.2 6.4 6.2 96.8 104.7
N. Quincy St. and 10th St. N. to N. Monroe St. (Figure 21; profile continues on Figure 24) 9108 9652 9498 153.1 4.5 4.5 1 1 15.9 15.9 10.2 9.2 6.2 5.8 96.9 104.7 9109 9498 9471 36.0 4.5 4.5 1 1 15.9 15.9 9.2 8.8 5.8 5.3 96.9 104.6 9107 9471 9443 270.7 4.5 4.5 1 1 15.9 15.9 8.8 9.1 5.3 4.9 96.9 104.8 9138 9443 9375 260.8 4.5 4.5 1 1 15.9 15.9 9.1 10.0 4.9 5.4 96.9 102.8 8944 9375 9269 375.6 5 5 1 1 19.6 19.6 10.0 8.1 5.4 5.2 153.1 150.6 8886 9269 9258 93.1 5 5 1 1 19.6 19.6 8.1 7.0 5.2 5.3 153.1 150.3 8908 9258 9250 21.9 5.5 5.5 1 2 23.8 47.5 7.0 7.1 5.3 5.2 142.2 239.4 8909 9250 9210 122.6 5.5 5.5 1 2 23.8 47.5 7.1 7.2 5.2 5.5 142.1 239.3 8910 9210 9187 50.6 5.5 5.5 1 2 23.8 47.5 7.2 7.6 5.5 5.5 142.1 239.2 8913 9187 9186 49.5 5.5 5.5 1 2 23.8 47.5 7.6 8.3 5.5 5.2 142.1 239.2

STORMWATER CAPACITY ANALYSIS FOR SPOUT RUN WATERSHED: DESIGN ITERATIONS, ARLINGTON COUNTY, VIRGINIA
70
TABLE 3 (CONTINUED) 10-yr, 24-hr SCS Type II Storm Event: Final Iteration Results Summary
Conduit ID
Node ID
Length (ft)
Size (Diameter or H × W) (ft) No. of Barrels Additional Pipe
Equivalent Cross-Sectional Area (ft2) Existing HGL Final HGL Flow (cfs)
US DS Existing Final Existing Final Model ID Diameter (ft) Existing Final US (ft) DS (ft) US (ft) DS (ft) Existing Final
20681 9186 9213 27.0 5.5 5.5 1 2 23.8 47.5 8.3 8.4 5.2 4.6 142.1 239.3 20682 9213 9281 77.0 5.5 5.5 1 2 23.8 47.5 8.4 10.2 4.6 5.1 143.3 239.5
N. Quincy St. and N. Nelson St. to 10th St. N. 8861 8753 9019 597.6 3.5 3.5 1 1 9.6 9.6 4.5 3.6 4.5 3.5 77.6 77.3 8862 9019 9057 55.3 4 4 1 1 12.6 12.6 3.6 3.1 3.5 2.9 77.2 76.9 8863 9057 9037 256.1 4 4 1 1 12.6 12.6 3.1 4.7 2.9 3.6 77.0 76.9 17054 9037 9022 43.6 4 4 1 1 12.6 12.6 4.7 4.9 3.6 3.8 77.1 76.6 24640 9022 9217 231.6 4 4 1 1 12.6 12.6 4.9 5.9 3.8 5.0 77.1 76.5 16692 9217 9221 11.4 4 4 1 1 12.6 12.6 5.9 6.4 5.0 5.1 40.0 76.6 17053 9221 9258 70.1 4.5 4.5 1 1 15.9 15.9 6.4 7.0 5.1 5.3 53.6 95.5
Fairfax Dr. from N. Quincy St. to N. Monroe St. 9119 9720 9722 221.3 3 3 1 1 7.1 7.1 4.0 7.7 1.1 1.5 13.6 9.8 9120 9722 9724 39.0 3.5 3.5 1 1 9.6 9.6 7.7 7.2 1.5 1.9 14.1 12.0 9121 9724 9695 333.6 3.5 3.5 1 1 9.6 9.6 7.2 6.7 1.9 4.9 42.5 40.4 9122 9695 9617 64.9 3.5 3.5 1 1 9.6 9.6 6.7 6.3 4.9 4.9 42.5 40.6 9212 9617 9584 125.6 3.5 3.5 1 1 9.6 9.6 6.3 6.7 4.9 5.3 42.4 39.5 9139 9584 9535 98.7 3.5 3.5 1 1 9.6 9.6 6.7 6.9 5.3 5.0 56.3 65.2 9140 9535 9425 200.9 3.5 3.5 1 1 9.6 9.6 6.9 7.7 5.0 4.5 56.3 65.3 9203 9425 9362 211.1 4 4 1 1 12.6 12.6 7.7 8.8 4.5 4.5 56.3 66.3 8903 9362 9357 28.0 4 4 1 1 12.6 12.6 8.8 7.8 4.5 3.3 56.3 66.6
Stub at N. Monroe St. 20737 9418 9398 32.5 3 3 1 1 7.1 7.1 7.8 8.0 3.7 4.1 0.5 1.4 8906 9398 9362 67.3 3 3 1 1 7.1 7.1 8.0 8.8 4.1 4.5 1.9 5.9
9th St. N. from N. Randolph St. to N. Oakland St. (Figure 22; profile continues on Figure 23) 9053 10266 10259 30.8 3 3 1 1 7.1 7.1 4.5 4.3 3.6 3.4 40.2 41.2 9054 10259 10222 156.7 3 3 1 1 7.1 7.1 4.3 6.0 3.4 3.4 40.2 41.2 24679 10222 24482 61.1 3 3 1 1 7.1 7.1 6.0 5.6 3.4 3.3 40.2 41.2 24680 24482 10190 38.9 3 3 1 1 7.1 7.1 5.6 4.0 3.3 3.1 40.2 41.2
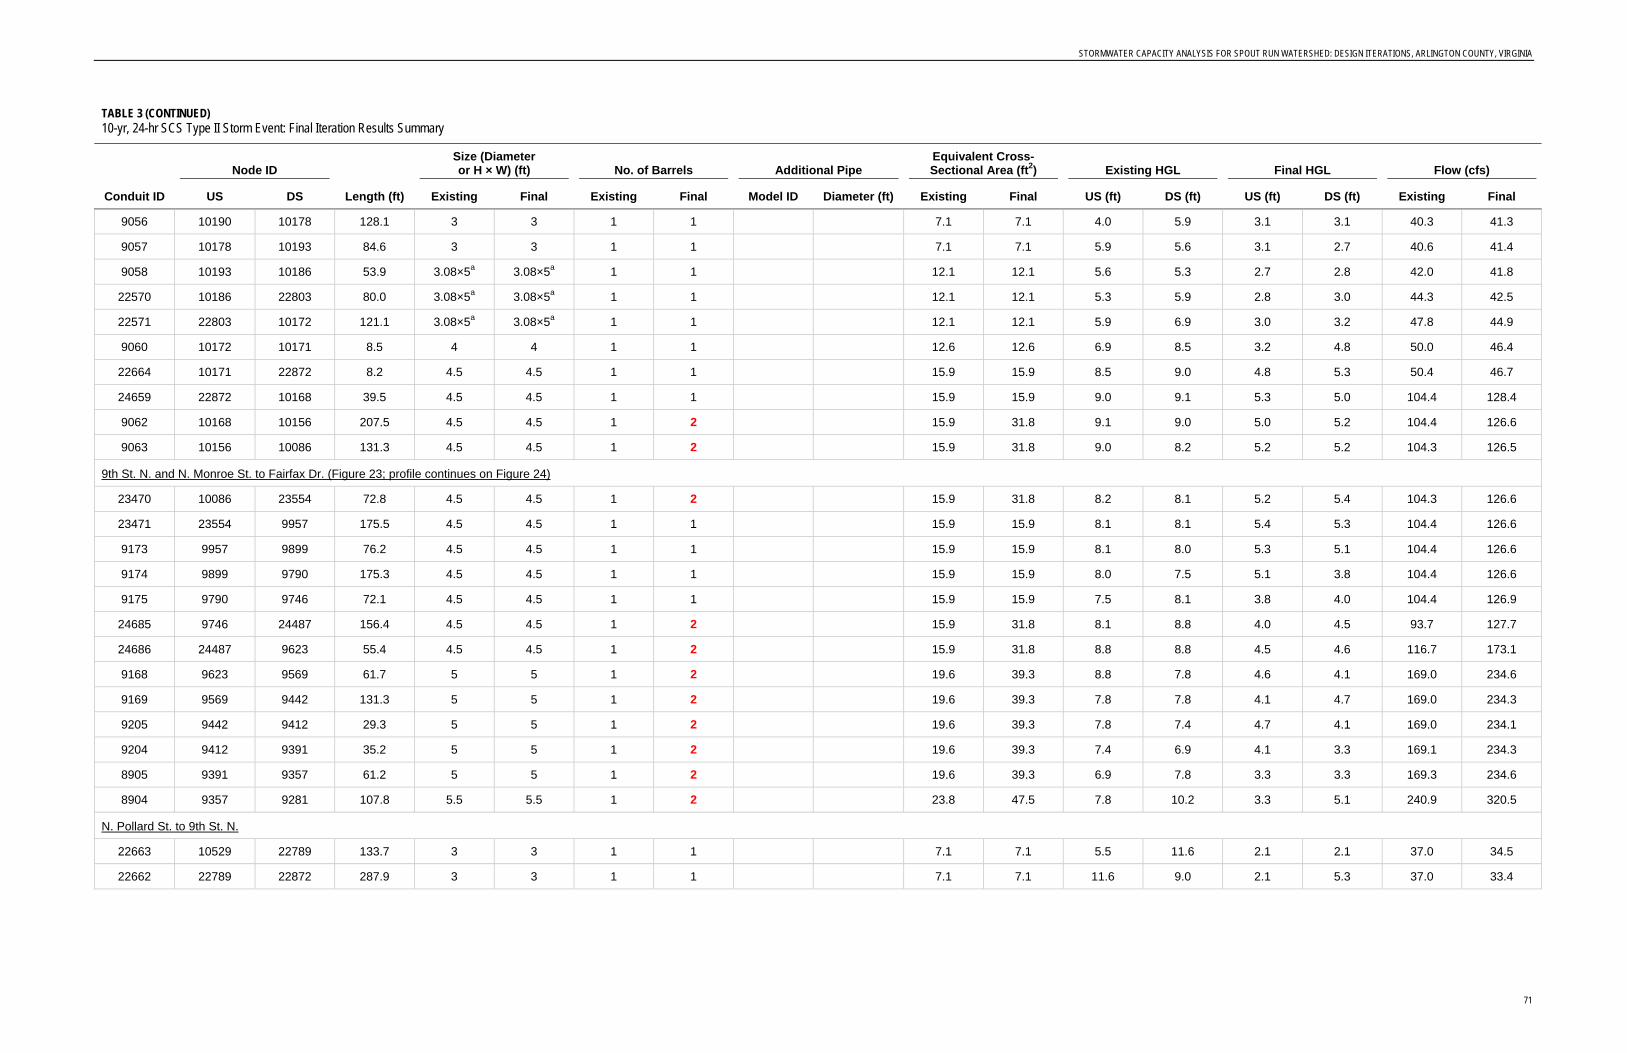
STORMWATER CAPACITY ANALYSIS FOR SPOUT RUN WATERSHED: DESIGN ITERATIONS, ARLINGTON COUNTY, VIRGINIA
71
TABLE 3 (CONTINUED) 10-yr, 24-hr SCS Type II Storm Event: Final Iteration Results Summary
Conduit ID
Node ID
Length (ft)
Size (Diameter or H × W) (ft) No. of Barrels Additional Pipe
Equivalent Cross-Sectional Area (ft2) Existing HGL Final HGL Flow (cfs)
US DS Existing Final Existing Final Model ID Diameter (ft) Existing Final US (ft) DS (ft) US (ft) DS (ft) Existing Final
9056 10190 10178 128.1 3 3 1 1 7.1 7.1 4.0 5.9 3.1 3.1 40.3 41.3 9057 10178 10193 84.6 3 3 1 1 7.1 7.1 5.9 5.6 3.1 2.7 40.6 41.4 9058 10193 10186 53.9 3.08×5a 3.08×5a 1 1 12.1 12.1 5.6 5.3 2.7 2.8 42.0 41.8 22570 10186 22803 80.0 3.08×5a 3.08×5a 1 1 12.1 12.1 5.3 5.9 2.8 3.0 44.3 42.5 22571 22803 10172 121.1 3.08×5a 3.08×5a 1 1 12.1 12.1 5.9 6.9 3.0 3.2 47.8 44.9 9060 10172 10171 8.5 4 4 1 1 12.6 12.6 6.9 8.5 3.2 4.8 50.0 46.4 22664 10171 22872 8.2 4.5 4.5 1 1 15.9 15.9 8.5 9.0 4.8 5.3 50.4 46.7 24659 22872 10168 39.5 4.5 4.5 1 1 15.9 15.9 9.0 9.1 5.3 5.0 104.4 128.4 9062 10168 10156 207.5 4.5 4.5 1 2 15.9 31.8 9.1 9.0 5.0 5.2 104.4 126.6 9063 10156 10086 131.3 4.5 4.5 1 2 15.9 31.8 9.0 8.2 5.2 5.2 104.3 126.5
9th St. N. and N. Monroe St. to Fairfax Dr. (Figure 23; profile continues on Figure 24) 23470 10086 23554 72.8 4.5 4.5 1 2 15.9 31.8 8.2 8.1 5.2 5.4 104.3 126.6 23471 23554 9957 175.5 4.5 4.5 1 1 15.9 15.9 8.1 8.1 5.4 5.3 104.4 126.6 9173 9957 9899 76.2 4.5 4.5 1 1 15.9 15.9 8.1 8.0 5.3 5.1 104.4 126.6 9174 9899 9790 175.3 4.5 4.5 1 1 15.9 15.9 8.0 7.5 5.1 3.8 104.4 126.6 9175 9790 9746 72.1 4.5 4.5 1 1 15.9 15.9 7.5 8.1 3.8 4.0 104.4 126.9 24685 9746 24487 156.4 4.5 4.5 1 2 15.9 31.8 8.1 8.8 4.0 4.5 93.7 127.7 24686 24487 9623 55.4 4.5 4.5 1 2 15.9 31.8 8.8 8.8 4.5 4.6 116.7 173.1 9168 9623 9569 61.7 5 5 1 2 19.6 39.3 8.8 7.8 4.6 4.1 169.0 234.6 9169 9569 9442 131.3 5 5 1 2 19.6 39.3 7.8 7.8 4.1 4.7 169.0 234.3 9205 9442 9412 29.3 5 5 1 2 19.6 39.3 7.8 7.4 4.7 4.1 169.0 234.1 9204 9412 9391 35.2 5 5 1 2 19.6 39.3 7.4 6.9 4.1 3.3 169.1 234.3 8905 9391 9357 61.2 5 5 1 2 19.6 39.3 6.9 7.8 3.3 3.3 169.3 234.6 8904 9357 9281 107.8 5.5 5.5 1 2 23.8 47.5 7.8 10.2 3.3 5.1 240.9 320.5
N. Pollard St. to 9th St. N. 22663 10529 22789 133.7 3 3 1 1 7.1 7.1 5.5 11.6 2.1 2.1 37.0 34.5 22662 22789 22872 287.9 3 3 1 1 7.1 7.1 11.6 9.0 2.1 5.3 37.0 33.4

STORMWATER CAPACITY ANALYSIS FOR SPOUT RUN WATERSHED: DESIGN ITERATIONS, ARLINGTON COUNTY, VIRGINIA
72
TABLE 3 (CONTINUED) 10-yr, 24-hr SCS Type II Storm Event: Final Iteration Results Summary
Conduit ID
Node ID
Length (ft)
Size (Diameter or H × W) (ft) No. of Barrels Additional Pipe
Equivalent Cross-Sectional Area (ft2) Existing HGL Final HGL Flow (cfs)
US DS Existing Final Existing Final Model ID Diameter (ft) Existing Final US (ft) DS (ft) US (ft) DS (ft) Existing Final
Fairfax Dr. from N. Monroe St. to N. Kenmore St. (Figure 24; profile continues on Figure 25) 8916 9281 9226 301.6 6×8 6×8 1 2 48.0 96.0 10.2 11.4 5.1 6.0 366.2 604.6 24636 9226 24445 82.1 6×8 6×8 1 2 48.0 96.0 11.4 12.2 6.0 5.8 366.1 600.0 24637 24445 9158 69.0 6×8 6×8 1 2 48.0 96.0 12.2 13.4 5.8 5.3 365.6 597.8 24638 9158 24446 88.9 6×8 6×8 1 2 48.0 96.0 13.4 15.1 5.3 5.0 439.2 674.7 24639 24446 9002 157.1 6×8 6×8 1 2 48.0 96.0 15.1 13.1 5.0 6.0 417.5 671.6 8919 9002 8871 208.2 5.5 5.5 1 2 23.8 47.5 13.1 12.2 6.0 6.9 248.5 517.4
Kirkwood Rd. from N. Kenmore St. to Washington Blvd. (Figure 25; profile continues on Figure 26) 8918 9002 8871 208.0 4.5 4.5 1 1 15.9 15.9 13.1 12.2 6.0 6.9 158.2 153.0 24623 8871 24431 250.0 7×9 7×9 1 2 63.0 126.0 12.2 11.0 6.9 7.3 404.4 665.1 24619 24431 24432 28.0 7×9 7×9 1 2 63.0 126.0 11.0 10.0 7.3 6.7 404.6 666.1 24620 24432 24433 56.0 7×9 7×9 1 2 63.0 126.0 10.0 10.3 6.7 7.6 404.9 668.2 24621 24433 24434 155.0 7×9 7×9 1 2 63.0 126.0 10.3 11.3 7.6 8.3 394.2 668.5 24622 24434 8616 31.6 8 8 1 2 50.3 100.5 11.3 10.8 8.3 8.0 465.9 722.7 20686 8616 8603 10.4 8 8 1 2 50.3 100.5 10.8 8.9 8.0 6.3 518.1 786.0 16666 8603 8453 148.8 8 8 1 2 50.3 100.5 8.9 8.0 6.3 6.7 518.6 785.9
Kirkwood Rd. from Washington Blvd. to 14th St. N. (Figure 26) 16669 8453 8430 36.8 5×7 5×7 2 1 SR65 6×10 70.0 95.0 8.0 10.4 6.7 5.6 459.3 785.8 8713 8430 8323 112.8 7 7 1 2 38.5 77.0 10.4 10.6 5.6 6.0 478.3 824.0 8714 8323 8185 152.0 7 7 1 2 38.5 77.0 10.6 9.9 6.0 5.6 478.3 823.9 8753 8185 7917 275.7 7 7 1 2 38.5 77.0 9.9 9.8 5.6 5.7 543.5 910.6 8754 7917 7849 53.0 7 7 1 2 38.5 77.0 9.8 9.8 5.7 5.4 572.5 961.1 25069 7849 7661 175.6 7 7 1 2 38.5 77.0 9.8 9.4 5.4 6.0 596.7 991.0 8757 7661 7594 82.4 7 7 1 2 38.5 77.0 9.4 8.5 6.0 6.0 596.7 991.0 20299 7594 7420 150.9 7 7 1 2 38.5 77.0 8.5 6.6 6.0 4.7 596.7 991.4
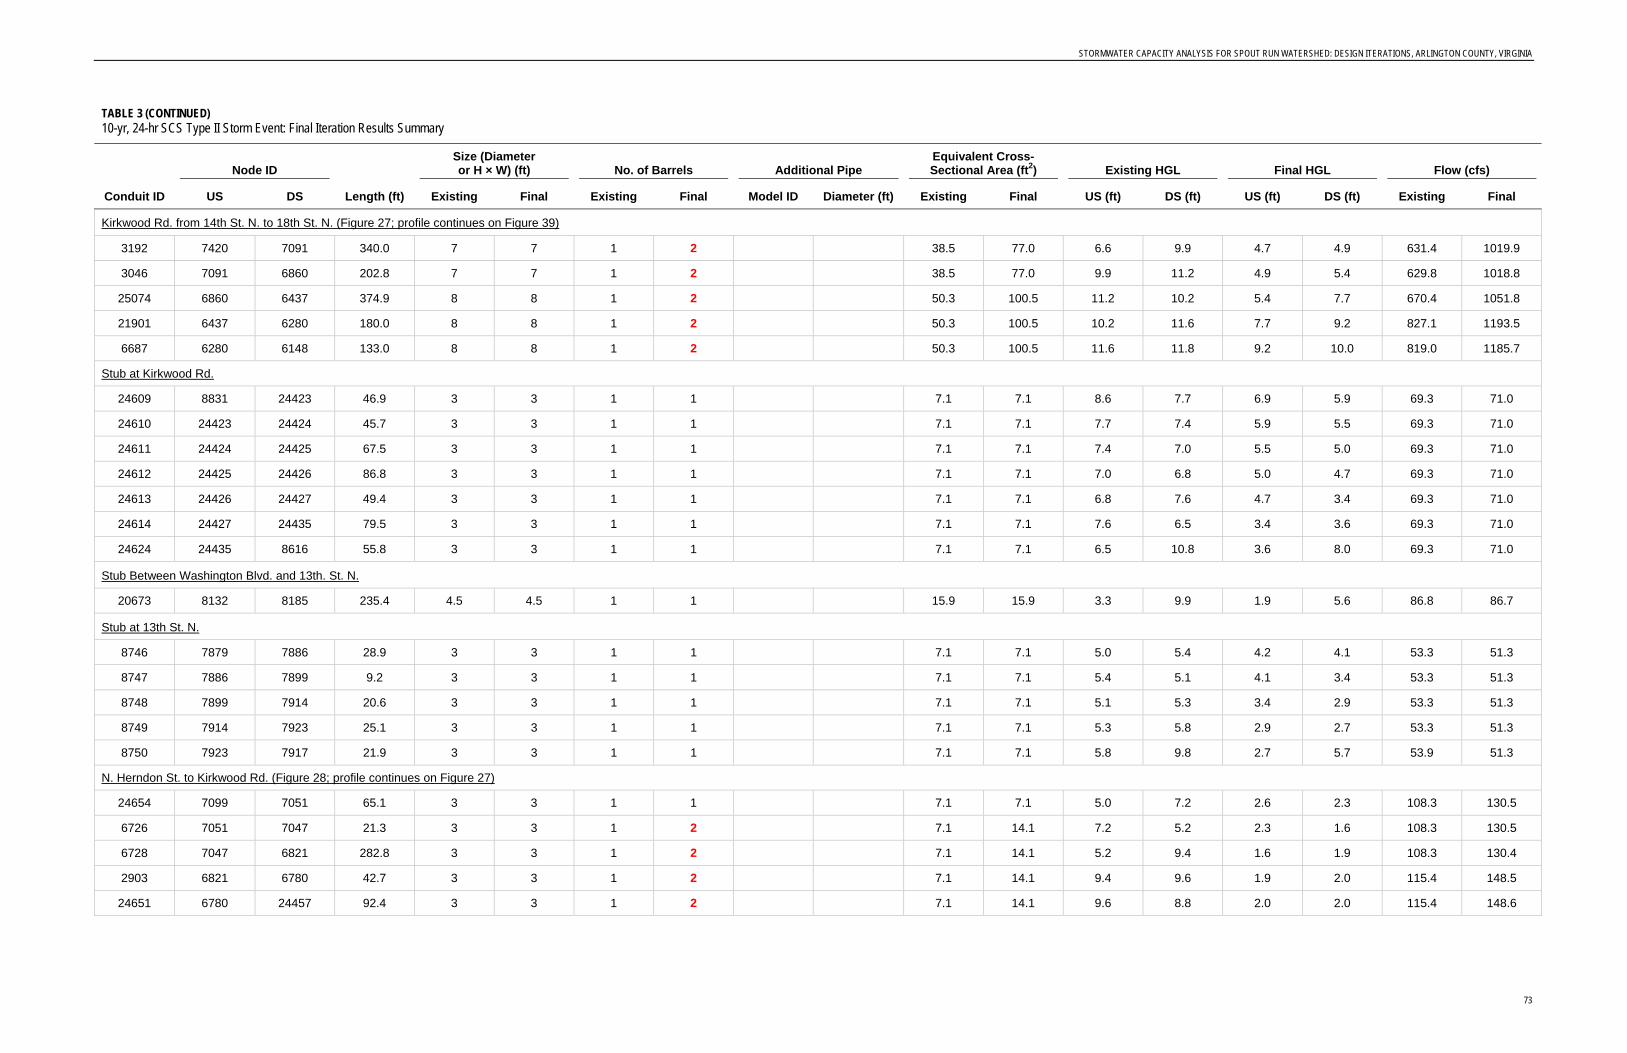
STORMWATER CAPACITY ANALYSIS FOR SPOUT RUN WATERSHED: DESIGN ITERATIONS, ARLINGTON COUNTY, VIRGINIA
73
TABLE 3 (CONTINUED) 10-yr, 24-hr SCS Type II Storm Event: Final Iteration Results Summary
Conduit ID
Node ID
Length (ft)
Size (Diameter or H × W) (ft) No. of Barrels Additional Pipe
Equivalent Cross-Sectional Area (ft2) Existing HGL Final HGL Flow (cfs)
US DS Existing Final Existing Final Model ID Diameter (ft) Existing Final US (ft) DS (ft) US (ft) DS (ft) Existing Final
Kirkwood Rd. from 14th St. N. to 18th St. N. (Figure 27; profile continues on Figure 39) 3192 7420 7091 340.0 7 7 1 2 38.5 77.0 6.6 9.9 4.7 4.9 631.4 1019.9 3046 7091 6860 202.8 7 7 1 2 38.5 77.0 9.9 11.2 4.9 5.4 629.8 1018.8 25074 6860 6437 374.9 8 8 1 2 50.3 100.5 11.2 10.2 5.4 7.7 670.4 1051.8 21901 6437 6280 180.0 8 8 1 2 50.3 100.5 10.2 11.6 7.7 9.2 827.1 1193.5 6687 6280 6148 133.0 8 8 1 2 50.3 100.5 11.6 11.8 9.2 10.0 819.0 1185.7
Stub at Kirkwood Rd. 24609 8831 24423 46.9 3 3 1 1 7.1 7.1 8.6 7.7 6.9 5.9 69.3 71.0 24610 24423 24424 45.7 3 3 1 1 7.1 7.1 7.7 7.4 5.9 5.5 69.3 71.0 24611 24424 24425 67.5 3 3 1 1 7.1 7.1 7.4 7.0 5.5 5.0 69.3 71.0 24612 24425 24426 86.8 3 3 1 1 7.1 7.1 7.0 6.8 5.0 4.7 69.3 71.0 24613 24426 24427 49.4 3 3 1 1 7.1 7.1 6.8 7.6 4.7 3.4 69.3 71.0 24614 24427 24435 79.5 3 3 1 1 7.1 7.1 7.6 6.5 3.4 3.6 69.3 71.0 24624 24435 8616 55.8 3 3 1 1 7.1 7.1 6.5 10.8 3.6 8.0 69.3 71.0
Stub Between Washington Blvd. and 13th. St. N. 20673 8132 8185 235.4 4.5 4.5 1 1 15.9 15.9 3.3 9.9 1.9 5.6 86.8 86.7
Stub at 13th St. N. 8746 7879 7886 28.9 3 3 1 1 7.1 7.1 5.0 5.4 4.2 4.1 53.3 51.3 8747 7886 7899 9.2 3 3 1 1 7.1 7.1 5.4 5.1 4.1 3.4 53.3 51.3 8748 7899 7914 20.6 3 3 1 1 7.1 7.1 5.1 5.3 3.4 2.9 53.3 51.3 8749 7914 7923 25.1 3 3 1 1 7.1 7.1 5.3 5.8 2.9 2.7 53.3 51.3 8750 7923 7917 21.9 3 3 1 1 7.1 7.1 5.8 9.8 2.7 5.7 53.9 51.3
N. Herndon St. to Kirkwood Rd. (Figure 28; profile continues on Figure 27) 24654 7099 7051 65.1 3 3 1 1 7.1 7.1 5.0 7.2 2.6 2.3 108.3 130.5 6726 7051 7047 21.3 3 3 1 2 7.1 14.1 7.2 5.2 2.3 1.6 108.3 130.5 6728 7047 6821 282.8 3 3 1 2 7.1 14.1 5.2 9.4 1.6 1.9 108.3 130.4 2903 6821 6780 42.7 3 3 1 2 7.1 14.1 9.4 9.6 1.9 2.0 115.4 148.5 24651 6780 24457 92.4 3 3 1 2 7.1 14.1 9.6 8.8 2.0 2.0 115.4 148.6

STORMWATER CAPACITY ANALYSIS FOR SPOUT RUN WATERSHED: DESIGN ITERATIONS, ARLINGTON COUNTY, VIRGINIA
74
TABLE 3 (CONTINUED) 10-yr, 24-hr SCS Type II Storm Event: Final Iteration Results Summary
Conduit ID
Node ID
Length (ft)
Size (Diameter or H × W) (ft) No. of Barrels Additional Pipe
Equivalent Cross-Sectional Area (ft2) Existing HGL Final HGL Flow (cfs)
US DS Existing Final Existing Final Model ID Diameter (ft) Existing Final US (ft) DS (ft) US (ft) DS (ft) Existing Final
24652 24457 24458 48.6 3 3 1 2 7.1 14.1 8.8 8.8 2.0 2.3 115.4 148.7 24653 24458 6518 115.3 3 3 1 2 7.1 14.1 8.8 8.0 2.3 3.0 115.4 148.8 2711 6518 6515 7.1 3.5 3.5 1 2 9.6 19.2 8.0 6.0 3.0 1.9 115.5 148.8 2710 6515 6471 106.7 3.5 3.5 1 2 9.6 19.2 6.0 6.1 1.9 2.1 115.2 149.0 2683 6471 6449 142.4 3.5 3.5 1 2 9.6 19.2 6.1 8.8 2.1 7.2 114.7 148.6 6718 6449 6437 32.9 3.5 3.5 1 1 9.6 9.6 8.8 10.2 7.2 7.7 114.7 148.7
West Branch Lee Hwy to N. Woodrow St.
5028 3849 3894 72.5 4×4 4×4 1 1 16.0 16.0 12.2 11.1 12.1 10.8 134.2 137.4 5033 3894 3914 17.1 4×4 4×4 1 1 16.0 16.0 11.1 10.7 10.8 10.3 147.4 150.0 6515 3914 3937 77.1 3.5 3.5 1 1 9.6 9.6 10.7 7.1 10.3 6.0 147.4 150.0 5039 3937 3964 65.4 3.5 3.5 1 1 9.6 9.6 7.1 5.7 6.0 3.8 147.3 150.0 5049 3964 3993 65.4 3.5 3.5 1 1 9.6 9.6 5.7 5.4 3.8 2.9 147.3 150.0 5051 3993 4003 216.8 3.5 3.5 1 1 9.6 9.6 5.4 6.1 2.9 2.5 145.8 150.0 20440 4003 4035 165.8 3.5 3.5 1 1 9.6 9.6 6.1 9.0 2.5 4.3 145.8 150.0 1333 4035 4048 70.7 4 4 1 1 12.6 12.6 9.0 8.6 4.3 1.7 145.8 150.0
N. Woodrow St. to 19th Rd. N. (Figure 29; profile continues on Figures 30 and 31) 1364 4048 4108 157.9 4 4 1 2 12.6 25.1 8.6 8.4 1.7 4.3 145.8 150.2 24343 4108 24212 16.7 4 4 1 2 12.6 25.1 8.4 6.7 4.3 3.6 158.4 196.9 24345 24212 4122 39.2 4 4 1 2 12.6 25.1 6.7 5.9 3.6 2.3 154.8 195.1 1424 4122 4204 215.0 4 4 1 2 12.6 25.1 5.9 10.9 2.3 6.7 205.0 288.2 1479 4204 4279 70.3 4.5 4.5 1 2 15.9 31.8 10.9 9.9 6.7 5.4 202.6 323.8 1531 4279 4359 64.2 4.5 4.5 1 2 15.9 31.8 9.9 12.1 5.4 4.6 207.6 335.0 1631 4359 4529 276.2 4.5 4.5 1 2 15.9 31.8 12.1 6.2 4.6 3.6 219.9 345.4 1723 4529 4722 185.7 4.5 4.5 1 1 SR34 4×6 15.9 39.9 6.2 3.6 3.6 2.4 182.6 344.7 1816 4722 4890 150.6 4.5 4.5 1 1 SR33 4×6 15.9 39.9 3.6 6.0 2.4 3.6 183.7 344.9

STORMWATER CAPACITY ANALYSIS FOR SPOUT RUN WATERSHED: DESIGN ITERATIONS, ARLINGTON COUNTY, VIRGINIA
75
TABLE 3 (CONTINUED) 10-yr, 24-hr SCS Type II Storm Event: Final Iteration Results Summary
Conduit ID
Node ID
Length (ft)
Size (Diameter or H × W) (ft) No. of Barrels Additional Pipe
Equivalent Cross-Sectional Area (ft2) Existing HGL Final HGL Flow (cfs)
US DS Existing Final Existing Final Model ID Diameter (ft) Existing Final US (ft) DS (ft) US (ft) DS (ft) Existing Final
19th Rd. N. to 18th St. N. (West Pipe) (Figure 30; profile continues on Figure 34) 1836 4890 4925 23.0 4.5 4.5 1 1 SR21 4×6 15.9 39.9 6.0 5.5 3.6 3.0 139.7 309.4 1867 4925 4979 51.4 4.5 4.5 1 1 SR20 4×6 15.9 39.9 5.5 6.1 3.0 3.3 139.7 309.4 1939 4979 5125 133.2 4.5 4.5 1 1 SR19 4×6 15.9 39.9 6.1 6.3 3.3 3.6 173.3 341.1 1960 5125 5159 43.5 4.5 4.5 1 1 15.9 15.9 6.3 7.5 3.6 5.0 128.8 136.9 1990 5159 5203 81.1 4.5 4.5 1 1 15.9 15.9 7.5 7.0 5.0 4.6 128.8 136.9 2023 5203 5254 78.7 5 5 1 1 19.6 19.6 7.0 6.6 4.6 3.6 158.8 164.4 20429 5254 5572 304.3 3.5 3.5 1 1 SR13 4×8 9.6 41.6 6.6 6.9 3.6 5.2 93.6 376.1 2253 5572 5683 116.5 4.5 4.5 1 1 SR14 4×6 15.9 39.9 6.9 6.1 5.2 4.9 149.0 344.3 2256 5683 5688 26.4 4.5 4.5 1 1 SR15 5×8 15.9 55.9 6.1 6.0 4.9 4.5 129.4 378.1 24370 5688 24235 21.2 4.5 4.5 1 1 SR16 5×8 15.9 55.9 6.0 5.5 4.5 3.7 128.7 377.9 24371 24235 5716 73.4 4.5 4.5 1 1 SR17 5×8 15.9 55.9 5.5 7.4 3.7 5.0 128.0 377.5 2320 5716 5801 81.9 4.5 4.5 1 1 SR3 5×8 15.9 55.9 7.4 6.5 5.0 4.3 143.9 467.1 2343 5801 5858 73.8 4.5 4.5 1 1 SR6 5×8 15.9 55.9 6.5 7.0 4.3 5.2 143.9 475.8 2434 5858 6017 158.5 4.5 4.5 1 1 SR7 5×8 15.9 55.9 7.0 6.9 5.2 5.7 143.9 464.3
20th St. N. to 19th Rd. N. (East Pipe) (Figure 31; profile continues on Figure 32) 1829 4890 4907 38.9 2.75 2.75 1 1 5.9 5.9 6.0 4.8 3.6 2.5 49.4 36.5 1953 4907 5151 221.4 3.5 3.5 1 1 9.6 9.6 4.8 7.1 2.5 4.0 92.7 84.4 1980 5151 5188 93.9 4.5 4.5 1 1 SR10 4×6 15.9 39.9 7.1 6.5 4.0 4.3 137.3 286.1 1998 5188 5217 45.2 4.5 4.5 1 1 SR11 4×6 15.9 39.9 6.5 6.6 4.3 4.5 135.8 299.2 2022 5217 5254 31.4 4.5 4.5 1 1 SR12 4×8 15.9 47.9 6.6 6.6 4.5 3.6 100.1 298.9 2031 5254 5266 12.6 4.5 4.5 1 1 15.9 15.9 6.6 6.1 3.6 2.8 141.3 87.5 2060 5266 5317 95.6 4.5 4.5 1 1 15.9 15.9 6.1 7.6 2.8 3.1 138.7 87.5 2075 5317 5342 21.2 4.5 4.5 1 1 15.9 15.9 7.6 7.4 3.1 2.6 138.6 87.4
19th Rd. N. to 18th St. N. (East Pipe) (Figure 32; profile continues on Figure 34) 2159 5342 5511 138.2 4.5 4.5 1 1 15.9 15.9 7.4 6.5 2.6 3.6 131.5 87.4 2196 5511 5572 50.2 4.5 4.5 1 1 15.9 15.9 6.5 6.9 3.6 5.2 131.8 87.1 6561 5572 5577 33.4 3.5 3.5 1 2 9.6 19.2 6.9 2.8 5.2 1.9 78.2 114.2
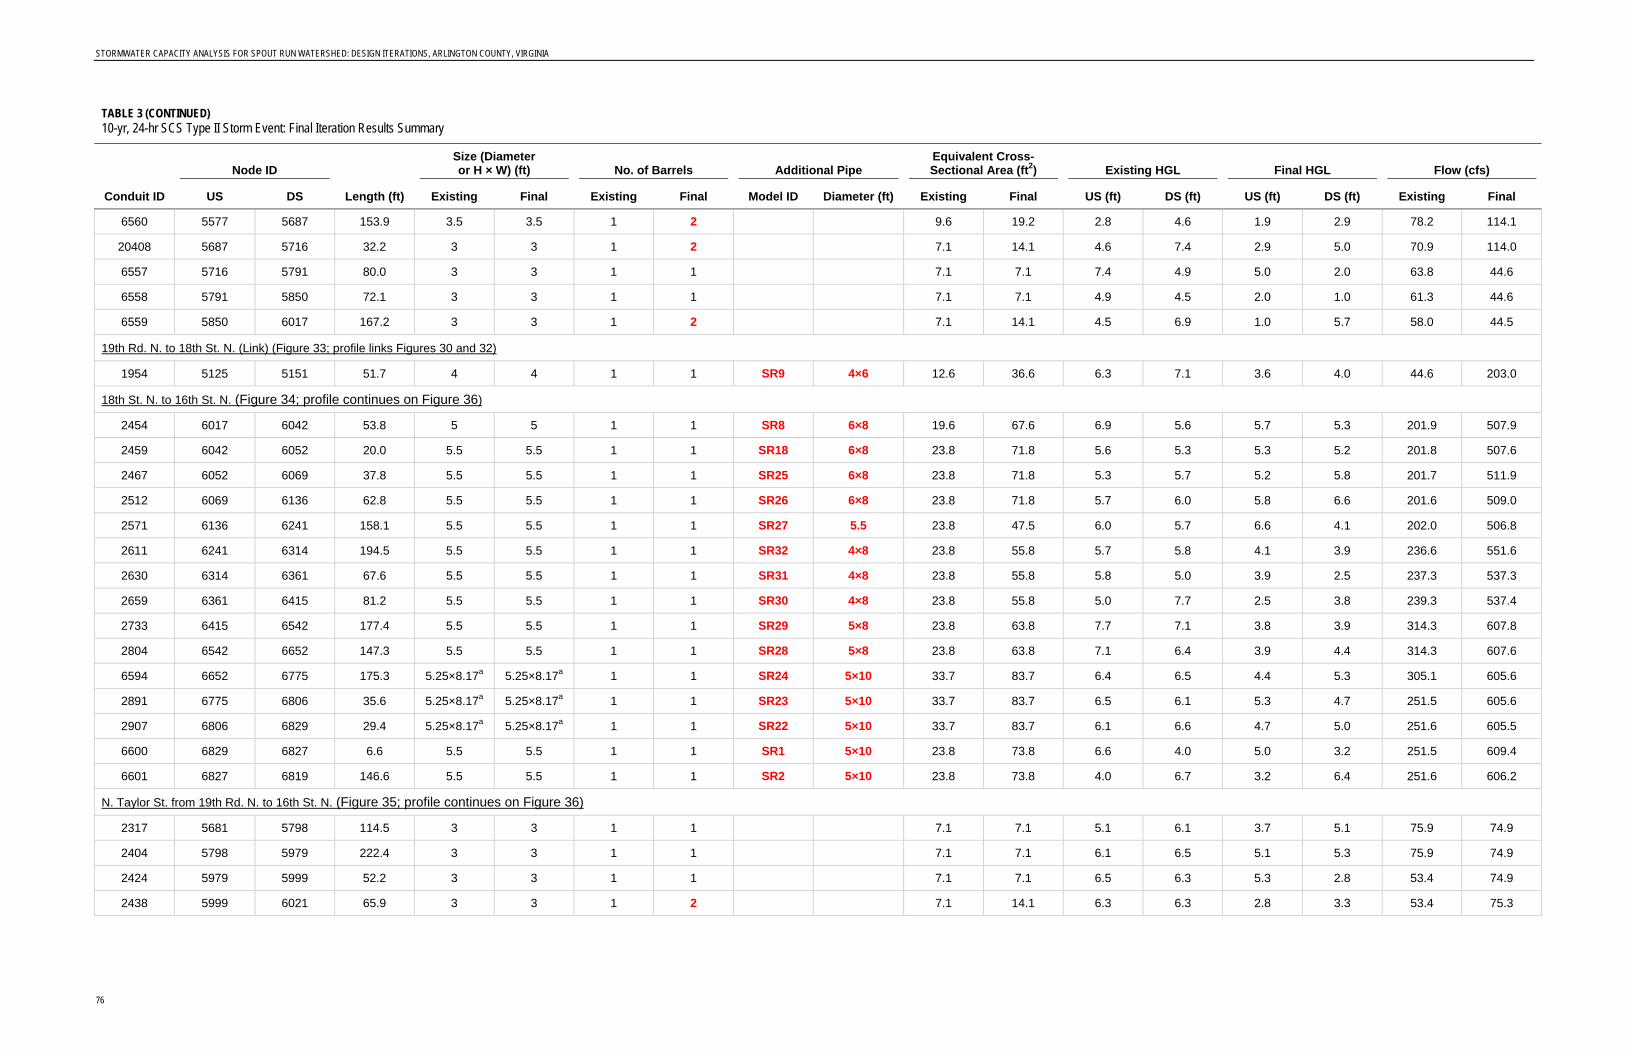
STORMWATER CAPACITY ANALYSIS FOR SPOUT RUN WATERSHED: DESIGN ITERATIONS, ARLINGTON COUNTY, VIRGINIA
76
TABLE 3 (CONTINUED) 10-yr, 24-hr SCS Type II Storm Event: Final Iteration Results Summary
Conduit ID
Node ID
Length (ft)
Size (Diameter or H × W) (ft) No. of Barrels Additional Pipe
Equivalent Cross-Sectional Area (ft2) Existing HGL Final HGL Flow (cfs)
US DS Existing Final Existing Final Model ID Diameter (ft) Existing Final US (ft) DS (ft) US (ft) DS (ft) Existing Final
6560 5577 5687 153.9 3.5 3.5 1 2 9.6 19.2 2.8 4.6 1.9 2.9 78.2 114.1 20408 5687 5716 32.2 3 3 1 2 7.1 14.1 4.6 7.4 2.9 5.0 70.9 114.0 6557 5716 5791 80.0 3 3 1 1 7.1 7.1 7.4 4.9 5.0 2.0 63.8 44.6 6558 5791 5850 72.1 3 3 1 1 7.1 7.1 4.9 4.5 2.0 1.0 61.3 44.6 6559 5850 6017 167.2 3 3 1 2 7.1 14.1 4.5 6.9 1.0 5.7 58.0 44.5
19th Rd. N. to 18th St. N. (Link) (Figure 33; profile links Figures 30 and 32) 1954 5125 5151 51.7 4 4 1 1 SR9 4×6 12.6 36.6 6.3 7.1 3.6 4.0 44.6 203.0
18th St. N. to 16th St. N. (Figure 34; profile continues on Figure 36) 2454 6017 6042 53.8 5 5 1 1 SR8 6×8 19.6 67.6 6.9 5.6 5.7 5.3 201.9 507.9 2459 6042 6052 20.0 5.5 5.5 1 1 SR18 6×8 23.8 71.8 5.6 5.3 5.3 5.2 201.8 507.6 2467 6052 6069 37.8 5.5 5.5 1 1 SR25 6×8 23.8 71.8 5.3 5.7 5.2 5.8 201.7 511.9 2512 6069 6136 62.8 5.5 5.5 1 1 SR26 6×8 23.8 71.8 5.7 6.0 5.8 6.6 201.6 509.0 2571 6136 6241 158.1 5.5 5.5 1 1 SR27 5.5 23.8 47.5 6.0 5.7 6.6 4.1 202.0 506.8 2611 6241 6314 194.5 5.5 5.5 1 1 SR32 4×8 23.8 55.8 5.7 5.8 4.1 3.9 236.6 551.6 2630 6314 6361 67.6 5.5 5.5 1 1 SR31 4×8 23.8 55.8 5.8 5.0 3.9 2.5 237.3 537.3 2659 6361 6415 81.2 5.5 5.5 1 1 SR30 4×8 23.8 55.8 5.0 7.7 2.5 3.8 239.3 537.4 2733 6415 6542 177.4 5.5 5.5 1 1 SR29 5×8 23.8 63.8 7.7 7.1 3.8 3.9 314.3 607.8 2804 6542 6652 147.3 5.5 5.5 1 1 SR28 5×8 23.8 63.8 7.1 6.4 3.9 4.4 314.3 607.6 6594 6652 6775 175.3 5.25×8.17a 5.25×8.17a 1 1 SR24 5×10 33.7 83.7 6.4 6.5 4.4 5.3 305.1 605.6 2891 6775 6806 35.6 5.25×8.17a 5.25×8.17a 1 1 SR23 5×10 33.7 83.7 6.5 6.1 5.3 4.7 251.5 605.6 2907 6806 6829 29.4 5.25×8.17a 5.25×8.17a 1 1 SR22 5×10 33.7 83.7 6.1 6.6 4.7 5.0 251.6 605.5 6600 6829 6827 6.6 5.5 5.5 1 1 SR1 5×10 23.8 73.8 6.6 4.0 5.0 3.2 251.5 609.4 6601 6827 6819 146.6 5.5 5.5 1 1 SR2 5×10 23.8 73.8 4.0 6.7 3.2 6.4 251.6 606.2
N. Taylor St. from 19th Rd. N. to 16th St. N. (Figure 35; profile continues on Figure 36) 2317 5681 5798 114.5 3 3 1 1 7.1 7.1 5.1 6.1 3.7 5.1 75.9 74.9 2404 5798 5979 222.4 3 3 1 1 7.1 7.1 6.1 6.5 5.1 5.3 75.9 74.9 2424 5979 5999 52.2 3 3 1 1 7.1 7.1 6.5 6.3 5.3 2.8 53.4 74.9 2438 5999 6021 65.9 3 3 1 2 7.1 14.1 6.3 6.3 2.8 3.3 53.4 75.3
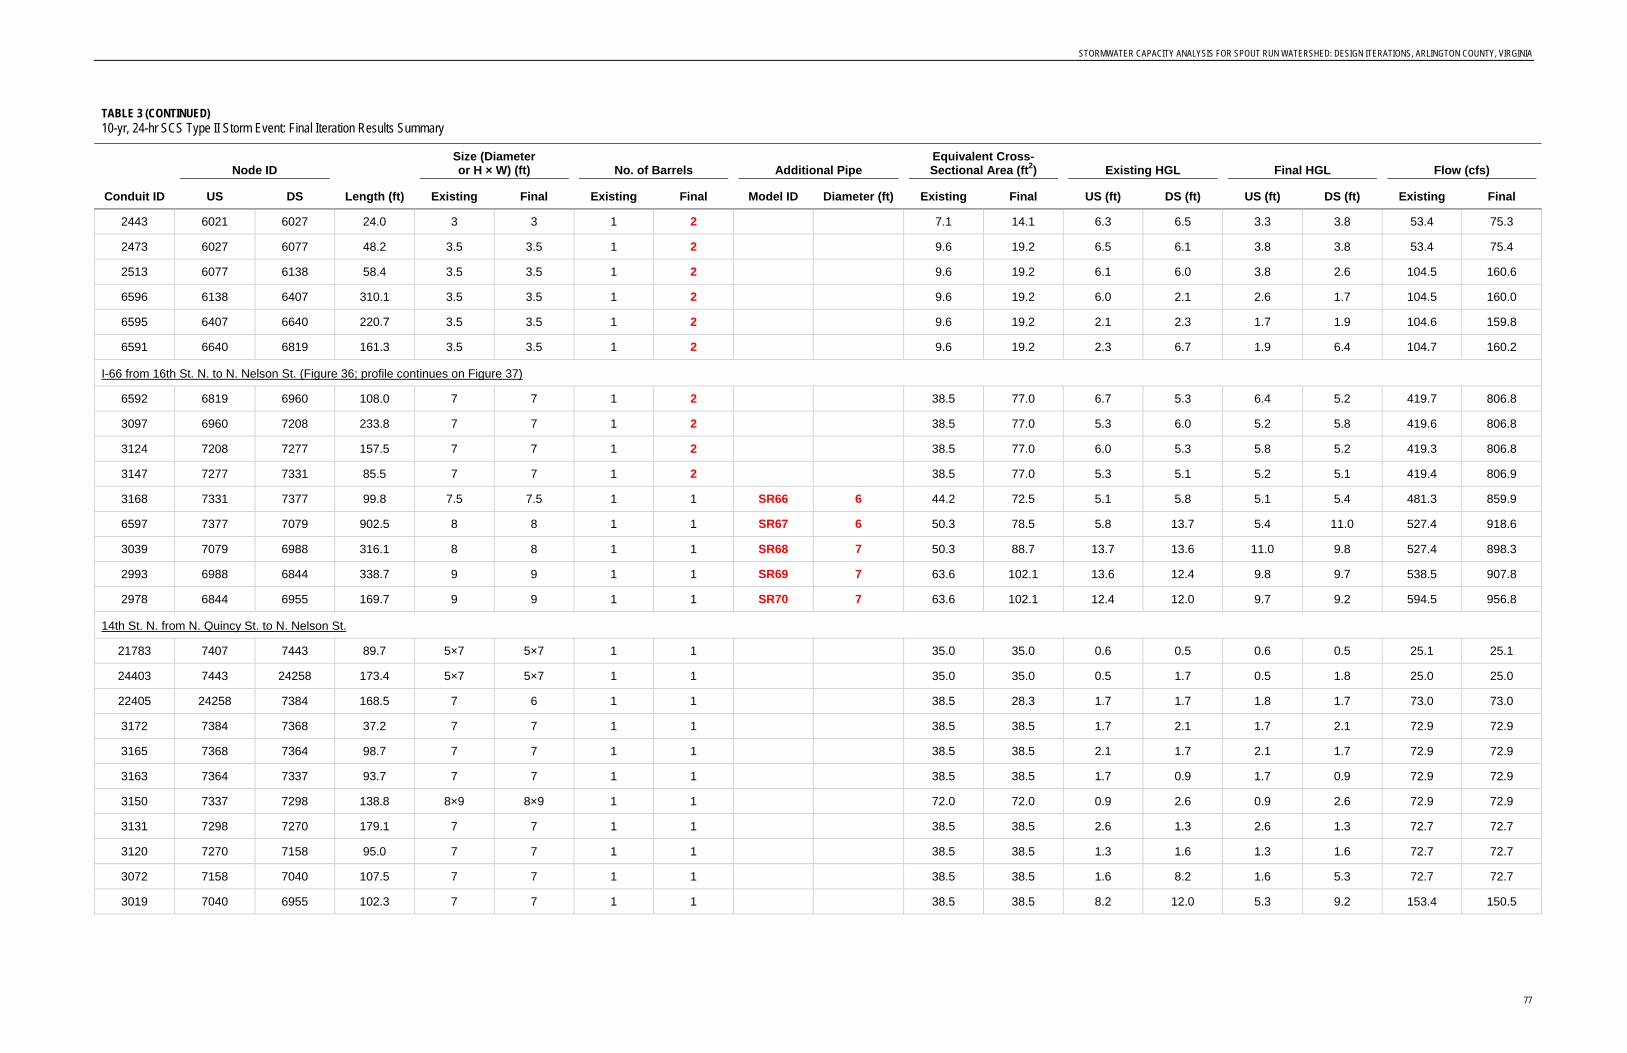
STORMWATER CAPACITY ANALYSIS FOR SPOUT RUN WATERSHED: DESIGN ITERATIONS, ARLINGTON COUNTY, VIRGINIA
77
TABLE 3 (CONTINUED) 10-yr, 24-hr SCS Type II Storm Event: Final Iteration Results Summary
Conduit ID
Node ID
Length (ft)
Size (Diameter or H × W) (ft) No. of Barrels Additional Pipe
Equivalent Cross-Sectional Area (ft2) Existing HGL Final HGL Flow (cfs)
US DS Existing Final Existing Final Model ID Diameter (ft) Existing Final US (ft) DS (ft) US (ft) DS (ft) Existing Final
2443 6021 6027 24.0 3 3 1 2 7.1 14.1 6.3 6.5 3.3 3.8 53.4 75.3 2473 6027 6077 48.2 3.5 3.5 1 2 9.6 19.2 6.5 6.1 3.8 3.8 53.4 75.4 2513 6077 6138 58.4 3.5 3.5 1 2 9.6 19.2 6.1 6.0 3.8 2.6 104.5 160.6 6596 6138 6407 310.1 3.5 3.5 1 2 9.6 19.2 6.0 2.1 2.6 1.7 104.5 160.0 6595 6407 6640 220.7 3.5 3.5 1 2 9.6 19.2 2.1 2.3 1.7 1.9 104.6 159.8 6591 6640 6819 161.3 3.5 3.5 1 2 9.6 19.2 2.3 6.7 1.9 6.4 104.7 160.2
I-66 from 16th St. N. to N. Nelson St. (Figure 36; profile continues on Figure 37) 6592 6819 6960 108.0 7 7 1 2 38.5 77.0 6.7 5.3 6.4 5.2 419.7 806.8 3097 6960 7208 233.8 7 7 1 2 38.5 77.0 5.3 6.0 5.2 5.8 419.6 806.8 3124 7208 7277 157.5 7 7 1 2 38.5 77.0 6.0 5.3 5.8 5.2 419.3 806.8 3147 7277 7331 85.5 7 7 1 2 38.5 77.0 5.3 5.1 5.2 5.1 419.4 806.9 3168 7331 7377 99.8 7.5 7.5 1 1 SR66 6 44.2 72.5 5.1 5.8 5.1 5.4 481.3 859.9 6597 7377 7079 902.5 8 8 1 1 SR67 6 50.3 78.5 5.8 13.7 5.4 11.0 527.4 918.6 3039 7079 6988 316.1 8 8 1 1 SR68 7 50.3 88.7 13.7 13.6 11.0 9.8 527.4 898.3 2993 6988 6844 338.7 9 9 1 1 SR69 7 63.6 102.1 13.6 12.4 9.8 9.7 538.5 907.8 2978 6844 6955 169.7 9 9 1 1 SR70 7 63.6 102.1 12.4 12.0 9.7 9.2 594.5 956.8
14th St. N. from N. Quincy St. to N. Nelson St. 21783 7407 7443 89.7 5×7 5×7 1 1 35.0 35.0 0.6 0.5 0.6 0.5 25.1 25.1 24403 7443 24258 173.4 5×7 5×7 1 1 35.0 35.0 0.5 1.7 0.5 1.8 25.0 25.0 22405 24258 7384 168.5 7 6 1 1 38.5 28.3 1.7 1.7 1.8 1.7 73.0 73.0 3172 7384 7368 37.2 7 7 1 1 38.5 38.5 1.7 2.1 1.7 2.1 72.9 72.9 3165 7368 7364 98.7 7 7 1 1 38.5 38.5 2.1 1.7 2.1 1.7 72.9 72.9 3163 7364 7337 93.7 7 7 1 1 38.5 38.5 1.7 0.9 1.7 0.9 72.9 72.9 3150 7337 7298 138.8 8×9 8×9 1 1 72.0 72.0 0.9 2.6 0.9 2.6 72.9 72.9 3131 7298 7270 179.1 7 7 1 1 38.5 38.5 2.6 1.3 2.6 1.3 72.7 72.7 3120 7270 7158 95.0 7 7 1 1 38.5 38.5 1.3 1.6 1.3 1.6 72.7 72.7 3072 7158 7040 107.5 7 7 1 1 38.5 38.5 1.6 8.2 1.6 5.3 72.7 72.7 3019 7040 6955 102.3 7 7 1 1 38.5 38.5 8.2 12.0 5.3 9.2 153.4 150.5
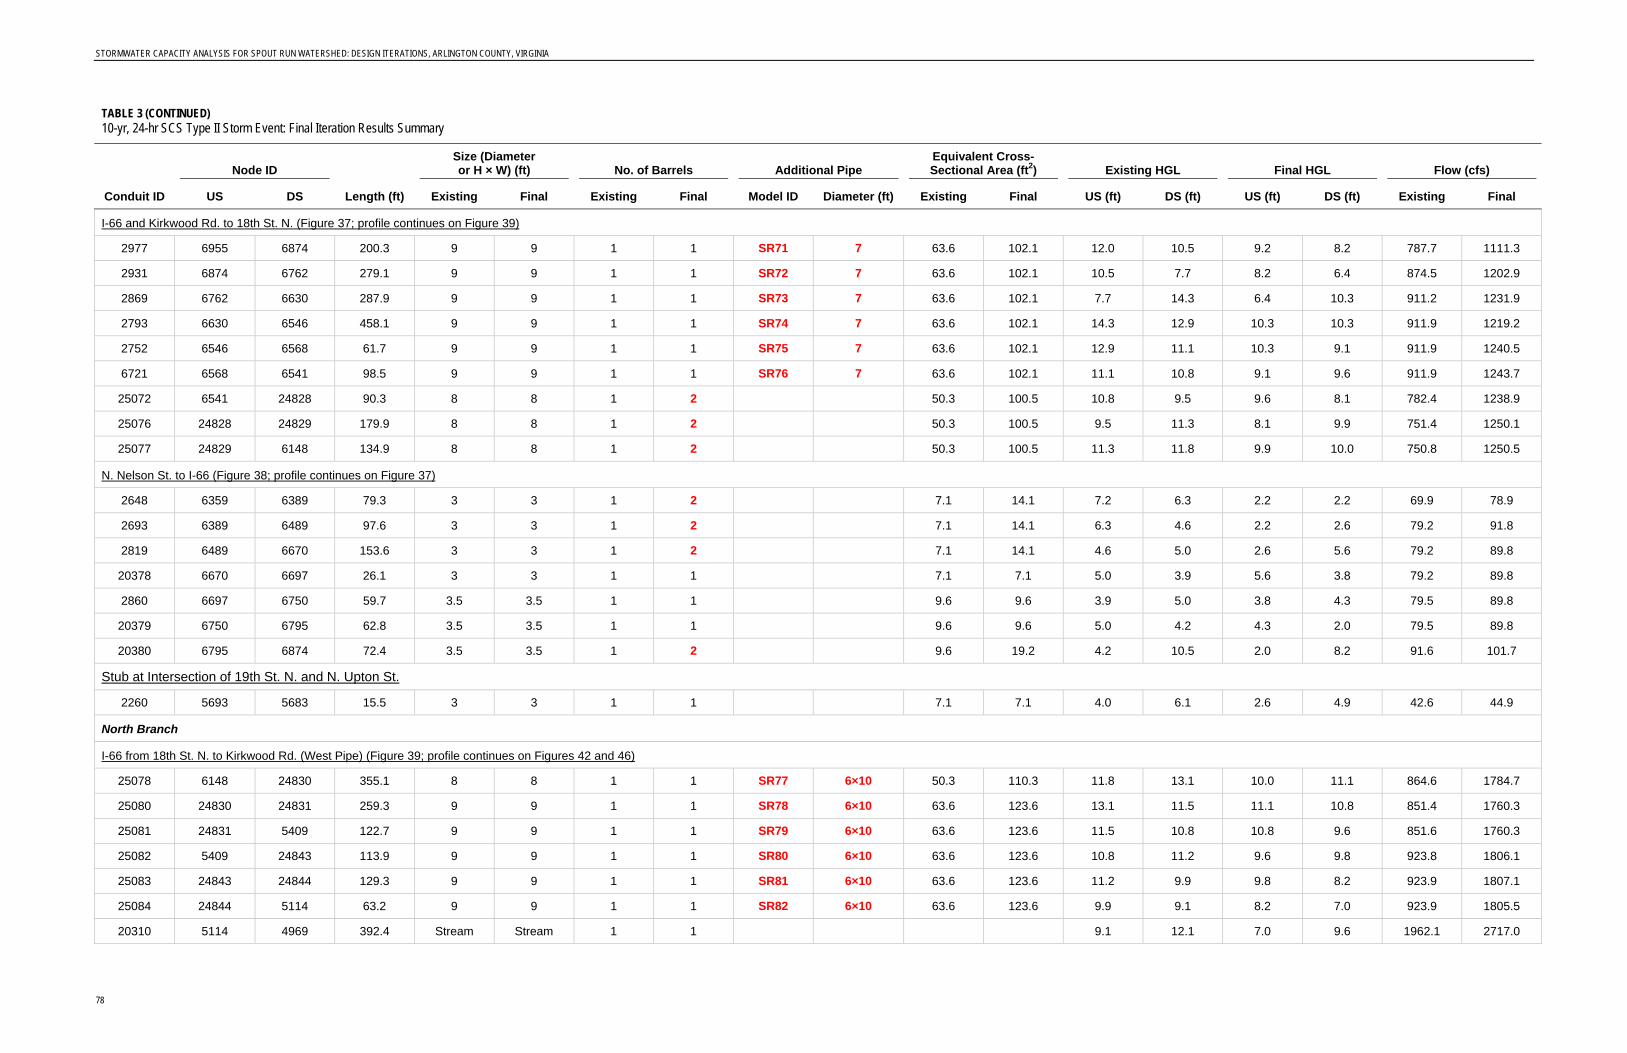
STORMWATER CAPACITY ANALYSIS FOR SPOUT RUN WATERSHED: DESIGN ITERATIONS, ARLINGTON COUNTY, VIRGINIA
78
TABLE 3 (CONTINUED) 10-yr, 24-hr SCS Type II Storm Event: Final Iteration Results Summary
Conduit ID
Node ID
Length (ft)
Size (Diameter or H × W) (ft) No. of Barrels Additional Pipe
Equivalent Cross-Sectional Area (ft2) Existing HGL Final HGL Flow (cfs)
US DS Existing Final Existing Final Model ID Diameter (ft) Existing Final US (ft) DS (ft) US (ft) DS (ft) Existing Final
I-66 and Kirkwood Rd. to 18th St. N. (Figure 37; profile continues on Figure 39) 2977 6955 6874 200.3 9 9 1 1 SR71 7 63.6 102.1 12.0 10.5 9.2 8.2 787.7 1111.3 2931 6874 6762 279.1 9 9 1 1 SR72 7 63.6 102.1 10.5 7.7 8.2 6.4 874.5 1202.9 2869 6762 6630 287.9 9 9 1 1 SR73 7 63.6 102.1 7.7 14.3 6.4 10.3 911.2 1231.9 2793 6630 6546 458.1 9 9 1 1 SR74 7 63.6 102.1 14.3 12.9 10.3 10.3 911.9 1219.2 2752 6546 6568 61.7 9 9 1 1 SR75 7 63.6 102.1 12.9 11.1 10.3 9.1 911.9 1240.5 6721 6568 6541 98.5 9 9 1 1 SR76 7 63.6 102.1 11.1 10.8 9.1 9.6 911.9 1243.7 25072 6541 24828 90.3 8 8 1 2 50.3 100.5 10.8 9.5 9.6 8.1 782.4 1238.9 25076 24828 24829 179.9 8 8 1 2 50.3 100.5 9.5 11.3 8.1 9.9 751.4 1250.1 25077 24829 6148 134.9 8 8 1 2 50.3 100.5 11.3 11.8 9.9 10.0 750.8 1250.5
N. Nelson St. to I-66 (Figure 38; profile continues on Figure 37) 2648 6359 6389 79.3 3 3 1 2 7.1 14.1 7.2 6.3 2.2 2.2 69.9 78.9 2693 6389 6489 97.6 3 3 1 2 7.1 14.1 6.3 4.6 2.2 2.6 79.2 91.8 2819 6489 6670 153.6 3 3 1 2 7.1 14.1 4.6 5.0 2.6 5.6 79.2 89.8 20378 6670 6697 26.1 3 3 1 1 7.1 7.1 5.0 3.9 5.6 3.8 79.2 89.8 2860 6697 6750 59.7 3.5 3.5 1 1 9.6 9.6 3.9 5.0 3.8 4.3 79.5 89.8 20379 6750 6795 62.8 3.5 3.5 1 1 9.6 9.6 5.0 4.2 4.3 2.0 79.5 89.8 20380 6795 6874 72.4 3.5 3.5 1 2 9.6 19.2 4.2 10.5 2.0 8.2 91.6 101.7
Stub at Intersection of 19th St. N. and N. Upton St. 2260 5693 5683 15.5 3 3 1 1 7.1 7.1 4.0 6.1 2.6 4.9 42.6 44.9
North Branch I-66 from 18th St. N. to Kirkwood Rd. (West Pipe) (Figure 39; profile continues on Figures 42 and 46)
25078 6148 24830 355.1 8 8 1 1 SR77 6×10 50.3 110.3 11.8 13.1 10.0 11.1 864.6 1784.7 25080 24830 24831 259.3 9 9 1 1 SR78 6×10 63.6 123.6 13.1 11.5 11.1 10.8 851.4 1760.3 25081 24831 5409 122.7 9 9 1 1 SR79 6×10 63.6 123.6 11.5 10.8 10.8 9.6 851.6 1760.3 25082 5409 24843 113.9 9 9 1 1 SR80 6×10 63.6 123.6 10.8 11.2 9.6 9.8 923.8 1806.1 25083 24843 24844 129.3 9 9 1 1 SR81 6×10 63.6 123.6 11.2 9.9 9.8 8.2 923.9 1807.1 25084 24844 5114 63.2 9 9 1 1 SR82 6×10 63.6 123.6 9.9 9.1 8.2 7.0 923.9 1805.5 20310 5114 4969 392.4 Stream Stream 1 1 9.1 12.1 7.0 9.6 1962.1 2717.0

STORMWATER CAPACITY ANALYSIS FOR SPOUT RUN WATERSHED: DESIGN ITERATIONS, ARLINGTON COUNTY, VIRGINIA
79
TABLE 3 (CONTINUED) 10-yr, 24-hr SCS Type II Storm Event: Final Iteration Results Summary
Conduit ID
Node ID
Length (ft)
Size (Diameter or H × W) (ft) No. of Barrels Additional Pipe
Equivalent Cross-Sectional Area (ft2) Existing HGL Final HGL Flow (cfs)
US DS Existing Final Existing Final Model ID Diameter (ft) Existing Final US (ft) DS (ft) US (ft) DS (ft) Existing Final
I-66 from 18th St. N. to Kirkwood Rd. (East Pipe) 6688 6148 5794 353.0 8 8 1 1 50.3 50.3 11.8 12.1 10.0 10.8 836.4 867.1 6698 5794 5559 259.0 9 9 1 1 63.6 63.6 12.1 11.7 10.8 10.7 885.9 896.7 6697 5559 5490 56.3 9 9 1 1 63.6 63.6 11.7 10.2 10.7 9.1 885.8 896.7 6696 5490 5269 181.2 9 9 1 1 63.6 63.6 10.2 11.0 9.1 9.8 917.6 917.7 6699 5269 5128 128.9 9 9 1 1 63.6 63.6 11.0 9.7 9.8 8.3 917.6 917.6 6700 5128 5114 58.8 9 9 1 1 63.6 63.6 9.7 9.1 8.3 7.0 914.5 917.1
20th St. N. to 19th St. N. (Figure 40; profile continues on Figure 41) 2027 5197 5260 136.3 3 3 1 2 7.1 14.1 5.0 4.9 2.0 2.3 83.0 119.4 6646 5260 5311 151.0 3 3 1 2 7.1 14.1 4.9 4.4 2.3 3.7 83.0 119.3 23424 5311 23512 40.3 3 3 1 2 7.1 14.1 4.4 3.5 3.7 2.8 59.1 119.3 23425 23512 5408 32.0 3 3 1 1 SR38 3.5 7.1 16.7 3.5 3.5 2.8 3.0 59.1 119.3 23426 5408 5435 19.0 3 3 1 1 SR37 3.5 7.1 16.7 3.5 3.5 3.0 3.1 59.3 119.8 2134 5435 5462 26.1 3 3 1 1 SR36 3.5 7.1 16.7 3.5 2.5 3.1 2.4 59.1 119.2 2141 5462 5469 21.0 3 3 1 1 SR35 3.5 7.1 16.7 2.5 1.9 2.4 1.9 59.1 119.2 2140 5469 5468 151.8 3 3 1 2 7.1 14.1 1.9 2.8 1.9 1.9 59.4 119.3 2138 5468 5466 116.5 3 3 1 2 7.1 14.1 2.8 9.1 1.9 2.2 61.3 119.3 2212 5466 5596 109.5 3 3 1 2 7.1 14.1 9.1 8.5 2.2 2.3 62.1 119.2 6682 5596 5664 70.8 3 3 1 2 7.1 14.1 8.5 7.3 2.3 2.5 62.1 118.9 6683 5664 5718 50.9 3 3 1 2 7.1 14.1 7.3 9.9 2.5 5.0 62.1 118.5 6685 5718 5720 25.0 3 3 1 2 7.1 14.1 9.9 9.0 5.0 3.3 62.1 118.6 2275 5720 5719 38.5 3 3 1 2 7.1 14.1 9.0 8.6 3.3 2.5 62.1 118.5 2292 5719 5739 99.6 3 3 1 2 7.1 14.1 8.6 10.3 2.5 5.5 102.3 164.8
19th. St. N. to 18th St. N. (Figure 41; profile continues on Figure 39) 2345 5739 5861 173.8 3 3 1 2 7.1 14.1 10.3 9.8 5.5 6.0 91.9 164.8 2349 5861 5871 50.0 3 3 1 2 7.1 14.1 9.8 9.3 6.0 5.2 91.9 164.8 2389 5871 5958 105.4 3 3 1 2 7.1 14.1 9.3 7.5 5.2 2.4 91.9 164.8 2449 5958 6035 208.4 3 3 1 2 7.1 14.1 7.5 5.5 2.4 4.0 91.5 164.7 24406 6035 24259 77.9 3.5 3.5 1 2 9.6 19.2 5.5 4.7 4.0 4.1 91.5 164.7
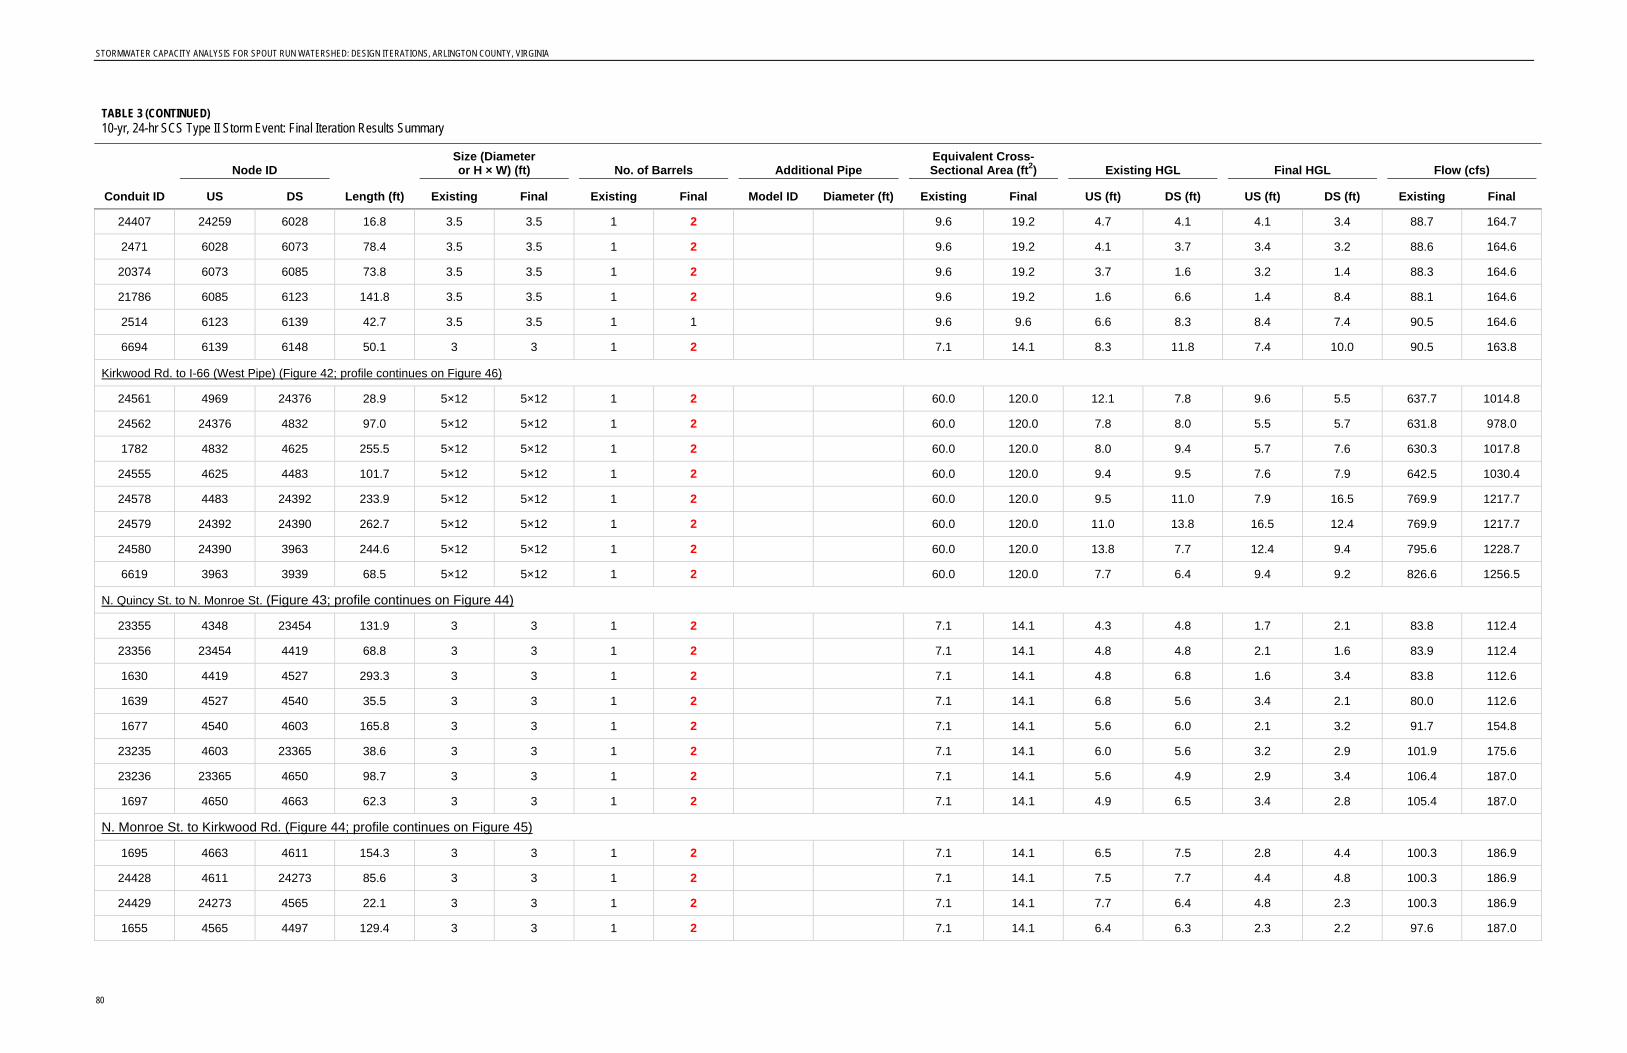
STORMWATER CAPACITY ANALYSIS FOR SPOUT RUN WATERSHED: DESIGN ITERATIONS, ARLINGTON COUNTY, VIRGINIA
80
TABLE 3 (CONTINUED) 10-yr, 24-hr SCS Type II Storm Event: Final Iteration Results Summary
Conduit ID
Node ID
Length (ft)
Size (Diameter or H × W) (ft) No. of Barrels Additional Pipe
Equivalent Cross-Sectional Area (ft2) Existing HGL Final HGL Flow (cfs)
US DS Existing Final Existing Final Model ID Diameter (ft) Existing Final US (ft) DS (ft) US (ft) DS (ft) Existing Final
24407 24259 6028 16.8 3.5 3.5 1 2 9.6 19.2 4.7 4.1 4.1 3.4 88.7 164.7 2471 6028 6073 78.4 3.5 3.5 1 2 9.6 19.2 4.1 3.7 3.4 3.2 88.6 164.6 20374 6073 6085 73.8 3.5 3.5 1 2 9.6 19.2 3.7 1.6 3.2 1.4 88.3 164.6 21786 6085 6123 141.8 3.5 3.5 1 2 9.6 19.2 1.6 6.6 1.4 8.4 88.1 164.6 2514 6123 6139 42.7 3.5 3.5 1 1 9.6 9.6 6.6 8.3 8.4 7.4 90.5 164.6 6694 6139 6148 50.1 3 3 1 2 7.1 14.1 8.3 11.8 7.4 10.0 90.5 163.8
Kirkwood Rd. to I-66 (West Pipe) (Figure 42; profile continues on Figure 46) 24561 4969 24376 28.9 5×12 5×12 1 2 60.0 120.0 12.1 7.8 9.6 5.5 637.7 1014.8 24562 24376 4832 97.0 5×12 5×12 1 2 60.0 120.0 7.8 8.0 5.5 5.7 631.8 978.0 1782 4832 4625 255.5 5×12 5×12 1 2 60.0 120.0 8.0 9.4 5.7 7.6 630.3 1017.8 24555 4625 4483 101.7 5×12 5×12 1 2 60.0 120.0 9.4 9.5 7.6 7.9 642.5 1030.4 24578 4483 24392 233.9 5×12 5×12 1 2 60.0 120.0 9.5 11.0 7.9 16.5 769.9 1217.7 24579 24392 24390 262.7 5×12 5×12 1 2 60.0 120.0 11.0 13.8 16.5 12.4 769.9 1217.7 24580 24390 3963 244.6 5×12 5×12 1 2 60.0 120.0 13.8 7.7 12.4 9.4 795.6 1228.7 6619 3963 3939 68.5 5×12 5×12 1 2 60.0 120.0 7.7 6.4 9.4 9.2 826.6 1256.5
N. Quincy St. to N. Monroe St. (Figure 43; profile continues on Figure 44) 23355 4348 23454 131.9 3 3 1 2 7.1 14.1 4.3 4.8 1.7 2.1 83.8 112.4 23356 23454 4419 68.8 3 3 1 2 7.1 14.1 4.8 4.8 2.1 1.6 83.9 112.4 1630 4419 4527 293.3 3 3 1 2 7.1 14.1 4.8 6.8 1.6 3.4 83.8 112.6 1639 4527 4540 35.5 3 3 1 2 7.1 14.1 6.8 5.6 3.4 2.1 80.0 112.6 1677 4540 4603 165.8 3 3 1 2 7.1 14.1 5.6 6.0 2.1 3.2 91.7 154.8 23235 4603 23365 38.6 3 3 1 2 7.1 14.1 6.0 5.6 3.2 2.9 101.9 175.6 23236 23365 4650 98.7 3 3 1 2 7.1 14.1 5.6 4.9 2.9 3.4 106.4 187.0 1697 4650 4663 62.3 3 3 1 2 7.1 14.1 4.9 6.5 3.4 2.8 105.4 187.0
N. Monroe St. to Kirkwood Rd. (Figure 44; profile continues on Figure 45) 1695 4663 4611 154.3 3 3 1 2 7.1 14.1 6.5 7.5 2.8 4.4 100.3 186.9 24428 4611 24273 85.6 3 3 1 2 7.1 14.1 7.5 7.7 4.4 4.8 100.3 186.9 24429 24273 4565 22.1 3 3 1 2 7.1 14.1 7.7 6.4 4.8 2.3 100.3 186.9 1655 4565 4497 129.4 3 3 1 2 7.1 14.1 6.4 6.3 2.3 2.2 97.6 187.0

STORMWATER CAPACITY ANALYSIS FOR SPOUT RUN WATERSHED: DESIGN ITERATIONS, ARLINGTON COUNTY, VIRGINIA
81
TABLE 3 (CONTINUED) 10-yr, 24-hr SCS Type II Storm Event: Final Iteration Results Summary
Conduit ID
Node ID
Length (ft)
Size (Diameter or H × W) (ft) No. of Barrels Additional Pipe
Equivalent Cross-Sectional Area (ft2) Existing HGL Final HGL Flow (cfs)
US DS Existing Final Existing Final Model ID Diameter (ft) Existing Final US (ft) DS (ft) US (ft) DS (ft) Existing Final
1611 4497 4442 156.9 3 3 1 2 7.1 14.1 6.3 9.0 2.2 5.1 97.6 186.8 1579 4442 4426 59.2 3 3 1 2 7.1 14.1 9.0 9.7 5.1 6.1 97.6 186.8 1573 4426 4434 128.0 3 3 1 2 7.1 14.1 9.7 6.2 6.1 3.7 97.6 186.8 1589 4434 4458 117.5 3 3 1 1 SR5 4 7.1 19.6 6.2 6.3 3.7 5.6 82.1 189.8 22163 4458 4341 118.8 3 3 1 1 SR4 4.5 7.1 23.0 6.3 5.0 5.6 3.0 76.7 230.7
Lee Hwy from N. Kenmore St. to Kirkwood Rd. (Figure 45; profile continues on Figure 42) 1525 4350 4340 155.2 3 3 1 1 7.1 7.1 1.5 1.4 1.5 1.4 41.1 41.1 1522 4340 4344 117.5 3 3 1 1 7.1 7.1 1.4 1.3 1.4 1.2 41.0 41.0 1520 4344 4341 93.5 3 3 1 1 7.1 7.1 1.3 5.0 1.2 3.0 41.0 41.0 1537 4341 4372 313.0 3.5 3.5 1 1 SR40 4.5 9.6 25.5 5.0 4.1 3.0 2.9 142.4 313.9 1559 4372 4399 94.9 3.5 3.5 1 1 SR56 4.5 9.6 25.5 4.1 4.8 2.9 3.8 142.4 313.8 1565 4399 4415 58.7 3.5 3.5 1 1 SR54 4.5 9.6 25.5 4.8 3.1 3.8 2.9 142.4 313.9 1577 4415 4440 119.4 3.5 3.5 1 1 SR44 4.5 9.6 25.5 3.1 2.7 2.9 2.5 142.5 314.1 1598 4440 4471 208.5 3.5 3.5 1 1 SR39 4.5 9.6 25.5 2.7 4.6 2.5 3.4 143.7 314.6 1605 4471 4480 275.7 4.5 4.5 1 1 SR57 5 15.9 35.5 4.6 6.0 3.4 4.0 143.0 314.3 1606 4480 4483 59.3 4.5 4.5 1 1 SR58 6 15.9 44.2 6.0 9.5 4.0 7.9 143.3 314.0
Stub at N. Nelson St. 23234 23364 23365 91.2 3 3 1 1 7.1 7.1 5.9 5.7 1.2 1.8 9.9 9.8
Kirkwood Rd. to I-66 (East Pipe) (Figure 46) 24560 4969 24377 26.9 10×10 10×10 1 2 100.0 200.0 12.1 11.5 9.6 8.9 1047.2 1716.6 24557 24377 4627 389.6 10×10 10×10 1 2 100.0 200.0 11.5 12.3 8.9 10.6 1037.0 1764.8 6665 4627 4559 67.0 10×10 10×10 1 2 100.0 200.0 12.3 12.1 10.6 10.6 1037.0 1765.2 6666 4559 4504 123.3 10×10 10×10 1 2 100.0 200.0 12.1 11.1 10.6 10.1 1037.0 1765.3 1618 4504 4466 55.4 10×10 10×10 1 2 100.0 200.0 11.1 9.8 10.1 9.0 1039.4 1769.6 1595 4466 4435 30.9 10×10 10×10 1 2 100.0 200.0 9.8 9.2 9.0 8.5 1039.6 1770.4 1574 4435 4308 127.6 10×10 10×10 1 2 100.0 200.0 9.2 8.6 8.5 8.4 1236.2 1979.6 1499 4308 4218 108.9 10×10 10×10 1 2 100.0 200.0 8.6 7.7 8.4 8.0 1236.6 1981.0 6620 4218 3939 346.2 10×10 10×10 1 2 100.0 200.0 7.7 6.4 8.0 9.2 1240.6 1980.4 6618 3939 3916 169.0 10×10 10×10 2 2 200.0 200.0 6.4 4.1 9.2 5.2 2070.4 3227.6
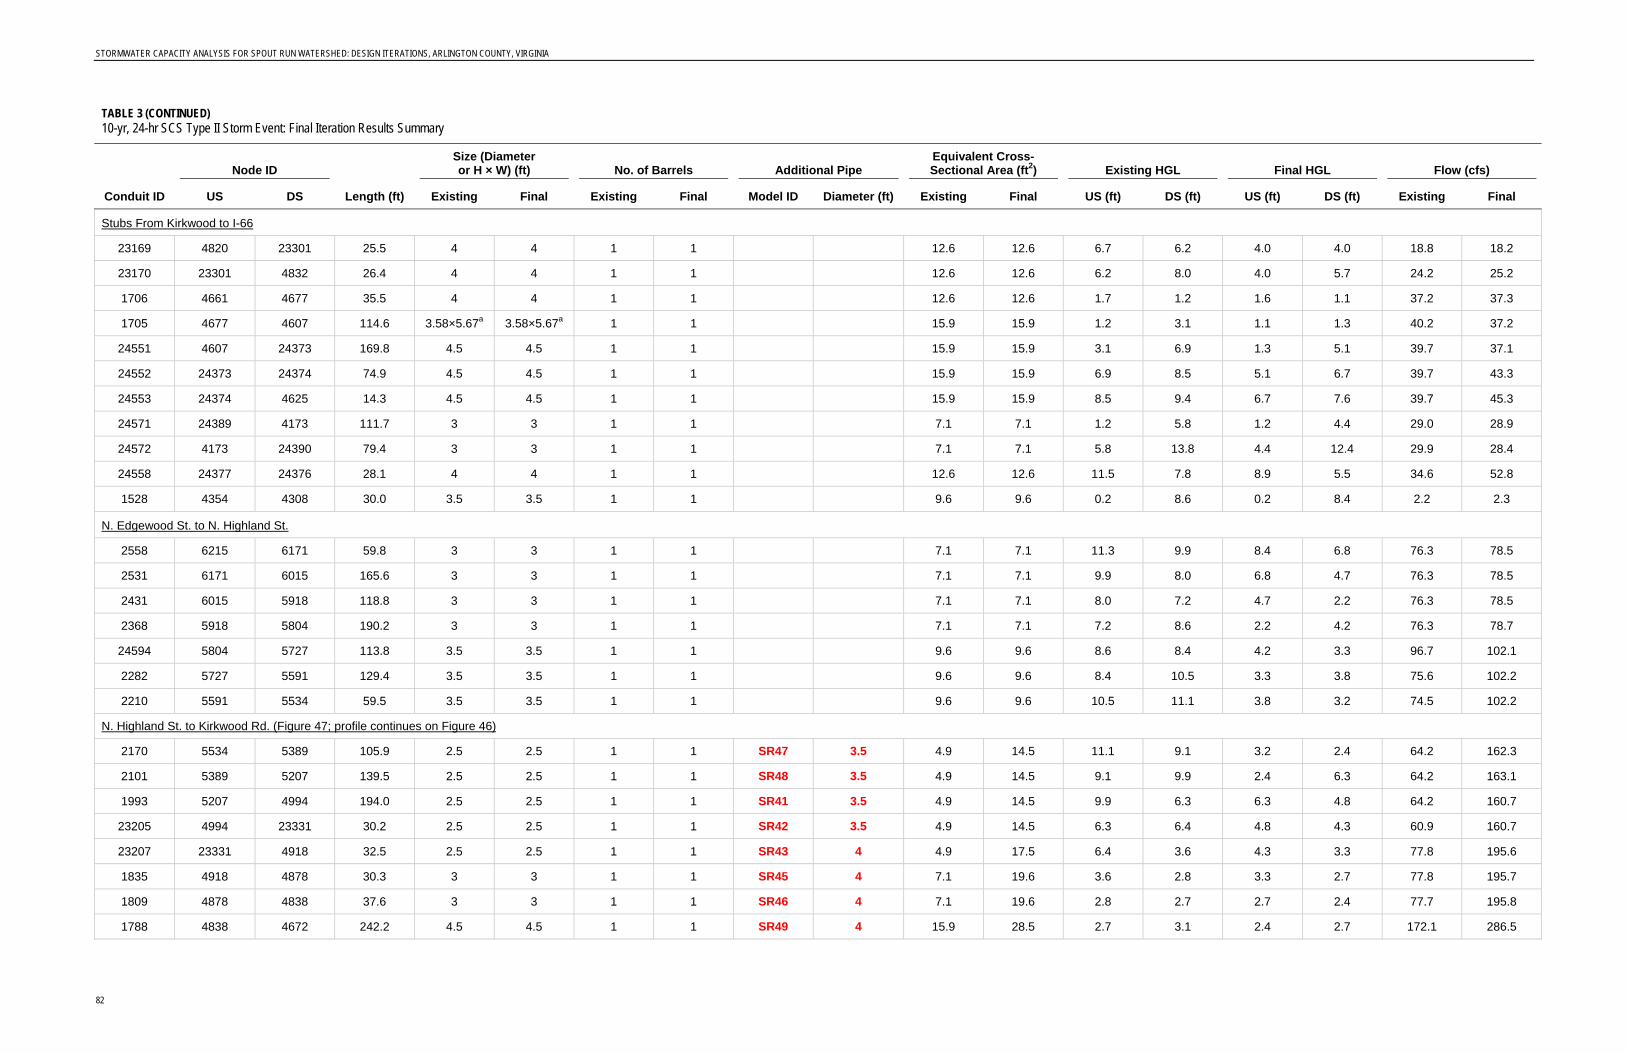
STORMWATER CAPACITY ANALYSIS FOR SPOUT RUN WATERSHED: DESIGN ITERATIONS, ARLINGTON COUNTY, VIRGINIA
82
TABLE 3 (CONTINUED) 10-yr, 24-hr SCS Type II Storm Event: Final Iteration Results Summary
Conduit ID
Node ID
Length (ft)
Size (Diameter or H × W) (ft) No. of Barrels Additional Pipe
Equivalent Cross-Sectional Area (ft2) Existing HGL Final HGL Flow (cfs)
US DS Existing Final Existing Final Model ID Diameter (ft) Existing Final US (ft) DS (ft) US (ft) DS (ft) Existing Final
Stubs From Kirkwood to I-66 23169 4820 23301 25.5 4 4 1 1 12.6 12.6 6.7 6.2 4.0 4.0 18.8 18.2 23170 23301 4832 26.4 4 4 1 1 12.6 12.6 6.2 8.0 4.0 5.7 24.2 25.2 1706 4661 4677 35.5 4 4 1 1 12.6 12.6 1.7 1.2 1.6 1.1 37.2 37.3 1705 4677 4607 114.6 3.58×5.67a 3.58×5.67a 1 1 15.9 15.9 1.2 3.1 1.1 1.3 40.2 37.2 24551 4607 24373 169.8 4.5 4.5 1 1 15.9 15.9 3.1 6.9 1.3 5.1 39.7 37.1 24552 24373 24374 74.9 4.5 4.5 1 1 15.9 15.9 6.9 8.5 5.1 6.7 39.7 43.3 24553 24374 4625 14.3 4.5 4.5 1 1 15.9 15.9 8.5 9.4 6.7 7.6 39.7 45.3 24571 24389 4173 111.7 3 3 1 1 7.1 7.1 1.2 5.8 1.2 4.4 29.0 28.9 24572 4173 24390 79.4 3 3 1 1 7.1 7.1 5.8 13.8 4.4 12.4 29.9 28.4 24558 24377 24376 28.1 4 4 1 1 12.6 12.6 11.5 7.8 8.9 5.5 34.6 52.8 1528 4354 4308 30.0 3.5 3.5 1 1 9.6 9.6 0.2 8.6 0.2 8.4 2.2 2.3
N. Edgewood St. to N. Highland St. 2558 6215 6171 59.8 3 3 1 1 7.1 7.1 11.3 9.9 8.4 6.8 76.3 78.5 2531 6171 6015 165.6 3 3 1 1 7.1 7.1 9.9 8.0 6.8 4.7 76.3 78.5 2431 6015 5918 118.8 3 3 1 1 7.1 7.1 8.0 7.2 4.7 2.2 76.3 78.5 2368 5918 5804 190.2 3 3 1 1 7.1 7.1 7.2 8.6 2.2 4.2 76.3 78.7 24594 5804 5727 113.8 3.5 3.5 1 1 9.6 9.6 8.6 8.4 4.2 3.3 96.7 102.1 2282 5727 5591 129.4 3.5 3.5 1 1 9.6 9.6 8.4 10.5 3.3 3.8 75.6 102.2 2210 5591 5534 59.5 3.5 3.5 1 1 9.6 9.6 10.5 11.1 3.8 3.2 74.5 102.2
N. Highland St. to Kirkwood Rd. (Figure 47; profile continues on Figure 46) 2170 5534 5389 105.9 2.5 2.5 1 1 SR47 3.5 4.9 14.5 11.1 9.1 3.2 2.4 64.2 162.3 2101 5389 5207 139.5 2.5 2.5 1 1 SR48 3.5 4.9 14.5 9.1 9.9 2.4 6.3 64.2 163.1 1993 5207 4994 194.0 2.5 2.5 1 1 SR41 3.5 4.9 14.5 9.9 6.3 6.3 4.8 64.2 160.7 23205 4994 23331 30.2 2.5 2.5 1 1 SR42 3.5 4.9 14.5 6.3 6.4 4.8 4.3 60.9 160.7 23207 23331 4918 32.5 2.5 2.5 1 1 SR43 4 4.9 17.5 6.4 3.6 4.3 3.3 77.8 195.6 1835 4918 4878 30.3 3 3 1 1 SR45 4 7.1 19.6 3.6 2.8 3.3 2.7 77.8 195.7 1809 4878 4838 37.6 3 3 1 1 SR46 4 7.1 19.6 2.8 2.7 2.7 2.4 77.7 195.8 1788 4838 4672 242.2 4.5 4.5 1 1 SR49 4 15.9 28.5 2.7 3.1 2.4 2.7 172.1 286.5
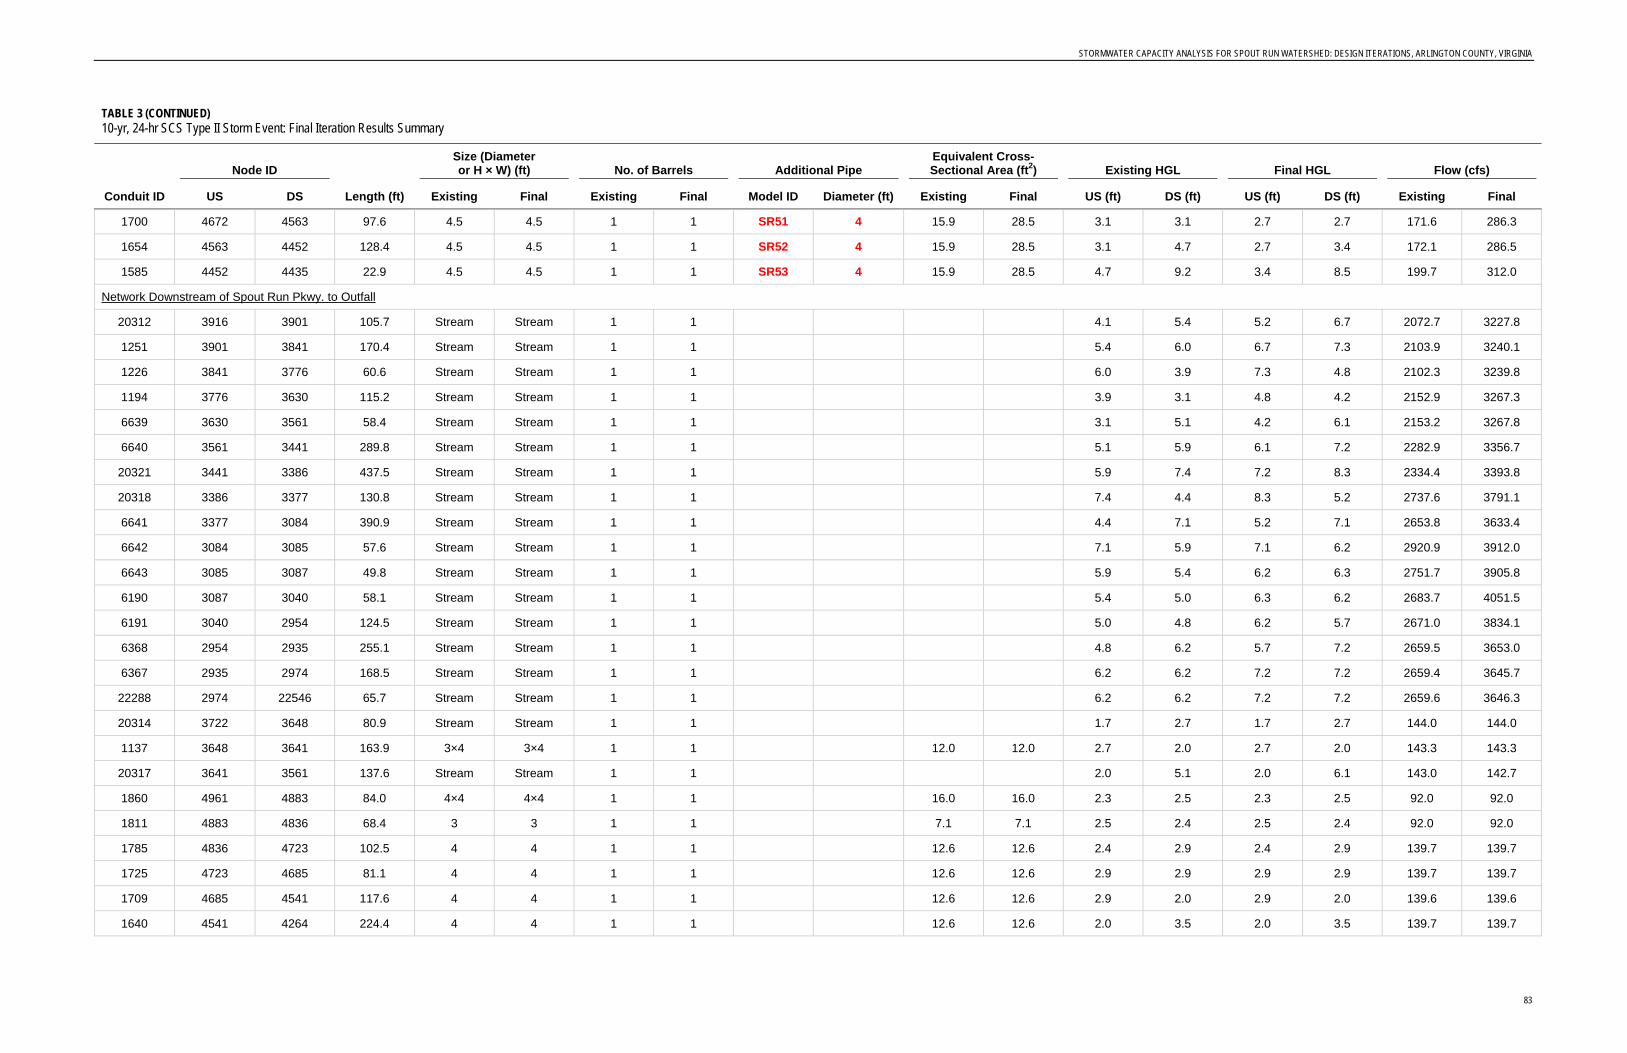
STORMWATER CAPACITY ANALYSIS FOR SPOUT RUN WATERSHED: DESIGN ITERATIONS, ARLINGTON COUNTY, VIRGINIA
83
TABLE 3 (CONTINUED) 10-yr, 24-hr SCS Type II Storm Event: Final Iteration Results Summary
Conduit ID
Node ID
Length (ft)
Size (Diameter or H × W) (ft) No. of Barrels Additional Pipe
Equivalent Cross-Sectional Area (ft2) Existing HGL Final HGL Flow (cfs)
US DS Existing Final Existing Final Model ID Diameter (ft) Existing Final US (ft) DS (ft) US (ft) DS (ft) Existing Final
1700 4672 4563 97.6 4.5 4.5 1 1 SR51 4 15.9 28.5 3.1 3.1 2.7 2.7 171.6 286.3 1654 4563 4452 128.4 4.5 4.5 1 1 SR52 4 15.9 28.5 3.1 4.7 2.7 3.4 172.1 286.5 1585 4452 4435 22.9 4.5 4.5 1 1 SR53 4 15.9 28.5 4.7 9.2 3.4 8.5 199.7 312.0
Network Downstream of Spout Run Pkwy. to Outfall 20312 3916 3901 105.7 Stream Stream 1 1 4.1 5.4 5.2 6.7 2072.7 3227.8 1251 3901 3841 170.4 Stream Stream 1 1 5.4 6.0 6.7 7.3 2103.9 3240.1 1226 3841 3776 60.6 Stream Stream 1 1 6.0 3.9 7.3 4.8 2102.3 3239.8 1194 3776 3630 115.2 Stream Stream 1 1 3.9 3.1 4.8 4.2 2152.9 3267.3 6639 3630 3561 58.4 Stream Stream 1 1 3.1 5.1 4.2 6.1 2153.2 3267.8 6640 3561 3441 289.8 Stream Stream 1 1 5.1 5.9 6.1 7.2 2282.9 3356.7 20321 3441 3386 437.5 Stream Stream 1 1 5.9 7.4 7.2 8.3 2334.4 3393.8 20318 3386 3377 130.8 Stream Stream 1 1 7.4 4.4 8.3 5.2 2737.6 3791.1 6641 3377 3084 390.9 Stream Stream 1 1 4.4 7.1 5.2 7.1 2653.8 3633.4 6642 3084 3085 57.6 Stream Stream 1 1 7.1 5.9 7.1 6.2 2920.9 3912.0 6643 3085 3087 49.8 Stream Stream 1 1 5.9 5.4 6.2 6.3 2751.7 3905.8 6190 3087 3040 58.1 Stream Stream 1 1 5.4 5.0 6.3 6.2 2683.7 4051.5 6191 3040 2954 124.5 Stream Stream 1 1 5.0 4.8 6.2 5.7 2671.0 3834.1 6368 2954 2935 255.1 Stream Stream 1 1 4.8 6.2 5.7 7.2 2659.5 3653.0 6367 2935 2974 168.5 Stream Stream 1 1 6.2 6.2 7.2 7.2 2659.4 3645.7 22288 2974 22546 65.7 Stream Stream 1 1 6.2 6.2 7.2 7.2 2659.6 3646.3 20314 3722 3648 80.9 Stream Stream 1 1 1.7 2.7 1.7 2.7 144.0 144.0 1137 3648 3641 163.9 3×4 3×4 1 1 12.0 12.0 2.7 2.0 2.7 2.0 143.3 143.3 20317 3641 3561 137.6 Stream Stream 1 1 2.0 5.1 2.0 6.1 143.0 142.7 1860 4961 4883 84.0 4×4 4×4 1 1 16.0 16.0 2.3 2.5 2.3 2.5 92.0 92.0 1811 4883 4836 68.4 3 3 1 1 7.1 7.1 2.5 2.4 2.5 2.4 92.0 92.0 1785 4836 4723 102.5 4 4 1 1 12.6 12.6 2.4 2.9 2.4 2.9 139.7 139.7 1725 4723 4685 81.1 4 4 1 1 12.6 12.6 2.9 2.9 2.9 2.9 139.7 139.7 1709 4685 4541 117.6 4 4 1 1 12.6 12.6 2.9 2.0 2.9 2.0 139.6 139.6 1640 4541 4264 224.4 4 4 1 1 12.6 12.6 2.0 3.5 2.0 3.5 139.7 139.7

STORMWATER CAPACITY ANALYSIS FOR SPOUT RUN WATERSHED: DESIGN ITERATIONS, ARLINGTON COUNTY, VIRGINIA
84
TABLE 3 (CONTINUED) 10-yr, 24-hr SCS Type II Storm Event: Final Iteration Results Summary
Conduit ID
Node ID
Length (ft)
Size (Diameter or H × W) (ft) No. of Barrels Additional Pipe
Equivalent Cross-Sectional Area (ft2) Existing HGL Final HGL Flow (cfs)
US DS Existing Final Existing Final Model ID Diameter (ft) Existing Final US (ft) DS (ft) US (ft) DS (ft) Existing Final
1466 4264 4076 194.8 4 4 1 1 12.6 12.6 3.5 10.6 3.5 11.2 140.9 140.9 1347 4076 3946 113.1 4 4 1 1 12.6 12.6 10.6 8.6 11.2 8.6 205.6 205.6 1269 3946 3930 10.4 4 4 1 1 12.6 12.6 8.6 2.1 8.6 2.1 205.6 205.5 1262 3930 3655 236.6 Stream Stream 1 1 2.1 2.8 2.1 2.8 205.2 205.2 1141 3655 3623 19.6 5×5 5×5 1 1 25.0 25.0 2.8 2.1 2.8 2.1 204.9 204.9 1127 3623 3483 141.9 5×5 5×5 1 1 25.0 25.0 2.1 2.1 2.1 2.1 266.0 266.0 20319 3483 3386 75.7 Stream Stream 1 1 2.1 7.4 2.1 8.3 265.9 265.9
US, upstream; DS, downstream. Note that cross-sectional area and HGL are not calculated for natural stream sections. The existing and final HGL data represent maximum node depths. a Irregularly shaped pipe, such as arch, elliptical.
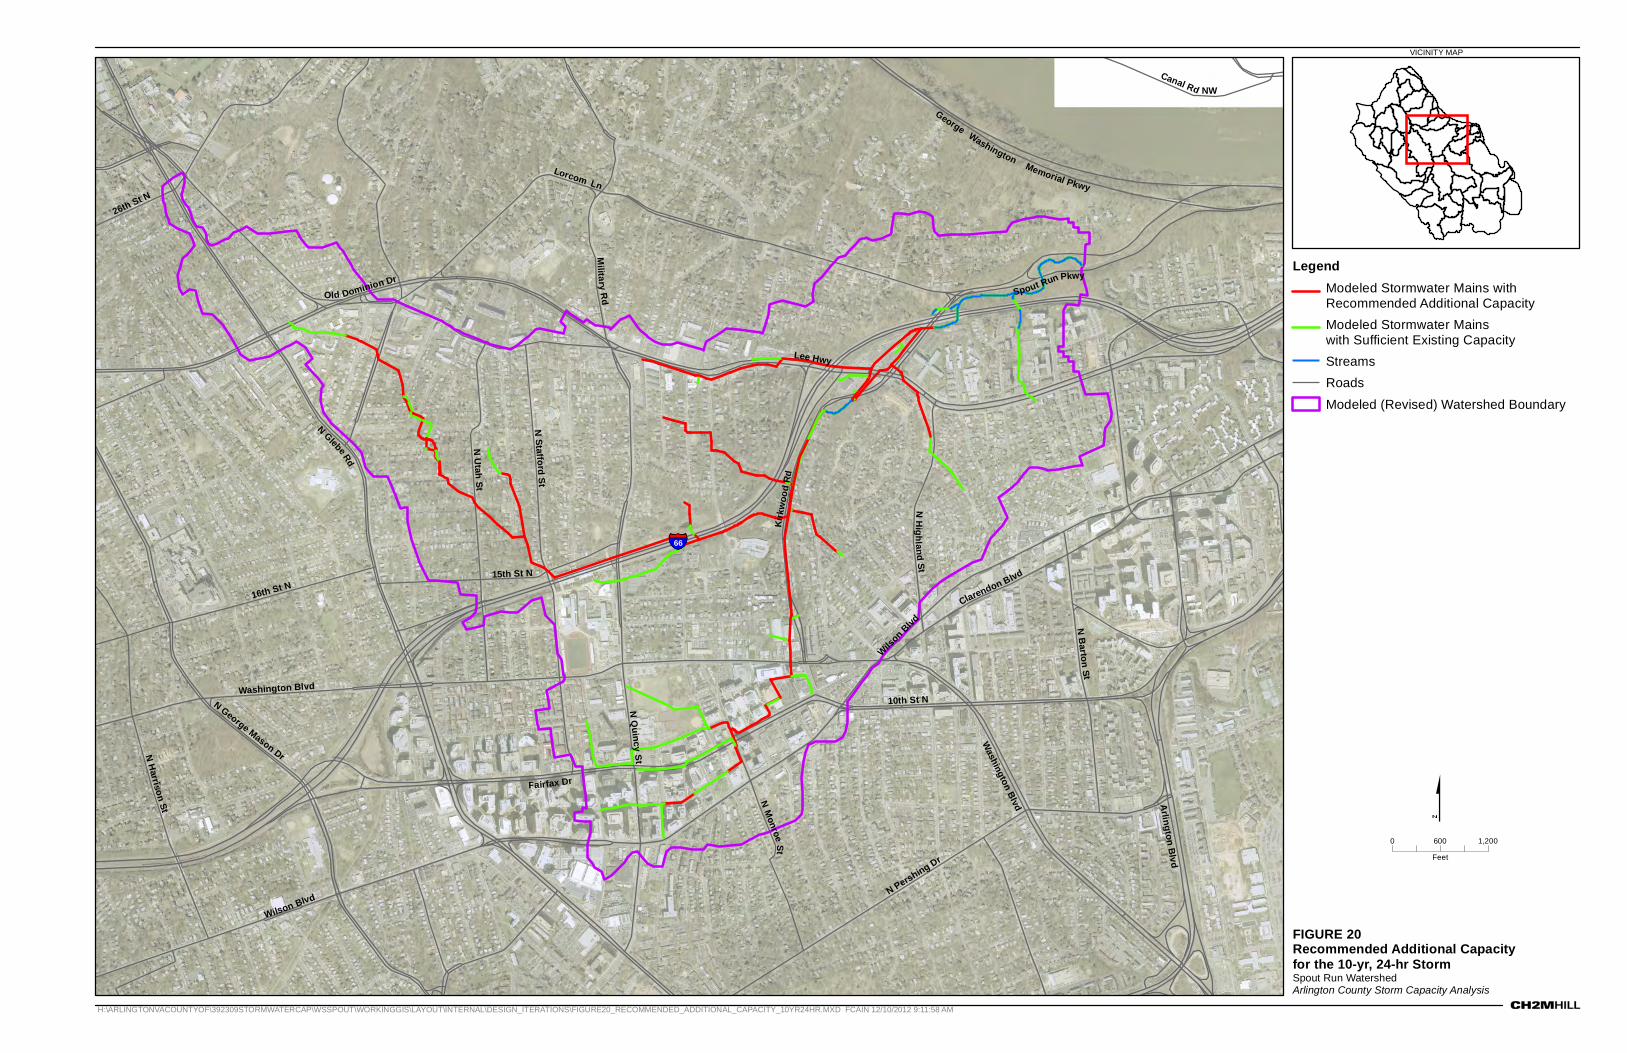
FIGURE 20Recommended Additional Capacityfor the 10-yr, 24-hr StormSpout Run WatershedArlington County Storm Capacity Analysis
H:\ARLINGTONVACOUNTYOF\392309STORMWATERCAP\WSSPOUT\WORKINGGIS\LAYOUT\INTERNAL\DESIGN_ITERATIONS\FIGURE20_RECOMMENDED_ADDITIONAL_CAPACITY_10YR24HR.MXD FCAIN 12/10/2012 9:11:58 AM
VICINITY MAP
N Pershing Dr
Lorcom Ln
Wilson Blvd
N George Mason Dr
26th St N
N Monroe St
N Highl and St15th St N
N Bar ton St
16th St N
10th St N
Spout Run Pkwy
N Harrison St
Clarendon Blvd
George Washington Memorial Pkwy
Fairfax Dr
Wilson Blvd
Mili t ary Rd
Kirkw
ood R
d
N Utah St
N Staffo rd St
N Quincy St
Canal Rd NW
N Glebe Rd
Washington Blvd
Washington Blvd
Old Dominion Dr
Arlington Blvd
Lee Hwy
66
LegendModeled Stormwater Mains withRecommended Additional CapacityModeled Stormwater Mainswith Sufficient Existing CapacityStreamsRoadsModeled (Revised) Watershed Boundary
0 1,200600Feet


FIGURE 21 - Spout RunN. Quincy St. and 10th St. N. to N. Monroe St. for the 10-yr 24-hr Storm Event
5.5’(2)
4.5’(1) 4.5’(1)
4.5’(1)4.5’(1)
5’(1)5’(1)
ExistingModel HGL
ExistingGrade
FinalModel HGL
ES120612173432WDC_SR_S2
NOTES: = Flooded Junction in Existing Model #’(#) = Diameter (No. barrels) from Existing Model or Unchanged in Final Model#’(#) = Diameter (No. barrels) Updated Information in Final Model
9108 8909 8910 20682206818913890888868944913891079109
9652 9269 9186 9281921391879210925092589375944394719498

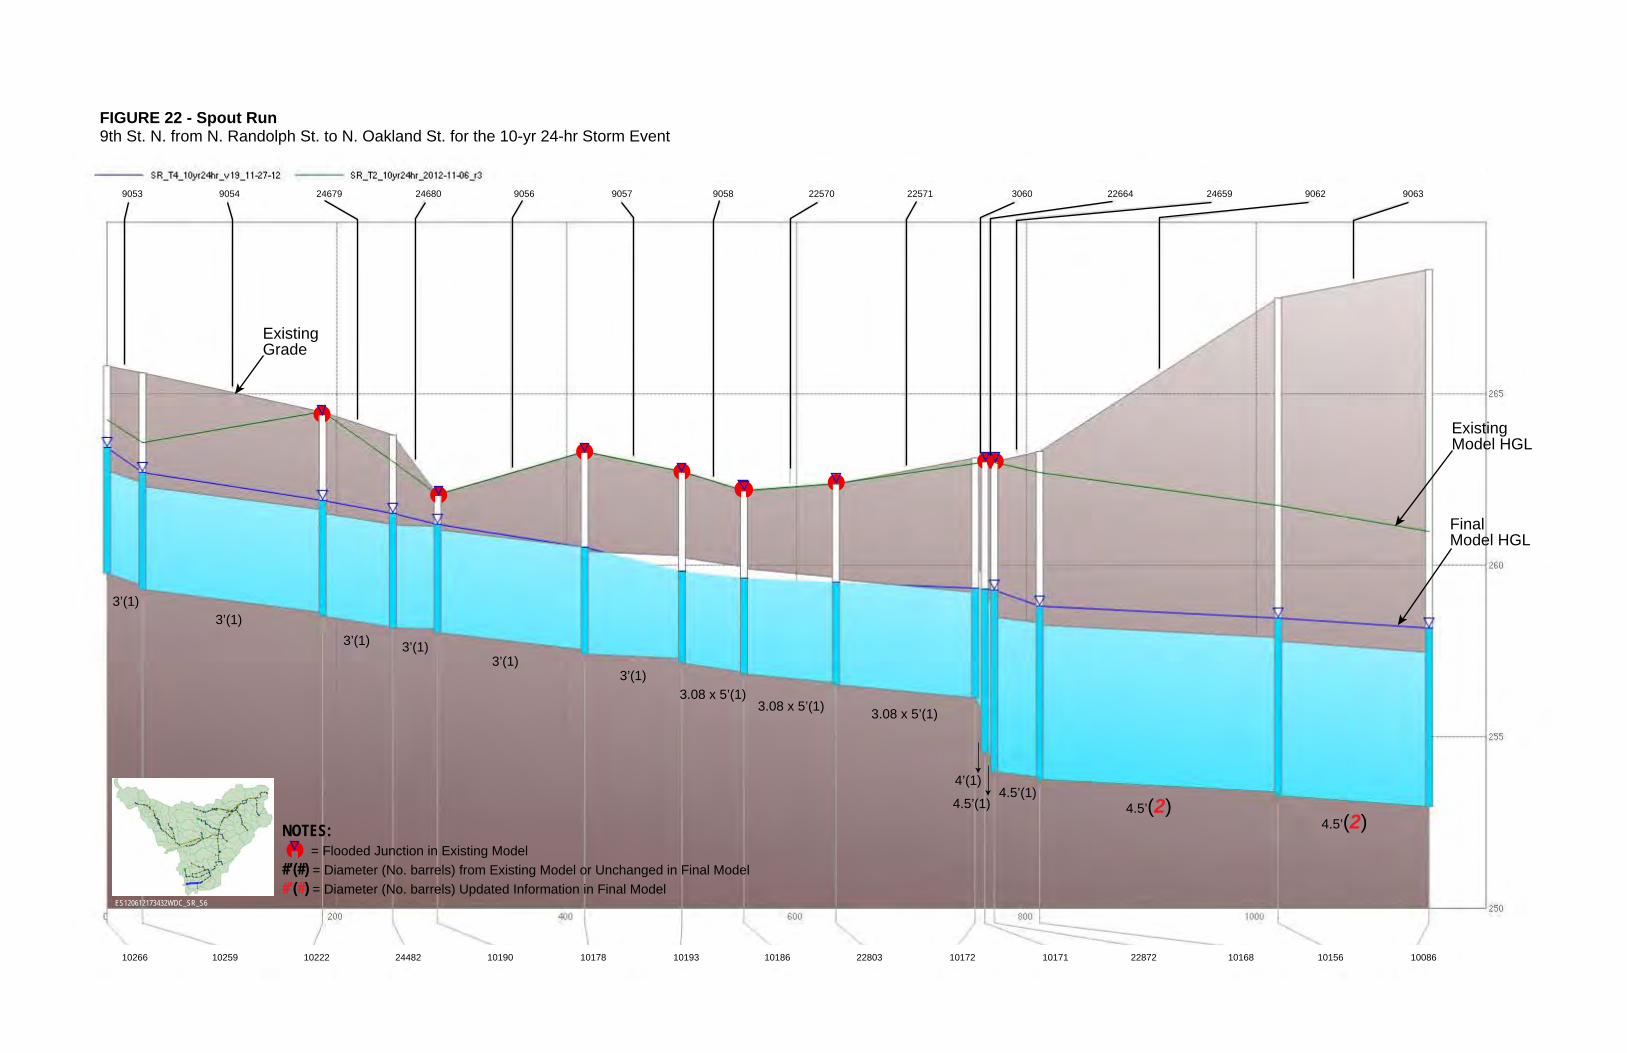
FIGURE 22 - Spout Run9th St. N. from N. Randolph St. to N. Oakland St. for the 10-yr 24-hr Storm Event
4.5’(2)4.5’(2)4’(1)
3.08 x 5’(1)3.08 x 5’(1)3.08 x 5’(1)
4.5’(1) 4.5’(1)
3’(1)
3’(1)3’(1)
3’(1)3’(1)3’(1)
ExistingModel HGL
ExistingGrade
FinalModel HGL
ES120612173432WDC_SR_S6
NOTES: = Flooded Junction in Existing Model #’(#) = Diameter (No. barrels) from Existing Model or Unchanged in Final Model#’(#) = Diameter (No. barrels) Updated Information in Final Model
10266 10178 10168 100861015622872101711017222803101861019310190244821022210259
9053 22571 90639062246592266430602257090589057905624680246799054


FIGURE 23 - Spout Run9th St. N. and N. Monroe St. to Fairfax Dr. for the 10-yr 24-hr Storm Event
4.5’(1)
4.5’(1)4.5’(1)4.5’(1)
ExistingModel HGL
ExistingGrade
FinalModel HGL
ES120612173432WDC_SR_S7
NOTES: = Flooded Junction in Existing Model #’(#) = Diameter (No. barrels) from Existing Model or Unchanged in Final Model#’(#) = Diameter (No. barrels) Updated Information in Final Model
10086 24487 9357 928193919412944295699623974697909899995723554
23470 24685 9205 890489059204916991682468691759174917323471
4.5’(2)
4.5’(2) 4.5’(2) 5’(2)
5.5’(2)5’(2)5’(2)
5’(2)5’(2)

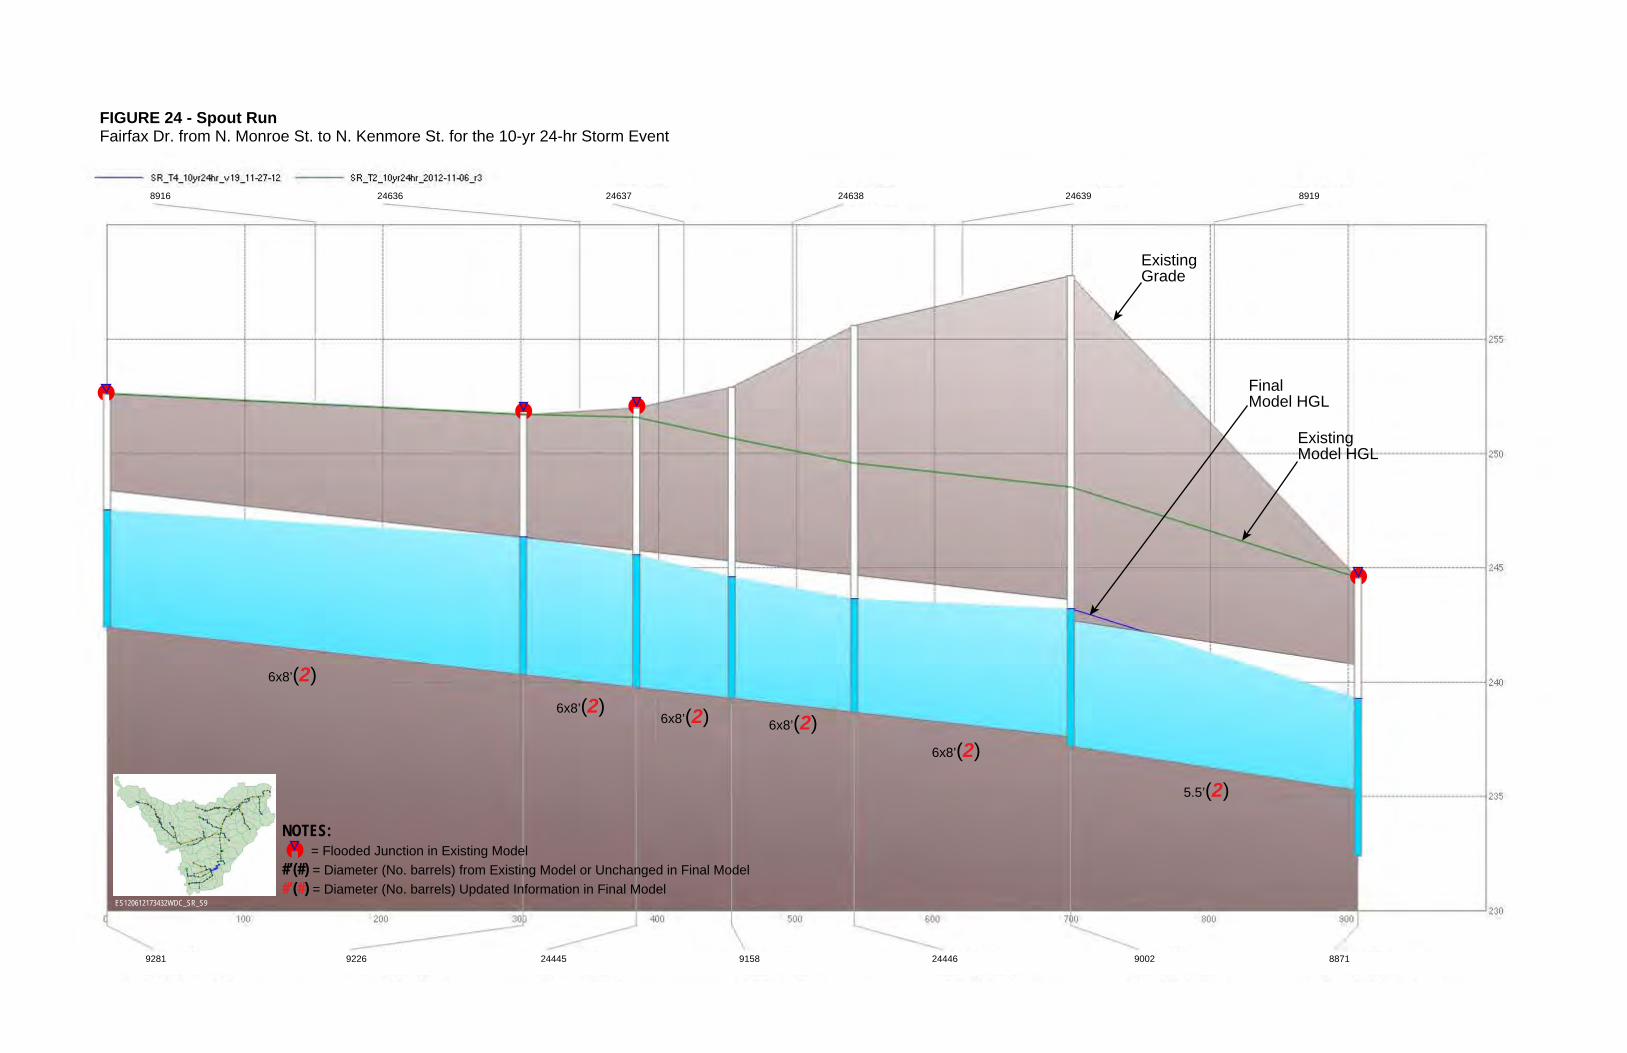
FIGURE 24 - Spout RunFairfax Dr. from N. Monroe St. to N. Kenmore St. for the 10-yr 24-hr Storm Event
6x8’(2)
6x8’(2)6x8’(2)6x8’(2)6x8’(2)
5.5’(2)
ExistingModel HGL
ExistingGrade
FinalModel HGL
ES120612173432WDC_SR_S9
NOTES: = Flooded Junction in Existing Model #’(#) = Diameter (No. barrels) from Existing Model or Unchanged in Final Model#’(#) = Diameter (No. barrels) Updated Information in Final Model
9281 24445 9158 9002 8871244469226
8916 24637 24639 89192463824636


FIGURE 25 - Spout RunKirkwood Rd. from N. Kenmore St. to Washington Blvd. for the 10-yr 24-hr Storm Event
7’x9’(2)
7’x9’(2) 8’(2)8’(2) 8’(2)
7’x9’(2)7’x9’(2)
4.5’(1)
ExistingModel HGL
ExistingGrade
FinalModel HGL
ES120612173432WDC_SR_S10
NOTES: = Flooded Junction in Existing Model #’(#) = Diameter (No. barrels) from Existing Model or Unchanged in Final Model#’(#) = Diameter (No. barrels) Updated Information in Final Model
9002 2443324433 8616 845386032443424432244318871
8918 24620 166662068624622246212461924623


FIGURE 26 - Spout RunKirkwood Rd. from Washington Blvd. to 14th St. N. for the 10-yr 24-hr Storm Event
7’(2)
7’(2)7’(2)
7’(2)
7’(2)7’(2)
7’(2)
6x10’(1)5x7’(2)
ExistingModel HGL
ExistingGrade
FinalModel HGL
ES120612173432WDC_SR_S11
NOTES: = Flooded Junction in Existing Model #’(#) = Diameter (No. barrels) from Existing Model or Unchanged in Final Model#’(#) = Diameter (No. barrels) Updated Information in Final Model
6x10’Additional
Pipe
8453 7917 7420759476617849818583238430
16669 8754 20299875725069875387148713

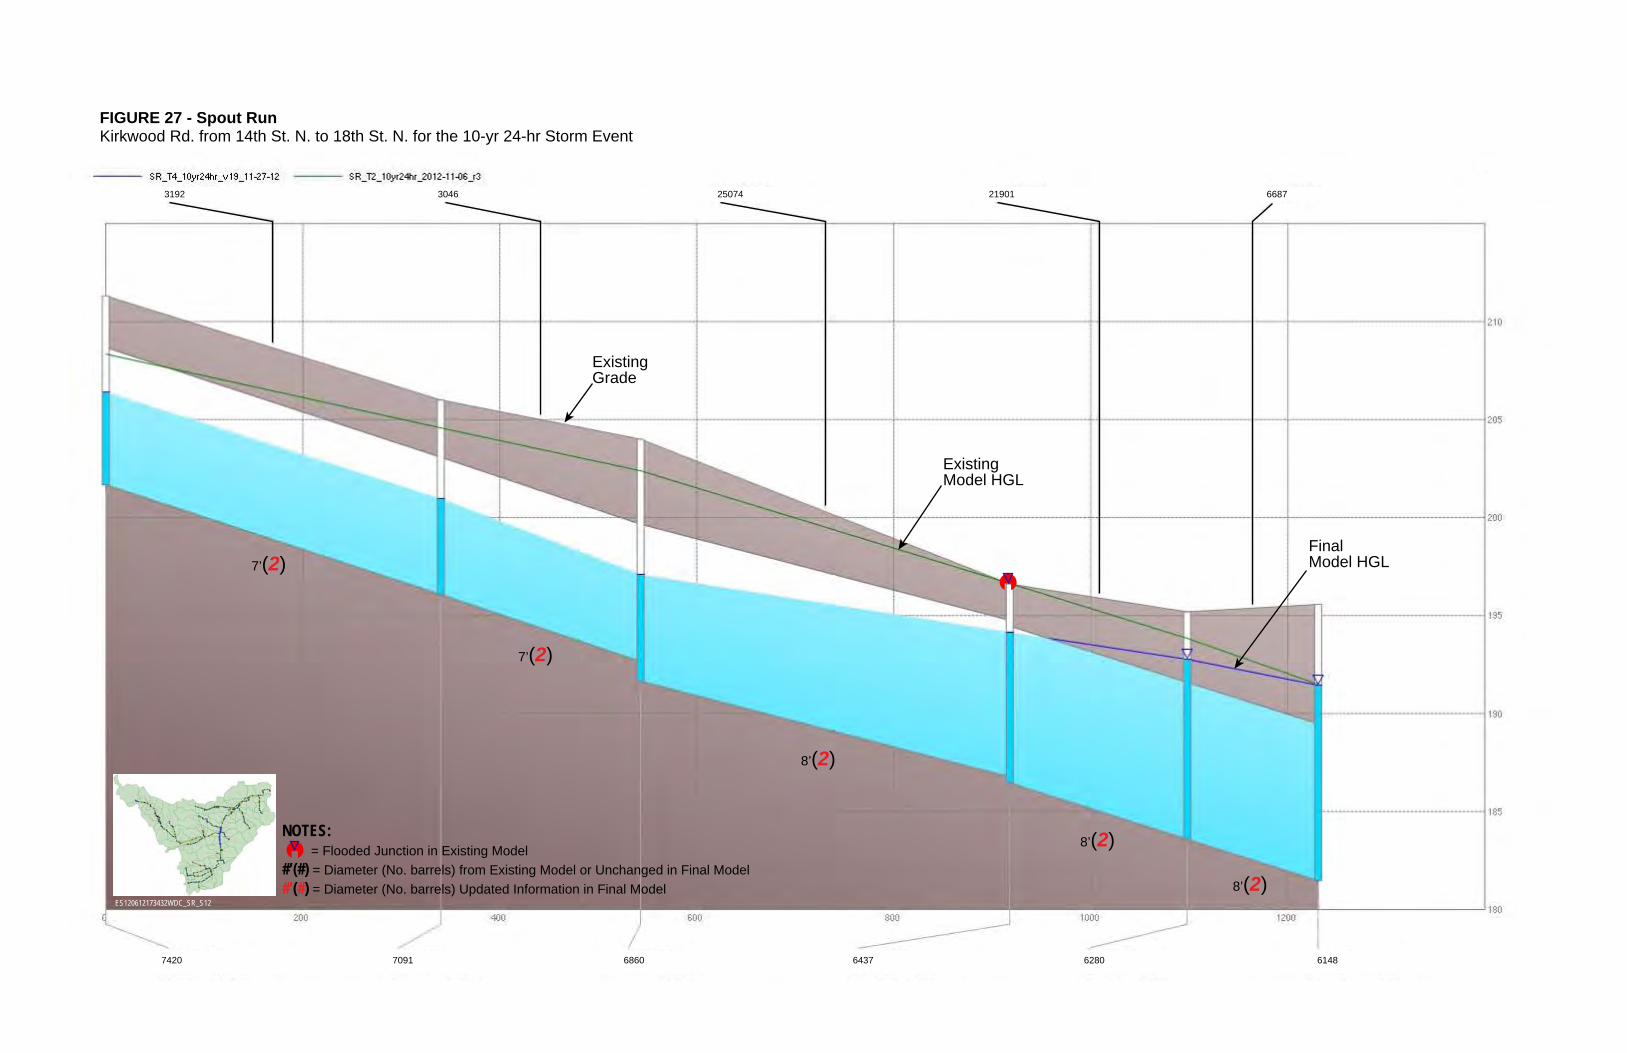
FIGURE 27 - Spout RunKirkwood Rd. from 14th St. N. to 18th St. N. for the 10-yr 24-hr Storm Event
7’(2)
7’(2)
8’(2)8’(2)
8’(2)
ExistingModel HGL
ExistingGrade
FinalModel HGL
ES120612173432WDC_SR_S12
NOTES: = Flooded Junction in Existing Model #’(#) = Diameter (No. barrels) from Existing Model or Unchanged in Final Model#’(#) = Diameter (No. barrels) Updated Information in Final Model
7420 7091 6860 6437 6280 6148
3192 3046 25074 668721901

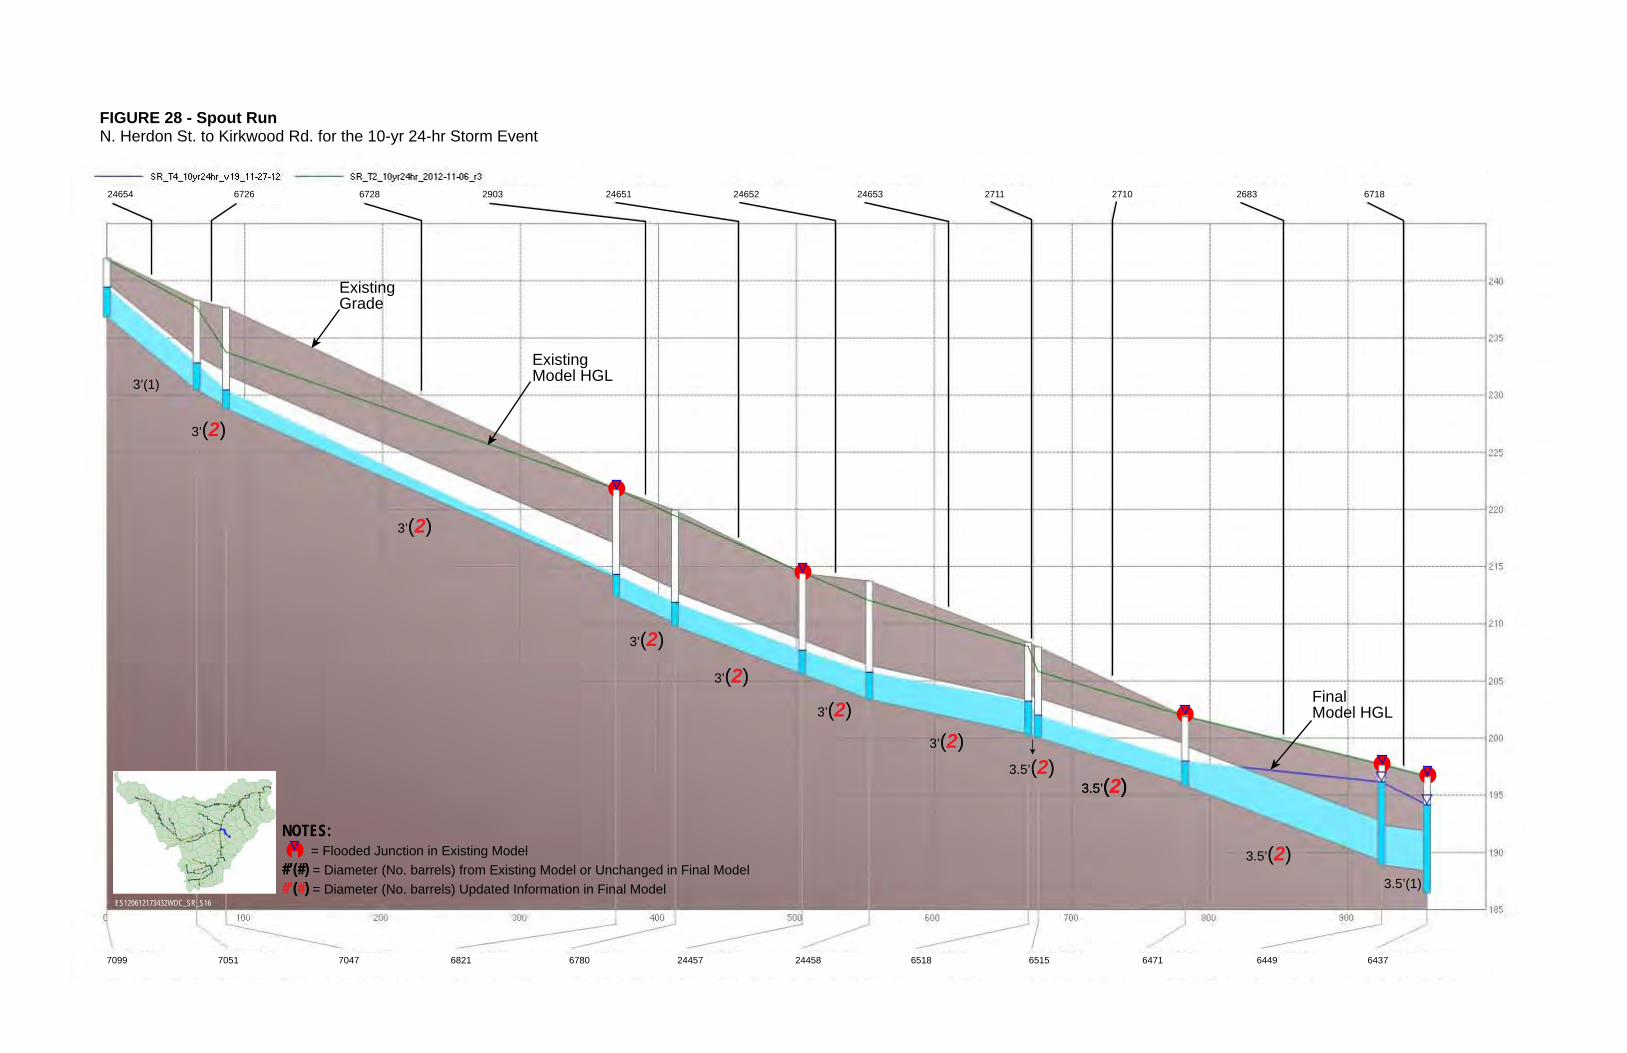
FIGURE 28 - Spout RunN. Herdon St. to Kirkwood Rd. for the 10-yr 24-hr Storm Event
3’(2)
3.5’(2)
3.5’(2)
3.5’(2)3’(2)
3.5’(2)
3’(2)3’(2)
3’(2)
3’(2)
3’(1)
3.5’(1)
ExistingModel HGL
ExistingGrade
FinalModel HGL
ES120612173432WDC_SR_S16
NOTES: = Flooded Junction in Existing Model #’(#) = Diameter (No. barrels) from Existing Model or Unchanged in Final Model#’(#) = Diameter (No. barrels) Updated Information in Final Model
7099 6821 6518 6449 6437647165152445824457678070477051
24654 6726 24653 6718268327102711246522465129036728


FIGURE 29 - Spout RunN. Woodrow St. to 19th Rd. N. for the 10-yr 24-hr Storm Event
4’(2)
4.5’(2) 4.5’(2)
4.5’(2)
4’(2)
4’(2)4’(2)
4x6’(1)
4x6’(1)
4.5’(1)
4.5’(1)
ExistingModel HGL
FinalModel HGL
ES120612173432WDC_SR_W2
NOTES: = Flooded Junction in Existing Model #’(#) = Diameter (No. barrels) from Existing Model or Unchanged in Final Model#’(#) = Diameter (No. barrels) Updated Information in Final Model Additional Piping System
4x6’ Additional Pipe4x6’ Additional Pipe
4048 4204 4529 48904722435942794122242124108
1364 1531 181617231631147914242434524343
ExistingGrade

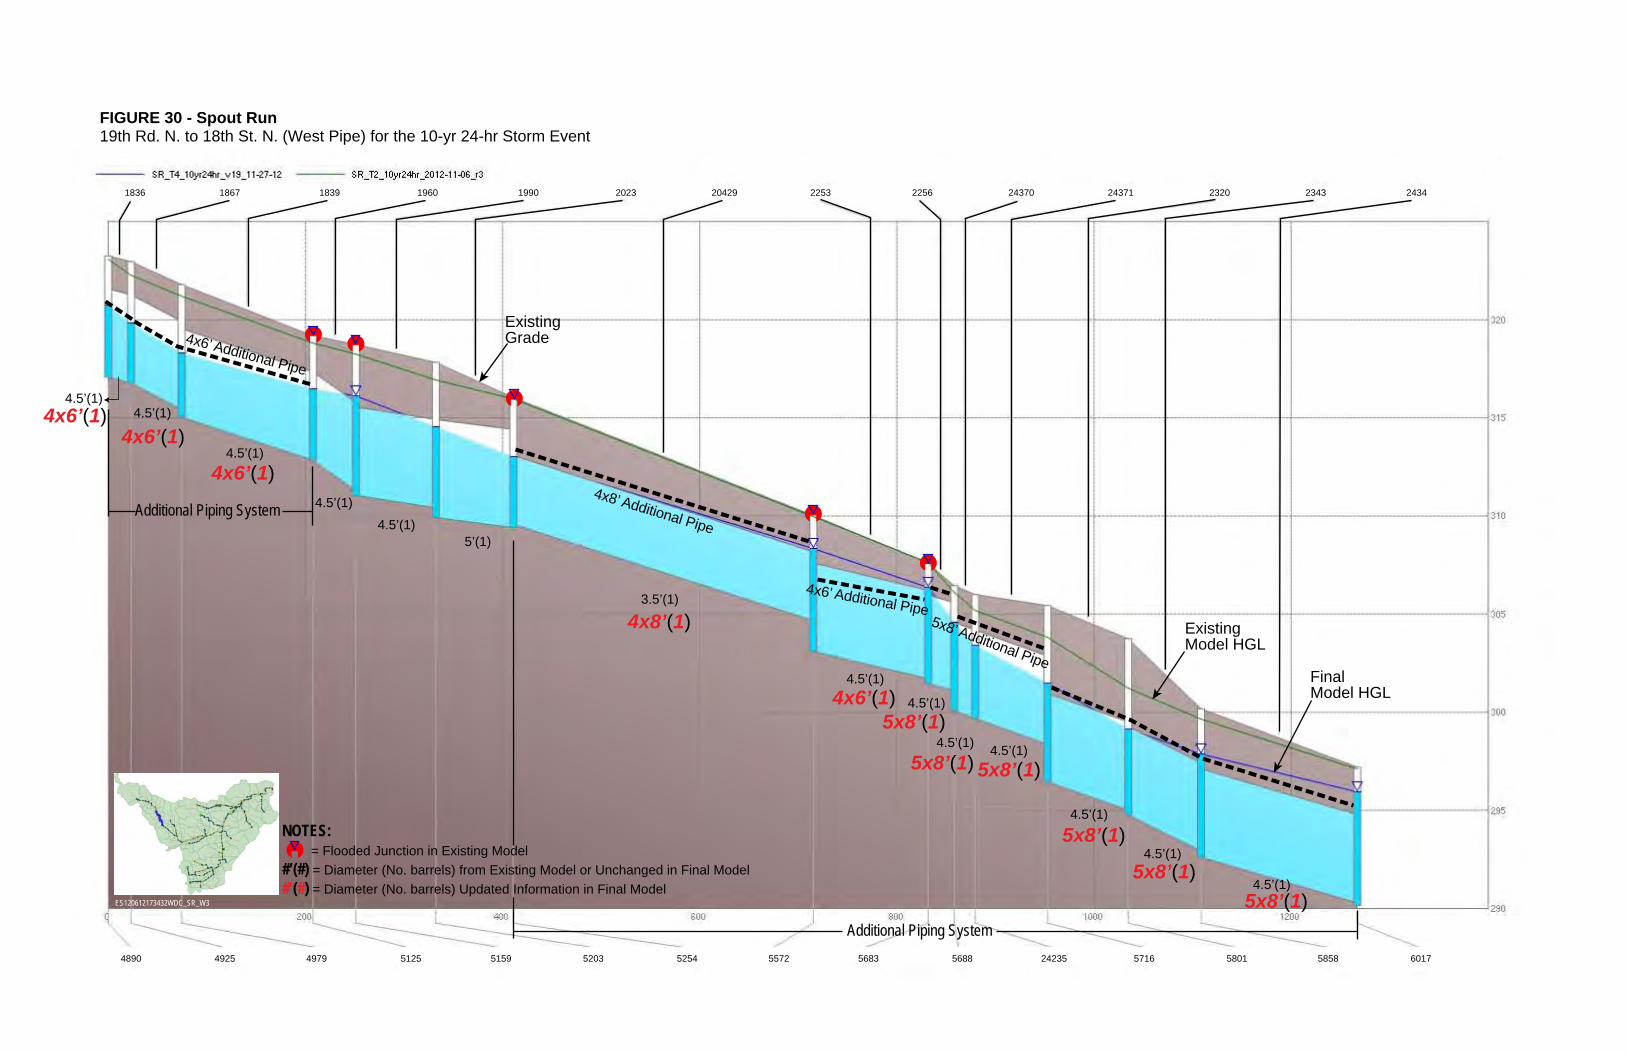
FIGURE 30 - Spout Run19th Rd. N. to 18th St. N. (West Pipe) for the 10-yr 24-hr Storm Event
4.5’(1)
4.5’(1)
4.5’(1)
4.5’(1)4.5’(1)
4.5’(1)
4.5’(1)4.5’(1)
4.5’(1)
4.5’(1)
4.5’(1)
4.5’(1)4x6’(1)
4x8’(1)
4x6’(1)5x8’(1)
5x8’(1) 5x8’(1)
5x8’(1)5x8’(1)
5x8’(1)
4x6’(1)4x6’(1)
5’(1)
3.5’(1)ExistingModel HGL
FinalModel HGL
ES120612173432WDC_SR_W3
NOTES: = Flooded Junction in Existing Model #’(#) = Diameter (No. barrels) from Existing Model or Unchanged in Final Model#’(#) = Diameter (No. barrels) Updated Information in Final Model
Additional Piping System
4x6’ Additional Pipe
5x8’ Additional Pipe
4x8’ Additional Pipe
4x6’ Additional Pipe
4890 5159512549794925 5203 5572 24235 5858 601758015716568856835254
1836 2023 24370 2434234323202437122562253204291990196018391867
ExistingGrade
Additional Piping System

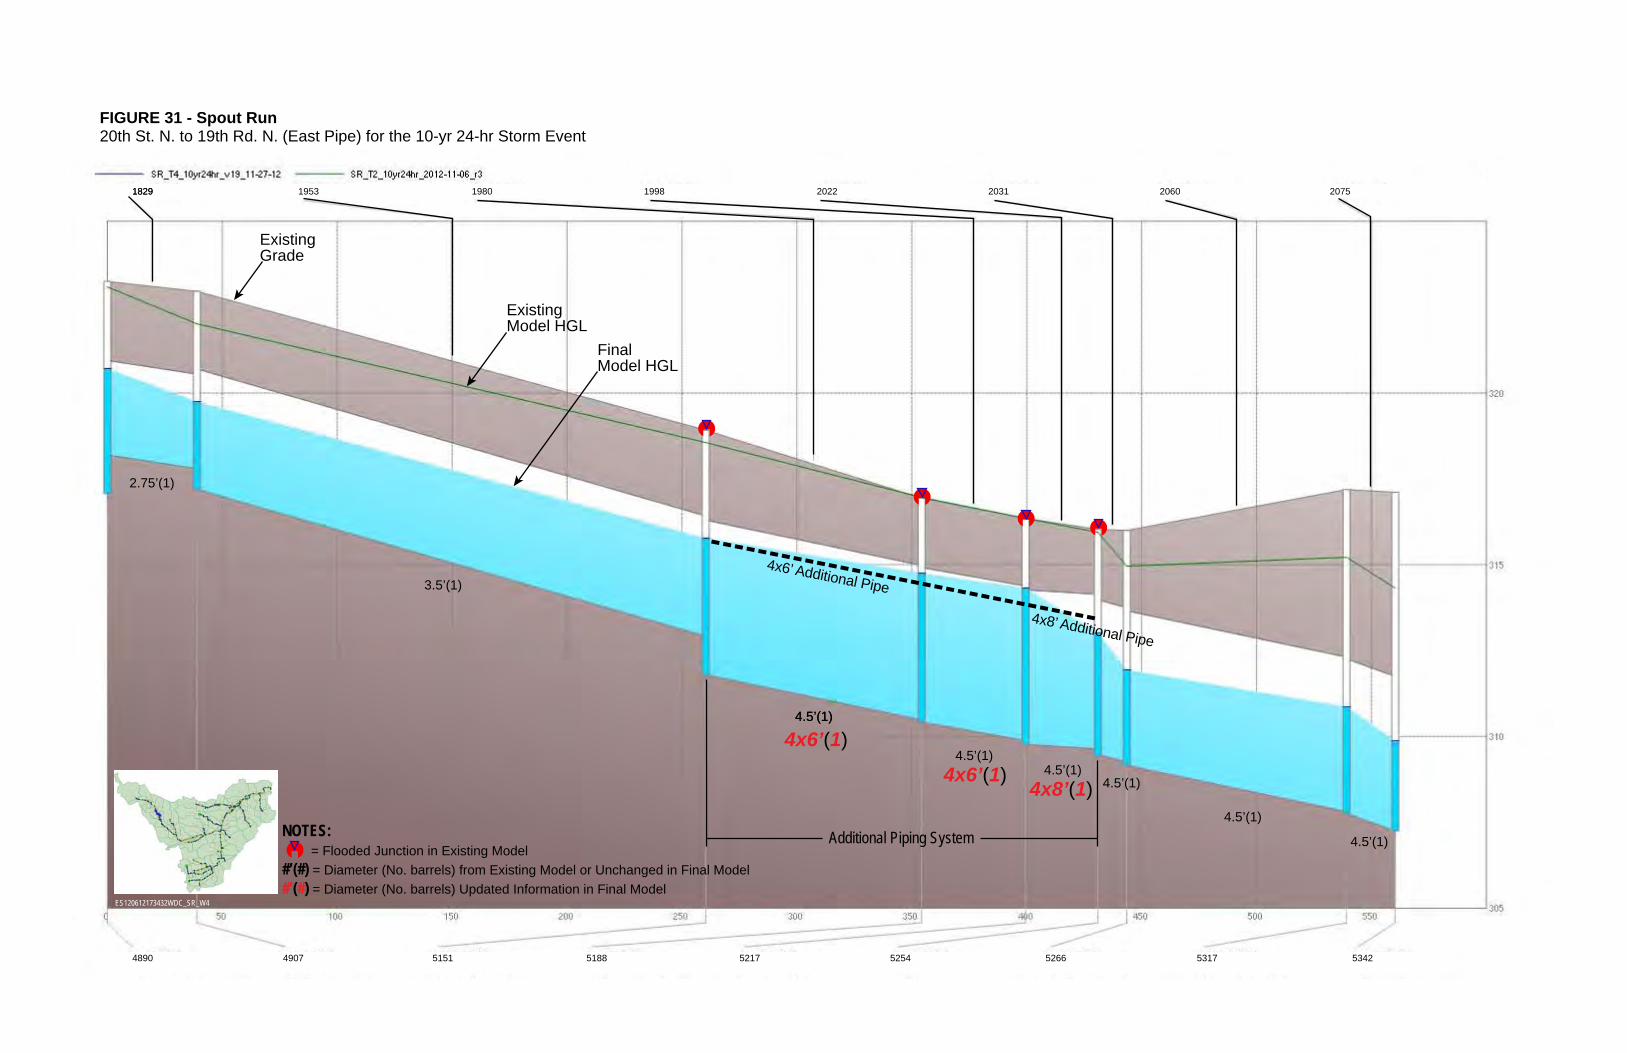
FIGURE 31 - Spout Run20th St. N. to 19th Rd. N. (East Pipe) for the 10-yr 24-hr Storm Event
2.75’(1)
4x6’(1)
4x8’(1)4x6’(1)
4.5’(1)4.5’(1)
4.5’(1)4.5’(1)
4.5’(1)4.5’(1)
4.5’(1)
3.5’(1)
ES120612173432WDC_SR_W4
NOTES: = Flooded Junction in Existing Model #’(#) = Diameter (No. barrels) from Existing Model or Unchanged in Final Model#’(#) = Diameter (No. barrels) Updated Information in Final Model
4x6’ Additional Pipe4x8’ Additional Pipe
18291829
4890 4907 5188 5317 53425266525452175151
2022 207520602031199819801953
ExistingGrade
Additional Piping System
ExistingModel HGL
FinalModel HGL

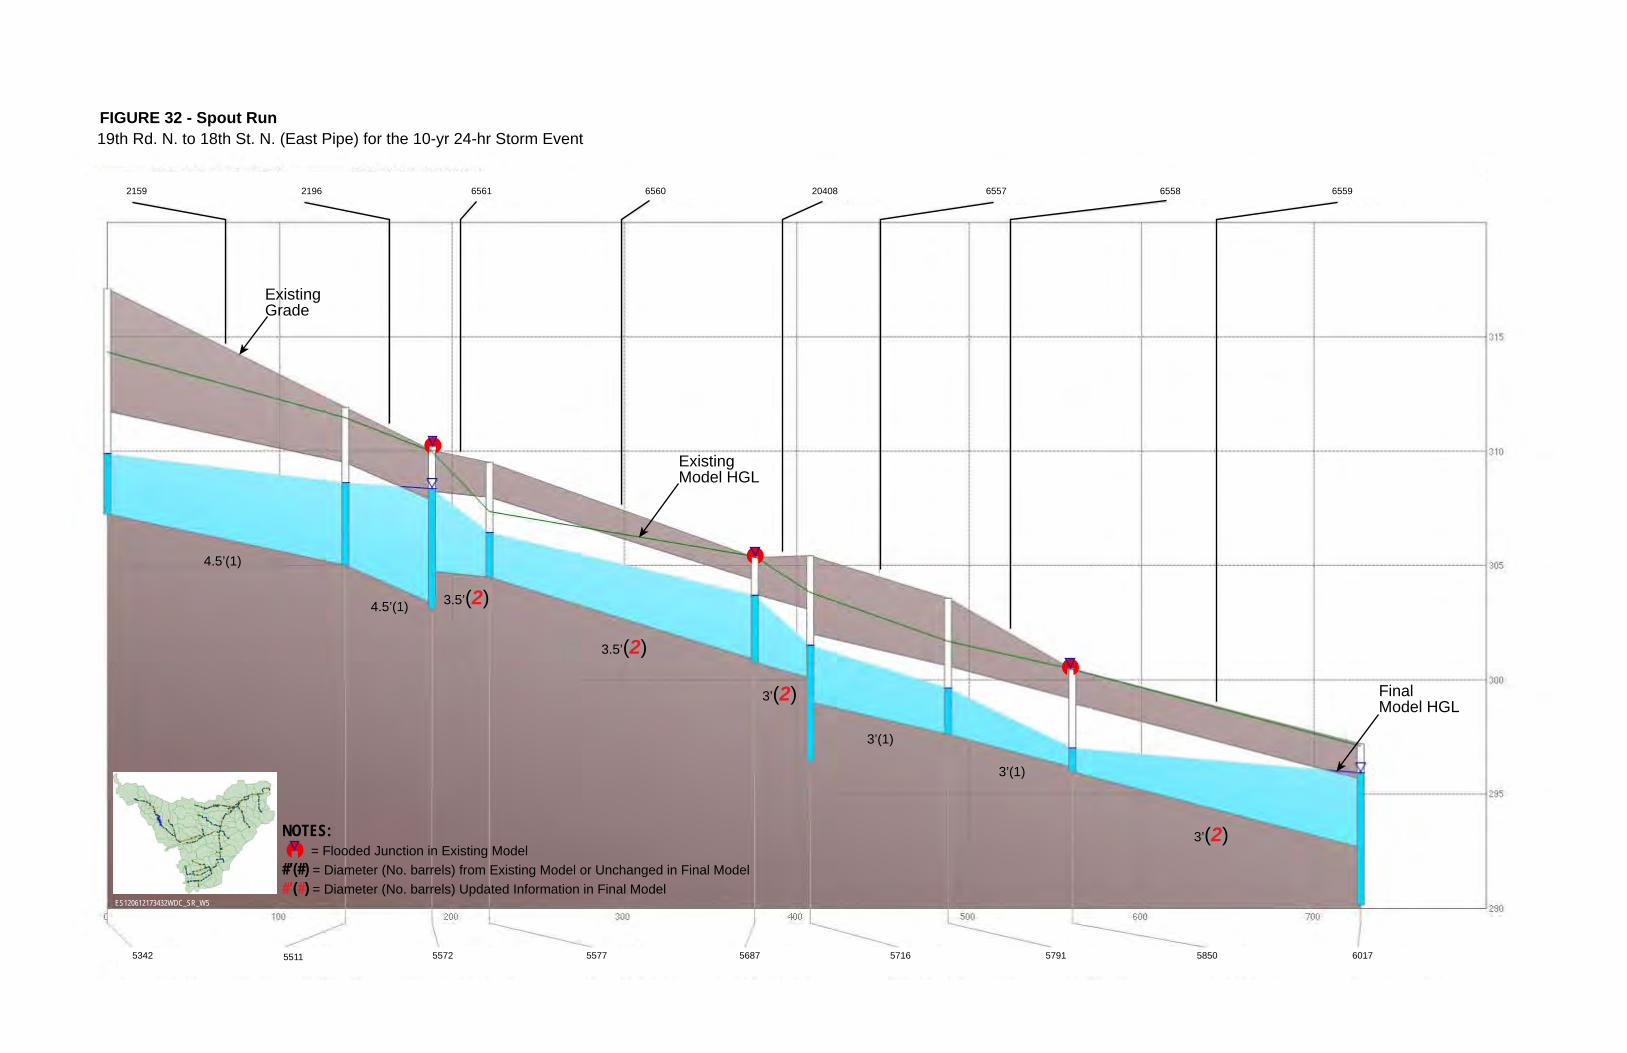
FIGURE 32 - Spout Run19th Rd. N. to 18th St. N. (East Pipe) for the 10-yr 24-hr Storm Event
3’(2)
3’(2)
3.5’(2)
3.5’(2)
3’(1)
3’(1)
4.5’(1)
4.5’(1)
ES120612173432WDC_SR_W5
NOTES: = Flooded Junction in Existing Model #’(#) = Diameter (No. barrels) from Existing Model or Unchanged in Final Model#’(#) = Diameter (No. barrels) Updated Information in Final Model
2159 6560 6558 655965572040865612196
5342 5511 5577 5850 60175791571656875572
ExistingGrade
ExistingModel HGL
FinalModel HGL

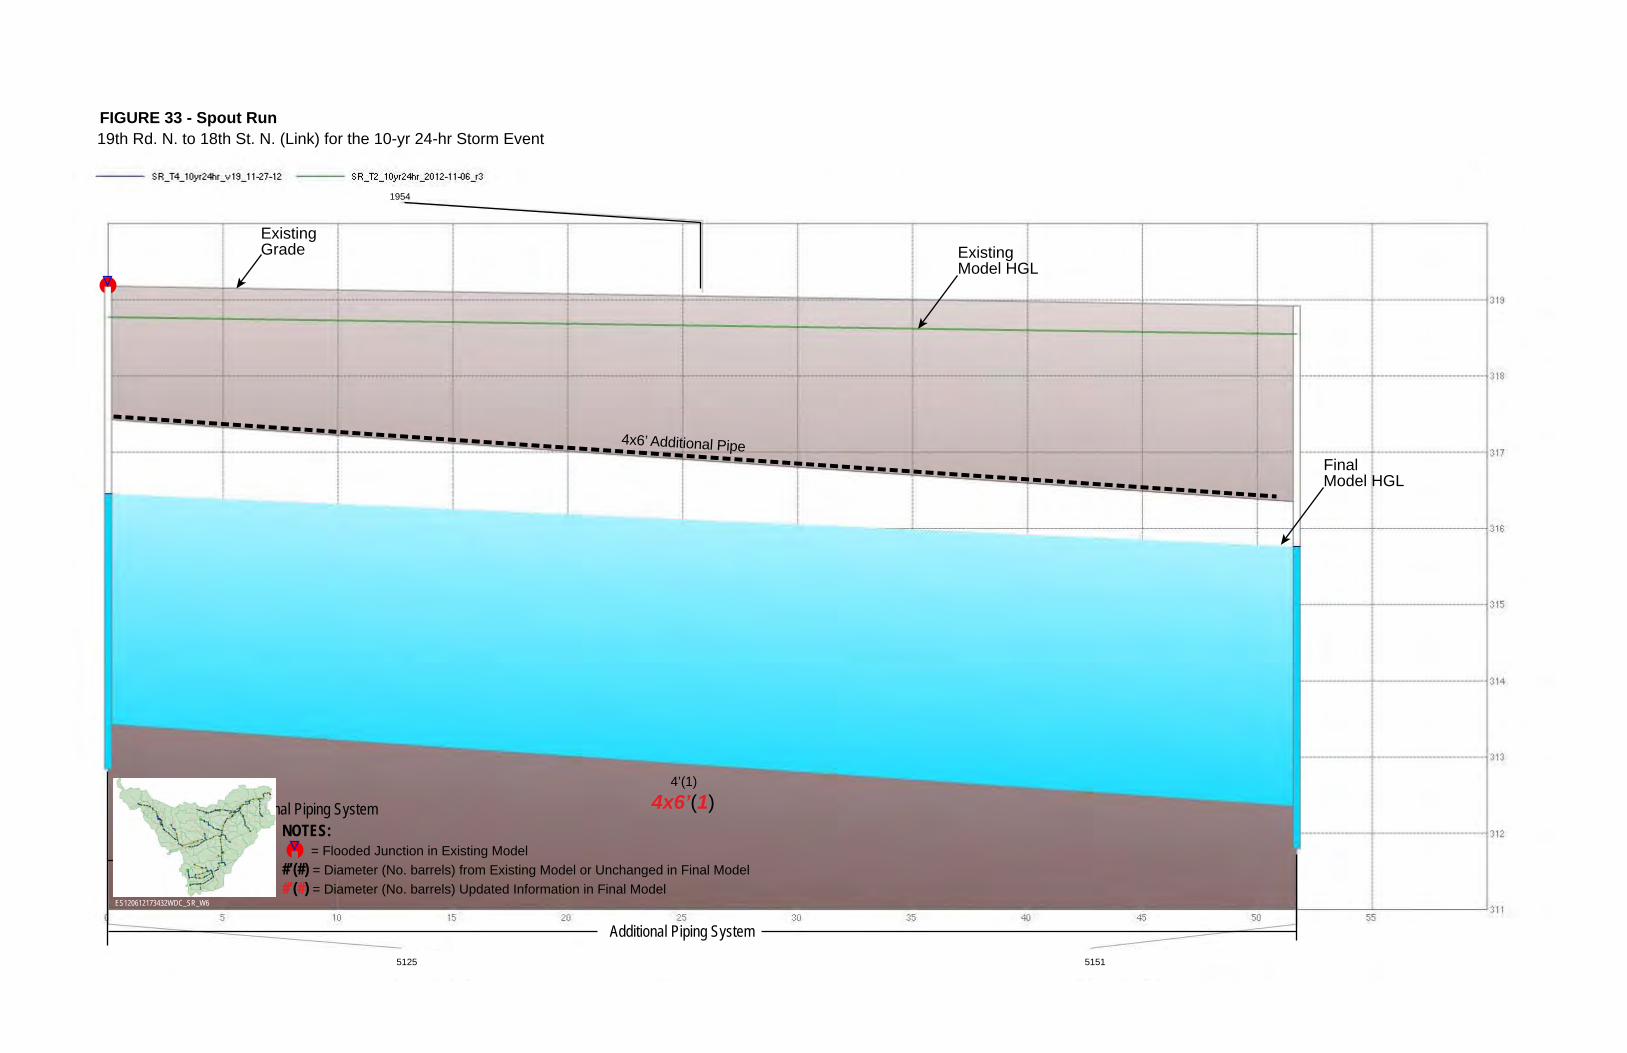
FIGURE 33 - Spout Run19th Rd. N. to 18th St. N. (Link) for the 10-yr 24-hr Storm Event
4x6’(1)4’(1)
ES120612173432WDC_SR_W6
NOTES: = Flooded Junction in Existing Model #’(#) = Diameter (No. barrels) from Existing Model or Unchanged in Final Model#’(#) = Diameter (No. barrels) Updated Information in Final Model
Additional Piping System
4x6’ Additional Pipe
1954
5125 5151
ExistingGrade
Additional Piping System
ExistingModel HGL
FinalModel HGL

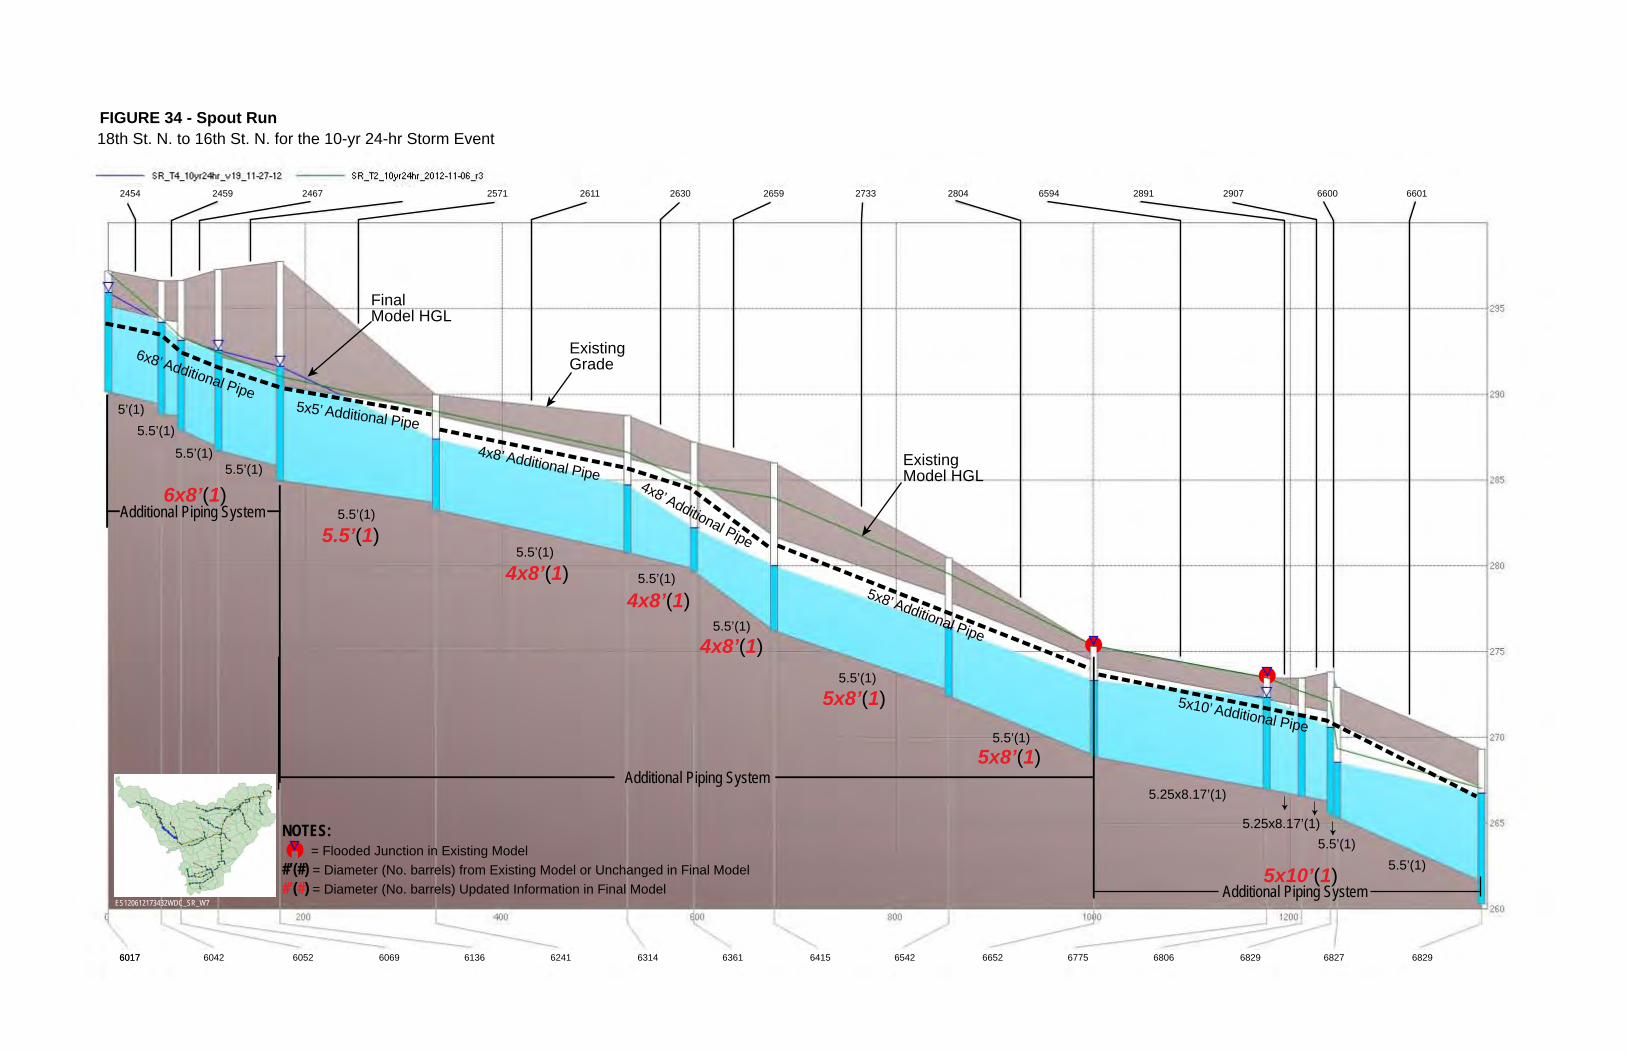
FIGURE 34 - Spout Run18th St. N. to 16th St. N. for the 10-yr 24-hr Storm Event
6x8’(1)
4x8’(1)
4x8’(1)
5x8’(1)
5x8’(1)
5x10’(1)
4x8’(1)
5.5’(1)
5’(1)
5.5’(1)
5.5’(1)
5.5’(1)5.5’(1)
5.5’(1)
5.25x8.17’(1)5.25x8.17’(1)
5.5’(1)
5.5’(1)
5.5’(1)
5.5’(1)
5.5’(1)5.5’(1)
ES120612173432WDC_SR_W7
NOTES: = Flooded Junction in Existing Model #’(#) = Diameter (No. barrels) from Existing Model or Unchanged in Final Model#’(#) = Diameter (No. barrels) Updated Information in Final Model Additional Piping System
6x8’ Additional Pipe5x5’ Additional Pipe
4x8’ Additional Pipe
5x8’ Additional Pipe
5x10’ Additional Pipe
4x8’ Additional Pipe
2454 2630 6594 66016600290728912804273326592611257124672459
60176017 6052 6361 6829 6829 68276806677566526542641563146241613660696042
ExistingGrade
Additional Piping System
ExistingModel HGL
FinalModel HGL
Additional Piping System


FIGURE 35 - Spout RunN. Taylor St. from 19th Rd. N. to 16th St. N. for the 10-yr 24-hr Storm Event
3.5’(2)
3.5’(2)
3.5’(2)
3.5’(2)
3.5’(2)
3’(2)3’(2)
3’(1)
3’(1)
3’(1)
ES120612173432WDC_SR_W8
NOTES: = Flooded Junction in Existing Model #’(#) = Diameter (No. barrels) from Existing Model or Unchanged in Final Model#’(#) = Diameter (No. barrels) Updated Information in Final Model
2317 2443 65916595659625132473243824242404
5681 6077 681966406407613860276021599959795798
ExistingModel HGL
ExistingGrade
FinalModel HGL

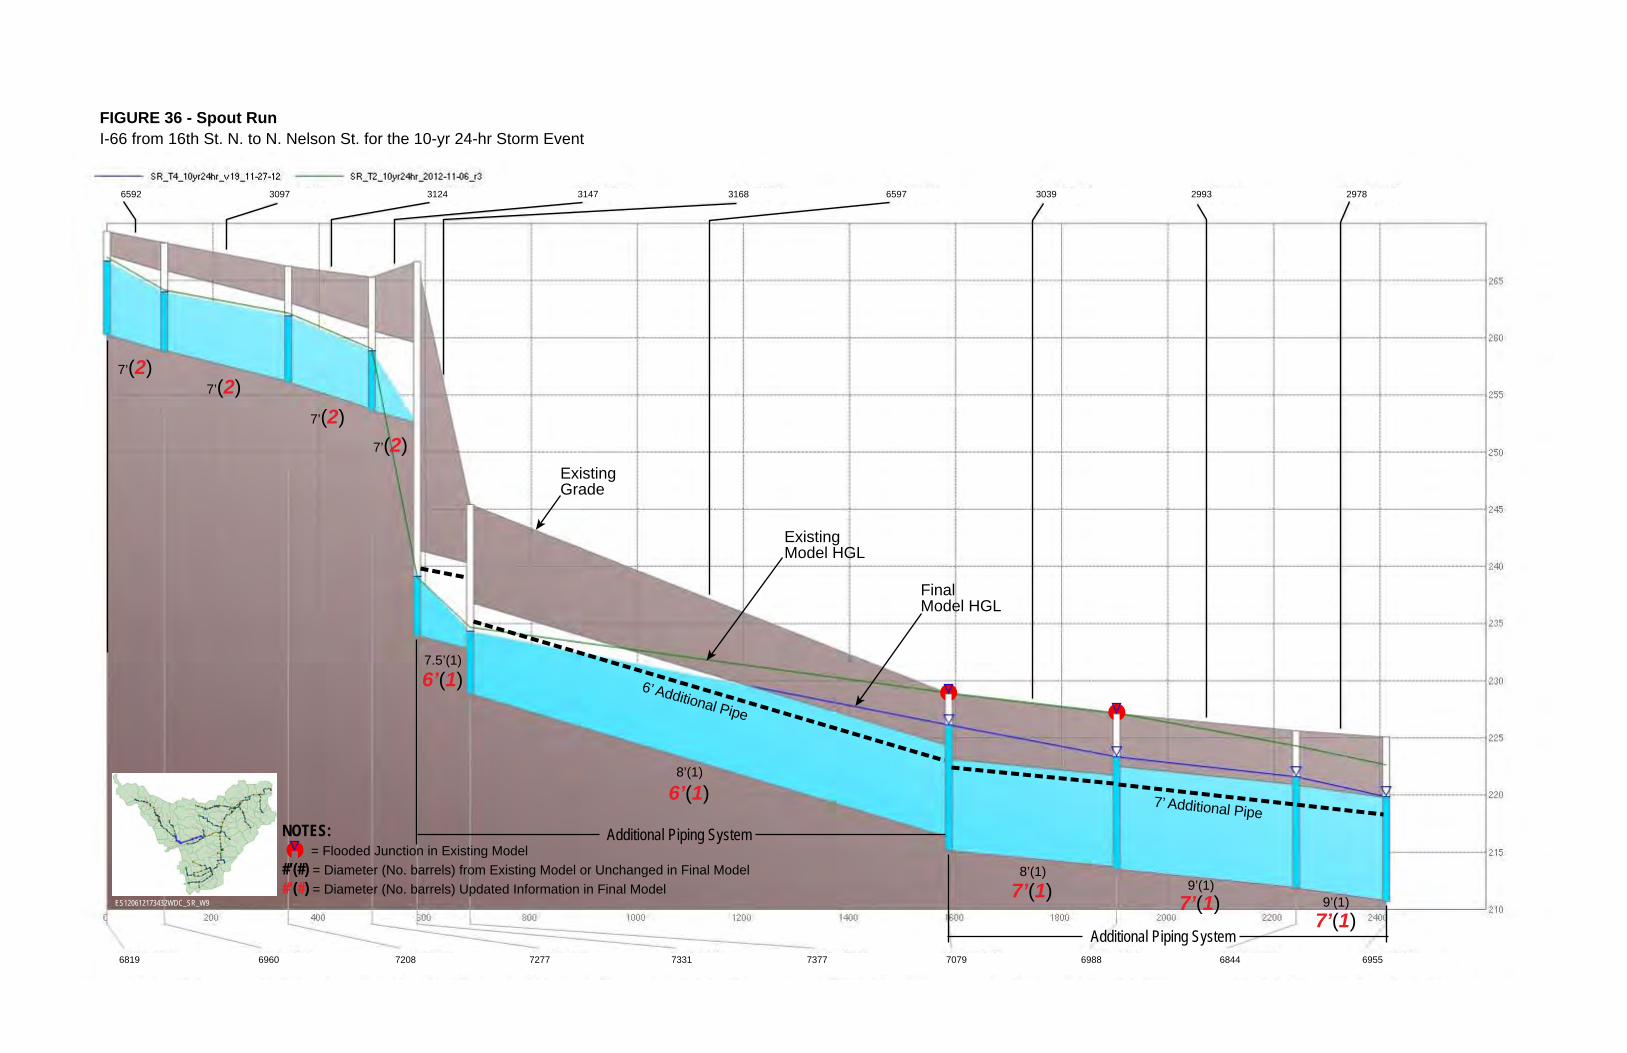
FIGURE 36 - Spout RunI-66 from 16th St. N. to N. Nelson St. for the 10-yr 24-hr Storm Event
6’(1)
6’(1)
7’(1)7’(1)7’(1)
7’(2)
7’(2)7’(2)
7’(2)
7.5’(1)
8’(1)
9’(1)9’(1)
8’(1)ES120612173432WDC_SR_W9
NOTES: = Flooded Junction in Existing Model #’(#) = Diameter (No. barrels) from Existing Model or Unchanged in Final Model#’(#) = Diameter (No. barrels) Updated Information in Final Model
Additional Piping System
7’ Additional Pipe
6’ Additional Pipe
6592 3168 2978299330396597314731243097
6819 7331 6844 6955698870797377727772086960
ExistingGrade
Additional Piping System
ExistingModel HGL
FinalModel HGL


FIGURE 37 - Spout RunI-66 and Kirkwood Rd. to 18th St. N. for the 10-yr 24-hr Storm Event
7’(1)
7’(1)7’(1)7’(1)
7’(1)7’(1)
8’(2)
8’(2)8’(2)
9’(1)
9’(1)9’(1)9’(1)
9’(1)9’(1)
ES120612173432WDC_SR_W11
NOTES: = Flooded Junction in Existing Model #’(#) = Diameter (No. barrels) from Existing Model or Unchanged in Final Model#’(#) = Diameter (No. barrels) Updated Information in Final Model
7’ Additional Pipe
7’ Additional Pipe
2977 2793 25076 25077250726721275228692931
6955 6546 24828 61482482965416568663067626874
ExistingGrade
Additional Piping System
ExistingModel HGL
FinalModel HGL

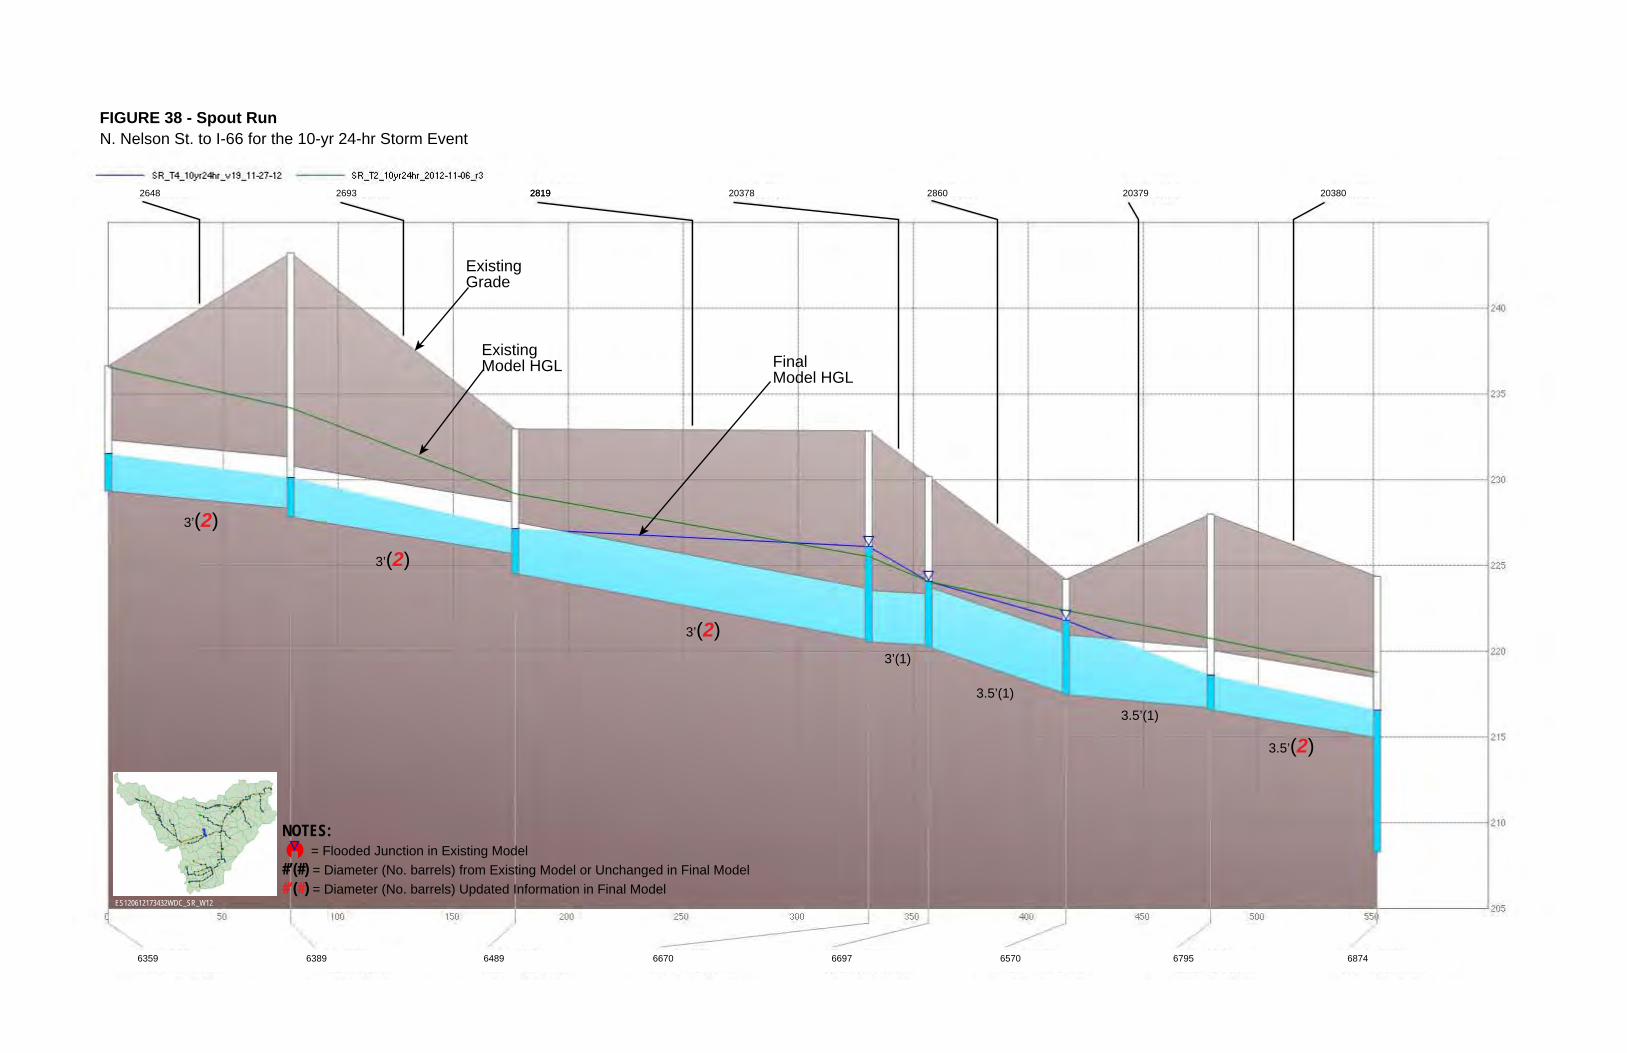
FIGURE 38 - Spout RunN. Nelson St. to I-66 for the 10-yr 24-hr Storm Event
3.5’(2)
3’(2)
3’(2)
3’(2)
3.5’(1)3.5’(1)
3’(1)
ES120612173432WDC_SR_W12
NOTES: = Flooded Junction in Existing Model #’(#) = Diameter (No. barrels) from Existing Model or Unchanged in Final Model#’(#) = Diameter (No. barrels) Updated Information in Final Model
2648 2693 2819 20378 2860 20379 203802819
6359 6389 6489 6570 6795 687466976670
ExistingModel HGL
ExistingGrade
FinalModel HGL


FIGURE 39 - Spout RunI-66 from 18th St. N. to Kirkwood Rd. (West Pipe) for the 10-yr 24-hr Storm Event
6x10’(1)
6x10’(1)6x10’(1)6x10’(1)
6x10’(1)6x10’(1)
8’(1)
9’(1)
Stream
9’(1)9’(1)
9’(1)
9’(1)
ES120612173432WDC_SR_C1
NOTES: = Flooded Junction in Existing Model #’(#) = Diameter (No. barrels) from Existing Model or Unchanged in Final Model#’(#) = Diameter (No. barrels) Updated Information in Final Model
6x10’ Additional Pipe
25078 25082 2031025084250832508125080
6148 24843 496951142484454092483124830
ExistingGrade
Additional Piping System
ExistingModel HGL
FinalModel HGL


FIGURE 40 - Spout Run20th St. N. to 19th St. N. for the 10-yr 24-hr Storm Event
3’(2)
3’(2)
3’(2)
3’(2)
3’(2)3’(2)3’(2)
3’(2)3’(2)
3’(2)
3’(2)3’(1)
3’(1)3’(1)
3’(1)
ES120612173432WDC_SR_C3
NOTES: = Flooded Junction in Existing Model #’(#) = Diameter (No. barrels) from Existing Model or Unchanged in Final Model#’(#) = Diameter (No. barrels) Updated Information in Final Model
3.5’ Additional Pipe
3.5’(1)
2027 2212 2292227566856683668221382140214121342342623425234246646
5197 5469 5719 57395720571856645596546654685462543554082351253115260
ExistingGrade
ExistingModel HGL
FinalModel HGL
AdditionalPiping System

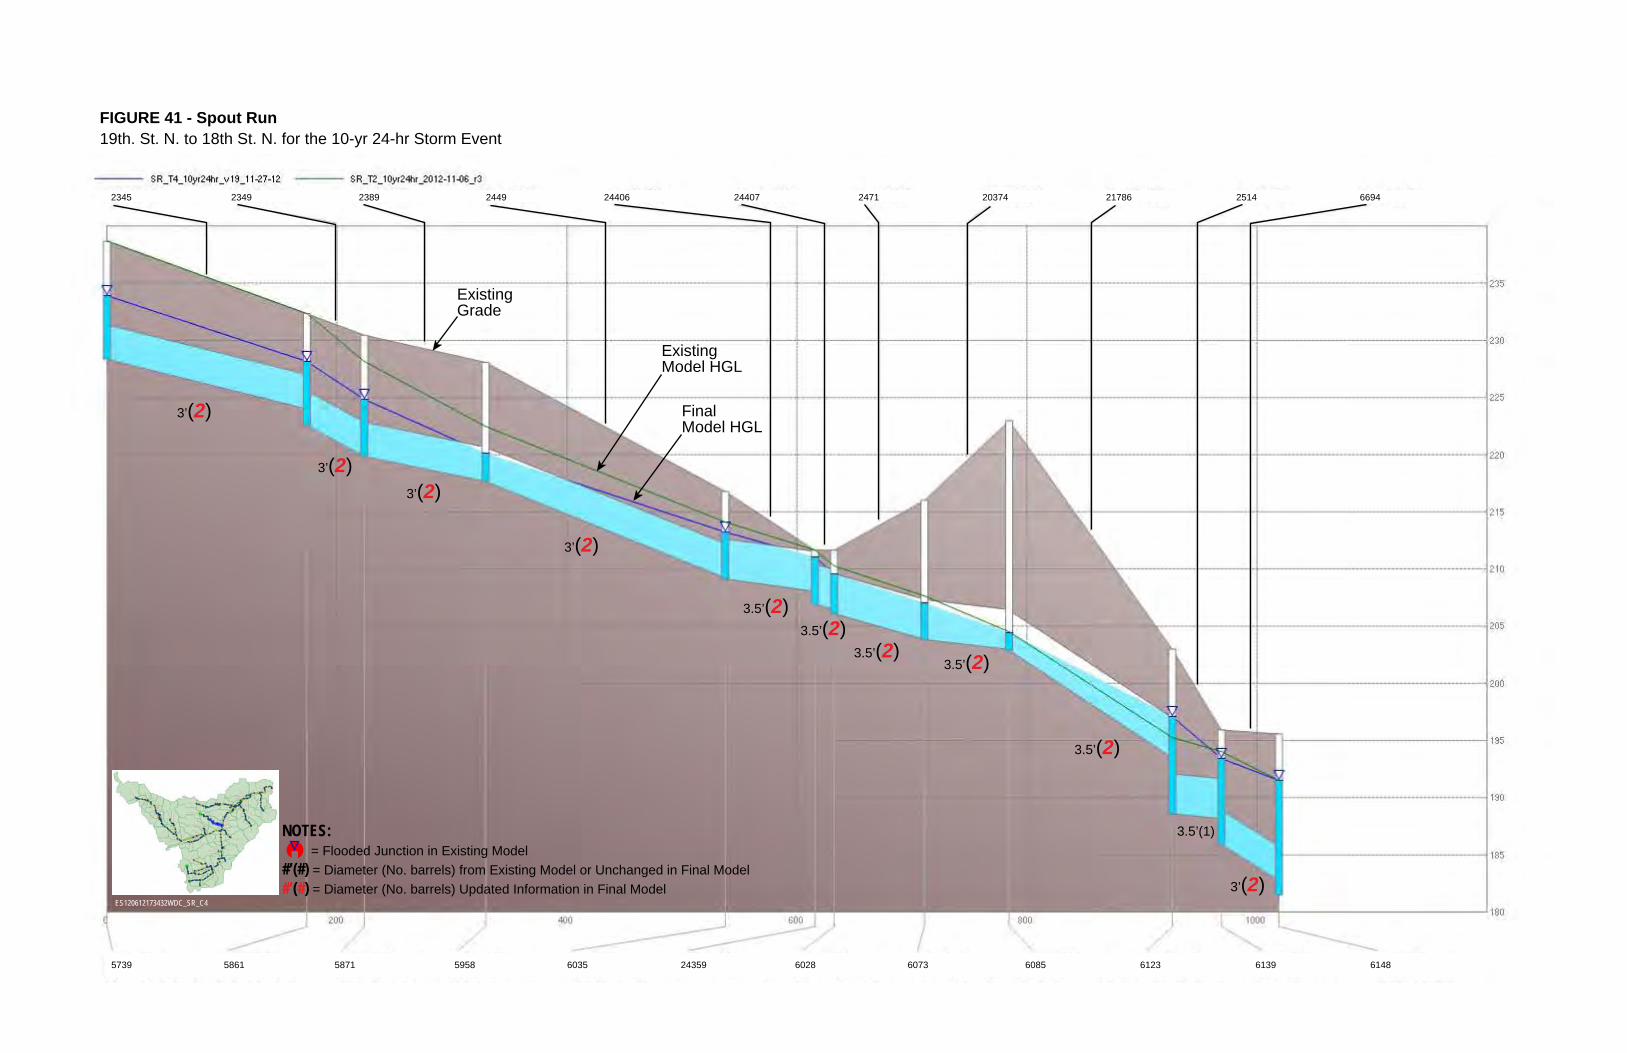
FIGURE 41 - Spout Run19th. St. N. to 18th St. N. for the 10-yr 24-hr Storm Event
3.5’(2)
3.5’(2)
3.5’(2)
3.5’(2)3.5’(2)
3’(2)
3’(2)
3’(2)
3’(2)3’(2)
3.5’(1)
ES120612173432WDC_SR_C4
NOTES: = Flooded Junction in Existing Model #’(#) = Diameter (No. barrels) from Existing Model or Unchanged in Final Model#’(#) = Diameter (No. barrels) Updated Information in Final Model
24406 21786 66942514203742471244072345 244923892349
5739 5958 6073 6148613961236085602824359603558715861
ExistingGrade
ExistingModel HGL
FinalModel HGL

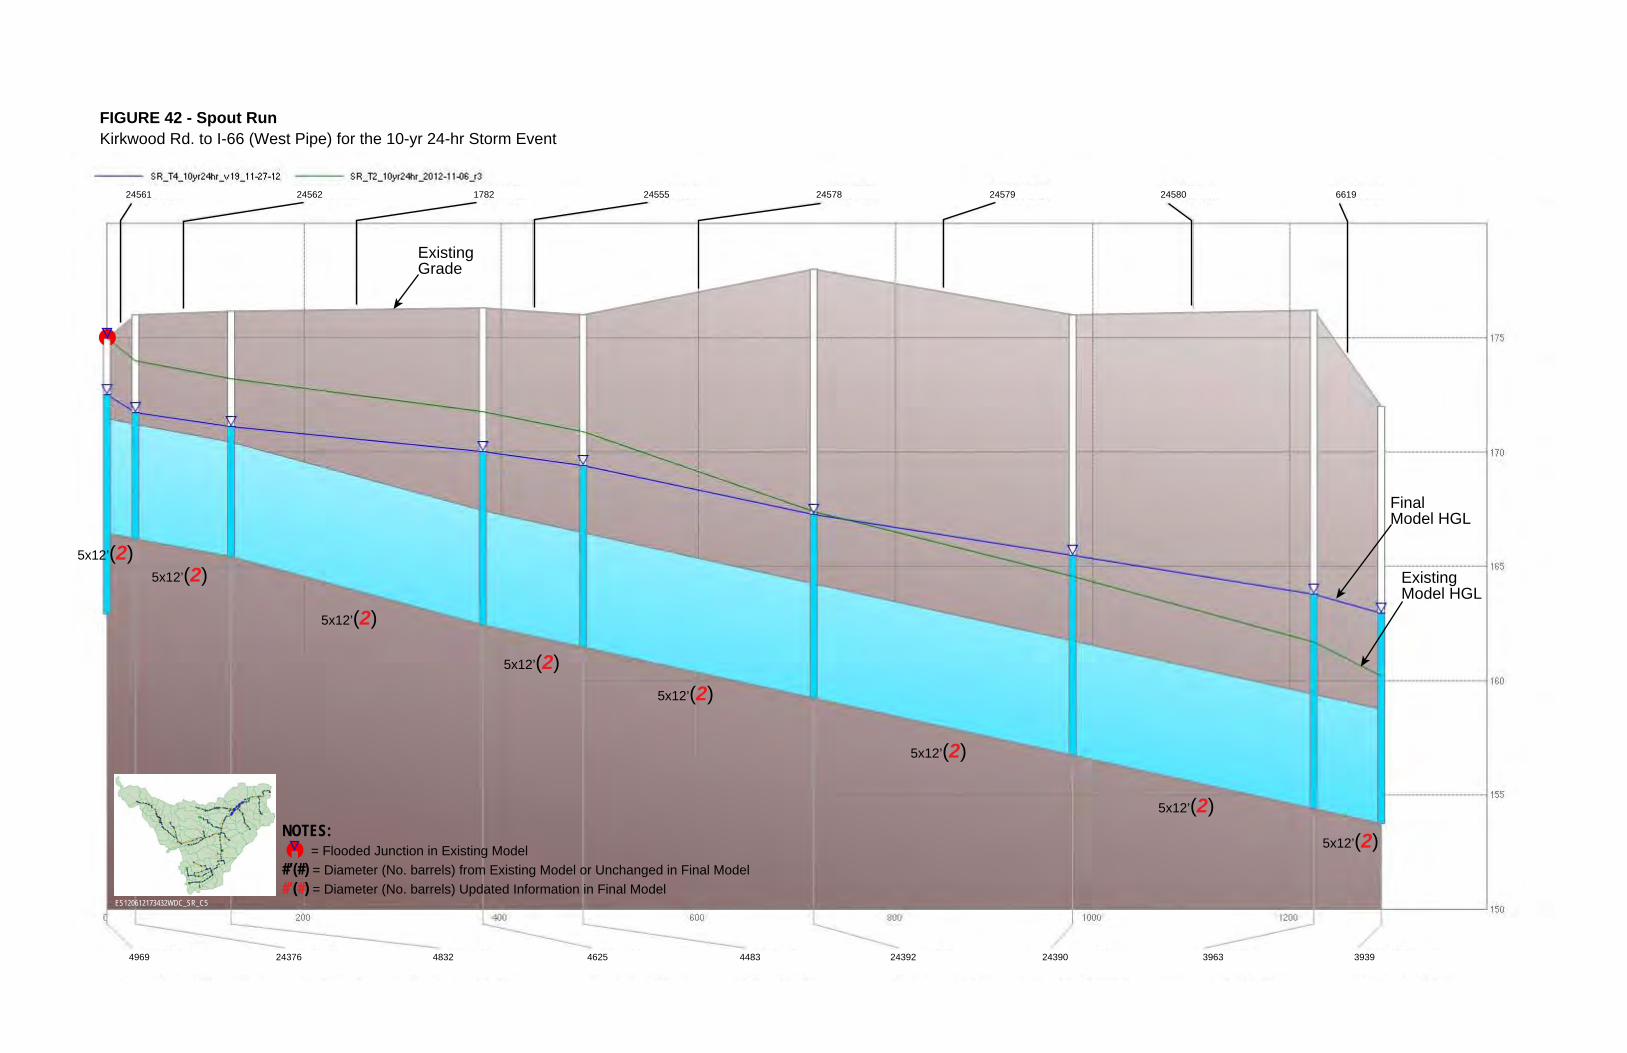
FIGURE 42 - Spout RunKirkwood Rd. to I-66 (West Pipe) for the 10-yr 24-hr Storm Event
5x12’(2)5x12’(2)
5x12’(2)
5x12’(2)5x12’(2)
5x12’(2)5x12’(2)
5x12’(2)
ES120612173432WDC_SR_C5
NOTES: = Flooded Junction in Existing Model #’(#) = Diameter (No. barrels) from Existing Model or Unchanged in Final Model#’(#) = Diameter (No. barrels) Updated Information in Final Model
24561 24578 24579 66192458024555178224562
4969 4483 3963 393924390243924625483224376
ExistingGrade
ExistingModel HGL
FinalModel HGL


FIGURE 43 - Spout RunN. Quincy St. to N. Monroe St. for the 10-yr 24-hr Storm Event
3’(2)
3’(2)3’(2)
3’(2)3’(2)
3’(2)
3’(2)3’(2)
ES120612173432WDC_SR_C6
NOTES: = Flooded Junction in Existing Model #’(#) = Diameter (No. barrels) from Existing Model or Unchanged in Final Model#’(#) = Diameter (No. barrels) Updated Information in Final Model
23355 1677 169723236232351639163023356
4348 4527 4650 46632336546034540441923454
ExistingGrade
ExistingModel HGL
FinalModel HGL


FIGURE 44 - Spout RunN. Monroe St. to Kirkwood Rd. for the 10-yr 24-hr Storm Event
3’(2)3’(2)
3’(2)
3’(2)3’(2)
3’(2)
3’(2)
3’(1)
3’(1)
ES120612173432WDC_SR_C7
NOTES: = Flooded Junction in Existing Model #’(#) = Diameter (No. barrels) from Existing Model or Unchanged in Final Model#’(#) = Diameter (No. barrels) Updated Information in Final Model
4’ Additional Pipe4.5’ Additional Pipe
4’(1) 4.5’(1)
1695 1655 1611 221631589157315792442924428
4663 4497 434144584434442844424565242734611
ExistingGrade
Additional Piping System
ExistingModel HGL
FinalModel HGL


FIGURE 45 - Spout RunLee Hwy from N. Kenmore St. to Kirkwood Rd. for the 10-yr 24-hr Storm Event
3’(1)
3’(1)
3’(1)
3.5’(1)
4.5’(1)4.5’(1)
3.5’(1)
3.5’(1)3.5’(1)
3.5’(1)
ES120612173432WDC_SR_C8
NOTES: = Flooded Junction in Existing Model #’(#) = Diameter (No. barrels) from Existing Model or Unchanged in Final Model#’(#) = Diameter (No. barrels) Updated Information in Final Model
4.5’ Additional Pipe
5’ Additional Pipe 6’ Additional Pipe
4.5’(1)
4.5’(1)
5’(1) 6’(1)
4.5’(1) 4.5’(1)
4.5’(1)
1525 1559 16061605159815771565153715201522
4350 4399 448344804471444044154372434143444340
Additional Piping System
Additional Piping System

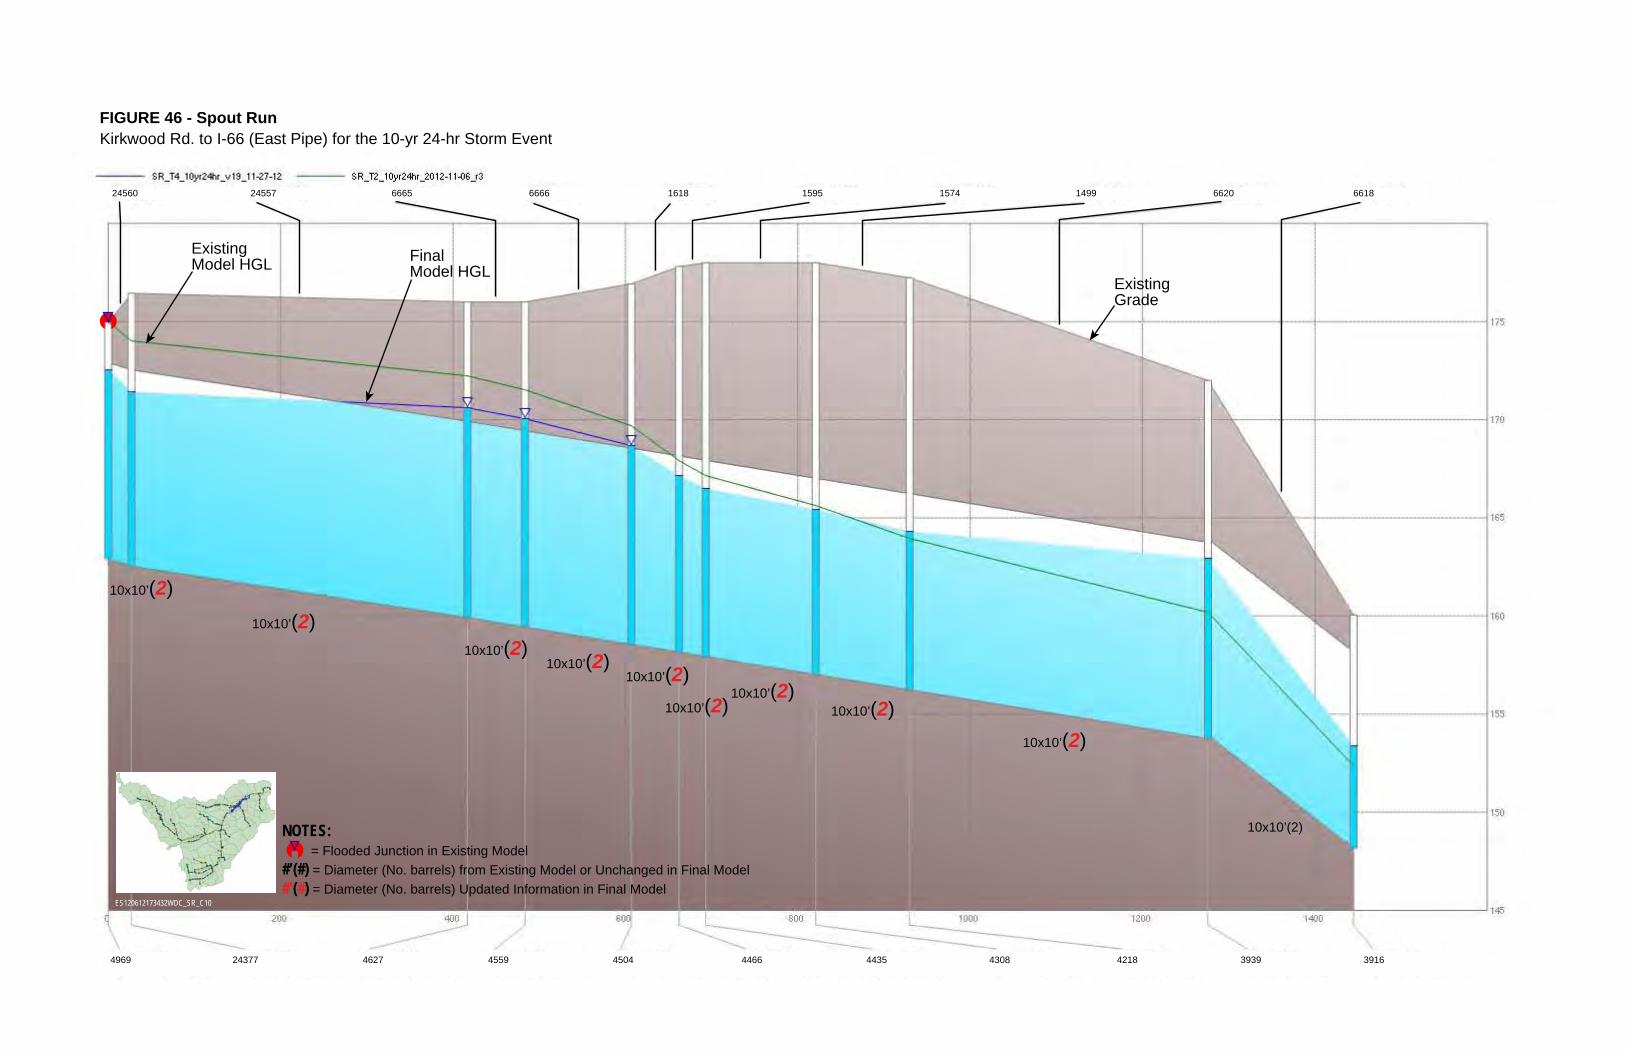
FIGURE 46 - Spout RunKirkwood Rd. to I-66 (East Pipe) for the 10-yr 24-hr Storm Event
10x10’(2) 10x10’(2)10x10’(2)
10x10’(2)
10x10’(2)10x10’(2)
10x10’(2)
10x10’(2)10x10’(2)
10x10’(2)
ES120612173432WDC_SR_C10
NOTES: = Flooded Junction in Existing Model #’(#) = Diameter (No. barrels) from Existing Model or Unchanged in Final Model#’(#) = Diameter (No. barrels) Updated Information in Final Model
24560 1618 6620 66181499157415956666666524557
4969 4466 3916393942184308443545044559462724377
ExistingGrade
ExistingModel HGL Final
Model HGL

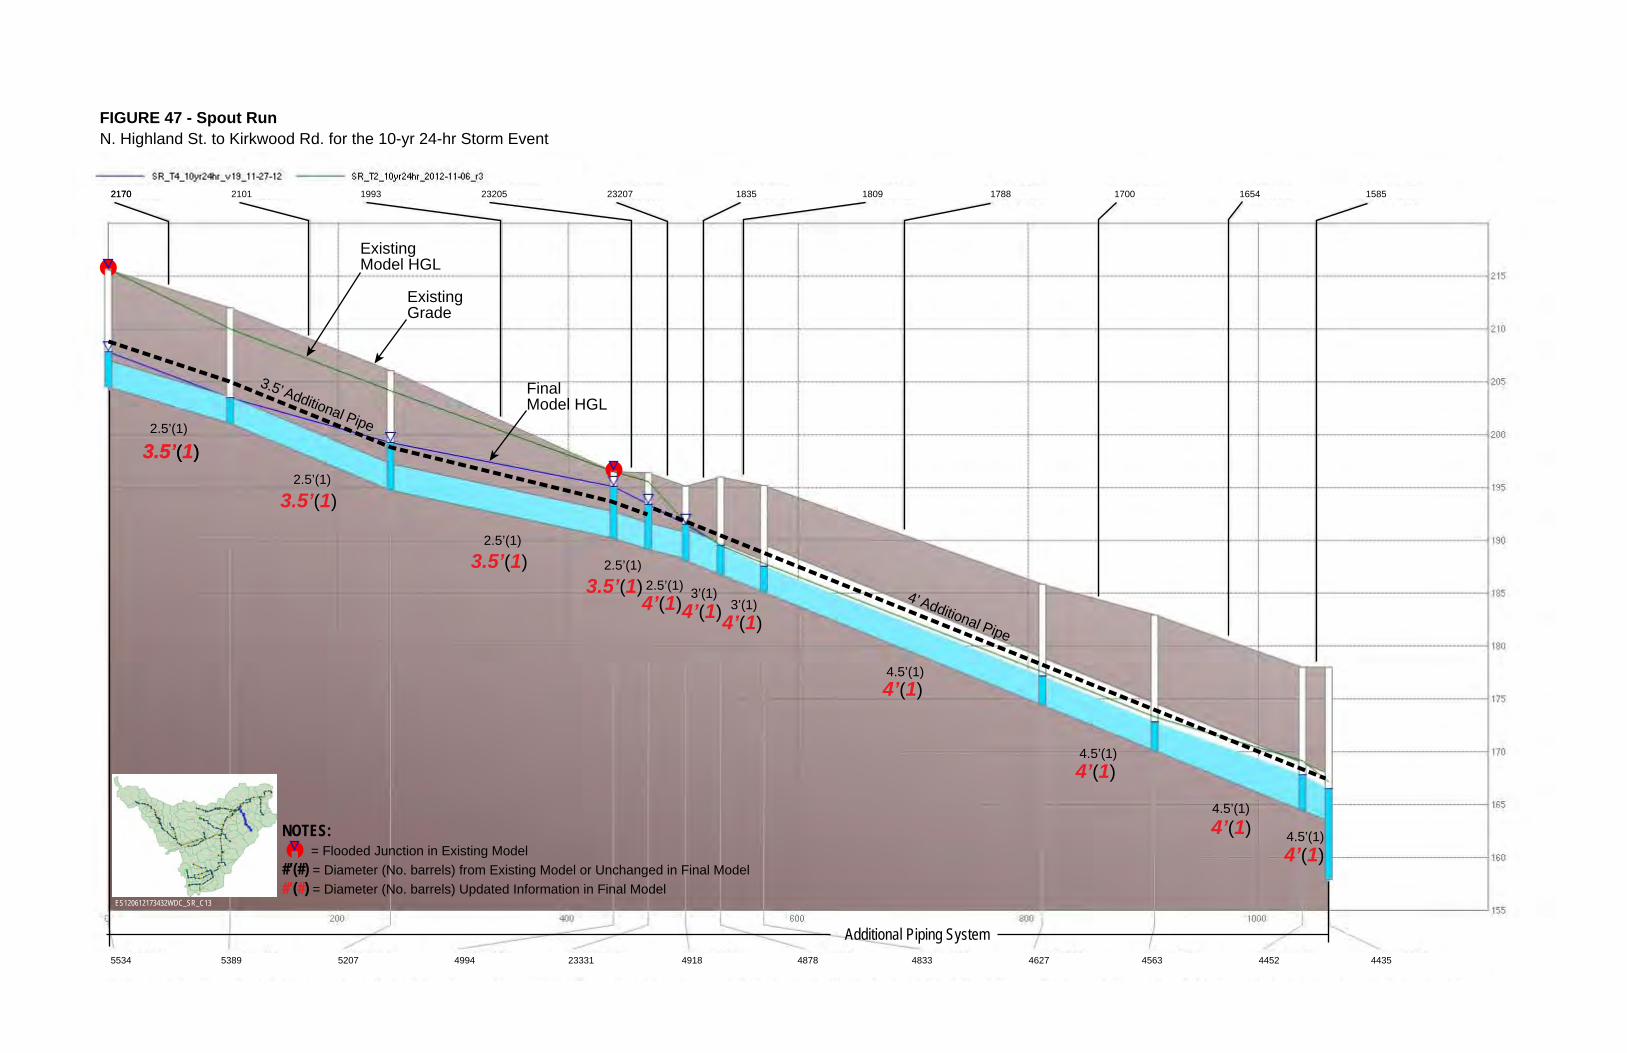
FIGURE 47 - Spout RunN. Highland St. to Kirkwood Rd. for the 10-yr 24-hr Storm Event
2.5’(1)
2.5’(1) 3’(1) 3’(1)
2.5’(1)
4.5’(1)
4.5’(1)4.5’(1)
4.5’(1)
2.5’(1)
2.5’(1)
ES120612173432WDC_SR_C13
NOTES: = Flooded Junction in Existing Model #’(#) = Diameter (No. barrels) from Existing Model or Unchanged in Final Model#’(#) = Diameter (No. barrels) Updated Information in Final Model
3.5’ Additional Pipe
4’ Additional Pipe
3.5’(1) 3.5’(1)
4’(1) 4’(1) 4’(1)
4’(1)
4’(1) 4’(1)
4’(1)
3.5’(1) 3.5’(1)
3.5’(1)
21702170 23207 1585165417001788180918352320519932101
5534 4878 4452 4435456346274833491823331499452075389
ExistingGrade
Additional Piping System
ExistingModel HGL
FinalModel HGL


STORMWATER CAPACITY ANALYSIS FOR SPOUT RUN WATERSHED: DESIGN ITERATIONS, ARLINGTON COUNTY, VIRGINIA
141
5. Summary The focus of this task was to develop solutions that eliminate flooding in the model during two selected storm events: the June 2006 storm event and the 10yr-24hr SCS Type II storm. Though specific model solutions were developed, the goal of the task was to understand what design capacity may be necessary to minimize the risk of flooding during similar rainfall events.
The hydraulic modeling results presented in this TM should be reviewed with the understanding that several assumptions were made to fill data gaps, primarily assumptions about pipe inverts, rim elevations, and inlet conditions. Additionally, when solutions were developed, the number of barrels and/or pipe sizes was the primary parameters adjusted. Implementation of these or similar solutions will not guarantee the elimination of flooding in the watershed.
Because of the assumptions applied to the model, it is important to note that all results are presented from a modeling perspective, not a design perspective. Assumptions should be verified and may need adjusting during the design stage of all improvement projects. Moreover, there are many factors related to scoping and implementing a project that will need to be taken into account with the model results when improvement projects are considered. Additionally, even after completion of the improvement projects, the risk of flooding is never completely eliminated.
Results of the design iterations show that flooding in the model during the June 2006 storm event may be eliminated by adding capacity to about 15 percent of the modeled network. Eliminating flooding in the model during the 10yr-24hr SCS Type II storm requires changes throughout the network. The solution identified in the TM requires adding capacity to more than 62 percent of the modeled pipe network.


Capacity Analysis