strategic coordination in forecasting. an experimental …
TRANSCRIPT
ISSN: 1439-2305
Number 195 – March 2014
STRATEGIC COORDINATION IN
FORECASTING. AN EXPERIMENTAL
STUDY
Kilian Bizer, Lukas Meub, Till Proeger, Markus Spiwoks

1
STRATEGIC COORDINATION IN FORECASTING.
AN EXPERIMENTAL STUDY
Kilian Bizer a, Lukas Meub a, Till Proeger a,*, Markus Spiwoks b
a Faculty of Economic Sciences, Chair of Economic Policy and SME Research, University of Goettingen.
b Faculty of Business Administration, Ostfalia University of Applied Sciences Wolfsburg
Abstract
Reputational herding has been considered as a driving force behind economic and financial
forecasts clustered around consensus values. Strategic coordination can consequently explain
poor performances of prediction markets as resulting from the distinct incentives that
forecasters face. While this notion has been considered theoretically and empirically, the
underlying behavioral working mechanisms have not yet been described. We thus put forth an
exploratory experiment on the emergence and robustness of coordination in a forecasting
setting implementing contradictory incentives for accurate forecasts and coordination.
Forecasts are shown to be inaccurate and biased toward current values. This in turn has
subjects aiming at coordination benefits. Predominantly, coordination is achieved through the
risk-dominant equilibrium as the game proceeds. Once established, coordination is fairly
stable and adds to overall welfare. Our results support the assumption of rational herding as a
driving force for predictions of poor accuracy that are systematically biased towards focal
points.
Keywords: coordination; incentives; laboratory experiment; reputational herding; sunspot
equilibrium
JEL classification: C90; D03; D83; G17
* Corresponding author: Till Proeger, Faculty of Economic Sciences, Chair of Economic Policy and SME
Research, University of Goettingen, Platz der Goettinger Sieben 3, 37073, Goettingen, Germany, e-mail:
[email protected], phone: +49 551 39 10173; fax: :+49 551 39 19558.

1
1. INTRODUCTION
Economic actors regularly coordinate their decisions in a broad range of settings, within
which a common course of action yields higher payoffs. A widely discussed area of
coordinated actions can be found on markets for economic and financial forecasting. It has
been convincingly argued that prediction markets are particularly prone to rational herding,
which manifests in a bias towards consensus forecasts in individual predictions. By
conforming to the majority of other agents, individuals benefit from concealing their inability
to provide accurate forecasts. Building on John Maynard Keynes’ writings on financial
markets, Scharfstein and Stein (1990) suggest in their seminal paper that forecasters generate
a “sharing-the-blame” effect by strategically coordinating their predictions. Accordingly,
analysts rationally decide against the truthful reporting of private information, rather adapting
to a common consensus to be perceived as being more capable. In this way, the blame for
false predictions can be avoided by pointing to the communities’ overall inability of correctly
anticipating actual developments.
The systematic, strategic overweighing of publicly available information has subsequently
been modelled theoretically and investigated empirically in a considerable number of studies.
Most recently, Ottaviani and Sorensen (2006b) have formalized the conception in a theory of
reputational cheap talk, whereby forecasters aim at improving their reputation by pretending
to principals to be well informed. This leads to a strong bias towards the overall consensus
forecasts and consequently to inaccurate predictions due to the strategic non-disclosure of
private information, the ultimate result being that “paradoxically, the desire of analysts to be
perceived as good forecasters turns them into poor forecasters” (Ottaviani and Sorensen,
2006b, p.443). This concept has been tested empirically, yielding ambiguous results. Most
prominently, Hong et al. (2000) suggest that particularly less experienced analysts seek safety
in consensus forecasts, while similarly, Lamont (2002) and Clement and Tse (2005) find
forecasts to be clustered around consensus values. By contrast, building upon models of anti-
herding, studies such as those by Batchelor and Dua (1990), Zitzewitz (2001a; b) and
Bernhardt et al. (2006) present evidence in favor of strategic differentiation in prediction
markets.
While these results are contradictory, a compromising interpretation has been put forth by
Marinovic et al. (2010), who argue that the lack of strong competition and ex-post evaluations
of forecasting accuracy leads prediction markets to quickly deteriorate to pure beauty
2
contests. Thereby, herding on consensus values becomes predominant as analysts are
primarily rewarded for their ability to anticipate the expectations and choices of all other
participants. Forecasters then cease their predictive efforts and resort to merely guessing the
actions of others, thus striving for coordination. Therefore, the distinct structure of incentives
might explain why herding on consensus values is more or less pronounced in prediction
markets for different economic or financial key figures.
Under these conditions, forecasting that maximizes individual reputation can be interpreted as
a coordination problem in which players minimize deviations from the average prediction by
agreeing upon a common focal point. While this notion has been discussed extensively in
previous studies, no behavioral study to date has explored strategic coordination in a
forecasting setting. Studying strategically biased forecasts experimentally could provide a
useful empirical insight into the coordination patterns of independent agents in a forecasting
environment. Given that underlying mechanisms of coordination are inaccessible from a
purely theoretical perspective or solely through an evaluation of time series data, a controlled
laboratory environment might provide additional evidence. Consequently, we run an
exploratory experimental study to provide behavioral insight into analysts’ coordinative
behavior in a forecasting setting.
We build our investigation on two distinct strands of literature in experimental economics.
Firstly, we use recent experiments on forecasting as our working horse, whereby payoff-
maximization demands that subjects correctly interpret fundamentals and make accurate
predictions. These settings (see e.g. Becker et al., 2008) primarily focus on showing subjects’
inability to rationally process graphical or statistical information, which is interpreted as a
refutation of the rational expectation hypothesis. Secondly, we implement a coordination
mechanism as an alternative mode of generating payoffs. This approach follows a large body
of experimental studies that consider rationality in coordination games. Based on Duffy and
Fisher’s (2005) seminal paper, recent studies have considered the effectiveness of random
focal points, so-called sunspots1, in fostering coordination between subjects. Connecting these
two experimental approaches, we are able to study if and how subjects coordinate in
forecasting games.
1 Duffy and Fisher (2005) explain the term “sunspot” as originating from William S. Jevons, who assumed solar
activity to be a considerable influence on economic activity. In the modern meaning, it is referred to as a random
variable that is unrelated to the fundamentals yet nevertheless fosters coordination.

3
While the basic structure of our setting somewhat resembles the experimental approach to
reputational herding in Bedke et al. (2009), it differs by implementing an actual forecasting
task and an endogenous coordination mechanism. Subjects are asked to perform judgmental
forecasting of future values based on the graphical and numerical depiction of several
determinants. Due to the complexity and interaction of the underlying fundamentals
determining the values to be forecast, accurate predictions – albeit the first best solution – are
effectively hard to achieve. Frustration with the task might prompt subjects to increasingly
consider the alternative strategy, i.e. coordination on a common focal point, which also leads
to a payoff in each period. While theoretically all values within the range of possible forecasts
could be used to coordinate, we implement a unique payoff and risk dominant equilibrium at
the respective rounds’ current value. Uniqueness of this particular efficient coordination
regime is achieved by implementing costs for forecasts that deviate from the focal point. In
societies of eight, all players are also randomly matched to groups of two, who are able to
communicate via chat. All fundamentals, prior predictions and earnings of other players are
common knowledge.
Within this framework, we investigate whether subjects succeed in agreeing on focal points,
even when the task of forecasting future values is conflicting to coordination. We can thus
explore four particular aspects. Firstly, we aim at analyzing forecasting accuracy and the
predictive quality of the rational expectation hypothesis. Secondly, we assess whether subjects
in a forecasting setting succeed in coordinating on external focal points. Thirdly, we
investigate the robustness of coordination once it is established and finally, we discuss the
welfare implications of our results.
Overall, we find that subjects fail to make forecasts in line with the rational expectation
hypothesis. Accordingly, forecast accuracy is poor, even when subjects do not aim at
coordination. However, coordination on the sunspot equilibrium constituted by current values
increases strongly over periods and is fairly successful overall. The coordination is found to
be efficient and quite robust, i.e. once subjects achieve coordination on the sunspot at minimal
costs, they tend not to deviate from this strategy. Along with dismal performance in
forecasting yet increasing cooperation, subjects’ effort levels and confidence in the accuracy
of their predictions decreases. It can thus be assumed that frustration with the forecasting task
fosters coordination. While total welfare is considerably lower than the maximum, for a
number of subjects it approaches the benchmark representing efficient coordination as the
game proceeds.

4
The remainder of this paper is organized as follows. Section 2 reviews the literature related to
our study. Section 3 presents the game and our experimental design. The results are presented
in section 4, before section 5 offers a conclusion.

5
2. RELATED LITERATURE
The forecasting behavior of financial and economic analysts has been discussed extensively
from various scientific angles.2 While the sheer volume of studies precludes a comprehensive
review, broad trends upon which our study builds can be outlined.
Starting in the early-1990s, two closely related strands of literature have evolved that apply
the concept of analyst’s rational herding. Primarily, based on the seminal contributions by
Welch (1992), Bikhchandani et al. (1992) and Banerjee (1992), the concept of informational
cascades has become widely discussed. These authors implement a sequential decision-
making regime in which the disregarding of private information in the face of potentially
conflicting public information becomes rational in certain situations. Bayesian updating has
agents rationally interpreting the weights of private and public information and deciding
accordingly. Thus, when aggregate public information becomes overwhelming, a cascade
situation develops and the single private information is rationally discarded by all following
agents in the decision sequence (Graham, 1999). The private information of these players is
not revealed by their decisions and information aggregation becomes insufficient. Starting
with the seminal contribution by Anderson and Holt (1997), experimental studies have
documented subjects’ failure to rationally make use of private and public information.
Thereby, subjects display a tendency to cling to private information that systematically
contradicts rational behavior derived from perfect Bayesian updating (Weizsäcker, 2010
2 A generalist theoretical perspective on economic aspects of forecasting is given in Elliot and Timmermann’s
(2008) literature review. The authors encompass the large number of empirical and theoretical studies within
several discussions on forecasting. More specifically and closer to our investigation is Devenov and Welch
(1996), who offer an overview of theoretical explanations as to why herding among agents in financial markets
might occur. Individual forecasting behavior is a prominent topic in experimental psychology, particularly from
the perspective of heuristics and biases, leading to non-optimal results in many forecasting settings. Harvey
(2007) offers a comprehensive introduction to the literature concerned with individual forecasting behavior.
More generally, Assad (2012) gives an overview of the literature on experimental finance and includes aspects of
forecasting. Stekler (2007) differentiates between various components regarding the process of macroeconomic
forecasting and reviews the respective studies. Ramnath et al. (2008) provide an applied institutional perspective,
presenting a taxonomy on the role of financial analysts in capital markets. Similarly, v. Campenhout and
Verhestraeten (2010) more specifically review contributions on herding behavior among financial analysts.
Another perspective of applied forecasting regarding corporate analysts is given by Lawrence et al. (2006), who
review the central research of the past 25 years in judgmental forecasting.

6
offers a meta-study). Rational herding thus occurs less often than it is predicted by theory due
to subject’s reluctance to discard private information.
Reputational herding is closely related to discussions of herding evoked by informational
cascades. However, an additional dimension of incentives is considered, which rewards
imitating the choices of previous agents. Consequently, agents gain positive reputational
externalities from the fact that their decisions resemble those of a reference group. Ottaviani
and Sorensen (2000) discuss the similarities between both concepts and propose that an
agency-based reputational model might yield superior explanatory power for a wide range of
economic contexts. The seminal model for reputational herding goes back to Scharfstein and
Stein (1990), who formalize Keynes’ remarks on conformity in financial markets.3 Other
influential models of reputational herding have been contributed by Hirshleifer (1993),
Trueman (1994), Prendergast and Stole (1996) and Holmstrom (1999), who point at different
sources, dimensions and consequences of reputational pressure. Froot and Scharfstein (1992)
more closely discuss the beauty contest-like structure of reputational concern, which evolves
due to short time horizons. Most recently, Bar-Isaac (2012) suggests a model on the interplay
of career concerns, transparency and the resulting incentive for the acquisition of expertise.
Two contradictory basic notions can be identified within the theoretical discussion on the
parameters of reputational herding. The first such notion emphasizes individual gains from
conforming to a publicly observable consensus value. Accordingly, conformity and
coordination are seen as the dominant strategy in forecasting situations. By contrast,
proponents of strategic differentiation, i.e. anti-herding, point to potential reputational
advantages of making forecasts that significantly deviate from consensus values. By
appearing to be bold, analysts can gain competitive advantages, signaling to have access to
superior private information.
Supporting the first notion, Ehrbeck and Waldmann (1996) present a model favoring the
reputational gains of biased forecasts, within which agents aim at mimicking the most capable
3 The original, widely quoted citation being: “it is the long-term investor, he who most promotes the public
interest, who will in practice come in for most criticism, wherever investment funds are managed by committees
or boards or banks. For it is in the essence of his behavior that he should be eccentric, unconventional, and rash
in the eyes of average opinion. If he is successful, that will only confirm the general belief in his rashness; and if
in the short-run he is unsuccessful, which is very likely, he will not receive much mercy. Worldly wisdom teaches
that it is better for reputation to fail conventionally than to succeed unconventionally.” (Keynes 1936, p. 157-
158)

7
forecasters, instead of merely minimizing prediction errors. However, their assumptions of a
strategic bias towards common values fail to hold empirically. Accordingly, they suggest a
behavioral explanation of biased forecasts. In three related models, Ottaviani and Sorensen
(2006a;b;c) argue that reputational concerns regularly fail to create appropriate incentives for
the truthful reporting of private information. Thus, the role of strong incentives to herd on the
mean forecasts is emphasized, particularly for the case when markets are unaware of analysts’
strategic herding. In turn, if the market knows about these strategic incentives, forecasts are
made honestly and necessarily deviate from the consensus equilibrium due to the full
revelation of private information. Moreover, if markets for forecasts include a competition for
accuracy with pre-specified rules in a winner-takes-all setting, agents’ predictions become
fully differentiated. Ottaviani and Sorensen (2006c) more closely discuss the conditions that
preclude the realization of equilibria for truth telling. In these equilibria, relative reputational
concerns that would otherwise lead to a differentiation of forecasts have no impact and
competition fails to alter the resulting equilibrium.
In contrast to the models predicting a strong overall bias towards common information,
numerous reputational models suggest anti-herding in forecasting. Most prominently,
Trueman (1994), Zwiebel (1995), Prendergast and Stole (1996), Avery and Chevalier (1999),
as well as Zitzewitz (2001b) show how reputational competition might effectively lead to
differentiated forecasts. Laster et al. (1999) present a model with common information of all
forecasters and thus a common expectation of future values. However, due to the structure of
the demand side, forecasts cover the future value’s probability distribution. Furthermore,
forecasters more dependent on publicity will deviate more strongly from consensus values.
Effinger and Polborn (2001) similarly point to positive reputational effects of not following
predecessors, while Laux and Probst (2004) again show heterogeneity in forecasts accruing
from strategic behavior. However, this only holds when past performance is perfectly
evaluated by the markets. Otherwise, analysts cease their effort to become better informed and
revert to herding. Kim and Zapatero (2009) argue that relative performance evaluation is the
primary driver of analysts’ herding. They further propose that herding is most likely to occur
when the market comprises strong penalties for underperforming analysts.
Theoretical models have effectively mapped the various potential influences of reputational
concerns on forecasters, with both herding and anti-herding as dominant strategies, the
according equilibria crucially depending on the market structure faced by analysts.
8
Complementary to the theoretical work, empirical studies have investigated forecasting time
series, discussing whether and under what conditions herding around common public
information or signals, most prominently consensus values4, occurs in forecasting. Graham
(1999) tests a sequential model of analysts’ predictions, finding that herding behavior by
contributors to investment newsletters depends on their former reputation. In laboratory
studies, Cote and Sanders (1997), as well as Ackert et al. (2008) find empirical evidence for
Trueman’s (1994) model, as subjects with weak private information herd on the predictions
made by others who are endowed with stronger private information. Welch (2000) provides
empirical support for consensus herding consistent with models in which analysts coordinate
based upon common information. Gallo et al. (2002), Bofinger und Schmidt (2003), Spiwoks
(2004), Spiwoks et al. (2005; 2008a; b), Spiwoks und Hein (2007), Ager et al. (2009),
Jegadeesh and Kim (2009), as well as Gubaydullina et al. (2011) also find empirical evidence
for analysts herding around consensus values. Bizer et al. (2013) in a recent classroom
experiment with inexperienced participants also find a pattern of forecasts strongly biased
towards current values of the respective time series. While Clement and Tse (2005) strengthen
this notion, they point to the simultaneous occurrence of bold forecasts incorporating analysts’
private information. Consequently, these bold forecasts have more informational value than
those resulting from herding, although such forecasts only constitute a small fraction of their
data. Batchelor (2007) adds to these results by showing an overall bias towards the consensus
and a resulting weak forecasting accuracy overall. However, some forecasters consistently
aim at signaling ability by making distinctively optimistic or pessimistic predictions in
comparison to the consensus.
A similarly large body of literature has evolved aiming at supporting the theoretical
perspective of strategic differentiation in forecasting. Batchelor and Dua (1990) show that
analysts systematically deviate from average forecasts in an optimistic manner, suggesting
that differentiation is responsible. In a follow-up study, Batchelor and Dua (1992) find
forecasters to be conservative in the sense that they cling to their past predictions. However,
they are shown not to be consensus-seeking. In two separate studies, Zitzewitz (2001a; b)
reports equity analysts’ earnings forecasts and thereby presents strong evidence of anti-
4 Zarnowitz and Lambros (1987) provide an extensive discussion on potential definitions of consensus and
uncertainty in economic forecasting. Gregory et al. (2001) provide a more recent contribution concerning how a
consensus should be defined, as well as providing additional empirical insights.
9
herding in form of an exaggeration of differences with respect to the consensus. Furthermore,
implementing the notion that forecasters can extract valuable information from consensus
forecasts, Bernhardt et al. (2006) as well as Chen and Jiang (2006) present evidence in favor
of anti-herding in forecasting. Most recently, Dovern and Weisser (2011) investigate
macroeconomic forecasts and find a strong dispersion of forecasts, leading them to conclude
that predictions overall are informational efficient and unbiased.
Another strand of literature approaches the role of reputation in forecasting by analyzing
which analysts consistently stick to consensus values or make deviating predictions on a
personal level. Stickel (1992) shows that analysts with a high reputation who made it on an
“all star” list tend to rely less on consensus values. Cooper et al. (2001) support this point of
view, showing that earnings forecasters herd by following superior lead analysts. As superior
analysts publish their forecasts earlier, timeliness is suggested as a good measure of
performance. Consequently, herding on consensus values is not universal, but rather depends
on the expertise of individual forecasters. Analyzing individual career paths, Hong and Kubik
(2003) show that accurate, as well as generally optimistic forecasters are more likely to have
favorable careers. Clarke and Subramanian (2006) investigate the connection of employment
risk and deviations from consensus values, showing that analysts with both very high and very
low employment risk are most likely to deviate from consensus values. Leone and Wu (2007)
measure the validity of analyst rankings and argue that they correctly represent their
performance in terms of accuracy. Another prominent discussion deals with experience of
analysts and their tendency to herd on consensus values. Chevalier and Ellison (1999), Hong,
et al. (2000), Lamont (2002), and Clement and Tse (2005) report results consistent with
theoretical work by Avery and Chevalier (1999) and Holmstrom (1999), thus indicating that
older analysts herd less compared to their young counterparts. By contrast, Prendergast and
Stole (1996) and Graham (1999) theoretically show that older analysts and managers should
herd more. These assumptions are supported empirically by Stark (1997), Graham (1999), Li
(2002) and Boyson (2010) who suggest that increased experience does not lead to more
extreme deviations from consensus values.
While there are numerous theoretical and empirical contributions on reputational herding in
prediction markets, to the best of our knowledge no experimental study to date has attempted
to reconcile forecasting and strategic coordination in a single experimental setting. We thus
review the respective experimental research.
10
Primarily, there is a large number of empirical studies on forecasting from the perspective of
experimental economics, operational research and experimental psychology, with Leitner and
Wildburger (2011) providing a comprehensive review. While several aspects are considered
in these fields, reconnecting the findings to the more general discussions on consensus-
seeking behavior in economic forecasting remains difficult. We argue that the most accessible
finding in this regard is the ubiquitous rejection of the rational expectation hypothesis.
Unsurprisingly, this finding is replicated in a number of experimental studies using graphical
depiction of indicators that constitute the future value to be predicted.5 Thus, subjects’
inability to adequately process fundamentals and reconstruct the underlying models can be
interpreted as asserting the notion of reputational herding by incapable forecasters.
Secondarily, with regard to coordination behavior, the experimental studies on “sunspot”
equilibria (SSE) are closest to our study and can be used to derive our behavioral predictions.
The first experiment testing the rationality of subjects in SSE-coordination games was put
forth by Marimon et al. (1993). In a simple market setting, colored squares serve as a
coordination mechanism, yet no coordination on SSE resulted. In the seminal contribution on
SSE, Duffy and Fisher (2005) are the first to show that extrinsic, irrelevant information
fosters coordination. In their setting, salient sunspots without connection to the fundamentals
influence subjects’ decisions and foster coordination. Crawford et al. (2008) show that
sunspots’ effectiveness is limited when they are not payoff dominant. Similarly, Bosch and
Vried (2013) report that the impact of focal points strongly depends on the respective payoff
and time that subjects have to consider coordination choices. This result is discussed by
Agranov and Schotter (2012), who find that detrimental effects of payoff asymmetries can be
neutralized by implementing communication among subjects. Alternatively, Roos et al.
(2010) consider SSE as a reason for coordination failure, which might lead to welfare losses,
as subjects are dragged away from the payoff-dominant equilibrium by the sunspot. Fehr et al.
(2011) show that the efficiency of sunspot coordination depends crucially on the precision of
public information, private signals and their respective correlation. Accordingly, extrinsic
information might also lead to miscoordination, which is interpreted as evidence for the
considerable fragility of sunspot-coordination. Further applications of this concept are
provided by Arifovic et al. (2012), who show sunspot coordination in macroeconomic
5 See Becker et al. (2005; 2007; 2008; 2009) for different variants of this experimental design. While parameters
are changed, the basic conclusion of non-optimal forecasts, as measured by the benchmark of rational
expectations, is replicated.

11
forecasting, as well as Shurchkow (2013), with coordination framed as speculation attacks.
Finally, Bardsley et al. (2009) comprehensively discuss the working mechanisms of
coordination by independent subjects, yet find contradictory evidence for the two potential
explanations of team reasoning and cognitive hierarchy. Consequently, the exact behavioral
mechanisms for successful coordination have not been determined to date. In a closely related
experimental strand of literature, external recommendations for coordinated play are
considered. Duffy et al. (2013) provide an overview, concluding that experiments so far have
shown that recommendations to play a particular equilibrium are only followed imperfectly
and particularly less if the recommended equilibrium is payoff-dominated by some other
equilibrium of the game. We interpret these findings as pointing to the fragility of
coordination on focal equilibria, given that even experimenter-given advice is only followed
irregularly. Therefore, coordination on endogenously generated equilibria in forecasting might
not emerge robustly.
A third strand of literature from experimental economics relevant to our study is the superior
performance of groups in achieving coordination. While teamwork itself has been shown to
increase overall rationality across experimental studies (see e.g. Kugler et al., 2012),
coordination in particular is similarly facilitated by the cooperation of players; for instance, as
in Feri et al.’s (2010) study of coordination games. These findings hold relevance in our
setting, which comprises both teamwork and coordination, suggesting that coordination might
be facilitated by a two-player team setting, as implemented in this study.

12
3. EXPERIMENTAL DESIGN AND PROCEDURE
We implement a forecasting task that is built on the experimental design by Becker et al.
(2007). Additionally we introduce incentives for coordination, extending the basic setting,
which primarily encourages accurate predictions. The coordination element is based on the
experimental literature on sunspot equilibria (Duffy and Fisher, 2005). Under fully rational
behavior, the welfare maximizing outcome is defined by all subjects making optimal forecasts
and thereby automatically coordinating on the expected future values. However, this is an
unlikely outcome given the high complexity of the forecasting task. Ultimately, the decision
problem for all subjects comes down to choosing between the strategies of making accurate
forecasts or attempting to coordinate on a common focal point. In the following, we present
the specifics of the game to clarify the dual game structure.6
3.1 GAME SETUP
Let us first consider the forecasting task, before explaining the coordination aspect of the
game and finally describing the respective payoff regime.
Forecasting task
Participants are asked to make 21 forecasts on the development of a time series , which are
the realizations of the simple linear equation: with , , , and being a normally distributed random
variable with . These weighting factors and the realizations of the random
variable are unknown to participants. Weightings are chosen such that values for drive positively to a similar extent as and combined negatively. The influence of is rather
small, which simplifies the task, once this has been recognized by subjects. However,
participants receive values for in every period, henceforth denominated as
determinants. All values are rounded integers. Expected future values can subsequently be
derived without taking into account, given that:
6 Instructions including a screenshot of the game play are attached in appendix A and B. Original instructions
were in German and can be obtained from the authors upon request.

13
Overall, there are periods. The forecast horizon is five periods. Let denote the
forecast at period , which aims at . This means in period , subjects make a forecast for and so on. Subjects observe determinant values and the values of of the first
five periods before making forecasts. Accordingly, the first forecast is given in period 5, and
the last one in period 25. Thus, while subjects did not know the correct formula, they had a
certain insight into the past development of the time series and could reflect upon its
derivation.
Additionally, the correct value is shown in each period ; this has subjects wait five periods
to assess the accuracy of their predictions. Consequently, the first feedback is given in period
10.
Figure 1 summarizes the determinant values, while Figure 2 shows the resulting time series of and respective expected values for over the course of the game.
Figure 1: Time series’ for determinants

14
Figure 2: Time series to be forecast
Along with every forecast, subjects are asked to report a self-assessment on three questions.
The first question refers to the subject’s effort when making the prediction, the second
question prompts subjects to assess the accuracy of the respective forecast and the third is
concerned with subjects’ confidence about the accuracy of the forecast given. All three
questions have to be answered by noting the respective assessment on a scale from 1,
representing “very low”, to 7, reflecting “very high”. Answering the three obligatory
questions is not rewarded by an additional payoff.
Coordination task
Subjects are matched to societies of eight players. Each society consists of four teams with
two members. Within a team, members are allowed to communicate using the chat
implemented in zTree (Fischbacher, 2007). We thus simulate analyst communities that
exchange information and potentially influence each other’s decisions. However, the two
group members are not obliged to give unanimous forecasts. All subjects in a society receive
information about all other players’ forecasts in the previous periods, as well as the respective
payments achieved (costs and bonuses). This structure allows participants to coordinate by
observing all others’ decisions, whereby coordination can be fostered explicitly through the
chat and implicitly through the forecast itself.

15
Payoffs
Our payoff regime incorporates three distinct aspects, as described below.
Firstly, we implement costs of forecasts equal to 1Cent times the percentage point deviation
from the respective current value. According to Brown (1998), subjects are more likely to
make more accurate forecasts when threatened by losses, rather than continuous positive
gains. Thus, we endow each subject with €8.00, while the payoff for each period can become
negative. Let denote the costs of forecast denominated in € in period and the forecast
aiming at ; accordingly, we can write:
| | Building on Brennscheidt (1993), we implement a punishment of extreme predictions. More
importantly, these costs of forecasts ensure the existence of a unique, risk dominant sunspot
equilibrium for coordination, as discussed in the subsequent section.
Secondly, each participant is paid an accuracy bonus of €2.5 for every accurate prediction,
whereby we define a prediction as accurate if , i.e. if the interval contains . Thus, an accurate prediction deviates from the
correct value by 5% at most. Let denote the function that determines the accuracy bonus
payment for each player ; therefore, we can formulate:
( ) {
Thirdly, there is a coordination bonus of €1 in each period, for which at least five of the eight
subjects have to give forecasts in a specific interval. The range of the interval is derived from
the five forecasts that are closest in relative terms in each period. The average of the highest
and the lowest of these five forecasts builds the midpoint of the interval, with the lower and
the upper bound again defined by a 5% deviation.
Let denote the prediction in period that is assigned rank . Ranks are assigned to
predictions sorted by their size, where . denotes the jth vector in period ,
comprising five forecasts. Thereby, vector includes values from the smallest forecast to the fifth smallest forecast . The same procedure applies to .

16
Therefore, we define:
denotes the vector with the smallest relative deviation of the upper bound from the lower
bound. Let denote a function that gives these relative deviations; hence:
The interval for deriving the coordination bonus can then be written as:
)]
If at least five subjects make forecasts lying within this interval, these subjects are rewarded
the coordination bonus. Let denote the function to determine the coordination bonus for
each subject and period; therefore:
( ) { ∑
with )={
The comprehensive payoff function comprising the three components for each player and
period is then given by: ( ) ( ) ( ) ( )
In short, subjects can receive payments by making accurate forecasts and coordinating, while
they have to bear costs when deviating from each rounds’ naïve forecast.
3.2 PROPERTIES OF THE GAME
This section develops the criteria for rational behavior and formulates expectations
concerning subjects’ behavior.

17
Optimal forecasts
The optimal strategy unrestricted by cognitive limitations is given by forecasts equal to the
expected future values. Note that the accuracy bonus is not guaranteed by an optimal forecast
due to the realizations of the random variable . However, given the actual time series of forecasts equal to expected future values pay the accuracy bonus in 14 of the 21 forecasting
periods. The average costs for these forecasts amount to €0.52. Thus, in the case of optimal
forecasting, an average net payment of €1.15 is realized.
In this case, whether additional payments for coordination are realized depends on other
players’ behavior. Consider the situation in which at least five players of a society give
optimal forecasts. Each of these subjects then earns the cooperation bonus, in addition to the
accuracy bonus. Accordingly, the average net payment amounts to €2.15 per period.
The coordination regime
Given the forecasting task’s complexity, it is reasonable to assume that subjects will fail to
make optimal forecasts. In this case, they are enabled to establish a coordination regime,
which pays the coordination bonus. Note that all forecasting values inducing costs smaller
than €1 are Nash-equilibria for coordination. However, there is a strictly risk dominant
equilibrium in coordination, which is given by the current values. Thereby, naïve forecasts
can realize the coordination bonus without incurring any costs. This can be interpreted as a
sunspot equilibrium, given that current values hold very little additional information for
forecasting future values.
In sum, effective coordination is possible in many ways, e.g. by forecasting a simple trend or
choosing a series of salient numbers like 200,300,200 etc. However, there is only one
possibility of efficient coordination given by forecasting the current values. While inefficient
coordination pays the coordination bonus of €1 minus the costs of deviations from current
values, efficient coordination gives an average net payment equal to the coordination bonus.
Nevertheless, the average net payment for efficient coordination is still lower than for making
accurate forecasts without having four other players predicting optimally.
Minimizing Costs
A third potential outcome is intertwined with the attempt to establish a coordination regime.
Risk-averse subjects might rely on the strategy of naïve forecasting to minimize costs,

18
whereby an efficient coordination might evolve. In the absence of coordination, this strategy
pays €0 in each period and subjects would end up with their initial endowment of €8.
Expected behavior
Having outlined three basic strategies players can choose to pursue, it cannot be
unambiguously defined which strategy ultimately defines rational behavior, given that it
depends on each subject’s cognitive ability and the expectation toward the other subjects’
behavior within a society.7 Moreover, risk preferences might play a crucial role, especially
since potentially negative outcomes in each period are likely to trigger loss aversion.
Overall, there is a well-defined and easily accessible risk dominant equilibrium in
coordination, given by the strategy of naïve forecasting. Thereby, current values can be
interpreted as sunspots facilitating coordination. We are interested in whether societies are
able to establish this efficient equilibrium, i.e. a coordination regime at minimal costs, and, if
so, how fast, comprehensive and stable coordination proves to be. Furthermore, we look into
the dynamics of coordination and identify whether the successful cooperation of others
prompts subjects to join in, dismissing their attempts at making accurate forecasts.
3.3 PROCEDURE
The experiment was conducted in the Laboratory for Behavioral Economics at the University
of Göttingen. Participants were recruited using ORSEE (Greiner, 2004) and were only
allowed to participate in one session. Experiments were programmed using z-Tree
(Fischbacher, 2007). There were 25 sessions featuring 25 societies in December 2011 and
January 2012, which gives us 200 participants in total. Prior to each session, understanding of
instructions was made sure by running control questions. The sessions lasted around ninety
minutes with participants earning €14.50 on average. Participants were on average 23 years
old, 55% were female and 38% students of economics or business administration.
7 To analyze incentives and expectations in detail, one might consider a level- k approach as presented by Nagel
(1995). However, a level-k based approach to individual behavior is beyond the exploratory scope of this paper.

19
4. RESULTS
We analyze our results with respect to prediction accuracy, the effectiveness of coordination
and overall welfare. Furthermore, we are interested in subjects’ self-assessment concerning
their effort to make predictions, as well as the confidence in their respective accuracy.
4.1 ACCURACY OF PREDICTIONS
We begin by analyzing the accuracy of predictions. Therefore, we consider the prediction-
accuracy matrix, as suggested by Andres and Spiwoks (1999). Accordingly, forecasts are
classified within four categories set up by two dimensions, i.e. by the combination of Theil’s
new inequality coefficient (Theil, 1975) and the TOTA-coefficient. These two measures assess
forecasting accuracy by a straightforward comparison of actual and naïve forecasts. We are
thus able to reveal subjects’ attempts at coordination on the risk dominant equilibrium by
measuring their forecasting performance.
Theil’s new inequality coefficient
To classify predictions within the prediction-accuracy matrix, we primarily need to calculate
Theil’s new inequality coefficient, which allows for an implicit comparison of actual and
naïve forecasts. It is defined as the square root of the ratio resulting when dividing the mean
of squared prediction errors by the actual mean of changes in the objective variable. Again, let
T denote the total number of forecasts, the forecast horizon, the actual value in period t
and the forecast for period t. The coefficient is then defined as follows:
√ ∑ √ ∑ with and
For exact predictions, U becomes 0. Predictions worse than the naïve one are indicated by
U>1 and better predictions by U<1.
Pooled over all subjects, U’s average amounts to 1.045, whereby 33% of prediction series
show a value smaller than 1, while only 2.5% achieve a value smaller than 0.9. This clearly
indicates weak prediction accuracy in general.

20
Furthermore, we are able to decompose the prediction error by rearranging the coefficient
equation. We can write: ∑ ∑ ∑
with ∑ ∑ ∑
denote the averages of and respectively. and denote the standard deviation of and ; gives the respective correlation coefficient. Thus, ME describes the error with
respect to the mean of future values, i.e. it measures the systematic error in predictions
regarding the level of future values. A systematic error in forecasts with respect to the
variance of future values is captured by VE. Accordingly, RE measures the random, non-
systematic component of prediction errors. Andres and Spiwoks (1999) point out that the
quality of predictions crucially depends on their ability to correctly assess the variance and
levels of future values. If forecasts fail to capture the two aspects, this indicates the inability
to forecast the general development of the objective time series. Better forecasts are indicated
by prediction errors that are driven by the random component.
Across all forecast series, we find the median share of the random component to be 51%,
while the variance component is about 32% and the miscalculation of the future values’ level
is 16%. Hence, only half of the total prediction error can be ascribed to the random
component.
TOTA-coefficient
In order to more appropriately assess prediction accuracy, we additionally calculate the
second dimension of the prediction-accuracy matrix: the Topically Oriented Trend
Adjustment (TOTA)-coefficient (see Andres and Spiwoks, 1999; Bofinger and Schmidt, 2003).
This coefficient represents the ratio of forecasts and correct values correlation, as well as the
correlation of forecasts with current values at the time the forecast was made.
21
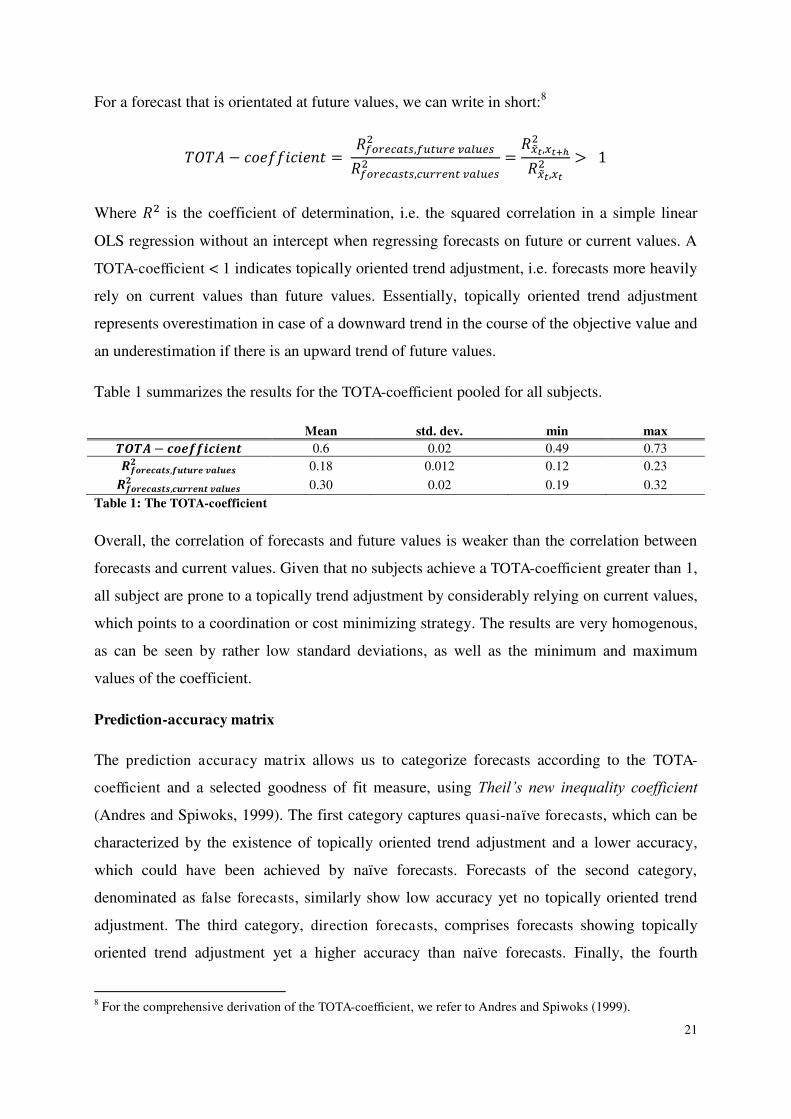
For a forecast that is orientated at future values, we can write in short:8
Where is the coefficient of determination, i.e. the squared correlation in a simple linear
OLS regression without an intercept when regressing forecasts on future or current values. A
TOTA-coefficient < 1 indicates topically oriented trend adjustment, i.e. forecasts more heavily
rely on current values than future values. Essentially, topically oriented trend adjustment
represents overestimation in case of a downward trend in the course of the objective value and
an underestimation if there is an upward trend of future values.
Table 1 summarizes the results for the TOTA-coefficient pooled for all subjects.
Mean std. dev. min max 0.6 0.02 0.49 0.73 0.18 0.012 0.12 0.23 0.30 0.02 0.19 0.32
Table 1: The TOTA-coefficient
Overall, the correlation of forecasts and future values is weaker than the correlation between
forecasts and current values. Given that no subjects achieve a TOTA-coefficient greater than 1,
all subject are prone to a topically trend adjustment by considerably relying on current values,
which points to a coordination or cost minimizing strategy. The results are very homogenous,
as can be seen by rather low standard deviations, as well as the minimum and maximum
values of the coefficient.
Prediction-accuracy matrix
The prediction accuracy matrix allows us to categorize forecasts according to the TOTA-
coefficient and a selected goodness of fit measure, using Theil’s new inequality coefficient
(Andres and Spiwoks, 1999). The first category captures quasi-naïve forecasts, which can be
characterized by the existence of topically oriented trend adjustment and a lower accuracy,
which could have been achieved by naïve forecasts. Forecasts of the second category,
denominated as false forecasts, similarly show low accuracy yet no topically oriented trend
adjustment. The third category, direction forecasts, comprises forecasts showing topically
oriented trend adjustment yet a higher accuracy than naïve forecasts. Finally, the fourth
8 For the comprehensive derivation of the TOTA-coefficient, we refer to Andres and Spiwoks (1999).

22
category, denominated as optimal forecasts, is achieved if forecast are better than the naïve
forecasts and do not show topically oriented trend adjustment.
Figure 3 shows the distribution of mean individual forecasts over the four categories
described.
Figure 3: Prediction accuracy matrix for all subjects.
As can clearly be seen, the vast majority of forecasts fall within the category of quasi-naïve
forecasts (67%), whereas only 33% are direction forecasts. All of the subjects forecast series
are prone to the topically oriented trend adjustment. We can thus formulate our primary result.
RESULT 1: Subjects fail to make accurate forecasts and rely considerably on current values.
4.2 COORDINATION
We have shown that subjects are incapable of making accurate predictions, i.e. predictions
that are equal to the expected future values. However, this might not reflect irrational
behavior, given that participants could have chosen the alternative strategy of establishing a
coordination regime. The effectiveness and stability of coordination is analyzed in the
following, where we turn to the society level of aggregation to analyze our results.
23
Figures 4 to 6 offer representations of different aspects of coordination for each society,
whereby we distinguish between effective and efficient coordination. The former merely
demands subjects to successfully establish a coordination regime, whereas the latter requires
the coordination to minimize costs, i.e. using the respective naïve forecasts.
Figure 4: Coordination effectiveness.
Note: one society never managed to coordinate and is therefore not included. The number of coordination does
not discriminate with respect to the number of subjects coordinating if at least the threshold of five players is
met.
Figure 4 graphs the total number of successful coordination in relation to the initial period of
successful coordination as an intuitive measure of effectiveness. As can be seen, the
occurrence of a coordination regime within the first periods determines the subsequent course
of coordination to some extent. Although there is a negative correlation of the initial period of
coordination and the number of periods with successful coordination, only three societies
manage to establish a perfectly stable regime, as indicated on the line presenting perfect
stability. Thus societies achieving a successful coordination relatively early are likely to
coordinate more often, but only few are able to coordinate in all subsequent periods. Although
not perfectly stable, once established coordination regimes prove rather robust throughout the
rest of the game. There is only one society that never coordinates.

24
Moreover, it can be expected that a successfully established coordination regime attracts the
remaining subjects within a society. Figure 5 gives a more detailed perspective on the
dynamics of coordination by showing the average share of subjects coordinating within a
society. Additionally, the share of societies featuring coordination in the respective period is
graphed. Lastly, we present the share of subjects playing the risk-dominant and cost-
minimizing coordination equilibrium. We define a subject as playing this strategy if her
respective forecast does not deviate by more than 5% from the naïve forecast.
Figure 5: Coordination dynamics.
Note: share of coordinated societies with respect to all societies, naïve forecasts with respect to all forecasts and
number of subjects coordinating.
Obviously, the share of societies achieving coordination is increasing over periods, which is
driven by the rising share of subjects playing the risk dominant coordination equilibrium, i.e.
make naïve forecasts. Also, the size of the coordination groups within societies increases
throughout the game, which supports the notion of successful coordination attracting subjects
that otherwise aim at accurate forecasts. However, only 22.63% of periods with successful
coordination comprise all eight subjects of a society. In most cases (38.27%), only the
minimum threshold of five players for the realization of the coordination bonus is reached.
The coordination group is formed by six players in 32.1% of the times, and by seven players
in 7%. Thus, a considerable number of subjects do not adjust to the majority within the

25
society following a coordination regime. They thereby forego considerably high payments by
sticking to the strategy of attempting to forecast accurately.9
Considering efficiency of coordination, evidently naïve forecast are the predominant
mechanism of coordination as the presentation of costs of forecasts in Figure 6 shows.
Figure 6: Coordination efficiency.
Note: only costs of forecasts yielding the coordination bonus are considered.
It can be seen that coordination is very efficient as the risk and payoff dominant equilibrium is
used for a coordination regime most often, i.e. player coordinate on current values. More than
50% of forecast yielding the coordination bonus are exactly equal to current values, and the
vast majority is not deviating more than 10% resulting in costs of less than 10 Cent.
Coordination effectiveness is clearly fostered by the salient risk dominant equilibrium of
making forecasts equal to current values. In none of the situations featuring successful
coordination players manage to coordinate on the expected future values, abstaining from the
cases where current values and future expected values happen to be similar. Thus the optimal
9 Another explanation might be seen in subjects’ incapability of understanding the coordination mechanism.
However, since they are able to communicate with one group member and there is full information about all
other players’ payments and forecasts this seems less likely.

26
solution of coordination on the expected future values is not achieved. We can formulate our
second main result accordingly.
RESULT 2: Overall, coordination increases as the game proceeds and attracts subjects
within societies, but attempts at forecasting are not universally discarded in favor of the
coordination regime. However, subjects coordinate efficiently once they abstain from
attempting to forecast accurately.
4.3 SELF-ASSESSMENT: EFFORT AND CONFIDENCE
Note that forecasts show poor quality (see Figure 3) even in the very first periods in which
coordination is not established. Thus, it seems reasonable to assume that subjects fail to make
correct forecasts and subsequently turn to a coordination strategy as indicated by the
dynamics of coordination. This perspective is supported by the reported self-assessments.
As described above, subjects answered three questions in each forecasting period. These
questions refer to self-assessments regarding subjects’ effort in forecasting, as well as their
confidence in forecasting accuracy. Figure 7 provides an overview of the respective results.
Figure 7: Overview of additional forecasting self-assessments

27
Not surprisingly, given increasing coordination, reported effort and confidence levels
deteriorate as the game proceeds. Subjects’ effort is quite high for the first five periods, i.e.
before subjects receive feedback, as indicated by an average reported effort level of 4.1. In
periods 6-15, the average deteriorates to 3.4 and ultimately to 2.9 for the last ten predictions,
for which 50.2% of subjects report a value smaller than three. Thus, if a stable coordination
regime is established, the effort for each additional forecast is rather low.
In line with this finding, there is a trend towards more pessimistic self-assessments with
respect to the accuracy of forecasts, which is reflected in decreasing reported levels for the
second and third question. For both questions, the median is equal to one in the last 10
periods, which is the lowest possible self-assessment. However, given that reported
confidence levels start off lower than the effort levels, the downward trend is weaker.
In sum, there is more successful coordination as the game proceeds, which lowers the effort
for making predictions, as well as the confidence in the accuracy of forecasts. Although there
might be some bias in the self-assessments as they were not incentivized, the results are
consistent with the findings presented in subsection 3.1 and 3.2.
RESULT 3: As effective coordination increases, subjects’ forecasting efforts deteriorate.
Accordingly, reported confidence levels decrease, given that subjects aim at coordination
rather than accurate forecasts.
4.4 WELFARE ANALYSIS
For a comprehensive welfare analysis, we use the structure of actual payoffs. Beforehand, we
define four benchmarks to evaluate the payoffs achieved.
For the first-best strategy, i.e. deriving the correct formula from the first five periods and
predicting the expected future value, an average payoff of €1.15 can be achieved as derived in
section 3.2. We consider this case as our first benchmark. Optimally, at least four other
subjects also forecast the expected values, which pays an additional €1 as a coordination
bonus in each period. This gives us our second benchmark of €2.15. The third benchmark is
formed by an efficient coordination at minimal costs for forecasts, i.e. by coordination on the
risk dominant equilibrium. Thus, in each period, subjects would receive €1. The last
benchmark is given by the cost minimizing strategy, which is realized if subjects give strictly
naïve forecasts without an effective coordination. Given that costs of forecast are zero and
there are no bonuses, the respective payoff amounts to €0. Recall that subjects were given a

28
budget of €8 and payoffs for each period could become negative. On average, subjects earned
€14.50, showing that they yielded a positive amount on average, but less than the 29€
accruing from efficient coordination in all periods.
Figure 8 summarizes the average costs, bonuses and total payoffs for all periods, as well as
future values.
Figure 8: Overview of payoffs, costs of forecasts and future values.
It can be seen that subjects overall start off worse than the lowest benchmark given at €0.
Subjects in the first periods unsuccessfully try to make accurate forecasts, thus bearing
substantial costs. As the game proceeds, they increasingly coordinate effectively, which
increases average payoffs. Net payments tend to go down for relatively low current values as
attempts for accurate forecasts induce higher costs since relative deviation from the naïve
forecast increases. However, subjects on average never reach the benchmark of efficient
coordination, which would yield €1 on average. Although costs tend to decrease during the
game, narrowing the gap between gross and net payments, efficient coordination is not
realized ubiquitously.
There are some salient events in our time series of actual values to be forecast that warrant
further discussion to explain the pattern of payoffs. Within the first periods, payments tend to
29
increase until period 8, at which point they reach a local maximum, before subsequently
decreasing for several periods. This can be explained by some correct forecasts by “accident”
in period 8 and 9 (37 of 200 in period 8; 28 of 200 in period 9). For period 8, the future value
to be forecast amounts to 236, which is close to the current value of 231. In period 9, the
future value is 202, which was correctly predicted by some subjects relying on salient
numbers: in this case, 200. Additionally, there is an extraordinary high number of payments
for group coordination, given that many subjects oriented their forecasts at the value of 200
(91 subjects received the coordination bonus). Moreover, many subjects gained the extra €2.5
in period 24 merely by sticking to the naïve forecast.
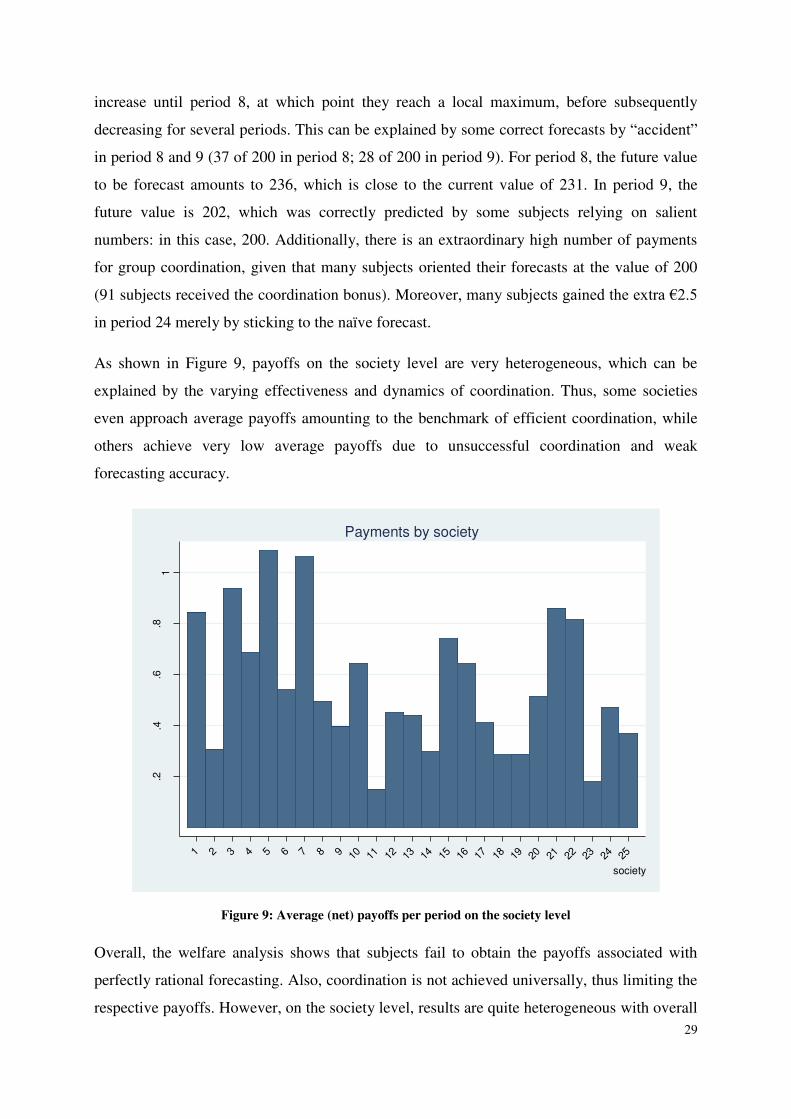
As shown in Figure 9, payoffs on the society level are very heterogeneous, which can be
explained by the varying effectiveness and dynamics of coordination. Thus, some societies
even approach average payoffs amounting to the benchmark of efficient coordination, while
others achieve very low average payoffs due to unsuccessful coordination and weak
forecasting accuracy.
Figure 9: Average (net) payoffs per period on the society level
Overall, the welfare analysis shows that subjects fail to obtain the payoffs associated with
perfectly rational forecasting. Also, coordination is not achieved universally, thus limiting the
respective payoffs. However, on the society level, results are quite heterogeneous with overall
.2.4
.6.8
1
aver
age
paym
ents
in €
1 2 3 4 5 6 7 8 9 10 11 12 13 14 15 16 17 18 19 20 21 22 23 24 25
society
Payments by society

30
welfare depending on subjects’ ability to learn to play the coordination equilibrium. We can
formulate our forth core result.
RESULT 4: Subjects fail to achieve maximal payoffs through rational forecasting.
Coordination is not perfectly efficient, given that it takes some time for subjects to establish a
coordination regime, which subsequently fails to be perfectly stable. Coordination
considerably increases payoffs, yet not to the full extent possible. In addition, individual
payments crucially depend on the society-specific dynamics.
5. CONCLUSION
While the notion that analysts’ “desire […] to be perceived as good forecasters turns them
into poor forecasters” (Ottaviani and Sorensen, 2006a, p.443) has been described
theoretically and investigated empirically, the behavioral mechanisms of reputational herding
remain largely unexplored. An empirical study in a controlled laboratory setting might thus
reveal the behavioral processes involved in the interplay of forecasting accuracy and
coordination among forecasters. In this paper, we aimed to experimentally investigate
subjects’ ability to coordinate on sunspot equilibria in a forecasting environment. Our study
connects two separate strands of literature, one concerned with the efficiency of judgmental
forecasting and the other discussing coordination on external focal points. Determining the
occurrence, speed and stability of coordination on external signals adds to the understanding
of reputational herding in forecasting settings from a behavioral perspective.
We provide results on subjects’ behavior regarding the interplay of forecasting and
coordination. While strong incentives for accuracy lead to initial efforts for achieving correct
predictions, overall prediction accuracy is considerably low. As in previous experiments, we
can reject the hypothesis of rational expectations for our forecasting task. Frustration with the
task leads subjects to start playing the efficient coordination equilibrium, to which a majority
of subjects conforms within a few periods. Sunspots are predominantly used to establish a
simple coordination regime, while only few attempts to coordinate are made by relying on
other salient numbers. Coordination on sunspot equilibria proves to be fairly robust once it is
established. Overall welfare approaches but rarely reaches the benchmark payoff of efficient
coordination. However, given subjects’ inability to make correct forecasts, they forego
significant payments rewarded for accurate predictions.

31
Presenting these results, we have illustrated a forecasting setting with conflicting incentives
for accurate forecasts and coordination to show the effectiveness of payoff dominant SSE in
fostering reputational herding. This provides additional empirical evidence for reputational
herding through external signals, as outlined by Spiwoks (2004). Accordingly, forecasters
evade the responsibility of making accurate forecasts that correctly reveal their private
information and coordinate on consensus values instead. This effectively conceals their
inability to make correct predictions. Analysts who fail to coordinate and continue to pursue
correct predictions in our setting gain comparably low payoffs, which in a real-world setting
would translate to the loss of reputation. Accordingly, in a more dynamic setting, only
forecasters capable of coordination would succeed. Those attempting to forecast honestly
would ultimately lose their occupation. On a more general level, our results emphasize that
once prediction markets are structurally incapable of providing incentives for forecasts that
reveal the analyst’s insight about the future state, it can be assumed that they will quickly
resort to herding on extrinsic focal points. While this assessment might not be applicable to all
prediction markets, the empirical results suggest that numerous financial and economic
predictions can be characterized by herding on consensus values. Therefore, further
experimental studies should focus on investigating parameters that succeed in reducing
herding in forecasting by introducing incentives for the revelation of private information and
thus fostering anti-herding.
32
REFERENCES
Ackert, L.F., Church, B.K., Ely, K., 2008. Biases in Individual Forecasts: Experimental
Evidence. The Journal of Behavioral Finance 9 (2), 53-61.
Ager, P., Kappler, M., Osterloh, S., 2009. The accuracy and efficiency of the Consensus
Forecasts: A further application and extension of the pooled approach. International
Journal of Forecasting 25 (1), 167-181.
Agranov, M., Schotter, A., 2012. Ignorance Is Bliss: An Experimental Study of the Use of
Ambiguity and Vagueness in the Coordination Games with Asymmetric Payoffs.
American Economic Journal: Microeconomics 4 (2), 77-103.
Anderson, L.R., Holt, C.A., 1997. Information cascades in the laboratory. The American
Economic Review 87 (5), 847-862.
Andres, P., Spiwoks, M., 1999. Prognosequalitätsmatrix – Ein methodologischer Beitrag zur
Beurteilung der Güte von Kapitalmarktprognosen. Jahrbücher für Nationalökonomie
und Statistik 219 (5-6), 513-542.
Arifovic, J., Evans, G., Kostyshyna, O., 2013. Are sunspots learnable? An experimental
investigation in a simple general-equilibrium model. Bank of Canada, Working Paper
No. 2013-14.
Asaad, C.T., 2012. Experimental finance: a cross–disciplinary exploration linking
expectations and behaviours. International Journal of Behavioural Accounting and
Finance 3 (3), 244-269.
Avery, C.N., Chevalier, J.A., 1999. Herding over the career. Economics Letters 63 (3), 327-
333.
Banerjee, A.V., 1992. A simple model of herd behavior. The Quarterly Journal of Economics
107 (3), 797-817.
Bardsley, N., Mehta, J., Starmer, C., Sugden, R., 2010. Explaining Focal Points: Cognitive
Hierarchy Theory versus Team Reasoning. The Economic Journal 120 (543), 40-79.
Bar-Isaac, H., 2008. Transparency, career concerns, and incentives for acquiring expertise.
The BE Journal of Theoretical Economics 12 (1), 1-15.
Batchelor, R., 2007. Bias in macroeconomic forecasts. International Journal of Forecasting 23
(2), 189-203.
33
Batchelor, R.A., Dua, P., 1990. Product differentiation in the economic forecasting industry.
International Journal of Forecasting 6 (3), 311-316.
Batchelor, R., Dua, P., 1992. Conservatism and consensus‐seeking among economic
forecasters. Journal of Forecasting 11 (2), 169-181.
Becker, O., Leitner, J., Leopold-Wildburger, U., 2005. Modelling judgmental forecasts under
tabular and graphical data presentation formats, in: Schmidt, U., Traub, S. (Eds.),
Advances in Public Economics: Utility, Choice and Welfare New York: Springer,
255-266.
Becker, O., Leitner, J., Leopold-Wildburger, U., 2007. Heuristic modeling of expectation
formation in a complex experimental information environment. European Journal of
Operational Research 176 (2), 975-985.
Becker, O., Leitner, J., Leopold‐Wildburger, U., 2008. Modeling expectation formation
involving several sources of information. German Economic Review 9 (1), 96-112.
Becker, O., Leitner, J., Leopold-Wildburger, U., 2009. Expectation formation and regime
switches. Experimental Economics 12 (3), 350-364.
Bedke, N., Bizer, K., Spiwoks, M., 2009. Gregarious Analysts - Experimental Evidence for
Reputational Herding. Journal of Money, Investment and Banking 12, 26-36.
Bernhardt, D., Campello, M., Kutsoati, E., 2006. Who herds?. Journal of Financial Economics
80 (3), 657-675.
Bikhchandani, S., Hirshleifer, D., Welch, I., 1992. A theory of fads, fashion, custom, and
cultural change as informational cascades. Journal of Political Economy 100 (5), 992-
1026.
Bizer, K., Scheier, J., Spiwoks, M., 2013. Planspiel Kapitalmarktprognose. Ein empirischer
Vergleich der Prognosekompetenz von Amateuren und Experten. Sofia-Studien 13-2.
Bofinger, P., Schmidt, R., 2003. On the reliability of professional exchange rate forecasts: An
empirical analysis for the€/US-$ rate. Financial Markets and Portfolio Management 17
(4), 437-449.
Bosch-Domènech, A., Vriend, N.J., 2013. On the role of non-equilibrium focal points as
coordination devices. Journal of Economic Behavior & Organization 94, 52-67.
34
Boyson, N.M., 2010. Implicit incentives and reputational herding by hedge fund managers.
Journal of Empirical Finance 17 (3), 283-299.
Brennscheidt, G., 1993. Predictive Behavior – An Experimental Study. Lecture Notes in
Economics and Mathematical Systems 403. Berlin: Springer.
Brown, P.M., 1998. Experimental evidence on the importance of competing for profits on
forecasting accuracy. Journal of Economic Behavior & Organization 33 (2), 259-269.
Chen, Q., Jiang, W., 2006. Analysts’ weighting of private and public information. Review of
Financial Studies 19 (1), 319-355.
Chevalier, J., Ellison, G., 1999. Career concerns of mutual fund managers. The Quarterly
Journal of Economics 114 (2), 389-432.
Clarke, J., Subramanian, A., 2006. Dynamic forecasting behavior by analysts: Theory and
evidence. Journal of Financial Economics 80 (1), 81-113.
Clement, M.B., Tse, S.Y., 2005. Financial analyst characteristics and herding behavior in
forecasting. The Journal of Finance 60 (1), 307-341.
Cooper, R.A., Day, T.E., Lewis, C.M., 2001. Following the leader: a study of individual
analysts’ earnings forecasts. Journal of Financial Economics 61 (3), 383-416.
Cote, J., Sanders, D., 1997. Herding behavior: Explanations and implications. Behavioral
Research in Accounting 9, 20-45.
Crawford, V.P., Gneezy, U., Rottenstreich, Y., 2008. The power of focal points is limited:
even minute payoff asymmetry may yield large coordination failures. The American
Economic Review 98 (4), 1443-1458.
Devenov, A. Welch, I., 1996. Rational herding in financial economics. European Economic
Review 40, 603-615.
Dovern, J., Weisser, J., 2011. Accuracy, unbiasedness and efficiency of professional
macroeconomic forecasts: An empirical comparison for the G7. International Journal
of Forecasting 27 (2), 452-465.
Duffy, J., Fisher, E.O.N., 2005. Sunspots in the Laboratory. The American Economic Review
95 (3), 510-529.
Duffy, J., Lai, E. K., Lim, W., 2013. Language and Coordination: An Experimental Study.
Genesis - The Journal of Genetics and Development 11, 6-7.

35
Effinger, M.R., Polborn, M.K., 2001. Herding and anti-herding: A model of reputational
differentiation. European Economic Review 45 (3), 385-403.
Ehrbeck, T., Waldmann, R., 1996. Why are professional forecasters biased? Agency versus
behavioral explanations. The Quarterly Journal of Economics 111 (1), 21-40.
Elliott, G., Timmermann, A., 2008. Economic forecasting. Journal of Economic Literature 46
(1), 3-56.
Fehr, D., Heinemann, F., Llorente-Saguer, A., 2011. The Power of Sunspots: An
Experimental Analysis. SFB 649 Discussion Paper No.070.
Feri, F., Irlenbusch, B., Sutter, M., 2010. Efficiency gains from team-based coordination -
Large-scale experimental evidence. The American Economic Review 100 (4), 1892-
1912.
Fischbacher, U., 2007. z-Tree: Zurich toolbox for ready-made economic experiments.
Experimental Economics 10 (2), 171-178.
Froot, K.A., Scharfstein, D.S., Stein, J.C., 1992. Herd on the Street: Informational
Inefficiencies in a Market with Short‐Term Speculation. The Journal of Finance 47
(4), 1461-1484.
Gallo, G.M., Granger, C.W., Jeon, Y., 2002. Copycats and Common Swings: The Impact of
the Use of Forecasts in Information Sets. IMF staff Papers No 49 (1).
Graham, J.R., 1999. Herding among investment newsletters: Theory and evidence. The
Journal of Finance 54 (1), 237-268.
Gregory, A.W., Smith, G.W., Yetman, J., 2001. Testing for forecast consensus. Journal of
Business & Economic Statistics 19 (1), 34-43.
Greiner, B., 2004. An online recruitment system for economic experiments. GWDG Berichte
63, 79-93.
Gubaydullina, Z., Hein, O., Spiwoks, M., 2011. The Status Quo Bias of Bond Market
Analysts. Journal of Applied Finance & Banking 1 (1), 31-51.
Harvey, N., 2007. Use of heuristics: Insights from forecasting research. Thinking &
Reasoning 13 (1), 5-24.
Hirshleifer, D., 1993. Managerial reputation and corporate investment decisions. Financial
Management 22 (2), 145-145.

36
Holmstrom, B., 1999. Managerial incentive problems: A dynamic perspective. The Review of
Economic Studies 66 (1), 169-182.
Hong, H., Kubik, J.D., 2003. Analyzing the Analysts: Career Concerns and Biased Earnings
Forecasts. The Journal of Finance 58 (1), 313-351.
Hong, H., Kubik, J.D., Solomon, A., 2000. Security analysts' career concerns and herding of
earnings forecasts. The Rand Journal of Economics 31 (1), 121-144.
Jegadeesh, N., Kim, W., 2010. Do analysts herd? An analysis of recommendations and market
reactions. Review of Financial Studies 23 (2), 901-937.
Keynes, J.M., 1936. The General Theory of Employment, Interest and Money, London:
Macmillan.
Kim, M. S., Zapatero, F., 2009. Rational bias and herding in analysts’ recommendations.
Marshall Research Paper Series, Working Paper FBE 08-10.
Kugler, T., Kausel, E.E., Kocher, M.G., 2012. Are groups more rational than individuals? A
review of interactive decision making in groups. Wiley Interdisciplinary Reviews:
Cognitive Science 3 (4), 471-482.
Lamont, O.A., 2002. Macroeconomic forecasts and microeconomic forecasters. Journal of
Economic Behavior & Organization 48 (3), 265-280.
Laster, D., Bennett, P., Geoum, I.S., 1999. Rational bias in macroeconomic forecasts. The
Quarterly Journal of Economics 114 (1), 293-318.
Laux, C., Probst, D.A., 2004. One signal, two opinions: strategic heterogeneity of analysts’
forecasts. Journal of Economic Behavior & Organization 55 (1), 45-66.
Lawrence, M., Goodwin, P., O'Connor, M., Önkal, D., 2006. Judgmental forecasting: A
review of progress over the last 25years. International Journal of Forecasting 22 (3),
493-518.
Leitner, J., Leopold-Wildburger, U., 2011. Experiments on forecasting behavior with several
sources of information–A review of the literature. European Journal of Operational
Research 213 (3), 459-469.
Leone, A., Wu, J., 2007. What does it take to become a superstar? Evidence from institutional
investor rankings of financial analysts. University of Rochester working paper.

37
Li, X., 2002. Performance, herding, and career concerns of individual financial analysts. EFA
2002 Berlin Meetings Discussion Paper.
Marimon, R., Spear, S.E., Sunder, S., 1993. Expectationally driven market volatility: an
experimental study. Journal of Economic Theory 61 (1), 74-103.
Marinovic, I., Ottaviani, M., Sorensen, P.N., 2011. Modeling Idea Markets: Between Beauty
Contests and Prediction Markets, in: Williams, L.V. (Ed.), Prediction Markets: Theory
and Applications. London: Routledge, 4-17.
Nagel, R., 1995. Unraveling in Guessing Games: An Experimental Study. The American
Economic Review 85 (5), 1313-1326.
Ottaviani, M., Sorensen, P., 2000. Herd behavior and investment: Comment. The American
Economic Review 90 (3), 695-704.
Ottaviani, M., Sorensen, P.N., 2006a. Professional advice. Journal of Economic Theory 126
(1), 120-142.
Ottaviani, M., Sorensen, P.N., 2006b. The strategy of professional forecasting. Journal of
Financial Economics 81 (2), 441-466.
Ottaviani, M., Sorensen, P.N., 2006c. Reputational cheap talk. The Rand Journal of
Economics 37 (1), 155-175.
Prendergast, C., Stole, L., 1996. Impetuous youngsters and jaded old-timers: Acquiring a
reputation for learning. Journal of Political Economy 104 (6), 1105-1134.
Ramnath, S., Rock, S., Shane, P., 2008. The financial analyst forecasting literature: A
taxonomy with suggestions for further research. International Journal of Forecasting
24 (1), 34-75.
Roos, M.W., Beugnot, J., Gürgüc, Z., Ovlisen, F.R., 2010. Coordination Failure Caused by
Sunspots. Beiträge zur Jahrestagung des Vereins für Socialpolitik 2010. Session:
Experimental Game Theory No. F13-V2.
Scharfstein, D.S., Stein, J.C., 1990. Herd behavior and investment. The American Economic
Review 80 (3), 465-479.
Shurchkov, O., 2013. Sunspot Coordination in Dynamic Global Games. Wellesley College
Working Paper.

38
Spiwoks, M., 2004. External triggered herding bei Rentenmarkt-Analysten. Financial Markets
and Portfolio Management 18 (1), 58-83.
Spiwoks, M., Bedke, N., Hein, O., 2008. Forecasting the past: the case of US interest rate
forecasts. Financial Markets and Portfolio Management 22 (4), 357-379.
Spiwoks, M., Bedke, N., Hein, O., 2008. Topically Orientated Trend Adjustment and
Autocorrelation of the Residuals – An Empirical Investigation of the Forecasting
Behavior of Bond Market Analysts in Germany between 1989 and 2007, Wolfsburg
Working Papers No. 08-03.
Spiwoks, M., Bizer, K., Hein, O., 2005. Anchoring Near the Lighthouse: Bond Market
Analysts’ Behavior Coordination by External Signal. Wolfsburg Working Papers No.
05-02.
Spiwoks, M., Hein, O., 2007. Die Währungs-, Anleihen-und Aktienmarktprognosen des
Zentrums für Europäische Wirtschaftsforschung. AStA Wirtschafts-und
Sozialstatistisches Archiv 1 (1), 43-52.
Stark, T., 1997. Macroeconomic forecasts and microeconomic forecasters in the survey of
professional forecasters. Federal Reserve Bank of Philadelphia Working Paper No. 97-
10.
Stekler, H.O., 2007. The future of macroeconomic forecasting: Understanding the forecasting
process. International Journal of Forecasting 23 (2), 237-248.
Stickel, S.E., 1992. Reputation and performance among security analysts. The Journal of
Finance 47 (5), 1811-1836.
Theil, H., 1975. Applied Economic Forecasting (3. Ed.). Amsterdam: North-Holland.
Trueman, B., 1994. Analyst forecasts and herding behavior. Review of Financial Studies 7
(1), 97-124.
Van Campenhout, G., Verhestraeten, J.F., 2010. Herding Behavior among Financial Analysts:
a Literature Review. HUB Research Paper No. 39.
Weizsäcker, G., 2010. Do we follow others when we should? A simple test of rational
expectations. The American Economic Review 100 (5), 2340-2360.
Welch, I., 1992. Sequential sales, learning, and cascades. The Journal of Finance 47 (2), 695-
732.

39
Welch, I., 2000. Herding among security analysts. Journal of Financial Economics 58 (3),
369-396.
Zarnowitz, V., Lambros, L.A., 1992. Consensus and uncertainty in economic prediction, in:
Zarnowitz, V. (Ed.), Business Cycles: Theory, History, Indicators, and Forecasting.
Chicago: University of Chicago Press, 492-518.
Zitzewitz, E., 2001a. Measuring herding and exaggeration by equity analysts and other
opinion sellers. Graduate School of Business Stanford University Working Paper.
Zitzewitz, E., 2001b. Opinion-producing agents: career concerns and exaggeration. Graduate
School of Business Stanford University Working Paper.
Zwiebel, J., 1995. Corporate conservatism and relative compensation. Journal of Political
Economy 103 (1), 1-25.

40
APPENDIX A
Instructions for the experiment. The original instructions were in German and are available
from the authors upon request.
_____________________________________________________________
General Information
In this game, you and other participants will make predictions for the development of a price.
This price results from the development of different determinants. You know the four most
important determinants (called A-D). Additionally, you know all prices up to the point of
prediction. Based on this information, all participants make a prediction in every period. Your
payoff depends on your own and your co-players’ predictions. You may communicate via
chat with another participant, who is randomly assigned to you at the beginning of the game.
The chat messages and all other data are recorded in an anonymous form. Every participant
has the same instructions and information.
The course of the game (see figure 1)
The game has 30 periods. In every period, you will make a prediction for the price in five
periods. You will make your first prediction in period 5. In every period, you will see three
consecutive screens:
The “Information and Chatscreen” (see: figure 2)
What you see: Development of prices up to the current period
Overview of the forecasts of all other participants
Development of the determinants (A-D)
Overview of the payoffs of all other participants
Additionally, you can use the chatbox to communicate with your group member and a
calculator, which is active with a click on the respective symbol.
What you do: You make a prediction for the price in five rounds. To become accustomed with
the game, you have 5 minutes to make your prediction in the first round, 3 minutes for the
next five periods and 2 minutes for the rest of the game. You will see the time you have left
for your prediction on the upper right side of your screen. You can reach the next screen by
clicking “to the input screen”.
The “Input Screen”
What you see: You will see an input box and three questions about your prediction.

41
What you do: You enter your forecast within 30 seconds, answer the three questions and click
“end period”. Please note the time constraint: If you allow the 30 seconds to pass without
clicking “end period”, the game proceeds automatically. Your prediction for this period would
be zero.
The “Payoff Screen”
What you see: Your current and overall payoff will be shown to you for 15 seconds.
What you do: No input is required.
Your Payoff
You start the game with a starting payment of 8€. You gain payoffs depending on your
predictions, but also have to bear prediction costs. Thus, your payoffs for a single period can
become negative. The payoff for all periods will be summed up and paid to you after the
game. For the payoff, your prediction-costs, prediction accuracy and forecasts of other
participants will be considered as follows.
Prediction costs: You will bear prediction costs in every round. They are estimated by the
deviation of your prediction from the current price. You will be deducted 1Cent per
percentage point deviation.
Prediction accuracy: All prices are the result of a fixed formula and the four determinants in
the respective round, which determines 95% of the future price. 5% of the price is random. If
your prediction is accurate, you will receive 2,50€ as an accuracy bonus. Accurate means that
your prediction does not deviate by more than 5% from the actual price. You will learn if your
prediction was correct in the period for which your prediction was made. For example, in
period 10, you will learn whether your prediction in round 5 for period 10 was correct.
Example: The price in the current period is 100. Your prediction is 120; thus, you have
immediate prediction-costs of 20. 5 periods later, you learn that the actual price was 125.
Your prediction (120) does not deviate by more than 5% from the actual price. Thus, you
receive a 2,50€ accuracy bonus for your prediction from 5 periods earlier.
If you do not predict accurately, you will not receive an accuracy bonus and have to bear
prediction costs.
The predictions of other participants
If the predictions of 5 (or more) participants do not deviate by more than 5% from a common
price, each of the 5 participants receives 1€ as “group-bonus”.
Example: The current price is 100; 5 participants predict a price of 120 (+ /-5%). The actual
price, 5 periods later, is 150. The prediction was thus inaccurate. However, each of the 5
participants receives a 1€ group bonus and has prediction costs of -0,20€.

42
Overview:
There are four situations in every period that lead to different payoffs.
1. Your prediction is inaccurate and you and at least 4 other participants have not predicted a
common price.
Your Payoff: You earn 0€ minus your prediction-costs.
(Payoff = 0€ accuracy bonus + 0€ group-bonus – prediction costs)
2. Your prediction is inaccurate, but you and at least 4 other participants have predicted a
common price (+/- 5%).
Your Payoff: You earn 1€ minus your prediction costs.
(Payoff = 0€ accuracy bonus + 1€ group-bonus – prediction costs)
3. Your prediction is accurate and you and at least 4 other participants have not predicted a
common price.
Your Payoff: You earn 2,50€ minus your prediction costs.
(Payoff = 2,50€ accuracy bonus + 0€ group-bonus – prediction costs)
4. Your prediction is accurate and you and at least 4 other participants have predicted a
common price (+/- 5%).
Your Payoff: You earn 3,50€ minus your prediction costs.
(Payoff = 2,50€ accuracy bonus + 1€ group-bonus – prediction costs)
We now ask you to answer some control questions on your computers. The game will start as
soon as all participants have answered these questions correctly.
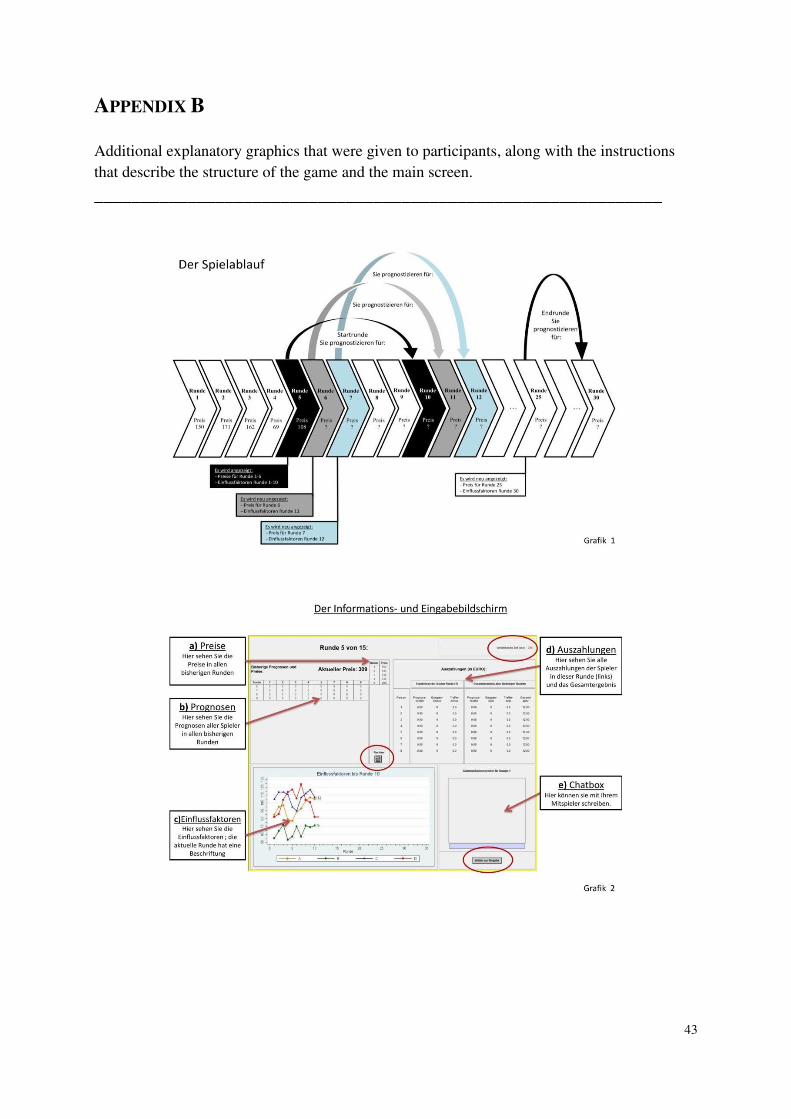
43
APPENDIX B
Additional explanatory graphics that were given to participants, along with the instructions
that describe the structure of the game and the main screen.
_____________________________________________________________