experimental study on forecasting mathematical model of
TRANSCRIPT
Hindawi Publishing CorporationMathematical Problems in EngineeringVolume 2012, Article ID 567812, 14 pagesdoi:10.1155/2012/567812
Research ArticleExperimental Study on ForecastingMathematical Model of Drying Shrinkage ofRecycled Aggregate Concrete
Yuanchen Guo and Xue Wang
College of Civil Engineering, Chongqing Three Gorges University, 780 ShaLong Road, Wanzhou District,Chongqing 414000, China
Correspondence should be addressed to Yuanchen Guo, [email protected]
Received 19 November 2011; Accepted 16 January 2012
Academic Editor: Ireneusz Zbicinski
Copyright q 2012 Y. Guo and X. Wang. This is an open access article distributed under theCreative Commons Attribution License, which permits unrestricted use, distribution, andreproduction in any medium, provided the original work is properly cited.
On the basis of basic law in AASHTO2007 model, the forecasting mathematical model of dryingshrinkage of recycled aggregate concrete (RAC) is established by regression analysis and experi-mental study. The research results show that (1) with the replacement rate of RCA increases, thedrying shrinkage value of RAC increases; this trend is even more obvious in the early drying time.(2) The addition of fly ash can inhibit the drying shrinkage of RAC, but the effect is not very obvi-ous. Specifically, the addition of fly ash will increase the shrinkage to some extent when the mixingamount is 20%. (3) The addition of expansive agent can obviously inhibit the shrinkage of RAC; theinhibition affection is better than that of fly ash. (4) The forecasting mathematical models of dry-ing shrinkage of RAC established in this paper have high accuracy and rationality according toexperiment validation and error analysis.
1. Introduction
Forecasting mathematical models of concrete drying shrinkage is a mathematical equationwhich represents the relationship of concrete shrinkage and its curing age of [1]. The modelsare generally fitted by regression analysis of experimental data. The common functional ex-pressions are hyperbolic function, exponential function, and logarithmic function, and so on.
In recent years, many domestic and foreign researchers are committed to the study offorecasting mathematical models and had found a lot of computational model. However, it isvery difficult to estimate the shrinkage value and its development in different age because ofexperimental value of concrete shrinkage having great dispersion [2]. Researchers have intro-duced a variety of concrete prediction computational model, but these models have some
2 Mathematical Problems in Engineering
limitations and application scope. Currently, more typical forecasting mathematical modelsof drying shrinkage of natural aggregate concrete are shown below.
The main factors considered in forecasting mathematical model proposed by CEB/FIP[3] are relative humidity, water-cement ratio, cement content, dry age, and size of compon-ents, the proposed expression is shown in the following:
εsh(t) = εc ·Kb ·Kt ·Ke, (1.1)
where εsh(t) is concrete shrinkage strain at any age t, (10−6); εc is shrinkage strain relative tohumidity (10−6); Kb is correction coefficient of concrete mix proportion affection; Kt is of con-crete drying time; Ke is correction coefficient of affection of concrete members.
Main factors what ACI proposed [4] also considered the influence of curing time beforedrying, curing way, aggregates content, and concrete’s air-containing except ones consideredby CEB/FIP forecasting mathematical model. ACI’s recommended formula is shown in (1.1)and (1.2).
Under wet curing conditions,
εsh(t) =(
t
35 + t
)εu. (1.2)
Under steam curing conditions,
εsh(t) =(
t
55 + t
)εu,
εu = 780 × 10−6γsh,
(1.3)
where εsh(t) is shrinkage strain drying time age t; εu is limit shrinkage strain with the relativehumidity 40% which is recommended by ACI; γsh is product of correction factors of a seriesof consideration factors, such as wet curing cycle, exposed time, and relative humidity.
This model accords with engineering practice well, for example, last days of beforedrying, t is considered, but the parameter t is very difficult to estimate.
The forecasting mathematical model proposed by Gardner and Lockman [5] is shownin the following:
εsh(t, tc) = εsh(t, tc)0fsh(RH)fsh(fcu,k
)fsh(Mcure)fsh(Tcement),
fsh(RH) = 1 − 1.18 RH4,(1.4)
where εsh(t, tc) is concrete shrinkage from beginning observational age tc to age t; εsh(t, tc)0is shrinkage of concrete under standard conditions; V/S is volume to surface area of concretecomponent; RH is relative humidity; fsh(RH) is the impact of relative humidity; fsh(fcu,k) isthe impact of strength grade of concrete; fsh(Mcure) is the impact coefficient of curing method,taking 1.0 under the standard curing of 1.0; fsh(Tcement) is influence coefficient of cement type.
In addition to the factors of humidity, component size of concrete, the model also con-siders the influence of concrete strength grade and cement type on concrete shrinkage.

Mathematical Problems in Engineering 3
Based on more recent experimental data, AASHTO [6] puts forward a forecastingmathematical model of concrete shrinkage by means of modifying ACI209 model and CEB/FIP model, the formula as can be seen from he following:
εsh = ks khs kf ktd 0.48 × 10⁻³, (1.5)
where εsh is shrinkage strain; ks is effect coefficient of component size between them:
ks =
[t/(26 exp(0.0142(V/S)) + t
)t/(t + 45)
][1064 − 3.70(V/S)
923
]. (1.6)
V/S is volume to surface area of concrete component; khs = (2.00 − 0.014H), is humidity cor-relation coefficient; H is humidity; kf = 35/(7 + f ′
ci) is correlation coefficient of concretestrength; ktd = (t/(61 − 0.58f ′
ci + t)) is correlation coefficient with the development of time t;f ′ci is compressive strength of concrete.
This model accords well with engineering practice, and the parameter selection is sim-ple and convenient. Therefore, the model is used widely since being proposed.
In summary, the considered factors of the existing mathematical models of concreteshrinkage are emphasized particularly, but all of these models have not considered the influe-nce of superplasticizer, fly ash, expansive agent, and other commonly used admixtures in pro-jects on shrinkage and also does not reflect the their positive and negative effects on dryingshrinkage of concrete. So they cannot accurately predict the shrinkage of concrete mixed withadditives. In addition, there is no consideration of influence of aggregate properties on con-crete shrinkage.
2. Parameters Considered in the Model and Its Basic Formula
2.1. Parameters Considered in the Model
Besides the environmental humidity, specimen geometry, strength, and other factors, themodel mainly considered the influence of replacement rate of recycled concrete aggregate(Hereinafter referred to as RCA) and the mixing amount of fly ash (FA), expansive agent ondrying shrinkage of recycled aggregate concrete (hereinafter referred to as RAC) in this paper.
2.2. Determination of the Basic Formula
On the basis of some basic law in AASHTO2007 model, the influence of replacement rate ofRCA and the mixing amount of fly ash, expansive agent on drying shrinkage were consideredsimultaneously in the model of this paper. The forecasting mathematical model of dryingshrinkage of RAC is obtained by fitting analysis of test results. The basic formula of the modelis shown in he following:
ε′sh = ks khs k′f ktd kr kk 0.48 × 10⁻³, (2.1)

4 Mathematical Problems in Engineering
Table 1: Mix design of RAC (kg/m3).
Project Group number Cement NCA RCA NFA Water FDN Sand ratio W/C FA UEA
RCA testRC0 426 1000 0 560 200 0 0.36 0.47 0 0RC70 426 300 700 560 200 0 0.36 0.47 0 0RC100 426 0 1000 560 200 0 0.36 0.47 0 0
FA test
FA0 426 0 1000 560 200 0 0.36 0.47 0 0FA10 426 0 1000 560 200 0 0.36 0.47 43 0FA20 426 0 1000 560 200 0 0.36 0.47 85 0FA30 426 0 1000 560 200 0 0.36 0.47 128 0
UEA test
UEA0 426 0 1000 560 200 0 0.36 0.47 0 0UEA8 426 0 1000 560 200 0 0.36 0.47 0 34.1UEA12 426 0 1000 560 200 0 0.36 0.47 0 51.1UEA15 426 0 1000 560 200 0 0.36 0.47 0 63.9
Table 2: Influence coefficient of strength grade.
Variety of concrete Strength grade (MPa) k′f
RAC20 0.7830 150 1.44
where kr is impact coefficient of RCA; kk is impact coefficient of additive; kk = kfa · ke, kfa isimpact coefficient of fly ash; ke is impact coefficient of expansive agent; the rest of parametersmeaning is same to (1.5).
3. Experimental Designs
3.1. Experimental Materials
Cement: P·S 32.5. Construction waste (hereinafter referred to as CW): generating from build-ing demolition in Kunming city, china. UEA-Expansive agent (hereinafter referred to asUEA): the recommended dosage is 8–12%. I grade product fly ash (hereinafter referred to asFA): the fineness is 7.3%.
3.2. Experimental Methods and Mix Proportion
Drying shrinkage test of RAC is made according to GBJ 82–85 “ordinary concrete test methodof long-term performance and durability.” In the test, mix design of C30 NAC is used as refer-ence. Specimen size is 100 mm × 100 mm × 515 mm mix proportion is shown in Table 1.
4. Experimental Results and Analysis
4.1. RAC Strength Grade and Its Impact on Drying Shrinkage of RAC
The influence coefficient k′f [7] (the influence of strength grade on drying shrinkage) is shown
in Table 2.

Mathematical Problems in Engineering 5
0 10 20 30 40 50 60 70 80 90 100
0
5
10
15
20
25
30
35
40
Time (day)
Experimental value of RC0Experimental value of RC70Experimental value of RC100
Calculated value of RC0Calculated value of RC70Calculated value of RC100
Dry
ing
shri
nkag
e va
lue
10−5
Figure 1: The influence of different RCA replacement rate on RAC drying shrinkage.
4.2. Replacement Rate of RCA and Its Impact on the DryingShrinkage of RAC
The result of the effects of replacement rate of RCA on drying shrinkage of RAC is shown inFigure 1.
The formula of forecasting mathematical model of concrete drying shrinkage consider-ing the influence of RCA replacement rate is shown in the following:
εshr(t) = kr · ε′sh. (4.1)
As can be seen from Figure 1, the concrete shrinkage curve of RAC with different RCAreplacement rate is in good agreement with the power function. The influence coefficient ofRCA according to power function is shown in (4.2), and the corresponding shrinkage modelis shown in (4.3):
kr = exp(a · vr + b), (4.2)
εshr = exp(a · vr + b) · ε′sh, (4.3)
where vr is replacement rate of RCA; a, b are constant which are derived from experimentaldata fitting.

6 Mathematical Problems in Engineering
Table 3: Table of fitting parameters of mathematical model.
Mathematical modelRegression coefficients
Fitting equation Correlationcoefficients
Mean squaredeviation F statistics
a b
Equation (4.3) 0.046 −0.003 Equation (4.5) 0.99459 1.56085 2565Equation (4.8) −3.88 1.18 Equation (4.10) 0.99324 3.15600 1390Equation (4.13) −1.85 −0.026 Equation (4.15) 0.99253 1.45512 1720
The function expression derived from regression fitting using Levenberg-Marquardtmethod + general global optimization method is shown in (4.4), (4.5), and the fitting para-meters are shown in Table 3:
kr = exp(0.046vr − 0.003), (4.4)
εshr = exp(0.046vr − 0.003) · ε′sh. (4.5)
When replacement rates of RCA are 0%, 70%, 100%, the concrete shrinkage valuesmeasured in the experimental at 3d age are 4.51 × 10⁻⁵, 4.6 × 10⁻⁵, 5.51 × 10⁻⁵, which is that theshrinkage strain of RAC with 70% RCA is 1.02 times of the natural coarse aggregate concretes(NACs) at 3 d age; the shrinkage strain of RAC with 100% recycled coarse aggregate is 1.2217times of NACs at 3 d age. The concrete shrinkage values measured in the experimental at 28 dage are 21.2 × 10⁻⁵ 22.1 × 10⁻⁵, 23.2 × 10⁻⁵, which is that the shrinkage strain of RAC with 70%recycled coarse aggregate is 1.02 times of the natural coarse aggregate concretes (NACs) at 3 dage; the shrinkage strain of RAC with 70% recycled coarse aggregate is 1.02 times of NACs at28 d age, the shrinkage strain of RAC with 100% recycled coarse aggregate is 1.094 times ofNACs at 28 d age; the concrete shrinkage values measured in the experimental at 60 d age are29.7 × 10−5, 29.9 × 10⁻⁵, 30.85 × 10⁻⁵, which is that the shrinkage strain of RAC with 70% recycl-ed coarse aggregate is 1.007 times of the natural coarse aggregate concretes (NACs) at 60 dage; the shrinkage strain of RAC with 100% recycled coarse aggregate is 1.009 times of NACsat 60 d age; the concrete shrinkage values measured in the experimental at 90 d age are 32.4× 10⁻⁵, 33.1 × 10⁻⁵, 33.8 × 10⁻⁵, which is that the shrinkage strain of RAC with 70% recycledcoarse aggregate is 1.02 times of the natural coarse aggregate concretes (NACs) at 90 d age,the shrinkage strain of RAC with 100% recycled coarse aggregate is 1.043 times of NACs at90 d age. It can clearly be seen that with the dosage of RCA increases, the shrinkage values ofRAC were gradually increasing, which is similar to the research results of Gomez-Soberon [8],Poon and Kou [9], Khatib [10]. This paper also found that the shrinkage values’ increasingtrend of RAC with 100% RCA is more obvious; the increasing trend of RAC shrinkage valuesin early age larger than late stages, but with the drying time increase, this trend graduallybecomes flat.
We can see that the increase effect of drying shrinkage caused by RCA is larger in theearly time than late stage’s; the shrinkage strain of RAC with 100% RCA is larger significantlythan NAC’s, This may be because RCA itself has larger shrinkage deformation and lowerelastic modulus [11].
In regression (4.4), when vr is from 0 to 0.7, 1, kr is from 0.9974 to 1.031, 1.045, it is1.033 and 1.048 times of the original, which tallies with the experimental results. As can beseen from Table 3, the model correlation coefficients are over 0.99, which explains that theforecasting mathematical model (4.5) in this paper is with high accuracy.
Mathematical Problems in Engineering 7
0 10 20 30 40 50 60 70 80 90 100
0
5
10
15
20
25
30
35
Drying time (day)
Experimental value of FA10Experimental value of FA20Experimental value of FA30
Calculated value of FA10Calculated value of FA20Calculated value of FA30
Dry
ing
shri
nkag
e va
lue
10−5
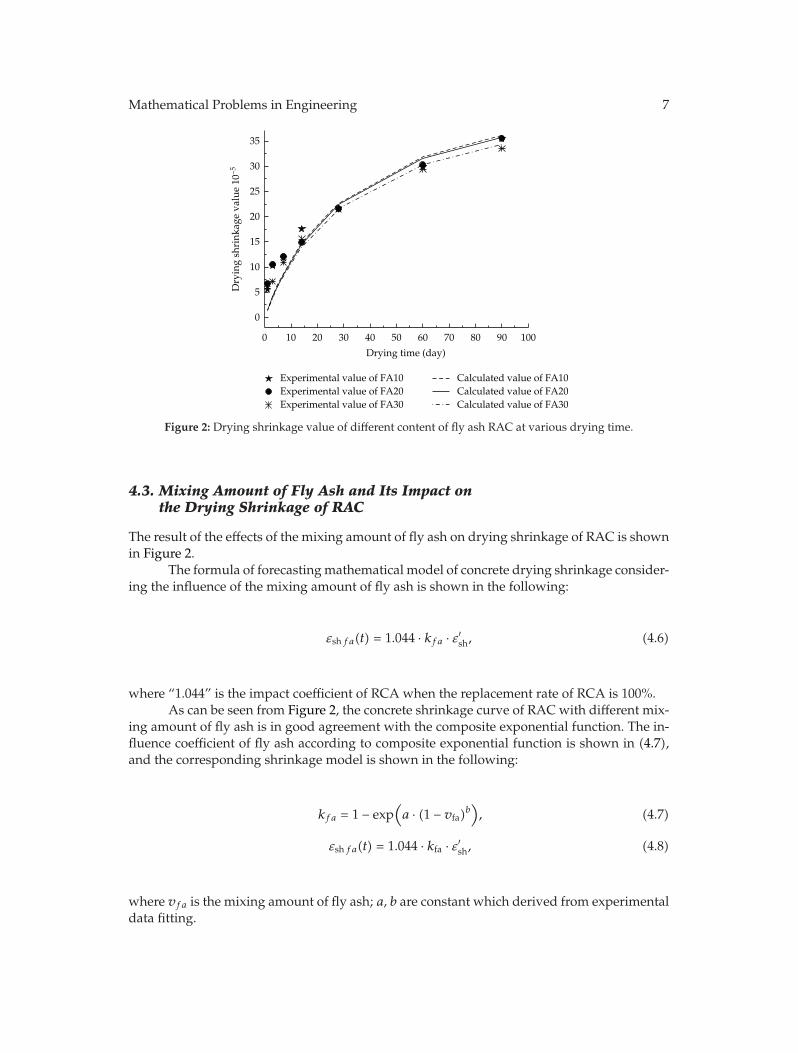
Figure 2: Drying shrinkage value of different content of fly ash RAC at various drying time.
4.3. Mixing Amount of Fly Ash and Its Impact onthe Drying Shrinkage of RAC
The result of the effects of the mixing amount of fly ash on drying shrinkage of RAC is shownin Figure 2.
The formula of forecasting mathematical model of concrete drying shrinkage consider-ing the influence of the mixing amount of fly ash is shown in the following:
εsh fa(t) = 1.044 · kfa · ε′sh, (4.6)
where “1.044” is the impact coefficient of RCA when the replacement rate of RCA is 100%.As can be seen from Figure 2, the concrete shrinkage curve of RAC with different mix-
ing amount of fly ash is in good agreement with the composite exponential function. The in-fluence coefficient of fly ash according to composite exponential function is shown in (4.7),and the corresponding shrinkage model is shown in the following:
kfa = 1 − exp(a · (1 − vfa)b
), (4.7)
εsh fa(t) = 1.044 · kfa · ε′sh, (4.8)
where vfa is the mixing amount of fly ash; a, b are constant which derived from experimentaldata fitting.
8 Mathematical Problems in Engineering
The function expression derived from regression fitting using Levenberg-Marquardtmethod + general global optimization method is shown in (4.9), (4.10), and the fitting para-meters are shown in Table 3:
kfa = 1 − exp(−3.38
(1 − vfa
)1.18), (4.9)
εsh fa(t) = 1.044 ·(
1 − exp(−3.38 · (1 − vfa
)1.18))
· ε′sh. (4.10)
As can be seen from Figure 2, when the mixing amount of fly ash is 10%, 20%, 30%, theconcrete shrinkage values measured in the experimental at 3 d age are 10.26 × 10⁻⁵, 10.55 ×10⁻⁵, 7.17 × 10⁻⁵, which is that the shrinkage strain of RAC with 20% fly ash is 1.208 times ofthe RACs with 10% fly ash at 3d age; the shrinkage strain of RAC with 30% fly ash is 0.6988times of RACs with 10% fly ash at 3d age. The concrete shrinkage values measured in the ex-perimental at 28 d age are 21.6 × 10⁻⁵, 21.55 × 10⁻⁵, 21.46 × 10⁻⁵, which is that the shrinkagestrain of RAC with 20% fly ash is 0.9977 times of the RACs with 10% fly ash at 28 d age; theshrinkage strain of RAC with 30% fly ash is 0.9935 times of the RACs with 10% fly ash at 28 dage. the concrete shrinkage values measured in the experimental at 60 d age are 29.91 × 10−5,30.31 × 10−5, 29.44 × 10⁻⁵, which is that the shrinkage strain of RAC with 20% fly ash is 1.013times of the RACs with 10% fly ash at 60 d age; the shrinkage strain of RAC with 30% fly ashis 0.9843 times of RACs with 10% fly ash at 60 d age. The concrete shrinkage values measuredin the experimental at 90 d age are 35.46 × 10⁻⁵, 35.45 × 10⁻⁵, 33.47 × 10⁻⁵, which is that theshrinkage strain of RAC with 20% fly ash is 0.9997 times of the RACs with 10% fly ash at 90 dage; the shrinkage strain of RAC with 30% fly ash is 0.9439 times of the RACs with 10% fly ashat 90 d age.
The results show that the addition of fly ash will slightly increase the shrinkage of RACin early drying time, but, generally, the addition of fly ash can inhibit the drying shrinkage ofRAC; however, this effect is not very obvious. The study found that the addition of fly ash willincrease the shrinkage to some extent when the mixing amount is 20%, the phenomenon ismore apparent in the early time, whose conclusion is slightly different from the research resultof Mandal and Gupta [12]. This maybe because the total porosity of RAC with 20% fly ashslightly higher than that with 10%, 30% fly ashes.
In regression (4.9), when vfa is from 0.1 to 0.2, 0.3, kfa is from 0.9675 to 0.9493, 0.9217, itis 0.9812 and 0.9527 times of the original, which tallies with the experimental results. As canbe seen from Table 3, the model correlation coefficients are over 0.99, which explains that theforecasting mathematical model (4.10) in this paper is with high accuracy.
4.4. Mixing Amount of Expansive Agent and Its Impact onthe Drying Shrinkage of RAC
The result of the effects of the mixing amount of expansive agent on drying shrinkage of RACis shown in Figure 3.
The formula of forecasting mathematical model of concrete drying shrinkage consid-ering the influence of the mixing amount of expansive agent is shown in the following:
εsh e(t) = 1.044 · ke · ε′sh. (4.11)

Mathematical Problems in Engineering 9
0 10 20 30 40 50 60 70 80 90 100
0
5
10
15
20
25
30
35
Drying time (day)
Experimental value of UEA0Experimental value of UEA8Experimental value of UEA12Experimental value of UEA15
Calculated value of UEA0Calculated value of UEA8Calculated value of UEA12Calculated value of UEA15
Dry
ing
shri
nkag
e va
lue
10−5
Figure 3: Drying shrinkage value of different content of expansion agent RC at various drying time.
As can be seen from Figure 3, the concrete shrinkage curve of RAC with different mix-ing amount of expansive agent is in good agreement with the power function. The influencecoefficient of fly ash according to power function is shown in (4.12), and the correspondingshrinkage model is shown in (4.13):
ke = exp(a · ve + b), (4.12)
εsh e(t) = 1.044 · ke · ε′sh. (4.13)
The function expression derived from regression fitting using Levenberg-Marquardtmethod + general global optimization method is shown in (4.14), (4.15), and the fitting para-meters are shown in Table 3:
ke = exp(−1.85ve − 0.026), (4.14)
εsh e(t) = 1.044 · exp(−1.85ve − 0.026) · ε′sh. (4.15)
As can be seen from Figure 3, when the mixing amount of expansive agent are 0%, 8%,12%, and 15%, the concrete shrinkage values measured in the experimental at 3 d age are 4.51× 10⁻⁵, 4.47 × 10⁻⁵, 4.42 × 10⁻⁵, 4.24 × 10⁻⁵, which is that the shrinkage strain of RAC with 8%expansive agent is 0.9911 times of the RACs with 0% expansive agent at 3 d age; the shrinkagestrain of RAC with 12% expansive agent is 0.9800 times of the RACs with 0% expansive agentat 3 d age; the shrinkage strain of RAC with 15% expansive agent is 0.9401 times of the RACswith 0% expansive agent at 3 d age. The concrete shrinkage values measured in the experi-mental at 28 d age are 21.2 × 10⁻⁵, 18.81 × 10⁻⁵, 18.12 × 10⁻⁵, 17.81 × 10⁻⁵, which is that theshrinkage strain of RAC with 8% expansive agent is 0.8873 times of the RACs with 0%

10 Mathematical Problems in Engineering
expansive agent at 28 d age; the shrinkage strain of RAC with 12% expansive agent is 0.8547times of the RACs with 0% expansive agent at 28 d age; the shrinkage strain of RAC with 15%expansive agent is 0.8401 times of the RACs with 0% expansive agent at 28 d age. The concreteshrinkage values measured in the experimental at 60 d age are 29.7 × 10⁻⁵, 26.92 × 10⁻⁵, 25.03× 10⁻⁵, 23.84 × 10⁻⁵, which is that the shrinkage strain of RAC with 8% expansive agent is0.9064 times of the RACs with 0% expansive agent at 60 d age; the shrinkage strain of RACwith 12% expansive agent is 0.8519 times of the RACs with 0% expansive agent at 60 d age;the shrinkage strain of RAC with 15% expansive agent is 0.8027 times of the RACs with 0% ex-pansive agent at 60 d age. The concrete shrinkage values measured in the experimental at 90 dage are 32.4 × 10⁻⁵, 26.85 × 10⁻⁵, 26.08 × 10⁻⁵, 24.32 × 10⁻⁵, which is that the shrinkage strainof RAC with 8% expansive agent is 0.8287 times of the RACs with 0% expansive agent at 90 dage; The shrinkage strain of RAC with 12% expansive agent is 0.8049 times of the RACs with0% expansive agent at 90 d age; the shrinkage strain of RAC with 15% expansive agent is0.7506 times of the RACs with 0% expansive agent at 90 d age.
It can clearly be seen that the addition of expansive agent can obviously inhibit theshrinkage of RAC and the inhibition affection is better than that of fly ash, which is similar tothe research result of Bissonnette et al. [13].
In regression (4.14), when ve is from 0 to 0.08, 0.12, 0.15, ke is from 0.9743 to 0.7804,0.7382, it is 0.8624, 0.8009, and 0.7577 times of the original, which tallies with the experimentalresults. As can be seen from Table 3, the model correlation coefficients are over 0.99, whichexplains that the forecasting mathematical model (4.15) in this paper is with high accuracy.
4.5. Ambient Humidity, Specimen Size, and Its Impact onthe Drying Shrinkage of RAC
According to AASHTO2007 model (1.5), khs = (2.00 − 0.014H), when relative humidity isfrom 60% to 100%, khs value changes from 1.16 to 0.6, which decreases by 48.3%. The resultshow that the change of humidity having have a great impact on drying shrinkage of concretematerials.
In general, the effect of specimen size on concrete shrinkage is mainly embodied in thespread speed of internal moisture to the outside and the impact mechanism on shrinkage hasthe similar law to that of relative humidity [13]. The size of shrinkage test mode in this paperis 100 mm × 100 mm × 515 mm, then V/S = 22.79. The effect coefficient of specimen size isdirectly calculated from AASHTO2007 model (1.6).
4.6. Forecasting Mathematical Models of Concrete Drying Shrinkage of RAC
With (2.1) as basic formula, in the comprehensive study in Sections 4.1, 4.2, 4.3, 4.4, and 4.5in this paper, the forecasting mathematical models of drying shrinkage of RAC are shown inthe following:
ε′sh = 0.00048 ks · khs · ktd · k′f exp(0.046vr − 0.003) ·
(1 − exp
(−3.38(1 − vfa)1.18
))
· exp(−1.85ve − 0.026),(4.16)
where ε′sh is shrinkage strain, 10−5; ks is effect coefficient of component size (as can be seenfrom (1.6)); khs = (2.00 − 0.014H) is humidity correlation coefficient; H is humidity; k′
fis

Mathematical Problems in Engineering 11
−0.2
−0.15
−0.1
−0.05
0
Dis
plac
emen
t(m
m)
0 20 40 60 80 100 120 140 160 180
Drying time (day)
Experimental value Calculated value
(a) GSC20
−0.3
−0.25
−0.2
−0.15
−0.1
−0.05
0
0 20 40 60 80 100 120 140 160 180
Drying time (day)
Experimental value Calculated value
Dis
plac
emen
t (m
m)
(b) GSC50
Figure 4: Calculated value of displacement of RAC contrasted with experimental value.
Table 4: Table of mix design in verification test.
Project Strengthgrade
Cement(kg/m3)
RCA(kg/m3)
Sand(kg/m3)
Water(kg/m3)
Sand ratio(kg/m3) W/C FDN
(kg/m3)UEA
(kg/m3)FA
(kg/m3)
GSC20 C20 299 970 700 200 0.42 0.67 1.50 / /GSC50 C50 476 950 510 200 0.35 0.36 2.38 27.8 80
correlation coefficient of concrete strength grade (as can be seen from Table 2); ktd = (t/(61 −0.58f ′
ci+t)) is correlation coefficient with the development of time t;f ′ci is compressive strength
of concrete at 28 d age; vr is replacement rate of RCA; vfa is the mixing amount of fly ash; ve
is the mixing amount of expansive agent. The rest of parameters’ meaning is same to those in(1.5).
5. Error Analysis and Model Validation
In order to verify the accuracy of the model, GSC20 and GSC50 (the strength grade is, resp.,C20, and C50), two different groups shrinkage specimen are devised and prepared in thispaper. The mix design of verification experiment is shown in Table 4.
One point located on the top surface of the specimen selected as object, transformingthe shrinkage values of the point into displacement, the comparison chart of calculated andexperimental values of GSC20, GSC50, is shown in Figures 4(a) and 4(b)
Absolute error and relative error are selected as indexes to do error analysis of displace-ment calculated values of RAC; the formula is shown in the following:
ea = xc − xe, (5.1)
er =eaxe
× 100%, (5.2)
where ea is absolute error value; xe is experimental value of displacement, mm; xc is calcu-lated value of displacement, mm; er is relative error value, 100%.

12 Mathematical Problems in Engineering
0 20 40 60 80 100 120 140 160 1800
0.010.020.030.040.050.060.070.080.090.1
Abs
olut
e er
ror
Drying time (day)
0 20 40 60 80 100 120 140 160 1800
102030405060708090
100
Rel
ativ
e er
ror
(%)
Drying time (day)
(a) GSC20
0 20 40 60 80 100 120 140 160 1800
0.010.020.030.040.050.060.070.080.090.1
Abs
olut
e er
ror
Drying time (day)
0 20 40 60 80 100 120 140 160 1800
102030405060708090
100
Rel
ativ
e er
ror
(%)
Drying time (day)
(b) GSC50
Figure 5: Error analysis chart of displacement calculated value and experimental value of RAC.
The absolute error values and relative error values are calculated according to (5.1)and (5.2). The error distribution curve drew by Matlab is shown in Figure 5.
Figures 5(a) and 5(b) is error chart (including absolute error and relative error) of con-crete of GSC20 and GSC50. As can be seen from Figures 5(a) and 5(b), the absolute error val-ues between calculated shrinkage value (calculated by the model built in this paper) and ex-perimental value have small fluctuation in 180-day drying time. Especially after 60 d dryingtime, the absolute error values gradually approach zero, which indicates that the model builtin this paper has high accuracy after 60 d drying time. The absolute error values have largefluctuation in the drying time of 0 ∼ 28 d, the maximum absolute error value arises in the dry-ing time of 14 d, absolute error value is about 0.035. The relative error values between calcu-lated shrinkage value and experimental value have the similar law to the absolute error onesin 180-day drying time. The relative error values have large fluctuation in the early dryingtime, the relative maximum error value is even up to 95%, but, with the drying time increase,the relative error values are becoming smaller and smaller. Especially after 60 d drying time,the error values gradually approach zero.
So, as can be seen from Figures 4 and 5, the drying shrinkage values calculated in theuse of the model of this paper are slightly smaller than those of experimental values, but,with the drying time increase, the calculated values have higher coincide degree with the ex-perimental results. Calculated values and experimental values of RAC shrinkage are almost

Mathematical Problems in Engineering 13
the same in 60 d age especially, which also shows that the forecasting mathematical modelsof drying shrinkage of RAC builded in this paper have high accuracy and rationality.
6. Conclusion
(1) Under the same experimental condition, the drying shrinkage values of RAC arehigher than those of NAC because of the reduce of RAC inhibition effect and old cementmortar’s further shrinkage after water absorption, and this trend is even more obvious in theearly drying time. With the replacement rate of RCA increases, the drying shrinkage value ofRAC increases too.
(2) The addition of fly ash can inhibit the drying shrinkage of RAC, but the effect is notvery obvious. Specifically, the addition of fly ash will increase the shrinkage to some extentwhen the mixing amount is 20%, the phenomenon is more apparent in the early time. This isbecause the total porosity of RAC with 20% fly ash is slightly higher than that with 10%, 30%fly ashes.
(3) The addition of expansive agent can obviously inhibit the shrinkage of RAC, the in-hibition affection is better than that of fly ash.
(4) Through regression analysis of large number of experimental data, the forecastingmathematical models of drying shrinkage of RAC shown as follow:
ε′sh = 0.048 × 10⁻³ × ks · khs · ktd · k′f exp(0.046vr − 0.003) ·
(1 − exp
(−3.38(1 − vfa)1.18
))
· exp(−1.85ve − 0.026).(6.1)
(5) The forecasting mathematical models of drying shrinkage of RAC built in this pa-per have high accuracy and rationality according to experiment validation and error analysis.
Acknowledgments
This project was supported by the Project of Science and Technology Committee of WanzhouDistrict of China (WZ011R003), Key Projects of Chongqing Three Gorges University (11ZD-14), Talents Project of Chongqing Three Gorges University (11RC-16), and Ph.D. Funded Pro-jects of Chongqing Three Gorges University (11ZZ-62).
References
[1] Z. Lv and Z. Yingchen, Shrinkage and Creep, China Railway Publishing House China Railway Publish-ing House, Beijing, China, 1994.
[2] D. W. Mokarem, R. E. Weyers, and D. S. Lane, “Development of a shrinkage performance specifica-tions and prediction model analysis for supplemental cementitious material concrete mixtures,” Ce-ment and Concrete Research, vol. 35, no. 5, pp. 918–925, 2005.
[3] O. Chaalla, B. Benmokrane, and G. Ballivy, “Drying shrinkage strains: experimental versus codes,”ACI Materials Journal, vol. 89, no. 3, pp. 263–266, 1992.
[4] ACI209 R-82, “Prediction of creep, shrinkage and temperature effects in Concrete Structures”.[5] N. J. Gardner and M. J. Lockman, “Design provisions for drying shrinkage and creep of normal-
strength concrete,” ACI Materials Journal, vol. 98, no. 2, pp. 159–167, 2001.
14 Mathematical Problems in Engineering
[6] “AASHTO LRFD bridge design specifications section 5: concrete structures,” in Proceedings of theAmerican Association of State Highway and Transportation Officials (AASHTO ’07), Washington, DC, USA,2007.
[7] G. Yuanchen, Drying Shrinkage Properties of Recycled Aggregate/ Cement Composite, Kunming Universityof Science and Technology, Kunming, China, 2010.
[8] J. M. V. Gomez-Soberon, “Porosity of recycled concrete with substitution of recycled concrete ag-gregate: an experimental study,” Cement and Concrete Research, vol. 32, no. 8, pp. 1301–1311, 2002.
[9] C. S. Poon and S. C. Kou, “Properties of steam cured recycled aggregate concrete,” in Proceedings of theInternational Conference on Sustainable Waste Management and Recycling, pp. 1–12, September 2004.
[10] J. M. Khatib, “Properties of concrete incorporating fine recycled aggregate,” Cement and Concrete Re-search, vol. 35, no. 4, pp. 763–769, 2005.
[11] K. Eguchi, K. Teranishi, and M. Narikawa, “Study on mechanism of drying shrinkage and water lossof recycled aggregate concrete,” Journal of Structure and Construction Engineering, vol. 3, pp. 1–7, 2003.
[12] S. Mandal and A. Gupta, “Strength and durability of recycled aggregate concrete,” in Towards a BetterBuilt Environment Innovation, Sustainability, Information Technology, E. Zurich, Ed., Zurich, Switzerland,2002.
[13] B. Bissonnette, P. Pierre, and M. Pigeon, “Influence of key parameters on drying shrinkage of cementi-tious materials,” Cement and Concrete Research, vol. 29, no. 10, pp. 1655–1662, 1999.

Submit your manuscripts athttp://www.hindawi.com
Hindawi Publishing Corporationhttp://www.hindawi.com Volume 2014
MathematicsJournal of
Hindawi Publishing Corporationhttp://www.hindawi.com Volume 2014
Mathematical Problems in Engineering
Hindawi Publishing Corporationhttp://www.hindawi.com
Differential EquationsInternational Journal of
Volume 2014
Applied MathematicsJournal of
Hindawi Publishing Corporationhttp://www.hindawi.com Volume 2014
Probability and StatisticsHindawi Publishing Corporationhttp://www.hindawi.com Volume 2014
Journal of
Hindawi Publishing Corporationhttp://www.hindawi.com Volume 2014
Mathematical PhysicsAdvances in
Complex AnalysisJournal of
Hindawi Publishing Corporationhttp://www.hindawi.com Volume 2014
OptimizationJournal of
Hindawi Publishing Corporationhttp://www.hindawi.com Volume 2014
CombinatoricsHindawi Publishing Corporationhttp://www.hindawi.com Volume 2014
International Journal of
Hindawi Publishing Corporationhttp://www.hindawi.com Volume 2014
Operations ResearchAdvances in
Journal of
Hindawi Publishing Corporationhttp://www.hindawi.com Volume 2014
Function Spaces
Abstract and Applied AnalysisHindawi Publishing Corporationhttp://www.hindawi.com Volume 2014
International Journal of Mathematics and Mathematical Sciences
Hindawi Publishing Corporationhttp://www.hindawi.com Volume 2014
The Scientific World JournalHindawi Publishing Corporation http://www.hindawi.com Volume 2014
Hindawi Publishing Corporationhttp://www.hindawi.com Volume 2014
Algebra
Discrete Dynamics in Nature and Society
Hindawi Publishing Corporationhttp://www.hindawi.com Volume 2014
Hindawi Publishing Corporationhttp://www.hindawi.com Volume 2014
Decision SciencesAdvances in
Discrete MathematicsJournal of
Hindawi Publishing Corporationhttp://www.hindawi.com
Volume 2014 Hindawi Publishing Corporationhttp://www.hindawi.com Volume 2014
Stochastic AnalysisInternational Journal of