strategic energy analysis at nrel (presentation) energy analysis at nrel nrel/pr-670-42435 presented...
TRANSCRIPT

1
November 2007
Douglas J. Arent, Ph.D., MBADirector
Strategic Energy Analysis & Applications Center
Strategic Energy Analysis at NREL
NREL/PR-670-42435Presented at the 20th NREL Industry Growth Forum held November 6-8, 2007 in Denver, Colorado

2
Integrated technical and economic analyses that advance the understanding of the value of technology in the context of dynamic global, national, and local markets,
policies, energy resources and loads, and infrastructure.
Strategic Energy Analysis
Analyze system performance and technology interfaces in the context of the overall system
System
Assess resource availability and characteristics
Resource
Analyze technology and component performance and cost
Technology/Component
Analyze benefits and impacts of programs, portfolios, and policy options
Impact
3
Some Key Themes for Analysis
Core Areas:Market, Technology and Policy AnalysisEnergy Modeling Analysis
Renewables, Hydrogen, Alt. Fuels
Risk, Benefits, and Portfolio Analysis

4
Tools to Inform Decision Making…• RET Finance• Real Options• Hybrid2• Vipor• HOMER• Fresa• Geospatial • Tool Kit• PV Watts• Advisor• Energy-10• Solar Advisor Model• SUNREL• JEDI
5
Understanding Energy Resources and potential impact of technology
advances on national goals
• Example: Solar resources in the Southwest. Resource (technical) potential to “economic” (e.g. commercially feasible) to “accessible” and links to transmission access, markets, pricing, technology adoption (learning) and thus technology advances….

6
Solar in the SouthWest: More than just photons
• Gross irradiance is baseline: Analysis to refine to “economic potential” to accessible and linkage to technology adoption, learning and advances in technology.

7
SOLARDS – PV on Buildings Market Penetration
By including rate diversity (especially tiered rates) SOLARDS captures more early adopters, especially in California. Early adoption in niche markets increases learning and penetration in other markets
8
Decisions “under uncertainty”
• Uncertainty and Translating R&D to Benefits via the applied technology pathway– Learning curve impacts; scale and technology
advances– Technology adoption impacts– Assessing multiple pathways– Valuing the R&D options
• Uncertainty, Risk, Real Options

9
Many (most?) major energy market drivers are highly uncertain and outside the scope of
most energy market models
Nuclear emergesTechnology Available
Too cheap to meter
Gas declines PIFUA prohibits
Nuclear declineInterest rates3-Mile Island (1979)Chernobyl (1986)Regulation
Gas increases(50+ GW added in 2002)PIFUA changedPURPACC efficiencyLow price through deregulation
Coal declinesCAAAderegulation
63 GW Science & TechnologyAdvances, particularlyFor Basis ScienceAre also highly uncertain

10
What Might a Stochastic Model Show You?
• Incorporating uncertainty into an energy market model conveys significantly more information than a single point estimate

11
“Valuation” depends on Analytic Approach
• Discounted Cash Flow (DCF) or other “linear” approaches may not be most appropriate.
• Stochastic analysis and options analysis offer alternative insights.
Source: Optimizing the Level ofRenewable Electric R&DExpenditures Using RealOptions Analysis, NREL/TP-620-31221, 2003

12
Market Development Insights:ReEDS- Regional Energy
Deployment Systems Model
A multi-regional, multi-time-period model of capacity expansion in the electric sector of the U.S.
Designed to estimate market potential of energy technologies in the U.S. for the next 20 – 50 years under different technology development and policy scenarios

13
ReEDS Model:Detailed Treatment of Wind Grid Integration Issues

14
Wind Resources in WinDS

15
WinDS 2030 RPS:Transmission and Consumption
16
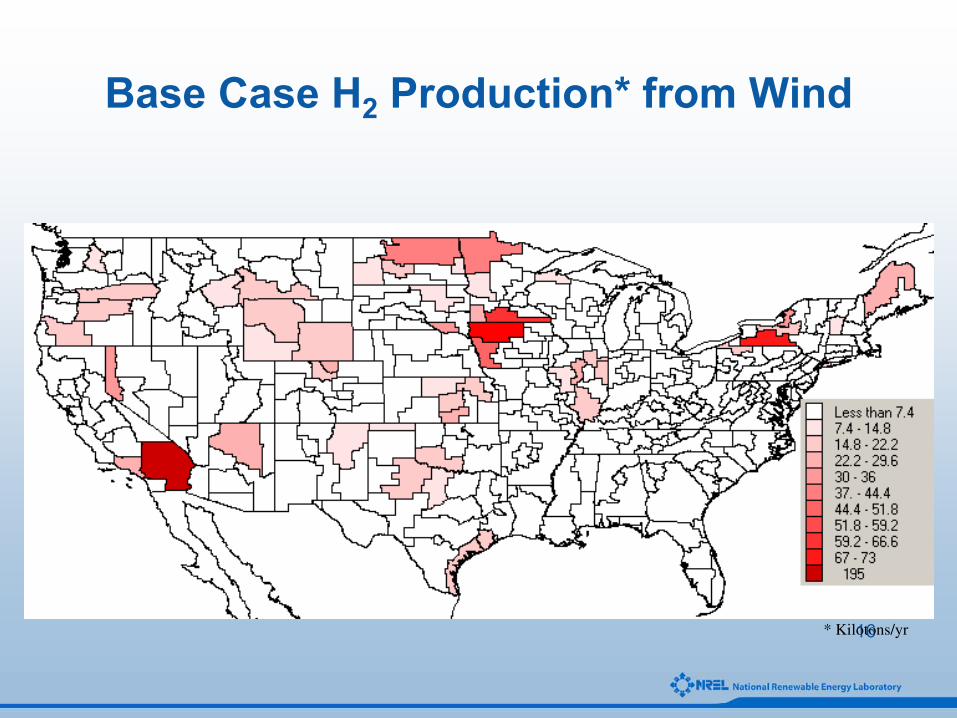
Base Case H2 Production* from Wind
* Kilotons/yr
17
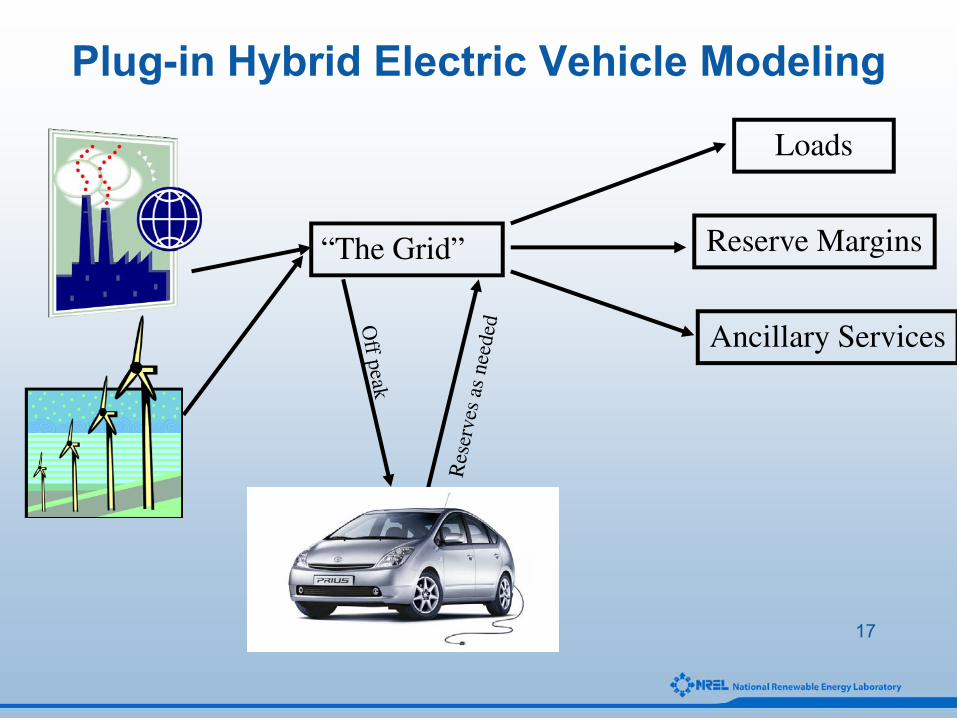
Plug-in Hybrid Electric Vehicle Modeling
“The Grid”
Loads
Reserve Margins
Ancillary Services

18
PHEVs* Can Increase Wind Penetration
* Assumes 50% PHEV-V2G penetration by 2050

19
Coal Generation: PHEV60 – Base Case

20
Industry Partnerships
• Who:– Utilities– Corporations– Developers– Investors
• What:– Strategic Planning– Market Insights– Scenario Modeling & Impacts– Expert Review– Transformational Applications
21
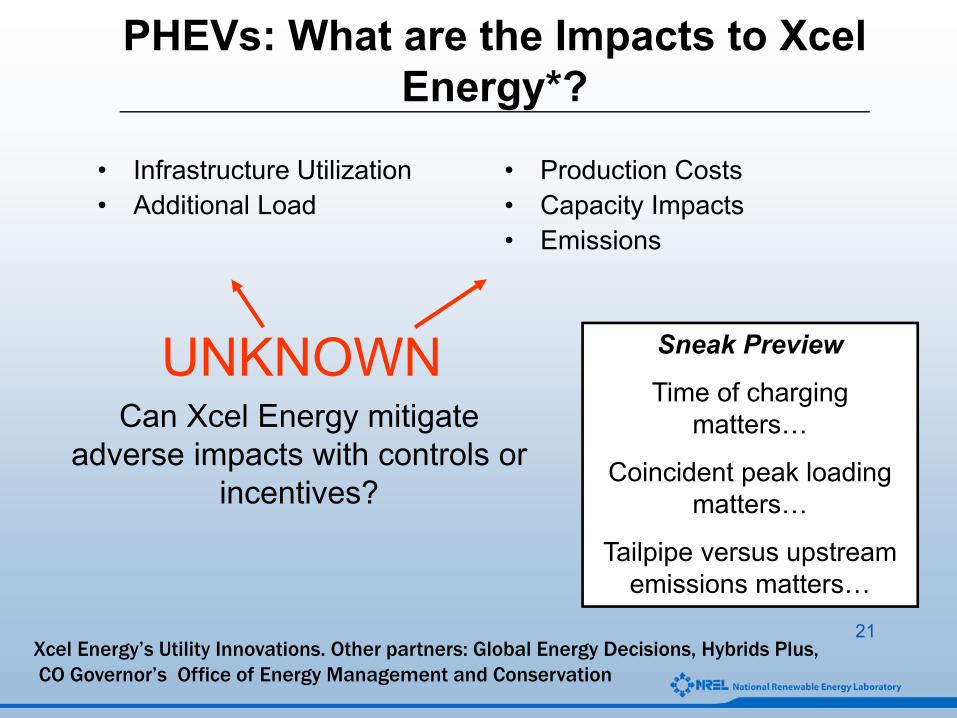
PHEVs: What are the Impacts to Xcel Energy*?
• Infrastructure Utilization • Additional Load
• Production Costs• Capacity Impacts• Emissions
Can Xcel Energy mitigate adverse impacts with controls or
incentives?
UNKNOWN Sneak Preview
Time of charging matters…
Coincident peak loading matters…
Tailpipe versus upstream emissions matters…
Xcel Energy’s Utility Innovations. Other partners: Global Energy Decisions, Hybrids Plus, CO Governor’s Office of Energy Management and Conservation

22
• Opportunity charging is the most costly charging strategy, but utilizes 75% more energy
Incremental Cost (Generation Capacity)
• Costs are dominated by fuel cost• As power is moved to the off-peak period…
23
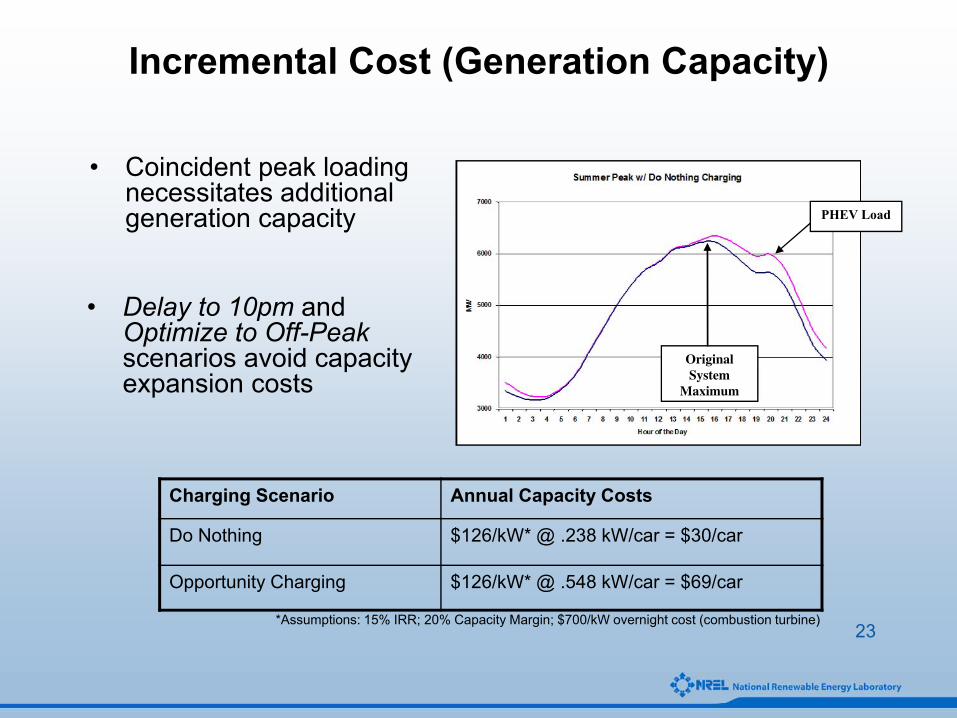
Incremental Cost (Generation Capacity)
• Coincident peak loading necessitates additional generation capacity
Original System
Maximum
PHEV Load
Charging Scenario Annual Capacity Costs
Do Nothing $126/kW* @ .238 kW/car = $30/car
Opportunity Charging $126/kW* @ .548 kW/car = $69/car
*Assumptions: 15% IRR; 20% Capacity Margin; $700/kW overnight cost (combustion turbine)
• Delay to 10pm and Optimize to Off-Peakscenarios avoid capacity expansion costs

24
Incremental Cost (Generation)
• Two significant changes when shifting PHEV load to the off-peak – Delay to 10pm shifts
generation from CT to CC – Optimized to Off-Peak then
shifts generation from CC to coal steam.
• Opportunity charging largely served by CT
*Other generation such as hydro, diesel, and wind are small contributors to incremental generation and are excluded from this graph
25
Synopsis
• Core Strengths: – Technoeconomic Systems Analysis– Geospatial Energy Economics– US Markets for RE/EE Technology– Policy and Technology Options Analysis– Uncertainty, Risk, and R&D Portfolio expertise