strategic factors impacting the california crude oil … · strategic factors impacting the...
TRANSCRIPT
1
California Independent Petroleum Association28th Annual Meeting
1June 12, 2004
P..Strategic Factors Impacting The California Crude Oil Market
California Independent Petroleum Association
28th Annual Meeting
June 12, 2004Hyatt Regency Huntington Beach
Mike SarnaEric WeiLong Beach Office
California Independent Petroleum Association28th Annual Meeting
2June 12, 2004
P..About Purvin & Gertz, Inc.
• Privately-Owned, Independent International Energy Consulting Firm
• Founded in 1947• Over 100 staff members worldwide• All consultants have chemical engineering
degrees• Representative offices in
– Houston, Texas (Headquarters)– Long Beach, California (Since 1982)– Calgary, Canada– Singapore– London, England– Moscow, Russia– Buenos Aires, Argentina
• Website at www.purvingertz.com
• Main Services:– Crude oil and natural gas market analysis– Refinery analysis (technical & economic)– Refined product market analysis– Terminal/Pipeline infrastructure analysis– Due diligence/ Independent engineer– Strategic planning/ M&A assistance– Asset valuation– Litigation support– Training & Seminars
– Studies are conducted on single or multi-client basis
– Routine Publications– Petroleum & natural gas price forecast– Global supply/demand projections

2
California Independent Petroleum Association28th Annual Meeting
3June 12, 2004
P..Presentation Overview
• California Crude Oil Market– California Refinery Demand– ANS Supplies– California Supplies– Foreign Supplies
• Factors Impacting California Crude Oil Price– California Benchmark Crude Oil Price– Import Costs– Global Supply-Demand Balance– International Crude Price– California Crude Oil Quality Differentials
• Closing Remarks
California Independent Petroleum Association28th Annual Meeting
4June 12, 2004
P..California Crude Oil Marketing Regions
• Refineries in San Francisco and Los Angeles are dependent on ANS and imported crude oil deliveries by tanker.
• Refineries in Central California process SJV and OCS crude.
• Closure of Shell Bakersfield refinery pending.
NEVADA
CALIFORNIA
ARIZONALos AngelesRefining Capacity
970 MBPD
Los AngelesRefining Capacity
970 MBPD
Ventura
Gaviota
Central AreaRefining Capacity
185 MBPD
Central AreaRefining Capacity
185 MBPD
San FranciscoRefining Capacity
620 MBPD
San FranciscoRefining Capacity
620 MBPD

3
California Independent Petroleum Association28th Annual Meeting
5June 12, 2004
P..California Crude Oil Supply Shift
• Decline in ANS supplies has led to increased dependence on foreign crude oils.
• Refiners must create strategies for foreign crude oil supplies. • Growing role of imported crudes creates basis for projecting the
value of California crudes.
1997 CRUDE OIL DEMAND1,617 Thousand Barrels Per Day
CA52%ANS
37%
Foreign11%
2003 CRUDE OIL DEMAND1,791 Thousand Barrels Per Day
CA43%
ANS23%
Foreign34%
Source: EIA, CEC, Purvin & Gertz Analysis
California Independent Petroleum Association28th Annual Meeting
6June 12, 2004
P..California Fuel Consumption Growth
California population growth will continue to drive demand growth for gasoline, jet and diesel fuels.
California refinery crude runs are likely to creep further, but more refined product imports are also expected.
California refiners will import more crude oil to meet growing demand.
0
200
400
600
800
1000
1200
1400
1600
1800
2000
2002
2004
2006
2008
2010
2012
2014
2016
2018
2020
2022
2024
FU
EL
CO
NS
UM
PT
ION
-M
BP
D
0.0%
0.5%
1.0%
1.5%
2.0%
2.5%
3.0%
3.5%
4.0%
4.5%
5.0%
AN
NU
AL
GR
OW
TH -%
TOTAL VEHICLE FUEL CONSUMPTION
(MBPD)
VEHICLE CONSUMPTION
Annual Growth %
Source: CalTrans

4
California Independent Petroleum Association28th Annual Meeting
7June 12, 2004
P..Historical West Coast Refinery Crude Runs
Crude runs increased 4% in 2003: – MTBE Phase-out – Economic recovery
Washington refineries account for roughly 23% (~540 MBPD) of crude demand.
0
500
1000
1500
2000
2500
1996 1997 1998 1999 2000 2001 2002 2003
CA WA
Thousands Of Barrels Per Day
Source: EIA, CEC
California Independent Petroleum Association28th Annual Meeting
8June 12, 2004
P..Historical California Crude Runs By Source
855
611
188
849
591
285
829
409
401
842
357
488
805
331
537
793
385
549
759
417
615
0
200
400
600
800
1000
1200
1400
1600
1800
1997 1998 1999 2000 2001 2002 2003
CA Crude ANS Crude Imported Crude
Thousands of Barrels Per Day
Source: CA DOGGR, CEC, EIA, Purvin & Gertz Analysis

5
California Independent Petroleum Association28th Annual Meeting
9June 12, 2004
P..ANS Disposition
ANS deliveries have favored Washington over California– Lower transportation costs
• Better utilization of Jones Act tankers
– Limited infrastructure for larger foreign crude tankers
Some west coast refiners control a significant share of ANS marketing– ConocoPhillips– ExxonMobil– BP
California Independent Petroleum Association28th Annual Meeting
10June 12, 2004
P..Historical ANS Production
ANS declines have slowed due to recent recovery enhancements & development of new fields.
ANS deliveries to California have declined.
Washington refineries have continued to rely on ANS.
-
500
1,000
1,500
2,000
1982
1983
1984
1985
1986
1987
1988
1989
1990
1991
1992
1993
1994
1995
1996
1997
1998
1999
2000
2001
2002
2003
Total Cook Inlet ProductionAlaskan North Slope
WA Refinery Crude Demand
(Thousand Barrels per Day)
Washington Refinery Crude Demand
Source: EIA, AK Dept. Of Oil & Gas

6
California Independent Petroleum Association28th Annual Meeting
11June 12, 2004
P..California Oil Production Declines
• Total California production declined at an annual rate of 1.9%.• LA Basin crudes declined at a faster 4% annually.
Thousands Of Barrels Per Day
700
750
800
850
900
950
1000
1050
1100
1988 1989 1990 1991 1992 1993 1994 1995 1996 1997 1998 1999 2000 2001 2002 2003
California Independent Petroleum Association28th Annual Meeting
12June 12, 2004
P..Foreign Crude Sources
Foreign supplies– Arab Gulf– S. America– Mexico– Canada– Asia
International crude oil price linkages
– Mexico– S. America– Arab Gulf
FROM ARAB GULF
FROMEUROPE, AFRICA
& ARAB GULF
ARGENTINA & AUSTRAILIA

7
California Independent Petroleum Association28th Annual Meeting
13June 12, 2004
P..2003 California Foreign Crude Oil Imports
The Arab Gulf crudes make up 58% of foreign imports, while Latin American crudes accounted for 31%.
Thousands Of Barrels Per Day
0
50
100
150
200
250
SAUDI A
RABIA
ECUA
DOR IRA
Q
MEXICO
ANGOLA
ARGEN
TINA
AUST
RALIA
CANA
DA
UNITE
D ARA
B EMIRA
TES
INDONE
SIA OMANPE
RU
KUWAIT
YEMEN
COLO
MBIABR
UNEI
VENEZ
UELA
NIGERIA
BRAZ
IL
EQUA
TORIA
L GUIN
EA VIETN
AM
California Independent Petroleum Association28th Annual Meeting
14June 12, 2004
P..Benchmark Crude Pricing Basis: Import Parity
ANS – Middle East Import Parity Differential, $/BBL
ANS can be used as a benchmark crude for evaluating U.S. West Coast crude oil prices.
ANS prices have gradually risen to levels consistent with delivered imports from Middle East (Western Hemisphere Import Parity Pricing).
(1.40)
(1.20)
(1.00)
(0.80)
(0.60)
(0.40)
(0.20)
-
0.20
0.40
1993 1994 1995 1996 1997 1998 1999 2000 2001 2002 2003
Est. Middle East Import Cost (VLCC w/ Lightering)
Source: Platts , Purvin & Gertz Analysis
8
California Independent Petroleum Association28th Annual Meeting
15June 12, 2004
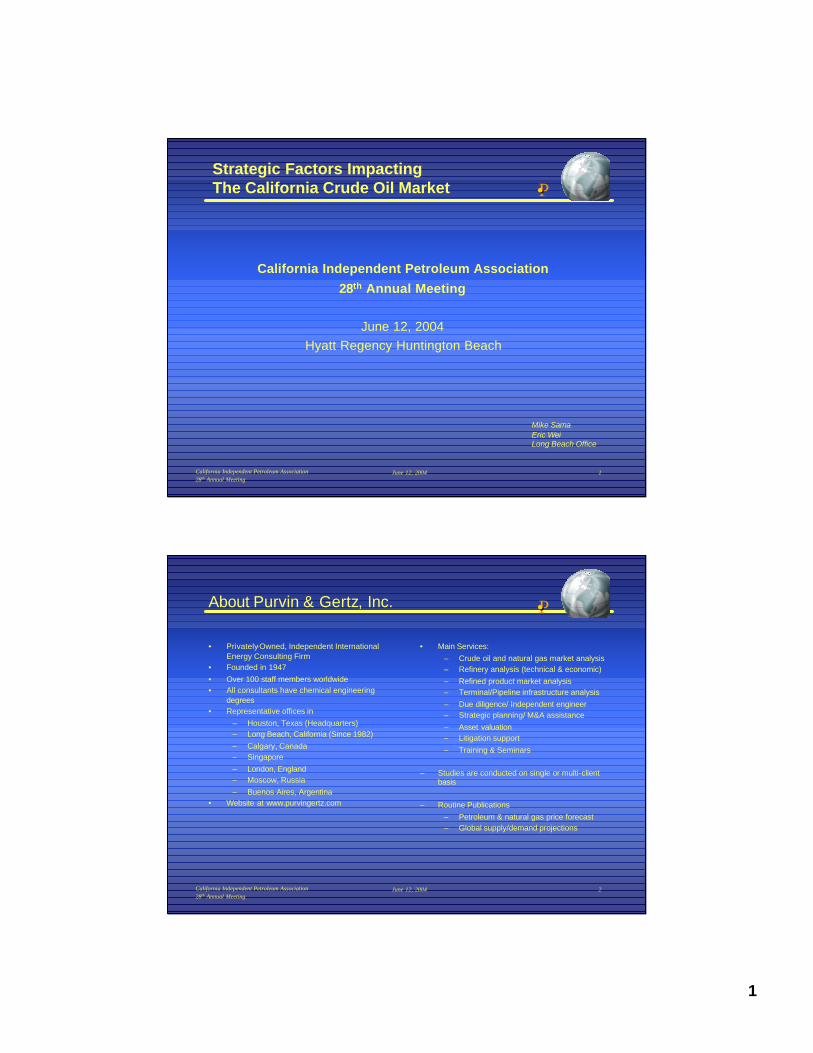
P..Delivered Costs For Foreign Crudes
• Port and terminal infrastructure improvements may eventually reduce delivery costs.
0
5
10
15
20
25
30
35
Foreign MarketFOB Price
VLCC/LR-2Tanker
Losses &Insurance
Lightering Duty/Fees
Dollars Per BarrelILLUSTRATIVE
EXAMPLE
California Independent Petroleum Association28th Annual Meeting
16June 12, 2004
P..VLCC CostDollars Per Barrel
0.0
0.5
1.0
1.5
2.0
2.5
3.0
3.5
Jan-01
Mar-01
May-01
Jul-01
Sep-01
Nov-01
Jan-02
Mar-02
May-02
Jul-02
Sep-0
2No
v-02 Jan-03
Mar-03
May-03
Jul-03
Sep-0
3Nov-
03Jan
-04Mar-0
4
24000
24500
25000
25500
26000
26500
27000
27500
28000
28500
29000
OPEC Crude Production
OPEC CrudeThousand Barrels Per Day
VLCC:Arab Gulf To USGC
VLCC:Arab Gulf To USWC
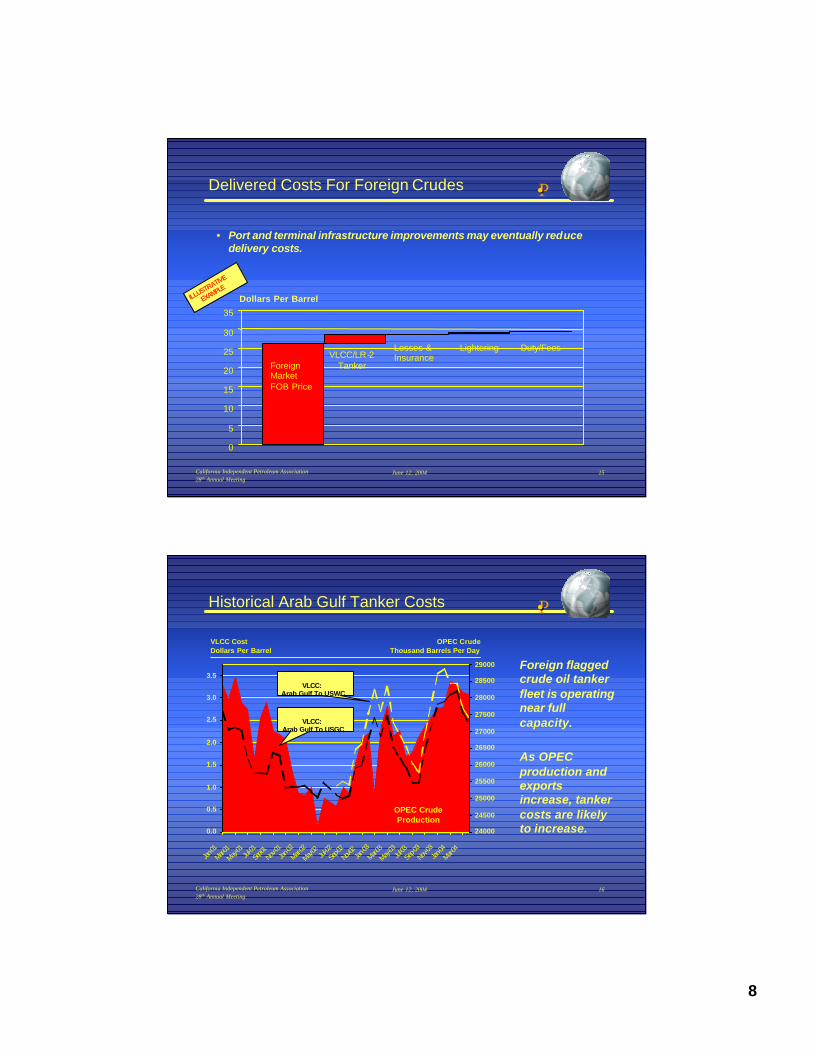
Historical Arab Gulf Tanker Costs
Foreign flagged crude oil tanker fleet is operating near full capacity.
As OPEC production and exports increase, tanker costs are likely to increase.

9
California Independent Petroleum Association28th Annual Meeting
17June 12, 2004
P..Thousands Of Barrels Per Day
0
2
4
6
8
10
12
1970
1972
1974
1976
1978
1980
1982
1984
1986
1988
1990
1992
1994
1996
1998
2000
2002
2004
0
10
20
30
40
50
60
70
80
90
1002004 $/BBL
OPEC SPARE
CAPACITY
Price
Crude Price And OPEC Spare Capacity
Strong demand growth led by Asia and U.S. economic recovery has cut spare OPEC crude oil production capacity.
Despite production increases by OPEC and Former Soviet Union, crude oil inventories remain tight.
Unlike previous oil shocks, the current price environment is accompanied by high OPEC and non-OPEC utilization.
Source: IEA, Platts
OPEC CUTS-LOW UTILIZATION
HIGH OPEC UTILIZATION
Iraq War
California Independent Petroleum Association28th Annual Meeting
18June 12, 2004
P..World Crude Oil Demand Growth
Seasonal global petroleum demand usually peaks in winter months.
Growth in worldwide demand over 2nd Half of 2003 was roughly 4.5 million barrels per day.
Over the last 3 years, roughly 65% of worldwide demand growth was driven by Asian countries.
Oil Demand Growth From 1Q 2001 (Millions Of Barrels Per Day)
-2
-1
0
1
2
3
4
5
1Q 20
01
2Q 20
01
3Q 20
01
4Q 20
01
1Q 20
02
2Q 20
02
3Q 20
02
4Q 20
02
1Q 20
03
2Q 20
03
3Q 20
03
4Q 20
03
1Q 20
04
China
World
Other Asia (Excl. Japan)
Source: IEA

10
California Independent Petroleum Association28th Annual Meeting
19June 12, 2004
P..Crude Oil Valuation Overview
Regional Benchmark Crude Pricing• International Import Parity• International Export Parity• Marginal Production Costs CRUDE OIL
VALUATION
Value Adjustments For Crude Quality• Refinery economic indifference
California Independent Petroleum Association28th Annual Meeting
20June 12, 2004
P..Estimating The Crude Oil Quality Differential
Key Assumptions• Refineries will
expand crude oil consumption until favorable economics disappear (marginal refinery mode).
• Crude oil supply costs based on market alternatives or marginal production costs.
Crude Oil Demand Curve(Refinery Breakeven)
Crude Oil Supply Curve(Supplier Indifference)
Market Clearing Price(US$/ Barrel)
Market Crude Oil Demand (Barrels Per Day)
Refiner’sMargin(US$/ BBL)
Supplier’sSurplus(US$/ BBL)
Marginal Refinery Operation
Determines Market Value
Marginal Refinery Operation
Determines Market Value
CLASSIC SUPPLY-DEMAND FRAMEWORK
ILLUSTRATIVE
EXAMPLE

11
California Independent Petroleum Association28th Annual Meeting
21June 12, 2004
P..Determining Crude Oil Quality Differentials
Crude oil quality differentials are based on the crude oil’s relative value in the marginal refinery mode.
The marginal refinery mode in the West Coast is usually FCC Cracking, which produces residual fuel oil.
RelativeMarket Clearing Price
Total Crude Oil Demand (Barrels Per Day)
REFINERY OPERATING MODE ECONOMICS
Coking Mode Variable
Realization
Coking Mode Variable
Realization
FCC Cracking Mode Variable
Realization
FCC Cracking Mode Variable
Realization
HydroskimmingMode Variable
Realization
HydroskimmingMode Variable
Realization
ToppingMode Variable
Realization
ToppingMode Variable
Realization
Crude Oil Price(US$/BBL)
ILLUSTRATIVE
EXAMPLE
California Independent Petroleum Association28th Annual Meeting
22June 12, 2004
P..Main Factors Impacting Crude Quality Differentials
• Refinery cracking yields– Fuel oil yield
• Vacuum residue• Viscosity blending properties
– Gasoline yield
• Refinery processing cost– Sulfur– Nitrogen/ Metals– Gas oil volume
• Refined product prices– Light product – fuel oil differential– Marginal product disposition
• Export parity• Import parity
Refinery Cracking
Mode
Crude Oil
Gasoline,Jet &Diesel
RefineryFuelOil

12
California Independent Petroleum Association28th Annual Meeting
23June 12, 2004
P..Recap
• California refineries are expected to expand as California product demand grows.
• Foreign crude imports will continue to increase as ANS and California supplies decline.
• Light sour crude oil from the Arab Gulf and Latin America will be the main source of foreign crude.
• Quality differentials for crude oils are usually dependent on the economics of the marginal refinery mode.
• Crude oil supplies in California are expected to follow import parity.
• Worldwide petroleum demand growth, particularly in Asia, has created a tight market for crude oil and tanker services.
• VLCC tanker costs from the Arab Gulf to the U.S. can have a significant impact California crude oil prices.
California Independent Petroleum Association28th Annual Meeting
24June 12, 2004
P..Outlook And Comments
• Although significant risk exists, strong Asian demand growth is likely to continue requiring increases in worldwide production.
• Supply concerns related to Middle East tensions have recently moved crude oil prices beyond industry fundamentals.
• Iraq and Former Soviet Union are seen as the main wildcards for increased crude supplies.
• Near-term crude oil prices should ease as non-OPEC production increases in 2004 and 2005.
• Long-run crude oil prices should more closely follow reserve development costs.
• Some California refiners may elect to import product rather than increase crude run due to high cost of expansion and difficulty with latest CARB specifications.

13
California Independent Petroleum Association28th Annual Meeting
25June 12, 2004
P..About This Presentation
This presentation has been prepared for the California Independent Petroleum Association (Client). It provides an overview of the factors expected to influence the market for crude oil in the California region.
Neither the presentation nor any part of the presentation shall be provided to third parties without the written consent of Purvin & Gertz. Any third party in possession of the presentation may not rely upon its conclusions without the written consent of Purvin & Gertz. Possession of the presentation does not carry with it the right of publication.
Some of the information on which this report is based has been provided by others including the Client. Purvin & Gertz has utilized such information without verification unless specifically noted otherwise. Purvin & Gertz accepts no liability for errors or inaccuracies in information provided by others.
Purvin & Gertz conducted this analysis and prepared this report utilizing reasonable care and skill in applying methods of analysis consistent with normal industry practice. Al l results are based on information available at the time of review. Changes in factors upon which the review is based could affect the results. Forecasts are inherently uncertain because of the events or combinations of events that cannot reasonably be foreseen including the actions of government, individuals, third parties and competitors. NO IMPLIED WARRANTY OF MERCHANTABILITY OR FITNESS FOR A PARTICULAR PURPOSE SHALL APPLY.