strategic management for large engineering …
TRANSCRIPT

STRATEGIC MANAGEMENT FOR LARGE ENGINEERING PROJECTS: THE STAKEHOLDER VALUE NETWORK APPROACH
by
Wen Feng
B.S., Refrigeration and Cryogenics Engineering, Shanghai Jiao Tong University, 2000 M.S. with Honors, Thermal Engineering, Tsinghua University, 2003
S.M., Civil and Environmental Engineering, MIT, 2007 S.M., Technology and Policy, MIT, 2007
Submitted to the Engineering Systems Division in Partial Fulfillment of the Requirements for the Degree of
Doctor of Philosophy in Technology, Management, and Policy
at the Massachusetts Institute of Technology
June 2013
2013 Massachusetts Institute of Technology. All Rights Reserved.
Signature of Author………………………………………………………………………………………………... Engineering Systems Division
March 24th, 2013
Certified by………………………………………………………………………………………………………… Edward F. Crawley
Ford Professor of Engineering Professor of Aeronautics and Astronautics and Engineering Systems
President, Skolkovo Institute of Science and Technology, Russian Federation Thesis Supervisor and Committee Chair
Certified by………………………………………………………………………………………………………… Olivier L. de Weck
Associate Professor of Aeronautics and Astronautics and Engineering Systems Co-Director, Center for Complex Engineering Systems at KACST and MIT
Thesis Committee Member
Certified by………………………………………………………………………………………………………… Donald R. Lessard
EPOCH Foundation Professor of International Management Professor of Global Economics and Management
Professor of Engineering Systems Thesis Committee Member
Accepted by………………………………………………………………………………………………………... Olivier L. de Weck
Associate Professor of Aeronautics and Astronautics and Engineering Systems Co-Director, Center for Complex Engineering Systems at KACST and MIT
Chair, Engineering Systems Division Education Committee

[This page left intentionally blank]
- 3 -
STRATEGIC MANAGEMENT FOR LARGE ENGINEERING PROJECTS:
THE STAKEHOLDER VALUE NETWORK APPROACH
by
Wen Feng
Submitted to the Engineering Systems Division on March 24th, 2013 in Partial Fulfillment of the Requirements for the Degree of Doctor of Philosophy
in Technology, Management, and Policy
ABSTRACT A critical element of the challenges and opportunities for today’s large engineering projects are associated with the multi-type and networked relationships between these projects and their various stakeholders. This dissertation advances a multidisciplinary approach—Stakeholder Value Network (SVN) analysis—as a unique lens to examine, understand, model, and manage these stakeholder relationships. The SVN approach, based on the Social Exchange Theory (SET), unifies both social and economic relationships into a common framework, under which all the stakeholder relationships are formed by the use of subjective utility analysis and the comparison of alternatives. Next, restricted and generalized exchanges are identified as two basic patterns for stakeholders to exchange both tangible and intangible value, and from this, the missing links between relationship types and exchange patterns are also discovered. In the end, the network implications, such as stakeholder importance or salience, are inferred as the outcome of both value exchanges and the structural properties of the network consisting of stakeholders and their exchange relationships. According to the above theoretically grounded assumptions, a four-step methodological framework (viz., Mapping, Quantifying, Searching, and Analyzing) is developed for the SVN analysis. As part of this development, a network utility model is built to quantify the value delivered to the focal organization (viz., the large engineering projects) through the channel of generalized exchanges. Meanwhile, the benefits from as well as a feasible way for the integration of stakeholders and strategic issues are explored under the SVN framework. In addition, for the purpose of reducing the egocentric bias associated with the pre-selection of a focal organization, the four-step framework is further developed to interpret the implications of the SVN from the perspective of the whole network. The computational challenges arising from this new development are met by the construction of a dedicated mathematical tool for the SVN analysis, namely, the Dependency Structure Matrix (DSM) modeling platform.

- 4 -
Corresponding to the two-stage development of the methodological framework, two large real-world engineering projects are studied respectively: The first one, Project Phoenix, is a retrospective case and applies the SVN analysis from the focal organization perspective. Based on this case study, the descriptive accuracy of the SVN analysis is validated, through a comparison of important stakeholders derived from Mangers’ Mental Model, the “Hub-and-Spoke” Model, and the SVN Model. Specifically, it is found that Managers’ Mental Model is similar to the “Hub-and-Spoke” Model, and both models miss the Public Media and the Local Governments as important stakeholders at the beginning of the project. On the contrary, even with only prior information, the SVN Model identifies the importance of these two stakeholders by capturing the impacts of indirect stakeholder relationships as generalized exchanges. The reasons why generalized exchanges matter for today’s large engineering projects are further examined from psychological, sociological, economic, and managerial aspects. The second one, China’s Energy Conservation Campaign, is a prospective case and applies the SVN analysis from the whole network perspective. In this case study, five basic principles are first proposed for modeling the intraorganizational hierarchies of large and important stakeholders, and then these principles are tested as an effective means to manage the structural complexity of the SVN in the modeling process. During this process, the instrumental power of the SVN analysis is demonstrated. The SVN approach becomes complete with the above theory, methodology, tool, and meaningful findings from two representative case studies. At the end of this dissertation, two conceptual innovations are conceived to bridge the gap between the SVN analysis and systems architecting, and the theoretical, methodological, as well as empirical directions of future research on the SVN approach are also discussed. Thesis Supervisor and Committee Chair:
Edward F. Crawley Ford Professor of Engineering Professor of Aeronautics and Astronautics and Engineering Systems President, Skolkovo Institute of Science and Technology, Russian Federation
Thesis Committee Member:
Olivier L. de Weck Associate Professor of Aeronautics and Astronautics and Engineering Systems Co-Director, Center for Complex Engineering Systems at KACST and MIT
Thesis Committee Member:
Donald R. Lessard EPOCH Foundation Professor of International Management Professor of Global Economics and Management Professor of Engineering Systems

- 5 -
To my dear wife, parents, mentor, and buddy:
Yuan, Chunbai & Xianze, Ed, and Bruce
… The brightest lights in the blackest nights

- 6 -
为天地立心,
为生民立命,
为往圣继绝学,
为万世开太平。
张载(1020~1077)
Twenty years from now you will be more disappointed by
the things that you didn't do than by the ones you did do.
So throw off the bowlines.
Sail away from the safe harbor.
Catch the trade winds in your sails.
Explore. Dream. Discover.
— Mark Twain (1835~1910)

- 7 -
ACKNOWLEDGEMENTS This is a moment I have expected for years—when my research lost momentums, when my health experienced problems, when my life met setbacks, and when my career faced difficult choices, I always told myself, you must keep faith and stand on, for that moment you are able to write down your acknowledgements—as the Persian poet Rumi said, “the wound is the place where the Light enters you”, this is an unforgettable moment for me to thank all the people who have lighted up my world in the darkest nights. First of all, I want to thank my advisor, Professor Ed Crawley. I met Ed in the fall of 2006, when I was desperately looking for the funding to cover my last year in TPP and Course 1, and more importantly, a professor who can be my Ph.D. advisor in the next a few years. I think it was one of the luckiest things in my life to meet Ed in that fall, and his smile is still vivid in my memory. “Welcome to join the team!” Ed firmly shook my hand and just said a few words—although it’s just a few words, Ed has put enormous trust on my research since the first day and never given me up even in my most difficult and unproductive time. Without his advice, kind consideration, warm encouragement, and unwavering support, I would never have had a chance to finally finish my thesis and see the light at the end of the tunnel. Ed is a brilliant scholar, not only in the important field studying how to put human on the Moon (or the Mars to be more recent), but also in the large and complex socio-technical systems behind and beyond those ambitious space missions. One of the most joyful moments in my Ph.D. life was actually to sit in Ed’s office and watch him to draw the tree of our academic family on the whiteboard: From Ludwig Prandtl (1875~1953) at the University of Göttingen, to Theodore von Kármán (1881~1963) and Qian Xuesen (a.k.a., Hsue-Shen Tsien, 1911~2009) at Caltech, and to Jack L. Kerrebrock at MIT, I always feel so honored to be connected with these great names, and meanwhile, these great names have strongly urged me to work very hard and bring more glory to our academic family. Especially, Professor Qian Xuesen, the father of China’s missile and space programs, first came to MIT in 1935 and later on has been highly regarded by all the Chinese people as a national symbol of outstanding scientists. Although it’s a pity that I didn’t become a cool rocket scientist like Professor Qian, I think our research did finally meet together in the interesting field of engineering systems. In fact, Professor Qian published his book Engineering Cybernetics in 1954, about the same time as Norbert Wiener’s Cybernetics, and then established the new discipline of systems engineering in China around the 1970s—in Professor Qian’s dictionary, the concept of “systems engineering” is very similar to our definition of “engineering systems” at ESD—he coined the name of “Open Complex Giant System” and also emphasized the critical roles of social sciences and management in fully understanding such an important system. From this perspective, Ed has made a similar transition from a traditional engineering discipline to the discipline of engineering systems and then to engineering leadership. Influenced by both professors, I hope I can also complete such a transition and explore more synergies between engineering, management, and social sciences to tackle the

- 8 -
challenges arising from today’s complicated socio-technical systems, for a better tomorrow of the world. Ed is a great teacher as well as a close friend to his students. No matter what kind of class, from Systems Architecture to Engineering Leadership, to Project Management, and to many other topics, Ed can surprisingly stimulate the curiosity of his students and we always feel there is a “magic” in his lectures. Outside of the classroom, Ed will invite his students to golf, ski, sail, and fly with him, and give the students lots of support far beyond their study and research. In the summer of 2008, when I conducted my second case study at Tsinghua University, Ed told me I should not stay in office days and nights, and then he bought an expensive ticket by himself and invited me to watch the closing ceremony of the Beijing Olympics (you can check out his Facebook for a wonderful picture taken by me, :P)! Ed is also a visionary leader in engineering education and has very successfully led the Department of Aeronautics and Astronautics at MIT, the Cambridge-MIT Institute, the global CDIO Initiative, the Gordon Engineering Leadership Program, and currently the Skolkovo Institute of Science and Technology in Russia. Additionally, Ed is the living definition of entrepreneur, and he has founded a few private companies across a variety of high-tech industries. In a word, Ed has not only taught me the knowledge to be a good researcher, but the virtues to be a great man. I am really proud of having been Ed’s student, and sincerely wish one day I can also make him proud. Second, I want to thank my committee members, Professors Don Lessard and Oli de Weck. Don is an eminent scholar in global economics and international management, and during his tenure as the Deputy Dean of the Sloan School of Management, he has achieved tremendous success in strengthening the research, international programs, as well as executive education for the whole school. Every time when I met with Don, I was amazed by the breadth and depth of his knowledge, and wished I could have a recorder to capture all the brilliant ideas discussed by him. Based on my previous background in engineering and public policy, Don is the mentor who has led me into the field of strategic management and I always greatly appreciate the systematic training given by him in business domain. In addition, Don kindly introduced me to many leading management scholars all over the world, and also taught me the rigorous attitude to become an outstanding researcher—no matter whether it is a short conference paper, or a dissertation with several hundred pages, Don will carefully read them word-by-word and write down insightful and detailed comments—if one day I can have the honor to become a professor in business school, I will definitely do the same to every student of mine. As the world’s leading scholar in systems engineering, Oli is my role model who has fundamentally changed my career goal. When I faced the difficult choice between industry and academia, it is Oli’s words that helped me determine my mind to pursue an academic career—in a doctoral seminar for ESD students, Oli said, he will not trade the intellectual challenge and academic freedom as a university professor for anything—his words touched the most sensitive part in my heart and reminded me of my original dream

- 9 -
to become a professor. After I decided to return to academia from industry in late 2011, Oli has also provided generous financial support for me to finish my doctoral study at MIT. Without his wise guidance and firm support, I may never have had a second chance to follow my heart and pursue my dream. Next, I want to thank my best friend at MIT, Dr. Bruce Cameron. I got to know Bruce in 2006 when joining Ed’s research group. Since then, we have become very good friends and begun our years long collaboration on the Stakeholder Value Network (SVN). As the founder of the SVN approach, Bruce has been incredibly resourceful, and I enjoyed a lot with our discussion on stakeholder research as well as other interesting topics. More importantly, when my life met serious setbacks in 2012, it is Bruce who has provided me enormous help, on both my research and personal life. Without his encouragement, friendship, and supervision, I think I would be still stuck in the very first chapter of my dissertation, and won’t be able to wake up from my own nightmares. I am deeply in debt to Bruce for all of his help. I am also deeply in debt to many other professors and distinguished scholars here at MIT and throughout the world: (1) I want to thank Professor Edward Laumann (University of Chicago) for his advice on social network analysis and multi-stranded network ties, Professor Karen Cook (Stanford University) for her advice on social exchange theory and exchange networks, as well as Professors Jeffrey Harrison (University of Richmond) and Edward Freeman (University of Virginia) for their advice on stakeholder theory and business ethics; (2) I want to thank Professor Steven Eppinger for kindly serving as the chair of my dissertation defense and giving me the honor to contribute a chapter in his latest book, Design Structure Matrix Methods and Applications; (3) I want to thank Professors Ni Weidou and Li Zheng (Tsinghua University) for inviting me to give a talk at the Tsinghua-BP Clean Energy Research & Education Centre in Beijing, Professor Robert Williams (Princeton University) for inviting me to present my research at the Energy Seminar of Princeton Environmental Institute (PEI), Professor Richard Priem (Texas Christian University) for appointing me as the session chair for “effective stakeholder management” in the Strategic Management Society (SMS) 32nd Annual International Conference in Prague, Professor Ezra Zuckerman for inviting me to attend the Harvard-MIT Economic Sociology Seminar, as well as Professors Maurizio Zollo (Bocconi University) and Aleksandra Kacperczyk for inviting me to attend the Doctoral Seminar on Corporate Sustainability; (4) I want to thank Professors David Marks, Stephen Connors, Joseph Sussman, Richard de Neufville, Dava Newman, Frank Field, Kenneth Oye, Nicholas Ashford, and John Sterman for their advice and support since my TPP years; (5) I want to thank Professors Richard Larson, Nancy Leveson, Yossi Sheffi, and Christopher Magee for their help on my general exams; (6) I want to thank Professors David Simchi-Levi, Stephen Graves, and Charles Fine for providing me an opportunity to hone my teaching skills in their highly-acclaimed supply chain courses at the Sloan School of Management. My doctoral research was mainly funded by the BP-MIT Joint Research Program, and also received the financial support from BP China, the King Abdulaziz City for Science

- 10 -
and Technology (KACST) in Saudi Arabia, as well as the Center for Complex Engineering Systems (CCES) at KACST and MIT. I am very grateful to my friends at BP, from both corporate and project levels as well as the Projects & Engineering Academy, for their continuous and generous support on my research, although their names must remain confidential. Meanwhile, I would like to thank many representatives from various stakeholders in two case studies of my dissertation, for their participation and collaboration in the multi-round interview process. I would also like to thank my teammates who worked with me together and helped me a lot in the case studies: Jim Keller, Ziv Rozenblum, Alessandro Golkar, Lin Jijun, and Howard Yue from MIT, as well as Fu Feng, Zheng Zhong, Chen Zhen, and Ma Linwei from Tsinghua University. Without the teamwork, it would not be possible to successfully complete our research projects and achieve today’s results. In addition, I want to take this opportunity to thank Kathi Brazil, Amy Shea, Ping Lee, Beth Milnes, Laura Bowen, Petra Aliberti, Maria Brennan, and many other great staff at MIT. I also want to extend my sincere thanks to all the lab mates and friends I met in my MIT life: Ryan Boas, Bill Simmons, Wilfried Hofstetter, Paul Wooster, Tom Speller, Ben Koo, Tim Sutherland, Alessandro Golkar, Daniel Selva, Theo Seher, Richard Rhodes, Arthur Guest, Lin Maokai, Jonathan Battat, Anthony Wicht, Brandon Suarez, Alexander Rudat, Emily Calandrelli, Morgan Dwyer, Paco Alonso, Paul Grogan, Matt Silver, Danielle Wood, Jaemin Song, Karen Tapia-Ahumada, Blandine Antonie, Woei Ling Leow, Doug Matty, Bob Rudin, Sid Rupani, Shardul Phadnis, Brian Mekdeci, Dan Livengood, Xu Zao, Luo Jianxi, Li Hua, Deng Hui, Ma Chen, Zhan Xiaohui, Mao Tingting, Qin Qi, Song Miao, Chen Jie, Chen Fei, Jiang Zibo, Gong Bo, Xu Min, Wu Ning, Liu Dazhi, Wen Yang, Zhang Huan, Ke Rongzhu, Liu Ruochuan, Zheng Enying, Chen Lei, Wu Shan, Kris Johnson, Christina Ingersoll, and many, many others. Especially, Daniel Selva, Alessandro Golkar, and Alexander Rudat deserve a special mention for their wonderful comments on my dissertation draft. For almost every day of the past a few years, I have been humbled by all the brightest minds around myself, and I greatly appreciate their inspiration, encouragement, as well as friendship which make my life valuable and enjoyable. From 2010 to 2011, for a special reason, I left Boston for New York City to work as a financial services consultant at Oliver Wyman, a top global management consultancy. Although I became a “traitor” and finally decided to return to academia, I owed a lot to my previous partners and colleagues: Peter Carroll, Scott Robinson, Samir Misra, John Lester, Andrew Dresner, Ugur Koyluoglu, James Morgan, Michael Zeltkevic, Melinda Sulewski, Daniel Mikkelsen, Deepak Kollali, Ma Rui, Kristin Ricci, Anders Nemeth, Daniel Cohen, Daniel Cope, Jesse Baver, Nick Dykstra, Kirill Skok, Sally Ling, Caity Greeley, Christopher Graff, Ulas Ziyan, Zhang Ming, Guan Mei, Alice Li, Stephen Yu, Divya Kirti, Katherine Campbell, Anna Chaleff, Karen Sarappo, Megan Walski, Marjorie Virella, and many others. From them, I have learned not only the advanced knowledge to solve the practical problems in the finance industry, but also the essential skills to communicate with different people in the real business world. No matter where I am in

- 11 -
the future, I will always cherish this invaluable experience and never forget the pursuit for perfection as an alumnus of this great firm. Finally, and very importantly, I want to dedicate this dissertation to my wife, Mei Yuan, and my parents, Wen Chunbai and Feng Xianze, for their unconditional, endless, and eternal love—my parents gave me life, brought me up, and influenced me to be a man of integrity, and meanwhile, the Cupid made a special arrangement for me to meet the best girl in our best age and at the best place—any language in the world cannot completely express my deep appreciation to and tremendous love for my family. If you read through my dissertation, you will see that I have been working hard to search for the logical reasons fostering social and economic relationships in human society. However, I would like to caution you beforehand that my current findings cannot fully explain the inseparably bounded relationships between family members—in the movie A Beautiful Mind, John Nash said at the end, “it is only in the mysterious equations of love that any logical reasons can be found”—in my mind, my life becomes logical only because of my family, and my family are all the reasons for my life.

- 12 -
TABLE OF CONTENTS
CHAPTER 1. INTRODUCTION ................................................................................ 25
1.1 DISSERTATION MOTIVATION .................................................................................. 25
1.1.1 Large Engineering Projects: Impacts and Challenges .................................. 25
1.1.2 “Rescuing Prometheus”: The Quest for A Multi-disciplinary Approach ...... 28
1.2 RESEARCH QUESTIONS ........................................................................................... 29
1.3 DISSERTATION ARCHITECTURE .............................................................................. 30
CHAPTER 2. LITERATURE REVIEW AND THEORETICAL BUILDUP ........ 33
2.1 CHAPTER INTRODUCTION ....................................................................................... 33
2.2 DOMAINS: STRATEGIC MANAGEMENT AND ENGINEERING SYSTEMS ...................... 34
2.2.1 Stakeholder Theory in Strategic Management ............................................... 34
2.2.2 Research Opportunities for Stakeholder Theory ........................................... 37
2.2.3 Large Engineering Projects as Engineering Systems .................................... 46
2.2.4 Research Opportunities for Engineering Systems ......................................... 48
2.3 APPROACH: NETWORK ANALYSIS IN SOCIAL SCIENCES ......................................... 53
2.3.1 Relationship Types: Social vs. Economic ...................................................... 53
2.3.2 Exchange Patterns: Restricted vs. Generalized ............................................. 56
2.3.3 Strategic Implications: Importance, Power, and Centrality .......................... 59
2.3.4 Research Opportunities for Network Analysis ............................................... 62
2.4 INTEGRATING DOMAINS WITH APPROACH: STAKEHOLDER VALUE NETWORK ....... 63
2.4.1 Stakeholder Value Network: Definition and Assumptions ............................. 63
2.4.2 Basic Units of Network Analysis: Salience, Relationships, and Issues ......... 66
2.5 CHAPTER SUMMARY ............................................................................................... 67
CHAPTER 3. METHODOLOGY DEVELOPMENT I: SVN FOR A FOCAL
ORGANIZATION .......................................................................................................... 69
3.1 CHAPTER INTRODUCTION ....................................................................................... 69
3.2 BASICS: FOUR-STEP MODELING FRAMEWORK ....................................................... 70
3.2.1 Step One: Mapping ........................................................................................ 73

- 13 -
3.2.2 Step Two: Quantifying ................................................................................... 86
3.2.3 Step Three: Searching .................................................................................. 106
3.2.4 Step Four: Analyzing ................................................................................... 116
3.2.5 Directions for Improvement ......................................................................... 129
3.3 EXTENSION A: INTEGRATION OF STAKEHOLDERS AND ISSUES ............................. 131
3.3.1 Rationales behind the Integration ................................................................ 131
3.3.2 Conceptual Process for the Integration ....................................................... 133
3.4 EXTENSION B: UTILITY MODEL FOR GENERALIZED EXCHANGES ......................... 134
3.4.1 Construction of the Model ........................................................................... 135
3.4.2 The Approximation Equation ....................................................................... 141
3.5 CHAPTER SUMMARY ............................................................................................. 143
CHAPTER 4. CASE STUDY I: PROJECT PHOENIX .......................................... 145
4.1 CHAPTER INTRODUCTION ..................................................................................... 145
4.2 CASE DESCRIPTION AND PROJECT PHOENIX MANAGERS’ MENTAL MODEL ......... 146
4.3 THE SVN ANALYSIS AND COMPARISONS OF THREE MODELS .............................. 148
4.3.1 Step One: Mapping ...................................................................................... 149
4.3.2 Step Two: Quantifying ................................................................................. 160
4.3.3 Step Three: Searching .................................................................................. 164
4.3.4 Step Four: Analyzing ................................................................................... 168
4.3.5 Impacts of Indirect Stakeholder Relationships ............................................ 178
4.4 INTEGRATION BETWEEN STAKEHOLDERS AND ISSUES ......................................... 190
4.4.1 Issue Identification and Issue Networks ...................................................... 190
4.4.2 Stakeholder Balance within A Single Issue .................................................. 192
4.4.3 Stakeholder Balance across Multiple Issues ................................................ 195
4.4.4 More Observations for the SVN Model and the Issue Networks ................. 197
4.5 CHAPTER SUMMARY ............................................................................................. 197
CHAPTER 5. METHODOLOGY DEVELOPMENT II: SVN FOR THE WHOLE
NETWORK ................................................................................................................... 199
5.1 CHAPTER INTRODUCTION ..................................................................................... 199

- 14 -
5.2 PREPARATION: DSM MODELING PLATFORM ........................................................ 200
5.2.1 Choice of the Danielson Algorithm .............................................................. 201
5.2.2 Construction of the DSM Modeling Platform .............................................. 207
5.2.3 RuSakOil Case Revisited .............................................................................. 215
5.2.4 Beyond the Computational Capacity ........................................................... 216
5.3 DEVELOPMENT: FROM FOCAL ORGANIZATION TO WHOLE NETWORK .................. 220
5.3.1 Motivation for A More Holistic View ........................................................... 220
5.3.2 Upgrades of the DSM Modeling Platform ................................................... 224
5.3.3 Whole Network Measurements and Project Phoenix Case Revisited .......... 226
5.3.4 Principles for Hierarchical Modeling ......................................................... 231
5.4 CHAPTER SUMMARY ............................................................................................. 234
CHAPTER 6. CASE STUDY II: CHINA’S ENERGY CONSERVATION
CAMPAIGN .................................................................................................................. 237
6.1 CHAPTER INTRODUCTION ..................................................................................... 237
6.2 CASE DESCRIPTION AND MODELING PREPARATION ............................................. 239
6.2.1 China’s Energy Challenges and the Energy Conservation Campaign ........ 240
6.2.2 Research Collaboration, Data Collection, and Information Granularity ... 243
6.3 LEVEL ONE OF CHINA SVN MODEL ..................................................................... 244
6.3.1 Stakeholder Map and Key Results ............................................................... 245
6.3.2 Major Steps from Level N to Level N+1 ...................................................... 250
6.3.3 Implications for Level Two Model ............................................................... 253
6.4 LEVEL TWO OF CHINA SVN MODEL .................................................................... 255
6.4.1 Stakeholder Maps and Key Results .............................................................. 255
6.4.2 New Insights for Level One Model ............................................................... 262
6.4.3 Implications for Level Three Model ............................................................. 264
6.5 POLICY AND STRATEGY RECOMMENDATIONS ...................................................... 266
6.6 CHAPTER SUMMARY ............................................................................................. 266
CHAPTER 7. CONCLUSIONS AND FUTURE WORK ....................................... 269
7.1 DISSERTATION SUMMARY .................................................................................... 269

- 15 -
7.2 CONTRIBUTIONS AND IMPLICATIONS .................................................................... 271
7.2.1 Theoretical, Methodological, and Empirical Contributions ........................ 271
7.2.2 Managerial Implications and Policy Recommendations ............................. 272
7.3 LIMITATIONS AND FUTURE WORK ........................................................................ 275
7.3.1 Short List of Limitations ............................................................................... 275
7.3.2 Future Work: Theoretical, Methodological, and Empirical Directions ...... 276
REFERENCES .............................................................................................................. 280
DISSERTATION PUBLICATIONS ........................................................................... 301
APPENDIX I: FROM SVN TO SYSTEMS ARCHITECTING .............................. 303
APPENDIX II: SUPPLEMENTAL MATERIALS .................................................. 314

- 16 -
LIST OF TABLES
TABLE 2-1: COMPARISON BETWEEN STAKEHOLDER THEORY AND STRATEGIC ISSUE
MANAGEMENT ........................................................................................................... 45
[ADAPTED FROM LUCEA, 2007, P. 24] ................................................................................ 45
TABLE 2-2: STAKEHOLDER RESEARCH AT MIT ESD (LISTED IN THE PUBLICATION ORDER)
................................................................................................................................... 49
TABLE 2-3: THREE TYPES OF CENTRALITY IN THE SOCIAL NETWORK ANALYSIS (SNA) ... 61
TABLE 2-4: A TYPOLOGY OF BOUNDARY SPECIFICATION STRATEGIES FOR DELIMITING
ACTORS WITHIN A NETWORK [ADAPTED FROM LAUMANN, MARSDEN, AND PRENSKY,
1983, P. 25] ................................................................................................................ 67
TABLE 2-5: MAPPING RESEARCH OPPORTUNITIES TO DISSERTATION CHAPTERS AND
SECTIONS ................................................................................................................... 68
TABLE 3-1: SOME PROJECT STAKEHOLDERS [WINCH, 2004, P. 323] .................................. 76
TABLE 3-2: STAKEHOLDER IDENTIFICATION FOR THE RUSAKOIL ...................................... 78
TABLE 3-3: STAKEHOLDERS AND VALUE FLOWS FOR THE RUSAKOIL .............................. 81
TABLE 3-4: VALUE FLOW VS. VALUE PATH ....................................................................... 87
TABLE 3-5: NUMERICAL SCALE FOR NEED INTENSITY QUESTIONNAIRE ............................ 95
TABLE 3-6: NUMERICAL SCALE FOR SOURCE IMPORTANCE QUESTIONNAIRE .................... 97
TABLE 3-7: CONVERSION MATRIX BETWEEN THE PROJECT’S OUTPUTS AND INPUTS ....... 124
TABLE 4-1: STAKEHOLDER IDENTIFICATION FOR PROJECT PHOENIX ............................... 150
TABLE 4-2: SUMMARY FOR ALL-PAIR-STAKEHOLDER-RELATIONSHIPS IN THE PROJECT
PHOENIX CASE ......................................................................................................... 169
TABLE 5-1: THREE ALGORITHMS FOR SIMPLE CYCLE ENUMERATION IN DIRECTED SIMPLE
GRAPH ..................................................................................................................... 205
[ADAPTED FROM MATETI AND DEO, 1976, P. 97] ............................................................. 205
TABLE 5-2: NETWORK STATISTICS COMPARISON BETWEEN FOCAL ORGANIZATION AND
WHOLE NETWORK ................................................................................................... 227
TABLE 6-1: STAKEHOLDER DECOMPOSITION FROM LEVEL ONE MODEL TO LEVEL TWO
MODEL ..................................................................................................................... 254

- 17 -
TABLE 6-2: STAKEHOLDER DECOMPOSITION FROM LEVEL TWO MODEL TO LEVEL THREE
MODEL (CNG ONLY) ............................................................................................... 265
TABLE A-1-1: DEFINITIONS OF VALUE EXCHANGE RATES FOR THE LOP ........................ 310
TABLE A-3-1: VALUE FLOW SCORES FOR THE RUSAKOIL CASE ..................................... 316
TABLE A-4-1: VALUE FLOW DEFINITIONS FOR PROJECT PHOENIX .................................. 317
TABLE A-4-2: STAKEHOLDER QUESTIONNAIRE FOR PROJECT PHOENIX .......................... 323
TABLE A-4-3: INTERNAL ASSETS DEFINITIONS FOR PROJECT PHOENIX ........................... 324
LIST OF FIGURES
FIGURE 1-1: DISSERTATION ARCHITECTURE ...................................................................... 31
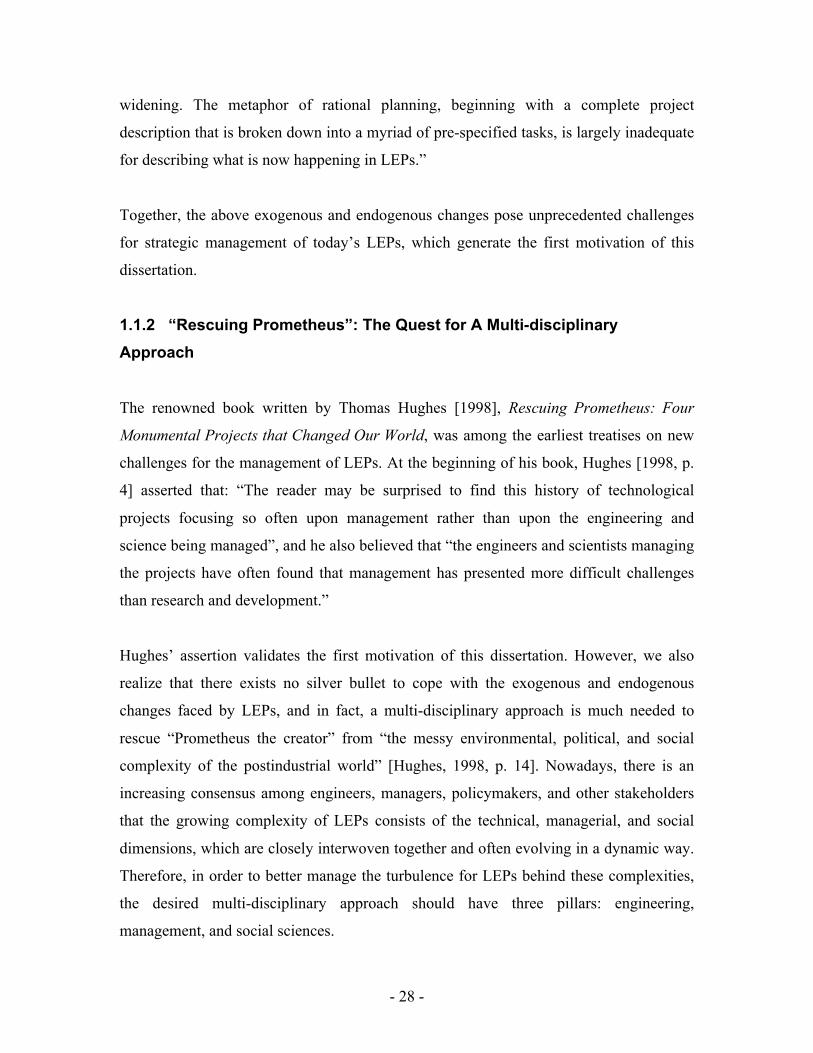
FIGURE 2-1: ROADMAP FOR LITERATURE REVIEW AND THEORETICAL BUILDUP ............... 34
FIGURE 2-2: STAKEHOLDER TYPOLOGY [ADAPTED FROM MITCHELL, AGLE, AND WOOD,
1997, P. 874] .............................................................................................................. 39
FIGURE 2-3: THE PRODUCTION MODEL OF THE FIRM [FREEMAN, 1984, P. 5, EXHIBIT 1.1] 41
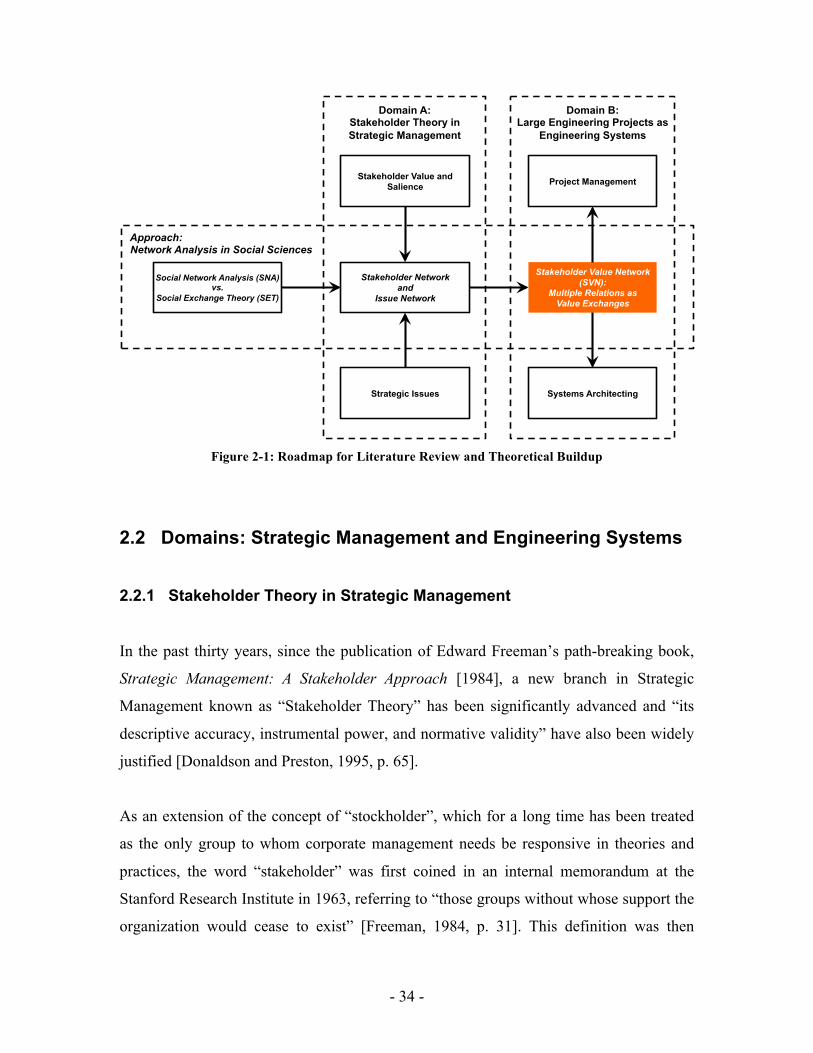
FIGURE 2-4: THE MANAGERIAL MODEL OF THE FIRM [FREEMAN, 1984, P. 6, EXHIBIT 1.2]42
FIGURE 2-5: THE “HUB-AND-SPOKE” STAKEHOLDER MODEL OF THE FIRM [FREEMAN,
1984, P. 25, EXHIBIT 1.5] ........................................................................................... 42
FIGURE 2-6: THE SINGLE-RELATIONAL STAKEHOLDER NETWORK MODEL OF THE FIRM .. 42
FIGURE 2-7: THE MULTI-RELATIONAL STAKEHOLDER NETWORK MODEL OF THE FIRM ... 43
FIGURE 2-8: RESEARCH GAP FOR THE NETWORK ANALYSIS IN SOCIAL SCIENCES ............. 62
FIGURE 3-1: FOUR-STEP MODELING FRAMEWORK FOR THE SVN ANALYSIS ..................... 72
FIGURE 3-2: STAKEHOLDER CHARACTERIZATION TEMPLATE FOR THE LOCAL COMMUNITY
................................................................................................................................... 79
FIGURE 3-3: STAKEHOLDER MAP FOR THE RUSAKOIL ...................................................... 82
FIGURE 3-4: TWO EXAMPLES FOR THE VALUE PATHS IN THE RUSAKOIL .......................... 84
FIGURE 3-5: KANO CATEGORIES FOR CUSTOMER REQUIREMENTS .................................... 93
FIGURE 3-6: STAKEHOLDER QUESTIONNAIRE FOR CATEGORIZING THE INTENSITY OF A
NEED ......................................................................................................................... 94

- 18 -
FIGURE 3-7: “PARTICULARISM” AND “CONCRETENESS” DIMENSIONS FOR FOUR TYPES OF
VALUE FLOWS ........................................................................................................... 96
FIGURE 3-8: STAKEHOLDER QUESTIONNAIRE FOR CATEGORIZING THE SOURCE
IMPORTANCE IN FULFILLING A NEED ......................................................................... 97
FIGURE 3-9: COMBINATION RULE FOR INTEGRATING TWO ATTRIBUTE SCORES INTO VALUE
FLOW SCORE .............................................................................................................. 98
FIGURE 3-10: EXAMPLE FOR THE MULTIPLICATIVE RULE OF VALUE PROPAGATION IN THE
SVN ......................................................................................................................... 103
FIGURE 3-11: FREEMAN’S EXAMPLES FOR GENERALIZED EXCHANGES [ADAPTED FROM
FREEMAN, 1984, P. 60] ............................................................................................ 109
FIGURE 3-12: OPN MODEL FOR THE SVN OF THE RUSAKOIL ......................................... 110
FIGURE 3-13: ZOOM-IN VIEW OF THE OPN MODEL ......................................................... 111
FIGURE 3-14: FINAL VERTEX REPORT FOR ALL THE VALUE CYCLES OF THE PROJECT .... 112
FIGURE 3-15: SCORE AND LENGTH OF ALL THE VALUE CYCLES FOR THE PROJECT ......... 117
FIGURE 3-16: TOP FIVE INDIRECT VALUE CYCLES FOR THE PROJECT .............................. 118
FIGURE 3-17: WEIGHTED STAKEHOLDER OCCURRENCE (WSO) FOR THE PROJECT ......... 120
FIGURE 3-18: WEIGHTED OUTPUT OCCURRENCE (WOO) FOR THE PROJECT ................... 122
FIGURE 3-19: WEIGHTED INPUT OCCURRENCE (WIO) FOR THE PROJECT ........................ 123
FIGURE 3-20: COMPARISON BETWEEN THE NORMALIZED VALUE FLOW SCORE AND THE
WIO ......................................................................................................................... 123
FIGURE 3-21: WEIGHTED VALUE FLOW OCCURRENCE (WVFO) FOR THE PROJECT ........ 125
FIGURE 3-22: STAKEHOLDER BALANCE FROM DIRECT TRANSACTIONS ........................... 127
FIGURE 3-23: STAKEHOLDER BALANCE FROM DIRECT AND INDIRECT TRANSACTIONS ... 127
FIGURE 3-24: NET TRANSACTION VALUE BETWEEN THE PROJECT AND OTHER
STAKEHOLDERS ....................................................................................................... 128
FIGURE 3-25: O/I RATIO BETWEEN THE PROJECT AND OTHER STAKEHOLDERS ............... 129
FIGURE 3-26: ISSUE-INTEGRATED FRAMEWORK OF THE SVN ANALYSIS ........................ 134
FIGURE 3-27: NOTATION FOR SINGLE STAKEHOLDER PROBLEM ...................................... 136
FIGURE 3-28: SOLUTION SPACE OF POSSIBLE OUTPUTS BY THE FOCAL ORGANIZATION AND
ONE STAKEHOLDER ................................................................................................. 140
FIGURE 3-29: INFLUENCE MATRIX AIJ .............................................................................. 141

- 19 -
FIGURE 4-1: PROJECT PHOENIX PRODUCTION PROCESS (VIZ., GOODS/SERVICE FLOWS) . 147
FIGURE 4-2: STAKEHOLDER CHARACTERIZATION TEMPLATE FOR LOCAL GOVERNMENTS
(LOG) ...................................................................................................................... 150
FIGURE 4-3: STAKEHOLDER MAP FOR THE PROJECT PHOENIX ......................................... 152
FIGURE 4-4: POLITICAL FLOWS IN THE STAKEHOLDER MAP ............................................ 153
FIGURE 4-5: INFORMATION FLOW IN THE STAKEHOLDER MAP ........................................ 153
FIGURE 4-6: GOODS/SERVICE FLOWS IN THE STAKEHOLDER MAP ................................... 154
FIGURE 4-7: FINANCIAL FLOWS IN THE STAKEHOLDER MAP ........................................... 154
FIGURE 4-8: “HUB-AND-SPOKE” MODEL FOR PROJECT PHOENIX .................................... 160
FIGURE 4-9: STAKEHOLDER QUESTIONNAIRE FOR CATEGORIZING THE URGENCY IN
FULFILLING A NEED ................................................................................................. 161
FIGURE 4-10: STAKEHOLDER QUESTIONNAIRE FOR CATEGORIZING THE SOURCE
IMPORTANCE IN FULFILLING A NEED ....................................................................... 161
FIGURE 4-11: COMBINATION RULE OF VALUE FLOW ATTRIBUTE SCORES ....................... 162
FIGURE 4-12: COMPARISON OF THREE TIME DISCOUNTING SCALES ................................ 162
FIGURE 4-13: OPN MODEL FOR THE SVN OF THE PROJECT PHOENIX .............................. 165
FIGURE 4-14: ZOOM-IN VIEW OF THE OPN MODEL ......................................................... 166
FIGURE 4-15: INTERNAL ASSETS WITHIN THE LOCAL GOVERNMENTS (LOG) ................. 167
FIGURE 4-16: UTILITY SCORE DISTRIBUTION OF ALL THE VALUE CYCLES FOR PROJECT
PHOENIX IN THE SVN MODEL .................................................................................. 168
FIGURE 4-17: TOP 11 VALUE CYCLES FOR PROJECT PHOENIX IN THE SVN MODEL ........ 170
FIGURE 4-18: VISUALIZATION OF TOP 13 VALUE CYCLES FOR PROJECT PHOENIX IN THE
SVN MODEL ............................................................................................................ 171
FIGURE 4-19: WEIGHTED STAKEHOLDER OCCURRENCE (WSO) FOR PROJECT PHOENIX IN
THE SVN MODEL ..................................................................................................... 173
FIGURE 4-20: WEIGHTED OUTPUT OCCURRENCE (WOO) FOR PROJECT PHOENIX IN THE
SVN MODEL ............................................................................................................ 174
FIGURE 4-21: WEIGHTED INPUT OCCURRENCE (WIO) FOR PROJECT PHOENIX IN THE SVN
MODEL ..................................................................................................................... 174
FIGURE 4-22: TOP 13 VALUE FLOWS FOR PROJECT PHOENIX IN THE SVN MODEL .......... 175
FIGURE 4-23: TOP 30 VALUE FLOWS FOR PROJECT PHOENIX IN THE SVN MODEL .......... 176

- 20 -
FIGURE 4-24: VISUALIZATION OF TOP 13 VALUE FLOWS FOR PROJECT PHOENIX IN THE
SVN MODEL ............................................................................................................ 177
FIGURE 4-25: WSO FOR PROJECT PHOENIX IN THE “HUB-AND-SPOKE” MODEL ............. 180
FIGURE 4-26: DECOMPOSITION OF THE IMPACTS OF INDIRECT STAKEHOLDER
RELATIONSHIPS (NUMERICAL SCALE) ..................................................................... 184
FIGURE 4-27: DIFFERENCES BETWEEN FOUR NETWORK MEASUREMENTS ....................... 185
FIGURE 4-28: DECOMPOSITION OF THE IMPACTS OF INDIRECT STAKEHOLDER
RELATIONSHIPS (PERCENTAGE SCALE) .................................................................... 186
FIGURE 4-29: CHANGE OF PERCENTAGE NETWORK STATISTICS FOR THE PROJECT PHOENIX
CASE ........................................................................................................................ 186
FIGURE 4-30: TYPOLOGY FOR STAKEHOLDER POWER AND CORRESPONDING
MEASUREMENT AND STRATEGY .............................................................................. 189
FIGURE 4-31: ISSUE NETWORK 1 OF “LOCAL ECONOMIC STIMULUS” .............................. 192
FIGURE 4-32: STAKEHOLDER BALANCE IN ISSUE NETWORK 1 ......................................... 193
FIGURE 4-33: NET TRANSACTION VALUE IN ISSUE NETWORK 1 ...................................... 194
FIGURE 4-34: IMPACT OF INDIRECT TRANSACTIONS FOR PROJECT PHOENIX IN ISSUE
NETWORK 1 ............................................................................................................. 195
FIGURE 4-35: RELATIONSHIP BALANCE BETWEEN PROJECT PHOENIX AND LOP ACROSS
FOUR ISSUES ............................................................................................................ 196
FIGURE 5-1: COMPARISON OF THE TIME BOUND BETWEEN JOHNSON AND OTHER TWO
ALGORITHMS ........................................................................................................... 206
FIGURE 5-2: EXAMPLE FOR THE SVN (NETWORK REPRESENTATION FOR M) ................... 208
FIGURE 5-3: DSM REPRESENTATION FOR M .................................................................... 209
FIGURE 5-4: DSM REPRESENTATION FOR M2 ................................................................... 210
FIGURE 5-5: DSM REPRESENTATION FOR M3 ................................................................... 210
FIGURE 5-6: DSM REPRESENTATION FOR THE IMPLICATIONS OF M3 ............................... 214
FIGURE 5-7: DSM FOR THE QUALITATIVE MODEL (LEFT) AND THE INPUTS OF THE
QUANTITATIVE MODEL (RIGHT) .............................................................................. 216
FIGURE 5-8: DSM FOR THE UNWEIGHTED (LEFT) AND WEIGHTED (RIGHT) OUTPUTS OF THE
QUANTITATIVE MODEL ............................................................................................ 216

- 21 -
FIGURE 5-9: WSO CHANGING WITH CYCLE LENGTH AND CYCLE NUMBER IN THE PROJECT
PHOENIX CASE ......................................................................................................... 218
FIGURE 5-10: EXAMPLE SVN SHOWING THE DIFFERENCE BETWEEN TWO PERSPECTIVES222
FIGURE 5-11: EXAMPLE FOR THE CONVERSION BETWEEN MULTIDIGRAPH AND SIMPLE
GRAPH ..................................................................................................................... 228
FIGURE 5-12: COMPARISON BETWEEN NWSO AND WSO IN THE PROJECT PHOENIX CASE
................................................................................................................................. 229
FIGURE 5-13: COMPARISON BETWEEN NWSO_ADJUSTED AND WSO IN THE PROJECT
PHOENIX CASE ......................................................................................................... 230
FIGURE 6-1: STAKEHOLDER MAP FOR LEVEL ONE MODEL .............................................. 247
FIGURE 6-2: NETWORK WEIGHTED STAKEHOLDER OCCURRENCE (NWSO) FOR LEVEL ONE
MODEL ..................................................................................................................... 249
FIGURE 6-3: NETWORK WEIGHTED VALUE FLOW OCCURRENCE (NWVFO) FOR LEVEL ONE
MODEL ..................................................................................................................... 250
FIGURE 6-4: IMPACTS OF STAKEHOLDER DECOMPOSITION ON VALUE FLOW
IDENTIFICATION ....................................................................................................... 252
FIGURE 6-5: STAKEHOLDER MAP FOR LEVEL TWO MODEL (POLITICAL FLOWS PART 1) . 256
FIGURE 6-6: STAKEHOLDER MAP FOR LEVEL TWO MODEL (POLITICAL FLOWS PART 2) . 257
FIGURE 6-7: STAKEHOLDER MAP FOR LEVEL TWO MODEL (INFORMATION FLOWS) ....... 258
FIGURE 6-8: STAKEHOLDER MAP FOR LEVEL TWO MODEL (GOODS/SERVICE FLOWS) ... 259
FIGURE 6-9: STAKEHOLDER MAP FOR LEVEL TWO MODEL (FINANCIAL FLOWS) ............ 260
FIGURE 6-10: NETWORK WEIGHTED STAKEHOLDER OCCURRENCE (NWSO) FOR LEVEL
TWO MODEL ............................................................................................................ 261
FIGURE 6-11: NETWORK WEIGHTED VALUE FLOW OCCURRENCE (NWVFO) FOR LEVEL
TWO MODEL ............................................................................................................ 261
FIGURE A-1-1: STAKEHOLDER-ORIENTED ARCHITECTING PROCESS ............................... 307
FIGURE A-1-2: SIMPLIFIED EXCHANGE MODEL FOR THE LOP ......................................... 309
FIGURE A-1-3: MAPPING BETWEEN VALUE EXCHANGE RATES AND THE EXCHANGE MODEL
................................................................................................................................. 311
FIGURE A-1-4: VALUE EXCHANGE MATRIX FOR THE LOP .............................................. 311

- 22 -
QUESTIONNAIRE A-3-1: STAKEHOLDER QUESTIONNAIRE FOR THE MULTINATIONAL
ENERGY PROJECT ..................................................................................................... 314
FIGURE A-4-1: INTERNAL ASSETS MODEL FOR PP .......................................................... 326
FIGURE A-4-2: INTERNAL ASSETS MODEL FOR HSG ....................................................... 326
FIGURE A-4-3: INTERNAL ASSETS MODEL FOR ASR ....................................................... 327
FIGURE A-4-4: INTERNAL ASSETS MODEL FOR UFG ....................................................... 327
FIGURE A-4-5: INTERNAL ASSETS MODEL FOR FCG ....................................................... 328
FIGURE A-4-6: INTERNAL ASSETS MODEL FOR FCT ........................................................ 328
FIGURE A-4-7: INTERNAL ASSETS MODEL FOR FCP ........................................................ 329
FIGURE A-4-8: INTERNAL ASSETS MODEL FOR NTG ....................................................... 329
FIGURE A-4-9: INTERNAL ASSETS MODEL FOR CSP ........................................................ 330
FIGURE A-4-10: INTERNAL ASSETS MODEL FOR LOP ..................................................... 330
FIGURE A-4-11: INTERNAL ASSETS MODEL FOR PUM .................................................... 331
FIGURE A-4-12: INTERNAL ASSETS MODEL FOR NGO .................................................... 331
FIGURE A-4-13: INTERNAL ASSETS MODEL FOR INF ...................................................... 332
FIGURE A-4-14: ISSUE NETWORK 2 OF “GENERAL ECONOMIC PERFORMANCE” .............. 332
FIGURE A-4-15: STAKEHOLDER BALANCE IN ISSUE NETWORK 2 ..................................... 333
FIGURE A-4-16: NET TRANSACTION VALUE IN ISSUE NETWORK 2 .................................. 333
FIGURE A-4-17: IMPACT OF INDIRECT TRANSACTIONS FOR PP IN ISSUE NETWORK 2 ...... 333
FIGURE A-4-18: ISSUE NETWORK 3 OF “LOCAL ENVIRONMENTAL PROTECTION” ........... 334
FIGURE A-4-19: STAKEHOLDER BALANCE IN ISSUE NETWORK 3 ..................................... 334
FIGURE A-4-20: NET TRANSACTION VALUE IN ISSUE NETWORK 3 .................................. 335
FIGURE A-4-21: IMPACTS OF INDIRECT TRANSACTIONS FOR PP IN ISSUE NETWORK 3 .... 335
FIGURE A-4-22: ISSUE NETWORK 4 OF “NATIONAL SECURITY” ...................................... 336
FIGURE A-4-23: STAKEHOLDER BALANCE IN ISSUE NETWORK 4 ..................................... 336
FIGURE A-4-24: NET TRANSACTION VALUE IN ISSUE NETWORK 4 .................................. 336
FIGURE A-4-25: IMPACT OF INDIRECT TRANSACTIONS FOR PP IN ISSUE NETWORK 4 ...... 337
FIGURE A-4-26: RELATIONSHIP BALANCE BETWEEN PP AND PUM ACROSS FOUR ISSUES
................................................................................................................................. 337
FIGURE A-4-27: RELATIONSHIP BALANCE BETWEEN PP AND LOG ACROSS THREE ISSUES
................................................................................................................................. 338

- 23 -
FIGURE A-4-28: RELATIONSHIP BALANCE BETWEEN PP AND UFG ACROSS THREE ISSUES
................................................................................................................................. 338
FIGURE A-6-1: STAKEHOLDER MAP FOR LEVEL THREE MODEL (76 STAKEHOLDERS) .... 351
FIGURE A-6-2: STAKEHOLDER MAP FOR LEVEL THREE MODEL (POLITICAL FLOWS PART 1)
................................................................................................................................. 352
FIGURE A-6-3: STAKEHOLDER MAP FOR LEVEL THREE MODEL (POLITICAL FLOWS PART 2)
................................................................................................................................. 353
FIGURE A-6-4: STAKEHOLDER MAP FOR LEVEL THREE MODEL (INFORMATION FLOWS) 354
FIGURE A-6-5: STAKEHOLDER MAP FOR LEVEL THREE MODEL (GOODS/SERVICE FLOWS)
................................................................................................................................. 355
FIGURE A-6-6: STAKEHOLDER MAP FOR LEVEL THREE MODEL (FINANCIAL FLOWS) ..... 356

- 24 -
[This page left intentionally blank]

- 25 -
CHAPTER 1. INTRODUCTION
“Prometheus the creator, once restrained by defense
projects sharply focused upon technical and economic
problems, is now free to embrace the messy environmental,
political, and social complexity of the postindustrial
world.”
— Hughes [1998, p. 14]
1.1 Dissertation Motivation
1.1.1 Large Engineering Projects: Impacts and Challenges
Since the twentieth century, large engineering projects (LEPs), sometimes also termed as
“megaprojects” [Flyvbjerg, Bruzelius, and Rothengatter, 2003] or “macro-projects”
[Bolonkin and Cathcart, 2009], have become a remarkable phenomenon emerging from
the interactions between human society and the natural environment, such as telephone
networks, electric grids, national highways, oil fields, space stations, and so on. These
phenomenal projects are made possible on the basis of technological advancement,
especially after individual “inventions begin to be connected” [de Weck, Roos, and
Magee, 2011, p. 3] into large and complex systems, and meanwhile, the impacts of these
projects are in-depth and far-reaching from many perspectives.
There is no doubt about the substantial improvement brought by the LEPs on the quality
of human life—for people living in the modern society, it is impossible to image going
back to the old times, even only for one day, without the telephones, electricity,
highways, and airports—several months ago, when Hurricane Sandy temporarily
destroyed many infrastructures in the New York City, I witnessed by myself the chaotic

- 26 -
and helpless scenes of the whole city, resulting from the loss of water, electricity, public
transportation, and many other benefits closely associated with the LEPs.
Additionally, when examined at the macro-level, LEPs “constitute one of the most
important business sectors in the world” [Miller and Lessard, 2001, p. 1]. It is evident
that there exists a strong connection between LEPs and the productivity growth and
national competitiveness of a country [Hirschman, 1957]. On one hand, for the developed
countries, such as the United States, this connection is apparent “because advanced
industrial societies in the West dealt with their infrastructure needs through a mixture of
centralized public bureaucracies, regional governments, and private firms” [Miller and
Lessard, 2001, p. 2]. On the other hand, for the developing countries, such as China
[Démurger, 2001], the role of LEPs in modernization makes that connection even clearer
and more important. For example, in 1993, China’s capital investment on LEPs already
reached 6.5% of the GDP of that year [World Bank, 1995]; and after more than ten years,
by the end of 2009, the LEPs investment had even reached 15% ~ 20% of the GDP for
coastal provinces and all four municipalities in China [Shi, 2012]. Moreover, for both the
developed and developing countries, during the period of economic slowdown or crisis,
LEPs have been widely taken as an effective policy measure to stimulate the general
economy, such as the well-known Roosevelt’s New Deal in the 1930s, and more recent
examples include the 2008-2009 Chinese Economic Stimulus Program, the 2008
European Union Stimulus Plan, as well as the American Recovery and Reinvestment Act
of 2009.
However, every coin has two sides—accompanying with the above positive impacts,
LEPs also bring potential externalities (i.e., the overuse of natural resources,
environmental pollutions, etc.) as well as unintended consequences (i.e., traffic
congestions, power outrages, etc.). Further, because of their scale and complexity, LEPs
are difficult to shape and execute and often go terribly wrong1, with serious implications
1 For example, the Central Artery/Tunnel Project (CA/T) or the “Big Dig” in Boston, Massachusetts (http://en.wikipedia.org/wiki/Big_Dig): This project was the most expensive highway project in the U.S. and has been plagued by escalating costs ($5.3 billion or 190% more than the estimated cost, in 1982 dollars), scheduling overruns (completed in December 2007,

- 27 -
for their sponsors and other stakeholders. Because of the magnitude of capital investment
for as well as broad spatial and temporal scope of LEPs, the negative impacts of those
externalities and consequences on human society are often severe, long-lasting, and even
irreversible. In return, with the increasing recognition of these possible negative impacts,
LEPs face the social, political, and legal oppositions from a wide range of stakeholders,
which in turn becomes a more common reason leading to the failure of the projects. For
example, since the 1960s, mass mobilization has taken place against the construction of
inner city freeways in the United States, nuclear power plants in Germany, new airports
in Mexico City, and oil pipelines in Africa. This stakeholder opposition becomes even
more difficult to handle for the LEPs that cross the borders of countries with different
social and political systems, such as Russia’s environmental ban in August 2006 imposed
on Royal Dutch Shell’s multi-billion offshore oil projects the Sakhalin-II [Parfitt, 2006],
which was financed by the European Bank for Reconstruction and Development (EBRD)
at that time. McAdam, Boudet, Davis, et al. [2011, p. 401] once synopsized this way:
“Fifty years ago, the main challenges to large infrastructure projects were technical or
scientific. Today, the greatest hurdles faced by such projects are almost always social and
/ or political.”
Meanwhile, “in parallel with the growth of physical infrastructure came an increase in the
size of the firms and organizations that ran these systems” [de Weck, Roos, and Magee,
2011, p. 7]. Further, with the increase in the size of the firms running LEPs, the
emergence of organizational hierarchy and heterogeneity adds even more difficulties to
efficiently design and effectively manage these projects surrounded by various
stakeholders, “who can affect and are affected by” [Freeman, 1984] the long-term success
of these large projects—in the dissertation, the “long-term success” specifically means
“creating as much value as possible for stakeholders, without resorting to trade-offs”
[Freeman, Harrison, Wicks, et al., 2010, p. 28]. As highlighted by Miller and Lessard
[2001, p. 3]: “The gap between the realities of projects and theories for managing them is
about ten years later than the original schedule), and worsening performance (such as leaks, design flaws, charges of poor execution and use of substandard materials, criminal arrests, and even one death).
- 28 -
widening. The metaphor of rational planning, beginning with a complete project
description that is broken down into a myriad of pre-specified tasks, is largely inadequate
for describing what is now happening in LEPs.”
Together, the above exogenous and endogenous changes pose unprecedented challenges
for strategic management of today’s LEPs, which generate the first motivation of this
dissertation.
1.1.2 “Rescuing Prometheus”: The Quest for A Multi-disciplinary Approach
The renowned book written by Thomas Hughes [1998], Rescuing Prometheus: Four
Monumental Projects that Changed Our World, was among the earliest treatises on new
challenges for the management of LEPs. At the beginning of his book, Hughes [1998, p.
4] asserted that: “The reader may be surprised to find this history of technological
projects focusing so often upon management rather than upon the engineering and
science being managed”, and he also believed that “the engineers and scientists managing
the projects have often found that management has presented more difficult challenges
than research and development.”
Hughes’ assertion validates the first motivation of this dissertation. However, we also
realize that there exists no silver bullet to cope with the exogenous and endogenous
changes faced by LEPs, and in fact, a multi-disciplinary approach is much needed to
rescue “Prometheus the creator” from “the messy environmental, political, and social
complexity of the postindustrial world” [Hughes, 1998, p. 14]. Nowadays, there is an
increasing consensus among engineers, managers, policymakers, and other stakeholders
that the growing complexity of LEPs consists of the technical, managerial, and social
dimensions, which are closely interwoven together and often evolving in a dynamic way.
Therefore, in order to better manage the turbulence for LEPs behind these complexities,
the desired multi-disciplinary approach should have three pillars: engineering,
management, and social sciences.

- 29 -
The quest for such an approach directly incubates the “Engineering Systems” as an
important and promising new field [Moses, 2004a; de Weck, Roos, and Magee, 2011],
which is discussed in detail in Chapter 2. Meanwhile, this epic quest also stimulates the
second motivation of this dissertation.
1.2 Research Questions
It should be clearly realized that the above two ambitious goals, either managing the
exogenous and endogenous turbulence of LEPs or developing a multi-disciplinary
approach for that purpose, can by no means be completely achieved in one single
doctoral dissertation, or even by several prestigious university departments, such as the
Engineering Systems Division (ESD) at MIT, the Department of Management Science
and Engineering (MS&E) at Stanford, and the Department of Engineering and Public
Policy (EPP) at CMU. Instead, these goals belong to the “endless frontier” [Bush, 1945]
of engineering science, and the achievement of the goals requires the devoted
contributions of many generations in all the related disciplines and practices.
That being said, we embark on this voyage by looking into the multi-type and networked
relationships between LEPs and their stakeholders—as one of the three founding
architects of sociology, Max Weber (1864~1920) treated “sociology as first and foremost
about relationships” [Scott and Calhoun, 2004, p. 10]—influenced by Weber’s treatment,
we are striving to find the answers to the following questions:
Question One: What are the basic types of the relationships between LEPs and
their stakeholders? Is it possible to analyze different types of stakeholder
relationships together?

- 30 -
Question Two: What are the basic patterns for value exchanges among LEPs
and their stakeholders through these relationships? Is there any connection
between the exchange patterns and the relationship types?
Question Three: Can we interpret the implications emerging from the multi-type
and networked relationships between LEPs and their stakeholders? Can we use
these insights to formulate strategies in a positive and proactive way as well as
with manageable complexity? Can we use these insights to inform the process of
system architecting?
Question Four: Based on the answers to the above questions, can we develop a
methodological framework, with the support of an effective and efficient
modeling tool, to perform a comprehensive analysis for the multi-relational
network consisting of LEPs and their stakeholders?
Question Five: Can we apply the above theory, methodology, and tool to the
LEPs in the real world? Can the theory, methodology, and tool be validated by
as well as shed light on the real-world case studies?
Note that the first three questions are centered on the theoretical foundation of this
dissertation; the fourth question puts forward the need for a methodological framework as
well as a modeling tool; and the last question requires the theory, methodology, and tool
to be tested by case studies.
We will argue that the answers to these questions must rely on a multi-disciplinary
approach across engineering, management, and social sciences. We also will show that
the multi-disciplinary approach of Stakeholder Value Network (SVN) contributes to the
existing knowledge in all three disciplinary domains.
1.3 Dissertation Architecture

- 31 -
Figure 1-1 sketches the overall architecture of this dissertation:
Figure 1-1: Dissertation Architecture
Based on Figure 1-1, the remainder of this dissertation is organized as follows:
Chapter 2 reviews the relevant literature in strategic management, engineering
systems, as well as the network analysis of social sciences. Based on the
literature review, the theoretical foundation for Stakeholder Value Network
(SVN) is built up, and more specific research opportunities arising from each
discipline are also identified.
Chapters 3 ~ 6 constitute the main body of this dissertation, which can be
divided into two modules: Chapters 3 and 4 form the first module and explore the
implications of the Stakeholder Value Network (SVN) from the perspective of a
focal organization, while Chapters 5 and 6 form the second module and explore
Chapter 2: Literature Review and Theoretical Buildup
Chapter 3: Methodology I (SVN for a Focal Organization)
Chapter 4: Case Study I (Project Phoenix)
Chapter 5: Methodology II (SVN for the Whole Network)
Chapter 6: Case Study II (China’s Energy Conservation)
Chapter 7: Conclusions and Future Work
Validation
Validation
Application
Application
Development
Chapter 1: Introduction
Construction

- 32 -
the implications of the Stakeholder Value Network (SVN) from the perspective
of the whole network. Further, Chapter 3 develops the methodology applied in
the case study of Chapter 4, and meanwhile, the case study of Chapter 4 validates
the methodology developed in Chapter 3. Organized in the same way, Chapters 5
and 6 stand on the work completed by Chapters 3 and 4, and also build a
modeling tool dedicated to the Stakeholder Value Network (SVN) analysis.
Chapter 7 concludes with the main contributions of this dissertation and also
suggests a few directions for future research.
In addition, Appendix I further extends the Stakeholder Value Network (SVN) approach
to the architecting process for LEPs as well as engineering systems in general.

- 33 -
CHAPTER 2. LITERATURE REVIEW AND THEORETICAL BUILDUP
“Many have argued that the business world of the twenty-
first century has undergone dramatic change. The rise of
globalization, the dominance of information technology, the
liberalization of states, especially the demise of centralized
state planning and ownership of industry, and increased
societal awareness of the impact of business on
communities and nations have all been suggested as
reasons to revise our understanding of business.”
— Freeman, Harrison, Wicks, et al. [2010, p. 3]
2.1 Chapter Introduction
Following the above background and motivations, this chapter conducts a thorough
investigation on the academic literature in the Stakeholder Theory, Engineering Systems,
as well as the Network Analysis in Social Sciences. Along with the literature review,
research opportunities to better answer the important questions raised in the last chapter
are identified, and through this process the theoretical foundation for this dissertation is
also built up, culminating in the definition of and three key assumptions for the
Stakeholder Value Network (SVN). Specifically, Figure 2-1 illustrates the roadmap for
literature review and theoretical buildup in this chapter.
- 34 -
Figure 2-1: Roadmap for Literature Review and Theoretical Buildup
2.2 Domains: Strategic Management and Engineering Systems
2.2.1 Stakeholder Theory in Strategic Management
In the past thirty years, since the publication of Edward Freeman’s path-breaking book,
Strategic Management: A Stakeholder Approach [1984], a new branch in Strategic
Management known as “Stakeholder Theory” has been significantly advanced and “its
descriptive accuracy, instrumental power, and normative validity” have also been widely
justified [Donaldson and Preston, 1995, p. 65].
As an extension of the concept of “stockholder”, which for a long time has been treated
as the only group to whom corporate management needs be responsive in theories and
practices, the word “stakeholder” was first coined in an internal memorandum at the
Stanford Research Institute in 1963, referring to “those groups without whose support the
organization would cease to exist” [Freeman, 1984, p. 31]. This definition was then
Domain A: Stakeholder Theory in Strategic Management
Domain B: Large Engineering Projects as
Engineering Systems
Stakeholder Value and Salience
Stakeholder Network and
Issue Network
Strategic Issues
Project Management
Systems Architecting
Approach: Network Analysis in Social Sciences
Social Network Analysis (SNA) vs.
Social Exchange Theory (SET)
Stakeholder Value Network (SVN):
Multiple Relations as Value Exchanges

- 35 -
refined in a more neutral and comprehensive way: a “stakeholder” for an organization is
“any group or individual who can affect or is affected by the achievement of the
organization’s objectives” [Freeman, 1984, p. 46], and Freeman clearly stated the
motivation behind the emergence of “stakeholder” is to better understand and cope with
the dramatic changes of the environment for modern corporations, such as “the rise of
globalization, the dominance of information technology, the liberalization of states,
especially the demise of centralized state planning and ownership of industry, and
increased societal awareness of the impact of business on communities and nations”
[Freeman, Harrison, Wicks, et al., 2010, p. 3].
Since its inception, the concept of “stakeholder” has challenged and been challenged by
the dominant schools in business and management, which are mainly based on the
economic ideal of an orderly movement towards the market equilibrium, with the
assumption that corporations are the property of their owners (viz., stockholders for
public companies) and their liability for their effects upon others is limited. Freeman and
other stakeholder scholars argued that the above basis and assumption do not always
hold, especially under the turbulent environment for modern corporations, and they
further proposed to ground the Stakeholder Theory in a Philosophical Pragmatism [Rorty,
1979; Wicks and Freeman, 1998] and made an explicit tie to the Theory of
Entrepreneurship [Venkataraman, 1997; 2002]. In addition, Freeman, Harrison, Wicks, et
al. [2010, pp. 10-19] also argued the main ideas of Stakeholder Theory are still
compatible with a number of other popular schools in business and management: the Free
Market approach of Milton Friedman [1962; 1970], the Agency Theory approach of
Michael Jensen [2001; Jensen and Meckling, 1976], the Competitive Advantage approach
of Michael Porter [1985], and the Transaction Cost theory of Oliver Williamson [1973;
1975; 1981].
Further, Donaldson and Preston [1995, pp. 66-67] divided the existing research on
Stakeholder Theory into three categories:

- 36 -
Descriptive Stakeholder Theory: This category of stakeholder research
presents a model that “describes the corporation as a constellation of cooperative
and competitive interests possessing intrinsic value”;
Instrumental Stakeholder Theory: This category of stakeholder research
“establishes a framework for examining the connections, if any, between the
practice of stakeholder management and the achievement of various corporate
performance goals”;
Normative Stakeholder Theory: This category of stakeholder research provides
the fundamental basis for Stakeholder Theory by assuming that “stakeholders are
persons or groups with legitimate interests in procedural and/or substantive
aspects of corporate activity”, and “the interests of all stakeholders are of
intrinsic value.”
Examples of Descriptive Stakeholder Theory can be found in Friedman and Miles [2002],
Mitchell, Agle, and Wood [1997], and Rowley [2003] among others. Examples of
Instrumental Stakeholder Theory can be found in Agle, Mitchell, and Sonnenfeld [1999],
Harrison, Bosse, and Phillips [2010], Harrison and St. John [1996], Jones [1995], Rowley
[1997], Scott and Lane [2000], Slinger [1999], and Wheeler and Sillanpää [1998] among
others. Finally, examples of Normative Stakeholder Theory can be found in Clarkson
[1995], Evan and Freeman [1993], Hillman and Keim [2001], Phillips [1997], and
Wheeler, Colbert, and Freeman [2003] among others. In addition, some scholars
[Donaldson, 1999; Freeman, 1999; Jones and Wicks, 1999; Treviño and Weaver, 1999]
also proposed to develop a Whole Stakeholder Theory by integrating all the above three
categories.
Specifically, Freeman, Harrison, Wicks, et al. [2010, p. 6] argued that the distinctions
given by Donaldson and Preston [1995] are not useful all the time, because Stakeholder
Theory should be inherently “managerial”. Based on this argument, Freeman, Harrison,
Wicks, et al. [2010, pp. 4-5 and p. 29] outlined three basic problems that Stakeholder
Theory has evolved to address over decades:

- 37 -
The Problem of Value Creation and Trade: Understanding and managing a
business in the world of the twenty-first century—for instance, “How can we
understand business in a world where there is a great deal of change in business
relationships, and where these relationships shift depending on the national,
industry, and societal context?” and “How is value creation and trade possible in
such a world?”
The Problem of the Ethics of Capitalism: Putting together thinking about
questions of ethics, responsibility, and sustainability with the usual economic
view of capitalism—for instance, “How can we understand capitalism so that all
its effects can be taken into account by decision makers, rather than externalized
on society?” and “Is it possible for business executives to ‘do the right thing’, all
things considered, no matter how complicated the world is?”
The Problem of Managerial Mindset: Understanding what to teach managers
and students about what it takes to be successful in the current business world—
for instance, “How can we utilize and redefine economic theory so that it
becomes useful in a turbulent world full of ethical challenges?” and “How can
managers adopt a mindset that puts business and ethics together to make
decisions on a routine basis?”
2.2.2 Research Opportunities for Stakeholder Theory
On the basis of the above literature review for Stakeholder Theory, against the backdrop
of Strategic Management, we identify three major opportunities to contribute to the
stakeholder research in the management domain: Stakeholder Salience, Stakeholder
Network Model, as well as Stakeholders and Strategic Issues. Note that these three
opportunities are organized by their logical depth, and mainly focus on the first and third
problems (viz., Value Creation & Trade and Managerial Mindset) studied by the
Stakeholder Theory [Freeman, Harrison, Wicks, et al., 2010, pp. 4-5 and p. 29]. In
addition, if using the terminology defined by Donaldson and Preston [1995, pp. 66-67],
these opportunities should be closer to the descriptive and instrumental categories than
the normative one.

- 38 -
2.2.2.1 Stakeholder Salience
Freeman [1994, p. 411] once suggested using “Who and What Really Counts” as the
principle to identify the stakeholders for an organization, which is often the first
challenge for scholars and practitioners to understand and apply the Stakeholder Theory.
However, there was little agreement on the specific contents of this principle. To meet
this challenge, Mitchell, Agle, and Wood [1997] developed a descriptive theory of
Stakeholder Salience and then validated its strength with an empirical study for CEO’s
(Chief Executive Officers) decisions [Agle, Mitchell, and Sonnenfeld, 1999]. In their
theory, Stakeholder Salience is defined as “the degree to which managers give priority to
competing stakeholder claims” [Mitchell, Agle, and Wood, 1997, p. 854], and can be
determined by managers’ perceptions of three key stakeholder attributes, namely, Power,
Legitimacy, and Urgency:
Power: A can get B to do something that B would not have otherwise done;
Legitimacy: The actions of an entity are desirable, proper, or appropriate within
some socially constructed system of norms, values, beliefs, and definitions;
Urgency: The degree to which stakeholder claims call for immediate attention.
Through combining the above three attributes, a comprehensive topology of seven
categories of stakeholders is generated (see Figure 2-2): those stakeholders having only
one attribute are called Latent Stakeholders (i.e., Category 1, 2, and 3), those stakeholders
having two attributes are called Expectant Stakeholders (i.e., Category 4, 5, and 6), and
those stakeholders having all of the three attributes are called Definitive Stakeholders
(i.e., Category 7). From the latent to expectant and to definitive stakeholders, their
importance perceived by managers, or the Stakeholder Salience, is increasing.

- 39 -
Figure 2-2: Stakeholder Typology [Adapted from Mitchell, Agle, and Wood, 1997, p. 874]
However, as emphasized by Freeman, Harrison, Wicks, et al. [2010, pp. 5-6]:
“Stakeholder theory suggests that if we adopt as a unit of analysis the relationship
between a business and the groups and individuals who can affect or are affected by it,
then we have a better chance to deal with these three problems” (viz. the problems
outlined in Section 2.2.1), we argue that it is more appropriate for the Stakeholder
Salience theory to take the relationships between stakeholders, rather than stakeholders
themselves, as the basis to understand the attributes of Power, Legitimacy, and Urgency,
as well as the resulting Stakeholder Salience. The reason for this argument is mainly
threefold:
First of all, in light of the complexity of stakeholder relationships, it is not
realistic to discuss the Power, Legitimacy, and Urgency of a stakeholder without
considering the specific contents of relationships between this stakeholder and
other stakeholders (including the focal organization). For example, Stakeholder
A is more powerful than Stakeholder B in terms of issuing the environmental
permits for Stakeholder B to conduct a large engineering project, but meanwhile
Stakeholder B gains more power by creating more jobs and boosting the local
1 Dormant
Stakeholder
2 Discretionary Stakeholder
3 Demanding Stakeholder
4 Dominant
Stakeholder
5 Dangerous Stakeholder
6 Dependent
Stakeholder
7 Definitive
Stakeholder
8 Nonstakeholder
POWER
URGENCY
LEGITIMACY

- 40 -
economy for Stakeholder A, and even more complicated, the power associated
with different relationships is not always the same and may come into play
during different period of the activity of a focal organization. The treatment is
oversimplified to measure the Power, Legitimacy, and Urgency on the basis of
stakeholders other than the relationships between stakeholders.
Specifically, “a meaningful discussion of power really requires networks rather
than dyads—precisely because dyadic relationships lack the social alternatives
which are central to Emerson’s conception of power (Cook and Emerson, 1978)”
[Cook, Cheshire, and Gerbasi, 2006, p. 197]. From the perspective of economics,
“Power” is a secondary and derivative phenomenon determined by exchange
relationships.
Social Exchange Theory (SET) [Cropanzano and Mitchell, 2005; Zafirovski,
2005], which will be discussed in detail later this chapter, further points out that
“Power” emerges and evolves in a complex structure of exchanges of
resources—Collins [1988, p. 412] once elaborated in this way: “Human beings
have the capacity to create and negotiate whatever they can at any moment in
time. But they always act in a structured situation, so that the consequences and
conditions of their creativity and negotiation are nevertheless patterned by larger
relationships beyond their control.” Therefore, more in-depth research is desired
to better interpret the “Power” of stakeholders, and we propose to base such an
interpretation on the exchange relationships between stakeholders as well as the
structural properties emerged from these relationships.
In fact, at the beginning of their seminal paper, Mitchell, Agle, and Wood [1997, p. 853]
also recognized that Power, Legitimacy, and Urgency are three “relationship attributes”,
but the logical consistency seemed lost later on, and they did not clearly map these
attributes to stakeholder relationships, nor did they touch the complexity of understanding
the multi-type and networked relationships between stakeholders.
2.2.2.2 Stakeholder Network Model

- 41 -
Once the stakeholder relationship is taken as the unit of analysis, the next interesting
question will be how to build a stakeholder model to describe these relationships for
informed decision-making. Rowley [1997] was among the first researchers to introduce
the network approach of social sciences to the modeling of stakeholder relationships—
specifically, he highlighted the limitation of concentrating on dyadic relationships
between individual stakeholders and a focal organization, and then applied the Social
Network Analysis (SNA), which will be discussed in detail later this chapter, to construct
“a theory of stakeholder influences, which accommodates multiple, independent
stakeholder demands and predicts how organizations respond to the simultaneous
influence of multiple stakeholders” [Rowley, 1997, p. 887].
Before discussing the limitation of the traditional stakeholder model only focusing on
dyadic relationships, like the “Hub-and-Spoke”, as well as the improvement on Rowley’s
proposal for stakeholder network model, we first review the management literature on the
modeling of modern firms (and their stakeholders), and classifies its development into
five stages, from the earliest to the latest: the Production Model, the Managerial Model,
the Stakeholder Model, the Single-Relational Stakeholder Network Model, and the Multi-
Relational Stakeholder Network Model (see Figures 2-3 ~ 2-7 for simplified example of
each model). Note that (1) the Production Model is also known as the Input-Output
Model [Donaldson and Preston, 1995, p. 68]; (2) the Managerial Model is actually the
Mental Model [Denzau and North, 1994, p. 4] shared by firms’ managers; (3) the
Stakeholder Model is first constructed by Freeman [1984, p. 25] and then renamed as the
“Hub-and-Spoke” Model by Donaldson and Preston [1995, p. 69]; (4) the Single-
Relational Stakeholder Network Model refers to the Social Network Analysis (SNA)
Model proposed by Rowley [1997, p. 891]; and (5) the Multi-Relational Stakeholder
Network Model refers to the Stakeholder Value Network (SVN) Model developed by this
dissertation and its forerunners [Cameron, 2007; Sutherland, 2009].
Figure 2-3: The Production Model of the Firm [Freeman, 1984, p. 5, Exhibit 1.1]
Suppliers Firm Customers
- 42 -
Figure 2-4: The Managerial Model of the Firm [Freeman, 1984, p. 6, Exhibit 1.2]
Figure 2-5: The “Hub-and-Spoke” Stakeholder Model of the Firm [Freeman, 1984, p. 25, Exhibit 1.5]
Figure 2-6: The Single-Relational Stakeholder Network Model of the Firm
Firm
Investors
Employees
Suppliers Customers
Firm
Governments Political Groups
Trade Associations Communities
Investors
Employees
Suppliers Customers
Project
Investors
Consumers
Firm
Suppliers
Host-Country Corporation
Local Community
Host-Country Government

- 43 -
Figure 2-7: The Multi-Relational Stakeholder Network Model of the Firm
From Figure 2-3 to Figure 2-7, we observe that the models become more and more
sophisticated in terms of the number of stakeholders and relationships as well as their
contexts. Specifically, (1) the evolution from the Production Model to the Managerial
Model depicts the separation of ownership and control from family-dominated business
to modern firms; (2) the advancement from the Managerial Model to the Stakeholder
Model highlights the internal and external changes in firms’ market and nonmarket
environments (especially in the “nonmarket” [Baron, 1995] one) during the past a few
decades; (3) the progress from the Stakeholder Model to the Network Model reflects the
current trend of moving the “units of analysis” [Freeman, Harrison, Wicks, et al., 2010,
pp. 5-6] from the actors to the networked relationships between these actors, which are
more fundamental phenomena as argued by sociologists [Emerson, 1976, p. 346; Firth,
Project
Investors
Consumers
Firm
Sales Revenue Product
Suppliers
Product Subsystems Contracts
Future Project Approval
Host-Country Corporation
Logistical Support
Revenue Sharing
Local Community
Employment
Workforce
NGO
Environmental Impact Plan
Environmental Compliance
Economic Support
Political Influence
Policy Support
Project Lobbying
Federal Support
ROI Investment
Host-Country Government
Regulatory Approval
Project Approval
Taxes
Investment
High-grade Goods
Low-grade Goods
Technology Transfer
Technology Reqts
Technology

- 44 -
1967, p. 4; Sahlins, 1965b, p. 139] and are also more holistic from the perspective of
engineering systems [Cameron, 2007; Feng, Crawley, de Weck, et al., 2010; Sutherland,
2009]; and (4) for the two different network models, compared to the Social Network
Analysis (SNA), the Stakeholder Value Network (SVN) developed in this dissertation
aims to study the interactions between the multiple types of stakeholder relationships,
particularly those indirect ones, as well as the resulting strategic implications. More
detailed comparison between SNA and SVN will be elaborated later in this chapter.
It has been almost sixteen years since Rowley’s proposal for applying the network
analysis (more specifically, the Social Network Analysis or SNA), but nowadays the
“Hub-and-Spoke” Model (see Figure 2-5) is still the dominant paradigm of stakeholder
model, possibly because of the lack of a sounder theoretical foundation, a more
comprehensive methodological framework, a more powerful modeling tool, as well as
more empirical case studies—all these possible reasons suggest promising research
opportunities for this dissertation.
2.2.2.3 Stakeholders and Strategic Issues
Based on the above classification for the development of firm models, another interesting
observation is that in moving from the Managerial Model (see Figure 2-4) to the “Hub-
and-Spoke” Stakeholder Model (see Figure 2-5), the added actors, Governments, Political
Groups, Trade Associations, and Communities, all come from the “nonmarket”
environment, in contrast to the traditional “market” environment which includes
Investors, Suppliers, Customers, and Employees. This observation indicates the strong
connections between Stakeholder Theory and the research on Nonmarket Strategy
[Baron, 1995, 2001; Boddewyn, 2003; Kanter, 1999; Mahon, Heugens, and Lamertz,
2004].
Actually, as highlighted by Lucea [2007, p. 17], in the research of Nonmarket Strategy,
Stakeholder Theory is often treated as a rival approach to “Issue Management” or
“Strategic Issue Management” [Ansoff, 1980; Arcelus and Schaeffer, 1982; Bartha, 1983;

- 45 -
Bigelow, Fahey, and Mahon, 1991, 1993; Chase, 1982, 1984; Dutton and Duncan, 1987;
Johnson, 1983; Mahon and Waddock, 1992]. “Issues” are usually defined as “events,
trends, or developments that could have a negative impact on the organization’s ability to
reach its objectives if left unattended” [Mahon, Heugens, and Lamertz, 2004, p. 171], or
more accurately, “focal and concrete events such as a project, a product, or a firm policy
that generate gaps between the expectations of a number of stakeholders and the firm’s
behavior” [Lucea, 2007, p. 26]. Specifically, Table 2-1 compares the objective, focus,
and research emphasis of Stakeholder Theory and Strategic Issue Management.
Table 2-1: Comparison between Stakeholder Theory and Strategic Issue Management
[Adapted from Lucea, 2007, p. 24]
Stakeholder Theory Strategic Issue Management
Objective
[Mahon, Heugens, and Lamertz, 2004]
Appease critical actors; Foster
cooperation
Minimize surprises; Risk management
approach
Focus
[Mahon, Heugens, and Lamertz, 2004]
Individuals, groups, communities,
organizations Events, trends
Research Emphasis Stakeholder identification; Stakeholder
classification; Stakeholder salience
Issue life cycles; Evolution of issues;
Strategic responses at different stages
Paradigm Critiques / Shortcomings
Intertwining of Issues and Stakeholders:
Stakeholder: May be involved in multiple issues [Mahon, Heugens, and Lamertz, 2004];
Issues: Interaction of multiple issues may deviate from normal path [Bigelow, Fahey, and Mahon, 1991, 1993].
Type of Relation:
Stakeholders: The relationship between firm and a given stakeholder may vary by issues
Issues: Issues may be subsumed in other issues [Marres and Rogers, 2004] or may be at different life cycle
stages [Mahon and Waddock, 1992]
Attributes vs. Relationships: Most research is based on attributes of stakeholders or issues rather than the
relationships among them [Rowley, 1997]
Unit of analysis:
Appropriate unit of analysis is firm-issue-stakeholder triplet [Eesley and Lenox, 2006]
As shown in the above table, although there are many differences between Stakeholder
Theory and Strategic Issue Management, several constructive proposals (listed in order of

- 46 -
publication) have been put forward to integrate these two fields, especially using the
network approach from social sciences, in order to gain more synergy and make better
decisions:
Mahon, Heugens, and Lamertz [2004] employed the Social Network Analysis
(SNA) to make “a number of theoretically grounded conjectures about the
delicate relationships between stakeholder behavior and issue evolution” [Mahon,
Heugens, and Lamertz, 2004, p. 170];
Lucea [2007] developed the concept of “global issue space” as an integrative
framework that “helps make sense of the multiple relations established between a
focal firm and its stakeholders across issues and geographies” [Lucea, 2007, p.
16];
Roloff [2008] identified two types of stakeholder management in the practice of
modern corporations, that is, “organization-focused” and “issue-focused”, and
then demonstrated that “issue-focused stakeholder management dominates in
multi-stakeholder networks” [Roloff, 2008, p. 233];
Frooman [2010] introduced the idea of an “issue network”, and argued that
“members of an issue network can be identified as those with grievances,
resources, or opportunities” [Frooman, 2010, p. 161], by drawing on concepts
from the fields of social movements (sociology) and interest groups (political
science).
We find that the above proposals are still in the early stage of forging the ties between
stakeholders and issues—most of them only focus on justifying the need of integration,
developing theoretical hypotheses, and/or building descriptive models. More importantly,
except the proposal from Lucea [2007], other three neither provide an analytical and
instrumental framework, nor address the importance of a multi-relational approach. These
limitations show more directions for us to make contributions.
2.2.3 Large Engineering Projects as Engineering Systems

- 47 -
Parallel to the emergence of stakeholder theory in management domain as an effort to
understand dramatic change of the environment for modern corporations, engineers—the
professionals who design, build, maintain, and optimize large engineering projects—are
also revising their understanding for today’s engineering discipline.
After the World War II, with Vannevar Bush’s landmark report, Science: The Endless
Frontier [1945], engineering formally became a science-based discipline. Since then, the
“epoch of great inventions and artifacts” has quickly progressed to the “epoch of complex
systems” [de Weck, Roos, and Magee, 2011, p. 14, Figure 1.2]. However, “the systems of
this epoch grew to become not only technically complex but also socially complex” [de
Weck, Roos, and Magee, 2011, p. 28], and this great challenge finally gave birth to
“engineering systems”, the next stage of engineering discipline following the epoch of
complex systems.
The Massachusetts Institute of Technology (MIT) was the birthplace of engineering
systems—based on the efforts of several generations, from Norbert Wiener to Charles
Miller, to Daniel Roos, and to today’s scholars and students at the Engineering Systems
Division (ESD hereafter)—engineering systems is currently “taking shape as a global
phenomenon” [de Weck, Roos, and Magee, 2011, p. xv].
Arguably, the most striking feature differentiating engineering systems from traditional
engineering fields is the in-depth combination of theories and approaches from
engineering, management, and social sciences [ESD Symposium Committee, 2006, p. 2]
to answer questions with far-reaching importance and related to the sociotechnical
systems—large engineering projects obviously belong to such kind of systems, which are
“characterized by a high degree of technical complexity, social intricacy, and elaborate
processes, aimed at fulfilling important functions in society” [de Weck, Roos, and
Magee, 2011, p. 31].
Specifically, rooted in the management domain, stakeholder theory has already seen
many useful applications in the research conducted at ESD. A thorough investigation on

- 48 -
these applications can help identify research opportunities for managing the stakeholders
for large engineering projects as well as ensuring the “long-term success” [Freeman,
1984] of these projects.
2.2.4 Research Opportunities for Engineering Systems
Table 2-2 summarizes the stakeholder-related research conducted at ESD (including its
preceding programs, such as the Technology and Policy Program) in the past twenty
years. Although this list is by no means complete, its length does confirm “stakeholder”
as a focus of pioneering research in the field of engineering systems. More importantly,
we will demonstrate that the selected 24 theses and papers (listed in the publication order)
are sufficient to identify the patterns, limitations, as well as trends of the interdisciplinary
research between stakeholder theory and engineering systems.

- 49 -
Table 2-2: Stakeholder Research at MIT ESD (Listed in the Publication Order)
System Theories
Stakeholder Theory Social Sciences Engineering
SystemsCorporate Strategy Public Policy Qualitative Quantitative Aerospace &
Defense Automobile Energy & Environment
IT & Communication Service Transportation
Schenker, 1991 ✔✔ ✔✔ ✔✔ ✔✔
Kochan and Rubinstein, 1997 ✔✔ ✔✔ ✔✔ ✔✔
Pickett, 1997 ✔✔ ✔✔ ✔✔ ✔✔ ✔✔
Dare, 2003 ✔✔ ✔✔ ✔✔ ✔✔
Grossi, 2003 ✔✔ ✔✔ ✔✔ ✔✔ ✔✔ ✔✔ ✔✔
Adams, 2004 ✔✔ ✔✔ ✔✔ ✔✔
Mostashari and Sussman, 2004 ✔✔ ✔✔ ✔✔ ✔✔ ✔✔
Mostashari, 2005 ✔✔ ✔✔ ✔✔ ✔✔ ✔✔
Catanzaro, 2006 ✔✔ ✔✔ ✔✔ ✔✔ ✔✔
Lathrop, 2006 ✔✔ ✔✔ ✔✔ ✔✔ ✔✔
McKenna, 2006 ✔✔ ✔✔ ✔✔ ✔✔ ✔✔ ✔✔ ✔✔
Abe, 2007 ✔✔ ✔✔ ✔✔ ✔✔
Cameron, 2007 ✔✔ ✔✔ ✔✔ ✔✔ ✔✔ ✔✔ ✔✔
Parrot, 2007 ✔✔ ✔✔ ✔✔ ✔✔ ✔✔
Donohoo, MacKenzie, McAulay, et al., 2008 ✔✔ ✔✔ ✔✔ ✔✔
Hanowsky and Sussman, 2008 ✔✔ ✔✔ ✔✔ ✔✔
Arvind, 2009 ✔✔ ✔✔ ✔✔ ✔✔ ✔✔
Brooks, Carroll, and Beard, 2009 ✔✔ ✔✔ ✔✔ ✔✔
Hashimoto, 2009 ✔✔ ✔✔ ✔✔ ✔✔ ✔✔
Sutherland, 2009 ✔✔ ✔✔ ✔✔ ✔✔ ✔✔ ✔✔
Czaika, 2010 ✔✔ ✔✔ ✔✔ ✔✔
Matty, 2010 ✔✔ ✔✔ ✔✔ ✔✔ ✔✔ ✔✔
Alonso, 2012 ✔✔ ✔✔ ✔✔ ✔✔ ✔✔
Nam, 2012 ✔✔ ✔✔ ✔✔ ✔✔
Feng, 2013 (This Thesis Itself) ✔✔ ✔✔ ✔✔ ✔✔ ✔✔ ✔✔ ✔✔ ✔✔ ✔✔
Theoretical Bases Contributing Areas Methodological Foci Case Studies

- 50 -
We realize that the breadth and depth of each research in the above table make it difficult
to analyze the patterns emerging from them, and therefore tries to first capture their major
characteristics from the following four aspects:
Theoretical Bases:
o System Theories, an umbrella term referring to all the concepts, theories,
and approaches related to systems, such as (1) System Representation and
Modeling (see the research of Dare, 2003; Mostashari and Sussman, 2004;
Mostashari, 2005; Lathrop, 2006); (2) Decision Theory and Analysis (see
the research of Pickett, 1997; Adams, 2004; Catanzaro, 2006; Donohoo,
MacKenzie, McAulay, et al., 2008); (3) System Dynamics (see the
research of Mckenna, 2006; Hashimoto, 2009); (4) Object-Process
Network (see the research of Cameron, 2007; Sutherland, 2009); (5)
Design Structure Matrix (see the research of Grossi, 2003); (6) System
Thinking (see the research of Czaika, 2010).
o Stakeholder Theory, an umbrella term referring to stakeholder-related
concepts, theories, and approaches in the business and management fields,
such as (1) Stakeholder Model of the Firm (see the research of Schenker,
1991; Kochan and Rubinstein, 1997; Brooks, Carroll, and Beard, 2009;
Nam, 2012); (2) Stakeholder Salience (see the research of Grossi, 2003;
Abe, 2007; Hanowsky and Sussman, 2008; Matty, 2010); (3) Stakeholder
Alignment (see the research of Mckenna, 2006; Parrot, 2007); (4)
Stakeholder Value Network (SVN, see the research of Cameron, 2007;
Sutherland, 2009; Arvind, 2009; Alonso, 2012).
o Social Sciences, an umbrella term referring to all the concepts, theories,
and approaches in economics, sociology, political science, anthropology,
psychology, etc., such as (1) Social Network Analysis (SNA, see the
research of Grossi, 2003); (2) Grounded Theory (see the research of
Mckenna, 2006).
Contributing Areas:

- 51 -
o Systems Engineering, which means the main contribution of the
corresponding research has a core of “technology”, such as (1) System
Design and Architecting (see the research of Dare, 2003; Mostashari and
Sussman, 2004; Mostashari, 2005; Catanzaro, 2006; Cameron, 2007;
Czaika, 2010); (2) Systems Engineers’ Roles and Practices (see the
research of Brooks, Carroll, and Beard, 2009).
o Corporate Strategy, which means the main contribution of the
corresponding research has a core of “management”, such as (1) Nature of
the Firm (see the research of Schenker, 1991; Kochan and Rubinstein,
1997; Nam, 2012); (2) Stakeholder Mapping (see the research of Lathrop,
2006); (3) Stakeholder Salience and Manager’s Response (see the research
of Grossi, 2003; Matty, 2010); (4) Stakeholder Interaction and Alignment
(see the research of McKenna, 2006); (5) Business Ecosystem (see the
research of Arvind, 2009).
o Public Policy, which means the main contribution of the corresponding
research has a core of “policy”, such as (1) Stakeholder-Informed Policy
Design (see the research of Pickett, 1997; Adams, 2004; Mostashari and
Sussman, 2004; Mostashari, 2005; Cameron, 2007; Donohoo, MacKenzie,
McAulay, et al., 2008; Hanowsky and Sussman, 2008; Sutherland, 2009;
Alonso, 2012); (2) Stakeholder-Informed Policy Implementation (see the
research of Lathrop, 2006; Abe, 2007; Matty, 2010); (3) Stakeholder-
Informed Policy Optimization (see the research of Parrot, 2007;
Hashimoto, 2009).
Methodological Foci: The methods of each research are also classified into two
categories, Qualitative and Quantitative, which are self-explanatory.
Case Studies: The case studies in the above research cross six industries, that is,
Aerospace and Defense, Automobile, Energy and Environment, IT and
Communication, Service, as well as Transportation.
Based on Table 2-2 and the above more detailed analysis, a few interesting observations
can be made for the stakeholder-related research at ESD in the past twenty years:

- 52 -
Observation A: All the 24 theses and papers applied qualitative methods, but
only 11 of them applied quantitative methods at the same time.
Observation B: All the 24 theses and papers included one or more case studies,
which were concentrated in two industries, that is, Aerospace and Defense, as
well as Energy and Environment.
Observation C: The two earliest research (viz., Schenker, 1991; Kochan and
Rubinstein, 1997) built their theoretical foundation in management field and also
contributed to the same field; Later on, especially between 2003 and 2006, the
concept of stakeholder began to interest engineering systems scholars, and the
research during this period featured applying systems theories and approaches to
design both physical systems and public policies; Since 2006, engineering
systems scholars had paid significantly more attention on the stakeholder theory
in management field, and meanwhile, their contributions also came back to the
traditional field of strategic management.
Observation D: Compared to system theories and management literature, the
theories and approaches in social sciences, such as economics, sociology,
anthropology, psychology, etc., have seen very few applications (viz., Social
Network Analysis or SNA in Grossi, 2003; Grounded Theory in McKenna, 2006)
in the existing stakeholder-related research at ESD.
According to a comprehensive review [Laplume, Sonpar and Litz, 2008] for 179 articles
published in top management journals, stakeholder theory was initiated by Freeman in
1984, and then experienced a fast growth between 1995 and 2000, during which many
nowadays most-cited stakeholder articles were published, such as Mitchell, Agle, and
Wood [1997] and Rowley [1997]. Putting this result and the above Observation C
together, we found that there was roughly a decade’s delay between the stakeholder-
related research at ESD and the frontier of stakeholder theory in the management domain.
Arguably, Value Creation and Delivery [Freeman, Harrison, Wicks, et al., 2010;
Harrison, Bosse, and Phillips, 2010; Wicks and Harrison, 2013] are currently one of the
hottest topics in stakeholder theory, and our contribution to this topic helps shorten the

- 53 -
delay of applying the most recent development of stakeholder theory to the field of
engineering systems.
More importantly, Observation D suggests that there is a pressing need to forge a
stronger connection between engineering systems and social sciences, such as
sociology—the scientific study of “human society and its origins, development,
organizations, and institutions” [American Heritage Science Dictionary, 2012;
Wikipedia, 2013]—in order to better “meet human needs in a complex technological
world” [de Weck, Roos, and Magee, 2011]. This motivation leads to the literature review
in the next section.
2.3 Approach: Network Analysis in Social Sciences
2.3.1 Relationship Types: Social vs. Economic
In social sciences, social and economic relationships are arguably two basic types of
interactions between individuals or organizations. Although they are different in many
ways and often studied separately by sociologists and economists, two ambitious efforts
among others have been made in recent years to unify both social and economic
relationships into a common framework for analysis: (1) one is the New Economic
Sociology (NES), or more specifically, the Social Network Analysis (SNA), which
begins with social relationships and uses the concept of “social embeddedness” to study
various economic phenomena (see the work of Harrison C. White, Mark S. Granovetter,
Ronald S. Burt, Paul J. DiMaggio, and Joel M. Podolny among others); (2) the other is
the Social Exchange Theory (SET), which begins with economic relationships and uses
the models of economic exchange to study various social situations (see the work of
George C. Homans, Peter M. Blau, Richard M. Emerson, Karen S. Cook, and Peter P.
Ekeh among others). These two efforts can be viewed as dual theories, echoing the
distinction of “Structure vs. Process” by Van de Ven [1976], or “Structural vs.
Relational” by Granovetter [1992], or “Structuralist vs. Connectionist” by Borgatti and

- 54 -
Foster [2003, 2009]—specifically, Social Network Analysis (SNA) corresponds to
“Structure”, “Structural”, or “Structuralist”, while Social Exchange Theory (SET)
corresponds to “Process”, “Relational”, or “Connectionist”—for the relationships
between either individual humans or organizations [Cook and Whitmeyer, 1992].
We choose the framework from the Social Exchange Theory (SET) [Cropanzano and
Mitchell, 2005; Zafirovski, 2005] in order to gain a deep appreciation for the contents of
the stakeholder relationships and avoid the separation for different types of
relationships—within the framework of the Social Network Analysis (SNA), in general
there are three typical approaches to study multiple types of organizational relationships
[Robins and Pattison, 2006]: (1) Repeating the analysis for single-relation network
multiple times and then comparing the results; (2) Using multivariate linear analysis by
precluding the possible association among the networks; (3) Focusing on the number of
different types of networks (viz., Multiplexity [Kapferer, 1969; Lazega and Pattison,
1999]) by stripping away the content of different networks—neither one is able to jointly
analyze the interactions of multiple types of organizational relationships at the same time.
In fact, some sociologists [Wasserman and Faust, 1994; Hanneman and Riddle, 2005;
Robins and Pattison, 2006] have already pointed out, the research on joint analysis for
multi relational networks (viz., Multiple Networks) is rather rare and will be one of the
most promising future directions for the Social Network Analysis (SNA)2.
Under the chosen framework of the Social Exchange Theory (SET) [Cropanzano and
Mitchell, 2005; Zafirovski, 2005], social relationships are the extension of economic
2 Professor Edward Laumann introduced us his work on the “multi-strained network ties”, covering in-depth theories, useful methods, and thorough case studies which probably can be applied in the future research of Stakeholder Value Network (SVN): (1) Networks of Collective Action: A Perspective on Community Influence Systems [Laumann and Pappi, 1976] models three network ties (informal social, business/professional, and community affairs discussion ties) among a community elite in Germany; (2) The Organizational State: Social Choice in National Policy Domains [Laumann and Knoke, 1987] collects ties among hundreds of organizations active in the formation of health and energy policy in the US using multiple tie information; (3) The Hollow Core: Private Interests in National Policy Making [Heinz, Laumann, Nelson, and Salisbury, 1993] models conflict and alliance structures in four national policy domains – energy, health, labor, and agriculture.

- 55 -
relationships [Coleman, 1990; Emerson, 1976; Homans, 1961], and therefore “concepts
and principles borrowed from microeconomics” [Cook, 2000, p. 687] can be applied to
conduct “the economic analysis of noneconomic social situations” [Emerson, 1976, p.
336]. For example, those economic concepts and principles often include diminishing
marginal utility [Blau, 1994, pp. 158-159], utility maximization [Coleman, 1994, p. 159],
equilibrium and optimum [Coleman, 1990, p. 39], supply and demand, market price,
imperfect competition, costs, profits, and so on3 [Coleman, 1990, pp. 719-769; Homans,
1990, pp. 77-81]. With these concepts and principles, all the human interactions,
including those at the organizational level, can be reduced to a purely rational process
that arises from economic theory4, indicating that Social Exchange Theory (SET) is
“primarily a more specific variation of the rational choice model—notably, closely tied to
public choice as the economic analysis of politics—rather than an autonomous theoretical
paradigm” [Zafirovski, 2005, p. 5].
3 Limited by the times, Social Exchange Theory (SET) borrows the rational choice model from neoclassical economics as its economic foundation and still adheres to the “holy trinity” of “rationality, selfishness, and equilibrium” [Colander, Holt, and Rosser, 2004, p. 485]. Therefore, these features should also be interpreted as assumptions or limitations of the Stakeholder Value Network (SVN) approach. However, although having these limitations, the main purpose of this dissertation is not to calculate the accurate amount of value exchanged through stakeholder relationships, but to understand and demonstrate the impacts of indirect stakeholder relationships. Moreover, once the basic framework of the SVN approach is built up, it will always be possible to revisit these limitations and make the model better, as briefly discussed in the next footnote. 4 The latest developments in economic theory bring tremendous opportunities to improve the rational choice model, which has been taken as the economic foundation of Social Exchange Theory (SET) and therefore Stakeholder Value Network (SVN): (1) First, Behavioral Economics studies the effects of cognitive and emotional elements in human’s economic decisions as well as the consequences for market exchange and resource allocation. A few key concepts in this new branch of economics, such as bounded rationality [Simon, 1972, 1997], information impactedness [Williamson, 1975], intertemporal choice [Loewenstein and Prelec, 1992; Berns, Laibson, and Loewenstein, 2007], prospect theory [Kahneman and Tversky, 1979; Tversky and Kahneman, 1992], and evolutionary game theory [Weibull, 1997] among others, can be introduced to the future SET and SVN research; (2) Second, Complexity Economics studies the economic dynamics with computer simulation and challenges the traditional equilibrium assumption for economic systems. A few important ideas [Arthur, Durlauf, and Lane, 1997] in this new branch of economics, such as dispersed interaction, no global controller, cross-cutting hierarchical organization, ongoing adaptation, novelty niches, and out-of-equilibrium dynamics among others, can also be introduced to the future SET and SVN research.

- 56 -
Astute readers may be interested in the question whether it is appropriate to extend the
economic and sociological theories developed on the individual level, including the
Social Exchange Theory (SET) [Cropanzano and Mitchell, 2005; Zafirovski, 2005], to
the organizational level. We do assume that the same network model of actors can be
used for both individual humans and organizations, but meanwhile, we would also like to
assert that “this assumption is widespread among network analysts whose actors are
organizations (e.g. Laumann et al 1985, Mizruchi 1989, 1990ab), and widespread among
exchange theorists (e.g. Emerson 1972b, Markovsky et al 1988) and indeed some other
theorists in sociology (e.g. Berger et al 1989)” [Cook and Whitmeyer, 1992, p. 117].
At this stage, it is important to recall one of the three basic problems studied by
stakeholder scholars in the management domain (see Section 2.2.1), that is, the “Problem
of Value Creation and Trade” [Freeman, Harrison, Wicks, et al., 2010, pp. 4-5 and p. 29].
In order to be better equipped to tackle with this specific problem, one must resort to
economic concepts and principles, which also justify our motivation to choose the Social
Exchange Theory (SET) [Cropanzano and Mitchell, 2005; Zafirovski, 2005] as the
theoretical cornerstone for the Stakeholder Value Network (SVN). In fact, the concepts
and principles from economics, such as utility, reciprocity, competition, and so on, have
been recently discussed a lot by stakeholder scholars [Harrison, Bosse, and Phillips,
2010; Wicks and Harrison, 2013].
2.3.2 Exchange Patterns: Restricted vs. Generalized
Once unifying both social and economic relationships into value exchanges under the
framework of the Social Exchange Theory (SET), sociologists (with the early
contribution of anthropologists) [Emerson, 1976; Homans, 1958; Levi-Strauss, 1949;
Malinowski, 1922] discover two generic patterns for the exchange of values, which can
be either monetary or nonmonetary, in human’s economic and social life: (1) “Restricted
Exchange”, the dyadic reciprocal relationships between two parties in the exchange
situation that may be represented diagrammatically as “A⇔B”; and (2) “Generalized
Exchange”, the univocal reciprocal relationships among at least three parties in the

- 57 -
exchange situation that may be represented diagrammatically as “A⇨B⇨C⇨A”.
Different from Restricted Exchange, Generalized Exchange neither requires immediate
reciprocation nor creates a direct obligation to a specific benefactor, and therefore heavily
relies on the social contracts mediated by the nonmarket environment, instead of the
economic contracts mediated by the market environment.
However, the logic linking the types of stakeholder relationships (viz., economic and
social relationships) with the patterns for stakeholders to exchange values (viz.,
Restricted and Generalized Exchanges) has not been fully understood. As such, we argue
that economic relationships mainly exist in the form of Restricted Exchange, while social
relationships mainly exist in the form of Generalized Exchange, for two major reasons:
First, on the individual and micro- levels, economic relationships often feature
specified economic contracts bonded by laws as well as legal obligations and
mainly aim for the extrinsic reward (viz., materials gains), and therefore are
usually “one-shot transactions”5 [Cook, 2000, p. 687] mediated in the market
environment. By contrast, social relationships often feature unspecified social
contracts bonded by trust as well as social norms and mainly aim for both the
intrinsic and extrinsic rewards, and therefore are usually “enduring long-term
relations” [Cook, 2000, p. 687] mediated in the nonmarket environment.
Recalling the difference between Restricted and Generalized Exchanges, it is not
difficult to find the connection between economic relationships and Restricted
Exchange through the market environment, as well as the connection between
social relationships and Generalized Exchange through the nonmarket
environment.
Second, on the meso- and macro- levels, social relationships can also be
conceived as the interchanges between various social systems. Under such an
interchange, Generalized Exchange will be the dominant pattern through 5 As pointed out by Professor Donald Lessard, for large engineering projects, it is quite normal for two parties to have a long run relational contract based on (the shadow of) future dyadic relationship that is not supported by a generalized exchange—therefore the statement of equating restricted exchanges as one-shot transactions may not be accurate.

- 58 -
connecting different types of social relationships into one path or cycle. As
argued by Zafirovski [2005, p. 24], “each social system, e.g. economic, political,
communal, and cultural, can be as Pareto, Parsons and other suggest, assumed to
exchange ‘inputs’ and ‘outputs’ with the other systems. Notably, these exchanges
between social systems represent multilateral or collective rather than bilateral or
individual exchanges.”
Further, after establishing the link between relationship types and exchange patterns, we
argue that Generalized Exchange is the primary pattern of value exchanges when social
relationships prevail6. Note that this argument attempts to improve the early behaviorist-
rational choice version of the Social Exchange Theory (SET, mainly by Homans and
Blau among others), which treats the Restricted Exchange as primary because of the
“psychological reinforcement”, and the significance of Generalized Exchange can be
interpreted from the following two aspects:
From a normative perspective, one basic assumption for the Social Exchange
Theory (SET) is to transform homo economicus (viz., economic man) “from a
rational egoist (Hechter and Kanazawa, 1997) or an asocial subject (‘rational
fool’ as termed by Sen, 1977) to a new actor holding not only utilitarian or
hedonistic but also altruistic or social values”7 [Zafirovski, 2005, p. 3]. This
assumption is consistent with the focus of the (normative) Stakeholder Theory on
“the identification of moral or philosophical guidelines for the operation and
management of corporations” [Donaldson and Preston, 1995, p. 71]. For these
social relationships bonded by trust and social norms as well as mediated in the
nonmarket environment, as discussed previously, mainly exist in the form of
Generalized Exchange.
6 Professor Donald Lessard suggested, the more important distinction between restricted and generalized exchanges relies on whether the exchanges involve one type of value, e.g. money, or various (objects of value) that are not commensurate in general terms. 7 Some criticism of Social Exchange Theory (SET) argues it may be self-contradictory to include both utilitarian/hedonistic and altruistic/social values, while still selecting the rational choice model from neoclassical economics as the mathematical foundation of SET.
- 59 -
From an instrumental perspective, other scholars emphasize the existence of
Generalized Exchange in organizations’ strategic behavior, such as Olson’s
theory [1965] on the logic for collective action, as well as Shah and Levine’s
examples [2003] for the Generalized Exchange among large and often
heterogeneous organizations. Baron’s Nonmarket Strategy Map [1995, p. 59,
Figure 4] can also be a source of unconscious support for the existence of
Generalized Exchange in the strategic behavior of modern organizations. In
addition, as observed in the decisions of modern firms, Generalized Exchange is
a widely practiced strategy, especially when it is difficult for a focal organization
to engage its stakeholders directly.
2.3.3 Strategic Implications: Importance, Power, and Centrality
Based on the above literature and discussion on the relationship types and exchange
patterns, we now turn to a more fundamental question, that is, how should the
implications of these networks be interpreted from the perspective of strategic
management? As argued by Smith, Mitchell, and Summer [1985] and Cameron, Crawley,
Feng, and Lin [2011, p. 37], “Managing, at a simple level, is a process of setting
priorities, particularly among uncertain outcomes, and then observing how outcomes
proceed according to those priorities”8. More specifically, for the value creation and trade
among stakeholders, Freeman, Harrison, Wicks, et al. [2010, p. 24] also proposed to
differentiate the “primary stakeholders” from the “secondary stakeholders”—although
such a proposal is more centered on an instrumental perspective than a normative one, it
is not practical for firms and managers to evenly allocate their limited resources in reality
to every stakeholder. Therefore when interpreting the strategic implications of
stakeholder networks, we put the first priority on understanding the “Importance” of
different stakeholders. Note that the word of “Importance” here can be taken as a
layman’s expression for the “Salience” defined by Mitchell, Agle, and Wood [1997].
8 As pointed out by Professor Donald Lessard, this is an engineering perspective for management. In fact, managing also involves conversation, persuasion, and intervention to cause individuals and organizations to move in the direction of priorities.

- 60 -
It would be beneficial to track down the economic and sociological roots for the word
“Importance”—we find that “Power” (see the work of Karl Marx, Max Weber, Georg
Simmel, Pierre Bourdieu, Jürgen Habermas, and Michel Foucault among others) and
“Centrality” (see the work of Harrison C. White, Mark S. Granovetter, Ronald S. Burt,
Paul J. DiMaggio, and Joel M. Podolny among others) are two closest concepts in the
vocabulary of economists and sociologists.
In traditional economics, “Power” is a secondary and derivative phenomenon determined
by market exchange, and more specifically, rational choice theory points out that “power
concept is a generalization of the wealth concept in economic theory” [Fararo, 2001, p.
266]. As “the economic analysis of noneconomic social situations” [Emerson, 1976, p.
336], Social Exchange Theory (SET), which provides the theoretical foundation for this
dissertation, also treats exchange as a more fundamental phenomenon than power [Cook,
1990, pp. 115-116], by assuming that power emerges and evolves in a complex structure
of exchanges of resources—“since these exchanges are governed by the objective
structure of alternatives, the latter determines power (and dependence) and gives it the
character of a structural variable residing within exchange networks” [Zafirovski, 2005,
p. 7]. These arguments further validate the opportunity to improve the current theory on
Stakeholder Salience [Agle, Mitchell, and Sonnenfeld, 1999; Mitchell, Agle, and Wood,
1997], which directly associates power with stakeholders without examining the multiple
and networked relationships between stakeholders (see Section 2.2.2.1).
By contrast, in the structural style network analysis (viz., Social Network Analysis or
SNA), “Centrality” generally means the “network position-conferred advantage” [Cook
and Whitmeyer, 1992, p. 120]. For example, Table 2-3 lists three common types of
centrality in the Social Network Analysis (SNA) [Wasserman and Faust, 1994] and their
implications for the stakeholder network.

- 61 -
Table 2-3: Three Types of Centrality in the Social Network Analysis (SNA)
In some variants of the Social Exchange Theory (SET), “Power” exhibits a direct
correlation to “Centrality” [Bonacich, 1987], with exceptions where central positions do
not necessarily imply superior power [Cook, Emerson, Gillmore, and Yamagishi, 1983].
Meanwhile, since the work of Emerson [1972, 1976], Social Exchange Theory (SET) has
increasingly considered network structure explicitly, which leads to the development of
“Exchange Networks” or “Network Exchange Theory” [Cook and Emerson, 1978;
Walker, Thye, Simpson, et al. 2000; Yamagishi, Gillmore, and Cook, 1988; Yamagishi
and Cook, 1990]. However, two basic differences still exist when applying these two
approaches to measure the “Power” or “Centrality” of network actors: (1) different
treatment of the ties between network actors—Social Exchange Theory (SET) stresses
the exchange aspects of all ties, while Social Network Analysis (SNA) tends to be more
catholic about the nature of the ties [Cook and Whitmeyer, 1992]; (2) different focus on
the basic units of network structure—Social Exchange Theory (SET) mainly studies the
dyadic ties (viz., restricted exchanges), because of the “psychological reinforcement”
discussed before, while Social Network Analysis (SNA) includes much more patterns of
network structure, although the network itself usually consists of only one type of
relationship [Cook, Cheshire, and Gerbasi, 2006].
Definition Equation Implication
Degree
Centrality
The number of ties the
reference stakeholder has
with other stakeholders
Stakeholder Importance
measured by the access to
alternative resources
Closeness Centrality
The sum of the lengths of
the shortest geodesic paths
from the reference
stakeholder to all other
stakeholders
Stakeholder Importance
measured by the
communication efficiency to
other stakeholders
Betweenness
Centrality
The frequency with which
the reference stakeholder
falls on the geodesic paths
between pairs of other
stakeholders
Stakeholder Importance
measured by the control
over other stakeholders
C
Dn
i( ) = d n
i( ) = x
ijj
∑ = xji
i
∑
C
Cn
i( ) = d ni,n
j( )j =1
g
∑⎡⎣⎢
⎤⎦⎥
−1
C
Bn
i( ) = gjk
ni( )
gjkj <k
∑

- 62 -
2.3.4 Research Opportunities for Network Analysis
Figure 2-8 visualizes the research gap identified from the above literature review: the
horizontal axis is divided into two areas by relationship type (see Section 2.3.1), while
the vertical axis is divided into two areas by exchange pattern (see Section 2.3.2). Note
that for the relationship types, “Single” means only one type of relationship is allowed at
each time of network analysis, and “Multiple” means multiple types of relationships (viz.,
both social and economic) can be studied at the same time. In addition, for the exchange
patterns, “Restricted” and “Generalized” focus on the corresponding network structure
(viz., dyads for “Restricted” and cycles for “Generalized”), rather than the exchange
contents of that structure.
Figure 2-8: Research Gap for the Network Analysis in Social Sciences
Putting these two axes together, four research subareas emerge for the network analysis
in social sciences (see Figure 2-8): (1) Social Network Analysis (SNA) covers two
subareas by studying single-relation networks without restriction on network structure;
(2) Social Exchange Theory (SET) only covers one subarea by studying multi-relation
networks with restriction on network structure; (3) Stakeholder Value Network (SVN)
developed in this dissertation aims to cover two subareas for multi-relation networks
consisting of both restricted and generalized exchanges; (4) The shadowed subarea,
“Multiple” and “Generalized”, indicates the gap for current network research in social
Single Multiple
Restricted
Generalized
SNA
SNA SVN
Relationship Type
Exchange Pattern
SVN
SET

- 63 -
sciences, or the potential new contribution of the Stakeholder Value Network (SVN), in
terms of understanding the impacts of indirect and multi-type stakeholder relationships
on the long-term success of large engineering projects.
Once the research directions for the Stakeholder Value Network (SVN) are identified,
two closely-related challenges will immediately follow: (1) How to define network
measurements and construct network statistics, which are similar to the “Power” in Social
Exchange Theory (SET) or the “Centrality” in Social Network Analysis (SNA), to
interpret the “Importance” of stakeholders in the Stakeholder Value Network (SVN)? (2)
How to build a computationally efficient and cost-effective modeling platform for the
analysis of Stakeholder Value Network (SVN)? These two pressing challenges bring
more promising opportunities for this dissertation.
2.4 Integrating Domains with Approach: Stakeholder Value Network
2.4.1 Stakeholder Value Network: Definition and Assumptions
As discussed in Section 2.2.2, Rowley [1997] proposed to apply the network analysis to
understand stakeholder influence. Meanwhile, Mahon, Heugens, and Lamertz [2004] as
well as Lucea [2007] also proposed to integrate stakeholders with strategic issues through
the network approach. However, limited by the then available choices of network analytic
methodologies in the social sciences, all of these proposals only considered Social
Network Analysis (SNA), which views stakeholder relationships as empty social ties
(without issue content) and studies the impacts of network structures on stakeholders’
behavior. As discussed previously, the strength of Social Network Analysis (SNA) lies in
providing a way to measure the structural properties of the whole network (viz., density,
etc.) and the structural positions of individual stakeholders (viz., degree-, closeness-, and
betweenness- centralities, etc.), with a rigorous basis in graph theory. However, the
weakness of this approach lies in the separation for different types of stakeholder

- 64 -
relationships—only the same type of relationships will be put into one network and all
these structural measurements are defined for such kind of single-relation networks.
In order to overcome this weakness of such a purely structural view, this dissertation and
its forerunners [Cameron, 2007; Sutherland, 2009] have developed over years a new
network approach, viz., the Stakeholder Value Network (SVN), which views multiple
types of stakeholder relationships (both social and economic) as value exchanges (both
restricted and generalized) and then studies the strategic implications of the exchanged
value flowing through the stakeholder network, so that the influence from value exchange
and network structure can be both captured at the same time and in one unified
framework.
Before the construction of methodological framework, we first formally define the
Stakeholder Value Network (SVN) as “a multi-relational network consisting of a
focal organization, the focal organization’s stakeholders, and the tangible and
intangible value exchanges between the focal organization and its stakeholders, as
well as between the stakeholders themselves”: (1) the focal organization can be a
company, a project within a company, a joint venture between companies, a government
agency, a non-government organization (NGO), or any other type of organization; (2) a
stakeholder for the focal organization is “any group or individual who can affect or is
affected by the achievement of the organization’s objectives” [Freeman, 1984, p. 46],
although this definition is too broad to be used directly in practice—more guidance for
stakeholder identification will be discussed in Chapter 3; (3) value exchanges are the
processes by which the specific needs of the focal organization and/or stakeholders are
satisfied at a desirable cost [Cook, 1990; Crawley, 2009]. In this dissertation, the focal
organization generally refers to a large engineering project conducted by companies or
governments; stakeholders are usually organizations instead of individuals or social
groups; and tangible value is often associated with the economic or monetary exchanges
for goods/service and financial resources, while intangible value is often associated with
the social or nonmonetary exchanges for political resources (political support, regulatory
approval, etc.) and information (technical know-how, process knowledge, etc.).
- 65 -
On the basis of literature review, we firmly ground our theoretical foundation in Social
Exchange Theory (SET) [Emerson, 1976; Homans, 1958; Lévi-Strauss, 1949;
Malinowski, 1922], and correspondingly, three key assumptions are made as below for
the Stakeholder Value Network (SVN) analysis:
Relationship Types: Social exchanges are the extension of economic exchanges
[Coleman, 1990; Emerson, 1976; Homans, 1961], and therefore monetary and
nonmonetary relationships between stakeholders can be analyzed in a common
framework, with the use of subjective utility judgments as well as comparison of
alternatives;
Exchange Patterns: Multilateral and indirect value exchanges exist widely in
the strategic behavior of modern organizations [Olson, 1965; Shah and Levine,
2003; Westphal and Zajac, 1997], and therefore generalized exchanges can be
taken as the basis to understand the impacts of indirect relationships between
stakeholders;
Strategic Implications: Stakeholder power is the outcome of both exchange
relations and network positions [Blau, 1964; Emerson, 1972; Molm, 1990], and
therefore network statistics can be constructed from the sample space of
generalized exchanges to measure the importance of stakeholders as well as other
metrics of interest.
Note that “generalized exchanges” in the above assumptions also include “restricted
exchanges” (see Figure 2-8), which for simplicity are treated as a special case of
generalized exchanges (viz., between two, not three or more, stakeholders) by this
dissertation. In addition, to help understand the logical consistency between theoretical
foundation and methodological framework in this dissertation, these three assumptions
can be linked back to three sections of literature review (2.3.1, 2.3.2, and 2.3.3,
respectively), and meanwhile, they can also be mapped forward to three key steps in the
methodological framework of the Stakeholder Value Network (SVN) analysis (see
Chapter 3).

- 66 -
2.4.2 Basic Units of Network Analysis: Salience, Relationships, and Issues
After reviewing the relevant literature across engineering, management, and social
science as well as establishing the theoretical foundation with key assumptions for the
Stakeholder Value Network (SVN) analysis, this last section discusses the basic units of
network analysis to gain a deeper appreciation for the correlations between Stakeholder
Theory, Strategic Issue Management, and the Stakeholder Value Network (SVN) analysis
(see Figure 2-1).
As the gurus for the network analysis in social sciences during the past century,
Laumann, Marsden, and Prensky [1983] once pointed out that “nodal attributes”,
“relations”, and “participation in specified events or activities” are three foci to define the
boundary of a network, and then they further developed a typology of eight strategies for
boundary specification (see Table 2-4). Note that they also distinguished between
“nominalist” and “realist” views of social phenomena—the former means “an analyst
self-consciously imposes a conceptual framework constructed to serve his own analytic
purposes” [Laumann, Marsden, and Prensky, 1983, p. 21], while the latter means “the
network is treated as a social fact only in that it is consciously experienced as such by the
actors composing it” [Laumann, Marsden, and Prensky, 1983, pp. 20-21]—obviously the
Stakeholder Value Network (SVN) analysis is closer to the “nominalist” view than the
“realist” one.
From Table 2-4, we further infer that “node attributes”, “relations”, and “participation in
events or activities” are three types of basic units in network analysis and close to the
definitions of stakeholder salience, stakeholder relationships, and strategic issues,
respectively. In addition, as argued by Laumann, Marsden, and Prensky [1983], “node
attributes”, “relations”, and “participation in events or activities” can actually
complement each other and help specify the appropriate network boundaries (see
Strategy VIII in Table 2-4). Based on this insight, although by definition stakeholder
relationships constitute the units of analysis for the Stakeholder Value Network (SVN),

- 67 -
we will also explore the synergy between stakeholder salience, stakeholder relationships,
and strategic issues, in terms of both boundary specification as well as the interpretation
for strategic implications.
Table 2-4: A Typology of Boundary Specification Strategies for Delimiting Actors within a Network
[Adapted from Laumann, Marsden, and Prensky, 1983, p. 25]
Metatheoretical Perspective
Definitional Focus for Delimitation
Attributes of Nodes Relation Participation in
Event or Activity Multiple Foci
Realist
I Corporate group [Weber, 1947] Bank wiring room [Roethlisberger and Dickson, 1939] Monastery [Sampson, 1969] High school [Coleman, 1961; Fararo and Sunshine, 1964] Norwegian Island Parish [Barnes, 1954] Cell room of Electrozinc Plant [Kapferer, 1969] School classroom [Davis, 1970]
III
Primary group, clique [Cooley, 1909]
V
Participants in a community controversy [Dahl, 1961]
Participants in common social events [Homans, 1950]
Street corner society [Whyte, 1955]
VII
Klasse fur sich [Marx]
Ethnic community [Barth, 1975; Laumann, 1973; Yancey et al., 1976]
Nominalist
II Klasse an sich [Marx] Doctors in small cities [Coleman et al., 1966] Formal organizations in small city [Galaskiewicz, 1979] American business elite [Useem, 1979] Community influential [Laumann and Pappi, 1973, 1976]
IV
Small world problem [Travers and Milgram, 1969; Erickson, 1978]
VI
Invisible college [Crane, 1972; Burt, 1978; Breiger, 1976]
VIII
Supporters of psycho-therapy [Kadushin, 1966]
National elite circles [Moore, 1979]
2.5 Chapter Summary
At the end of this chapter, it is worthwhile to recapitulate all the research opportunities
identified from the literature review, as well as to map them to specific chapters and

- 68 -
sections in this dissertation (see Table 2-5). In this way, scholars and practitioners with
different disciplinary background of engineering, management and social sciences can
more easily grasp the whole structure of this dissertation and even choose to first read the
chapters and sections interesting them the most.
Table 2-5: Mapping Research Opportunities to Dissertation Chapters and Sections
Discipline and Field Research Opportunity Dissertation Chapter / Section
Strategic Management and Stakeholder Theory
Stakeholder Salience Section 3.2; Chapter 4; Section 5.3; Chapter 6
Stakeholder Network Model Section 3.2; Section 5.3
Stakeholders and Strategic Issues Section 3.3; Section 4.4
Engineering Systems and Large Engineering Projects
Multiple Relations as Value Exchanges Section 3.2; Section 7.3
Generalized Exchanges and Impacts of Indirect Stakeholder Relationships Section 3.4; Section 4.3
Stakeholder-Oriented System Architecting Appendix I
Social Sciences and Network Analysis
Common Framework Unifying Both Social and Economic Relationships Section 3.2; Section 5.3
Connection between Relationship Types and Exchange Patterns Section 4.3
Salience/Importance/Power/Centrality in Exchange Networks with Weak Ties
Section 3.2; Section 5.3
Modeling Platform and Analytical Tool Section 5.2
As shown in Figure 1-1, the next chapter accounts for the first stage of the
methodological development for the Stakeholder Value Network (SVN) analysis, with a
focus on interpreting the network implications from the perspective of a focal
organization, which is often a large engineering project in the context of this dissertation.

- 69 -
CHAPTER 3. METHODOLOGY DEVELOPMENT I: SVN FOR A FOCAL ORGANIZATION
“… little is known in the way of formulating strategies for
utilizing such networks in a positive and proactive fashion.
Little is known, prescriptively, about what range of
alternatives is open to managers who want to utilize such
an indirect approach to dealing with stakeholders.”
— Freeman [1984, p. 58]
3.1 Chapter Introduction
This chapter lays out the methodological foundation for analyzing the SVN from the
viewpoint of a focal organization. According to the definition of SVN in Chapter 2, SVN
analysis is a method viewing multiple stakeholder relationships as value exchanges and
studying the strategic implications of different types of value flowing throughout the
stakeholder network. By virtue of SVN analysis, the focal organization should be able to
understand the impacts of both direct and indirect relationships between stakeholders on
the long-term success of achieving its objectives, as well as apply such an understanding
to formulate stakeholder management strategies in a positive way and with reduced
complexity. Moreover, this method builds a common platform for different departments
within the focal organization to communicate the important information about
stakeholders.
There are three specific goals that the SVN analysis must accomplish:

- 70 -
Data Collection: To develop a comprehensive understanding of the stakeholders
of a focal organization, By articulating the roles, objectives, and needs of each
stakeholder, Using information collected from documents and interviews;
Qualitative Model: To capture both direct and indirect relationships among all
the stakeholders, By mapping their specific needs as “value flows” within a
network, Using information garnered from the articulation of stakeholder needs;
Quantitative Model: To identify the critical “value paths”, the high-leverage
outputs, as well as the most important stakeholders and value flows for the focal
organization, By conducting a rigorous network analysis, Using the network
measurements defined in and the network statistics calculated from this analysis.
In particular, a value flow is defined as the output of one stakeholder, and at the same
time, the input of another; and a value path is defined as a string of value flows
connecting a group of stakeholders. Following the above goals, the essence of the SVN
analysis can be summarized in a Four-Step Modeling Framework, which is first
discussed in this chapter, with the illustration of a running example for a multinational
energy project. And then, two important extensions are made for this framework: First, an
Integration of Stakeholders and Issues is proposed to reveal additional insights into the
balance of stakeholder relationships and reduce the dimensionality of the network model;
Second, a Utility Model for Generalized Exchanges is established to improve the
calculation for the scores of value paths in the stakeholder network. In the next chapter,
the whole framework and its two extensions are applied to the SVN analysis for a real
case of large engineering project: “Project Phoenix”.
3.2 Basics: Four-Step Modeling Framework
Initiated by Cameron [2007] and developed by Sutherland [2009] as well as this
dissertation, the methodological framework of the SVN analysis has grown mature
gradually and mainly consists of the following four steps:

- 71 -
Mapping: At the beginning, the focal organization should be defined and its
stakeholders should be identified. Meanwhile, their roles, objectives, and specific
needs will also be extracted from documents and interviews. Based on this
information, a qualitative model of the SVN can be built, in the format of
stakeholder maps, through mapping the specific needs of each stakeholder as
value flows.
Quantifying: Once the stakeholder maps are obtained, the next step is to score
value flows with the perceived utility of the recipient stakeholder and define the
propagation rule of value flows in the stakeholder network to calculate the score
of a value path.
Searching: Based on the quantified value flows and the value propagation rule, a
quantitative model of the SVN can be built, to search for all the value paths
beginning from and ending with the focal organization as the sample space for a
rigorous network analysis.
Analyzing: Once the quantitative model finds all the value paths for the focal
organization, the last step is to define network measurements and construct
network statistics in order to study the strategic implications of the SVN for that
focal organization.
For a better understanding, this framework can be visualized in Figure 3-1, using the
Object-Process Diagram (OPD) [Dori, 2002], where the rectangle represents an object
(i.e., a noun), the oval represents a process (i.e., a verb), and the line ending with a
hollow cycle represents an “instrument” link (i.e., process requires object). In this figure,
the inputs and outputs as well as the corresponding techniques of each step in the SVN
analysis are clearly shown. Note that these four steps can be implemented in an iterative
manner (see the dotted oval and arrows, representing a possible “fifth” step), when more
information for the SVN becomes available, or the situation of previous analysis changes.

- 72 -
Figure 3-1: Four-Step Modeling Framework for the SVN Analysis
This four-step modeling framework is quite general and hence theoretically, is suitable
for the use in any circumstance involving complex interactions between multiple
stakeholders. In this section, we illustrate the SVN framework with an application to a
multinational energy project, RuSakOil.
RuSakOil is based on a multi-year and multi-billion dollar offshore oil exploration and
production (E&P) project invested by an international energy giant. On one hand, this
project has been simplified enough for the purpose of demonstration; On the other hand,
it still remains representative for many multinational investments in the energy industry.
Here is a brief introduction to this example:
The Enterprise is a large multinational with expertise in the exploration
and production of oil & gas and has recently secured the rights to a
significant reservoir in a foreign country by creating a multi-billion joint
venture (i.e., Project) with a local firm (i.e., Host-Country Corporation).
While the Project will be technically challenging, there are early
Inputs/Outputs Steps Techniques
Step 1: Mapping
Step 2: Quantifying
Step 3: Searching
Step 4: Analyzing
Focal Organization, Stakeholders, and Their Roles, Objectives, and Needs
Qualitative Model of Stakeholder Value Network (SVN)
Document Survey, Stakeholder Interview, Network Visualization
Quantitative Model of Stakeholder Value Network (SVN)
Stakeholder Questionnaire, Value Flow Scoring, Value Propagation Rule
All the Value Paths Beginning from and Ending with the Focal Organization
Object-Process Network (OPN)
Important Paths/Outputs/Stakeholders/Flows for the Focal Organization
Network Measurements Definition and Network Statistics Construction
Itera
ting

- 73 -
indications that the complexity of the external relations, in both market
and nonmarket environment, will pose the most significant risk to the
successful completion of the Project. Specifically, from the market side,
the Host-Country Corporation tries to gain more revenue sharing and
increase the transfer of technology; from the nonmarket side, the Host-
Country Government lacks of the credibility, and the Local Community
wants to create more jobs before giving its regulatory approval for the
environmental compliance of the Project.
Next, a step-by-step SVN analysis is conducted for the RuSakOil, under the guidance of
the framework shown in Figure 3-1. Specifically, we put the focus of each step on the
elaboration for its general process and techniques, which can be taken as a stand-alone
manual, rather than the narrow discussion of this specific example.
3.2.1 Step One: Mapping
Mapping is the first step of the SVN analysis. Its specific goal is to develop a qualitative
model of the SVN: articulating the roles, objectives, and specific needs of each
stakeholder and then mapping their specific needs as value flows. Such a qualitative
model, in the format of stakeholder maps, provides a vivid and comprehensive
description of the stakeholders of a focal organization as well as the direct and indirect
relationships between them.
First of all, the focal organization, which is both the starting point and the final
destination of the whole SVN analysis, should be unambiguously defined. In the case of
RuSakOil, the focal organization can be either the Enterprise or the Project, depending on
which one is of the major research interest as well as where the organizational boundaries
are set. For simplicity, the Project is chosen as the focal organization here and will also

- 74 -
be treated as an entity independent from the Enterprise9, although for a joint venture, the
organizational overlap between the Project and the Enterprise is unavoidable.
After choosing the focal organization, there are still two challenges in the first step:
stakeholder identification and value flow definition.
3.2.1.1 Stakeholder Identification
Identifying the stakeholders of the focal organization is one of the most important
components in the whole SVN analysis, not only because missing a key stakeholder
could jeopardize the chance for the focal organization to successfully achieve its
objectives in the long run, but also because all the value flows in the SVN are derived
from the stakeholders and the inaccuracy in stakeholder identification will ripple through
the definition of value flows as well as the remaining process of the SVN analysis.
However, stakeholder identification is not an easy task, in consideration of the fact that
the community lacks a specific and unambiguous definition for “stakeholder” [Mitchell,
Agle, and Wood, 1997]. Freeman’s now-classic definition seems too broad: “A
stakeholder in an organization is (by definition) any group or individual who can affect
or is affected by the achievement of the organization’s objectives” [1984, p. 46]. In this
dissertation, three approaches are suggested together as a practical guidance for
stakeholder identification.
First, the MIT System Architecture Group [Crawley, 2009; Sutherland, 2009] defined
stakeholders more specifically as those who: (1) have a direct or indirect affect on the
focal organization’s activities, or (2) receive direct or indirect benefits from the focal
organization’s activities, or (3) possess a significant, legitimate interest in the focal
organization’s activities. With this definition, the types of stakeholders for a project (i.e.,
the focal organization) generally include:
9 Otherwise many value flows from the Enterprise and Host-Country Corporation to the Project will be eliminated from the SVN model.

- 75 -
“Stake” Holders: Those who have a direct stake in the project;
Beneficiaries: Those who derive benefits from the project;
Users: The ultimate consumers or users of the project’s outputs;
Agents: Those who act on behalf of other stakeholders in the model;
Institutions: Official bodies or organizations10 that directly impact the project;
Interests11: Those with a significant, legitimate interest in the project’s outputs,
who may not be considered a direct stakeholder in the traditional sense;
Project: Relatively, the focal organization itself is also a stakeholder in the eyes
of other stakeholders.
Particularly, for the RuSakOil described before, “stake” holders can be Enterprise, Host-
Country Corporation, Investors, and Suppliers; beneficiaries can be Local Community;
users can be Consumers; institutions can be Host-Country Government; and interests can
be NGOs12 or other social movements and groups.
Second, from the perspective of project management, Calvert [1995], Cleland [1998], and
Winch [2004] proposed a classification for the stakeholders of a project (see Table 3-1),
which is also helpful for stakeholder identification:
10 In the literature of social sciences (http://plato.stanford.edu/archives/fall2012/entries/social-institutions/), “institutions” are often organizations [Scott, 2001], or systems of organizations (e.g., capitalism). However, some institutions (e.g., English) are not organizations, or systems of organizations, and do not require organizations. A typical definition of “institutions” is [Turner 1997, p. 6]: “A complex of positions, roles, norms and values lodged in particular types of social structures and organizing relatively stable patterns of human activity with respect to fundamental problems in producing life-sustaining resources, in reproducing individuals, and in sustaining viable societal structures within a given environment.” Or as Harre [1979, p. 98] defined: “An interlocking double-structure of persons-as-role-holders or office-bearers and the like, and of social practices involving both expressive and practical aims and outcomes.” 11 Note that we define “Institutions” and “Interests” as stakeholders, which are different from Baron’s original definitions [1995] as the characteristics of stakeholders. 12 Nowadays there are still lots of debates about the legitimacy of NGOs’ interests. For example, who gives responsibilities to NGOs and how do NGOs obtain the representation of citizens and civil society [Edwards and Hulme, 2002]; whether or not the funding sources for NGOs are independent [Edwards and Hulme, 1996]; whether or not NGOs sufficiently represent the needs of developing countries [Lindenberg and Bryant, 2001]; among others.

- 76 -
Internal Stakeholders: Those who have a contractual relationship with the
project or a subcontract from another internal stakeholder. Internal stakeholders
can be further broken down to those on the Demand side and those on the Supply
side for the project.
External Stakeholders: Those who may have little choice about whether the
project goes ahead and may be positive, negative, or indifferent about the project.
External stakeholders can be further divided into Private and Public actors.
However, there are a few inaccurate places13 in the above definitions from our viewpoint,
and we suggest to rename the “internal stakeholders” and “external stakeholders” as
“market stakeholders” and “nonmarket stakeholders” [Baron, 1995], respectively: The
internal stakeholders usually exist in the market environment, which includes those
interactions between the focal organization and other parties that are intermediated by
markets; While the external stakeholder usually exist in the nonmarket environment,
which consists of the social, political, and legal arrangements that structure the focal
organization’s interactions outside of, and in conjunction with, markets.
Table 3-1: Some Project Stakeholders [Winch, 2004, p. 323]
Internal Stakeholders External Stakeholders
Demand Side Supply Side Private Public
Client
Sponsor
Financiers
Client’s employees
Client’s customers
Client’s tenants
Client’s suppliers
Consulting engineers
Principal contractors
Trade contractors
Materials suppliers
Employees of the above
Local residents
Local landowners
Environmentalists
Conservationists
Archaeologists
Regulatory agencies
Local government
National government
13 As pointed out by Professors Jeffrey Harrison and Donald Lessard, Calvert, Cleland, and Winch’s descriptions of “internal stakeholders” and “external stakeholders” are not accurate—typically internal and external stakeholders are distinguished by the organizational boundaries of firms or projects. In addition, for the “external stakeholders”, some of them are quite powerful and can even block the whole project, and therefore the statement of “who may have little choice” is also inaccurate.

- 77 -
Specifically, for the RuSakOil, Enterprise, Host-Country Corporation, Investors, and
Consumers can be the internal stakeholders identified from the demand side; Suppliers
can be the internal stakeholders identified from the supply side; NGO can be the external
stakeholders identified from the private sector; and Local Community and Host-Country
Government can be the external stakeholders identified from the public sector. In
addition, Enterprise, Host-Country Corporation, Investors, Consumers, and Suppliers are
the stakeholders in the market environment, while NGO, Local Community, and Host-
Country Government are the stakeholders in the nonmarket environment.
Third, as introduced in Chapter 2, Mitchell, Agle, and Wood [1997] developed a
descriptive theory of stakeholder salience and then validated it with an empirical study
[Agle, Mitchell, and Sonnenfeld, 1999]. In their theory, power, legitimacy, and urgency
are extracted as three relationship attributes for stakeholders and a typology of seven
categories of stakeholders can be generated through combining these attributes (see
Figure 2-2).
For the RuSakOil, using the above theory, most of the previously identified stakeholders
including Enterprise, Host-Country Corporation, Investors, NGO, Local Community, and
Host-Country Government can be characterized as the Definitive Stakeholders for the
Project. Moreover, Consumers and Suppliers can be characterized as the Expectant
Stakeholders who may lack of the attribute of power to some degree. This is also a
validation for the other two approaches in terms of stakeholder identification.
After going through the basics of the above three approaches, a list of stakeholders for the
Project in the running example is now obtained: Enterprise, Host-Country Corporation,
Investors, Consumers, Suppliers, NGO, Local Community, as well as Host-Country
Government. Counting in the Project itself, there are totally nine stakeholders for this
SVN analysis (see Table 3-2).

- 78 -
Table 3-2: Stakeholder Identification for the RuSakOil
Stakeholders Identification Approach
Crawley [2009], Sutherland [2009]
Calvert [1995], Cleland [1998], Winch [2004]
Mitchell, Agle, and Wood [1997]
Enterprise “Stake” Holders Internal/Demand; Market Definitive Stakeholder
Host-Country Corporation “Stake” Holders Internal/Demand; Market Definitive Stakeholder
Investors “Stake” Holders Internal/Demand; Market Definitive Stakeholder
Consumers Users Internal/Demand; Market Expectant Stakeholder
Suppliers “Stake” Holders Internal/Supply; Market Expectant Stakeholder
NGO Interests External/Private; Nonmarket Definitive Stakeholder
Local Community Beneficiaries External/Public; Nonmarket Definitive Stakeholder
Host-Country Government Institutions External/Public; Nonmarket Definitive Stakeholder
Project The Focal Organization
From the above table, we observe that Mitchell, Agle, and Wood’s approach [1997]
provides less differentiation than the other two approaches. One major reason, as
discussed in Chapter 2, lies in that the confusion between “Stakeholder” and
“Stakeholder Relationship”—as argued by many sociological theories, Power,
Legitimacy, and Urgency are more appropriate to be treated as the properties of
“Stakeholder Relationship”, rather than properties of “Stakeholder”—this argument will
be discussed in detail in Section 3.2.4.2 for the identification of important stakeholders.
In reality, after brainstorming among researchers and interviewing stakeholders, the
initial list for stakeholders could be much longer than that in the example, even with the
aid of the above three approaches. However, for technical reasons the number of
stakeholders in the SVN analysis should be no more than twenty, mainly bounded by the
computational capacity of the modeling platform (of the third step in the framework, see
Figure 3-1), which is elaborated later in this chapter as well as in Chapter 5 and 6. Facing
this situation, the stakeholders with similar role or in jurisdictional hierarchy will be
clustered together to shorten the long list of stakeholders and keep the SVN

- 79 -
computationally manageable. Examples for such a technique can be found in later
chapters as well as in Crawley [2009] and Sutherland [2009].
3.2.1.2 Value Flow Definition
Once an appropriate list of stakeholders (including the focal organization hereafter) has
been obtained, the next challenge in the first step is to identify the tangible and intangible
value exchanges between any two stakeholders to construct a multi-relational network,
that is, a SVN. Those bilateral and direct value exchanges are represented by value flows,
which can be derived from the specific needs of each stakeholder.
Together with Sutherland [2009], we develop a template to articulate the roles,
objectives, and specific needs of each stakeholder step by step, and then those specific
needs of each stakeholder are mapped as value flows coming from other stakeholders.
Taking the Local Community in the RuSakOil as an example, Figure 3-2 shows how such
a stakeholder characterization template looks like.
Figure 3-2: Stakeholder Characterization Template for the Local Community
The stakeholder characterization template begins with the top box defining the roles of
each stakeholder that are relevant to the focal organization’s activities. Below the roles,
the stakeholder’s objectives are extracted from its published goal statements, mission
statements, policy and strategy documents, or other official documents. Below the
!!
Value Flows !!!!!!!
ROLE: Serve the Local People
OBJECTIVES: Sustain/Increase the Political Support Protect the Local Environment Develop the Local Economy
SPECIFIC NEEDS: Political Support Environmental Protection Employment
INPUTS: Federal Support from Host-Country Government Policy Support from NGO Environmental Compliance from Project Employment from Project
LOCAL COMMUNITY
- 80 -
objectives, the stakeholder’s specific needs are refined in the same manner and finally
translated into the specific inputs flowing from other stakeholders, that is, the value flows
defined above. For example, in Figure 3-2, the Local Community receives four value
flows from other stakeholders to fulfill its own specific needs: “Federal Support” from
the Host-Country Government, “Policy Support” from the NGO, “Environmental
Compliance” from the Project, and “Employment” from the Project.
In the above template, we can observe the logic relationship between all the four parts:
From the roles to objectives to specific needs and to value flows, the stakeholder
characterization template develops a traceable, consistent, and deepened understanding
for how the stakeholders contribute owned resources to and acquire desirable value from
each other. More importantly, these bilateral and direct value exchanges, or value flows,
derived from such an understanding provide the “building blocks” for the multilateral and
indirect value exchanges, or value paths, which can be taken as the basis for further
interpreting the impacts of indirect relationships between stakeholders in the SVN, as
discussed in Chapter 2. In addition, theoretically, the sum of all the value flows identified
in the stakeholder characterization templates forms a complete set of the value
transactions within the stakeholder network, and therefore it is unnecessary to conduct a
similar but separate exercise to decide each stakeholder’s outputs to other stakeholders.
Also based on the cognitive characteristics of human beings, in general it is easier to
identify the inputs required by one stakeholder than to identify that stakeholder’s outputs
delivering value to others.
For the RuSakOil, all the stakeholders and the value flows required by each stakeholder
are summarized in Table 3-3, after using the template to characterize the other eight
stakeholders in term of their roles, objectives, specific needs, and finally the value flows
running into them. Note that the names of these value flows tend to be generic and are
self-explanatory in this running example, but in the real case study of Chapter 4, it is
necessary to give a specific and detailed description for each value flow.

- 81 -
Table 3-3: Stakeholders and Value Flows for the RuSakOil
To Stakeholder Value Flow From Stakeholder
Project
Project Approval Host-Country Government
Regulatory Approval Local Community
Technology Enterprise
Workforce Local Community
Logistic Support Host-Country Corporation
Product Subsystems Suppliers
Investment Enterprise
Enterprise
Future Project Approval Host-Country Government
Technology Requirements Project
High-Grade Goods Project
Low-Grade Goods Project
Investment Investors
Sales Revenue Consumers
Host-Country Corporation
Technology Transfer Project
Revenue Sharing Project
Economic Support Host-Country Government
Host-Country Government
Political Influence Host-Country Corporation
Project Lobbying Local Community
Taxes Project
Local Community
Federal Support Host-Country Government
Policy Support NGO
Environmental Compliance Project
Employment Project
Investors ROI Enterprise
Consumers Product Enterprise
Suppliers Contracts Project
NGO Environmental Impact Plan Project
Now the two challenges, stakeholder identification and value flow definition, have been
tackled for the first step of the SVN analysis (see Figure 3-1). In practice, the process of
identifying stakeholders and defining value flows should involve the participation of both
researchers familiar with these analysis techniques and representatives from each
stakeholder with expertise and experience related to relationship management. Note that
for modern companies, relationship management, or customer relationship management
(CRM) [Chen and Popovich, 2003], is a widely implemented method for managing a
company’s interactions with customers, and nowadays, there is a trend to extend the

- 82 -
concept of CRM to manage a company’s interactions with other stakeholders than
customers only, which is called enterprise relationship management (ERM) [Galbreath,
2002] and consistent with the development of stakeholder theory. In addition, based on
different strategic goals of the focal organization, the whole process can be either open or
close—when the main goal is to collaborate, this process should keep open and
transparent; while when the main goal is to compete, this process should keep close and
confidential—for both cases, an awareness is always required for the computational
capacity of the modeling platform introduced later.
Based on the set of stakeholders and values flows determined through the above process,
the qualitative model of the SVN can now be built up, in the format of “stakeholder
maps”, by connecting all the stakeholders with the value flows between them. For the
RuSakOil, using the information in Table 3-2 and 3-3, its stakeholder map can be created
in Figure 3-3:
Figure 3-3: Stakeholder Map for the RuSakOil
Project Investors
Consumers
Enterprise
Sales Revenue Product
Suppliers
Product Subsystems Contracts
Future Project Approval
Host-Country Corporation
Logistical Support
Revenue Sharing
Local Community
Employment Workforce
NGO
Environmental Impact Plan
Environmental Compliance
Economic Support
Political Influence
Policy Support
Project Lobbying
Federal Support
ROI
Investment
Host-Country Government
Regulatory Approval
Project Approval
Taxes
Political
Information
Goods/Service
Financial
Investment
High-grade Goods
Low-grade Goods
Technology Transfer
Technology Requirements
Technology
The Focal Organization
Market Stakeholders
Nonmarket Stakeholders

- 83 -
As shown in the above figure, one attractive feature of the stakeholder maps is the color-
coding system for different types of stakeholders and value flows: For stakeholders, the
focal organization is colored with light green, the market stakeholders are colored with
light blue, and the nonmarket stakeholders are colored with light salmon; For value
flows, red color represents the political flows, purple color represents the information
flows, blue color represents the goods/service flows, and green color represents the
financial flows. Note that classifying the stakeholders by the market and nonmarket
environment is based on the argument of Baron [1995] among other scholars in the field
of nonmarket strategy, while classifying the value flows by the political, information,
goods/service, and financial resources is based on Foa and Foa’s [1971, 1974, 1980]
resource theory for social and economic exchanges. We design such a color-coding
system in the stakeholder maps and applies it to all the case studies in order to discover
the connections between the types of value flows and the environment where they are
exchanged, as well as other possible principles or patterns for the value exchanges in the
stakeholder network.
Another attractive feature of the stakeholder maps is the emergence of indirect value
exchanges, or value paths, from those direct value exchanges, or value flows. As
mentioned previously, value paths show the possible ways for a group of stakeholders to
exchange value in an indirect manner and further can be taken as the basis to study the
impacts of indirect relationships in the stakeholder network. For example, Figure 3-4
brings up two value paths, along which different types of value have been exchanged, in
the RuSakOil case.
On the left, the Project provides “Employment” to the Local Community, and then the
Local Community gives “Project Lobbying” to the Host-Country Government, and
finally the Host-Country Government issues “Project Approval” back to the Project; On
the right, the Project provides “Environmental Impact Plan” to the NGO, and then the
NGO gives “Policy Support” to the Local Community, and finally the Local Community
issues “Regulatory Approval” back to the Project. Intuitively, these two value paths are
very meaningful for the Project to engage its stakeholders in an indirect way and should

- 84 -
have seen many applications in the real world, especially when some stakeholders are not
easy to be engaged directly. However, the identification of all the value paths is not that
intuitive and the interpretation for the aggregate impacts of these value paths cannot rely
on the intuition either. As such, it is a necessary and important task to find an efficient
means to search for the value paths in the stakeholder network as well as develop a
comprehensive understanding for their strategic implications in the viewpoint of the focal
organization. And the quantitative model of the SVN, which is established in the next
step (see Figure 3-1), can complete this task.
Figure 3-4: Two Examples for the Value Paths in the RuSakOil
The third feature of the stakeholder maps is the similarity between its terminology and
that of the Object-Process Diagram (OPD) and the related Object-Process Methodology
(OPM) [Dori, 2002], which has been used to visualize the four-step modeling framework
for the SVN analysis (see Figure 3-1). In the stakeholder maps, stakeholders are actually
the “objects” and value flows are the “processes” of exchanging various resources
between stakeholders. This similarity makes it possible and convenient to build the
quantitative model of the SVN on the platform of the Object-Process Network (OPN)
Project
Local Community
NGO
Environmental Impact Plan
Policy Support
Regulatory Approval
Project
Local Community
Employment
Project Lobbying
Host-Country Government
Project Approval

- 85 -
[Koo, 2005], a domain-neutral and executable meta-language based on the OPD and
OPM. This is discussed in detail in the third step of the framework (see Figure 3-1).
Finally, in the stakeholder map for the RuSakOil (see Figure 3-3), there are totally 9
stakeholders and 27 value flows. As emphasized before, this is a simplified small
network only for the purpose of demonstration. For the real cases studied in this
dissertation as well as in the collaborative research efforts [Cameron, 2007; Sutherland,
2009], generally the number of stakeholders in the SVN is from ten to twenty, bounded
by the computational capacity of the modeling platform (i.e., the OPN). Moreover, as a
good rule of thumb, the number of value flows is five to ten times the number of
stakeholders in the same network, which means on average each stakeholder has five to
ten specific needs, and this observation may be explained by the limits on human
capacity for processing information, or the “magic number seven, plus or minus two”
[Miller, 1956]. This rule also implies the number of possible value paths in the
stakeholder network will increase exponentially with the number of stakeholders or value
flows, which poses a great challenge for the OPN modeling platform. In addition, the
more stakeholders and value flows are included in the SVN, the more difficult it is to
understand the details of the stakeholder map for that SVN. Under this circumstance,
there are two ways to improve: One is to decompose the stakeholder maps into multiple
views, according to the types of value flows (e.g., Political, Information, Goods/Service,
and Financial), or the temporal stages of a project (e.g., Access, Appraise, Select, Define,
Execute, and Operate), for both better visibility and more insights gained from the
individual views—examples for the decomposition of stakeholder maps can be found in
the case studies of Chapter 4 and 6; The other is to aggregate stakeholders with similar
roles/functions into several sections and then on a higher level to show the reduced
amount of value flows among those sections—example for this technique can be found in
Sutherland [2009].
At this point, the qualitative construction of the SVN model has been completed with the
formation of stakeholder maps. Before diving into the details of the next three steps in the
modeling framework (i.e., Quantifying, Searching, and Analyzing, see Figure 3-1), it is
- 86 -
helpful to recall the three major assumptions for the SVN analysis, in light of the high
correlations between these assumptions and the next three modeling steps. Respectively,
the first assumption about Relationship Types provides the theoretical basis for scoring
value flows and value paths in the step of “Quantifying”; the second assumption about
Exchange Patterns provides the theoretical basis for searching for all the value paths
beginning from and ending with the focal organization in the step of “Searching”; and the
third assumption about Strategic Implications provides the theoretical basis for
constructing network statistics from the sample space of value paths in the step of
“Analyzing”. In other words, the remaining three steps of the SVN analysis heavily rely
on the above assumptions and take the quantitative modeling as their main theme, in
order to gain a deeper appreciation for the implications of both direct and indirect
stakeholder relationships.
Now the quantitative modeling for the SVN begins with the process of scoring value
flows and value paths as described in the next step.
3.2.2 Step Two: Quantifying
“Quantifying” is the second step in the SVN analysis, and as mentioned before, its
specific goal is to transform the stakeholder maps into a quantitative model of the SVN
through scoring value flows by the perceived utility of the recipient stakeholders and
defining the propagation rule of value flows in the stakeholder network to calculate the
score of a value path. Such a quantitative model, built upon the additional information
collected from a questionnaire for each stakeholder, provides a feasible way to compare
the relative importance of value flows and rank the emerging value paths, which can be
taken as the basic units to further measure the aggregate impacts of both direct and
indirect relationships between stakeholders for the focal organization.
Obviously, for this step, “value flow” and “value path” (see Table 3-4) are two important
concepts and have already been discussed many times in this chapter. From the
perspective of the Social Exchange Theory (SET) [Cropanzano and Mitchell, 2005;

- 87 -
Zafirovski, 2005], a pair of value flows between two stakeholders actually represents the
“restricted exchange” [Lévi-Strauss, 1949], which is defined as the two-party reciprocal
relationships that may be shown as “AóB”; While a closed value path, or a value path
beginning from and ending with the same stakeholder, actually represents the
“generalized exchange” [Bearman, 1997; Ekeh, 1974; Lévi-Strauss, 1963; Malinowski,
1922; Sahlins, 1965a], which is defined as the univocal reciprocal relationships among at
least three parties in the exchange situation that may be shown as “AðBðCðA” (Note
that in some literature this is a special case of generalized exchange, called “network-
generalized exchange” [Takahashi, 2000; Yamagishi and Cook, 1993] or “chain-
generalized exchange” [Shah and Levine, 2003]).
After going through the essence of the above two concepts, the process to quantify value
flows through a stakeholder questionnaire and the process to quantify value paths with
the value propagation rule are discussed in detail as below.
Table 3-4: Value Flow vs. Value Path
Definition Basis Implication
Value Flow The output of one stakeholder
and at the same time, the
input of another
Specific need of a
stakeholder
A pair of value flows between
two stakeholders constitutes
a “restricted exchange”
Value Path A string of value flows
connecting a group of
stakeholders
Value flows between
stakeholders
A closed value path
constitutes a “generalized
exchange”
3.2.2.1 Value Flow Scoring and Stakeholder Questionnaire
Necessity of a Common Framework
A pair of value flows between two stakeholders represents the bilateral and direct value
exchanges and can be derived from the specific needs of each stakeholder. As discussed
in the last step, we classify all the value flows into four categories: Political, Information,
Goods/Service, and Financial. These four categories are coded with different colors in

- 88 -
stakeholder maps and stand for different types of resources for exchanges [Foa, 1971;
Foa and Foa, 1974, 1980]. Further, the political and information value flows, or the
exchanges for political and information resources, can be taken as an abstraction of social
or nonmonetary relationships; While the goods/service and financial value flows, or the
exchanges for goods/service and financial resources, can be taken as an abstraction of the
economic or monetary relationships.
As discussed in Chapter 2, a common framework is necessary to simultaneously analyze
both social (i.e., political and information value flows) and economic (i.e., goods/service
and financial value flows) relationships between stakeholders, which are usually at the
organizational level instead of being individuals. And we choose the framework of the
Social Exchange Theory (SET) [Cropanzano and Mitchell, 2005; Zafirovski, 2005] in
order to gain a deep appreciation for the contents of the stakeholder relationships and
avoid the separation for different types of relationships. Under the chosen framework
from the Social Exchange Theory (SET) [Cropanzano and Mitchell, 2005; Zafirovski,
2005], social relationships are the extension of economic relationships [Coleman, 1990;
Emerson, 1976; Homans, 1961], and therefore “concepts and principles borrowed from
microeconomics” [Cook, 2000, p. 687] can be applied to conduct “the economic analysis
of noneconomic social situations” [Emerson, 1976, p. 336].
Specifically, the classic concept of “utility”14 in economics is applied in this dissertation
to create a mathematical model to compare the relative importance of value flows in the
14 Since the beginning of last century, there have been lots of debates on the measurability of utility in economics literature [Köbberling, 2006; Moscati, 2012]. Correspondingly, “ordinal utility” [Hicks and Allen, 1934] has gradually gained more popularity, while nowadays the “cardinal utility” is often treated as an outdated idea mainly because of the difficulty of measurement (and behavioral considerations). However, for the analytical purpose, cardinal utility is still usefully applied in a few specific contexts, such as the expected utilities for decision-making under uncertainty [von Neumann and Morgenstern, 1944] and the discounted utilities for intertemporal evaluations [Samuelson, 1937]. In this dissertation, we choose cardinal utility because in Project Phoenix (see Chapter 4), intertemporal evaluations constitute one important dimension of the utility function. Additionally, in other network analysis of social sciences, such as Coleman and Smith [1973], Coleman [1986, pp. 85-136], and Laumann and Knoke [1987, pp. 369-373], cardinal utility has also seen its application in the mathematical models for resource mobilization and deployment between organizations.

- 89 -
stakeholder network: Each value flow, no matter what type it is, will be assigned a
numeric score according to the satisfaction level perceived by the stakeholder who
receives the benefits from that value flow. These value flow scores are comparable and
actually reflect the degrees of desire for stakeholders to be involved in the relevant direct
value exchanges. Further, these scores, or the importance levels of value flows, provide a
basis to rank the relative importance of value paths, which are the basic units to measure
the aggregate impacts of both direct and indirect stakeholder relationships for the focal
organization. Based on the Social Exchange Theory (SET) [Cropanzano and Mitchell,
2005; Zafirovski, 2005], here we posit that all the stakeholder relationships are formed by
the use of subjective utility analysis and the comparison of alternatives. In the next
section of this chapter, some traditional economic principles, such as “diminishing
marginal utility” and “utility maximization”, will also be applied to develop a theory for
generalized exchange to improve the calculation method for the relative importance of all
the value paths in the stakeholder network.
Based on the above discussion, the relative importance of each value flow can be
quantified by the perceived utility of the recipient stakeholder. Note that the utility
studied in this dissertation is not “ordinal” but “cardinal” [Strotz, 1953], in order to
capture not only the ranking but also the strength of preferences for value flows.
However, it’s a notoriously difficult task to measure the magnitude of utility differences,
and economists argue that utility could not be measured directly but only indirectly, as
highlighted by Marshall [1920, p. 78]: “Utility is taken to be correlative to Desire or
Want. It has been already argued that desires cannot be measured directly, but only
indirectly, by the outward phenomena to which they give rise: and that in those cases
with which economics is chiefly concerned the measure is found in the price which a
person is willing to pay for the fulfillment or satisfaction of his desire.”
Utility of a Value Flow
We also take an indirect approach to measure the perceived utility for value flows: First,
in light of the analysis for stakeholders’ specific needs as well as for the specific contexts

- 90 -
of the Stakeholder Value Network (SVN), several key attributes are defined to
characterize the value flows; Second, numerical scales are developed to measure these
key attributes and correspondingly a questionnaire is designed to guide the recipient
stakeholders to assign a score for each attribute of the value flows coming to them; Third,
a combination rule is chosen to integrate the individual attribute scores of each value flow
into a single score, that is, the utility of that value flow comprehensively perceived by the
recipient stakeholder. One may notice that such an indirect approach for utility
measurement is actually a simplified application of the Multi-Attribute Utility Theory
(MAUT) [Edwards, 1977; Keeney and Raiffa, 1976], which is a useful tool for decision
makers to create a mathematical model and then quantify the desirability of certain
alternatives in a logic and consistent way. In addition, there is an implicit assumption to
apply the MAUT to quantify the utility of value flows—that is, all the value flows or
specific needs of one stakeholder, are independent from each other—this assumption may
be too simplified to reflect the real situations and therefore poses a limitation to the
approach chosen by us. For example, in the real world, one stakeholder can have some
“emergent needs”, which means these needs will not be presented or become more
desired until other “existent needs” are not met by other stakeholders.
As summarized by Sutherland [2009], the following is a list of common characteristics
when analyzing the specific needs of each stakeholder:
Intensity of a need
Source importance in fulfilling a need
Urgency in fulfilling a need
Competition in fulfilling a need
Awareness of a need
Since all the value flows in the network are derived from stakeholders’ specific needs, the
above need characteristics can also be taken as the key attributes of value flows.
Specifically, “Intensity of a need” characterizes a value flow from the demand side of the
recipient stakeholder; “Source importance in fulfilling a need” characterizes a value flow

- 91 -
from the supply side of the recipient stakeholder; “Urgency in fulfilling a need”
characterizes the dynamic property of a value flow; “Competition in fulfilling a need”
characterizes the interactive property of a value flow; and “Awareness of a need”
characterizes the cognitive property of a value flow.
In practice it is not necessary to include all the above five or even more attributes when
scoring the perceived utility of value flows, and there always exists a trade-off between
better decisions and the burden to collect more information: The more attributes are
included, the more detailed scale can be generated to characterize the value flows, which
provide the basis for more fine-grained decisions; However, on the other hand, the more
attributes are included, the more difficult it becomes for researchers to design the
questionnaire, as well as for stakeholders to fully understand the questionnaire and fill out
with reliable answers. Based on the experience of previous research [Cameron, 2007;
Sutherland, 2009], generally two or three value flow attributes are good enough for
conducting the whole Stakeholder Value Network (SVN) analysis, and “Intensity of a
need” and “Source importance in fulfilling a need” are the most frequently used ones,
which describe the value flows completely from both the demand side and the supply side
of the recipient stakeholders. Under some circumstance it’s also important to include
other value flow attributes, in consideration of the specific contexts of the Stakeholder
Value Network (SVN). For example, in the real large engineering project studied in the
next chapter, timing or temporal stage is a sensitive topic for many stakeholders, and
therefore “Urgency in fulfilling a need” will be taken as an attribute to characterize the
value flows in that project.
For the RuSakOil (see Figure 3-3) in this chapter, all the value flows are characterized by
“Intensity of a need” and “Source importance in fulfilling a need”, and these two
important attributes as well as their numerical scales are discussed in detail as below.
Further, a stakeholder questionnaire is constructed with these attributes and a
combination rule is chosen to get a single utility score for each value flow.
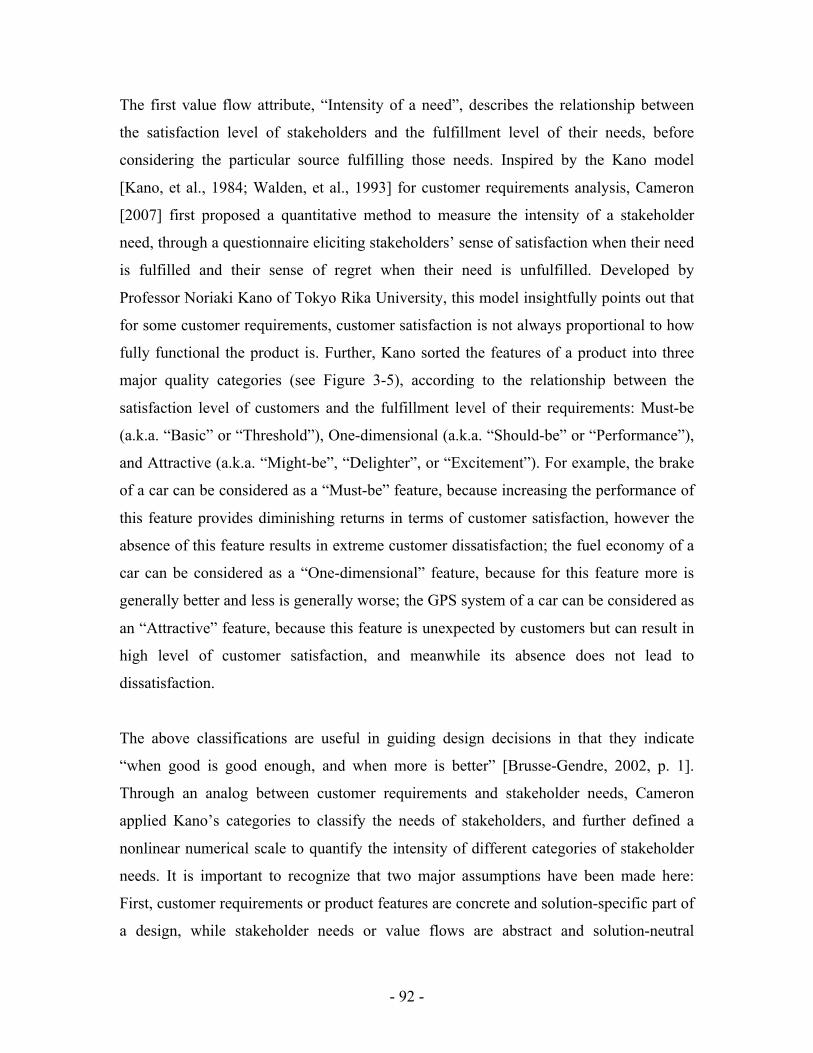
- 92 -
The first value flow attribute, “Intensity of a need”, describes the relationship between
the satisfaction level of stakeholders and the fulfillment level of their needs, before
considering the particular source fulfilling those needs. Inspired by the Kano model
[Kano, et al., 1984; Walden, et al., 1993] for customer requirements analysis, Cameron
[2007] first proposed a quantitative method to measure the intensity of a stakeholder
need, through a questionnaire eliciting stakeholders’ sense of satisfaction when their need
is fulfilled and their sense of regret when their need is unfulfilled. Developed by
Professor Noriaki Kano of Tokyo Rika University, this model insightfully points out that
for some customer requirements, customer satisfaction is not always proportional to how
fully functional the product is. Further, Kano sorted the features of a product into three
major quality categories (see Figure 3-5), according to the relationship between the
satisfaction level of customers and the fulfillment level of their requirements: Must-be
(a.k.a. “Basic” or “Threshold”), One-dimensional (a.k.a. “Should-be” or “Performance”),
and Attractive (a.k.a. “Might-be”, “Delighter”, or “Excitement”). For example, the brake
of a car can be considered as a “Must-be” feature, because increasing the performance of
this feature provides diminishing returns in terms of customer satisfaction, however the
absence of this feature results in extreme customer dissatisfaction; the fuel economy of a
car can be considered as a “One-dimensional” feature, because for this feature more is
generally better and less is generally worse; the GPS system of a car can be considered as
an “Attractive” feature, because this feature is unexpected by customers but can result in
high level of customer satisfaction, and meanwhile its absence does not lead to
dissatisfaction.
The above classifications are useful in guiding design decisions in that they indicate
“when good is good enough, and when more is better” [Brusse-Gendre, 2002, p. 1].
Through an analog between customer requirements and stakeholder needs, Cameron
applied Kano’s categories to classify the needs of stakeholders, and further defined a
nonlinear numerical scale to quantify the intensity of different categories of stakeholder
needs. It is important to recognize that two major assumptions have been made here:
First, customer requirements or product features are concrete and solution-specific part of
a design, while stakeholder needs or value flows are abstract and solution-neutral
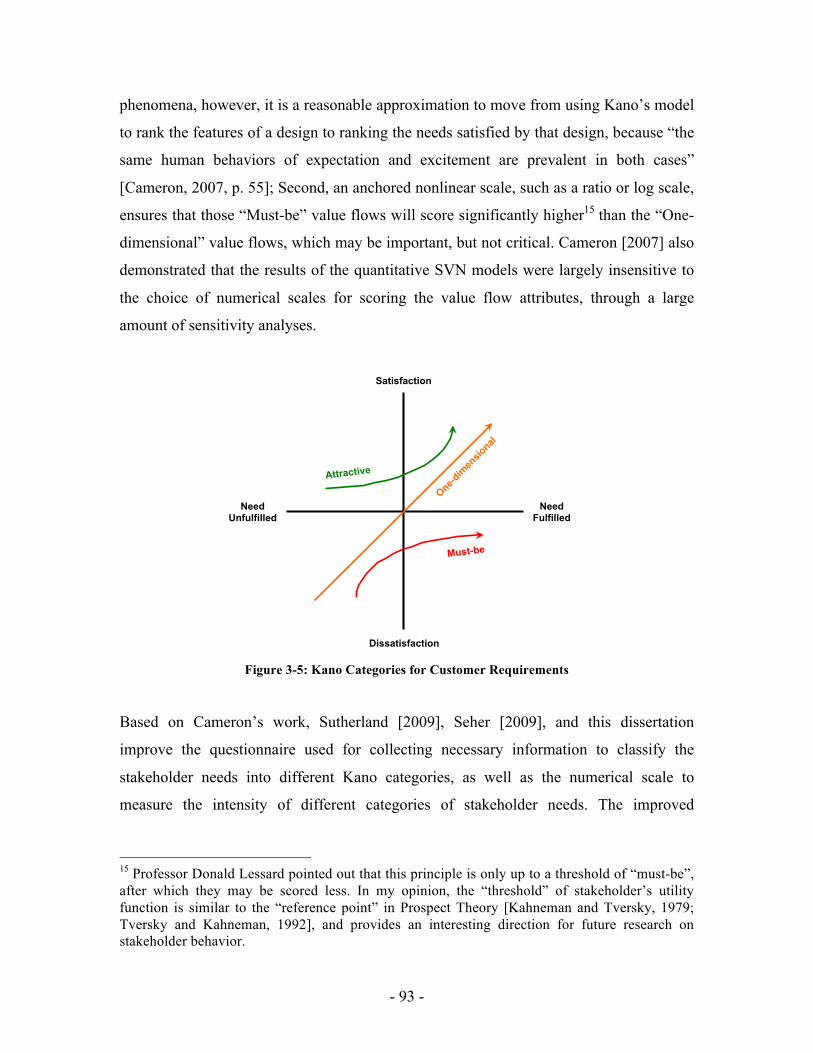
- 93 -
phenomena, however, it is a reasonable approximation to move from using Kano’s model
to rank the features of a design to ranking the needs satisfied by that design, because “the
same human behaviors of expectation and excitement are prevalent in both cases”
[Cameron, 2007, p. 55]; Second, an anchored nonlinear scale, such as a ratio or log scale,
ensures that those “Must-be” value flows will score significantly higher15 than the “One-
dimensional” value flows, which may be important, but not critical. Cameron [2007] also
demonstrated that the results of the quantitative SVN models were largely insensitive to
the choice of numerical scales for scoring the value flow attributes, through a large
amount of sensitivity analyses.
Figure 3-5: Kano Categories for Customer Requirements
Based on Cameron’s work, Sutherland [2009], Seher [2009], and this dissertation
improve the questionnaire used for collecting necessary information to classify the
stakeholder needs into different Kano categories, as well as the numerical scale to
measure the intensity of different categories of stakeholder needs. The improved
15 Professor Donald Lessard pointed out that this principle is only up to a threshold of “must-be”, after which they may be scored less. In my opinion, the “threshold” of stakeholder’s utility function is similar to the “reference point” in Prospect Theory [Kahneman and Tversky, 1979; Tversky and Kahneman, 1992], and provides an interesting direction for future research on stakeholder behavior.
Need Fulfilled
Need Unfulfilled
Attractive
One-dim
ensio
nal
Must-be
Satisfaction
Dissatisfaction

- 94 -
stakeholder questionnaire asks all the stakeholders the following question regarding the
presence or absence of fulfillment of their own needs (see Figure 3-6).
In the questionnaire, stakeholder responses A, C, and E represent the “Attractive”, “One-
dimensional”, and “Must-be” value flows respectively (see Figure 3-5), between which
responses B and D are falling. All the words in the questionnaire are chosen very
carefully to describe both the functional and dysfunctional characteristics of each Kano
category as precisely as possible, yet in a simpler and more consistent way compared to
the previous versions of stakeholder questionnaire.
Need Intensity Questionnaire
How would you characterize the presence/absence of fulfillment of this need?
A. I would be satisfied by its presence, but I would not regret its absence
B. I would be satisfied by its presence, and I would somewhat regret its absence
C. I would be satisfied by its presence, and I would regret its absence
D. Its presence is necessary, and I would regret its absence
E. Its presence is absolutely essential, and I would regret its absence
Figure 3-6: Stakeholder Questionnaire for Categorizing the Intensity of a Need
Correspondingly, the improved scale for measuring the intensity of different categories of
stakeholder needs is listed in Table 3-5. We select a five-point scale, because a three-
point scale doesn’t provide enough differentiation for stakeholder needs, a four-point
scale forces stakeholders to make unrealistic trade-off in some situations as a
consequence of lacking a middle position, and a scale with more than five points adds the
difficulty for stakeholders to answer the questionnaire.
As discussed before, we also choose a ratio scale to quantify the “need intensity” attribute
of value flows, and the scale multiplier between each questionnaire response is roughly
set as 1.7 for computational convenience. In addition, one may notice that all the attribute
scores are constrained between 0.11 and 0.98, and the reason why defining such a
constraint will be explained later when introducing the combination rule integrating

- 95 -
individual attribute scores into a single utility score for a value flow, as well as when
discussing the value propagation rule calculating the score of a value path consisting of
multiple value flows (see Table 3-4).
Table 3-5: Numerical Scale for Need Intensity Questionnaire
Questionnaire Response Numeric Score
A 0.11
B 0.19
C 0.33
D 0.57
E 0.98
The second value flow attribute, “Source importance in fulfilling a need”, further
describes the relationship between the satisfaction level of stakeholders and the particular
sources (i.e., other stakeholders in the network) fulfilling their needs, after considering
the fulfillment level of those needs. This attribute emphasizes the diversity of supply—if
there is a commodity demanded by one stakeholder, could this stakeholder get it from
elsewhere in the market? In addition, the attribute of source importance is similar to the
concept of “particularism” (vs. “universalism”) defined by Foa and Foa [1971, 1974,
1980]. From Foa and Foa’s resource exchange perspective, there are two important
dimensions to understand the benefits of a value exchange: one dimension is
“particularism”, meaning that the resource’s value varies based on its source; and the
other dimension is “concreteness”, meaning that how tangible or specific the resource is.
For example, among four different types of value flows studied in this dissertation (see
Figure 3-3), financial value flows are relatively low in particularism—its monetary value
is constant regardless of who provides it. Political value flows, however, is highly
particularistic, and its importance depends on its source. Meanwhile, most goods/service
value flows are at least somewhat concrete, and less concrete resources, such as some
information value flows, provide more intangible benefits. These examples are
approximately visualized in Figure 3-7 (Note that it has not been found there is an
amazing similarity between this figure and Fig. 1 in Foa [1971, p. 347], until Figure 3-7
is plotted by this dissertation independently).

- 96 -
Figure 3-7: “Particularism” and “Concreteness” Dimensions for Four Types of Value Flows
Although “concreteness” is a useful concept to describe the characteristics of value flows,
it’s not directly related with the perceived utility of those flows, especially the quantity of
utility. That is, some tangible value flows (i.e., high concreteness) could be more
desirable than other intangible (i.e., low concreteness) value flows, and meanwhile, some
intangible value flows could be more desirable than other tangible value flows.
Nevertheless, the concept of “particularism” should not be ignored when quantifying the
utility of value flows, particularly because for those flows with high particularism, the
recipient stakeholders’ desire level will vary a lot with different value flow sources.
Therefore, in this dissertation, “particularism”, or “Source importance in fulfilling a
need”, has been chosen as the second key attribute to characterize the value flows,
following the first one, “Intensity of a need”. Note that we purposely introduce these two
value flow attributes in such an order, to provide a clear and consistent logic for
stakeholders to evaluate each value flow coming to them, in the sense that the “Intensity
of a need” is more fundamental than the “Source importance in fulfilling a need” by
classifying the basic categories of stakeholder needs. Accordingly, the questionnaire for
the “source importance” attribute is shown in Figure 3-8.
Low High
Low
High
Financial
Particularism
Concreteness
Political
Goods/Service
Information

- 97 -
Source Importance Questionnaire If this need were to be fulfilled, how important would this specific source be in
fulfilling the need?
1. Not important – I do not need this source to fulfill this need
2. Somewhat important – It is acceptable that this source fulfills this need
3. Important – It is preferable that this source fulfills this need
4. Very important – It is strongly desirable that this source fulfills this need
5. Extremely important – It is indispensible that this source fulfills this need
Figure 3-8: Stakeholder Questionnaire for Categorizing the Source Importance in Fulfilling a Need
And the corresponding numerical scale for the source importance questionnaire is listed
as below (see Table 3-6). For the same reason discussed previously, we also select a five-
point scale for the “source importance” attribute. However, based on the definition for
each response in the above questionnaire (see Figure 3-6), a linear scale is more
appropriate than a nonlinear scale, and meanwhile, it is a rational assumption that
stakeholders can linearly differentiate the importance of multiple sources fulfilling a
common need. Similarly, the reason why constraining the scores for all the responses
between 0.11 and 0.98 will be discussed later in this section.
Table 3-6: Numerical Scale for Source Importance Questionnaire
Questionnaire Response Numeric Score
1 0.11
2 0.33
3 0.55
4 0.78
5 0.98
Once obtaining the attribute scores for “need intensity” and “source importance” through
the above stakeholder questionnaires and numerical scales (see Figures 3-6, 3-8, and
Tables 3-5 ~ 3-6), it comes to the last step to quantify the perceived utility of value flows,
that is, choosing a combination rule to integrate the scores of two attributes into one
- 98 -
single utility score for each value flow, which is also called “value flow score”. As shown
in Figure 3-9, we choose multiplication operation as the combination rule:
Figure 3-9: Combination Rule for Integrating Two Attribute Scores into Value Flow Score
In the above figure, those colored grids represent 25 possible combinations of two
attribute scores, and the utility score of each grid equals the multiplication of the
corresponding “need intensity” score and “source importance” score. For example, if a
value flow is ranked as “D” in terms of need intensity and as “3” in terms of source
importance, the utility score for that value flow will be 0.31. In addition, note that the
grid color changes with the magnitude of value flow scores.
As pointed out before, from the perspective of the Multi-Attribute Utility Theory
(MAUT) [Edwards, 1977; Keeney and Raiffa, 1976], the above indirect approach for
stakeholder utility measurement can also be described by a two-attribute utility function,
which is similar to the concept of production function in economics, in a discrete format
(i.e., Source = 1, 2, 3, 4, 5 and Intensity = 1, 2, 3, 4, 5):
Sou
rce
Impo
rtan
ce S
core
5 =
0.98
0.11 0.19 0.32 0.56 0.96
4 =
0.78
0.09 0.15 0.26 0.44 0.76
3 =
0.55
0.06 0.10 0.18 0.31 0.54
2 =
0.33
0.04 0.06 0.11 0.19 0.32
1 =
0.11
0.01 0.02 0.04 0.06 0.11
A = 0.11
B = 0.19
C = 0.33
D = 0.57
E = 0.98
Need Intensity Score

- 99 -
(Equation 3-1)
The main reason why a multiplicative utility function is chosen here is to simplify the
computation while ensuring positive correlations between utility and those two attribute
scales. Moreover, together with the range of [0.11, 0.96] for each attribute scale, the
multiplicative function normalizes all the value flow scores within the range of [0, 1],
which is consistent with the traditional settings of the utility theory.
One may argue that an additive utility function is even simpler than the multiplicative
form. However, assumptions for the additive form are more restrictive: in addition to the
Preferential Independence and Utility Independence which have to be satisfied for the
multiplicative form, the additive form also requires the Additive Independence. Based on
the MAUT, these three independence conditions are defined as below:
Preferential Independence: Attribute X is preferential independent from
Attribute Y when changes in the preference order of Y do not change the
preference order of X.
Utility Independence: Attribute X is utility independent from Attribute Y if the
utility for X does not change when Y is changed.
Additive Independence: Attributes X and Y are additive independent if the
paired preference comparison of any two lotteries, defined by two joint
probability distributions on X×Y, depends only on their marginal probability
distributions.
The above three conditions become stronger increasingly, from the Preferential to Utility
and to Additive Independence. Recalling the concepts for the “need intensity” and
“source importance” attributes of value flows discussed previously, it is straightforward
to understand that the Preferential Independence and Utility Independence are satisfied.
However, the Additive Independence does not hold—for simplicity, assuming that the
“need intensity” attribute only includes Must-be and Attractive, and the “source
Utility = Need Intensity × Source Importance = 0.11× 1.7 Intensity( ) × 0.11× Source( ) = 0.0121× Source × 1.7 Intensity

- 100 -
importance” attribute also includes only Extremely Important and Not Important—a
stakeholder will not be indifferent for the following two lotteries, or those two lotteries
will not be equally preferred by a stakeholder:
The above explanation provides a theoretical support for the value flow scoring method
used in this dissertation. In the real world, a stakeholder’s utility function can be
calibrated by the Conjoint Analysis [Green and Srinivasan, 1978; Orme, 2005] or the
Analytical Hierarchy Process (AHP) [Saaty, 1999, 2001], among other mathematical
psychology tools. Meanwhile, it is more realistic to assume that different stakeholders
have different utility functions, and even for the same stakeholder, the utility function
may also change with time. But all of these improvements would require more
computational/analytical resources and can only be achieved when the complexity of the
SVN model is reasonably managed, which will be discussed later in this chapter. More
importantly, the relative significance of value flows matters more than their absolute
scores, in light of the purpose of this dissertation. von Mises [1944, p. 26] once
mentioned: “There are no such things as absolute values, independent of the subjective
preferences of erring men.” In addition, Cameron [2007] went a step further and pointed
out that another merit of such a scoring system for these subjective utilities is to model
the “what-if” scenarios of value exchanges between stakeholders, instead of the actual
value transmissions in the network.
After elaborating the details of value flow scoring and stakeholder questionnaire from
both theoretical and practical aspects, now this method is applied to the running example
(see Figure 3-3) discussed earlier in this chapter: the specific questionnaire for the
RuSakOil is shown in Questionnaire A-3-1 (see the Appendix), to characterize the value
flows in terms of both the “Intensity of a need” and “Source importance in fulfilling a
(Must-be, Extremely Important)
(Attractive, Not Important)
(Must-be, Not Important)
(Attractive, Extremely Important)
0.5 0.5
0.5 0.5
and

- 101 -
need”; and the answered questionnaire as well as the combined utility score for each
value flow are exhibited in Table A-3-1 (see the Appendix).
More Discussions on Stakeholder Questionnaire
Before introducing the value propagation rule for value path scoring, there are two more
questions worthwhile for further discussion: Firstly, how should the stakeholder
questionnaire be answered? And secondly, how should the value flow scores from the
questionnaire be validated?
Considering the first question, several individuals knowledgeable about the project
should answer the stakeholder questionnaire, and ideally there will be at least one person
representing each stakeholder. In this way the fairness merit of the SVN analysis can be
guaranteed and there will be no inputs from “an overarching modeler”. When assigning
the attributes scores to each value flow, it is important that all the participants put
themselves in the shoes of the recipient stakeholder for that flow, and it should be better
to assign all the “need intensity” scores before assigning the “source importance” scores
to those value flows, in order to keep the participant’s mind “focused on one scoring
rubric rather than alternating back and forth” between two attribute scales, as well as to
avoid the coupled responses for different attributes which will remove “some of the
useful texture in the final results of the value network analysis” [Sutherland, 2009, pp.
70-71]. Once the attribute scores of each value flow are obtained, one can apply an
appropriate method, such as the Delphi method developed by the RAND Corporation
[Brown, 1968; Dalkey and Helmer, 1963; Linstone and Turoff, 1975; Sackman, 1974], to
reconcile differences of the scores among all the participants. An independent researcher
familiar with the methods can act as a facilitator for the reconciling process, and such an
interactive process will be stopped after a pre-defined criterion (e.g., number of rounds,
achievement of consensus, stability of results) is met. Finally, the mean or median scores
of the last round of questionnaire survey determine the attribute scores of each value flow
and then the value flow scores in the stakeholder network.
- 102 -
Considering the second question, it will be helpful to validate the value flow scores, or at
least the relative ranking of value flows, after a final set of scores are determined. There
are three ways to achieve this goal: First, one can conduct a cross validation by
interviewing different individuals or teams within one stakeholder. Second, the relative
ranking of some value flows can be validated by proxy data sources. For example, in the
SVN analysis for the Space-based Earth Observations, Sutherland [2009] used the
number of House Committee hearings in NASA’s six science categories to validate the
preference of the U.S. government for those categories. Last but not least, sensitivity
analysis is also a possible way—flag those questionable scores first, and then change
their range to see how sensitive the final results of the SVN analysis would be to those
scores—this technique can save time and efforts in the first step of analysis. Basically,
the objective of validation is not to rigorously prove the validity of all the value flow
scores, which are “the outcome of human arbitrariness” and reflect “all the shortcomings
and weaknesses of their authors” [von Mises, 1944, p. 26]. Instead, the objective here is
to “perform enough verification to establish general confidence in the model”
[Sutherland, 2009, p. 74], as well as to transparently record the subjective preferences of
stakeholders and surface some implicit assumptions—they are beneficial for further
improving the SVN model with more information or better knowledge. In addition,
similar to the arguments from System Dynamics [Forrester, 1964; Sterman, 2000], only
one possible state of the world will be revealed with time, so a physical calibration
against data is not possible—however, the key difference between System Dynamics and
the SVN analysis lies in whether the system model is dynamic or static: System
Dynamics is an approach to understanding the behavior of complex systems over time,
and deals with the internal feedback loops (reinforcing or balancing) and time delays
(stock and flow) that affect the behavior of the entire system; While for the SVN analysis,
its main goal is to understand the exchange and structure properties of multi-relation
networks as well as the strategic implications of these properties, therefore under the
limitation of analytical and computational resources, the system model is static and more
like a “snapshot” for the value exchanges between stakeholders at a specific temporal
stage.

- 103 -
For the RuSakOil case, five researchers at MIT filled out the stakeholder questionnaire
(see Questionnaire A-3-1), and the final score of each value flow (see Table A-3-1) was
determined after a three-round Delphi process. Two representatives from the Project
provided a cross-validation for the value flow scores, especially the relative ranking of
value flows for the Project and the Enterprise.
3.2.2.2 Value Path Scoring and Value Propagation Rule
As observed before, one attractive feature of the stakeholder maps is the emergence of
the multilateral and indirect value exchanges, or value paths, from those bilateral and
direct value exchanges, or value flows (see Figure 3-4). And then the concepts of value
flows and value paths are contrasted in terms of definition, basis, and implication (see
Table 3-4). In particular, value paths show the possible ways for a group of stakeholders
to exchange value in an indirect manner and further can be taken as the basis to study the
impacts of indirect relationships in the stakeholder network. Therefore, after a detailed
discussion on value flow scoring and stakeholder questionnaire, the next task before the
completion of the quantitative SVN model is to define a propagation rule for value flows,
in order to score the value paths in the network.
Cameron [2007] first defined a multiplicative rule to calculate the score of a value path.
According to this rule, the path score equals the product of the scores of all the value
flows along that path. Taking one of the two value paths highlighted in Figure 3-4 as an
example (see Figure 3-10), the score of this specific value path can be calculated through
Equation 3-2:
Figure 3-10: Example for the Multiplicative Rule of Value Propagation in the SVN
(Equation 3-2) Value Path Score = Value Flow Score( ) = ∏ 0.54 × 0.10 × 0.96 ≈ 0.052
Project Employment Local
Community Host-Country Government
Project Lobbying
Project
Project Approval
Score = 0.54
Score = 0.10
Score = 0.96

- 104 -
Before explaining the rationale behind the above multiplicative rule, it is important to
point out that by virtue of the previous method for value flow scoring (see Figure 3-9), all
the scores of value flows have been normalized within the range of [0, 1], which is
consistent with the traditional settings of the utility theory. Moreover, there is no value
flow scored with negative utility in the SVN (see Table A-3-1), or in the terminology of
graph theory, the SVN is a “Signed Graph” [Cartwright and Harary, 1956] with positive
signs only, and this fact is decided by the context of this dissertation—all the value flows
are derived from the specific needs of each stakeholder—however, it does not mean
“detriment” cannot be modeled in the SVN. As argued by Freeman [1984, p. 122], the
stakeholder relationships include three basic types, that is, “positive”, “negative”, and
“neutral”. We agree with Freeman but uses a different strategy to simplify the situation:
for a “positive” relationship from Stakeholder A to Stakeholder B, it can be represented
by a value flow running from A to B; for a “negative” relationship from Stakeholder A to
Stakeholder B, it can be represented by a value flow running from B to A; and for a
“neutral” relationship between Stakeholder A and Stakeholder B, it can be represented by
two or more value flows running in both directions between A and B. In other words, the
directions of value flows in the SVN are always the same as the directions toward which
the actual benefits are delivered, and by doing this, “detriment” is also able to be
reflected in the SVN. For example, in the RuSakOil (see Figure 3-3), the value flow of
“Environmental Compliance” from the Project to the Local Community is beneficial for
the Local Community, but may be perceived by the Project as “detriment”. Meanwhile,
from the perspective of this dissertation, it would be redundant to use another flow with
negative value in the SVN to show the “Environmental Requirements” from the Local
Community to the Project.
Based on the above observations, there are three reasons to define a multiplicative rule
for the calculation of value path scores:
First, similar to the value flow scores, the score of a value path reflects the
relative importance of an indirect value exchange for all the stakeholders along
- 105 -
that path. A multiplicative rule ensures that all the value path scores—the
products of the scores of all the value flows on those paths—remain bounded
within the range of [0, 1], which is consistent with the traditional settings of the
utility theory.
Second, heuristically, under the multiplicative rule, longer paths tend to have
lower scores, indicating the fact that with the increase of path length, it becomes
more and more difficult to engage stakeholders along the value path, constrained
by the cognitive capability of each stakeholder. Meanwhile, it also becomes more
and more difficult to manage those stakeholders because of more considerations
as well as more uncertainties associated with a longer path. In another word, the
multiplicative rule reflects both the benefits (through the subjective utilities of
each stakeholder, or the value flow scores) and the costs of a value path at the
same time, and is supported by the argument from Harary, Norman, and
Cartwright [1965, p. 159] among others [Jackson, 2008]: “There may be a
distance (length of path) beyond which it is not feasible for u to communicate
with v because of costs or distortions entailed in each act of transmission.”
Third, the multiplicative rule simplifies the calculation for the value path scores,
as it does for the calculation of value flow scores. In the future, with more
computational/analytical resources, the quantification for the benefits and costs
of a value path can be completed by different operation rules, for instance,
showing “more value accumulated along the longer paths” and “more difficulties
to manage the longer paths” respectively.
Additionally, the multiplicative rule for path score calculation requires that the lowest
value flow score should be larger than 0—otherwise the value path score will always
equal to 0 no matter what else value flows are included in that path (see Figure 3-9); and
the largest value flow score should be smaller than 1—otherwise the value path score will
keep unchanged no matter how many value flows with a score of 1 are added to that path
(see Figure 3-9). This is also the reason why previously defining a range constraint for
those two attribute scales (see Tables 3-5 and 3-6). Although the choice of 0.11 and 0.96
- 106 -
is at the discretion of this dissertation, however, such a choice does guarantee some
important characteristics for the indirect value exchanges within the SVN.
For simplicity, the multiplicative rule for value propagation is also applied to calculate
the value path scores for the RuSakOil (see Figure 3-3). In the fourth section of this
chapter, a more rigorous foundation for the calculation of value path scores—a utility
model of generalized exchanges—will be established, and correspondingly, an improved
mathematical method will be developed to calculate the scores of value paths. And such
an improved method, rather than the multiplicative rule discussed here, will be put in an
application for all the case studies in later chapters of this dissertation.
Once the value flows are scored and a value propagation rule is defined, the quantitative
construction of the SVN model has been completed. As highlighted previously, the
assumption about relationship types—monetary and nonmonetary relationships between
stakeholders can be analyzed in a common framework because social exchanges are the
extension of economic exchanges—provides the theoretical justification for scoring value
flows and value paths in this step. Based on such a quantitative model, the next step is to
search for all the direct and indirect value paths in the SVN, which can be then taken as
the basis for a network analysis in the last step.
3.2.3 Step Three: Searching
“Searching” is the third step in the SVN analysis, and as mentioned before, its specific
goal is to search for all the value paths beginning from and ending with the focal
organization as the sample space for a statistical network analysis. These closed value
paths, or “value cycles” defined by this dissertation, can be taken as the basic units to
further measure the aggregate impacts of stakeholder relationships—both direct and
indirect ones—on the strategic behavior of the focal organization, which is the Project as
chosen in the first step of the SVN analysis. Note that in order to avoid ambiguity, we do
not use the term of “value loops” [Cameron, 2007; Sutherland, 2009] for those special
value paths, because “loop” and “cycle” are two different concepts from the perspective

- 107 -
of graph theory: the former means “an edge that joins a single endpoint to itself” [Gross
and Yellen, 2003, p. 55], while the latter means “a closed path of length at least one”
[Gross and Yellen, 2003, p. 51]. The difference between these two concepts is important
for the discussion in Chapter 5.
This section first reviews several key terms for the SVN analysis, and then further
explains the theoretical basis for value path search. After that, the software platform and
modeling details for searching all the value paths beginning from and ending with the
same stakeholder are discussed.
By far the following key terms have been defined in this chapter:
Value Flow: The output of one stakeholder, and at the same time, the input of
another;
Flow Score: The subjective preference or perceived utility for a value flow
ranked by the recipient stakeholder;
Value Path: A string of value flows connecting a group of stakeholders;
Path Score: The product of the scores of all the value flows along the path;
Value Cycle: The value path beginning from and ending with the same
stakeholder, namely, the focal organization;
Cycle Score: The product of the scores of all the value flows along the cycle.
As emphasized prior to the quantitative construction of the SVN model, the assumption
of “Exchange Patterns”, which roots in the Social Exchange Theory (SET) [Emerson,
1976; Homans, 1958; Lévi-Strauss, 1949; Malinowski, 1922], sets up the theoretical
foundation for this step of the SVN analysis: The multilateral and indirect value
exchanges, namely, generalized exchanges [Bearman, 1997; Ekeh, 1974; Lévi-Strauss,
1963; Sahlins, 1965a], widely exist in the strategic behavior of modern organizations
[Olson, 1965; Shah and Levine, 2003; Westphal and Zajac, 1997]. For example, in Figure
3-4, the closed value paths (i.e., value cycles) bring forward two generalized exchanges
meaningful for the Project to engage its stakeholders in an indirect manner, especially

- 108 -
when some stakeholders—in this case they are the Host-Country Government and Local
Community, respectively—are not easy to engage directly. More importantly, project
managers confirmed that among others, these two generalized exchanges have seen wide
applications in the real world.
In Freeman’s now-classic book, Strategic Management: A Stakeholder Approach,
generalized exchanges between organizations, as well as the relationship networks
consisting of such indirect exchanges, are also acknowledged (see Figure 3-11).
However, Freeman [1984, p. 58] argues that: “… little is known in the way of
formulating strategies for utilizing such networks in a positive and proactive fashion.
Little is known, prescriptively, about what range of alternatives is open to managers who
want to utilize such an indirect approach to dealing with stakeholders.” Almost thirty
years later, a series of efforts made by MIT researchers [Cameron, 2007; Cameron,
Crawley, Feng, and Lin, 2009; Cameron, Crawley, Loureiro, and Rebentisch, 2008;
Crawley, 2008, 2009; Feng, Crawley, de Weck, et al., 2010; Feng, Crawley, de Weck,
Keller, Robinson, and Lin, 2012; Feng, Crawley, de Weck, Lessard, and Cameron, 2012;
Fu, Feng, Li, Crawley, and Ni, 2011; Sutherland, 2009] including this dissertation, aim to
challenge Freeman’s argument and utilize “such an indirect approach” to deal with
stakeholders in “a positive and proactive fashion”, through developing a rigorous method
to quantitatively measure the strategic impacts of those generalized exchanges between
stakeholders. Moreover, from an analytical perspective, generalized exchanges in the
form of value cycles, provide the means for gaining an in-depth understanding on how
value is created, exchanged, and delivered throughout the whole stakeholder network,
which is not often obvious or intuitive, especially when the size of network (i.e., number
of stakeholders and value flows) becomes large. Based on such an understanding,
generalized exchanges can help the focal organization allocate its limited resources by
identifying the stakeholder needs that are not currently satisfied well.

- 109 -
Figure 3-11: Freeman’s Examples for Generalized Exchanges [Adapted from Freeman, 1984, p. 60]
Now the major task of the third step in the SVN analysis boils down to searching for all
the value cycles beginning from and ending with the focal organization. As pointed out
during the qualitative construction of the SVN model, the terminology of the stakeholder
maps (see Figure 3-3) is similar to that of the Object-Process Diagram (OPD) and the
related Object-Process Methodology (OPM) [Dori, 2002], where stakeholders are the
“objects” and value flows are the “processes” of exchanging various resources between
stakeholders. Such a similarity provides the feasibility and convenience of running the
quantitative SVN model on the platform of the Object-Process Network (OPN), a
computer software program built upon the OPD and OPM.
Developed by the MIT System Architecture Group [Koo, 2005], OPN is a graphical,
domain-neutral, and executable meta-language for the purpose of representing,
generating, and manipulating simulation models. It is especially suitable for the
enumeration and analysis of large, complex system architectures, and can also be applied
to search and calculate the value cycles in the stakeholder networks.
Taking the RuSakOil (see Figure 3-3) as an example, the user interface of the OPN
modeling platform is snapshotted in Figure 3-12: The left window visualizes the SVN
model with “objects” (see green rectangles) and “processes” (see blue ovals); the middle
window records the entire search process, including both intermediate steps and final
results, for all the value cycles of the focal organization (i.e., the Project); and the right
windows exhibit the details of each step in the form of graphs and tables.
Marathon Local Community
Courts
U.S. Steel Mobil
AT&T
Owners
Employees
Congress

- 110 -
Figure 3-12: OPN Model for the SVN of the RuSakOil
Specifically, in the left window, the model breaks the SVN at the place of the focal
organization (i.e., the Project) and then unfolds the whole network from left to right: the
Project, eight other stakeholders, and the Project. At the same time, value flows are
grouped together around the recipient stakeholders, standing for the specific needs of
each stakeholder. Further, value flow scores obtained from the stakeholder questionnaire
and the multiplicative rule defined previously for value propagation, are coded behind the
corresponding objects and process. Figure 3-13 shows the zoom-in view of one portion
(see the red box in Figure 3-12) of the SVN model.

- 111 -
Figure 3-13: Zoom-In View of the OPN Model
When the SVN model is running, the program codes search the unfolded network from
the left side to the right side (see the dotted green arrow in Figure 3-12) and report all the
value cycles to the final vertex (see the orange box in Figure 3-12) as soon as the search
algorithm finds such a cycle for the focal organization (i.e., the Project). In general, the
shorter cycles appear earlier than the longer cycles in the search results, because the
mechanism of Breath-First-Search (BFS) [Bollobás, 1998; Diestel, 2005; Hochbaum,
2008], which will be discussed in detail in Chapter 5, is employed in the search algorithm
of the OPN. Figure 3-14 shows the modeling report exported from the final vertex: Each
row in the left table represents one unique value cycle for the focal organization (i.e., the
Project), and the important information about this cycle, such as the involved
stakeholders and value flows, cycle length, and cycle score, is summarized in the graph
and table to the right. For example, the current graph in Figure 3-14 visualizes the value
cycle in the 30th row of the report, which is the same cycle highlighted in the search
process (see Figure 3-12).

- 112 -
Figure 3-14: Final Vertex Report for All the Value Cycles of the Project
From the above report, we observe that the total number of value cycles for the Project is
small—there are totally 43 value cycles that will be discussed later in this section—and
therefore the running time of the SVN model on the OPN platform is negligible.
However, in the real world the SVN models are often much larger with more
stakeholders and/or more value flows, and correspondingly the running time is a big
concern, which will be further treated in the complexity analysis for the search algorithms
in Chapter 5. In order to ensure that these larger models are still solvable with the
limitation of computational resources, usually the following four types of constraints will
be integrated into the quantitative model of the SVN:

- 113 -
Internal Assets: This constraint defines the mechanism for stakeholders to
convert their inputs to outputs, in the form of “internal assets”, which are the
categorized resource pools to connect each stakeholder’s inputs with the same
category of outputs;
Simple Cycle: This constraint requires that no stakeholder is revisited along the
value cycle excluding the start/end one (i.e., the focal organization);
Cycle Score ≥ a: This constraint sets the lower bound for the score of a value
cycle, where “a” is between 0 and 1 (for the previous quantitative model);
Cycle Length ≤ k: This constraint sets the upper bound for the length of a value
cycle, where “k” is between 2 and n (n is the total number of stakeholders).
It is straightforward to understand that the above constraints shrink the sample space of
value cycles for the focal organization and therefore reduce the dimensionality of the
SVN model. More importantly, the proposition of these constraints is also justified by
their strategic implications:
First of all, in the existing SVN model, each stakeholder’s inputs are matched to its
outputs freely along a value cycle. However, such a treatment is not realistic for various
reasons—a good one is that when the value flows are highly concrete, such as most
goods/service value flows (see Figure 3-7), their connectivity is often restricted and the
connection between them should be carefully examined. For example, if a stakeholder
needs an input value flow labeled “raw materials from manufacturer”, and meanwhile
provides an output value flow labeled “equipment specifications to contractor”, these two
value flows should not be connected as one part of a value cycle because they have clear,
specific, but different contents. Stated in a more fundamental way, the existing SVN
model does not factor in the causal relationships between flows when linking them into a
cycle. As such, the concept of “internal assets” is developed to ensure that the value
cycles from the SVN model have realistic causation by specifying the conversion or
production process between each stakeholder’s input and output value flows—rather than
getting connected directly, now the input and output value flows will be connected
through different resource pools named “internal assets”, and within the same “internal

- 114 -
assets”, the input value flows can be freely matched to the output value flows. For
instance, domestic political capital, project support, and treasury are common “internal
assets” for nonmarket stakeholders (i.e., government, NGO, and so on), while human
resource, CAPEX, OPEX, revenue, legal eligibility, and corporate strategy are common
“internal assets” for market stakeholders (i.e., enterprise, project, and so on). The case
study in Chapter 4 will illustrate more details about the application of these “internal
assets”. With this technique, a lucid logic is presented for the existence of each value
cycle and the reason why stakeholders are engaged in a generalized exchange is also
partially explained.
Second, the requirement that no stakeholder except the focal organization is visited more
than once along the value cycle, is identical to the premise of “simple cycle” often
implied in modern graph theory [Bollobás, 1998; Diestel, 2005; Gross and Yellen, 2003;
Hochbuam, 2008; Weinblatt, 1972], or the “elementary cycle/circuit” finding numerous
applications in electrical engineering and communication theory [Danielson, 1968;
Johnson, 1975; Szwarcfiter and Lauer, 1976; Tarjan, 1972]. In this dissertation, the
requirement for “simple cycle” has more practical meaning: First, as highlighted before,
the system model in the SVN analysis is static and more like a “snapshot” for value
exchanges among stakeholders at a specific temporal stage, and therefore the dynamic
process of value accumulation, in the format of visiting a stakeholder multiple times, will
not be considered; Second, a simple cycle exactly represents the standard form of
“generalized exchange” and has been taken as the basic units to measure the impacts of
stakeholder relationships in the network—any value cycle with a stakeholder visited
more than once can actually be interpreted as the combination of several simple cycles—
if it is allowed to visit a stakeholder multiple times, some simple cycles will be counted
more than others, and obviously there is no point to do so.
Third, as introduced before, all the value flow scores have been normalized between 0
and 1, and under the multiplication rule for value propagation (see Equation 3-2), the
score of a value cycle equals the product of the scores of all the value flows along that
cycle—therefore the cycle scores also remain bounded within the range of [0, 1].

- 115 -
Moreover, according to the utility theory, the value cycles with higher scores are
interpreted more important than those with lower scores, which make it possible to set up
a lower bound of cycle scores to filter out the relatively less important value cycles to
save more computational resources. Obviously such a lower bound should be chosen
between 0 and 1, however the choice of the lower bound is open to the critique of being
arbitrary, because in this dissertation the perceived utility of each value flow for the
recipient stakeholder has not been benchmarked with the conjoint analysis or other
mathematical psychology tools.
Last but not least, from the perspective of graph theory, the length of a value cycle is
another key attribute associated with the value cycle, in addition to the cycle score.
Generally the cycle length is defined as the number of value flows included in that value
cycle, and further, based on the requirement of “simple cycle” in the SVN, the shortest
length of a value cycle equals two, which is corresponding to the direct or restricted
exchange between two stakeholders, while the longest length of a value cycle equals the
total number of stakeholders in the network, which is corresponding to the indirect or
generalized exchange involving all the stakeholders. As discussed in the multiplication
rule for value propagation, with the increase of the cycle length, it becomes more and
more difficult to engage stakeholders along that value cycle facing the constrained
cognitive capacity of each stakeholder, and meanwhile, it also becomes more and more
difficult to manage those stakeholders because of more considerations as well as more
uncertainties associated with a longer path. Therefore, similar to those value cycles with
too low scores, it is not necessary to include the value cycles with too long length in the
SVN analysis, especially when the computational resources is always limited. But
different from choosing the lower bound of cycle scores, the choice of an appropriate
upper bound of cycle length is not arbitrary and will be discussed in detail in Chapter 5.
For the RuSakOil (see Figure 3-3) in this chapter, the SVN model is very small and there
are totally 43 value cycles, which can be found on the OPN platform in a time-efficient
manner. Hence only the second constraint of “simple cycle” is added to the OPN model
of the SVN—for the first constraint, the causation between value flows along a value

- 116 -
cycle can be easily checked one by one and all the illogical or inconsistent value cycles
will be removed manually; and for the third and fourth constraints, neither the lower
bound of cycle scores or the upper bound of cycle length is necessary in this case.
After all the unique and valid value cycles are identified from the quantitative SVN
model, many interesting and meaningful analyses can be conducted to interpret the
strategic implications of both direct and indirect stakeholder relationships for the focal
organization. As stressed prior to quantifying the SVN model, the assumption about
strategic implications—for example, stakeholder power is the outcome of both exchange
relations and network positions—provides the theoretical basis for constructing network
statistics from the sample space of value cycles and defining network measurements for
the importance of stakeholders as well as other metrics of interest, from the standpoint of
the focal organization.
3.2.4 Step Four: Analyzing
This is the last step of the SVN analysis, and as mentioned before, its specific goal is to
define network measurements and construct network statistics in order to study the
strategic implications of the SVN for that focal organization, such as critical value cycles,
important stakeholders, important value flows, important outputs from and important
inputs for the focal organization, and so on. These strategic implications, from the
perspective of the Social Exchange Theory (SET), are the outcome of both exchange
relations and network positions [Blau, 1964; Emerson, 1972; Molm, 1990], and we argue
that value cycles (i.e., the value paths beginning from and ending with the focal
organization), can be taken as the basic unit to measure such an outcome. On one hand,
the value cycles discovered from the quantitative SVN model, along with their scores,
provide a feasible way for the focal organization to compare the relative importance of all
the exchange relations, including both direct and indirect ones, with other stakeholders;
On the other hand, the value cycles also simultaneously capture the information about
each stakeholder’s position in the SVN—for example, the occurrence of a specific
stakeholder in all the value cycles for the focal organization, will obviously vary with its

- 117 -
network position. Therefore, in the last step of the SVN analysis, all the value cycles will
be chosen as the sample space for constructing network statistics and then studying the
strategic implications of the SVN for the focal organization.
3.2.4.1 Critical Value Cycles
Once all the unique and valid value cycles are identified, one of the most straightforward
implications is the relative importance of these value cycles for the focal organization, in
terms of the cycle scores calculated in the last step. For the RuSakOil (see Figure 3-3) in
this chapter, there are totally 43 value cycles for the Project, and Figure 3-15 shows the
score distribution of those value cycles (see the green dotted curve), as well as the
corresponding length of each value cycle (see the blue column).
Figure 3-15: Score and Length of All the Value Cycles for the Project
From the above figure, we observe that the highest cycle score is around 0.5 and more
than 60% (28 out of 43) of value cycles have a score lower than 0.05, which implies a
majority of value cycles are not easy to be differentiated with cycle scores, using the
combination rule shown in Figure 3-9, or in other words, using the two-attribute utility
function shown in Equation 3-1. This situation may change when introducing more
attributes into the utility function of value flows, and Chapter 6 will discuss more details
on the relationship between the number of utility attributes and the differentiability of
0
1
2
3
4
5
6
0
0.1
0.2
0.3
0.4
0.5
0.6
1 2 3 4 5 6 7 8 9 10 11 12 13 14 15 16 17 18 19 20 21 22 23 24 25 26 27 28 29 30 31 32 33 34 35 36 37 38 39 40 41 42 43 C
ycle
leng
th
Cyc
le S
core
Cycle No.
All the Value Cycles for the Project
Cycle Length
Cycle Score Top Five Indirect Value Cycles (Critical Value Cycles) for the Project

- 118 -
value cycles in terms of their scores, especially for those networks with a large number of
stakeholders and value flows.
In addition, we observe that cycle scores tend to decrease with the increase of cycle
length. This observation is consistent with the earlier assumption in this chapter to choose
the multiplicative rule for value flow propagation in the stakeholder network.
Interestingly, there are also some “unusual” cycles that have much higher scores than
other value cycles with the same length. We argues that these “unusual” cycles actually
present the opportunities for the focal organization to engage its stakeholders in an
indirect way, particularly when it is difficult to engage them directly. For the RuSakOil
(see Figure 3-3), the top five indirect value cycles for the Project are circled in red in
Figure 3-15, and Figure 3-16 uncovers the details of each cycle. In particular, it is
worthwhile to mention that the third value cycle in Figure 3-16, “Project => (Revenue
Sharing) => Host-Country Corporation => (Political Influence) => Host-Country
Government => (Project Approval) => Project,” was a successful strategy taken by an
international energy company in a real multi-billion offshore oil project in a foreign
country, which can be seen as a mild validation of this SVN analysis. In this dissertation,
these high-leverage indirect value cycles are called “Critical Value Cycles” hereafter.
Figure 3-16: Top Five Indirect Value Cycles for the Project
3.2.4.2 Important Stakeholders
Project Host-Country Government
Local Community
Taxes Project
Regulatory Approval
Score = 0.295
Federal Support
Project Host-Country Government Enterprise
Taxes Project
Investment Score = 0.078
Future Project Approval
Project Host-Country Corporation
Host-Country Government
Revenue Sharing
Project
Project Approval
Score = 0.052
Political Influence
Project Local Community
Host-Country Government
Employment Project Score = 0.052
Project Host-Country Corporation
Host-Country Government
Revenue Sharing Local
Community
Federal Support
Political Influence
Project Approval
Project Lobbying
Project
Regulatory Approval
Score = 0.050

- 119 -
The second implication from the SVN analysis is the relative importance of each
stakeholder, or the Weighted Stakeholder Occurrence (WSO) [Cameron, 2007;
Sutherland, 2009], in terms of the occurrence of that stakeholder in all the value cycles
for the focal organization, weighted by the corresponding cycle scores (see Equation 3-3).
As highlighted in Chapter 2, the word “Importance” here should be interpreted from a
descriptive or instrumental perspective, instead of a normative one [Donaldson and
Preston, 1995], which is often a focus in the filed of business ethics—more specifically,
Corporate Social Responsibility (CSR) and Corporate Social Performance (CSP) [Carroll,
1999; Clarkson, 1995; Hillman and Keim, 2001; Phillips, 1997; Wheeler, Colbert, and
Freeman, 2003; Wood, 1991].
(Equation 3-3)
Built upon the Social Exchange Theory (SET) [Cropanzano and Mitchell, 2005;
Zafirovski, 2005], the WSO defined in the SVN analysis (see Equation 3-3) also
emphasizes the exchange aspects of stakeholder relationships, with the inclusion of
structural consideration—the subjective utilities of each stakeholder in all specific value
exchanges with other stakeholders have been factored into the scores of value flows and
then into the scores of value cycles, while the frequency of stakeholders’ appearance in
all the value cycles for the focal organization is clearly a measurement for the structural
characteristics of the stakeholder network—because of these two features, we coin a
more intuitive name for the WSO, that is, “Exchange Centrality I”, which implies the
combination of both exchange and structural properties, or the integration of “Resource
Power” and “Positional Power” in Handy’s words [1993]. Moreover, in order to honor
Professor Edward F. Crawley who initiated the research in this dissertation, “Exchange
Centrality I” is also called “Crawley Centrality I”. Note that the name “Exchange
Centrality II” or “Crawley Centrality II” is reserved for the Network Weighted
Stakeholder Occurrence (NWSO) introduced in Chapter 5 and 6.
Weighted Stakeholder Occurrence (WSO) = Score Sum of the Value Cycles Containing a Specific Stakeholder
Score Sum of All the Value Cycles for the Focal Organization

- 120 -
It is worthwhile to highlight again two major developments, from the exchange networks
in the Social Exchange Theory (SET) to the stakeholder networks in the SVN analysis, as
discussed in Chapter 2: First, exchange networks generally are single-relation networks
(i.e., simple graphs), while stakeholder networks are multi-relation networks (i.e.,
multiple graphs), and the WSO aims to measure the interaction of multiple exchange
relationships, or the exchange of multiple types of resources, at the same time; Second,
exchange networks mainly study the restricted exchanges between actors in the network,
as argued by Emerson [1976, p. 358]: “such networks tend to be composed of linked two-
way exchange relations,” while stakeholder networks also examine those generalized
exchanges, which are similar to the concept of “weak ties in diffusion processes”
[Granovetter, 1973, p. 1363].
Based on the definition of the WSO and using the Equation 3-3, Figure 3-17 shows the
calculated relative importance of each stakeholder for the Project in the case of RuSakOil
(see Figure 3-3):
Figure 3-17: Weighted Stakeholder Occurrence (WSO) for the Project
Since the Project is taken as the focal organization and will definitely appear in every
value cycle in the sample space, it is straightforward to understand that the WSO of the
Project equals to 1.0. Also from the above figure, the most three important stakeholders
0.0
0.2
0.4
0.6
0.8
1.0
Project
Local Community
Enterprise
Host-Country Government
Host-Country Corporation NGO
Suppliers
Investors
Consumers
WSO
Stakeholder
WSO in the Stakeholder Value Network (43 Paths)
Most Important Stakeholders for the Project

- 121 -
can be identified as Local Community, Enterprise, and Host-Country Government,
respectively—a short explanation is that the stakeholder with a higher WSO will have
more effect on turning the focal organization’s outputs into good inputs, through the
possible value cycles. Considering the RuSakOil is a simplified running example, we will
not elaborate more details about the implications of the WSO, until in Chapter 4, for a
large real-world engineering project (i.e., Project Phoenix), interesting comparisons will
be made between the WSO derived from three different stakeholder models (i.e.,
Manager’s Mental Model, “Hub-and-Spoke” Model, and the SVN model), the individual
contribution from exchange and structural properties of the stakeholder network on the
WSO will be extracted, and the corresponding strategic implications for the focal
organization will also be discussed.
3.2.4.3 Important Outputs and Inputs
Similar to the WSO, two more network statistics [Cameron, 2007; Sutherland, 2009] are
defined to measure the relative importance of the outputs from and the relative
influenceability of the inputs for the focal organization, i.e., Weighted Output Occurrence
(WOO) and Weighted Input Occurrence (WIO), respectively (see Equation 3-4 and 3-5):
(Equation 3-4)
(Equation 3-5)
Figure 3-18 and 3-19 summarize the modeling results of the WOO and WIO for the
Project in the case of RuSakOil (see Figure 3-3):
WOO helped identify that the top four high-leverage outputs from the Project are
“Taxes” to Host-Country Government, “Employment” to Local Community,
“Environmental Compliance” to Local Community, and “High-Grade Goods” to
Enterprise. An output with a higher WOO, will have a greater effect on improving
Weighted Output Occurrence (WOO) = Score Sum of the Value Cycles Beginning from a Specific Output
Score Sum of All the Value Cycles for the Focal Organization
Weighted Input Occurrence (WIO) = Score Sum of the Value Cycles Ending with a Specific Input
Score Sum of All the Value Cycles for the Focal Organization
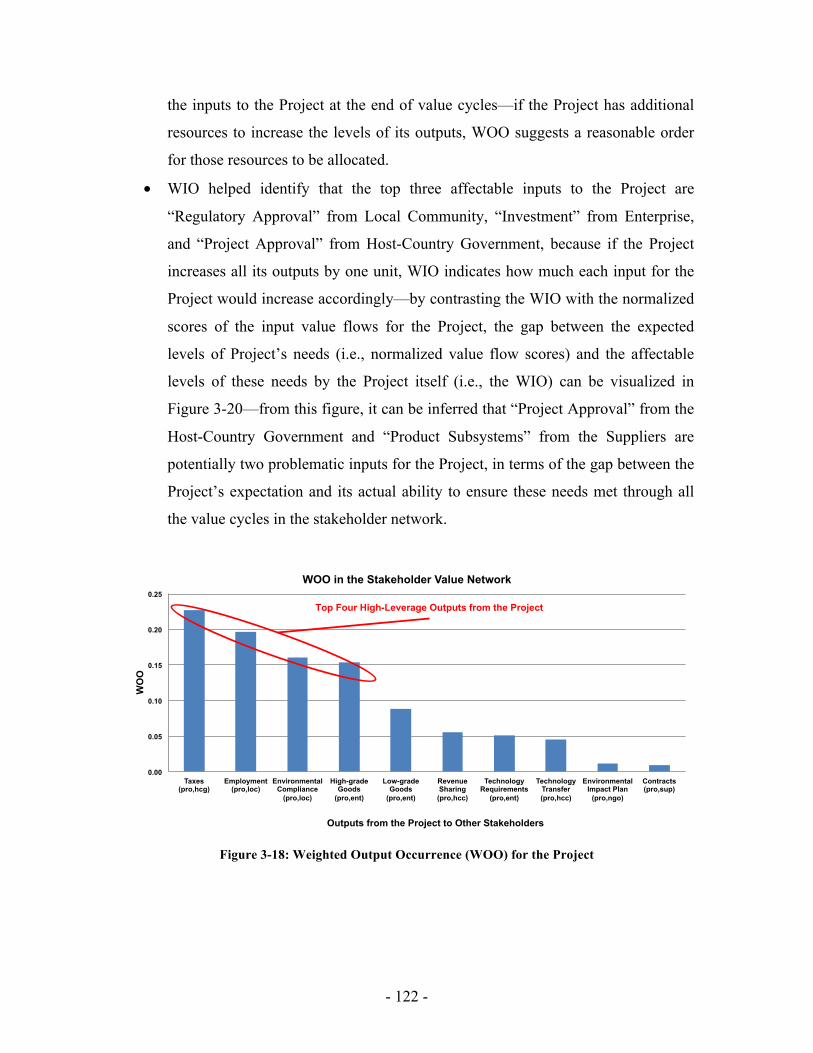
- 122 -
the inputs to the Project at the end of value cycles—if the Project has additional
resources to increase the levels of its outputs, WOO suggests a reasonable order
for those resources to be allocated.
WIO helped identify that the top three affectable inputs to the Project are
“Regulatory Approval” from Local Community, “Investment” from Enterprise,
and “Project Approval” from Host-Country Government, because if the Project
increases all its outputs by one unit, WIO indicates how much each input for the
Project would increase accordingly—by contrasting the WIO with the normalized
scores of the input value flows for the Project, the gap between the expected
levels of Project’s needs (i.e., normalized value flow scores) and the affectable
levels of these needs by the Project itself (i.e., the WIO) can be visualized in
Figure 3-20—from this figure, it can be inferred that “Project Approval” from the
Host-Country Government and “Product Subsystems” from the Suppliers are
potentially two problematic inputs for the Project, in terms of the gap between the
Project’s expectation and its actual ability to ensure these needs met through all
the value cycles in the stakeholder network.
Figure 3-18: Weighted Output Occurrence (WOO) for the Project
0.00
0.05
0.10
0.15
0.20
0.25
Taxes (pro,hcg)
Employment (pro,loc)
Environmental Compliance
(pro,loc)
High-grade Goods
(pro,ent)
Low-grade Goods
(pro,ent)
Revenue Sharing (pro,hcc)
Technology Requirements
(pro,ent)
Technology Transfer (pro,hcc)
Environmental Impact Plan
(pro,ngo)
Contracts (pro,sup)
WO
O
Outputs from the Project to Other Stakeholders
WOO in the Stakeholder Value Network
Top Four High-Leverage Outputs from the Project
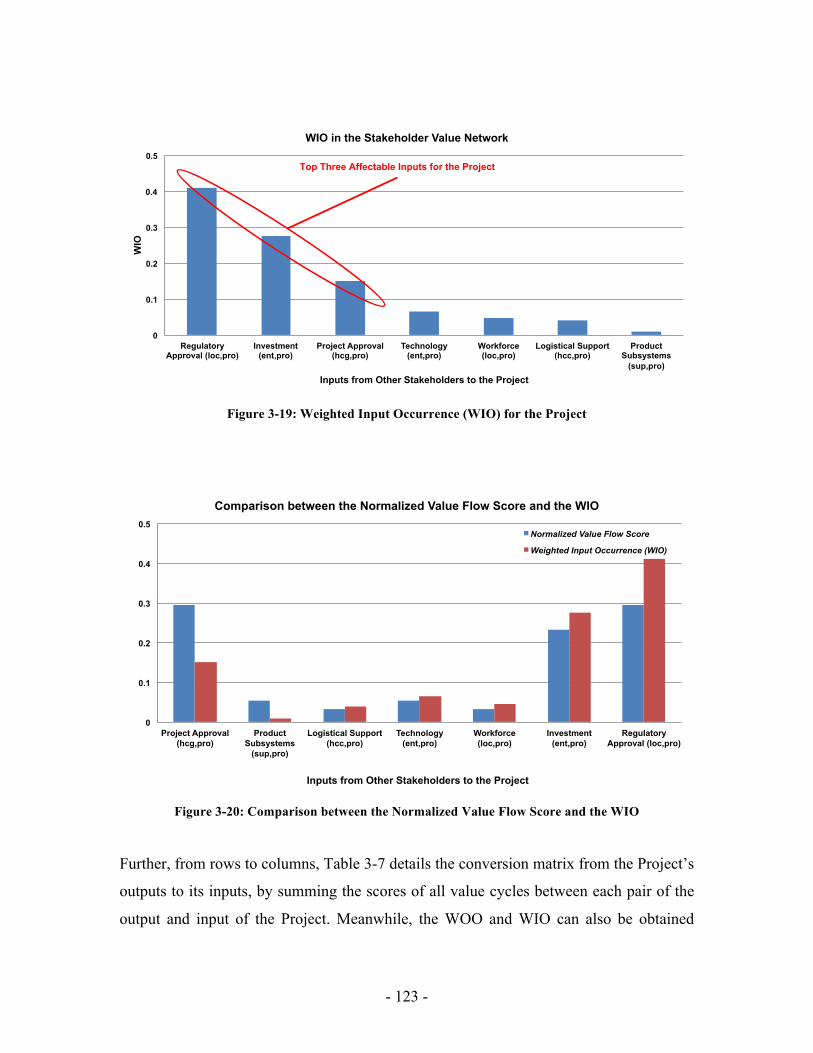
- 123 -
Figure 3-19: Weighted Input Occurrence (WIO) for the Project
Figure 3-20: Comparison between the Normalized Value Flow Score and the WIO
Further, from rows to columns, Table 3-7 details the conversion matrix from the Project’s
outputs to its inputs, by summing the scores of all value cycles between each pair of the
output and input of the Project. Meanwhile, the WOO and WIO can also be obtained
0
0.1
0.2
0.3
0.4
0.5
Regulatory Approval (loc,pro)
Investment (ent,pro)
Project Approval (hcg,pro)
Technology (ent,pro)
Workforce (loc,pro)
Logistical Support (hcc,pro)
Product Subsystems
(sup,pro)
WIO
Inputs from Other Stakeholders to the Project
WIO in the Stakeholder Value Network
Top Three Affectable Inputs for the Project
0
0.1
0.2
0.3
0.4
0.5
Project Approval (hcg,pro)
Product Subsystems
(sup,pro)
Logistical Support (hcc,pro)
Technology (ent,pro)
Workforce (loc,pro)
Investment (ent,pro)
Regulatory Approval (loc,pro)
Inputs from Other Stakeholders to the Project
Comparison between the Normalized Value Flow Score and the WIO
Normalized Value Flow Score
Weighted Input Occurrence (WIO)

- 124 -
through adding all the row elements and column elements together, respectively, based
on their definitions (see Equation 3-4 and 3-5).
Table 3-7: Conversion Matrix between the Project’s Outputs and Inputs
3.2.4.4 Important Value Flows and Manageable Network Complexity
A natural extension of the concepts of WOO and WIO is the Weighted Value Flow
Occurrence (WVFO) [Cameron, 2007; Sutherland, 2009], which aims to measure the
relative importance of each value flow, through counting the weighted occurrence of that
value flow in all the value cycles for the focal organization (see Equation 3-6). Note that
in this dissertation, WOO, WIO, and WVFO have all been normalized for the
convenience of comparison, while WSO has not been normalized, mainly for the purpose
of benchmarking the WSO of the focal organization always as 1.0.
(Equation 3-6)
Figure 3-21 shows the modeling results of the WVFO of all the 27 value flows in the case
of RuSakOil (see Figure 3-3). Value flows associated with higher WVFO can be
Weighted Value Flow Occurrence (WVFO) = Score Sum of the Value Cycles Containing a Specific Value Flow
Sum (Score Sum of the Value Cycles Containing a Specific Value Flow)
Project Approval (hcg,pro)
Regulatory Approval (loc,pro)
Investment (ent, pro)
Workforce (loc, pro)
Technology (ent, pro)
Logistical Support (hcc,pro)
Product Subsystems (sup,pro) SUM (Rank)
Technology Requirements
(pro,ent)0.000 0.000 0.041 0.000 0.010 0.000 0.000 0.051 (7)
High-grade Goods (pro,ent) 0.000 0.000 0.124 0.000 0.029 0.000 0.000 0.154 (4)
Low-grade Goods (pro,ent) 0.000 0.000 0.071 0.000 0.017 0.000 0.000 0.088 (5)
Revenue Sharing (pro,hcc) 0.016 0.015 0.004 0.002 0.001 0.018 0.000 0.055 (6)
Technology Transfer (pro,hcc) 0.013 0.012 0.003 0.001 0.001 0.015 0.000 0.045 (8)
Taxes (pro, hcg) 0.093 0.089 0.024 0.010 0.006 0.006 0.000 0.228 (1)
Employment (pro,loc) 0.016 0.157 0.004 0.018 0.001 0.001 0.000 0.197 (2)
Environmental Compliance
(pro, loc)0.013 0.128 0.003 0.015 0.001 0.001 0.000 0.160 (3)
Contracts (pro, sup) 0.000 0.000 0.000 0.000 0.000 0.000 0.010 0.010 (10)
Environmental Impact Plan
(pro,ngo)0.001 0.009 0.000 0.001 0.000 0.000 0.000 0.012 (9)
SUM (Rank) 0.151 (3) 0.411 (1) 0.275 (2) 0.047 (5) 0.065 (4) 0.041 (6) 0.010 (7) 1.000
Project Input
Project Output

- 125 -
interpreted to have more resource significance and structural advantage in the stakeholder
network from the perspective of the focal organization.
Figure 3-21: Weighted Value Flow Occurrence (WVFO) for the Project
Based on Figure 3-21, it is interesting to observe that less than half value flows (10 out of
27) are responsible for more than 80% of the total value. Using these top ten value flows,
together with the important stakeholders identified previously by the WSO (i.e. Exchange
Centrality I or Crawley Centrality I), a smaller SVN consisting of fewer stakeholders and
value flows can be constructed. Within this smaller network model, more analytical
and/or computational resources will be available to deal with more details of the
organizational structure and hierarchy of stakeholders as well as their heterogeneous
utility functions for value exchanges in the network. In other words, a combination of the
WVFO and the WSO can be used by the focal organization to manage the complexity of
stakeholder networks, and meanwhile provide the basis for more fine-grained decisions
regarding stakeholders. Specifically, the guidelines on managing the network complexity
and the principles for hierarchical modeling of the SVN are the focus of Chapter 5 and 6
in this dissertation, with a case study for China’s Energy Conservation Campaign [Fu,
Feng, Li, Crawley, and Ni, 2011].
3.2.4.5 Stakeholder Balance
0.00
0.04
0.08
0.12
0.16
0.20
Regulat
ory Appro
val (l
oc, pro
)
Investm
ent (e
nt, pro
)
Taxe
s (pro
, hcg
)
Employmen
t (pro
, loc)
Environmen
tal C
ompliance
(pro
, loc)
High-grade G
oods (pro
, ent)
Projec
t Appro
val (h
cg, p
ro)
Federa
l Support
(hcg, lo
c)
Low-grade G
oods (pro
, ent)
Politica
l Influ
ence
(hcc
, hcg
)
Tech
nology (en
t, pro
)
Reven
ue Shari
ng (pro
, hcc
)
Tech
nology Req
uiremen
ts (pro
, ent)
Future Pro
ject A
pprova
l (hcg
, ent)
Workforce
(loc,
pro)
Tech
nology Tran
sfer (
pro, h
cc)
Projec
t Lobbyin
g (loc,
hcg)
Logistica
l Support
(hcc, p
ro)
Policy S
upport (ngo, lo
c)
Environmen
tal Im
pact P
lan (p
ro, n
go)
Product
Subsyste
ms (su
p, pro
)
Contracts
(pro
, sup)
Economic
Support (hcg
, hcc
)
Investm
ent (i
nv, en
t)
Sales R
even
ue (co
n, ent)
ROI (ent, i
nv)
Product
(ent, c
on)
WVF
O
Value Flow (From, To)
WVFO in the Stakeholder Value Network
WVFOii=1
27
∑ = 1WVFOii=1
10
∑ = 0.808

- 126 -
The previous statistics for the SVN, including the Critical Value Cycle, WSO, WOO,
WIO, and WVFO, are all established on the sample space of value cycles for the focal
organization, in order to measure the strategic implications of vertices (i.e., stakeholders),
edges (i.e., value flows), and cycles (i.e., value cycles) in a multidigraph (i.e., SVN).
Now the last statistic in this chapter, i.e., Stakeholder Balance, will break all the value
cycles in the sample space into pairwise value paths between the focal organization and
other stakeholders, and calculate the score sum of the resulting paths on each direction—
from the focal organization to other stakeholders, and from other stakeholders to the focal
organization—as the indicators for the strength balance between the focal organization
and its stakeholders in terms of value transactions. The creation of this concept has been
benefited from the study of “Structural Balance” [Cartwright and Harary, 1956; Harary,
1965] in graph theory, which is one of the three main sources for the network analysis in
social sciences, argued by Cook and Whitmeyer [1992, p. 115] (another two are social
anthropology and sociometry).
Figure 3-22 and 3-23 show the calculated Stakeholder Balance in the RuSakOil (see
Figure 3-3), from all the direct transactions as well as from both direct and indirect
transactions, respectively. It is straightforward to understand that the direct transactions
between the Project and other stakeholders are obtained from the decomposition of the
restricted exchanges (AóB) in the network, while the indirect transactions are obtained
from the decomposition from the generalized exchanges (AðBðCðA). The main
objective for differentiating indirect transactions from direct ones and having such a
comparison is to highlight the changes from the traditional stakeholder model, i.e., the
“Hub-and-Spoke” Model, to the networked stakeholder model, i.e., the SVN, as
discussed in Chapter 2. More comparisons between these two types of stakeholder
models and further discussions on the strategic implications of those changes will be
followed by the case study of Project Phoenix in Chapter 4.
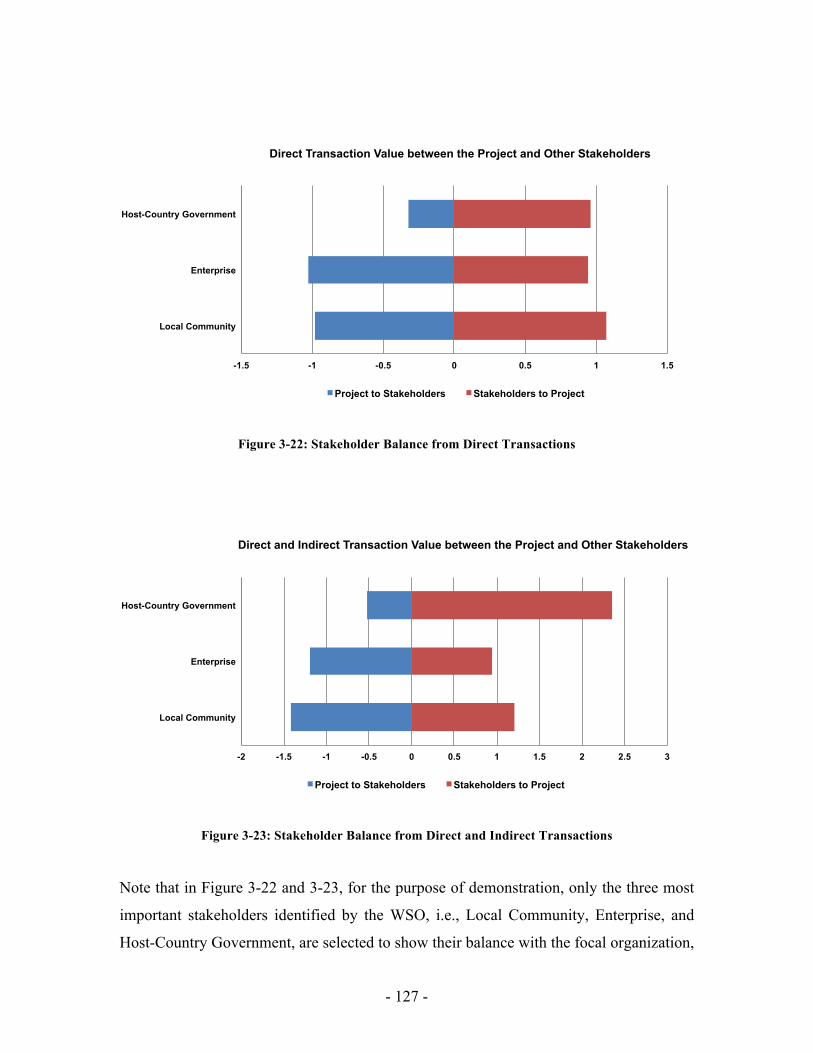
- 127 -
Figure 3-22: Stakeholder Balance from Direct Transactions
Figure 3-23: Stakeholder Balance from Direct and Indirect Transactions
Note that in Figure 3-22 and 3-23, for the purpose of demonstration, only the three most
important stakeholders identified by the WSO, i.e., Local Community, Enterprise, and
Host-Country Government, are selected to show their balance with the focal organization,
-1.5 -1 -0.5 0 0.5 1 1.5
Local Community
Enterprise
Host-Country Government
Direct Transaction Value between the Project and Other Stakeholders
Project to Stakeholders Stakeholders to Project
-2 -1.5 -1 -0.5 0 0.5 1 1.5 2 2.5 3
Local Community
Enterprise
Host-Country Government
Direct and Indirect Transaction Value between the Project and Other Stakeholders
Project to Stakeholders Stakeholders to Project

- 128 -
i.e., the Project. In addition, the length of blue bars is proportional to the transaction value
from the Project to other stakeholders, and the length of red bars is proportional to the
transaction value from other stakeholders to the Project. Specifically, for the balance
where the blue bar is longer than the corresponding red bar, the Project provides more
value to a stakeholder than it needs from that stakeholder, which indicates that the Project
occupies an advantageous position because of the imbalance nature of the transaction
value between two of them; and vice versa for the balance where the red bar is longer
than the corresponding blue bar.
Comparing Figure 3-22 with Figure 3-23, we observe that the strength balance between
the Project and a specific stakeholder may change from the “Hub-and-Spoke” Model to
the SVN model. For example, in RuSakOil, the most obvious change is the balance
between the Project and Host-Country Government, in terms of the “absolute” change
reflected by the net transaction value (see Figure 3-24). Meanwhile, if taking the
“relative” change reflected by the output/input ratio (i.e., the O/I ratio) as a new criterion,
the most obvious change would be the balance between the Project and Local
Community (see Figure 3-25). However, for either criterion, these changes signal an
advantage gained by other stakeholder via the general exchanges in the network, and this
advantage should not be ignored by the focal organization in its strategic decisions
regarding stakeholders. This is a very important conclusion in this dissertation and will be
validated by the case of Project Phoenix in Chapter 4.
Figure 3-24: Net Transaction Value between the Project and Other Stakeholders
-1
0
1
2 Local Community
Enterprise Host-Country Government
Direct Transactions
Direct and Indirect Transactions

- 129 -
Figure 3-25: O/I Ratio between the Project and Other Stakeholders
3.2.5 Directions for Improvement
After going through the above four steps of “Mapping”, “Quantifying”, “Searching”, and
“Analyzing”, the SVN analysis for the RuSakOil (see Figure 3-3) is now completed. Note
that these steps can be iterated when more information becomes available for the SVN
and/or the situation of previous analysis changes. In addition, the general process and
techniques of the SVN analysis (see Figure 3-1) elaborated in this section should be taken
as a stand-alone manual with broad applications, rather than the narrow discussion on a
specific example.
Before proceeding to the next section, it would be helpful to list a few known limitations
of this network approach for stakeholder modeling:
Relational Approach: The essence of the SVN analysis is a relation-based
network approach, which treats the exchange relationships as more fundamental
phenomena than others in the stakeholder network, and it would be interesting to
discover the synergy with other actor- or event- based approaches;
Value Propagation: The SVN analysis takes a multiplicative rule to simplify the
calculation of the utility scores of value cycles in the stakeholder network, but
0
1
2
Local Community
Enterprise Host-Country Government
Direct Transactions
Direct and Indirect Transations

- 130 -
considering these cycles are the basic units for understanding the impacts of
indirect stakeholder relationships, it is necessary to develop a more rigorous
mathematical model to improve the calculation;
Computational Platform: The Object-Process Network (OPN) is a graphical,
domain-neutral, and executable meta-language designed to represent, generate,
and manipulate simulation models, but as a computational platform, its capability
to handle large networks is seriously constrained, mainly because of the opaque
and inefficient algorithms as well as the unnecessary visualization effects;
Egocentric Distortion: Value cycles, the representation of generalized
exchanges, are the basic units to measure the impacts of indirect stakeholder
relationships in the SVN model, but the sample space of important network
statistics is centered on the focal organization and therefore omits those cycles
bypassing the focal organization, which may cause distortions of the network
structure from a descriptive perspective, as well as of the resulting stakeholder
strategies from an instrumental perspective;
Strategy Implementation: Last but not least, the SVN analysis does not provide
practical guidelines to effectively implement the derived strategies for
stakeholder engagement (for example, how to avoid the problems of moral
hazard and free-riding in the generalized exchanges), and these guidelines are
much desired in the real world.
Organized by the workflow of the SVN analysis, the above is a list for the known
limitations of the methodological framework described in Figure 3-1. Although this is by
no means a complete list, one should not be intimidated by the number of those
limitations—as wisely commented by Box and Draper [1987, p. 424], “Essentially, all
models are wrong, but some are useful.” and “Remember that all models are wrong; the
practical question is how wrong do they have to be to not be useful.” [Box and Draper,
1987, p. 74]—articulating these limitations will actually help with the appropriate usage
of the SVN approach and also the identification of the directions for further development
and improvement.

- 131 -
Specifically, the above five limitations will be addressed one by one in the following
sections and chapters (Note that such an arrangement is aligned with the dissertation
architecture shown in Figure 1-1):
Relational Approach: In Section 3.3, a conceptual process is proposed to integrate
the SVN and Strategic Issue Management; and In Chapter 4, Project Phoenix is
taken as an example to demonstrate how to integrate the SVN analysis with the
Strategic Issue Management to obtain more insights on stakeholder balance.
Value Propagation: In Section 3.4, a utility model of the generalized exchanges is
established to improve the calculation for the scores of value cycles in the
stakeholder network; and In Chapter 4, the improved calculations derived from
this utility model are applied through the Project Phoenix.
Computational Platform: In Chapter 5, using the technique of the Dependency
Structure Matrix (DSM), a more powerful computational platform is developed
with the Java language; and In Chapter 6, China’s Energy Conservation
Campaign is taken as an example to demonstrate the strength of this new platform
in dealing with large-size networks.
Egocentric Distortion: In Chapter 5, a new category of network statistics are
constructed to interpret the implications of the SVN from the standpoint of the
whole network instead of a focal organization; and In Chapter 6, these new
statistics are applied to hierarchical modeling for China’s Energy Conservation
Campaign.
Strategy Implementation: In Chapter 4 and 6, practical guidelines are discussed to
implement the stakeholder strategies for a retrospective case (i.e., Project
Phoenix) and for a prospective case (i.e., China’s Energy Conservation
Campaign), respectively.
3.3 Extension A: Integration of Stakeholders and Issues
3.3.1 Rationales behind the Integration
- 132 -
As discussed in Chapter 2, the integration between stakeholders and strategic issues
provides a unique research opportunity for this dissertation, and the rationales behind
such an integration are mainly three-fold:
It is necessary to have this integration because stakeholder relationships and issue
evolutions are delicately intertwined with each other (see Table 2-1): On one
hand, stakeholders may be involved in multiple issues [Mahon, Heugens, and
Lamertz, 2004], and on the other hand, the interaction of multiple issues may
deviate from their normal life cycles because of the awareness of and the
influence from stakeholders [Bigelow, Fahey, and Mahon, 1991, 1993]. Bigelow,
Fahey, and Mahon [1993] also summarized: “Stakeholders are only mobilized
around issues, and issues only emerge when stakeholders advocate them.”
It is important to have this integration because each method has its own strength
and weakness: As discussed previously, the concept of “Issues” is currently
missing in the framework of the SVN analysis, and such an ignorance causes two
major shortcomings—From the analytical perspective, without the consideration
of “Issues”, it is difficult to see through the causal mechanisms behind the
different stakeholder balance (see Figures 3-22 ~ 3-25) and formulate the
corresponding strategies, as once pointed out by Granovetter [1973, p. 1378]:
“Treating only the strength of ties ignores, for instance, all the important issues
involving their content”; And from the computational perspective, compared to
the “Issues”, stakeholder relationships and the types of stakeholder relationships
(i.e., Political, Information, Goods/Service, and Financial) are neither a justifiable
choice nor a practical principle to restructure the large-size networks so that the
modeling complexity can be effectively managed.
“Relations” are more fundamental than “Actors”: Based on the Social Exchange
Theory (SET), the attributes of “Actors”, such as Power or Centrality, are actually
emerging and evolving in a complex structure of exchanges of resources [Cook,
1990, pp. 115-116], and therefore the “Relations”, especially the exchange
relationships, are a more fundamental phenomenon for the network analysis in

- 133 -
social sciences. This is the reason why we propose to integrate the Strategic Issue
Management with the SVN analysis, instead of with the Stakeholder Theory
directly. As criticized by Rowley [1997], most extant stakeholder research is
based on the attributes of stakeholders rather than the relationships among them—
we concur with Rowley’s critical comment, and consider this is a questionable
exercise of putting the “effect” prior to the “cause”, which even exists in the
widely acclaimed theory of Stakeholder Identification and Salience [Mitchell,
Agle, and Wood, 1997].
3.3.2 Conceptual Process for the Integration
Based on the above rationales and the limitations of similar proposals, we now
conceptualize the following process to integrate the Strategic Issue Management into the
four-step framework of the SVN analysis (see Figure 3-1):
Issue Identification: After mapping stakeholders’ specific needs as value flows,
the primary issues of concern to different stakeholders can be identified with a
specific and appropriate definition of strategic issues in the SVN environment.
Stakeholder Re-Identification: If the number of value flows is much larger than
that of strategic issues in the network, and the computational capability of the
SVN modeling tool is also challenged, those stakeholders in similar positions
(support or opposition) around issues can be grouped together, in addition to the
clustering rules of aggregation (role/function) and hierarchy (control/jurisdiction)
introduced at the beginning of this chapter.
Issue Networks: Once all the value flows are quantified through the stakeholder
questionnaire, the SVN model can be decomposed into several smaller network
models organized by the issues identified before, and these smaller network
models are also named as “Issue Networks” [Frooman, 2010; Lucea, 2007] in this
dissertation. Within each issue network, the modeling complexity is managed
because of the smaller number of stakeholders and value flows. Meanwhile, cross
these issue networks, the causal mechanism behind different stakeholder balance

- 134 -
can be better understood than in the previous method which analyzes the whole
SVN model, or decomposes the SVN model by the type of value flows.
Iterative Application: The above three techniques can be applied in an iterative
manner to reduce the dimensionality of large SVN models, until the appropriate
level of abstraction is reached with the criteria of both analytical significance and
computational feasibility.
Figure 3-26 visualizes the updated methodological framework of the SVN analysis with
the above integrative process (see Step 1.5 and 2.5), which will be exercised for and then
refined by the case study of Project Phoenix in Chapter 4.
Figure 3-26: Issue-Integrated Framework of the SVN Analysis
3.4 Extension B: Utility Model for Generalized Exchanges
Inputs/Outputs Steps Techniques
Step 1: Mapping
Step 1.5: Issue Scanning
Step 2: Quantifying
Step 2.5: Issue Decomposing
Focal Organization, Stakeholders, and Their Roles, Objectives, and Needs
Qualitative Model of the SVN
Document Survey, Stakeholder Interview, Network Visualization
Updated Qualitative Model of the SVN
Issue Identification and Stakeholder Re-Identification
Quantitative Model of the SVN
Stakeholder Questionnaire, Value Flow Scoring, Value Propagation Rule
Qualitative and Quantitative Models of the Issue Networks
Stakeholder Re-Interview, Network Visualization, Issue Questionnaire
Itera
ting
Step 3: Searching
All the Value Paths Beginning from and Ending with the Focal Organization
Object-Process Network (OPN)
Step 4: Analyzing
Important Paths/Outputs/Stakeholders/Flows for the Focal Organization
Network Measurements Definition and Network Statistics Construction

- 135 -
The main goal of this section is to establish a utility model for generalized exchanges in
order to derive a “justifiable” and “feasible” mean to calculate the scores of value cycles
in the stakeholder network. As introduced in the RuSakOil example, the calculation for
the scores of value flows, or the subjective utility of stakeholders’ needs, is firmly based
on the Multi-Attribute Utility Theory (MAUT) [Edwards, 1977; Keeney and Raiffa,
1976]. However, the multiplicative rule (see Equation 3-2) used to calculate the scores of
value cycles, or the relative importance of generalized exchanges for a focal organization,
has not been justified yet, although it is simplified enough and intuitively reasonable, in
the sense that the scores of longer cycles are punished to reflect the difficulty of engaging
more stakeholders in an indirect way.
This section is divided into two parts: First, a utility model for generalized exchanges is
constructed step by step to address the “justifiable” consideration, and the related key
assumptions are also discussed. And then, once the model is at hand, an approximation
equation for the calculation of value cycle scores is derived to address the “feasible”
consideration. In the next chapter, for the Project Phoenix case, this approximation
equation will replace the previous multiplicative equation (see Equation 3-2) to calculate
the scores of value cycles and improve the results of the SVN analysis. In addition, note
that most contents of this section are directly based on a journal article [Cameron,
Crawley, Feng, and Lin, 2011] published by the MIT System Architecture Group
including the author of this dissertation.
3.4.1 Construction of the Model
First of all, several desired behaviors of this utility model are articulated as below:
Non Satiation: More of an input is always better;
Diminishing Marginal Rates of Substitution: Stakeholders prefer a mix of goods
over only one good;

- 136 -
Parallel Computation: The merit of each value cycle can be computed
independently of the other cycles through the network;
Cost Benefit Tests: Analysis should indicate which value cycles do not provide
the minimum return.
Specifically, the decision behavior of each stakeholder including the focal organization
(a.k.a., the reference stakeholder) is modeled using the following four equations (see
Equations 3-7 ~ 3-10), illustrated by a simplified two-input problem shown in Figure 3-
27. In this sense, we are attempting to bridge the input-output model by Donaldson and
Preston [1995] with the SVN model.
Figure 3-27: Notation for Single Stakeholder Problem
Utility
As defined in Equation 3-7, the utility (U) of each stakeholder is a function of the
strength of the Need (n), and the amount of Input (I), where the Input 1 of Stakeholder A
is equivalent to the Output 1 of Stakeholder O. Further, it is assumed that the focal
organization has a non-linear utility function, and the non-linearity is adjusted by the
exponent “α”, ranging [0, 1]; while the utility function of its stakeholders is assumed to
be linear (α = 1), because the non-linear utility of each stakeholder will couple the
network together—it will be shown later that linear utility functions for the stakeholders
Focal Organization
(SH O)
Stakeholder A
(SH A)
OO1
OO2
OA1
OA2
nO2A nO1A
nA2O nA1O

- 137 -
of the focal organization are sufficient to produce the diminishing marginal rates of
substitutions.
Uin = n1I1α + n2I2
α (Equation 3-7)
Resources Received
As shown in Equation 3-8, resources (R) are defined as a function of utility (U) to convey
that the monetary and nonmonetary outputs produced by the focal organization are
sourced from the inputs it receives. The constant “p” captures the propensity of the
stakeholder to convert its received utility into outputs, in order to avoid the dynamic
implications of the accrual of utility stocks because of the static nature of the SVN model.
In addition, such a propensity constant may be useful for differentiating among for-profit
and non-for-profit stakeholders.
R = pUout (Equation 3-8)
Resource Utilization
Outputs are constrained by available resources, and two types of resource models are
explored here: In some cases such as material resources, outputs (O1 and O2) compete for
resources (R) (see Equation 3-9a); In other cases such as information resources, outputs
do not compete for resources (see Equation 3-9b)—equivalently, the marginal cost of
producing or changing additional units is zero.
R =O1 +O2 (Equation 3-9a)
R =O1 & R =O2 (Equation 3-9b)
Satisfaction
As shown in Equation 3-10, satisfaction (S) is defined as the generalization of profit and
at the equilibrium condition. In addition, S is constrained to be non-negative to reflect the
reality that generating profit is the necessary condition to engage a stakeholder into value
exchanges.

- 138 -
S =Uin −Uout ≥ 0 (Equation 3-10)
In order to demonstrate the solution method for this problem (see Figure 3-27), the
outputs in the following exchange will be solved. Interspersed with the solution are
modeling decisions made to generate a closed, direct solution.
As it stands, the problem has two objective functions (maximizing the satisfactions of the
Focal Organization and Stakeholder A) and six constraints (Equations 3-7 ~ 3-9a for the
Focal Organization and Stakeholder A) in four variables (OO1, OO2, OA1, and OA2) with
seven constants (nA1O, nA2O, nO1A, nO2A, pO, pA, and α). Optimizing for the maximum
combined satisfaction of the two players is underdetermined and heavily coupled.
To make the problem solvable, two important assumptions are made below:
Egocentric Focal Organization: The satisfaction of all other stakeholders is
constrained to zero, leaving only the focal organization’s satisfaction in the
objective function. While mathematically convenient, this assumption echoes the
rationale for network measurements (i.e., WSO, WOO, WIO, and WVFO)
defined in the SVN analysis and also best represents the focal organization’s
outlook—maximize the long-term profitability of the organization, where the
distinction “long-term” is specifically interpreted as retaining stakeholders via
non-negative satisfaction, and the word “profitability” represents the non-negative
satisfaction and is an extension of the economic profits in traditional sense.
Transparent Production Function: The problem is also decoupled into its
constituent value cycles. In order to do so, the input-output mappings must be
tracked—for example, the contribution of OO1 toward the creation of OA1. This
necessarily surfaces the implicit assumptions about the production function of
Stakeholder A. In more complex cases it has been found convenient to specify the

- 139 -
input-output mappings, reflecting the fact that not all inputs are simultaneously
required to produce each output of the focal organization.
Given the decoupled, constrained cycle problem, each output’s contribution to the
satisfaction of the focal organization can be analyzed. Conveniently, it can be shown that
this system of equations is linear in these contributions, and therefore, superposition can
be used to reconstruct the total satisfaction achieved and the desired prioritization of
outputs. Substituting Equations 3-7 ~ 3-9a into Equation 3-10, the contribution of O1 to
the focal organization’s satisfaction is shown as below:
(SO )O1 = nA1O (panO1AOO1)α + nA 2O (panO1AOO1)
α − OO1
po (Equation 3-11)
Given this formulation, weak cycles, in terms of cycle scores, can be pruned. If assuming
a unit output and a known value of po, it can be computed whether or not the contribution
to satisfaction is greater than zero. Cycles not providing positive satisfaction should be
excluded from further considerations. This rough cost/benefit calculus effectively reduces
the complexity of this model. After pruning, the outputs that maximize satisfaction can be
calculated next:
OO1max = (αpo)
11−α (nA1O + nA 2O )
11−α (panO1A )
α1−α (Equation 3-12)
Given the system is symmetrical in O1 and O2, the solution for OO2 can be inferred, which
demonstrates that it is less than the resource constraint.
Figure 3-28 shows the feasible solution space and the optimal allocation of resources for
the simplest value exchange, with one flow in either direction. It is observed that the non-
linearity in utility at the focal organization (i.e., the firm in the figure) is sufficient to
produce an interior solution, consistent with the formulation exhibiting the diminishing
marginal rates of substitution among the inputs to the focal organization. Meanwhile, the
fully non-linear solution can also be superimposed, to demonstrate the compromise made
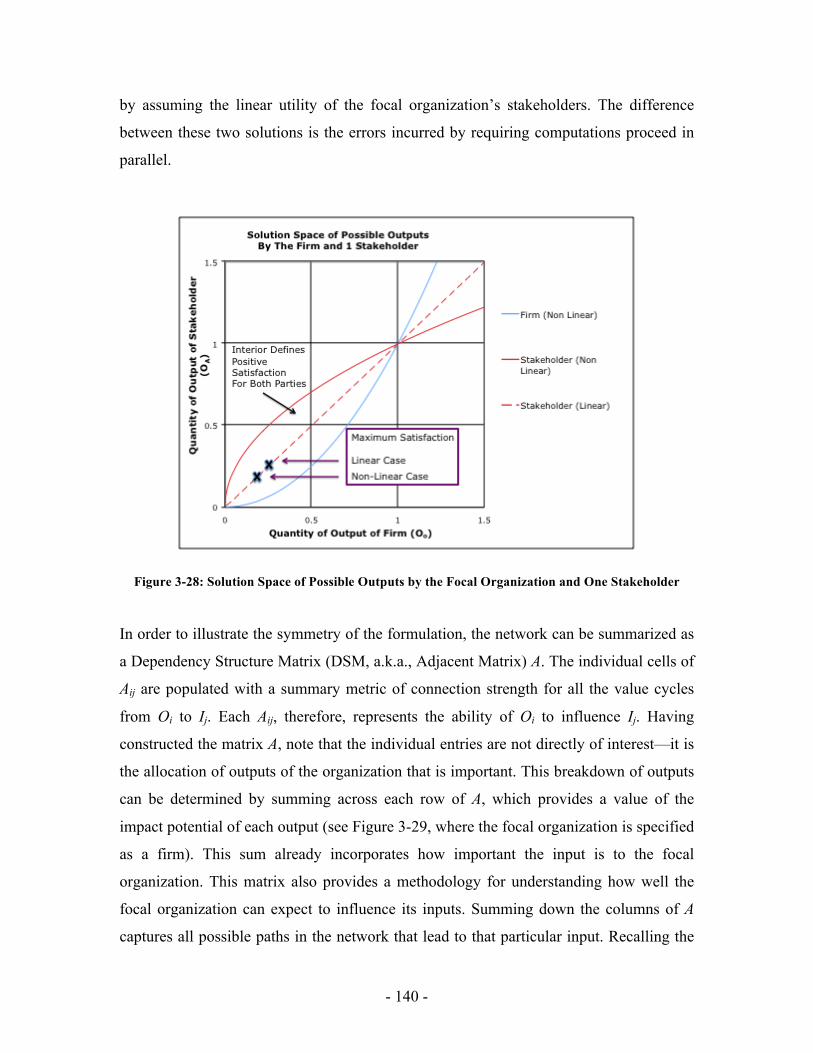
- 140 -
by assuming the linear utility of the focal organization’s stakeholders. The difference
between these two solutions is the errors incurred by requiring computations proceed in
parallel.
Figure 3-28: Solution Space of Possible Outputs by the Focal Organization and One Stakeholder
In order to illustrate the symmetry of the formulation, the network can be summarized as
a Dependency Structure Matrix (DSM, a.k.a., Adjacent Matrix) A. The individual cells of
Aij are populated with a summary metric of connection strength for all the value cycles
from Oi to Ij. Each Aij, therefore, represents the ability of Oi to influence Ij. Having
constructed the matrix A, note that the individual entries are not directly of interest—it is
the allocation of outputs of the organization that is important. This breakdown of outputs
can be determined by summing across each row of A, which provides a value of the
impact potential of each output (see Figure 3-29, where the focal organization is specified
as a firm). This sum already incorporates how important the input is to the focal
organization. This matrix also provides a methodology for understanding how well the
focal organization can expect to influence its inputs. Summing down the columns of A
captures all possible paths in the network that lead to that particular input. Recalling the
!

- 141 -
network measurements defined previously for the RuSakOil, astute readers can
immediately find that the sum score of each row is actually the WOO of that output, the
sum score of each column is the WIO of that input, and the “Influence Matrix” shown in
Figure 3-29 is essentially the same as the “Conversion Matrix” shown in Table 3-7.
Figure 3-29: Influence Matrix Aij
3.4.2 The Approximation Equation
As a sanity check on the system can be that the distribution of utilities received by the
focal organization should correspond to a manager’s intuitive understanding for the
relative importance of these inputs. Writing Equation 3-11 in terms of OA1 and OA2
instead of for OO1, Stakeholder A’s outputs at the satisfaction maximizing solution for
OO1_max can be shown as below:
(OA1max )O1 = (αpopAnA1OnO1A )
11−α (Equation 3-13a)
(OA1max )O2 = (αpopAnA1OnO2A )
11−α (Equation 3-13b)
(OA1max ) = (OA1
max )O1 + (OA1max )O2 = (αpopAnA1O )
11−α (nO1A
11−α + nO2A
11−α ) (Equation 3-13c)
If the same process is followed to generate for OO2_max, their ratio can be calculated in
Equation 3-14:
!

- 142 -
OA1max
OA 2max =
nA1O( )11−α
nA 2O( )11−α
(Equation 3-14)
Substituting Equation 3-14 into Equation 3-7, and taking the ratio of the instantiations for
A1 and A2, Equation 3-15 can be obtained:
UA1
nA1O( )11−α
= UA 2
nA 2O( )11−α
(Equation 3-15)
Having solved a simplified case, it is easy to extrapolate the solution with n vertices
(stakeholders) along a value cycle (generalized exchange). For each cycle through the
network with Stakeholder A, B, …, Z, starting with OO1, the contribution to that Output’s
importance can be shown in Equation 3-16:
OO1cycle1 = (α po )
11−α (nZ1O )
11−α (pa pb ...pznO1AnA1B ...nY1Z )
α1−α
(Equation 3-16)
The above equation is a very important result in this dissertation, and actually, it is the
right answer for which this section has searched. Derived from the utility model of
generalized exchanges constructed here, Equation 3-16 provides a justifiable way to
quantify the relative importance of value cycles, which are then taken as the basic units to
interpret the impacts of indirect stakeholder relationships, from the perspective of a focal
organization.
Specifically, when α = 0.5, Equation 3-16 changes into a concise format:
OO1cycle1 = (0.25po
2pa pb ...pz )(nO1AnA1B ...nY1Z )(nZ1O )2
(Equation 3-17)

- 143 -
Deleting the constant items from Equation 3-17, the desired approximation equation for
the calculation of value cycle scores is finally written as:
OO1cycle1 = (nO1AnA1B ...nY1Z )(nZ1O )
2 (Equation 3-18)
It is observed that Equation 3-18 is amazingly similar to the multiplicative equation (see
Equation 3-2) chosen before, except that the utility score of the last value flow in the
cycle, or the input flow to the focal organization, is multiplied twice instead of once.
Based on the fact that the input value flows are the graphical representation for the
specific needs of the focal organization, we argue there can be a profound implication
behind the minor difference between Equation 3-18 and Equation 3-2—by multiplying
the utility score of the last value flow one more time, it reflects the discrimination of the
focal organization against other value flows than the last one which satisfies the focal
organization’s own needs—on one hand, this discrimination exactly reflects the
egocentric assumption stated before; on the other hand, this discrimination can also lead
to distortions on interpreting the exchange and structure properties of other stakeholders
in the network, which is the limitation of “Egocentric Distortion” listed in the end of last
section. Another way easier for scientists and engineers to understand this minor
difference, we suggest, is to take the one more multiplication of the last value flow as the
“transformation coefficient” from a fairness-based value system to an egocentric value
system, just like the “transformation coefficient” between different coordination systems
in mathematics and physics.
Finally, for the convenience of quotation, we name Equation 3-2 as the “abc” rule
hereafter, while by contrast, we name Equation 3-18 as the “abc2” rule, which will be
applied to calculate the value cycle scores in the Project Phoenix case in Chapter 4.
3.5 Chapter Summary

- 144 -
Organized into three major sections, this chapter mainly develops the methodological
framework for analyzing the SVN from the perspective of a focal organization: First of
all, a four-step modeling framework for the SVN analysis is elaborated in detail step by
step, with a simplified multinational energy project as the running example; Second,
responding to the limitations of this basic framework, two important extensions are
proposed.
The first proposed extension is the integration of Strategic Issue Management with the
SVN analysis, in order to reveal additional insights into the strength balance between
stakeholders, as well as to manage the complexity of the network models for the
computational feasibility. The second extension is the construction of a utility model of
generalized exchanges to help derive a justifiable and feasible method to calculate the
scores of value cycles, which are taken as the basic units for understanding the impacts of
indirect stakeholder relationships in the SVN.
Next, in Chapter 4, the four-step modeling framework along with the above two
extensions will be applied to analyze the SVN of a large real-world engineering project,
that is, Project Phoenix. In return, the results from this retrospective case study will be
used to validate the strength of the framework discussed in this chapter. Combining these
two chapters together, the first module of the main body of this dissertation is complete
(see Figure 1-1), and one is ready to conduct the SVN analysis from the perspective of a
focal organization.

- 145 -
CHAPTER 4. CASE STUDY I: PROJECT PHOENIX
“Fifty years ago, the main challenges to large
infrastructure projects were technical or scientific. Today,
the greatest hurdles faced by such projects are almost
always social and / or political.”
— McAdam, Boudet, Davis, et al. [2010, p. 401]
4.1 Chapter Introduction
In this chapter we apply the SVN framework previously illustrated in Chapter 3 to Project
Phoenix, a large real-world engineering project. By comparing the most important
stakeholders derived from Managers’ Mental Model with those identified by the WSO
(Exchange Centrality) in the “Hub-and-Spoke” and “Network” (SVN) models, we
successfully demonstrate the strength of the SVN analysis, especially in understanding
the impacts of indirect stakeholder relationships from the perspective of a focal
organization.
The SVN Model we apply in this chapter incorporates two major extensions to the
simplified RuSakOil example of Chapter 3 that together improve both the descriptive
accuracy and instrumental power of the SVN analysis, especially on the balance of
stakeholder relationships emerging from the network of value exchanges. First, we
integrate an alternative way of mapping an organization’s “institutional fields”
[Dimaggio and Powell, 1983; North, 1990, 1991; Scott, 1987, 2002, 2005], the Strategic
Issue Management [Ansoff, 1980; Arcelus and Schaeffer, 1982; Bartha, 1983; Bigelow,
Fahey, and Mahon, 1991, 1993; Chase, 1982, 1984; Dutton and Duncan, 1987; Johnson,
1983; Mahon and Waddock, 1992] through the concept of “Issue Networks” [Frooman,
2010; Lucea, 2007; Lucea and Doh, 2012]. Second, we incorporate a new rule for value
propagation to calculate the scores of value cycles for the focal organization, including

- 146 -
the value cycle scores in those newly developed “Issue Networks”. This “abc2” rule,
obtained from a rigorous utility model of Generalized Exchanges [Cameron, Crawley,
Feng, and Lin, 2011], replaces the multiplicative “abc” rule we used earlier.
4.2 Case Description and Project Phoenix Managers’ Mental Model
Project Phoenix is a major “brownfield project” being implemented by a
Global 500 firm in one of its older operating facilities in the United States.
It is integrated into a complex processing facility that is undergoing a
change in the mix of feedstocks and chemical products. Many of these new
feedstocks come from an adjacent country. In the early 2000s, the focal
firm announced Project Phoenix, to expand the unit’s production capacity
and equip it to deal with a new mix of feedstocks and chemical products.
At the time of the announcement, the project was expected to require a
multi-billion dollar investment and five years to complete.
In the first year of the project, the firm successfully obtained new
environmental permits from the host state’s Environmental Protection
Agency (EPA). The new permits allow the facility to increase the emission
levels of certain chemicals. Even though the increased levels still comply
with EPA environmental standards, this situation ignited a firestorm of
protest in the public media and from local public from surrounding
communities that had not been anticipated by Project Phoenix’s
managers. After a several-month negotiation, the owner finally promised
to keep the original emission levels and admitted that they might be forced
to cancel Project Phoenix as a result.
Although subsequently the Project Phoenix’s managers found that the
Project could be completed within the original discharge limits and

- 147 -
actually also proceeded with it, significant delay and escalation of cost
have been made to the project. The analysis of this case study focuses on
the initial period ending with the strong public pushback.
Figure 4-1: Project Phoenix Production Process (viz., Goods/Service Flows)
From the above introduction, which is based on the public information, it is reasonable to
infer that before experiencing the unexpected protest, the most important stakeholders in
Project Phoenix Managers’ Mental Model were the Host State Government and the U.S.
Federal Government. We confirmed this observation through multiple rounds of
interviews with Project Phoenix’s managers. Managers had not paid enough attention to
the Public Media and the Local Public, and this resulted in significant delay and
increased cost to the project as well as serious damage to the image of the project’s owner
later on.
Following Denzau and North [1994, p. 4], we define the “mental model” as the “internal
representations that individual cognitive systems create to interpret the environment”,
because “cognitive systems construct models of the problem space that are then mentally
‘run’ or manipulated to produce expectations about the environment” [Holland et al.,
1986, p. 12]. Further, under conditions of uncertainty, “individuals with common culture
backgrounds and experiences will share reasonably convergent mental models” [Denzau
and North, 1994, p. 3], and we found that the above mental model had been widely
shared by Project Phoenix’s managers before they saw the firestorm of protest in 2007.
Note that the time window of this case study has been narrowed down to 2006~2007,
during which Project Phoenix was announced and then met unexpected protest from the
Public Media and the Local Public. In other words, this is a “retrospective” case study.
As discussed in Chapter 3, the SVN Model is essentially one static “snapshot” of the
value exchanges between stakeholders at a specific temporal stage. As a result, the main
Feedstock Country Producers
Feedstock Country Transportation
Owner / Project Phoenix
Product Consumers
Feedstocks Chemical Products Feedstocks

- 148 -
purpose of the SVN analysis in this chapter is to explore the reasons why the Public
Media and the Local Public were missed in the short list of the most important
stakeholders in Project Phoenix Managers’ Mental Model, rather than to formulate
effective strategies for managing the relationships with those stakeholders16. Using
Donaldson and Preston’s [1995, p. 65] terminology, the SVN analysis in this chapter is
more “descriptive” than “instrumental”.
In addition, because the case study of the Project Phoenix is a retrospective one, it was
very important for us to remind all the stakeholder representatives that they should not
apply their “later” experience (viz., after seeing the protest from the Public Media and
Local Public) in answering the stakeholder questionnaire for value flow scoring in the
second step of the SVN analysis (see Figure 3-1). Such experience will become the
“noise” clouding the process to discover the reasons behind the absence of two important
stakeholders (viz., Public Media and Local Public) in the Managers’ Mental Model.
With this “prior” information for the Project Phoenix, we constructed a “Network” Model
consisting of stakeholders and their exchange relationships within the framework of the
SVN analysis. We also constructed a traditional “Hub-and-Spoke” Model by examining
only the direct and bilateral value exchanges (viz., pairs of value flows, or “restricted
exchanges”) between Project Phoenix and its stakeholders. Using the WSO statistic
defined in Chapter 3, we then extracted two short lists of the most important stakeholders
for Project Phoenix (viz., the focal organization) from the “Network” and “Hub-and-
Spoke” models respectively and compared them with the Managers’ Mental Model.
4.3 The SVN Analysis and Comparisons of Three Models
In Chapter 3, the methodological framework of the SVN analysis is decomposed into four
major steps—“Mapping”, “Quantifying”, “Searching”, and “Analyzing” (see Figure 3-1).
16 In Chapter 6 we develop a normative analysis on a “prospective” case study of China’s Energy Conservation Campaign.

- 149 -
Since the general purpose and techniques of each step are elaborated in detail in the
context of the RuSakOil case of Chapter 3, we only presents the key results of each step
in the case study of Project Phoenix, with necessary discussion on practice cautions and
method variations. Specifically, in the last step, the SVN analysis for the Project Phoenix
case culminates with the comparison of important stakeholders between three models,
that is, Managers’ Mental Model, the “Hub-and-Spoke” Model, and the “Network”
Model, to demonstrate the strength of the SVN approach in understanding the impacts of
indirect stakeholder relationships, especially from the perspective of a focal organization.
4.3.1 Step One: Mapping
We utilize publically available information collected from news, reports, websites,
stakeholder policy and strategy documents, as well as the multi-round interviews with
Project Phoenix’s managers at the operating facility, to identify a manageable list of
stakeholders. In Chapter 3, three methods [Calvert, 1995; Cleland, 1998; Crawley, 2009;
Mitchell, Agle, and Wood, 1997; Winch, 2004] are introduced and then combined as a
practical guidance for stakeholder identification. Table 4-1 summarizes the relationships
between each identification method and the stakeholder list for Project Phoenix. For the
convenience of discussion, we will typical refer to these 14 stakeholders by their
acronyms.
Next, with the help of the stakeholder characterization template introduced in Chapter 3,
each stakeholder’s roles, objectives, and specific needs are clearly articulated step by
step. Figure 4-2 takes the Local Governments (LOG) as an example to illustrate again the
application of such a template. Based on these templates, the specific needs of
stakeholders are mapped as four types of value flows (viz., political, information,
goods/service, and financial flows, see Figure 3-7) running into them, which together
constitute the qualitative SVN Model.

- 150 -
Table 4-1: Stakeholder Identification for Project Phoenix
Stakeholder (Abbreviation)
Identification Approach
Crawley [2009] Calvert [1995], Cleland [1998], Winch [2004]
Mitchell, Agle, and Wood [1997]
Local Governments (LOG) Institutions External/Public; Nonmarket Expectant Stakeholder
Host State Government (HSG) Institutions External/Public; Nonmarket Definitive Stakeholder
Adjacent State Representatives (ASR) Interests External/Public; Nonmarket Latent Stakeholder
U.S. Federal Government (UFG) Institutions External/Public; Nonmarket Definitive Stakeholder
Feedstock Country Government (FCG) Beneficiaries External/Public; Nonmarket Latent Stakeholder
Feedstock Country Transportation (FCT) “Stake” Holders Internal/Supply; Market Definitive Stakeholder
Feedstock Country Producers (FCP) “Stake” Holders Internal/Supply; Market Definitive Stakeholder
New Tech Generators (NTG) “Stake” Holders Internal/Supply; Market Expectant Stakeholder
Contractors/Suppliers/3rd Parties (CSP) “Stake” Holders Internal/Supply; Market Expectant Stakeholder
Local Public (LOP) Users Internal/Demand; Market Expectant Stakeholder
Public Media (PUM) Interests External/Private; Nonmarket Expectant Stakeholder
NGO (NGO) Interests External/Private; Nonmarket Expectant Stakeholder
International Finance (INF) “Stake” Holders Internal/Demand; Market Definitive Stakeholder
Project Phoenix (PP) The Focal Organization
Figure 4-2: Stakeholder Characterization Template for Local Governments (LOG)
ROLE: Serve for the Local Public
OBJECTIVES: Develop the Local Economy Protect the Local Environment Sustain/Increase Political Support
SPECIFIC NEEDS: Taxes Employment Cheap Chemical Products Environmental Protection Political Support from State Governments Support from Local Public Support from Public Media
INPUTS (VALUE FLOWS): Taxes from PP Economic Stimulation from PP Environmental Compliance from PP Political Support from HSG Political Support from ASR Support from LOP News from PUM
LOCAL GOVERNMENTS (LOG)

- 151 -
For the Project Phoenix case, Figure 4-3 visualizes the qualitative SVN Model in the
format of stakeholder map, which includes 14 stakeholders and 74 value flows in total.
Note that the SVN Model of the Project Phoenix case is much larger than the one of the
RuSakOil case, which included only 9 stakeholders and 27 flows. In addition, for the
Project Phoenix case, on average each stakeholder has five value flows.
The resulting stakeholder map is decomposed into different views by the types of value
flows: Figure 4-4 presents the political flows, Figure 4-5 presents the information flows,
Figure 4-6 presents the goods/service flows, and Figure 4-7 presents the financial flows.

- 152 -
Figure 4-3: Stakeholder Map for the Project Phoenix
Taxes
Local Public
Owner
Local Governments Host State Government
Owner Corporation
Owner Distribution
Project Phoenix
New Tech Generators
Contractors/Suppliers/
Third Parties
Intl. Finance(Owner
Shareholders and Bond Holders)
Product Consumers
Feedstock Country
Producers
EPAAdjacent State Representatives
Oversight Committee
NGO
Investment
Rev
enue
Inve
stm
ent
Compliance
Oversight
Concerned Neighbors
U.S. Federal Government
EPA Congress (House)
Compliance
Oversight
Public MediaOpinions
News
Pol
itica
l Inf
luen
ce
Political Influence
National Permits
Local Permits
Environmental “Approval”
Information
Opinions
News
Environmental Satisfaction
Employment
Spe
cific
atio
ns
Raw
Mat
eria
lsP
aym
ent
Pro
fit
OpinionsNews
New
Tec
hTe
ch A
ssur
ance
Tech
Dem
and
Pay
men
t
Revenue
Em
ploy
men
t
Chemical Products
Env
ironm
enta
l Miti
gatio
n
Support
Political Support
Support
Local Government Service
Tech Assurance Information
Eco
nom
ic S
timul
atio
n
Strategy Supply Security
Taxe
s
Taxes
Env
ironm
enta
l Com
plia
nce
New
s
Opi
nion
sN
ews
New
s
Opi
nion
s
New
sOpinions
Opi
nion
s
Economic Stimulation
Local Government B
Local Government A
Opi
nion
s
New
s
Environmental Justice
Boundary Conditions
Frie
ndly
Env
iron
Pol
icy
Frie
ndly
Env
iron
Pol
icy
Inve
stm
ent
Feedstock Country
Transportation
Feedstock Country
Government
Reg
ulat
ions
Regulations
Tran
spor
tatio
n Fa
cilit
ies
Pay
men
t
Taxe
s
Taxe
s
Sup
port
Sup
port
Influence
Influ
ence
New
s
Tech
Aw
aren
ess
Loca
l Inf
rast
ruct
ure
Regulatory CompliancePolitical Influence
Payment
Equ
ipm
ent a
nd S
ervi
ce
Sup
port
Opi
nion
sSup
port

- 153 -
Figure 4-4: Political Flows in the Stakeholder Map
Figure 4-5: Information Flow in the Stakeholder Map
Local Public
Owner
Local Governments Host State Government
Owner Corporation
Owner Distribution
Project Phoenix
New Tech Generators
Contractors/Suppliers/
Third Parties
Intl. Finance(Owner
Shareholders and Bond Holders)
Product Consumers
Feedstock Country
Producers
EPAAdjacent State Representatives
Oversight Committee
NGO
Compliance
Oversight
Concerned Neighbors
U.S. Federal Government
EPA Congress (House)
Compliance
Oversight
Public Media
Pol
itica
l Inf
luen
ce
Political Influence
Env
ironm
enta
l Miti
gatio
nSupport
Sup
port
Support
Political Support
Support
Local Government Service
Strategy Supply Security
Env
ironm
enta
l Com
plia
nce
Local Government B
Local Government A
Environmental Justice
Frie
ndly
Env
iron
Pol
icy
Frie
ndly
Env
iron
Pol
icy
Feedstock Country
Transportation
Feedstock Country
Government
Sup
port
Sup
port
InfluenceInfluence
Regulatory CompliancePolitical Influence
Local Public
Owner
Local Governments Host State Government
Owner Corporation
Owner Distribution
Project Phoenix
New Tech Generators
Contractors/Suppliers/
Third Parties
Intl. Finance(Owner
Shareholders and Bond Holders)
Product Consumers
Feedstock Country
Producers
EPAAdjacent State Representatives
Oversight Committee
NGOConcerned Neighbors
U.S. Federal Government
EPA Congress (House)
Public MediaOpinions
News
National Permits
Local Permits
Environmental “Approval”
Information
Opinions
News
Environmental Satisfaction
Spe
cific
atio
ns
OpinionsNews
New
Tec
hTe
ch A
ssur
ance
Tech
Dem
and
Tech Assurance Information
Tech
Aw
aren
ess
New
sO
pini
ons
New
sO
pini
ons
New
sO
pini
ons
New
s
Opi
nion
s
Opi
nion
sN
ews
Local Government B
Local Government A
Opi
nion
s
New
s
Boundary Conditions
Feedstock Country
Transportation
Feedstock Country
Government
Reg
ulat
ions
Regulations

- 154 -
Figure 4-6: Goods/Service Flows in the Stakeholder Map
Figure 4-7: Financial Flows in the Stakeholder Map
Local Public
Owner
Local Governments Host State Government
Owner Corporation
Owner Distribution
Project Phoenix
New Tech Generators
Contractors/Suppliers/
Third Parties
Intl. Finance(Owner
Shareholders and Bond Holders)
Product Consumers
Feedstock Country
Producers
EPAAdjacent State Representatives
Oversight Committee
NGOConcerned Neighbors
U.S. Federal Government
EPA Congress (House)
Public Media
Equ
ipm
ent a
nd S
ervi
ce
Raw
Mat
eria
ls
Chemical Products
Local Government B
Local Government A
Feedstock Country
Transportation
Feedstock Country
Government
Tran
spor
tatio
n Fa
cilit
ies
Loca
l Inf
rast
ruct
ure
Local Public
Owner
Local Governments Host State Government
Owner Corporation
Owner Distribution
Project Phoenix
New Tech Generators
Contractors/Suppliers/
Third Parties
Intl. Finance(Owner
Shareholders and Bond Holders)
Product Consumers
Feedstock Country
Producers
EPAAdjacent State Representatives
Oversight Committee
NGO
Investment
Rev
enue
Inve
stm
ent
Concerned Neighbors
U.S. Federal Government
EPA Congress (House)
Public MediaEmployment
Pay
men
t
Pro
fit Pay
men
t
Revenue
Em
ploy
men
t
Eco
nom
ic S
timul
atio
n
Taxe
s
Taxes
Economic Stimulation
Local Government B
Local Government A
Inve
stm
ent
Feedstock Country
Transportation
Feedstock Country
Government
Pay
men
t
Taxe
s
Taxe
s
Payment
Taxes

- 155 -
In addition to the process of stakeholder identification and value flow definition, which is
discussed in detail in Chapter 3 (see Sections 3.2.1.1 and 3.2.1.2), there are four more
topics that require further development in order to better map the SVN in practice. These
topics are Organizational Hierarchy within Stakeholders, Accompanying Documents for
Value Flows, Visualized Insights from Stakeholder Maps, and from “Hub-and-Spoke” to
“Network”:
4.3.1.1 Organizational Hierarchy within Stakeholders
From the stakeholder map shown in Figure 4-3, it is apparent that Project Phoenix (PP),
Local Governments (LOG), Host State Government (HSG), U.S. Federal Government
(UFG), and Local Public (LOP) consist of several “smaller” stakeholders: PP includes the
Owner Corporation, Owner Distribution, and Project Phoenix, which the operating
facility belongs to; LOG includes the Local Government A and the Local Government B;
HSG includes the Environmental Protection Agency (EPA) on the state level and its
Oversight Committee; UFG includes the Environmental Protection Agency (EPA) on the
national level and the U.S. Congress, where the House of Representatives is mainly
involved in this case; and LOP includes the Concerned Neighbors and Chemical Product
Consumers, which can be the same group of local people when they focus their attention
on the needs for different things, that is, clean environment and/or cheap chemical
products.
The main reason for the inclusion of multi-level organizational hierarchy for the above
five stakeholder—PP, LOG, HSG, UFG, and LOP—lies in the factor that these large
organizations or groups play a broad range of roles leading to many different needs. As a
result, it is necessary to understand their internal structures before their specific needs for
value exchanges can be fully identified. For example, within the LOG, Local
Government B may have different opinions on the project than Local Government A,
because the additional taxes from this project only go to the latter (see Figures 4-3 and 4-
7) according to state laws and regulations, but the increased pollution will impact the
natural environment near both governments, perhaps in different ways and different

- 156 -
extents. In addition, we find that in the real world, it is not uncommon for researchers and
practitioners to come up with a long list of stakeholders on various organizational levels
at the beginning, and then gradually understand the hierarchical relationships between
these stakeholders.
In the subsequent analysis, however, the organizational structures of the above five
stakeholders are hidden mainly because of limitations of computational and/or analytical
resources, especially on the current modeling platform, that is, the Object-Process
Network (OPN) [Koo, 2005]. Specifically, the stakeholders in a particular jurisdictional
hierarchy will be clustered together to shorten the long list of stakeholders into a
manageable one usually including less than twenty17 stakeholders.
In Chapter 5, a more powerful modeling platform is developed and new statistical
measurements are constructed for the whole network analysis, making it possible to
model the multiple hierarchies of large stakeholders in terms of the requirements from
both computational and analytical aspects. Consequently, we are able to explore the
principles for hierarchical modeling to advance the SVN analysis to the next level and
will also apply these principles into the case study of China’s Energy Conservation
Campaign in Chapter 6.
4.3.1.2 Accompanying Documents for Value Flows
The second important topic is the accompanying documents for more detailed definitions
of value flows. After many practical applications of the SVN analysis [Cameron, 2007;
Seher, 2009; Sutherland, 2009], we observe that the stakeholder characterization
templates (see Figures 3-2 and 4-2) are not enough to define the value flows precisely,
and therefore different interpretations for the same value flows may exist between
researchers and stakeholder representatives. As a result, the accuracy and credibility of
17 As discussed in Chapter 3, this number represents a “rule of thumb” based on all the existing SVN work in our research group during the past six years, and it should be able to go up with more computational and analytical resources.

- 157 -
the SVN analysis will be negatively impacted, which makes it necessary to have these
accompanying documents.
Table A-4-1 in the Appendix shows an example of the accompanying documents for the
74 value flows in the Project Phoenix case. In general, it is important to define the
providing and recipient stakeholders, as well as the spatial, temporal, and
economic/social contexts of each flow, and also clarify a few places easily leading to
various interpretations. More importantly, considering the iterative nature of the SVN
analysis, these accompanying documents for value flows should be continuously updated
when more information becomes available and/or the situations for previous analysis
have changed, so that the SVN analysis can serve as a common platform for engineering,
external affairs, commercial, and management within a large engineering project to
communicate important information about stakeholders. In addition, these documents
will help researchers and stakeholder representatives surface the implicit assumptions and
share the same understanding before they answer the stakeholder questionnaires to better
quantify the value flows in the second step of the SVN analysis.
4.3.1.3 Visualized Insights from Stakeholder Maps
As demonstrated by the popular work of Tufte [1983, 1990, 1997], visualization can be a
powerful tool generating insights from non-graphic information, and this is also the main
purpose for the SVN analysis to visualize the qualitative SVN models as “stakeholder
maps” before proceeding to build the quantitative SVN models.
In particular, as discussed in Chapter 3, the SVN analysis has designed a color-coding
system (see Figure 3-3) to show different types of stakeholders and value flows in the
stakeholder maps: For stakeholders, the focal organization is colored with light green, the
market stakeholders are colored with light blue, and the nonmarket stakeholders are
colored with light salmon; For value flows, red color represents the political flows, purple
color represents the information flows, blue color represents the goods/service flows, and
green color represents the financial flows. Such a color-coding system is based on the

- 158 -
theories of nonmarket strategy [Baron, 1995] and resource exchange [Foa and Foa, 1971,
1974, 1980], and aims to discover the connections between the types of value flows and
the environment where they are exchanged, as well as other possible principles or
patterns for the value exchanges in the stakeholder network.
Moreover, in order to increase the visibility of large SVN models which include lots of
stakeholders and value flows, stakeholder maps can be decomposed into multiple views
according to different criteria, such as value flow types and project temporal stages. For
the Project Phoenix case, Figures 4-4 ~ 4-7 show the decomposition of the stakeholder
map (see Figure 4-3) by four types of value flows, that is, political, information,
goods/service, and financial flows. Together with the above color-coding system, two
interesting observations for these four figures are made as below:
First, the political and information flows (colored in red and purple, respectively) are
mainly between nonmarket stakeholders (colored in light salmon) and therefore are
mediated by the nonmarket environment, while the goods/service and financial flows
(colored in blue and green, respectively) are mainly between market stakeholders
(colored in light blue) and therefore are mediated by the market environment. This
observation is consistent with Baron’s definitions for the market and nonmarket
environments [1995].
Second, the density of political and information flows (colored in red and purple,
respectively) is much larger than that of goods/service and financial flows (colored in
blue and green, respectively). Beautifully echoed in the recent findings of social
movements scholars [McAdam, Boudet, Davis, et al., 2010, p. 401]: “Fifty years ago, the
main challenges to large infrastructure projects were technical or scientific. Today, the
greatest hurdles faced by such projects are almost always social and/or political”, this
simple observation is actually quite meaningful with regard to its close connection to the
Social Exchange Theory (SET) [Cropanzano and Mitchell, 2005; Zafirovski, 2005] and
will be discussed again when exploring the fundamental reasons for the different results
from three stakeholder models (viz., Project Phoenix Managers’ Mental Model, the

- 159 -
traditional “Hub-and-Spoke” Model, and the “Network” (SVN) Model) in the last step of
the SVN analysis for the Project Phoenix case.
4.3.1.4 From “Hub-and-Spoke” to “Network”
As discussed in Chapter 2, based on the existing management literature, we identify five
different stages for the development of the models for modern firms, from the earliest to
the latest (see Figures 2-3 ~ 2-7, respectively): the Production Model, the Managerial
Model, the Stakeholder Model, the Single-Relational Network Model, and the Multi-
Relational Network Model.
In order to validate the strength of the SVN analysis on understanding the strategic
implications of the indirect stakeholder relationships, three different models will be
compared in terms of their capability of identifying the most important stakeholders for
the focal organization. These three models, namely, Project Phoenix Managers’ Mental
Model, the “Hub-and-Spoke” Model, and the “Network” Model, actually corresponds to
the Managerial Model, the Stakeholder Model, and the Multi-Relational Network Model
in the above discussion, respectively.
Because Project Phoenix Managers’ Mental Model and the “Network” Model have
already been built up through publically available information and multi-round interviews
in the first step of the SVN analysis, it is not necessary starting from scratch to build the
“Hub-and-Spoke” Model for the Project Phoenix. Instead, a reverse and simplified
approach is taken to deduce the “Hub-and-Spoke” Model from the existing “Network”
Model (see Figure 4-3), by only including the direct relationships between the focal
organization and its stakeholders while excluding those indirect relationships as well as
the relationships between the focal organization’s stakeholders. The resulting model is
shown in Figure 4-8.

- 160 -
Figure 4-8: “Hub-and-Spoke” Model for Project Phoenix
4.3.2 Step Two: Quantifying
As discussed in Chapter 3, the goal of the second step of the SVN analysis is to transform
the qualitative SVN Model into a quantitative one, through first quantifying the
subjective utility of each value flow from the standpoint of the recipient stakeholders and
then by defining the propagation rule of value flows in order to calculate the utility score
of each value path or cycle.
The method for value flow quantification in this chapter is slightly different from that in
Chapter 3 based on the consideration that the timing or temporal stage of value exchanges
was a primary concern of many stakeholders for the Project Phoenix. More specifically,
this chapter uses the “Urgency in fulfilling a need” (see Figure 4-9) and “Source
importance in fulfilling a need” (see Figure 4-10) as two utility attributes of value flows
to design the corresponding stakeholder questionnaire (see Table A-4-2 in the Appendix),
and then defines a multiplicative rule (see Figure 4-11), which is similar to that used for
Taxes
Local Public
Owner
Local Governments Host State Government
Owner Corporation
Owner Distribution
Project Phoenix
New Tech Generators
Contractors/Suppliers/
Third Parties
Intl. Finance(Owner
Shareholders and Bond Holders)
Product Consumers
Feedstock Country
Producers
EPAAdjacent State Representatives
Oversight Committee
NGO
Investment
Rev
enue
Inve
stm
ent
Concerned Neighbors
U.S. Federal Government
EPA Congress (House)
Public Media
Local Permits
Information
Spe
cific
atio
ns
Equ
ipm
ent a
nd S
ervi
ce
Pay
men
t
Pro
fit New
Tec
hTe
ch A
ssur
ance
Tech
Dem
and
Pay
men
t
Revenue
Chemical Products
Tech Assurance Information
Eco
nom
ic S
timul
atio
n
Strategy Supply Security
Taxe
s
Taxes
Env
ironm
enta
l Com
plia
nce
Opi
nion
s
Economic Stimulation
Local Government B
Local Government A
Inve
stm
ent
Feedstock Country
Transportation
Feedstock Country
Government
Tran
spor
tatio
n Fa
cilit
ies
Pay
men
t
PaymentTe
ch A
war
enes
s
Loca
l Inf
rast
ruct
ure
New
s
Raw
Mat
eria
ls
Em
ploy
men
tE
nviro
nmen
tal M
itiga
tion
Environmental “Approval”National Permits

- 161 -
the previous RuSakOil case (see Figure 3-9), to combine the scores of these two
attributes in stakeholder questionnaire into a single utility score for each value flow with
the theoretical support from the Multi-Attribute Utility Theory (MAUT) [Edwards, 1977;
Keeney and Raiffa, 1976], as introduced in Chapter 3.
Need Urgency Questionnaire
How would you characterize the urgency of fulfillment of this need?
A. It can be fulfilled after four years from now
B. It should be fulfilled between the third and fourth year from now
C. It should be fulfilled between the second and third year from now
D. It must be fulfilled next year
E. It must be fulfilled this year
Figure 4-9: Stakeholder Questionnaire for Categorizing the Urgency in Fulfilling a Need
Source Importance Questionnaire If this need were to be fulfilled, how important would this specific source be in
fulfilling the need?
1. Not important – I do not need this source to fulfill this need
2. Somewhat important – It is acceptable that this source fulfills this need
3. Important – It is preferable that this source fulfills this need
4. Very important – It is strongly desirable that this source fulfills this need
5. Extremely important – It is indispensible that this source fulfills this need
Figure 4-10: Stakeholder Questionnaire for Categorizing the Source Importance in Fulfilling a Need

- 162 -
Figure 4-11: Combination Rule of Value Flow Attribute Scores
Note that in Figure 4-11, the scale for the Need Urgency Score is designed to be
nonlinear to meet the common assumption in economics for human’s choice over time
[Edwards, 1954; Koopmans, Diamond, and Williamson, 1964; Samuelson, 1937], that is,
the value of the later rewards tends to be discounted by a factor (viz., “discount factor” or
DF) that increases with the length of the delay (with or without uncertainty).
Figure 4-12: Comparison of Three Time Discounting Scales
Sou
rce
Impo
rtan
ce S
core
5 =
0.98
0.11 0.22 0.32 0.65 0.96
4 =
0.78
0.09 0.17 0.26 0.51 0.76
3 =
0.55
0.06 0.12 0.18 0.36 0.54
2 =
0.33
0.04 0.07 0.11 0.22 0.32
1 =
0.11
0.01 0.02 0.04 0.07 0.11
A = 0.11
B = 0.22
C = 0.33
D = 0.66
E = 0.98
Need Urgency Score
0 1 2 3 4 Exponential 0.98 0.59 0.36 0.22 0.13 Hyperbolic 0.98 0.33 0.20 0.14 0.11 Need Urgency 0.98 0.66 0.33 0.22 0.11
0.00
0.20
0.40
0.60
0.80
1.00
Dis
coun
t Fac
tor (
DF)
Year
Exponential
Hyperbolic
Need Urgency
DF(Exponential) = 1/ (1+ r)n
DF(Hyperbolic) = 1/ (1+ nk)

- 163 -
Further, Figure 4-12 compares the scale of the Need Urgency Score with the exponential
and hyperbolic discounting scales, which have seen broad applications in economic
models [Frederick, Loewenstein, and O’Donoghue, 2002]. A few important observations
for Figure 4-12 are made as below:
The scale of the Need Urgency Score is closely aligned with the exponential
discounting scale, which is a more traditional choice than the hyperbolic
discounting scale. However, as pointed out by Frederick, Loewenstein, and
O’Donoghue [2002] among other literature, a large number of empirical studies
have demonstrated that the constant “discount rate” (r) in exponential
discounting is systematically being violated, and hyperbolic discounting is a
mathematical improvement over exponential discounting and has been observed
in the behavior of humans and animals [Laibson, 1997]. Therefore it could be
interesting to apply the hyperbolic discounting in future research.
Based on calculations, the annual discount rate of the exponential discounting
scale approximately equals 65%, which is at the high end of the normal range of
annual discount rates in economic models [Frederick, Loewenstein, and
O’Donoghue, 2002, p. 379]. However, this choice may be justified by one of the
three key assumptions for the SVN analysis (viz., the first assumption of
“Relationship Types”, see Chapters 2 and 3) that not only monetary value but
also nonmonetary value is exchanged within the stakeholder networks.
Moreover, for Project Phoenix, timing is an especially important consideration
and any delay related to the project will significantly decrease the perceived
utility levels of the focal organization and its stakeholders.
Astute readers may find that one year is chosen as the basic unit for the scale of
Urgency Need Score, but for those 74 value flows in the Project Phoenix case
(see Figure 4-3), some of them will certainly span for more than one year, which
means the stakeholder representatives may check two or more blocks when
answering the columns of “URGENCY OF NEED” in the questionnaire (see
Table A-4-2 in the Appendix). For simplicity, if this situation occurs, we will

- 164 -
only take the highest utility score for that value flow, instead of converting
several scores into one not included in Figure 4-11.
Once the method for value flow scoring is chosen and the propagation rule of value flows
is defined, the remaining task for the construction of the quantitative SVN Model is to
distribute the stakeholder questionnaire (see Table A-4-2 in the Appendix) to all the
representatives of each stakeholder and then collect the converged answers from them
through multi-round interviews as well as the Delphi approach [Brown, 1968; Dalkey and
Helmer, 1963; Linstone and Turoff, 1975; Sackman, 1974]. Detailed discussion on the
stakeholder questionnaire has been provided in Chapter 3 (see Section 3.2.2.1), and
specifically, for the retrospective case of Project Phoenix, one additional caution is to
remind the stakeholder representatives to not apply their later experience into their
answers to the questionnaire, as highlighted at the beginning of this chapter. Last but not
least, for the consideration of confidentiality, all the finalized answers to the stakeholder
questionnaire (see Table A-4-2 in the Appendix) have been removed.
4.3.3 Step Three: Searching
With the quantitative SVN Model obtained above, the objective of the third step in the
SVN analysis is to search for all the possible value paths between any two stakeholders
within such a multi-relational network. Specifically, all the value cycles for the focal
organization can be taken as the sample space to construct network statistics in order to
measure the exchange and structural properties of the SVN: On one hand, value cycles
and their utility scores provide a feasible way for the focal organization to compare the
relative importance of all the exchange relations, including both direct and indirect ones,
with other stakeholders; On the other hand, value cycles also simultaneously capture the
information about each stakeholder’s structural position in the network—for example, the
occurrence of a specific stakeholder in all the value cycles for the focal organization, will
obviously vary with its network position.

- 165 -
As introduced in Chapter 3, the Object-Process Network (OPN) [Koo, 2005] developed
by the MIT System Architecture Group provides a graphical modeling platform to
perform the above searching task. Similar to Figures 3-12 and 3-13, Figures 4-13 and 4-
14 show a snapshot for the OPN model and a zoom-in view of this model, respectively.
However, compared to the RuSakOil case (see Figure 3-3), we observe that the SVN of
the Project Phoenix case (see Figure 4-3) takes much longer time (from seconds up to
hours) to be solved on the OPN platform, with the number of stakeholders increasing
from 9 to 14 and the number of value flows increasing from 27 to 74. Although the
running time of the OPN model is still manageable for the Project Phoenix case, similar
or even worse results have been observed in other applications of the SVN analysis,
which raise the concern for the OPN platform to solve those medium and large
stakeholder networks and also bring up the opportunity to develop a more effective as
well as more efficient software tool for the SVN analysis. This mission is finally
accomplished in Chapter 5, starting with an analysis for the shortcomings of the OPN
platform and then followed by the development of a new modeling platform using more
powerful algorithm and better software design.
Figure 4-13: OPN Model for the SVN of the Project Phoenix

- 166 -
Figure 4-14: Zoom-In View of the OPN Model
Facing the limited computational power of the OPN platform, one simple and feasible
solution is to add constraints into the quantitative SVN Model, as discussed in Chapter 3
(see Section 3.2.3). Specifically, this chapter chooses the “Internal Assets” as a constraint
for the SVN Model of the Project Phoenix case, for both mathematical and strategic
considerations.
The constraint of “Internal Assets” defines the mechanism for stakeholders to convert
their inputs to outputs, which can be either monetary or nonmonetary, in the form of
categorized resource pools to connect each stakeholder’s inputs with the same category of
outputs. Figure 4-15 takes the Local Governments (LOG) in the Project Phoenix case as
an example to illustrate how this constraint works. For instance, the “Economic
Stimulation” from PP, “Political Support” from the Host State Government (HSG),
“Political Support” from the Adjacent State Representatives (ASR), and “Support” from
the Local Public (LOP) are four inputs that can add the “Domestic Political Capital” for
the Local Governments (LOG), and once these inputs are converted into the political
capital, they can be applied by the Local Governments (LOG) as the same type of
resources without any difference to exert the “Political Influence” on the Host State
Value Cycles for PP
Local Governments (LOG)

- 167 -
Government (HSG) and the Adjacent State Representatives (ASR) as well as to provide
the “Local Government Service” to the Local Public (LOP).
Figure 4-15: Internal Assets within the Local Governments (LOG)
From the mathematical perspective, it is straightforward to understand that the “Internal
Assets” within each stakeholder narrow the solution space of the quantitative SVN Model
by eliminating those value cycles with unreasonable matches between value flows, and
therefore speed the computation on the OPN platform. From the strategic perspective, the
constraint of “Internal Assets” adds more rigor to the SVN Model by factoring in the
causal relationships between value flows before linking them into a value path or cycle.
As such, a lucid logic is presented for the existence of each value cycle and the reason
why stakeholders are engaged in a generalized exchange is also partially explained.
In the Appendix, similar to the accompanying documents for value flows shown in Table
A-4-1, Table A-4-3 lists the specific “Internal Assets” for each stakeholder in Project
Phoenix as well as their formal definitions in order to converge the interpretation from
different stakeholder representatives and ensure the credibility of the results from the
SVN analysis. In addition, similar to Figure 4-15, Figures A-4-1 ~ A-4-13 visualize the
“Internal Assets” constraints for other 13 stakeholders in the Project Phoenix case. Note
Political Support from HSG
Local Govern Service to LOP Political Support from ASR
Regulatory Compliance to ASR
Political Influence to ASR
Opinions to PUM Support from LOP
News from PUM
Environ Compliance from PP
Economic Stimulation from PP
Taxes from PP
LOG
Domestic Political Capital
Project Support
Treasury
Regulatory Compliance to HSG
Political Influence to HSG

- 168 -
that even with the constraint of “Internal Assets”, the inputs of a few stakeholders can
still be freely matched to their outputs, and those stakeholders are colored in red
purposefully.
4.3.4 Step Four: Analyzing
After adding the above constraint of “Internal Assets”, the quantitative SVN Model for
the Project Phoenix case can be solved on the OPN platform much faster (from hours
down to minutes). Specifically, when taking Project Phoenix as the focal organization,
Figure 4-16 shows the distribution of the utility scores of all the 5039 value cycles for
Project Phoenix found in the SVN. From this figure, we observe that only 222 value
cycles have a utility score between 0.1 and 0.5, and the utility scores of the remaining
4817 value cycles are lower than 0.1.
Figure 4-16: Utility Score Distribution of All the Value Cycles for Project Phoenix in the SVN Model
Further, after running the SVN Model on the OPN platform multiple times (142 = 196),
Table 4-2 summarizes the number of possible value paths or cycles between any two
stakeholders, and these results can be used to analyze the relationship balance between
stakeholders, which are discussed together with the integration of stakeholders and issues
in the next Section. In Chapter 5, once the new software tool for the SVN analysis is
developed, such a table can be fully obtained at once and much more efficiently.
0
0.1
0.2
0.3
0.4
0.5
1 501 1001 1501 2001 2501 3001 3501 4001 4501 5001
Cyc
le S
core
Cycle No.
All the Value Cycles for Project Phoenix (PP)
Top 27 (0.3)
Top 81 (0.2)
Top 222 (0.1)
Top 1065 (0.01) All 5039

- 169 -
Table 4-2: Summary for All-Pair-Stakeholder-Relationships in the Project Phoenix Case
Similar to the RuSakOil case in Chapter 3, in this chapter we also compute network
statistics based on all the 5039 value cycles (under the constraint of “Internal Assets” for
each stakeholder) for Project Phoenix. With these statistics, the following strategic
implications are discussed in order: Important Value Cycles, Important Stakeholders,
Important Outputs and Inputs, Important Value Flows, and more importantly, the
Comparison of Important Stakeholders between Project Phoenix Managers’ Mental
Model, the “Hub-and-Spoke” Model, and the “Network” Model, in order to validate the
strength of the SVN analysis for understanding the impacts of indirect stakeholder
relationships on the long-term success of large engineering projects.
4.3.4.1 Important Value Cycles
First of all, Figures 4-17 and 4-18 visualize the top 11 value cycles for Project Phoenix in
terms of the utility scores of those cycles. For better visibility, the value flows in the same
color and line type in Figure 4-18 constitute one value cycle.
PP FCG FCP FCT CSP INF HSG ASR LOG LOP NGO NTG PUM UFG
PP 5039 468 468 1402 2 534 770 833 714 392 1000 2 534 468
FCG 167 440 1 195 130 846 985 1389 1100 634 1223 296 758 406
FCP 167 160 161 513 130 846 985 1389 1100 634 1223 296 758 406
FCT 166 124 124 565 130 685 781 1188 938 534 931 295 597 283
CSP 384 474 474 1328 221 667 799 844 762 178 1030 569 545 444
INF 182 534 534 1600 79 466 933 953 847 535 1059 239 409 534
HSG 255 401 401 1165 134 238 1804 344 335 365 327 349 170 392
ASR 296 262 262 732 176 356 505 1603 616 563 590 447 245 244
LOG 466 444 444 1260 254 419 498 254 2364 639 693 670 268 420
LOP 384 353 353 967 221 445 528 492 461 2385 688 569 323 323
NGO 258 372 372 1054 99 279 731 549 517 142 1629 323 247 353
NTG 2 684 684 2050 3 722 1156 1133 993 503 1432 4 722 684
PUM 182 206 206 616 79 57 427 416 396 248 418 239 2156 206
UFG 167 34 34 36 130 465 467 933 671 394 480 296 377 1847

- 170 -
Figure 4-17: Top 11 Value Cycles for Project Phoenix in the SVN Model
PP Host State Government PP
Taxes Score = 0.494
Local Permits
PP U.S. Federal Government PP
Strategy Supply
Security Score = 0.494
National Permits
PP Local Public Host State Government
Economic Stimulation
PP
Local Permits
Score = 0.469 Support
PP U.S. Federal Government
Host State Government
Strategy Supply
Security PP Score = 0.469
Local Permits
Boundary Conditions
PP U.S. Federal Government
Host State Government
Strategy Supply
Security PP Score = 0.469
Local Permits
Political Influence
PP International Finance PP
Profits Score = 0.410
Investment
PP Local Public PP
Chemical Products
Score = 0.410 Payment
PP Local Governments Public Media
Economic Stimulation
PP News
Score = 0.390 Opinions
PP Local Public Public Media
Economic Stimulation
PP Score = 0.390 News Opinions
PP Local Public Host State Government
Environmental Mitigation
PP Score = 0.375
Local Permits Support
PP Local Public Host State Government
Chemical Products
PP Score = 0.375
Local Permits Support
No.1
No.2
No.3
No.4
No.5
No.6
No.7
No.8
No.9
No.10
No.11

- 171 -
Figure 4-18: Visualization of Top 13 Value Cycles for Project Phoenix in the SVN Model
From the above two figures, three key observations are made as below:
The top value cycles provide guidance for Project Phoenix to formulate indirect
strategies to engage other stakeholders, especially when it is difficult to engage
them directly.
The occurring frequency of each value flow in these top value cycles roughly
indicates its relative importance from the perspective of the focal organization.
For example, within the top 11 value cycles, on one hand, the most important
outputs from Project Phoenix are “Strategic Supply Security” to the U.S. Federal
Government (UFG), as well as “Economic Stimulation” and “Chemical
Products” to the Local Public (LOP); and on the other hand, the most important
inputs for Project Phoenix are “Local Permits” from the Host State Government
(HSG) and “News” from the Public Media (PUM). This observation intuitively
supports the network statistics constructed in Chapter 3—once expanding the
Local Public
Owner / Project Phoenix
Local Governments Host State Government
U.S. Federal Government
Public Media
Intl. Finance(Owner
Shareholders and bond holders)
Tax
National PermitsB
ound
ary
Con
ditio
nsPo
litic
al In
fluen
ce
Prof
its
Investment
Payment
Econ
omic
Stim
ulat
ion
OpinionsOpinions
Envi
ronm
enta
l Miti
gatio
n
Strategy Supply SecurityEc
onom
ic S
timul
atio
nC
hem
ical
Pro
duct
s
Local Permits
New
s
Supp
ort
No.1
No.2
No.3
No.4No.5
No.6
No.7
No.8
No.9
No.10
No.11
New Tech Generators
Contractors/Suppliers/
Third Parties
Feedstock Country
Producers
NGO
Feedstock Country
Transportation
Feedstock Country
Government
Adjacent State Repres.

- 172 -
sample space from the top 11 value cycles to all the 5039 value cycles, these
occurring frequencies will become the Weighted Output Occurrence (WOO),
Weighted Input Occurrence (WIO), and Weighted Value Flow Occurrence
(WVFO), which are formally defined in Equations 3-4 ~ 3-6.
There are seven stakeholders that do not show up in the top 11 value cycles for
PP. This can be taken as the theoretical basis to collapse out less important
stakeholders in order to better manage both the computational and analytical
complexities in the SVN Model.
4.3.4.2 Important Stakeholders
Defined in Equation 3-3, the Weighted Stakeholder Occurrence (WSO, a.k.a. Exchange
Centrality I or Crawley Centrality I) quantifies the relative importance of each
stakeholder for the focal organization from both the exchange and structural perspectives.
Specifically, Figure 4-19 shows the calculated WSO for Project Phoenix in the SVN
Model (see Figure 4-3). We observe that the most important stakeholders for Project
Phoenix are the Public Media (PUM), Local Public (LOP), Host State Government
(HSG), and so on. Note that as a reference, the numerical value of the first blue bar in this
figure always equals 1.0, because the focal organization appears in all its value cycles by
definition.

- 173 -
Figure 4-19: Weighted Stakeholder Occurrence (WSO) for Project Phoenix in the SVN Model
4.3.4.3 Important Outputs and Inputs
Using Equations 3-4 and 3-5, Figures 4-20 and 4-21 calculate the Weighted Output
Occurrence (WOO) and the Weighted Input Occurrence (WIO) for Project Phoenix in the
SVN Model (see Figure 4-3), respectively. By definition, the sum of WOO and the sum
of WIO should always equal 1.0.
From these two figures, the following observations are made:
WOO helps identify that the top six high-leverage outputs from Project Phoenix
are “Economic Stimulation”, “Chemical Products”, “Environmental Mitigation”,
and “Employment” to the Local Public (LOP), “Economic Stimulation” to the
Local Governments (LOG), as well as “Strategic Supply Security” to the U.S.
Federal Government (UFG). An output with a higher WOO, will have a greater
effect on improving the inputs to Project Phoenix at the end of value cycles—if
Project Phoenix has additional resources to increase the levels of its outputs,
WOO suggests a reasonable order for those resources to be allocated.
0.0
0.2
0.4
0.6
0.8
1.0
PP PUM LOP HSG UFG LOG NGO INF FCG ASR FCP FCT CSP NTG
WSO
_SVN
Stakeholder
WSO in the Stakeholder Value Network (5039 Cycles)
Most Important Stakeholders for PP
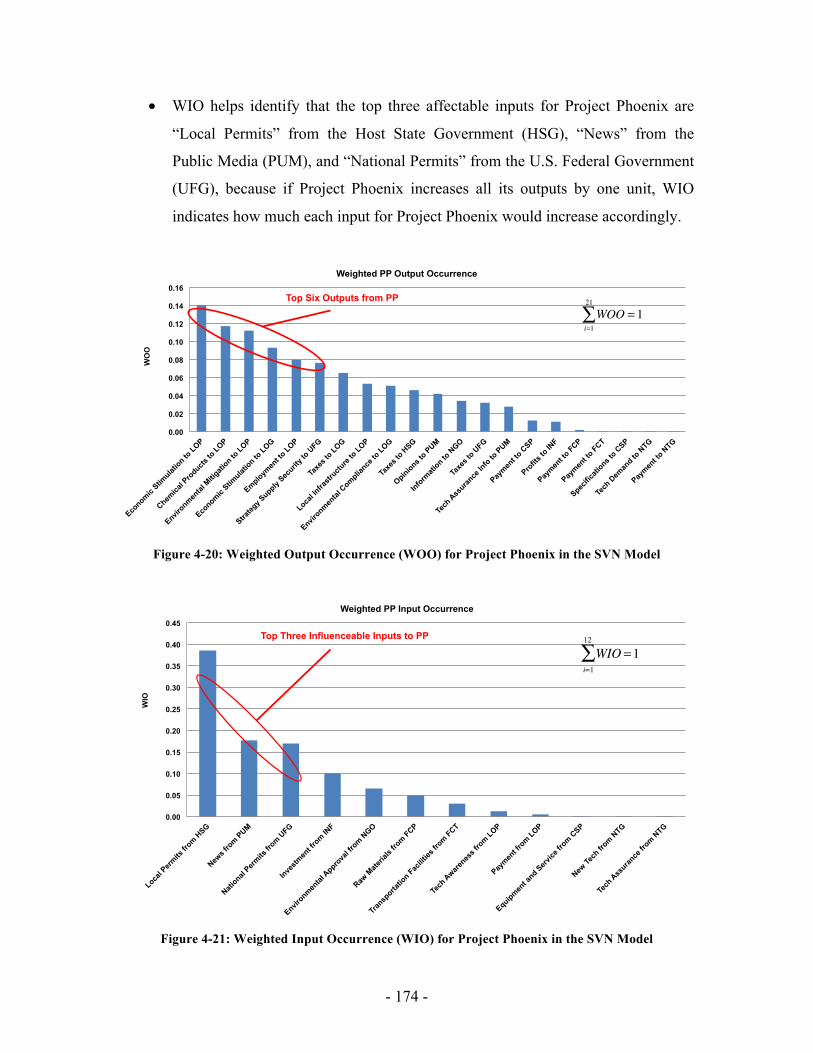
- 174 -
WIO helps identify that the top three affectable inputs for Project Phoenix are
“Local Permits” from the Host State Government (HSG), “News” from the
Public Media (PUM), and “National Permits” from the U.S. Federal Government
(UFG), because if Project Phoenix increases all its outputs by one unit, WIO
indicates how much each input for Project Phoenix would increase accordingly.
Figure 4-20: Weighted Output Occurrence (WOO) for Project Phoenix in the SVN Model
Figure 4-21: Weighted Input Occurrence (WIO) for Project Phoenix in the SVN Model
0.00
0.02
0.04
0.06
0.08
0.10
0.12
0.14
0.16
Economic
Stimulat
ion to LOP
Chemica
l Pro
ducts to
LOP
Environmen
tal M
itigati
on to LOP
Economic
Stimulat
ion to LOG
Employmen
t to LOP
Strateg
y Supply
Securit
y to U
FG
Taxe
s to LOG
Local In
frastr
ucture
to LOP
Environmen
tal C
ompliance
to LOG
Taxe
s to H
SG
Opinions to PUM
Informati
on to N
GO
Taxe
s to U
FG
Tech
Assuran
ce In
fo to PUM
Paymen
t to C
SP
Profits
to IN
F
Paymen
t to FCP
Paymen
t to FCT
Specific
ations t
o CSP
Tech
Dem
and to
NTG
Paymen
t to N
TG
WO
O
Weighted PP Output Occurrence
Top Six Outputs from PP
WOOi=1
21
∑ = 1
0.00
0.05
0.10
0.15
0.20
0.25
0.30
0.35
0.40
0.45
Local P
ermits
from H
SG
News f
rom PUM
National
Permits
from U
FG
Investm
ent fr
om INF
Environmen
tal Appro
val fr
om NGO
Raw M
ateria
ls fro
m FCP
Transp
ortatio
n Facilit
ies fr
om FCT
Tech
Awarenes
s fro
m LOP
Paymen
t from LOP
Equipment a
nd Service
from C
SP
New Te
ch fr
om NTG
Tech
Assuran
ce fr
om NTG
WIO
Weighted PP Input Occurrence
Top Three Influenceable Inputs to PP
WIO =1i=1
12
∑

- 175 -
4.3.4.4 Reduced Complexity for Stakeholder Networks
Using Equation 3-6, the Weighted Value Flow Occurrence (WVFO) can also be
calculated. Based on the WVFO, Figures 4-22 and 4-23 identify the top 13 and top 30
value flows for Project Phoenix in the SVN Model (see Figure 4-3), respectively. By
definition, the sum of WVFO should always equal 1.0, like the WOO and WIO (see
Figures 4-20 and 4-21).
Figure 4-22: Top 13 Value Flows for Project Phoenix in the SVN Model
0
0.01
0.02
0.03
0.04
0.05
0.06
0.07
0.08
0.09
Local P
ermits
from H
SG to PP
News f
rom PUM to
UFG
Support fro
m LOP to U
FG
Opinions fro
m LOG to PUM
News f
rom PUM to
PP
National
Permits
from U
FG to PP
Boundary C
onditions f
rom U
FG to H
SG
Politica
l Influ
ence
from U
FG to H
SG
Opinions fro
m NGO to
PUM
Opinions fro
m HSG to
PUM
Support fro
m LOP to H
SG
Economic
Stimulat
ion from PP to
LOP
Opinions fro
m LOP to PUM
WVF
O
Top 13 Value Flows
WVFO =1i=1
74
∑WVFO = 0.525i=1
13
∑
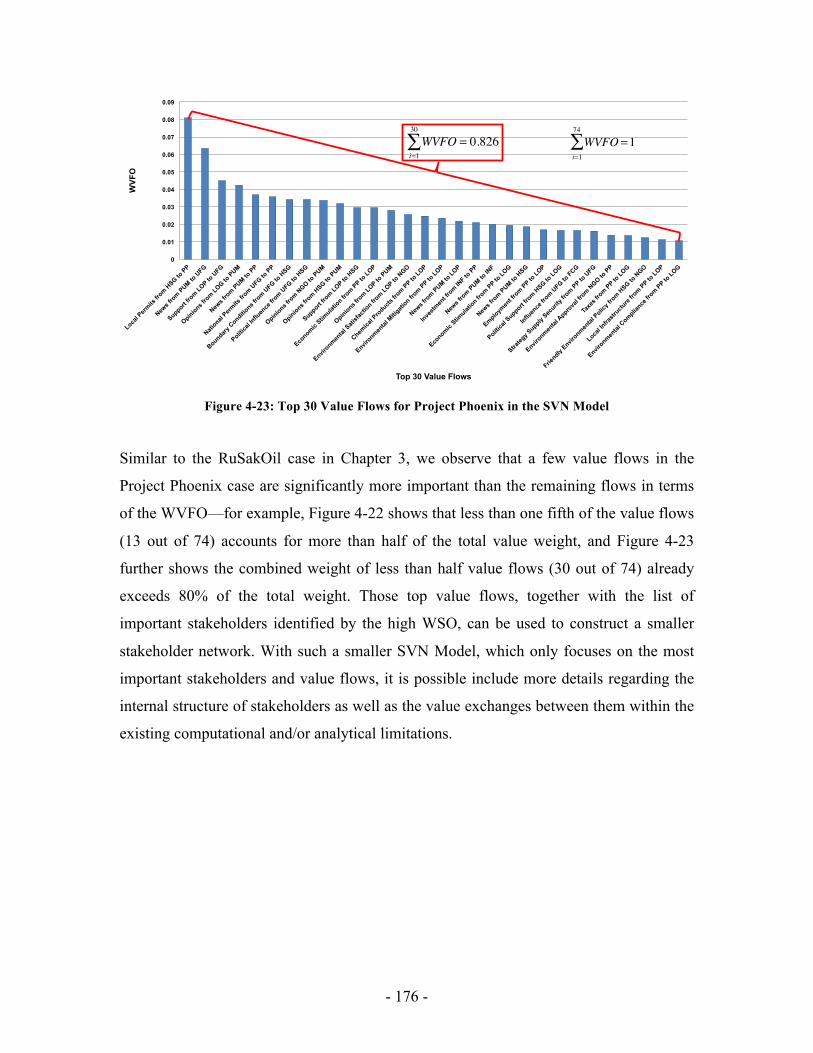
- 176 -
Figure 4-23: Top 30 Value Flows for Project Phoenix in the SVN Model
Similar to the RuSakOil case in Chapter 3, we observe that a few value flows in the
Project Phoenix case are significantly more important than the remaining flows in terms
of the WVFO—for example, Figure 4-22 shows that less than one fifth of the value flows
(13 out of 74) accounts for more than half of the total value weight, and Figure 4-23
further shows the combined weight of less than half value flows (30 out of 74) already
exceeds 80% of the total weight. Those top value flows, together with the list of
important stakeholders identified by the high WSO, can be used to construct a smaller
stakeholder network. With such a smaller SVN Model, which only focuses on the most
important stakeholders and value flows, it is possible include more details regarding the
internal structure of stakeholders as well as the value exchanges between them within the
existing computational and/or analytical limitations.
0
0.01
0.02
0.03
0.04
0.05
0.06
0.07
0.08
0.09
Local P
ermits
from H
SG to PP
News f
rom PUM to
UFG
Support fro
m LOP to U
FG
Opinions fro
m LOG to PUM
News f
rom PUM to
PP
National
Permits
from U
FG to PP
Boundary C
onditions f
rom U
FG to H
SG
Politica
l Influ
ence
from U
FG to H
SG
Opinions fro
m NGO to
PUM
Opinions fro
m HSG to
PUM
Support fro
m LOP to H
SG
Economic
Stimulat
ion from PP to
LOP
Opinions fro
m LOP to PUM
Environmen
tal Sati
sfacti
on from LOP to
NGO
Chemica
l Pro
ducts fr
om PP to LOP
Environmen
tal M
itigati
on from PP to
LOP
News f
rom PUM to
LOP
Investm
ent fr
om INF to
PP
News f
rom PUM to
INF
Economic
Stimulat
ion from PP to
LOG
News f
rom PUM to
HSG
Employmen
t from PP to
LOP
Politica
l Support
from H
SG to LOG
Influen
ce fr
om UFG to
FCG
Strateg
y Supply
Securit
y fro
m PP to U
FG
Environmen
tal Appro
val fr
om NGO to
PP
Taxe
s fro
m PP to LOG
Friendly
Environmen
tal Polic
y fro
m HSG to
NGO
Local In
frastr
ucture
from PP to
LOP
Environmen
tal C
ompliance
from PP to
LOG
WVF
O
Top 30 Value Flows
WVFO =1i=1
74
∑WVFO = 0.826i=1
30
∑

- 177 -
Figure 4-24: Visualization of Top 13 Value Flows for Project Phoenix in the SVN Model
In addition, Figure 4-24 visualizes the top 13 value flows for Project Phoenix in the SVN
Model through adjusting the thickness of each flow proportionally to its ranking (see
Figure 4-22). From this figure, a few more observations are made as below:
The types of all the top 13 value flows are either political or information, which
are mediated only by the nonmarket environment, and none of the goods/service
and financial flows makes the list. This observation confirms the previous
findings on the density of different types of value flows (see Figures 4-4 ~ 4-7
and Section 4.3.1.3)—as argued by McAdam, Boudet, Davis, et al. [2010], today
the nonmonetary and intangible social relationships are gradually replacing the
monetary and tangible economic relationships to become the main challenges for
large engineering projects, especially when these projects cross the borders of
different countries [Miller and Lessard, 2001]—this phenomenon has far-
reaching significance, which is discussed in the next Section based on the
Local Public
Owner / Project Phoenix
Local Governments Host State Government
U.S. Federal Government
Public Media NGO
Local Permits
New
s
Support
Opinions
New
s
National PermitsB
ound
ary
Con
ditio
nsP
oliti
cal I
nflu
ence
Opinions Opinions
New Tech Generators
Contractors/Suppliers/
Third Parties
Intl. Finance(Owner
Shareholders and bond holders)
Feedstock Country
Producers
Feedstock Country
Transportation
Feedstock Country
Government
Adjacent State Repres.

- 178 -
comparisons between Project Phoenix Managers’ Mental Model, the “Hub-and-
Spoke” Model, and the “Network” Model.
There are seven stakeholders not involved with the top 13 value flows in the
network. This can be taken as the theoretical basis to collapse out less important
stakeholders in order to better manage both the computational and analytical
complexities in the SVN Model.
While Figure 4-24 looks similar to Figure 4-18, which visualizes only the top 11
value cycles for Project Phoenix, one basic difference between these two figures
is their sample space. Figure 4-18 only takes 11 value cycles while Figure 4-24
takes all the 5039 value cycles—therefore when constructing a smaller SVN
Model for more fine-grained analysis, Figure 4-24 or WVFO provides a more
solid basis than Figure 4-18 or Important Value Cycles.
4.3.5 Impacts of Indirect Stakeholder Relationships
As the climax of the SVN analysis for the Project Phoenix case, this section compares a
short list of important stakeholders obtained from Project Phoenix Managers’ Mental
Model, the “Hub-and-Spoke” Model, and the “Network” Model, in order to validate the
strength of the SVN analysis for understanding the impacts of indirect stakeholder
relationships for the long-term success of large engineering projects.
4.3.5.1 Comparison between the Mental Model and the “Network” Model
As noted in Section 4.2, the Host State Government (HSG) and the U.S. Federal
Government (UFG) were the most important stakeholders in Project Phoenix Managers’
Mental Model, mainly because from the standpoint of the project managers, the new
wastewater discharge permits were among the most direct and important requirements for
Project Phoenix to be conducted successfully, while the HSG and UFG were exactly the
stakeholders in charge of issuing these permits on the local and national levels
respectively. Meanwhile, we also conclude that PP’s project managers had not paid
- 179 -
enough attention to the Public Media (PUM) and the Local Public (LOP) before seeing
the unanticipated protest from them.
Now recall the most important stakeholders ranked by the WSO in the “Network” (SVN)
Model: From Figure 4-19, it is clear that the PUM and LOP are the most important
stakeholders for Project Phoenix, which means the results from the SVN analysis match
the later facts better than Project Phoenix Mangers’ Mental Model in this retrospective
case study, through including both direct and indirect relationships in the stakeholder
network.
4.3.5.2 Comparison between the “Hub-and-Spoke” and “Network” Models
The “Hub-and-Spoke” Model (see Figure 4-8) is derived from the “Network” (SVN)
Model for Project Phoenix (see Figure 4-3), by including only the direct relationships
between the focal organization (PP) and its stakeholders. Following the same steps in the
SVN analysis as the “Network” (SVN) Model, Figure 4-25 shows the rank of stakeholder
importance in terms of their WSO for the “Hub-and-Spoke” Model. Comparing Figure 4-
25 with Figure 4-19, three major differences are apparent: First, the Public Media (PUM)
jumps from the fourth important stakeholder to the first important one; Second, the Local
Governments (LOG) jump from the least important one to one of the most important
stakeholders; Third, on the contrary, the Contractors/Suppliers/Third Parties (CSP)
become less important in the SVN Model. Recalling the later facts about important
stakeholders introduced at the beginning of this case study, it is not difficult to conclude
that the SVN Model better reflects the reality, thanks to the consideration of the indirect
relationships between stakeholders.

- 180 -
Figure 4-25: WSO for Project Phoenix in the “Hub-and-Spoke” Model
4.3.5.3 Why the Indirect Stakeholder Relationships Matter
The above comparisons between three models have convincingly demonstrated the
strength of the SVN analysis for understanding the impacts of indirect stakeholder
relationships on the long-term success of large engineering projects. However, a more
fundamental question can be raised from these comparisons: “Why do the indirect
stakeholder relationships matter so much for today’s large engineering projects such as
Project Phoenix?”
Equipped with the relevant theories in social sciences, we argue that the key to answer
this important question is the missing link between the types of stakeholder relationships
and the patterns for stakeholders to exchange values. As discussed in Chapter 2,
economic relationships mainly exist in the form of Restricted Exchange, while social
relationships mainly exist in the form of Generalized Exchange.
Based on the bridge between relationship types and exchange patterns, as well as the
normative and instrumental origins for Generalized Exchange, the answer to the
fundamental question asked at beginning, “Why do the indirect stakeholder relationships
0.0
0.2
0.4
0.6
0.8
1.0
PP UFG LOP HSG PUM INF CSP NGO FCP NTG FCT FCG ASR LOG
WSO
_H&
S
Stakeholder
WSO in the "Hub-and-Spoke" Model (21 Cycles)
- 181 -
matter so much for today’s large engineering projects such as Project Phoenix”, comes
into place by itself: As observed earlier in this chapter, for today’s large engineering
projects, the social relationships between stakeholders (including the political and
information value flows as defined in this dissertation) prevail over their economic
relationships (including the goods/service and financial value flows as defined in this
dissertation), in terms of both density (see the decomposition views of stakeholder map in
Figures 4-4 ~ 4-7) and importance (see the visualization for top value flows in Figure 4-
24). This phenomenon decides the significance of the Generalized Exchange, which
consists of indirect stakeholder relationships, as a pattern for stakeholders to exchange
values. Therefore, compared to the traditional managerial model and “Hub-and-Spoke”
stakeholder model, the strength of the SVN analysis comes exactly from its inclusion of
indirect stakeholder relationships or Generalized Exchange as the basic units to measure
the exchange and structural properties of the networks, which then determine the
distribution of stakeholder power as a consequence [Blau, 1964; Emerson, 1972; Molm,
1990].
In addition, the importance of generalized exchanges for today’s large engineering
projects can also be understood from the following aspects:
Psychological Perspective: Generalized exchanges can emerge with a variety of
reasons and motivations—“from pure altruistic (Sahlins, 1972) to norm-based
behavior (Ekeh, 1974) to behavior that is based on rational choice and
instrumental incentives (Olson, 1965)” [Levine and Shah, 2003, pp. 3-4].
Sociological Perspective: Generalized exchanges heavily rely on the social
relationships mediated by the nonmarket environment and are mainly bounded
by the mutual trust among all the participants. Therefore, when social
relationships prevail with the waves of education, globalization, and information
technology, the significance of generalized exchanges cannot be simply ignored.
Economic Perspective: From Marx to Keynes, to Friedman, and to von Mises
and Hayek, different schools of economists have different belief in free market.
However, the most recent financial crisis and global economic recession bring

- 182 -
back the heated debate on how free an efficient market should be (see the latest
work of Joseph E. Stiglitz, Paul R. Krugman, James K. Galbraith, and J.
Bradford DeLong among others). In the foreseeable future, no one can deny the
increasing visibility of nonmarket stakeholders, such as governments and NGOs,
in the economic activities of modern firms, not mentioning that many of those
activities are often across the borders of countries with different political
systems, social mechanisms, and culture. Therefore, generalized exchanges
potentially provide an effective means for firms to manage these stakeholder
relationships mediated by the nonmarket environment without clearly stated
economic contracts.
Managerial Perspective: Recently, the importance of generalized exchanges has
been recognized by a few leading scholars in the field of stakeholder theory,
because generalized exchanges provide “a partial answer to the question of why
the whole of stakeholder relationships can be greater than the sum of its parts”
[Wicks and Harrison, 2013, pp. 105-106]. Essentially, generalized exchanges are
an indirect form of collaboration among a group of stakeholders and can help
internalize the previously externalized costs, such as environmental pollutions, so
that these stakeholders are able to reach a better agreement on “distributive
justice” [Homans, 1961, p. 264], share the benefits and costs, and finally foster
the trust between them, which is critical for the long-term success of large
engineering projects.
Finally, looking back on the three major assumptions for the SVN discussed in Chapter 2,
it is not hard to find that the linkage between the first two assumptions (viz., Relationship
Types and Exchange Patterns) is the key to answer the question of “Why the indirect
stakeholder relationships matter for today’s large engineering projects”, while the third
assumption (viz., Strategic Implications) provides the theoretical foundation to construct
network statistics in order to quantitatively measure the impacts of these indirect
stakeholder relationships. Moreover, these assumptions have guided three main steps in
the framework of the SVN analysis, that is, Quantifying, Searching, and Analyzing,
respectively (see Figure 3-1).

- 183 -
4.3.5.4 Decomposition of the Impacts of Indirect Stakeholder Relationships
After exploring the reasons behind the significance of indirect stakeholder relationships
or Generalized Exchange for today’s large engineering projects, the third assumption of
the SVN analysis about Strategic Implications provides the theoretical foundation to
construct network statistics, which can be used to quantitatively measure the impacts of
indirect stakeholder relationships. Specifically, taking the importance of stakeholders as
an example, stakeholder power is the outcome of both exchange relations and network
positions, based on the Social Exchange Theory (SET) [Blau, 1964; Emerson, 1972;
Molm, 1990]. In another word, the impacts of indirect relationships on the ranking of
stakeholder importance are exerted through both the exchange and structural properties of
the network. However, it remains unclear which properties play a bigger role than the
other if not equally, and this information can be very meaningful for the focal
organization to formulate effective strategies to manage the relationships (viz., value
flows) with its stakeholders, using either the “exchange” approach (increase or decrease
the resources allocated to a specific relationship) or the “structural” approach (build a
new relationship or destroy an existing one), or even both of them.
In order to obtain such information, we push the frontier of the SVN analysis a bit
further, through proposing an innovative way to decompose the impacts of the indirect
stakeholder relationships into two parts—one takes into effect through the exchange
properties of the stakeholder networks, and the other through the structural properties of
the same networks.
As the first step, we define a new network statistics called “Stakeholder Occurrence” or
“SO”:
(Equation 4-1)
Stakeholder Occurrence (SO) = Number of the Value Cycles Containing a Specific Stakeholder
Number of All the Value Cycles for the Focal Organization

- 184 -
Compared to the Weighted Stakeholder Occurrence or WSO (see Equation 3-3),
Stakeholder Occurrence or SO does not factor in the utility score of each value cycle, so
that the impacts from the exchange properties can be excluded and only the impacts from
the structural properties are left in the measurement.
By combining the above two measurements (WSO and SO) with two stakeholder models
(“Network” or SVN and “Hub-and-Spoke”) for the Project Phoenix case, four network
statistics can be calculated, that is, the WSO calculated from the “Network” Model
(WSO_SVN), the SO calculated from the “Network” Model (SO_SVN), the SO
calculated from the “Hub-and-Spoke” Model (SO_H&S), and the WSO calculated from
the “Hub-and-Spoke” Model (WSO_H&S). Figure 4-26 shows the calculation results.
Figure 4-26: Decomposition of the Impacts of Indirect Stakeholder Relationships (Numerical Scale)
Theoretically, based on the definitions for the above four network statistics, the change
from “SO_SVN” to “WSO_SVN” only reflects the impacts of the exchange properties in
the “Network” Model, and the change from “SO_H&S” to “SO_SVN” only reflects the
impacts of the structural properties from the “Hub-and-Spoke” Model to the “Network”
Model, while the change from “WSO_H&S” to “WSO_SVN” reflects the integrated
impacts of both the exchange and structural properties from the “Hub-and-Spoke” Model
0.0
0.2
0.4
0.6
0.8
1.0
PP PUM LOP HSG UFG LOG NGO INF FCG ASR FCP FCT CSP NTG
Stakeholder
WSO_SVN
SO_SVN
SO_H&S
WSO_H&S

- 185 -
to the “Network” Model. For a better understanding, the differences between these four
network measurements are visualized in Figure 4-27.
Figure 4-27: Differences between Four Network Measurements
However, astute readers may notice that because of the huge difference of the size of
sample space for the “Network” Model (5039 value cycles in total) and the “Hub-and-
Spoke” Model (21 value cycles in total), these four network statistics are actually not on
the same scale, therefore weakening the explanatory power of the comparisons. In order
to overcome this weakness, we define two more statistics to convert the previous
numerical scales into a unified percentage scale:
(Equation 4-2)
(Equation 4-3)
H&S SVN
SO
W
SO
Stakeholder Model
Sta
tistic
al M
easu
rem
ent
Integrated Impacts
Structural Impacts
Exc
hang
e Im
pact
s
Exc
hang
e Im
pact
s
Percentage Weighted Stakeholder Occurrence (PWSO) = Weighted Stakeholder Occurrence of a Specific Stakeholder
Sum (Weighted Stakeholder Occurrence of a Specific Stakeholder)
Percentage Stakeholder Occurrence (PSO) = Stakeholder Occurrence of a Specific Stakeholder
Sum (Stakeholder Occurrence of a Specific Stakeholder)

- 186 -
Note that the “Specific Stakeholder” in Equations 4-2 and 4-3 does not include the focal
organization, which only provides a reference number (always equals to 1.0) for the
WSO and SO. The new calculation results are shown in Figure 4-28:
Figure 4-28: Decomposition of the Impacts of Indirect Stakeholder Relationships (Percentage Scale)
For the convenience of comparison, Figure 4-29 visualizes the differences between those
percentage network statistics in Figure 4-28:
Figure 4-29: Change of Percentage Network Statistics for the Project Phoenix Case
0%
5%
10%
15%
20%
25%
30%
PUM LOP HSG UFG LOG NGO INF FCG ASR FCP FCT CSP NTG
Stakeholder
PWSO_SVN
PSO_SVN
PSO_H&S
PWSO_H&S
-25%
-20%
-15%
-10%
-5%
0%
5%
10%
15%
PUM LOP HSG UFG LOG NGO INF FCG ASR FCP FCT CSP NTG
Cha
nge
of P
erce
ntag
e St
atis
tics
Stakeholder
(PWSO_SVN) - (PSO_SVN)
(PSO_SVN) - (PSO_H&S)
(PWSO_SVN) - (PWSO_H&S)
- 187 -
From the above figure, three observations are made as below:
Observation A: From the “PWSO_H&S” to “PWSO_SVN” (see the orange bars
in Figure 4-29), the integrated impacts of both the exchange and structural
properties from the “Hub-and-Spoke” Model to the “Network” Model are
reflected. We observe that the importance of the Local Governments (LOG)
increases most, while the importance of the International Finance (INF)
decreases most.
Observation B: From the “PSO_H&S” to “PSO_SVN” (see the green bars in
Figure 4-29), only the impacts of the structural properties from the “Hub-and-
Spoke” Model to the “Network” Model are reflected. We observe that the
importance of the Local Governments (LOG) increases most, while the
importance of the New Technology Generator (NTG) decreases most.
Observation C: From the “PSO_SVN” to “PWSO_SVN” (see the blue bars in
Figure 4-29), only the impacts of the exchange properties in the “Network”
Model are reflected. We observe that the importance of the Public Media (PUM)
increases most, while the importance of the Adjacent State Representatives
(ASR) decreases most.
Based on the above three observations, two strategies for stakeholder management can be
further formulated:
Strategy A: Although the WSO calculated from the “Network” Model shows that
the Public Media (PUM) and Local Public (LOP) are the most important
stakeholders for Project Phoenix (see Figure 4-19), Observation A counter-
intuitively points out neither of them is the stakeholder gaining the most
advantage when switched from the traditional “Hub-and-Spoke” Model—
surprisingly, that stakeholder is the Local Governments (LOG), who should
therefore not be missed in the list of top priorities for PP’s managers. In addition,
if Project Phoenix wants to engage the Local Governments (LOG) to change the
outcome of the previous SVN, Observation B suggests that the “structural”

- 188 -
approach (for example, building new relationships instead of allocating more
resources) should be first considered, because the additional advantage gained by
the Local Governments (LOG) mainly comes from its structural position in the
“Network” Model.
Strategy B: According to Observation C, in the “Network” Model, the Public
Media (PUM) is the stakeholder gaining the most advantage when adding the
utilities of indirect relationships into calculations. Therefore, if Project Phoenix
wants to engage the Public Media (PUM) to change the outcome of the previous
SVN, the “exchange” approach (for example, allocating more resources instead
of building new relationships) should be first considered.
Similarly, more interesting strategies can be systematically formulated with the useful
information obtained from the decomposition of the impacts of indirect stakeholder
relationships, which instills the SVN analysis with more instrumental power, in addition
to its descriptive accuracy demonstrated by the striking comparisons of important
stakeholders between three models.
For a more general situation, we can classify the stakeholders for a focal organization
into four categories, in terms of the contribution levels of exchange relationships and
network structures in the importance or power of stakeholder (see Figure 4-30):
Wealthy Stakeholder: stakeholders only with exchange advantages are
“wealthy” but not necessarily powerful;
Central Stakeholder: stakeholders only with structural advantages are “central”
but not necessarily powerful;
Powerful Stakeholder: stakeholders with both exchange and structural
advantages are powerful;
Powerless Stakeholder: stakeholders with neither exchange nor structural
advantages are powerless.

- 189 -
According to the above classification, we further come up with a simple typology of
corresponding measurement and management strategy for each category of stakeholders
(see Figure 4-30):
Structural Strategy: for wealthy stakeholders (measured by the difference
between WSO_SVN and SO_SVN), it would be more effective for firms to take
strategies (such as building new relationships or severing current relationships) to
gain more structural advantages, in order to balance the exchange advantages of
these stakeholders;
Exchange Strategy: for central stakeholders (measured by SO_SVN), it would
be more effective for firms to take strategies (such as increasing or decreasing the
resources allocated to specific relationships) to gain more exchange advantages,
in order to balance the structural advantages of these stakeholders;
Integrated Strategy: for powerful stakeholders (measured by WSO_SVN),
firms should take an integrated strategy to simultaneously cope with the
exchange and structural advantages of these stakeholders;
Null Strategy: for powerless stakeholders (measured by WSO_SVN), firms
should wait until the power status of these stakeholders change (with the passage
of time or with the availability of more information).
Figure 4-30: Typology for Stakeholder Power and Corresponding Measurement and Strategy
Low High
Low
H
igh
Wealthy Stakeholder
(WSO_SVN – SO_SVN)
Structural Strategy
Structural Advantage
Exc
hang
e A
dvan
tage
Powerful Stakeholder
(WSO_SVN)
Integrated Strategy
Powerless Stakeholder
(WSO_SVN)
Null Strategy
Central Stakeholder
(SO_SVN)
Exchange Strategy

- 190 -
The above in-depth exploration and discussion on the impacts of indirect stakeholder
relationships complete the standard SVN analysis for Project Phoenix, using the four-step
modeling framework shown in Figure 3-1. Next, as planned at the beginning of this
chapter, an extended SVN analysis is conducted for the same Project Phoenix case with
the integration of the Strategic Issue Management, an important and alternative way of
mapping an organization’s “institutional fields” [Dimaggio and Powell, 1983; North,
1990, 1991; Scott, 1987, 2002, 2005].
4.4 Integration between Stakeholders and Issues
In this section we present an alternative perspective on the SVN analyzed above. Rather
than focus on all relationships among all stakeholders, we focus on all value flows
involving a particular type of issue. We then integrate the stakeholder and issue
perspectives in order to strengthen the SVN analysis from the analytical perspective by
crystalizing the causal mechanisms behind different stakeholder balance emerging from
the network of value exchanges, as well as from the computational perspective by
providing a justifiable principle to manage the complexity of large stakeholder networks.
As a starting point, we choose a definition of strategic issues and based on that definition,
identify four major issues in the Project Phoenix case, and then develop the
corresponding four “Issue Networks” [Frooman, 2010; Lucea, 2007; Lucea and Doh,
2012]. After that, the standard SVN analysis is conducted for these Issue Networks one
by one. Finally, the strategic implications of the analysis results are interpreted from two
perspectives: (1) the stakeholder balance within a single issue, (2) the stakeholder balance
across multiple issues. Note that for the calculations of the utility scores of value cycles,
the new “abc2” rule is applied throughout all four Issue Networks.
4.4.1 Issue Identification and Issue Networks

- 191 -
First, after comparing several definitions of strategic issues, we choose the most
comprehensive one given by Lucea [2007, p. 26]: “Issues are focal and concrete events
such as a project, a product, or a firm policy that generate gaps between the expectations
of a number of stakeholders and the firm’s behavior. These events and the gaps generated
by them can evolve with time and therefore need managerial attention in a timely
manner.”
Based on the above definition and recalling the previous introduction to Project Phoenix,
it is obvious that the key point of this case is the gap it generated between the
expectations from Public Media (PUM) and Local Public (LOP) for clean environment,
and Project Phoenix’s potential behavior to emit more pollutants to the local
environment. In addition, the project is not an isolated event existing in vacuum but also
inseparably connected to other activities/policies of owner of the project at the same
location, which can have positive impacts to close the gap generated by the current
project, more specifically, the new pollutant discharge permits. Through examining the
main activities of Project Phoenix and the general expectations from its stakeholders, it is
not difficult to find these relevant activities/policies: Providing products from a domestic
source at low cost, Creating more jobs, Building local infrastructures, and Paying taxes.
In summary, there are four major issues in the Project Phoenix case:
Issue 1: Local Economic Stimulus (Infrastructures, Products, and Jobs)
Issue 2: General Economic Performance (Taxes)
Issue 3: Local Environmental Protection (Pollutant Permits)
Issue 4: National Security (Domestic Supply of Products)
Using the above issues as the “focal and concrete events” to identify the primary
participation (shown in bold fonts and thick lines) of stakeholders and the relevant
relationships (shown in regular fonts and thin lines) between them, the previous
stakeholder map for Project Phoenix (see Figure 4-3) can be converted into four smaller

- 192 -
“Issue Networks” (see Figure 4-31 as well as Figures A-4-14, A-4-18, and A-4-22 in the
Appendix).
Figure 4-31: Issue Network 1 of “Local Economic Stimulus”
4.4.2 Stakeholder Balance within A Single Issue
Taking the Issue Network 1 of “Local Economic Stimulus” as an example, the
implications of stakeholder relationship balance within a single issue can be interpreted in
three ways: stakeholder balance (see Figure 4-32), net transaction value (see Figure 4-
33), and the impacts of indirect transactions (see Figure 4-34). Similar results for other
three Issue Networks are collected in the Appendix (see Figures A-4-14 ~ A-4-25).
4.4.2.1 Stakeholder Balance
Definition:
Local Public
Owner
Local Governments Host State Government
Owner Distribution
Project Phoenix
Contractors/Suppliers/
Third PartiesProduct
Consumers
Political Influence and Regulatory Compliance
Public MediaOpinions
NewsEmployment
Spe
cific
atio
ns
Equ
ipm
ent a
nd S
ervi
ce
Payment
Em
ploy
men
t
Chemical Products
Support
Sup
port
Local Government Service
Eco
nom
ic S
timul
atio
n
Taxe
s
Loca
l Inf
rast
ruct
ure
New
s
Opi
nion
s
New
s
Opi
nion
s
Opi
nion
sN
ews
Economic Stimulation
Local Government B
Local Government A
Opi
nion
s
New
s Political Support
Payment
Taxes

- 193 -
o In Figure 4-32, blue bars represent the total transaction value from Project
Phoenix to its stakeholders, while red bars represent the total transaction
value from these stakeholders back to Project Phoenix;
o In Figure 4-32, the right graph shows the value of direct transactions
between Project Phoenix and its stakeholders in the “Hub-and-Spoke”
Model, while the left graph shows the value of both direct and indirect
transactions between Project Phoenix and its stakeholders in the
“Network” Model;
Implication:
o For a specific balance where blue bar is longer than red bar, Project
Phoenix is more powerful than that stakeholder because Project Phoenix
provides more value to the stakeholder than the stakeholder provides to
itself, vice versa;
o From the “Hub-and-Spoke” Model to the “Network” Model, the scale of
transaction value generally becomes much larger because of the inclusion
of indirect transactions;
o All the stakeholder balance comparisons are made under a specific issue
(viz., Local Economic Stimulus, General Economic Performance, Local
Environmental Protection, or National Security) and based on a specific
model (viz., “Hub-and-Spoke” or “Network”).
Figure 4-32: Stakeholder Balance in Issue Network 1
4.4.2.2 Net Transaction Value
-2 0 2 4 6 8 10 12
CSP
HSG
LOG
LOP
PUM
Network: Direct and Indirect Transaction Value in Issue Network 1
PP to Stakeholders Stakeholders to PP
-0.5 0 0.5 1 1.5 2 2.5
CSP
HSG
LOG
LOP
PUM
Hub-and-Spoke: Direct Transaction Value in Issue Network 1
PP to Stakeholders Stakeholders to PP

- 194 -
Definition: In Figure 4-33, “Net Transaction Value = Value from Project
Phoenix to Stakeholder – Value from Stakeholder to Project Phoenix”;
Implication:
o Based on the implication of stakeholder balance, Project Phoenix is more
powerful than the stakeholder if the corresponding net transaction value is
positive, vice versa;
o Project Phoenix’s power over the stakeholder will increase with the net
transaction value, vice versa;
o From the “Hub-and-Spoke” Model to the “Network” Model, if the net
transaction value between Project Phoenix and a stakeholder increases
(especially from negative to positive), it would be beneficial for Project
Phoenix to take the indirect strategies to engage that stakeholder, vice
versa;
o All the above implications are made under a specific issue and the cross-
issue comparisons should also be taken into consideration (see Section
4.4.3).
Figure 4-33: Net Transaction Value in Issue Network 1
4.4.2.3 Impact of Indirect Transactions
-2
0
2
4
6
8
10
CSP HSG LOG LOP PUM
Net
Tra
nsac
tion
Valu
e
Stakeholder
Net Transaction Value in Issue Network 1
Hub-and-Spoke
Network

- 195 -
Definition: In Figure 4-34, blue bars represent the inputs for Project Phoenix
from a specific stakeholder in the “Network” Model, red bars represent Project
Phoenix’s outputs to a specific stakeholder in the “Hub-and-Spoke” Model, and
green bars represent Project Phoenix’s outputs to a specific stakeholder in the
“Network” Model.
Implication: Assuming in the real world stakeholders always know how to apply
the indirect transactions to leverage the inputs for Project Phoenix, the increase
from red bar to green bar actually reflects the additional strength which Project
Phoenix can gain from the indirect transactions from itself to stakeholders. In
another word, Figure 4-34 quantifies the benefits of indirect stakeholder
influencing strategies taken by Project Phoenix.
Figure 4-34: Impact of Indirect Transactions for Project Phoenix in Issue Network 1
4.4.3 Stakeholder Balance across Multiple Issues
The same analysis can be conducted for other three Issue Networks (Figures A-4-14 ~ A-
4-25 in the Appendix). More importantly, by putting the results from each Issue Network
together, an interesting cross-issue comparison of relationship balance between two
stakeholders can be obtained.
0
2
4
6
8
10
12
CSP HSG LOG LOP PUM
Tran
sact
ion
Valu
e
Impact of Indirect Transactions for PP in Issue Network 1
PP's Inputs (Network)
PP's Outputs (Hub-and-Spoke)
PP's Outputs (Network)

- 196 -
For example, Figure 4-35 visualizes the relationship balance between Project Phoenix
and the Local Public (LOP) across four Issue Networks. From this figure, the following
two conclusions are made:
In the “Hub-and-Spoke” Model, which only includes the direct relationships
between Project Phoenix and LOP, Project Phoenix seems to have almost the
same power (viz., Net Transaction Value closes to zero) as LOP on different
issues. However, this observation neither reflects the later facts in the Project
Phoenix case nor provides help to formulate effective stakeholder strategies.
In the “Network” Model, which includes both direct and indirect relationships
between Project Phoenix and LOP, Project Phoenix is much more powerful than
LOP on Issue 1 of “Local Economic Stimulus”, but is less powerful than LOP on
Issue 3 of “Local Environmental Protection”, measured by the Net Transaction
Value. Obviously this observation reflects the later facts well and also provides
the direction to formulate stakeholder strategies—for example, Project Phoenix
can utilize its strength on Issue 1 to make up for its weakness on Issue 3 to better
manage its relationship with LOP.
Figure 4-35: Relationship Balance between Project Phoenix and LOP across Four Issues
-4
-2
0
2
4
6
ISSUE 1: LOCAL ECONOMIC STIMULUS
ISSUE 2: GENERAL ECONOMIC PERFORMANCE
ISSUE 3: LOCAL ENVIRONMENTAL
PROTECTION
ISSUE 4: NATIONAL STRATEGY SUPPLY
SECURITY
Net Transaction Value between PP and LOP
H&S
SVN

- 197 -
Similarly, a few more cross-issue comparisons of relationship balance can also be
obtained and have been collected in the Appendix (see Figures A-4-26 ~ A-4-28).
4.4.4 More Observations for the SVN Model and the Issue Networks
Reflecting on the previous findings from the SVN Model (see Section 4.3) and the Issue
Networks (see Section 4.4), a few more important observations are made as below:
Managers’ Mental Model is very similar to the “Hub-and-Spoke” Model;
The “Hub-and-Spoke” Model and Managers’ Mental Model both miss the Public
Media and Local Government as important stakeholders;
The SVN Model identifies the importance of the Public Media and Local
Government, even with only prior information;
Issue Networks arrive to the same conclusions as the SVN Model, with much
simpler analysis;
Issue Networks provide greatest normative power since they identify those
stakeholders that place large values (positive and negative) on the two opposing
types of issues (taxes and jobs vs. pollutions) and thus can link them internally,
as well as those stakeholders that are “closest” to each other to effect this “issue
trade”. The central issue for Project Phoenix is that it has negative balance on
pollutions and positive balance on taxes as well as jobs, but that in general these
apply to different stakeholders;
Under the above circumstance, generalized exchanges, which include more than
two parties in value exchange, can certainly shed light on formulating “indirect”
strategies to simultaneously influence the stakeholders with positive balance and
those with negative balance.
4.5 Chapter Summary

- 198 -
In this chapter, the four-step modeling framework developed in Chapter 3 is applied to
conduct the SVN analysis for Project Phoenix, a large real-world engineering project.
Through this retrospective case study, the descriptive accuracy of the SVN analysis for
understanding the impacts of the indirect stakeholder relationships is convincingly
validated by the comparison of important stakeholders derived from the Managers’
Mental Model18, the “Hub-and-Spoke” Model, and the “Network” (SVN) Model. After
the validation, the reasons for the significance of indirect stakeholder relationships for
today’s large engineering projects are explored in theoretical depth, and meanwhile a few
more network statistics are constructed to understand the influence mechanisms for the
indirect stakeholder relationships in order to formulate better implementation strategies.
In addition, two major extensions to the SVN framework, the integration of Stakeholders
and Issues as well as a new rule for value propagation, are also applied to the Project
Phoenix case. Specifically, the integration of Stakeholders and Issues, through the
concept of “Issue Networks”, provides more insights on the balance of stakeholder
relationships and also helps manage the computational complexity of large SVN models.
Putting Chapters 3 and 4 together, the first module of the main body of this dissertation is
now completed (see Figure 1-1), and we are ready to conduct the SVN analysis in
practice, from the perspective of a focal organization.
However, a few limitations, especially the computational capability of the OPN modeling
platform, are also observed in analyzing the case study in this chapter. This provides an
impetus to develop a more effective and efficient modeling platform for the SVN
analysis, which we do in Chapter 5. With more computational and/or analytical resources
brought by such a new modeling platform, it becomes possible for us to study the
implications of the SVN from the whole network perspective as well as to model the
multiple organizational hierarchies in the stakeholder networks. 18 Please note that the Managers’ Mental Model was first inferred from publically available information, and then confirmed by our interviews with Project Phoenix’s managers. More importantly, we found that the “Hub-and-Spoke” Model is actually the underlying assumption used in the Managers’ Mental Model.

- 199 -
CHAPTER 5. METHODOLOGY DEVELOPMENT II: SVN FOR THE WHOLE NETWORK
Written on the Wall at West Forest Temple
“It’s a range viewed in face and peaks from the side,
Assuming different shapes viewed from far and wide.
Of the Mountain Lu we cannot make out the true face,
For we are lost in the heart of the very place.”
— A Chinese Poem by SU Shi (1037~1101)
Translated by XU Yuanchong
5.1 Chapter Introduction
This chapter further develops the methodological framework of the SVN analysis
building upon the four-step SVN modeling framework established in Chapter 3 and then
applied to as well as validated by the Project Phoenix case in Chapter 4. We first expand
the sample space from only the value cycles for a focal organization to all the non-
duplicate value cycles in the network, and we then construct a new family of network
statistics based on the expanded space in order to interpret the strategic implications of
the SVN from the perspective of the Whole Network, instead of from the perspective of
a pre-selected Focal Organization as we do in Chapters 3 and 4.
Before the further development of the methodological framework, we had to develop a
new modeling platform dedicated to SVN analysis, because the OPN (Object-Process
Network) platform [Koo, 2005] was not designed purposefully for the stakeholder

- 200 -
networks and its computational capability is also not satisfactory for dealing with larger
sample space required to examine the Whole Network.
In this chapter, we first describe this new modeling platform, which is based on the
Danielson [1968] algorithm that originated from the circuit theory in electrical
engineering and utilizes the multiplication of the Dependency Structure Matrix (DSM,
a.k.a. Design Structure Matrix or the Adjacency Matrix) [Browning, 1998; Eppinger et
al., 1990, 1994; Steward, 1981a, 1981b] to search for all the simple cycles in a graph. In
addition to a better computational performance, this new modeling platform (“the DSM
modeling platform” hereafter) provides more convenience and flexibility for the network
analysis.
Once the DSM modeling platform is developed and a new family of network statistics is
subsequently constructed for the Whole Network, more computational and analytical
resources become available for modeling the complicated organizational hierarchies
within those large stakeholder organizations, as proposed in Chapter 4. Specifically, at
the end of this chapter, five basic principles for hierarchical modeling in the SVN are laid
out as an important extension of the Whole Network analysis. These principles are then
applied and also tested in Chapter 6, through a prospective case study for China’s Energy
Conservation Campaign.
Chapters 5 and 6 advance the analytical perspective of the SVN from a focal organization
to the whole network and together constitute the second module of the main body of this
dissertation (see Figure 1-1). The second module also presents a method to increase the
instrumental power of SVN in terms of generating less biased principles for modeling the
organizational hierarchies of large stakeholders.
5.2 Preparation: DSM Modeling Platform

- 201 -
As a necessary preparation for the Whole Network analysis, this section answers two key
questions surrounding the new modeling platform dedicated to the stakeholder networks,
that is, “Why the Danielson algorithm is chosen” and “How the corresponding DSM
platform is constructed”. After that, the RuSakOil case from Chapter 3 is revisited to
further explain the benefits of the DSM modeling platform. In addition, for the rare
situation when the SVN is too large to be solved even on the DSM modeling platform
established in this dissertation, a useful and justifiable technique to find approximate
solutions in a timely manner is also introduced, based on the relationships between the
modeling results and the length of value cycles in the SVN.
5.2.1 Choice of the Danielson Algorithm
First of all, for the convenience of discussion, the terms and essence of the SVN analysis
are reexamined through the lens of the graph theory, followed by a brief complexity
analysis for three major algorithms for simple cycle search, which is the central task
performed by the third step of “Searching” in the SVN analysis (see Figure 3-1). Based
on the results of complexity analysis as well as the convenience for network analysis
brought by the unique features associated with the DSM multiplication, the Danielson
algorithm is finally chosen as the basis for the new modeling platform.
5.2.1.1 The SVN Analysis through the Lens of Graph Theory
It is important to grasp the following concepts in graph theory [Bollobás, 1998; Diestel,
2005; Gross and Yellen, 2003; Hochbuam, 2008; Weinblatt, 1972] before discussing the
choice of appropriate algorithm for the SVN analysis:
Vertex: A node or point in a graph.
Degree of Vertex: The number of edges incident to a vertex in a graph.
Edge: A line with or without the direction in a graph.
Multiple Edges: Edges with the same source and target vertices.
Loop: An edge that connects a vertex to itself.

- 202 -
Path: A sequence of vertices such that from each of its vertices there is an edge
to the next vertex in the sequence.
Simple Path: A path with no repeated vertices.
Cycle: A path such that the start vertex and the end vertex are the same.
Simple Cycle: A cycle with no repeated vertices aside from the start/end vertex.
Graph: An ordered pair G: = (V, E) comprising a set V of vertices together with
a set E of edges, which are 2-element subsets of V.
Simple Graph: A graph that contains no loops or multiple edges. Simple graph
is also called strict graph.
Multigraph: A graph that is permitted to have multiple edges. It is noted that
loop is often excluded in multigraph.
Multidigraph: A directed graph that is permitted to have multiple directed
edges, viz., directed edges with the same source and target vertices.
Weighted Graph: Every edge in the graph is associated with a value.
Complete Graph: A graph in which each pair of vertices is connected by an
edge. Complete graph is also called universal graph.
Comparing the above concepts with the terms defined by the SVN analysis in this
dissertation, it is not difficult to find that, using the language of graph theory,
“stakeholder” is a vertex, “value flow” is an edge, “value path” is a simple path, “value
cycle” is a simple cycle, and the “SVN” is a weighted multidigraph. Further, based on the
four-step modeling framework (see Figure 3-1), the central task of the SVN analysis is
actually to enumerate all the simple cycles in a weighted multidigraph, for a pre-selected
focal vertex.
In modern graph theory, the condition of simple graph is usually implied, and multigraph
has not been studied as often as simple graph. However, the research of simple cycles can
be traced back to almost three hundred years ago—in 1735, Euler solved the classical
problem known as the “Seven Bridges of Königsberg” and discovered the Euler’s
Theorem [1736], which is often considered as the first theorem of graph theory
[Alexanderson, 2006, p. 567]: A finite graph has an Euler tour (viz., a single non-simple

- 203 -
cycle that covers the edges of the graph) if, and only if, it is connected and every vertex
has even degree—indeed, a representation of a graph as a union of simple cycles may be
obtained from an Euler tour by repeatedly splitting the tour into smaller cycles whenever
there is a repeated vertex. Further, Veblen’s Theorem [1912] states that the edge set of a
finite graph can be written as a union of disjoint simple cycles if, and only if, every
vertex has an even degree, which also applies to disconnected graphs, and can be
generalized into infinite graphs in which every vertex has finite degree [Sabidussi, 1964].
As discussed in Chapter 3, different from the often-implied condition of simple graph, the
SVN is generally a multigraph where multiple edges are permitted to reflect the fact that
one stakeholder may have multiple needs (even for the same type of resources, viz.,
political, information, goods/service, and financial) fulfilled by another stakeholder.
More importantly, the requirement of simple cycle in the SVN analysis also has realistic
meaning: First, the system model in the SVN analysis is static and therefore the dynamic
process of value accumulation, which can be the format of visiting a stakeholder multiple
times, will not be considered; Second, based on the Social Exchange Theory (SET), a
simple cycle represents the standard form of Generalized Exchange and has been taken as
the basic units to measure the impacts of stakeholder relationships in the network—any
value cycle with a stakeholder visited more than once can be actually interpreted as the
combination of several simple cycles—if it is allowed to visit a stakeholder multiple
times, some simple cycles will be counted more than others, and obviously there is no
point to do so. In addition, if one is interested in the question whether a specific SVN can
be represented by a union of disjoint value cycles, the Veblen’s Theorem stated above is
clearly applicable.
5.2.1.2 Complexity Analysis and Algorithm Choice
As discussed above, using the language of graph theory, the essence of the SVN analysis
is to enumerate all the simple cycles in a weighted multidigraph under certain constraints,
such as passing through a pre-selected vertex (viz., the focal organization) and obeying
the pre-defined rules for edge connection (viz., internal assets within stakeholders).
- 204 -
According to Johnson [1975, p. 77], there are two enumeration problems on sets of
objects—one is called “Counting” with the purpose of determining how many objects
there are in the set, and the other is called “Finding” with the purpose of constructing
every object in the set exactly once—it is obvious that the enumeration problem in the
SVN analysis belongs to the “Finding” category.
A following literature review suggests that simple cycle enumeration is a classic problem
with many applications in circuit theory, control theory, and communication systems
[Danielson, 1968; Johnson, 1975; Szwarcfiter and Lauer, 1976; Tarjan, 1972], where
simple cycle is also called the “elementary cycle” or “elementary circuit”. Weinblatt
[1972, pp. 43-44] once summarized: “In many applications of directed graph theory, it is
desired to obtain a list of the cycles of the graph. This information can then be used: (a)
to help break the feedback paths (of a control system, a logical network, a computer
program, etc.); (b) as part of a sophisticated system for optimizing computer programs; or
(c) to perform more general types of analysis on computer programs, such as estimation
of running times.”
Specifically, there are three major algorithms arising from the above applications for the
enumeration of simple cycles in a directed simple graph:
Johnson [1975] Algorithm: Using the backtrack search [Floyd, 1967] to
generate all the paths of the graphs and then identifying if it is a simple cycle.
Danielson [1968] Algorithm: Using the k-time multiplication (ordinary matrix
product) of DSM to find the simple cycles with a length of k.
Cartwright and Gleason [1966] Algorithm: Using the edge-digraph to obtain
the simple cycles with the same length step by step, based on the one-to-one
correspondence between the simple cycles of the original digraph and its edge-
digraph.
Note that there are many variants from the methods applied in the above three algorithms,
and for simplicity, only the most representative ones are listed. For these algorithms, their

- 205 -
time bound and space bound are summarized in Table 5-1 for a brief complexity analysis,
where “n” is the number of vertices, “e” is the number of edges, and “c” is the number of
simple cycles.
Table 5-1: Three Algorithms for Simple Cycle Enumeration in Directed Simple Graph
[Adapted from Mateti and Deo, 1976, p. 97]
From the above table, we observe that the Johnson algorithm has a manageable space
bound, compared to other two algorithms. However, a manageable time bound is more
desired nowadays as the major measurement for algorithm complexity, because for a
single computer, the accessible memory of a program is already constrained by the digit
characteristics (32-digit or 64-digit) of operation systems, although parallel computation
involving multiple computers is a possible way to improve. Comparing the time bound of
these three algorithms, it is not straightforward to conclude which one is the best, and
therefore we take a complete graph with n vertices (loops not allowed) as the benchmark
to quantitatively compare their time bound listed in Table 5-1, in light of the
deterministic relationships between n, e, and c in complete graphs (see Equations 5-1 and
5-2):
(Equation 5-1)
(Equation 5-2)
Simple Cycle Enumeration Algorithm Time Bound Space Bound Method Applied
Johnson [1975] (n + e)c n + e Backtrack
Danielson [1968] n(constant)n n(constant)n DSM Multiplication
Cartwright and Gleason [1966] n(constant)n n(constant)n Edge-digraph
e = n(n −1)2
c = nn − i +1
⎛⎝⎜
⎞⎠⎟n − i( )!
i=1
n−1
∑

- 206 -
Based on Equations 5-1 and 5-2, the comparison of the time bound of Johnson and other
two algorithms is shown in Figure 5-1. Note that in the time bound for the Danielson as
well as Cartwright and Gleason algorithms (see Table 5-1), there is a constant determined
by the graph itself—for simplicity, a few possible values have been chosen to make the
comparison of time bound easier.
Figure 5-1: Comparison of the Time Bound between Johnson and Other Two Algorithms
From the above figure, we conclude that the Johnson algorithm is not as efficient as other
two algorithms, because its time bound increases with the size of the graph much faster.
In addition, as discussed before, the unique structural features associated with the DSM
multiplication, which is the key operation applied in the Danielson algorithm, provide
more convenience and flexibility for the network analysis—for example, compared to the
Johnson as well as Cartwright and Gleason algorithms, it is much easier to extend the
application of the Danielson algorithm from directed simple graph to multidigraph (viz.,
the SVN)—more details are followed in the next Section. Mainly for these two reasons,
we choose the Danielson algorithm, or the multiplication of the DSM, as the
mathematical foundation for the new modeling platform of the SVN analysis.
Johnson Algorithm: (n + e)c
Danielson Algorithm & Cartwright and Gleason Algorithm:
n(const.)n, const. = 0.5, 1.0, 1.5, 2.0, 2.5, 3.0, 3.5
2 3 4 5 6 7n
10000
20000
30000
40000
50000
60000
Time Bound

- 207 -
5.2.2 Construction of the DSM Modeling Platform
After choosing the Danielson algorithm, or the DSM multiplication, as the mathematical
foundation, there is still significant work remaining for the construction of the new
modeling platform: First, the algorithm needs to be adapted for multidigraph or the SVN;
Second, many details regarding to software design need to be considered before the new
modeling platform can be used for the SVN analysis effectively and efficiently. In light
of our focus in strategic management, only the adaption of the algorithm is briefly
discussed here, while the details about the corresponding software, such as its
architecture, sample codes, and memo, are all documented in the Appendix19.
Specifically, centered on the adaption for the SVN analysis, this section explores the
representation, algorithm, and benefits of the DSM modeling platform. Figure 5-2 shows
a simplified example of the SVN used throughout the discussion. In this example, a, b, c,
d, e, f, g, and h are eight value flows between four stakeholders A, B, C, and D, which is
clearly a multidigraph according to the previous definition.
19 The executable Java code of the DSM modeling platform can be downloaded from http://systemarchitect.mit.edu/docs/SVNcode.zip, together with an instruction manual for the SVN analysis http://systemarchitect.mit.edu/docs/SVNmanual.pdf. This software package was developed with the collaboration from Yuan MEI at the MIT Computer Science and Artificial Intelligence Laboratory (CSAIL), and is currently in the application process for a U.S. patent protected by the relevant laws and regulations.
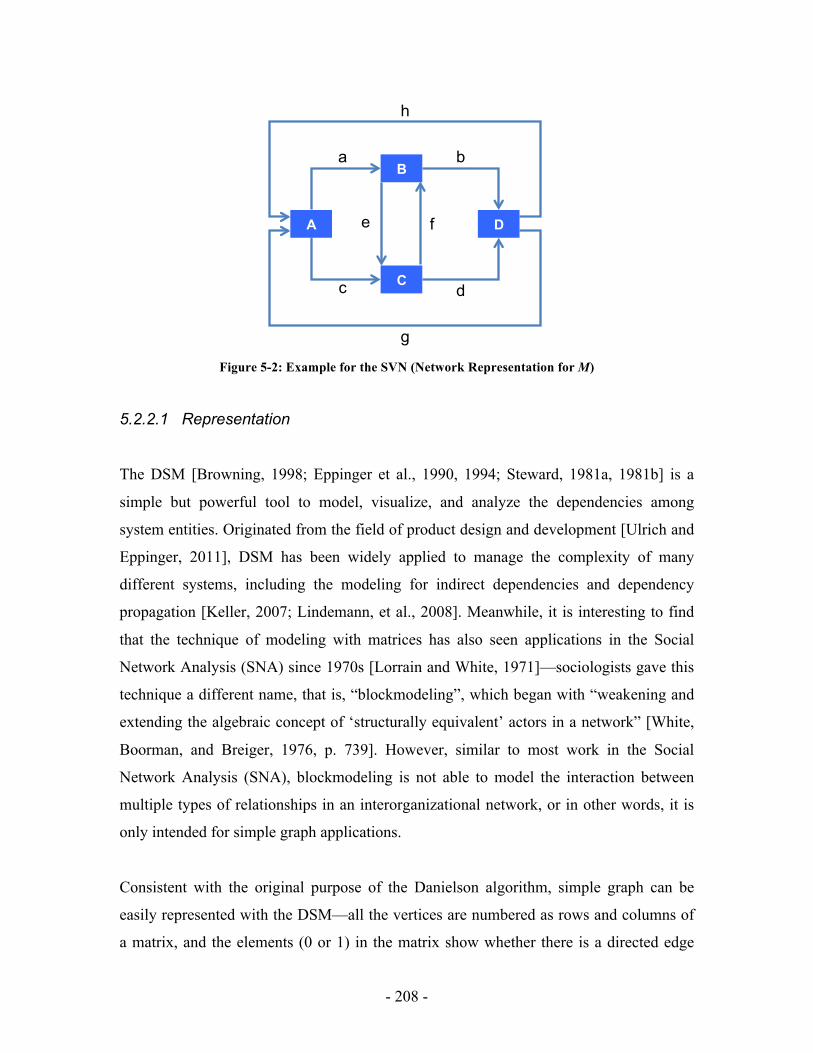
- 208 -
Figure 5-2: Example for the SVN (Network Representation for M)
5.2.2.1 Representation
The DSM [Browning, 1998; Eppinger et al., 1990, 1994; Steward, 1981a, 1981b] is a
simple but powerful tool to model, visualize, and analyze the dependencies among
system entities. Originated from the field of product design and development [Ulrich and
Eppinger, 2011], DSM has been widely applied to manage the complexity of many
different systems, including the modeling for indirect dependencies and dependency
propagation [Keller, 2007; Lindemann, et al., 2008]. Meanwhile, it is interesting to find
that the technique of modeling with matrices has also seen applications in the Social
Network Analysis (SNA) since 1970s [Lorrain and White, 1971]—sociologists gave this
technique a different name, that is, “blockmodeling”, which began with “weakening and
extending the algebraic concept of ‘structurally equivalent’ actors in a network” [White,
Boorman, and Breiger, 1976, p. 739]. However, similar to most work in the Social
Network Analysis (SNA), blockmodeling is not able to model the interaction between
multiple types of relationships in an interorganizational network, or in other words, it is
only intended for simple graph applications.
Consistent with the original purpose of the Danielson algorithm, simple graph can be
easily represented with the DSM—all the vertices are numbered as rows and columns of
a matrix, and the elements (0 or 1) in the matrix show whether there is a directed edge
A
B
C
D
a
c
b
e
d
f
g
h

- 209 -
from row vertex to column vertex. But in order to represent the multidigraph or the SVN,
two modifications need to be made for traditional DSM: First, defining the matrix
elements as characters to name edges (or as 0 if there is no edge); Second, using the
“addition” operation to connect the names of multiple edges with the same source and
target vertices. With these modifications, the following DSM (see Figure 5-3) represents
the SVN shown in Figure 5-2:
Figure 5-3: DSM Representation for M
For example, the element (4, 1) in M is “g + h”, which means there are two directed
edges (viz., value flows) “g” and “h” from Vertex “4” to “1” (viz., from Stakeholder “D”
to “A”), in Figure 5-2. Note that all the diagonal elements (i, i) in M must be zero,
because loops are not allowed in the SVN as discussed before. In addition, it is
worthwhile to point out that the modified DSM in this dissertation is similar to a few
concepts in other scholarly work, such as the modified Variable Adjacency Matrix
[Danielson, 1968], N-Matrix [Paz, 1967], and the Reachability/Visibility Matrix
[Warfield, 1973].
5.2.2.2 Algorithm
Multiplying M by itself once (ordinary matrix product), the resulting new DSM (see
Figure 5-4) is:
A B C D
A a c
B e b
C f d
D g+h

- 210 -
Figure 5-4: DSM Representation for M2
By observation, we conclude that the element (i, j) in the new DSM represents all the
paths (viz., value paths) from Vertex (viz., Stakeholder) “i “to “j” with path length equal
to 2. Particularly, the diagonal elements (i, i) in the new matrix may not be zero, because
now they represent all the value cycles with a length of 2 (viz., Restricted Exchange in
the form of “AóB”) for Stakeholder “i”. This conclusion can be generalized to the k-
time multiplication (k ≤ n, the total number of vertices) of the modified DSM. For
example, when k = 3, the corresponding DSM (see Figure 5-5) is:
Figure 5-5: DSM Representation for M3
A B C D
A cf ae ab+cd
B bg+bh ef ed
C dg+dh fe fb
D ga+ha gc+hc
A B C D
A abg+abh+cdg+cdh aef cfe cfb+aed
B edg+edh bga+bha bgc+bhc+efe efb
C fbg+fbh dga+dha+fef dgc+dhc fed
D gcf+hcf gae+hae gab+hab+gcd+hcd

- 211 -
Therefore the multiplication of the modified DSM can be applied as the basic algorithm
to model the value propagation in the SVN, which in fact is to search for all the simple
cycles for a focal organization and also calculate the utility scores of these cycles.
Additionally, in order to accommodate the specific requirements of the SVN analysis, the
following four important features have been integrated into the DSM modeling platform:
“Simple Path Only”, “Connection Constraints”, “Path Score Calculation”, and “All the
Value Paths”.
Simple Path Only
As highlighted earlier in this chapter, the central task of the SVN analysis is to find all the
simple paths in the stakeholder network, and therefore the DSM modeling platform
should filter out the non-simple paths (see the circled elements in Figure 5-5 for example)
and only keep those simple ones. The requirement of “Simple Path Only” can be met by
satisfying the condition that no vertex in the path has input/output degrees (viz., the
number of edges incident to that vertex) greater than 2, when connecting two paths/edges.
Meanwhile, this requirement also explains the condition of “k ≤ n, the total number of
vertices” listed above, because the longest length of the simple paths/cycles in a
multidigraph equals the total number of vertices—these longest simple paths/cycles are
often called the “Hamiltonian paths/cycles” by operations researchers [Danielson, 1968,
p. 294].
Connection Constraints
To ensure that the connections between edges (viz., value flows) are reasonable,
appropriate constraints between each stakeholder’s input and out flows should be
satisfied, and these constraints are actually the “internal assets” within stakeholders, as
discussed in Chapters 3 and 4 (see Figure 4-15 for example). Specifically, the DSM
modeling platform reads all the connection constraints as the initial inputs, in the format
of listing the connectable outputs for a specific input. And then an “edge constraint
check” is conducted during each time when two paths P1 and P2 are to be connected: The

- 212 -
last edge of P1 is checked against the first edge of P2 to determine whether they are
connectable. In order to perform the task of edge constraint check more efficiently, a
Hash Map is maintained by the DSM modeling platform to record all the connectable
information—if the paths/edges are not connectable, the resulting path/cycle will be
dropped before running the next multiplication. Note that in computer sciences, a Hash
Map [Corman et al., 2001, p. 221-252; Gonnet, 1984; Knuth, 1973; Luhn, 1953] is a data
structure that uses a hash function to map identifying values, known as keys, to
associated values, and by doing this, its major advantage over other data structures is
speed, which is even more apparent when the number of entries becomes large.
Path Score Calculation
In order to calculate the utility scores of value paths at the same time, the DSM modeling
platform reads the value flows and their scores together as the initial inputs. And then, the
computation for path score is finished in parallel with the generation of that path by
multiplying the DSM. In addition, for the purpose of improving the computational
efficiency, all the previous paths/cycles and their scores are stored in the DSM platform
so that the score for a new path/cycle can be obtained from the score of two existing
paths/edges forming that new path/cycle.
All the Value Paths
As discussed before, the k-length value cycles for a focal stakeholder “i” will be exactly
represented by the diagonal element (i, i) in the resulting DSM after k-time multiplication
(k ≤ n, the total number of stakeholders). In order to find all the value cycles for that
stakeholder, which constitute the sample space for the subsequent SVN analysis, the
DSM platform adds all the diagonal element (i, i) together, from the initial DSM
representing the network itself to the last DSM obtained after n-time multiplication.
In summary, with the above four features integrated into its algorithm, the DSM
modeling platform is successfully constructed for searching, storing, computing, and
- 213 -
analyzing all the simple paths between any two vertices in a weighted multidigraph.
Specifically, all the simple cycles (viz. value cycles) for a pre-selected vertex (viz., the
focal organization) are taken as the sample space for network statistics measuring both
the exchange and structural properties of the SVN, as demonstrated in Chapters 3 and 4.
5.2.2.3 Benefits
After running numerous and rigorous tests for the DSM modeling platform (software
architecture, sample codes, and memo are documented in the Appendix), the following
three major benefits of the DSM platform are confirmed:
Computational Performance: Although the simple cycle search is an NP-hard
problem (viz., No-Polynomial Hard Problem, definition see Corman et al. [2001,
p. 986]) by nature, the DSM multiplication algorithm is very efficient for most
cases in which the SVN analysis has been applied, especially after a few
algorithmic improvements such as the Hash Map to optimize the usage of
computer memory during calculation.
All-at-Once: After n-time multiplication of the initial DSM (n is the total
number of stakeholders), all the simple paths (viz., value paths) between any two
vertices (viz., stakeholders) can be obtained simultaneously. This useful feature
associated with matrix structure and operation brings more flexibility and
convenience for the SVN analysis, as shown later in this section when revisiting
the RuSakOil case.
Strategic Implication: First, for the diagonal elements in the resulting DSM,
each element represents the sample space for a Focal Organization, which can be
used to interpret the implications for that organization, while all the diagonal
elements together represent the sample space that can be used to interpret the
implications for the Whole Network, which are discussed later in this chapter as
an important development of the SVN analysis. Second, for the off-diagonal
elements in the resulting DSM, Element (i, j) represents the influence (viz., value
paths) from Stakeholder “i” to Stakeholder “j”, and further Element (i, j) and

- 214 -
Element (j, i) represent the relationship balance between Stakeholders “i” and
“j”, which are discussed extensively through the Issue Networks in Chapter 4.
These implications are explained below (see Figure 5-6) with the same example
in Figure 5-2 (non-simple paths have been filtered out):
Figure 5-6: DSM Representation for the Implications of M3
5.2.2.4 Comparison between DSM and OPN
Based on the numerous tests for the DSM modeling platform, we observe that compared
to the OPN platform, the major advantage of the DSM platform is better computational
performance in terms of both the running speed and the network size these platforms can
handle.
There are three important factors responsible for such an advantage: First, the DSM
platform is built upon the modified Danielson algorithm, which has a manageable time
bound as concluded in the previous complexity analysis (see Figure 5-1), while the
mathematical foundation for the OPN platform remains unclear and may have not been
optimized for the SVN analysis (viz., simple cycle search in multidigraph); Second, the
DSM platform integrates a few algorithmic improvements such as the Hash Map to
optimize the usage of computer memory during calculation; Last but not least, the DSM
platform dismisses the visualization feature (see Figure 3-12 ~ 3-14 and Figures 4-13 ~ 4-
A B C D
A abg+abh+cdg+cdh cfb+aed
B edg+edh bga+bha bgc+bhc
C fbg+fbh dga+dha dgc+dhc
D gcf+hcf gae+hae gab+hab+gcd+hcd

- 215 -
14) for the SVN and the corresponding modeling process to save more memory on single
computers, although the visualization is an attracting feature for the OPN platform to
showcase the SVN analysis with small networks.
5.2.3 RuSakOil Case Revisited
After the successful construction of the DSM platform, the simplified RuSakOil case (see
Figure 3-3) in Chapter 3 is briefly revisited here to better understand the forms and
benefits of this new modeling platform for the SVN analysis.
First of all, the left DSM in Figure 5-7 represents the qualitative model of the RuSakOil
case by showing the number of value flows from column stakeholders to row
stakeholders. Meanwhile, the right DSM in the same figure shows the total utility score
of value flows from column stakeholders to row stakeholders, which is calculated with
the answers to the stakeholder questionnaire and provides the inputs for the subsequent
quantitative model for the RuSakOil case.
By virtue of the DSM platform, the left DSM in Figure 5-8 summarizes the number of all
the value paths between any two stakeholders, while the right DSM in the same figure
lists the total utility score of those paths. The diagonal elements in these DSM, as
discussed before, can be taken as the sample space to study the strategic implications
from either the Focal Organization’s perspective or the perspective of the Whole
Network. In addition, two off-diagonal elements located in symmetric positions reflect
the relationship balance between two stakeholders. More importantly, it is clear that with
the DSM platform, the value paths between any two stakeholders can be obtained “all-at-
once”—recalling similar results in the Project Phoenix case (see Table 4-2), it takes much
more efforts (196 times vs. once) for the OPN platform to obtain the same amount of
information about the SVN.

- 216 -
Figure 5-7: DSM for the Qualitative Model (Left) and the Inputs of the Quantitative Model (Right)
Figure 5-8: DSM for the Unweighted (Left) and Weighted (Right) Outputs of the Quantitative Model
Note that for all the DSM in Figures 5-7 and 5-8, the focal organization, market
stakeholders, and nonmarket stakeholders are differentiated with the same color-coding
system as Chapters 3 and 4.
5.2.4 Beyond the Computational Capacity
Although the above DSM modeling platform is very efficient for most cases in which the
SVN analysis has been applied until today, simple cycle enumeration (for either simple
graph or multigraph) is inherently an NP-hard problem, as highlighted by Tarjan [1972,
p. 1]: “In some cases the number of objects may grow exponentially with the number of
vertices in the graph; thus there are no algorithms with time bounds polynomial in the
size of the graph for solving such problems. Examples include enumerating the
elementary circuits, the spanning trees, or the cliques of a given graph.”
pro ent hcc inv con sup hcg loc ngo pro ent hcc inv con sup hcg loc ngo
Project: pro 3 2 1 1 2 1 Project: pro 1.6 1.2 0.4 0.4 1.2 0.4
Enterprise: ent 2 1 1 Enterprise: ent 1.2 0.8 0.4
Host-Country Corporation: hcc 1 1 Host-Country Corporation: hcc 0.2 0.2
Investors: inv 1 Investors: inv 0.2
Consumers: con 1 Consumers: con 0.4
Suppliers: sup 1 Suppliers: sup 0.4
Host-Country Government: hcg 1 1 1 1 Host-Country Government: hcg 1.0 0.5 0.5 1.0
Local Community: loc 2 1 Local Community: loc 1.2 0.2
NGO: ngo 1 NGO: ngo 0.4
pro ent hcc inv con sup hcg loc ngo pro ent hcc inv con sup hcg loc ngo
Project: pro 43 9 6 9 9 1 6 6 1 Project: pro 6.2 2.1 1.5 1.6 0.8 0.4 0.9 2.0 0.4
Enterprise: ent 2 20 12 1 1 2 12 12 2 Enterprise: ent 1.2 2.8 1.8 0.8 0.4 0.5 1.1 2.4 0.5
Host-Country Corporation: hcc 6 17 17 17 17 6 5 14 6 Host-Country Corporation: hcc 0.8 1.2 1.1 1.0 0.5 0.3 0.3 1.0 0.3
Investors: inv 2 1 12 1 1 2 12 12 2 Investors: inv 0.2 0.2 0.4 0.2 0.1 0.1 0.2 0.5 0.1
Consumers: con 2 1 12 1 1 2 12 12 2 Consumers: con 0.5 0.4 0.7 0.3 0.2 0.2 0.4 1.0 0.2
Suppliers: sup 1 9 6 9 9 1 6 6 1 Suppliers: sup 0.4 0.8 0.6 0.7 0.3 0.2 0.4 0.8 0.2
Host-Country Government: hcg 6 13 11 13 13 6 30 13 6 Host-Country Government: hcg 2.9 4.2 3.9 3.3 1.7 1.2 2.6 3.3 1.2
Local Community: loc 6 19 13 19 19 6 7 25 6 Local Community: loc 1.5 2.8 2.2 2.2 1.1 0.6 1.0 3.1 0.6
NGO: ngo 6 19 13 19 19 6 7 1 6 NGO: ngo 0.6 1.1 0.9 0.9 0.4 0.2 0.4 0.4 0.2

- 217 -
For the possible situation when the SVN is too large to be solved even with the DSM
platform, we propose to add the constraint of maximum length of value cycles as a
useful and justifiable modeling technique, which helps obtain good approximations for
important network statistics in a timely manner and without enumerating all the value
cycles or generating the whole sample space in the stakeholder networks.
The proposal for the above technique is based on an interesting observation from various
applications of the SVN analysis: Network statistics, such as the WSO (Weighted
Stakeholder Occurrence), will change with the size of the sample space by finding more
value cycles with longer length in the network; However, their values do not change too
much and tend to become stable after the maximum cycle length exceeds a small number
(around six).
Taking the Project Phoenix case (see Figure 4-3) as an example, which has a sample
space (see Figure 4-16) large enough for making observations, Figure 5-9 records the
changes of the WSO for each stakeholder with the maximum length of value cycles as
well as with the total number of value cycles in the sample space. Note that PP is
excluded from the list of stakeholders, as the WSO of the focal organization always
equals to 1 by definition (see Equation 3-3). In addition, with the DSM modeling
platform, the relationships between the WSO of each stakeholder and the maximum cycle
length as well as the size of the sample space can be easily obtained by increasing the
multiplication times of the DSM one by one.

- 218 -
Figure 5-9: WSO Changing with Cycle Length and Cycle Number in the Project Phoenix Case
From the above figure, a few key findings are made as below:
When the maximum cycle length (x axis in Figure 5-9) increases from one to
five, the WSO of each stakeholder (color dotted lines in Figure 5-9) experiences
significant changes (either increase or decrease), and the total number of value
cycles (grey bars in Figure 5-9), or the size of the sample space, also sees
significant change (increase only);
When the maximum cycle length increases from six to ten, the WSO of each
stakeholder becomes stable, in terms of both absolute and relative values, while
the size of the sample space still sees significant change (increase only);
When the maximum cycle length increases from eleven to fourteen, both the
WSO of each stakeholder and the size of sample space become stable, in terms of
both absolute and relative values;
Comparing the above three observations, we find the correlation between the
WSO and the maximum cycle length is stronger than that between the WSO and
the size of sample space, because longer value cycles tend to have smaller utility
scores (under both the “abc” and “abc2” rules) and therefore contribute less to the
0
1000
2000
3000
4000
5000
6000
0.0
0.1
0.2
0.3
0.4
0.5
0.6
0.7
0.8
0.9
1.0
1 2 3 4 5 6 7 8 9 10 11 12 13 14
Cyc
le N
umbe
r
WSO
Maximum (Cycle Length)
WSO Changing with Cycle Length and Cycle Number
PM LP
ISG UFG
LG NGO
INF CG
ISR CHO
CHP CSP
NTG

- 219 -
WSO, even the number of those longer cycles can increase significantly; In
addition, the WSO is influenced by the maximum cycle length through the
changes of both exchange and structural properties of the SVN at the same time.
Based on the above findings, we conclude that adding the constraint of maximum cycle
length is a useful technique to obtain good approximations for network statistics without
enumerating all the value cycles in the SVN. Further, the rationale behind this technique
can be justified from at least three aspects:
From the perspective of the focal organization, the maximum length of value
cycles reflects the difficulty level for the organization to engage its stakeholders
in an indirect way;
From the perspective of other stakeholders, the maximum length of value cycles
reflects the cognitive boundary for these stakeholders to realize they are involved
in an indirect value exchange;
From a more holistic perspective, the maximum length of value cycles reflects
the possibility for both the focal organization and its stakeholders to participate
in a generalized exchange as well as to maintain such an exchange with mutual
trust and social contracts against the problem of free-riding.
In fact, the above three justifications also suggest three promising directions respectively,
to further integrate the SVN analysis with other academic fields in future research:
In the field of stakeholder theory, it is important for firms and their managers to
understand how to define the stakeholder salience [Mitchell, Agle, and Wood,
1997] from a relational perspective and also factor in the impacts of indirect
relationships [Rowley, 1997];
In the field of social psychology, it is important for individuals and organizations
to understand how to identify the maximum distance [Harary, Norman, and
Cartwright, 1965; Jackson, 2008] to communicate with each other and trace the
received utility with their constrained cognitive capacity;

- 220 -
In the fields of exchange networks and social dilemma, it is important for
individuals and organizations to understand how to avoid the free-riding problem
in the situation of generalized exchange [Yamagishi and Cook, 1993], possibly
with the help of network game theory [Myerson, 1977] and the stag hunter games
[Skyrms, 2004].
Arguably the potential findings from these three directions can all deepen the knowledge
in strategic management for the practical implementation of generalized exchange as an
effective stakeholder strategy, and therefore both theoretical and empirical research in
each direction are much desired.
5.3 Development: from Focal Organization to Whole Network
Based on the previous work in Chapters 3 and 4, which mainly explore the implications
of the SVN from the perspective of a pre-chosen focal organization, this section provides
the methodological support to further explore the implications of the SVN from the
perspective of the whole network. In the Whole Network analysis, a new family of
network statistics is constructed from an expanded sample space, which includes all the
non-duplicate value cycles in the SVN, so that the stakeholder importance and other
network measurements can be evaluated in a more holistic view. With these more holistic
network measurements, as well as the additional computational resources provided by the
DSM modeling platform, it is possible to bring forward a few principles for hierarchical
modeling in the SVN as an important extension of the Whole Network analysis.
5.3.1 Motivation for A More Holistic View
As discussed in Chapter 2, in recent research of Stakeholder Theory, there have been a
few proposals [Lucea, 2007; Mahon, Heugens, et al., 2003; Rowley, 1997] for applying
the network approach from social sciences, especially the Social Network Analysis
(SNA), to overcome the limitation of the traditional “Hub-and-Spoke” Model and study

- 221 -
the networked relationships between stakeholders. We argue that, however, an inherent
methodological difference between Stakeholder Theory and the Social Network Analysis
(SNA) has not yet received enough attention: For Stakeholder Theory, by definition
[Freeman, 1984, p. 46], a focal organization and its objectives always come at the first
place, and then the stakeholders are identified by the criterion of whether they “can affect
or is affected by the achievement of the organization’s objectives.” Although later on
more rigorous theories, such as the “stakeholder salience” [Mitchell, Alge, Wood, 1997],
have been developed to better identify “who and what really counts”, it is still necessary
to select a focal organization before everything else; By contrast, in the Social Network
Analysis (SNA), the requirement for such a focal actor does not exist (except the special
case of the “ego-centered” networks, which “have been widely used by anthropologists to
study the social environment surrounding individuals (Boissevain, 1973) or families
(Bott, 1957)” [Wasserman and Faust, 1994, p. 42]), and on the contrary, one main
purpose of the Social Network Analysis (SNA) is to find who is the focal actor in a
network by virtue of the structural measurement of “centrality” (see Table 2-3)—as put
forward by Wasserman and Faust [1994, pp. 42-43], “a social network arises when all
actors can, theoretically, have ties to all relevant actors”, and therefore “the primary
object of study” in the Social Network Analysis (SNA) is “this complete collection of
actors (one or more sets) and the ties among them.”
Also rooted in the network approach from social sciences, the SVN analysis in this
dissertation develops a multi-relational network model as an improvement over the
traditional “Hub-and-Spoke” Model, and then defines generalized exchange as the basic
units to measure the exchange and structural properties of such a network. Through
taking the impacts of indirect stakeholder relationships into consideration, the SVN
analysis provides a more comprehensive and therefore more accurate way to measure
interesting network properties, such as the stakeholder importance or the WSO, which
has been validated in Chapter 4 with the Project Phoenix case.
However, similar to other research in Stakeholder Theory, SVN analysis also requires the
choice of a focal organization at the very beginning. The above contrast between

- 222 -
Stakeholder Theory and the Social Network Analysis (SNA), in terms of whether or not
requiring a focal organization/actor, motivates us to also analyze the SVN from the
perspective of the whole network, instead of one single perspective of a pre-chosen focal
organization, in order to gain a deeper and more holistic appreciation for the properties of
the SVN.
For better understanding of the difference between these two perspectives, a simplified
SVN is shown as an example in Figure 5-10:
Figure 5-10: Example SVN Showing the Difference between Two Perspectives
In the above example, if taking A as the focal organization, it is apparent that B and C are
equivalently important from A’s perspective, because in the SVN there is only one simple
cycle consisting of “a”, “b”, and “c” for the focal organization A, and based on Equation
3-3, the WSO of B and C are the same. However, if examining their relationships from
the perspective of the whole network, another simple cycle consisting of “d” and “e”
emerges immediately—because this cycle does not pass through A, it has been missed in
previous analysis from the focal organization’s standpoint—but also because of this
cycle, compared to C, B is able to extract additional resources from D, which can be
important to fulfill A’s needs directly or indirectly, and therefore we argue that the
importance of B should not be treated equally to C, if a more holistic view is taken by
including those value cycles not passing through the focal organization.
A
B
D
C
a b
d e
c

- 223 -
In light of the above example, we further argue that it is beneficial for the SVN analysis
to move its analytical perspective from a focal organization to the whole network,
because by counting in all the value cycles in the SVN, the exchange and structural
properties of such a multi-relational network can be better measured with a more holistic
view. As a return, these more holistic measurements should be able to enhance the
descriptive accuracy of the SVN analysis and also supply this method with more
instrumental power—these benefits are validated in the end of this section by revisiting
the Project Phoenix case.
In addition, as proposed in Chapter 4, it is desired to be able to model the complicated
organizational hierarchies within large stakeholders. Following this proposal, we argue
the network measurements from the perspective of the whole network are less biased than
those from the perspective of the focal organization, and therefore should be taken as the
primary basis to identify large and important stakeholders in the SVN. Once those
stakeholders are identified, as demonstrated by the case study of China’s Energy
Conservation Campaign in Chapter 6, more computational and analytical resources can
be allocated to model their internal structures, from which more fine-grained decisions
are possible to be made accordingly.
Before proceeding to the details of the Whole Network analysis, a methodological caveat
should be given regarding to the limitation of the SVN approach: Moving from the
traditional “Hub-and-Spoke” Model to the SVN Model, as well as from the perspective of
a focal organization to the perspective of the whole network, we continuously advance
the frontier of the SVN analysis through gradually integrating the network approach from
social sciences with Stakeholder Theory. However, the inherent difference discussed
previously between stakeholder theory and the network approach cannot be completely
avoided in the SVN analysis, mainly because at the very beginning of the whole analysis,
all the data and information still have to be collected around a pre-chosen focal
organization, which is the starting point of stakeholder theory and determines the
egocentric nature of all the SVN models. In other words, the SVN model built around a
focal organization aims to reduce the egocentric bias and understand the stakeholder

- 224 -
network as a whole, but the network itself will not necessarily be the same as it would
have been if another stakeholder had been taken as the focal organization.
5.3.2 Upgrades of the DSM Modeling Platform
Based on the above motivation, the Whole Network analysis takes all the value cycles in
the SVN as the sample and then constructs a new family of network statistics to provide
more holistic and less biased measurements for the properties of the network. However,
in order to compute the new statistics for the whole network, it is necessary to make a
few upgrades for the DSM modeling platform.
5.3.2.1 Computing the Expanded Sample Space
The DSM modeling platform should be able to compute network statistics for the
expanded sample space, which includes all the value cycles in the SVN. Each diagonal
element in the resulting DSM represents the value cycles passing through that stakeholder
(see Figure 5-6), and therefore the sum of all the diagonal elements should represent all
the value cycles in the SVN, except the duplicate ones added as different permutations of
the same value cycle. Still taking Figure 5-6 as an example, in the sum of all the diagonal
elements, value cycle “abg” has other two permutations of “bga” and “gab” when B and
D are treated as the focal organization respectively. It is obvious that “abg”, “bga”, and
“gab” are actually the same value cycle, and further, this observation can be generalized
as: The k-length value cycle has exactly k permutations in the sum of all the diagonal
elements.
Arguably, in the expanded sample space, each value cycle should be counted only once
and other permutations of the same cycle should be filtered out from the sum of all the
diagonal elements in the resulting DSM. The main reason lies in that the difference
between value cycles has already been reflected in the way their utility scores are
calculated, and it does not make sense for the SVN analysis to count longer cycles more
than shorter cycles in the measurements for network properties. As highlighted by

- 225 -
Johnson [1975, p. 77], for the enumeration problems falling into the category of
“Finding”, their purpose is to construct “every object in the set exactly once.”
To do this, we propose two modeling techniques to filter out different permutations of the
same value cycle so that all the non-duplicate value cycles in the SVN can be found for
the Whole Network analysis:
Technique A: First adding all the diagonal matrix elements together, and then
identifying different value cycles of the same length with the sum code of all the
edges in each cycle;
Technique B: First dividing the score of each value cycle by its own length, as
the k-length cycle has exactly k different permutations, and then adding all the
diagonal matrix elements together.
Compared to Technique A, which is an algorithmic technique and can be integrated into
software design, Technique B is more like a mathematical technique, because in fact it
does not find the complete set of non-duplicate value cycles, but utilizes the unique
features associated with the definitions of network statistics to bypass the check process
for duplicate cycles and still be able to calculate the values of those statistics, which
provide the foundation to interpret the strategic implications of the whole SVN.
Specifically, considering the benefit of finding the complete set of non-duplicate value
cycles, we choose Technique A to upgrade the previous DSM modeling platform (see
Software Architecture in the Appendix), while the application of Technique B is briefly
discussed later in this chapter, together with another technique of collapsing multidigraph
into simple graph in the Whole Network analysis.
5.3.2.2 Redefining the Value Propagation Rule
In addition to enabling computation for the expanded sample space, another important
upgrade from the previous DSM platform is to switch the value propagation rule in the

- 226 -
quantitative SVN model from “abc2” back to “abc”, which is the simple multiplicative
rule applied to the RuSakOil case in Chapter 3.
The redefinition of the value propagation rule is mainly based on the change of an
important modeling assumption when moving the analytical perspective of the SVN
analysis from a focal organization to the whole network. Recalling the utility model of
generalized exchange discussed in Chapter 3 (see Section 3.4), and also as emphasized by
Cameron, Crawley, Feng, and Lin [2011, p. 40]: “To solve the system, we first constrain
the satisfaction of all stakeholders to zero, leaving only the organization’s satisfaction in
the objective function. While mathematically convenient, this also best represents the
firm’s outlook—maximize the long term profitability of the firm, where the distinction
‘long term’ is interpreted as retaining stakeholders via non-negative satisfaction.”
We observe that the previous Focal Organization analysis assumes the utilities of other
stakeholders equal to zero, and obviously this assumption no longer holds in the Whole
Network analysis, which aims to understand the implications of the SVN as a whole,
instead of taking the egocentric view of a pre-chosen focal organization.
Therefore we argue that “abc” is a more appropriate rule to calculate the value
propagation in the Whole Network analysis, because it reflects both the benefits (viz., the
subjective utilities of each stakeholder or the value flow scores) and the costs (viz., the
difficulty to manage longer cycle and the constrain of cognitive capacity) of a value cycle
at the same time, and more importantly, it does not count the last value flow twice
(although the number “twice” may change with different choice of the “alpha” in the
utility function for generalized exchange, see Equation 3-16) to stress the egocentric
standpoint of the focal organization on its own needs.
5.3.3 Whole Network Measurements and Project Phoenix Case Revisited
With the above two important upgrades, the DSM modeling platform is now ready to
analyze the implications of the SVN from the perspective of the whole network.

- 227 -
First of all, based on the definitions of the WSO (Weighted Stakeholder Occurrence, see
Equation 3-3) and WVFO (Weighted Value Flow Occurrence, see Equation 3-6) in the
Focal Organization analysis, two similar network statistics are constructed from all the
value cycles in the SVN to measure the relative importance of stakeholders and value
flows in a more holistic way: NWSO (Network Weighted Stakeholder Occurrence, see
Equation 5-3) and NWVFO (Network Weighted Value Flow Occurrence, see Equation 5-
4). Similar to the WSO, we also name the NWSO as Exchange Centrality II, or Crawley
Centrality II.
(Equation 5-3)
(Equation 5-4)
For the convenience of comparison, Table 5-2 lists the equations for the WSO and
WVFO from the Focal Organization analysis, as well as for the NWSO and NWVFO
from the Whole Network analysis.
Table 5-2: Network Statistics Comparison between Focal Organization and Whole Network
From Equations 5-3 and 5-4, we observe that the values of NWSO and NWVFO only
depend on the score sum of a specific group of value cycles, which contain either a
particular stakeholder or a particular value flow. Therefore, under this situation, it will
Network Weighted Stakeholder Occurrence (NWSO) =
Score Sum of All the Cycles Containing a Specific Stakeholder
Score Sum of All the Cycles in the Network
Network Weighted Value Flow Occurrence (NWVFO) =
Score Sum of All the Cycles Containing a Specific Value Flow
Sum (Score Sum of All the Cycles Containing a Specific Value Flow)
Focal Organization Analysis Whole Network Analysis
Stakeholder Importance
Value Flow Importance
WSO =
Score Sum of the Value Cycles Containing a Specific Stakeholder
Score Sum of All the Value Cycles for the Focal Organization NWSO =
Score Sum of All the Cycles Containing a Specific Stakeholder
Score Sum of All the Cycles in the Network
WVFO =
Score Sum of the Value Cycles Containing a Specific Value Flow
Sum (Score Sum of the Value Cycles Containing a Specific Value Flow) NWVFO =
Score Sum of All the Cycles Containing a Specific Value Flow
Sum (Score Sum of All the Cycles Containing a Specific Value Flow)

- 228 -
not be necessary literally “finding” all the value cycles in that specific group, and the
primary task for the calculation of the NWSO and NWVFO will be “counting” the total
utility scores of these value cycles (see Johnson [1975, p. 77] for the difference between
“counting” and “finding” in enumeration problems, as discussed earlier in this chapter).
Based on the above observation as well as the “abc” rule chosen for the Whole Network
analysis, a special technique can be devised to calculate the NWSO and NWVFO without
finding all the value cycles in the SVN. As shown in Figure 5-11, this technique collapses
a multigraph (vertices: A1, B1, C1 and edges: a1, a2, b1, b2, c1, c2), which is the standard
form of the SVN, into a simple graph (vertices: A, B, C and edges: a, b, c) by combining
multiple edges into a single edge (a = a1 + a2; b = b1 + b2; c = c1 + c2), and then calculates
network statistics for the simple graph, which can finally be converted back to the
measurements for the original multigraph (see Equations 5-5 and 5-6 as an example).
Figure 5-11: Example for the Conversion between Multidigraph and Simple Graph
(Equation 5-5)
(Equation 5-6)
As discussed before, by integrating the above technique with the Technique B for the
computation of the expanded sample space, there is no need to find all the value cycles in
the SVN and meanwhile the check process for duplicated cycles can also be bypassed, if
A1 (A)
B1 (B) C1 (C)
a1
a2
b1
b2
b = b1+ b2
c1
c2
a = a1+ a2 c = c1+ c2
Score Sum of All the Cycles in Multigraph= a1b1c1 +a1b1c2 +a1b2c1 +a1b2c2 +a2b1c1 +a2b1c2 +a2b2c1 +a2b2c2
= (a1 +a2 )(b1 +b2 )(c1 +c2 )= abc=Score Sum of All the Cycles in Simple Graph
NWSOA1= NWSOA
NWVFOa1= NWVFOa *
a1a= NWVFOa *
a1a1 + a2

- 229 -
the objective of the analysis is not to identify the top value cycles with the highest utility
scores. These benefits will certainly save more computational resources and speed the
calculations for the NWSO and NWVFO in the Whole Network analysis. In addition,
once the multigraph is collapsed, the algorithms only applicable for simple graph will
then become available to improve the efficiency of the DSM modeling platform.
Now the previous Project Phoenix (PP) case is briefly revisited in the Whole Network
analysis. Specifically, the NWSO of each stakeholder (including PP) is calculated with
Equation 5-3 and then compared to the WSO from the Focal Organization analysis in
Chapter 4. Note that the concept of the NWSO has also been applied in the SVN analysis
for the Mobile Services Ecosystem [Arvind, 2009, pp. 53-57], based on our suggestion.
Figure 5-12: Comparison between NWSO and WSO in the Project Phoenix Case
Figure 5-12 directly compares the NWSO and the WSO of each stakeholder. We observe
that, however, these two network statistics are not on the same scale, as the sample space
of the Whole Network analysis is larger by adding the value cycles not passing through
PP, which is the focal organization in previous analysis. In order to make such a
comparison more meaningful, the values of the NWSO are adjusted from PP’s
perspective—in another word, after adjustment, PP’s NWSO and WSO both equal to 1.0.
The comparison between the adjusted NWSO and the WSO is shown in Figure 5-13.
0.0
0.2
0.4
0.6
0.8
1.0
PP PUM LOP HSG UFG LOG NGO INF FCG ASR FCT FCP CSP NTG
Project Phoenix Stakeholder Value Network
WSO
NWSO

- 230 -
Figure 5-13: Comparison between NWSO_Adjusted and WSO in the Project Phoenix Case
From the above figure, we conclude that by including all the value cycles in the SVN—
more specifically, by also considering the value cycles not passing through PP—the
relative importance (for PP) of three stakeholders have seen the biggest increase, and
these three stakeholders are Local Governments (LOG), Local Public (LOP), and Public
Media (PUM). This conclusion is surprisingly consistent with the previous conclusion
made from a similar comparison between the “Hub-and-Spoke” Model (see Figure 4-25)
and the SVN model for a foal organization (see Figure 4-19). In that comparison, by
adding the indirect relationships between PP and its stakeholders (viz., the value cycles
passing through PP) into consideration, PUM and LOP are identified as the two most
important stakeholders, and meanwhile, the relative importance of LOG has also seen the
biggest increase.
For better understanding, the above conclusions are restated in a more systematic way:
Going from the “Hub-and-Spoke” Model to the SVN model for PP, the size of
sample space increases from 21 value cycles to 5039 value cycles. The additional
5018 cycles represent the generalized exchanges between PP and its
0.0
0.2
0.4
0.6
0.8
1.0
PP PUM LOP HSG UFG LOG NGO INF FCG ASR FCT FCP CSP NTG
Project Phoenix Stakeholder Value Network
WSO
NWSO_Adjusted
- 231 -
stakeholders, and the impacts of these generalized exchanges spotlight the
relative importance of PUM, LOP, and LOG for PP.
Going from the SVN model for PP as the focal organization to the SVN model
for the whole network, the size of sample space increases from 5039 value cycles
to 6772 value cycles. The additional 1733 cycles represent the generalized
exchanges only between PP’s stakeholders, and the impacts of these generalized
exchanges further spotlight the relative importance of PUM, LOP, and LOG for
PP.
Based on the later developments in this retrospective case study (viz.,
unanticipated firestorm of protest from PUM and LOP), we conclude that the
Whole Network SVN model is a significant improvement over the “Hub-and-
Spoke” Model, for both exchange and structural network properties. Further, the
description for the phenomena associated with network properties also becomes
more and more accurate. These benefits clearly demonstrate the strength of the
SVN model in understanding the impacts of networked stakeholder relationships
on the long-term success of large engineering projects. In addition, as shown
through the two-stage development from the Focal Organization analysis to the
Whole Network analysis, the strength of the SVN approach is gradually built up
by taking a more and more holistic view for the social and economic
relationships between the focal organization and its stakeholders.
5.3.4 Principles for Hierarchical Modeling
Once the DSM platform is developed and new statistics for the whole network are
constructed, more computational and analytical resources are now become available to
model the organizational hierarchies within large stakeholders, as discussed in Chapter 4.
Before laying out the principles for hierarchical modeling and then applying them to the
SVN analysis, it is an essential task to define the meaning of “hierarchy”, a fashionable
word across many academic fields, such as physics, biology, engineering, social sciences,
and so on. Although in each field, the definition of “hierarchy” can be very different,

- 232 -
Simon [1962] was arguably the first one attempting to build “a theory of hierarchy” in
order to better understand and manage the complexity in social, physical, biological, and
symbolic systems.
In his groundbreaking paper, “The Architecture of Complexity” Simon defined
“hierarchy” in both a narrow and a broad way: Narrowly speaking, “hierarchy” refers to
“a complex system in which each of the subsystems is subordinated by an authority
relation to the system it belongs to” [Simon, 1962, p. 468]; By contrast, a broader
definition of “hierarchy” is “a system that is composed of interrelated subsystems, each
of the latter being, in turn, hierarchic in structure until we reach some lowest level of
elementary subsystem” [Simon, 1962, p. 468].
Specifically, based on the organizational context of the SVN analysis, we choose the
above narrow definition to explore how to model the relationships between a few smaller
stakeholders “subordinated by an authority relation” to a larger stakeholder they belong
to. As pointed out by Simon [1962, p. 468], the narrow definition of “hierarchy” is given
for the “hierarchic formal organization” often studied in social sciences, and within such
an organization, “each system consists of a ‘boss’ and a set of subordinate subsystems.
Each of the subsystems has a ‘boss’ who is the immediate subordinate of the boss of the
system.” He also observed “business firms, governments, universities all have a clearly
visible parts-within-parts structure” [Simon, 1962, p. 469].
Note that the above narrow definition of “hierarchy” is almost identical to the one used in
organizational economics, where the “hierarchy” generally refers to the organizations
with authorities, in contrast with the autonomous market. In fact, “hierarchies” and
“markets” are often treated as two opposite but complementary choices to form
organizations from the perspective of economics [Williamson, 1973, 1975, 1981].
After defining the “hierarchy”, we now propose five basic principles for hierarchical
modeling in the SVN, which are organized in a logic order and also followed by a brief
explanation:

- 233 -
Principle A: In the SVN, hierarchy is not an interorganizational, but an
intraorganizational phenomenon.
o Explanation: In both engineering systems [Moses, 2004b] and strategic
management [Thorelli, 1986] fields, it is a consensus that networks are
non-hierarchical in principle. Therefore, defined as interorganizational
networks by us, the SVN themselves are not hierarchies. In addition,
according to Simon’s definition [1962, p. 468] for “hierarchic formal
organization”, we treat hierarchies as intraorganizational phenomena.
Principle B: In the SVN, hierarchical modeling is not a bottom-up, but a top-
down approach to decomposing a stakeholder into a set of subordinate ones.
o Explanation: First, for an organization with multiple hierarchies, the top-
down approach is consistent with the nature order of human’s cognition,
which always evolves from simple observations to complicated ones.
Second, as a holistic network approach, starting from larger organizations
and then digging into their internal structures can ensure that the SVN
analysis does not miss the big picture at the first place. Last but not least,
the intraorganizational relationships are generally more dynamic than the
interorganizational relationships [Simon, 1962, p. 477], and therefore
should be more difficult to be captured in the SVN model, which is static
by nature. In another word, the top-down approach guarantees that the
merits of the SVN model are first applied to analyze those more static
relationships on the higher level of hierarchical model.
Principle C: In the SVN, importance and necessity are two criteria to identify
the stakeholders to be decomposed on the next level of hierarchical model.
o Explanation: Limited by the computational and analytical resources, it is
not realistic to model the detailed hierarchies within each stakeholder, and
therefore those important stakeholders have the priority to be decomposed
on the next level of hierarchical model to better understand and manage

- 234 -
their related complexities. Meanwhile, some important stakeholders may
have very simple internal structures, and under this situation, it is not
necessary to decompose these stakeholders to save more computational
and analytical resources.
Principle D: In the SVN, NWSO is a more holistic measurement for stakeholder
importance and therefore should be applied in hierarchical modeling.
o Explanation: As discussed in this chapter, especially demonstrated by
revisiting the Project Phoenix case, we conclude that compared to WSO,
NWSO is a more holistic measurement for stakeholder importance in the
SVN model, and therefore should be taken as the “importance” criterion in
hierarchical modeling.
Principle E: In the SVN, NWVFO is the network measurement for value flow
importance and can help NWSO build the hierarchical model on the next level.
o Explanation: As discussed in Chapter 3, WVFO identifies the most
important value flows and can be used with WSO together to manage the
complexity of the SVN model. Similarly, as an alternative for WVFO,
NWVFO can also be used with NWSO together in hierarchical modeling
for the SVN.
Next in Chapter 6, the above five basic principles for hierarchical modeling will be
discussed in more detail and also applied to a prospective case study for China’s Energy
Conservation Campaign.
5.4 Chapter Summary
As a necessary preparation for better computational performance, this chapter first
utilizes the Danielson [1968] algorithm for simple cycle search to build a new modeling
platform—the DSM platform—as the dedicated software tool for the SVN analysis. And

- 235 -
then, this chapter further develops the SVN modeling framework from the Focal
Organization analysis to the Whole Network analysis in two steps: First, the sample space
of network statistics is expanded by including all the non-duplicate value cycles in the
network; and then, a new family of network statistics is constructed to interpret the
strategic implications of the SVN from the perspective of the whole network, instead of a
pre-chosen focal organization.
Once the DSM platform is developed and new statistics for the whole network are
constructed, more computational and analytical resources are now become available to
model the organizational hierarchies within large stakeholders. Therefore, in the end of
this chapter, five basic principles for hierarchical modeling in the SVN are derived as an
important extension of the Whole Network analysis. In the next chapter, these principles
are discussed in detail and then applied to a prospective case study for China’s Energy
Conservation Campaign.

- 236 -
[This page left intentionally blank]

- 237 -
CHAPTER 6. CASE STUDY II: CHINA’S ENERGY
CONSERVATION CAMPAIGN
“Hierarchy, I shall argue, is one of the central structural
schemes that the architect of complexity uses.”
— Simon [1962, p. 468]
“The significant problems we face cannot be solved at the
same level of thinking we were at when we created them.”
— Albert Einstein (1879~1955)
6.1 Chapter Introduction
This chapter applies the Whole Network analysis developed in Chapter 5 to study a more
complicated SVN involving large stakeholders on the national scale, that is, China’s
Energy Conservation Campaign. As discussed in Chapter 4 (see Section 4.3.1.1), for
those large stakeholders, it is necessary to understand their internal structure before their
specific needs for value exchanges can be better identified. With the DSM modeling
platform and new measurements for the whole stakeholder network established in
Chapter 5, more computational and analytical resources are now available to perform
such an important task, viz., modeling the multi-level organizational hierarchies within
large stakeholders in the SVN.
Further, Chapter 5 proposes five basic principles for hierarchical modeling in the SVN:
Principle A: Hierarchy is an Intraorganizational phenomenon;
Principle B: Hierarchical modeling is a Top-Down approach to decompose a
stakeholder into a set of subordinate ones;

- 238 -
Principle C: Importance and Necessity are two criteria to identify the
stakeholders to be decomposed on the next level of hierarchical model;
Principle D: NWSO is a more holistic measurement for stakeholder importance
and therefore should be applied in hierarchical modeling;
Principle E: NWVFO is the network measurement for value flow importance
and can help NWSO build the hierarchical model on the next level.
Specifically, following the above principles, this chapter models the SVN of China’s
Energy Conservation Campaign from top to down into three different levels: On one
hand, the NWSO and NWVFO calculated in a higher-level model provide more holistic
measurements (than WSO and WVFO) for the most important stakeholders and value
flows, which are then decomposed into subordinate stakeholders and more detailed value
exchanges to form a lower-level model; On the other hand, the NWSO and NWVFO
(among other measurements) calculated in a lower-level model are expected to answer
interesting questions which are raised from the precedent higher-level model, but cannot
be completely answered by the information and analysis of the same level.
As argued by Simon [1962, p. 468], hierarchy is “one of the central structural schemes
that the architecture of complexity uses.” By modeling the multi-level organizational
hierarchies of large stakeholders, we intend to explore a systematic way to manage the
complexity associated with the SVN—not only better identify stakeholder needs through
mapping their internal structures, but also obtain a deeper appreciation of stakeholder
interactions from their value exchanges on a more detailed level. As a major extension of
the Whole Network analysis, hierarchical modeling provides the basis to formulate
effective strategies in order to improve the networked relationships between stakeholders
and therefore instill more instrumental power into the SVN methodology, in addition to
its descriptive accuracy demonstrated by the Project Phoenix case.
Before introducing the background of China’s Energy Conservation Campaign, it is
beneficial to highlight a few key differences between this case and the Project Phoenix

- 239 -
case in Chapter 4, so that the reason can be better understood why each case is chosen at
different stage during the development of the SVN method:
Main Purpose: The China case aims to demonstrate the instrumental power of
the SVN analysis through formulating the strategies to manage stakeholder
relationships, while the Project Phoenix case aims to demonstrate the descriptive
accuracy of the SVN analysis through explaining the outcome from the
networked stakeholder relationships;
Analytical Focus: The focus of the China case is to model the organizational
hierarchies of large and important stakeholders from the perspective of the whole
network, while the focus of the Project Phoenix case is to explore the integration
between stakeholders and strategic issues from the perspective of a focal
organization in the network;
Temporal Boundary: China’s Energy Conservation Campaign is a prospective
case which may last for decades, while Project Phoenix is a retrospective case
which lasts only five years;
Spatial Boundary: China’s Energy Conservation Campaign is a nationwide task
which may include many engineering projects among other activities, while
Project Phoenix is a specific engineering project conducted at one operating
facility in the United States;
Network Contexts: The social, political, economic, cultural and other contexts
in China and the United States are very different, and these differences will exert
huge impacts on the formation of as well as the consequent analysis for
stakeholder networks in these two case studies;
Modeling Platform: The Project Phoenix case utilizes the OPN modeling
platform, while the China case utilizes the DSM modeling platform, mainly
because of different sizes of these two SVN models and the corresponding
requests for computational capabilities.
6.2 Case Description and Modeling Preparation

- 240 -
This section first introduces China’s Energy Conservation Campaign, starting with a
short discussion on the challenges of energy utilization and sustainable development.
After that, the motivations behind this case study as well as the preparation process for
SVN models are also briefed.
6.2.1 China’s Energy Challenges and the Energy Conservation Campaign
In the past thirty years, with China’s rapid economic development, the whole country is
also facing uprecedented challenges of energy production as well as many social,
political, economic, and environmental issues related to energy utilization. These
challenges can be boiled down to five major conflicts [Ni, Chen, and Li, 2008]: (1) the
conflict between fast-growing energy demand and the limited capacity of energy supply;
(2) the conflict between environmental protection and energy consumption; (3) the
conflict between the rapid growth of demand for liquid fuel as well as the related energy
security and the increasing dependency on foreign oil and gas; (4) the conflict between
the energy quality required by fast urbanization as well as large rural regions and the
current availability of clean energy; (5) the conflict between the need to improve China’s
global image and the huge economic costs associated with reducing greenhouse gas
emissions. These major conflicts further put forward an urgent request for China to
achieve the sustainable development in energy production and ulitlization, while
maintaining its fast speed of economic growth and protecting the natural environment.
Specifically, as emphasized by Jiang Zemin [2008], the “core of the third generation” of
China’s leaders, the low efficiency of energy utilization is currently a big hurdle for
China’s sustainable development in energy, environment, and economy. Meanwhile,
energy conservation has been proven to be one of the most practical and effective
strategies to enhance the efficiency of energy utilitzation [Chai and Zhang, 2010; He,
Deng, and Su, 2010; Jiang, Sun, and Liu, 2010; Ma, Liu, Fu, et al., 2011]. Compared to
the advanced level of energy efficiency worldwide, there are still huge potentials for

- 241 -
China to save more energy in the ulitilization process and increase the energy efficiency
[Wang, 2008].
In addition, energy conservation has a more far-reaching significance for the sustainable
development of the whole society of China: First, as a developing country, China is still
far from the completion of its industrialization and urbanization process [TSMPT, 2008],
and in light of the experience of developed countries, this process has a significant path
dependence [Li, Ma, Pan, et al., 2006], which means the nationwide differences of
industrial structure and infrastructure mode will determine the “baseload” level of energy
utilization. Thus, in the early and middle stages of the development process,
implementing the strategy of energy conservation will help China avoid the “extensive
pattern” of economic growth, and fulfill the goal of the “resource-saving and
environment-friendly society” [Hu Jintao, 2007]. Second, the endowment of China’s
primary energy resources (viz., rich coal, poor oil, and little gas), as well as the fact of
coal-dominated energy supply in the long term, pose inherent difficulties for the
sustainbility of energy utilization in China. This situation is even worsened when climate
change and energy security nowadays become two major concerns of the international
community [IPCC, 2007; Yergin, 1991]. Nevertheless, it is these difficulties from both
domestic and international aspects that highlight the necessity for China to take the
strategy of energy conservation as one of the seven “basic national policies” [National
People’s Congress, 2007].
As such, Chinese government has launched a nationwide and decades-long Campaign for
Energy Conservation since its “Eleventh Five-Year Plan” [State Council, 2007], which
aimed to “reduce energy consumption per unit gross domestic product by 20%” from
2006 to 2010. However, although the whole society of China had made tremendous
efforts, this goal wasn’t turned into reality in the end of 2010. As a result, in the latest
“Twelfth Five-Year Plan” [State Council, 2012], the general goal of China’s Energy
Conservation Campaign has to be adjusted to “reduce energy consumption per unit gross
domestic product by 16%” from 2011 to 2015.

- 242 -
At the same time, Chinese policymakers and scholars began to reflect on the first five
years of the Energy Conservation Campaign and tried to come up with effective
strategies to win this critical campaign in the next a few decades. Many of them [CAE,
2009; Grimble and Wellard, 1997; Mushove and Vogel, 2005; Wu, Wu, and Lu, 2008;
Yang and Zhu, 2008] have realized the necessity and importance to view China’s Energy
Conservation Campaign as a large complex sociotechnical system [Qian Xuesen, 1988;
Dodder, Sussman, and McConnell, 2004]. Within such a system, it is crucial to identify
the relevant stakeholders, understand their different roles and specific needs, prioritize
the key relationships between stakeholders, and more importantly, manage these
stakeholder relationships in order to ensure the “long-term success” [Freeman, 1984;
Freeman, Harrison, and Wicks, 2007] of this campaign.
Clearly, initiated by the government, China’s Energy Conservation Campaign sets
quantitative requirements every five years for energy companies to improve their energy
efficiency and reduce the level of energy consumption. In addition to the government and
energy companies, however, there are many other stakeholders involved: Research and
education organizations provide policy suggestions to the government; Financial
institutions provide funds for energy companies to upgrade outdated equipment and adopt
new technologies; Technology and consulting companies develop more energy-efficient
equipment and technologies and then sell them to energy companies; Certification and
inspection companies evaluate the efforts of energy-saving made by each energy
company; Industrial associations issue industry standards for and collect statistical data
about energy efficiency; Moreover, non-governmental organizations (NGO), public
media, and even all the Chinese people, are also stakeholders participating in this
nationwide and decades-long campaign.
With more stakeholders identified, it becomes more difficult to understand the networked
and complicated relationships between stakeholders, as well as the impacts of these
stakeholder relationships on the whole campaign, before stakeholders and their
relationships can be effectively managed. This challenge brought the opportunity for us
to apply the SVN analysis to China’s Energy Conservation Campaign.

- 243 -
6.2.2 Research Collaboration, Data Collection, and Information Granularity
The SVN analysis for China’s Energy Conservation Campaign was based on a two-year
collaboration between MIT (System Architecture Group and Engineering Systems
Division), Tsinghua University (Tsinghua-BP Clean Energy Research & Education
Centre), and Chinese Academy of Engineering (China’s Energy Development Strategy
Project).
The input data for the SVN models were mainly collected over a three-month period in
Beijing, China, during which more than twenty interviews were conducted with senior
policy makers from the Chinese government, as well as representatives of Chinese energy
companies, industrial associations, universities, and other major stakeholders. In addition
to the interview data, hundreds of documents were reviewed prior to these interviews.
Particularly, significant support in obtaining access to various stakeholders was provided
by Dr. Bai Quan, Associate Director of the Energy Efficiency Center within the Energy
Research Institute of NDRC (National Development and Reform Commission), and
Professor Ni Weidou, Co-Chairman of the Energy Group of CCICED (China Council for
International Cooperation on Environment and Development) and Chairman of the
Science and Technology Committee of MOE (Ministry of Education).
Additional background for this case study can be found in Fu, Feng, Li, Crawley, and Ni
[2011], and the details of the solicitation of modeling inputs, especially the answers to
stakeholder questionnaires, have been discussed in previous chapters. However, it is
important to highlight a different experience from the Project Phoenix case—because the
temporal and spatial boundaries as well as the network contexts of the China case are
much broader and deeper, as summarized at the beginning of this chapter, the granularity
of modeling inputs collected from documents and stakeholder interviews are often not at
the same level and even vary a lot—for example, some needs of Stakeholder A are
directly provided by Stakeholder B, while Stakeholder A also has other needs fulfilled by
subordinate organizations of Stakeholder B, which may not have interest in or control

- 244 -
over these value exchanges between its subordinate organizations and Stakeholder A.
This situation poses challenges to choose the granularity level of the SVN models, and
necessitates the consideration of organizational hierarchy, an intraorganizational
phenomenon, in the SVN analysis. Based on the five principles of hierarchical modeling
(see Section 5.3.4), a “top-down” approach is applied to the China case—the SVN model
with a lower level of granularity will be built first, and then proceed to a higher level of
granularity with the aid of the WSO and WVFO calculated from the previous level—
therefore the focus of this chapter is put on the modeling results of each level SVN as
well as the interactions between different levels of the SVN models. In addition, the
concept of hierarchy will be discussed again in Appendix I when bridging the SVN
analysis to the architecting process for large engineering projects.
6.3 Level One of China SVN Model
As discussed before, the SVN model for China’s Energy Conservation Campaign consists
of three different levels: from Level One to Level Two and to Level Three, a “top-down”
approach is applied step by step to decompose those large and important stakeholders on
a higher level into a set of subordinate ones on a lower level. In other words, a lower-
level model contains more details about the organizational hierarchies of large and
important stakeholders, and therefore is often larger than a higher-level model in terms of
the number of stakeholders and value flows. Note that in this dissertation the level of
SVN model is different from the level of information granularity—a higher-level model
has a lower level of information granularity, because fewer and larger stakeholders are
included compared to a lower-level model—relatively speaking, a higher-level SVN
model is more coarse-grained, while a lower-level SVN model is more fine-grained.
There are at least three reasons why a “top-down” approach is applied in hierarchical
modeling of the SVN: First, the “top-down” approach is consistent with the nature order
of human’s cognition, which always evolves from simple observations to complicated
ones; Second, as a holistic network approach, starting from larger organizations and then

- 245 -
digging into their internal structures can ensure that the SVN analysis does not miss the
big picture at the first place; Last but not least, the intraorganizational relationships are
generally more dynamic than the interorganizational relationships [Simon, 1962, p. 477],
and therefore should be more difficult to be captured in the SVN analysis, which is static
by nature—to put it differently, the “top-down” approach guarantees that the merits of the
SVN analysis are first applied to analyze those more static relationships in the higher-
level SVN model.
Now this case study starts with the Level One of China SVN Model, and then proceeds to
Level Two and Level Three step by step. For each step, the discussions are mainly
focused on three aspects: (1) stakeholder maps of the qualitative SVN model and key
results from the quantitative SVN model; (2) new insights gained for the previous higher-
level SVN model; (3) implications for building the next lower-level SVN model.
6.3.1 Stakeholder Map and Key Results
Using the same color-coding system as previous chapters for market and nonmarket
stakeholders as well as four different types of value flows, Figure 6-1 shows the
stakeholder map for the Level One of China SVN Model, which consists of 10
stakeholders and 60 value flows.
As discussed in Section 6.1, the temporal and spatial boundaries as well as the network
contexts of the China case are very broad, in light of the widespread influence of energy
conservation on the Chinese economy and environment. Based on the previous case
description, a number of large stakeholders are present in the Level One Model, such as
the Chinese Government, Energy Companies, Chinese Industrial Associations, and so on.
However, it should be noted that the purpose of this case study is not to map the whole
Chinese society, but rather to gather the relevant inputs and outputs of the energy
utilization system from a stakeholder perspective. More importantly, because this is the
highest-level SVN model, the priority of network boundary specification should be put
on identifying all the large stakeholders, instead of including too many subordinate ones

- 246 -
of a large stakeholder, in order to ensure that the SVN analysis does not miss the big
picture at the first place. For example, from document review and stakeholder interviews,
there are initially more than 30 governmental organizations or administrative institutions
appearing in the long list of stakeholders, such as the National Energy Administration
(NEA), Ministry of Environmental Protection (MEP), Environmental Protection and
Resource Conservation Committee (EPRCC), and so on. Although many of them are
closely related to the Energy Conservation Campaign, the Level One Model chooses to
cluster them into one large stakeholder, that is, the Chinese Government. As discussed in
Chapter 5, because in reality there are no unlimited computational and analytical
resources, it is a reasonable and logical choice to allocate the limited resources on the
organizational hierarchies of those most important stakeholders—if the results from the
Level One Model don’t recognize the Chinese Government as one of the most important
stakeholders, it may not be necessary to consider the subordinate stakeholders within the
Chinese Government at the beginning, which will consume more computational and
analytical resources but produce less meaningful results.

- 247 -
Figure 6-1: Stakeholder Map for Level One Model
Dec
isio
n su
ppor
tS
tatis
tic d
ata
First-hand materials
Funding
Chinese Government(GOV)
Energy Companies(ENC)
Chinese People(PPL)
Chinese Research and Education Organizations
(REO)
Technology and Consulting Companies
(TCC)
Certification and Inspection Companies
(CIC)
Chinese Media(CME)
Chinese Industrial Associations
(CIA)
Non-governmental Organizations
(NGO)
Chinese Financial Institutions
(CFI)
Consumer preference of products and services
Supply of professional skilled laborSupply of high-quality and preferential-price products and services
Employment and wages
Thrift living mode
Laws and regulations
Sup
ervi
sion
Infrastructure building
Price subsidies
Political guidanceC
ultiv
atio
n of
con
scio
usne
ss
Fund
ing
Cultivation of professional skillCultivation of consciousnessFu
ndin
g
Sup
ervi
sion
Supervision
Supervision
Supervision
Supervision
Thrift producing modeAccomplishment of periodical target
Fulfillment of laws and regulationsQuality of statistic data
Cul
tivat
ion
of c
onsc
ious
ness
Funding
Administrative order and evaluationLaws and regulations
Guidance of economic mode
Financial preferential policies
Financial preferences
Laws and regulations
Aud
iting
and
cer
tific
atio
n
Technology innovations
Funding
Self-disciplinary of industries
Tech
nolo
gy in
nova
tion
Dec
isio
n su
ppor
t
Funding
Laws and regulationsFunding
Funding
Fund
ing
Pay
for a
uditi
ng &
cer
tific
atio
ns
Professional knowledge
Laws and regulations
Guide of economic modeReport of auditingand certifications
Statistic data Statistic data
Fiscal and tax policies
Statistic data
Decision support
Firs
t-han
d m
ater
ials
Political guidance
Practical experiences

- 248 -
Once the stakeholder map, or the qualitative SVN model, is obtained, as shown in the
four-step modeling framework (see Figure 3-1), the following steps are quantifying value
flows with stakeholder questionnaire, choosing the value propagation rule, searching for
all the value cycles, and finally calculating the network statistics. Similar to the RuSakOil
case in Chapter 3, “Need Intensity” and “Source Importance” are chosen as two attributes
to describe value flows from both the demand side and the supply side of the recipient
stakeholder (see Figure 3-9). In addition, according to the motivations discussed before,
the primary question of interest for the China case is how to effectively manage the most
important stakeholders through exploring their complicated organizational hierarchies,
and meanwhile, we conclude in Chapter 5 that NWSO (Network Weighted Stakeholder
Occurrence, a.k.a. Exchange Centrality II or Crawley Centrality II) is a more holistic
measurement for stakeholder importance than WSO (Weighted Stakeholder Occurrence,
a.k.a. Exchange Centrality I or Crawley Centrality I)—therefore the SVN analysis for
China’s Energy Conservation Campaign should be not centered on a pre-chosen Focal
Organization, but at the Whole Network level, by searching for all the value cycles in the
SVN and then taking them as the sample space for network statistics. Correspondingly,
“abc” is chosen as the value propagation rule in this case, and NWSO (see Equation 5-3)
are the key statistics for the DSM modeling platform to calculate.
Figure 6-2 ranks the NWSO calculated from the Level One Model (see Figure 6-1). We
observe that the two most important stakeholders surface as the Energy Companies
(ENC) and the Chinese Government (GOV), while the least important stakeholder is the
Certification and Inspection Companies (CIC). This observation identifies the ENC and
GOV as the stakeholders that should be explored in more details, and the corresponding
implications for the Level Two Model will be discussed later in this section. In addition,
based on the previous discussion on decomposing the impacts of indirect stakeholder
relationships (see Section 4.3.5.4), it is not difficult to find the reason why the CIC has a
very low score of NWSO—those Certification and Inspection Companies are only tasked
with the monitoring efforts for energy conservation and do not provide valuable outputs
to most stakeholders—therefore the low score of NWSO is mainly the result of their poor
structural position in the network.

- 249 -
Figure 6-2: Network Weighted Stakeholder Occurrence (NWSO) for Level One Model
As discussed in Chapter 5, in addition to the NWSO, it is also necessary to examine the
NWVFO (Network Weighted Value Flow Occurrence) in the network, because these
most important value flows can help build the next level of the SVN model. Specifically,
the top 20 (out of 60) value flows in the Level One Model (see Figure 6-1) are shown in
Figure 6-3, and the total weights of these value flows already exceed 50% of the weights
of all the value flows.
Figure 6-3 suggests that there is significantly less differentiation between these most
important flows, as compared with the Project Phoenix case—the slope of the curve is
much shallower.
In addition, two of the top four value flows represent flows provided to the Chinese
People (PPL), rather than flows to the Energy Companies (ENC), which is not consistent
with the fraction of energy consumed by the residential vs. industrial sectors—in China,
the largest developing country in the world, industry is always the dominate sector for
energy consumption and accounts for more than 60% of total primary energy
consumption for decades [Zhou, McNeil, Fridley, et al., 2007, p. 10]—such an
inconsistency indicates one of the limitations of the Level One Model.
0.0
0.2
0.4
0.6
0.8
1.0
ENC GOV PPL REO CIA NGO CME CFI TCC CIC
NW
SO_L
1
Stakeholder
NWSO for Level One Model
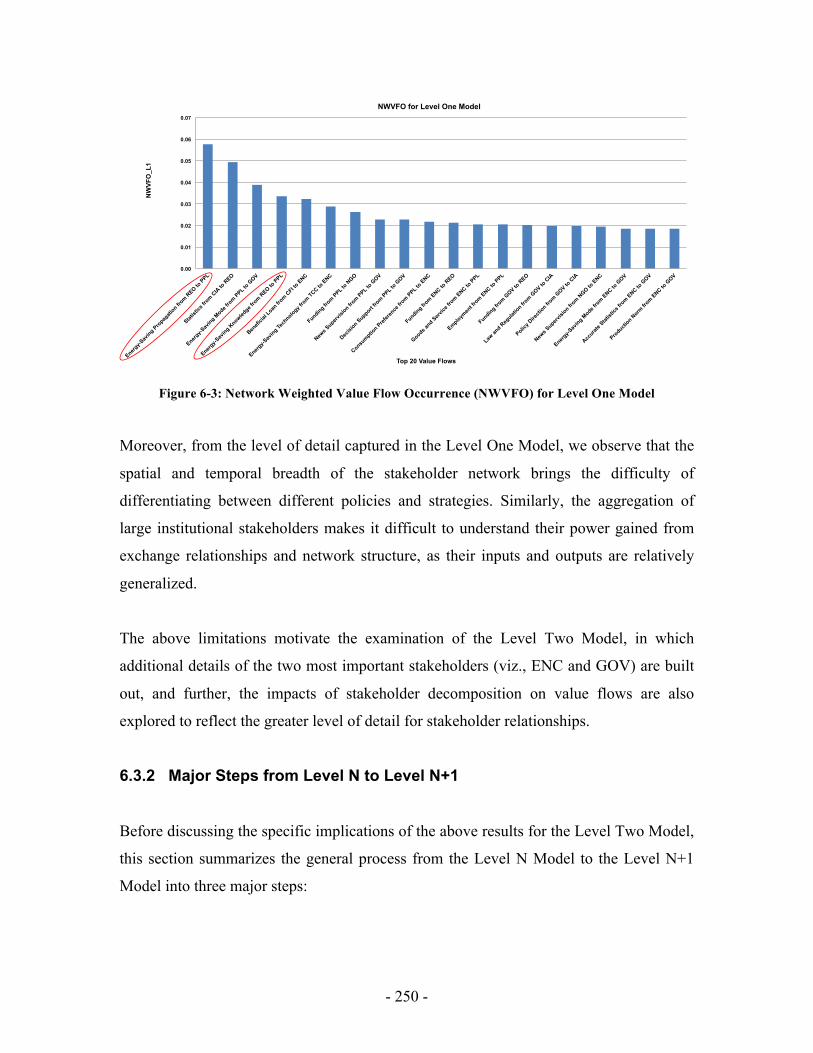
- 250 -
Figure 6-3: Network Weighted Value Flow Occurrence (NWVFO) for Level One Model
Moreover, from the level of detail captured in the Level One Model, we observe that the
spatial and temporal breadth of the stakeholder network brings the difficulty of
differentiating between different policies and strategies. Similarly, the aggregation of
large institutional stakeholders makes it difficult to understand their power gained from
exchange relationships and network structure, as their inputs and outputs are relatively
generalized.
The above limitations motivate the examination of the Level Two Model, in which
additional details of the two most important stakeholders (viz., ENC and GOV) are built
out, and further, the impacts of stakeholder decomposition on value flows are also
explored to reflect the greater level of detail for stakeholder relationships.
6.3.2 Major Steps from Level N to Level N+1
Before discussing the specific implications of the above results for the Level Two Model,
this section summarizes the general process from the Level N Model to the Level N+1
Model into three major steps:
0.00
0.01
0.02
0.03
0.04
0.05
0.06
0.07
Energy-S
aving Pro
pagati
on from R
EO to PPL
Statist
ics fr
om CIA to
REO
Energy-S
aving M
ode fro
m PPL to G
OV
Energy-S
aving K
nowledge f
rom R
EO to PPL
Benefi
cial L
oan fr
om CFI to
ENC
Energy-S
aving Te
chnology f
rom TCC to
ENC
Funding from PPL to
NGO
News S
upervisi
on from PPL to
GOV
Decisi
on Support fro
m PPL to G
OV
Consumptio
n Prefere
nce fr
om PPL to ENC
Funding from ENC to
REO
Goods and Serv
ice fr
om ENC to PPL
Employmen
t from ENC to
PPL
Funding from G
OV to R
EO
Law an
d Reg
ulation fr
om GOV to
CIA
Policy D
irecti
on from G
OV to C
IA
News S
upervisi
on from N
GO to ENC
Energy-S
aving M
ode fro
m ENC to G
OV
Accurat
e Stat
istics
from ENC to
GOV
Producti
on Norm
from ENC to
GOV
NW
VFO
_L1
Top 20 Value Flows
NWVFO for Level One Model

- 251 -
First, identify the stakeholders on Level N+1, based on the NWSO calculated from Level
N. In the China case, the NWSO from the Level One Model indicates Energy Companies
(ENC) and Chinese Government (GOV) are the two most important stakeholders (see
Figure 6-2), and therefore they are decomposed into several subordinate stakeholders in
the Level Two Model (see Table 6-1), so that more fine-grained decisions can be made
by exploring the organizational hierarchies of these important stakeholders. Note that it is
not necessary to decompose all the important stakeholders on the next level—for
example, although Chinese People (PPL) is the third most important stakeholder (see
Figure 6-2), compared to Energy Companies (ENC) and Chinese Government (GOV),
Chinese People (PPL) has more homogeneous needs in the Energy Conservation
Campaign and therefore can be treated as a whole group in the SVN—this is consistent
with the criterion of “Necessity” in Principle B for hierarchical modeling discussed in
Chapter 5. In addition, the number of stakeholders should always be kept manageable,
because adding too many subordinate stakeholders at once into the next level may waste
lots of computational resources and cause the SVN model not solvable. We suggest to
categorize the granularity of information collected from documents and stakeholder
interviews and also have a plan for the total number of organizational levels, before the
hierarchical modeling actually begins.
Second, identify the value flows on Level N+1, based on both the NWSO and NWVFO
calculated from Level N. Because the Level N+1 Model is only a “zoom-in” version of
the Level N Model by decomposing large and important stakeholders into subordinate
ones, it is obvious that the value flows should remain unchanged if their source and end
stakeholders are the same as Level N. In other words, the evolution from Level N to
Level N+1 will only impact the value flows that connect one or two decomposed
stakeholders, and these value flows can be further classified into four groups: (1) value
flows between the newly added “child” stakeholders and their “parent” stakeholder; (2)
value flows between the “child” stakeholders themselves; (3) value flows between the
“parent” stakeholder and other stakeholders; (4) value flows between the “child”
stakeholders and other stakeholders. This classification can be better understood through
a simplified example as below (see Figure 6-4):

- 252 -
Figure 6-4: Impacts of Stakeholder Decomposition on Value Flow Identification
In the above figure, on Level N+1, “a” and “b” are the “child” stakeholders, and “A'” is
the “parent” stakeholder (viz., the remaining part of “A”), while “B” keeps the same as
Level N. In addition, the above figure also labels four groups of value flows, which are
impacted by stakeholder decomposition, correspondingly. Note that the first two groups
of value flows describe the hierarchical relationships within a large and important
stakeholder (viz., Stakeholder “A”) and have nothing to do with the existing value flows
on Level N, and therefore both of them are represented by dotted arrows. By contrast, the
last two groups of value flows are represented by solid arrows, because they are different
from the first two groups in terms of their connections with the existing value flows on
Level N. Arguably, when Stakeholder “A” is decomposed into “a”, “b”, and “A'” on
Level N+1, the existing value flows between “A” and “B” (see Figure 6-4) should also
evolve into the value flows between “a” (and/or “b” and/or “A'”) and “B”, depending on
whether the existing value flows are substituted by a set of more detailed value flows, as
well as who are the specific stakeholders responsible for those value flows. To put it
differently, the third and fourth group of value flows belongs to interorganizational
relationships and therefore should be closely related to the existing value flows on Level
N, which are also interorganizational relationships; while the first and second group of
value flows belongs to intraorganizational relationships and therefore cannot find the
correspondents in the previous model.
A B
A'
B a b
Level N
Level N+1
(1)
(1)
(4)
(2)
(3)
(4)

- 253 -
Last but not least, once the stakeholders and value flows on Level N+1 are identified, the
logical consistency between stakeholders and value flows as well as between these two
levels should be carefully examined, before running the Level N+1 Model on the DSM
modeling platform. We suggest preparing similar templates (see Figure 3-2 and Figure 4-
2) for the newly added subordinate stakeholders, as well as to keep a good record for all
the changes from Level N to Level N+1. Based on the modeling experience from other
case studies, the increase of value flows is much faster than the increase of stakeholders,
and therefore linear relationships are often not observed between two different levels.
6.3.3 Implications for Level Two Model
As discussed before, based on the NWSO calculated from the Level One Model (see
Figure 6-2), Energy Companies (ENC) and Chinese Government (GOV) are chosen as
two large and important stakeholders to be decomposed in the Level Two Model.
Generally speaking, Energy Companies (ENC) can be broken out into Energy Producing
Companies (EPC) and Energy Using Companies (EUC), in terms of their different roles
(supply vs. demand) in the energy market20. In addition, with China’s policy of reform
and opening-up as well as the trend of globalization, more and more International Energy
Companies (IEC) have shown their strong interest in providing financial and technology
support for China’s Energy Conservation Campaign.
Meanwhile, although Chinese Government (GOV) has a unique and very complicated
structure including dozens of ministries, commissions, organizations, and institutions, the
Chinese Energy Policymakers (ENP) and the Chinese Environmental Policymakers
(ERP) are arguably two subordinate stakeholders most closely related to the Energy
Conservation Campaign. Moreover, considering the vast territory of China as well as the
huge imbalance of economic development between different areas, it is necessary to
20 On a more fine-grained level, some energy transportation companies may be included as well.

- 254 -
differentiate the Chinese Local Governments (CLG) from the Chinese National
Government (CNG) in light of their different stakes in the Campaign.
The above reasoning process is captured as the results of stakeholder decomposition (see
Table 6-1). As emphasized before, the number of stakeholders has not seen a big increase
(from 10 to 15), because adding too many subordinate stakeholders at once into the next
level may waste lots of computational resources and cause the SVN model not solvable.
In addition, at the beginning of this case study, it is designed to build a three-level SVN
model for China’s Energy Conservation Campaign, and therefore the Level Two Model
should only reflect the middle-level granularity of information collected from documents
and stakeholder interviews.
Table 6-1: Stakeholder Decomposition from Level One Model to Level Two Model
CHINA SVN LEVEL ONE (10 stakeholders) CHINA SVN LEVEL TWO (15 stakeholders)
Energy Companies (ENC)
Energy Using Companies (EUC)
Energy Producing Companies (EPC)
International Energy Companies (IEC)
Chinese Government (GOV)
Chinese National Government (CNG)
Chinese Energy Policymakers (ENP)
Chinese Environmental Policymakers (ERP)
Chinese Local Governments (CLG)
Chinese People (PPL) Chinese People (PPL)
Chinese Research and Education Organizations (REO) Chinese Research and Education Organizations (REO)
Chinese Industry Associations (CIA) Chinese Industry Associations (CIA)
Non-Governmental Organizations (NGO) Non-Governmental Organizations (NGO)
Chinese Media (CME) Chinese Media (CME)
Chinese Financial Institutions (CFI) Chinese Financial Institutions (CFI)
Technology and Consulting Companies (TCC) Technology and Consulting Companies (TCC)
Certification and Inspection Companies (CIC) Certification and Inspection Companies (CIC)

- 255 -
6.4 Level Two of China SVN Model
6.4.1 Stakeholder Maps and Key Results
After determining the stakeholders, the value flows between the newly added seven
stakeholders and other stakeholders as well as between seven stakeholders themselves
can also be identified with the method introduced before (see Figure 6-4). The resulting
stakeholder map for the Level Two Model is then visualized by different types of value
flows (see Figures 6-5 ~ 6-9), which are too dense to show in one graphic. Specifically,
two figures are needed to clearly display the Political Flows, and there are totally 176
flows connecting 15 stakeholders in the Level Two Model.
From these stakeholder maps, it can be immediately observed that the Energy Using
Companies (EUC) are structurally more centered than the Energy Producing Companies
(EPC) in the campaign, although their network statistics need to be further examined to
see whether they receive lots of regulation from or provide valued outputs to other
stakeholders. We also find that there does not exist a stakeholder taking centralized
responsibility for energy policies and regulations, such as the Department of Energy in
the United States, but rather a number of stakeholders combine to play this role, and they
are labeled together as the Chinese Energy Policymakers (ENP).
Additionally, it can be observed that there are many value flows between the subordinate
stakeholders (CNG, ENP, ERP, and CLG) decomposed from the Chinese Government
(GOV), and these flows represent very complicated intraorganizational relationships.
Through examining these relationships, it can be determined whether these stakeholders
have distributed and independent responsibility, or whether there exists overlapping or
potentially conflicting responsibility. In the case of the latter, the hierarchical modeling
should be able to identify which stakeholders hold structurally strong positions, as well as
formulate effective strategies to restructure the organizational hierarchies, so that these
stakeholders’ structural positions can be aligned with their given roles.

- 256 -
Figure 6-5: Stakeholder Map for Level Two Model (Political Flows Part 1)
Chinese National Government
(CNG)
Chinese Energy Policymaker
(ENP)
Chinese Environ Policymaker
(ERP)
Chinese Local Governments
(CLG)
Chinese People (PPL)
Chinese Research and Education Organizations
(REO)
Chinese Media (CME)
International Energy Companies
(IEC)
Non-governmental Organizations
(NGO)
Energy Producing Companies
(EPC)
Chinese Industrial Associations
(CIA)
Chinese Financial Institutions
(CFI)
Energy Using Companies
(EUC)
Support
Sup
port
Sup
port
Sup
port
Support
Sup
port
Support
Support
Support
Support
SupportSupportSupportSupport
Support
Assets Superv &Executive Appraisal
Com
plia
nce
Environ Permits
Sup
port
Assets Superv &Executive Appraisal
Sup
port
Environ Permits
Com
plia
nce
Sup
port
Sup
port
Sup
port
Sup
port
Support
SupportFulfillment
SupportFulfillment
SupportFulfillment
Sup
port
SupportSupport
SupportSupportSupport
Sup
port
Sup
port
News Direction
Com
plia
nce
Laws and Regulations
Com
plia
nce
Sup
port

- 257 -
Figure 6-6: Stakeholder Map for Level Two Model (Political Flows Part 2)
Chinese National Government
(CNG)
Chinese Energy Policymaker
(ENP)
Chinese Environ Policymaker
(ERP)
Chinese Local Governments
(CLG)
Chinese People (PPL)
Chinese Research and Education Organizations
(REO)
International Energy Companies
(IEC)
Non-governmental Organizations
(NGO)
Technology and Consulting Companies
(TCC)
Certification and Inspection Companies
(CIC)
Energy Producing Companies
(EPC)
Chinese Financial Institutions
(CFI)
Energy Using Companies
(EUC)
Access to Energy-Saving Project
Favorable Policies
Favorable Policies
Assurance for E
nergy-Saving and E
nviron Protection
Assurance for Energy-Saving and Environ Protection
Assurance for Energy-Saving and Environ Protection
Assurance for Energy-Saving and Environ Protection
Goa
l Ful
fillm
ent
Energy-Saving Goals
Energy-S
aving Goals
Goa
l Ful
fillm
ent
Energy-Saving Goals
Environ
Protection
Energy S
ecurity
Econom
icD
evelopment
Goal Fulfillment
Economic Development
Energy SecurityEnviron Protection
Creation of Energy-Saving Co’s
Perm
ission
Compliance
Com
plia
nce
Energy-S
avingP
roject Perm
its
Favorable Policies
Favorable Financial Policies
Favorable Taxation Policies
Energy-Saving Policy Suggestions
Suggested Goals
Approved Goals
Legislation for Energy
Energy LawImplementation
Environ Law ImplementationLegislation for Environ
Support on Curriculum and Construction
Laws and Regulations
Com
plia
nce
Com
plia
nce
Environ Protection Policy Suggestions
Chinese Industrial Associations
(CIA)
Support
Support
Approved Energy Prices
Suggested EnergyPrices
Com
plia
nce

- 258 -
Figure 6-7: Stakeholder Map for Level Two Model (Information Flows)
Chinese National Government
(CNG)
Chinese Energy Policymaker
(ENP)
Chinese Environ Policymaker
(ERP)
Chinese Local Governments
(CLG)
Chinese People (PPL)
Chinese Research and Education Organizations
(REO)
Chinese Media (CME)
International Energy Companies
(IEC)
Non-governmental Organizations
(NGO)
Certification and Inspection Companies
(CIC)
Chinese Industrial Associations
(CIA)
Chinese Financial Institutions
(CFI)
Energy Using Companies
(EUC)
Tax Rates
Financial Wellbeing andProgress Evaluation
Research DataNews
Progress Evaluation
Tax Rates
Tax Rates
News
News
News
News
Pub
lic A
war
enes
s on
Ene
rgy-
Sav
ing
Tax Rates
News
Energy-S
aving Report for A
uditing
Research Data
Financial Wellbeing
Energy-Saving Propaganda
Interest Rates
Financial Report for AuditingAssets Report for AuditingOfficials Evaluation
Pro
gres
s E
valu
atio
n
Environ Report for Auditing
Pro
gres
s E
valu
atio
n
Officials Evaluation

- 259 -
Figure 6-8: Stakeholder Map for Level Two Model (Goods/Service Flows)
Chinese National Government
(CNG)
Chinese Energy Policymaker
(ENP)
Chinese Environ Policymaker
(ERP)
Chinese Local Governments
(CLG)
Chinese People (PPL)
Chinese Research and Education Organizations
(REO)
International Energy Companies
(IEC)
Technology and Consulting Companies
(TCC)
Certification and Inspection Companies
(CIC)
Energy Producing Companies
(EPC)
Chinese Industrial Associations
(CIA)
Chinese Financial Institutions
(CFI)
Energy Using Companies
(EUC)
CDM Credits
CDM Credits
Students
Tech and ConsulEnergy-Saving Certificate
Ene
rgy
Tech and Consul C
apability
Tech and Consul C
apability
Tech and Consul
Chemical ProductsEnergy
Tech and Consul
Workforce
Industry Standards and Benchmarking
Chemical ProductsEnergy
Energy-S
aving Tech
Software Tools and Assessments
Ene
rgy-
Sav
ing
Tech
Environ Protection Tech
Environ Protection TechTech and Consul
Large Equipm
ent andK
ey Tech
Large Equipment and Key Tech

- 260 -
Figure 6-9: Stakeholder Map for Level Two Model (Financial Flows)
Chinese National Government
(CNG)
Chinese Energy Policymaker
(ENP)
Chinese Environ Policymaker
(ERP)
Chinese Local Governments
(CLG)
Chinese People (PPL)
Chinese Research and Education Organizations
(REO)
International Energy Companies
(IEC)
Non-governmental Organizations
(NGO)
Technology and Consulting Companies
(TCC)
Certification and Inspection Companies
(CIC)
Energy Producing Companies
(EPC)
Chinese Industrial Associations
(CIA)
Chinese Financial Institutions
(CFI)
Energy Using Companies
(EUC)
ROI and PaymentPayment
Payment
Paym
ent
Paym
ent
Paym
ent
ROI
Dues
Investment and Loan
FundingTuition
Payment
Funding
Funding
Wages
Social Insurance
Taxe
sTa
xes
Funding
Payment
Paym
ent
Allow
ance and Rew
ardfor E
nergy-Saving
Budget
Investment and Demo Fund
Demo Fund
Taxes
Taxe
s
Taxes
Taxe
s
Non
-Com
plia
nce
Fine
Non-Compliance Fine
Dem
o Fu
ndD
emo
Fund
Dem
o Fund
Taxe
s

- 261 -
Similar to the Level One Model, the Network Weighted Stakeholder Occurrence
(NWSO) and the Network Weighted Value Flow Occurrence (NWVFO) for the Level
Two Model can be quickly calculated with the DSM modeling platform. The results are
ranked in Figure 6-10 and Figure 6-11, respectively:
Figure 6-10: Network Weighted Stakeholder Occurrence (NWSO) for Level Two Model
Figure 6-11: Network Weighted Value Flow Occurrence (NWVFO) for Level Two Model
Next, the above two figures will be compared to the corresponding results from the Level
One Model. Based on such a comparison, a few new insights gained from the hierarchical
modeling will be discussed in detail.
0.0
0.2
0.4
0.6
0.8
1.0
CNG EUC ENP PPL CLG REO IEC EPC ERP CFI CME NGO CIA TCC CIC
NW
SO_L
2
Stakeholder
NWSO for Level Two Model
0.000
0.005
0.010
0.015
0.020
Taxe
s fro
m EUC to C
LG
Support fro
m PPL to EUC
Energy L
aw Im
plemen
tation fr
om ENP to C
NG
Fulfillm
ent fr
om ENP to C
NG
Suggested
Energy P
rices
from ENP to
CNG
Goal Fulfil
lmen
t from C
LG to ENP
Support fro
m EUC to C
LG
Tuitio
n from PPL to
REO
Paymen
t from PPL to
EUC
Large E
quipment a
nd Key
Tech
from IE
C to ENP
Support on C
urricu
lum and C
onstructi
on from C
NG to R
EO
Funding from C
NG to R
EO
Fulfillm
ent fr
om CLG to
CNG
Taxe
s fro
m CLG to
CNG
Paymen
t from EUC to
EPC
Wages
from EUC to
PPL
Compliance
from EUC to
ENP
Goal Fulfil
lmen
t from EUC to
ENP
Support fro
m CFI to
CLG
Support fro
m CNG to
CLG
NW
VFO
_L2
Top 20 Value Flows
NWVFO for Level Two Model
- 262 -
6.4.2 New Insights for Level One Model
Comparing Figure 6-10 with Figure 6-2, we observe that one child of each of the Chinese
Government (GOV) and Energy Companies (ENC) is present as the two most important
stakeholders on Level Two: Chinese National Government (CNG) and Energy Using
Companies (EUC). However, the other children of the Chinese Government (GOV) are
significantly less strong, most notably, the Energy Policymakers (ENP) and
Environmental Policymakers (ERP), the two stakeholders chiefly responsible for the
Energy Conservation Campaign. Given that the Energy Policymakers (ENP) and
Environmental Policymakers (ERP) actually do not have sufficient power (from both
exchange relationships and structural positions in the network) to regulate the
stakeholders they are responsible for regulating, particularly the Energy Using
Companies (EUC), we recommend that the Chinese National Government (CNG) should
give the Energy Policymakers (ENP) and Environmental Policymakers (ERP) more
power to regulate the energy consumptions and related environmental pollution of the
Energy Using Companies (EUC)—in China, the majority of the Energy Using
Companies (EUC) are state-owned enterprises, and their top executives are often senior
government officers at the same time. Based on the previous observation for stakeholder
maps, the first step may be taken is to integrate the distributed administrative authorities
into a single governmental unit (for example, Ministry of Energy) to assume centralized
responsibility for energy policies and regulations. More importantly, the performance of
the top executives in the Energy Using Companies (EUC) should be linked to their
achievements on energy conservation, which are directly evaluated by such an integrated
governmental unit.
In addition, Figure 6-10 ranks the Energy Using Companies (EUC) much higher than the
Energy Producing Companies (EPC), which is one of the least important stakeholders in
the list. This result is not surprising and consistent with the previous observation on the
structural advantages of the Energy Using Companies (EUC) in the stakeholder network.
After carefully examining the inputs and outputs of these two stakeholders, we find that

- 263 -
the more central position of the Energy Using Companies (EUC) comes from the much
heavier regulation on their energy consumption. This finding reflects a long-standing but
controversial policy direction in China to only regulate the energy consumption of the
Energy Using Companies (EUC) in the industry sector, mainly because of the concerns
that the growth rate of China’s economy would cause demand to always exceed supply in
the energy market. The historic strategy of China has been to give relatively free reign to
the Energy Producing Companies (EPC), to guarantee the capacity of energy supply can
grow as quickly as possible.
Comparing Figure 6-11 with Figure 6-3, one of the most interesting findings is that in the
Level Two Model, the top two value flows (viz., “Taxes from EUC to CLG”, and
“Support from PPL to EUC”) surface the Energy Using Companies (EUC) as the key
player in the Energy Conservation Campaign. This finding overcomes one limitation of
the Level One Model (see Section 6.3.1), that is, the inconsistency between the
importance of the residential and industrial sectors in the campaign (indicated by the
NWVFO) and the actual fraction of energy consumed by these two sectors—based on
statistical data [Zhou, McNeil, Fridley, et al., 2007, p. 10], the industrial sector in China
accounts for more than 60% of total primary energy consumption for decades, while the
residential sector only accounts for about 10% of total primary energy consumption—it is
obvious that the industrial sector, or the Energy Using Companies (EUC) to be more
specific, should be first addressed in the Energy Conservation Campaign to achieve more
significant reductions of energy consumption.
Additionally, as discussed before, another limitation of the Level One Model is the
difficulty of differentiating between different policies and strategies (see Figure 6-3),
which is mainly caused by the spatial and temporal breadth of the stakeholder network in
China’s Energy Conservation Campaign. However, this situation is also improved by the
greater level of detail captured in the Level Two Model. For example, two of the top five
flows in Figure 6-11, that is, “Energy Law Implementation from ENP to CNG” and
“Suggested Energy Prices from ENP to CNG”, bring to attention two specific strategies
(one is legislative and the other is economic) for the Chinese National Government

- 264 -
(CNG) to enhance the power of the Energy Policymakers (ENP) in the campaign, which
is required by the previous comparison of the NWSO between Level One and Level Two.
Another good example is the “Taxes from EUC to CLG”, which is the most important
value flow in the Level Two Model. In fact, this flow highlights a tension between the
Chinese Local Governments (CLG) and the Chinese National Government (CNG)
regarding to their different stakes in the campaign—motivated by the direct economic
benefits (and other indirect benefits such as the promotion of government officers
because of their satisfactory performance in stimulating local economy), the Chinese
Local Governments (CLG) often loosen their supervision on the energy consumption of
the Energy Using Companies (EUC) and therefore sacrifice the achievement of the
energy-saving goals set by the Chinese National Government (CNG).
6.4.3 Implications for Level Three Model
Similar to the Level One Model, the NWSO from the Level Two Model (see Figure 6-10)
identify the Chinese National Governments (CNG) and the Energy Using Companies
(EUC) as two stakeholders to be decomposed on Level Three. Table 6-2 takes the
Chinese National Government (CNG) as an example to show the results of stakeholder
decomposition. Further, using the method introduced before (see Figure 6-4), the value
flows on Level Three can also be identified, and the resulting stakeholder map is
visualized by different types of value flows (see Figures A-6-1 ~ A-6-6 in the Appendix).
However, based on the “Two Down, One Up” principle [Sutherland, 2009], the main
purpose of the Level Three Model in this chapter is to examine the stakeholders and
value flows on Level Two. Note that the Level Three Model is not computationally
tractable (with the current modeling tool), but it is useful as a system check that the
stakeholders illustrated on Level Two are an appropriate decomposition of the Level One
Model.

- 265 -
Table 6-2: Stakeholder Decomposition from Level Two Model to Level Three Model (CNG only)
CHINA MODEL LEVEL 3-1 (5 Stakeholders) CHINA MODEL LEVEL 3-2 (7 Stakeholders) CHINA MODEL LEVEL 3-3 (22 Stakeholders) CHINA MODEL LEVEL 3-4 (5 Stakeholders)
Communist Party of China
National Congress of CPC
Politburo
Central Organization Department
Central Commission of Discipline Inspection
General Secretary / President
Prime Minister National Leading Group to Address Climate Change, Energy Conservation & Pollutant Discharge Reduction
State Organs
National People's Congress Environmental Protection and Resource Conservation Committee
State Council
National Development and Reform Commission
National Energy Administration
Dept. of Resource Conservation & Environ. Protection
Dept. of Industry
Academy of Macroeconomic Research
Ministry of Industry and Information Technology Dept. of Energy Conservation & Integrated Utilization
Ministry of Environmental Protection
Ministry of Science and Technology
Ministry of Education
Ministry of Finance
Ministry of Human Resources and Social Security
Ministry of Supervision
People's Bank of China State-Owned Assets Supervision and Administration Commission
State Administration of Taxation General Administration of Quality Supervision Inspection and Quarantine
National Bureau of Statistics
General Administration of Press and Publication
Xinhua News Agency
Chinese Academy of Sciences
Chinese Academy of Engineering
Development Research Center
China Banking Regulatory Commission
China Securities Regulatory Commission
State Electricity Regulatory Commission
Political Consultative Conference

- 266 -
6.5 Policy and Strategy Recommendations
Based on the hierarchical modeling for the SVN of China’s Energy Conservation
Campaign, a few policy and strategy recommendations are summarized as below:
Placing the priority of the campaign on reducing energy consumption of the
industrial sector and improving the efficiency of energy utilization;
Managing the energy consumption on the supply side and coordinating the
development of economy with energy production on the national level;
Integrating the distributed administrative authorities into one single government
organization, such as the Ministry of Energy, to assume centralized responsibility
for energy policies and regulations;
Enhancing the power of energy and environmental policymakers, through
administrative (evaluating the performance of top executives in state-owned
enterprises), legislative (implementing energy law), economic (adjusting energy
prices), and other means;
Balancing the different interests of national government and local governments,
such as designing a tax structure more favored by local governments, or linking
the overall performance of local government officers with their achievements in
the campaign.
As introduced before, the stakeholder analysis for China’s Energy Conservation
Campaign is still in its early stage, and most existing research [Wu, Wu, and Lu, 2008;
Yang and Zhu, 2008] only focuses on stakeholder identification and categorization.
Through the case study in this chapter, the SVN analysis not only provides a rigorous
framework for better understanding the networked relationships between stakeholders,
but also proposes a systematic way to manage the complexity of stakeholder networks.
6.6 Chapter Summary

- 267 -
In this chapter, the Whole Network analysis and the DSM modeling platform developed
in Chapter 5 are applied to conduct the SVN analysis for China’s Energy Conservation
Campaign, which has much broader spatial and temporal boundaries as well as more
complicated network contexts than the previous Project Phoenix case.
Through this prospective case study, the instrumental power of the SVN analysis for
better managing the complexity associated with stakeholder networks is demonstrated.
Specifically, following the five principles for hierarchical modeling, this chapter models
the SVN of China’s Energy Conservation Campaign from top to down into three different
levels: On one hand, the NWSO and NWVFO calculated in a higher-level model identify
the most important stakeholders and value flows to be decomposed in a lower-level
model; On the other hand, the NWSO and NWVFO calculated in a lower-level model
provide more fine-grained decision support for the precedent higher-level model.
Putting Chapters 5 and 6 together, the second module of the main body of this
dissertation is now completed (see Figure 1-1), and one should be ready to conduct the
SVN analysis for more complicated cases, from the perspective of the whole network.
Next, set against an even broader backdrop, the possible ways to apply the SVN analysis
to design the physical architectures of large engineering projects are further explored in
Appendix I.

- 268 -
[This page left intentionally blank]

- 269 -
CHAPTER 7. CONCLUSIONS AND FUTURE WORK
“LEPs (Large Engineering Projects) are important not
only because they transform the physical landscape and
change the quality of human life, but because they are the
crucibles in which new forms of collaboration are
developed. The study of LEPs provides insights into the
workings of human organizations, both large and small.”
— Miller and Lessard [2001, p. 1]
7.1 Dissertation Summary
In order to better meet the challenges arising from as well as embrace the opportunities
brought by the exogenous and endogenous changes that large engineering projects are
experiencing today, we advance a multi-disciplinary approach, namely, the Stakeholder
Value Network (SVN) analysis, as a unique lens to examine, understand, model, and
manage the multi-type and networked relationships between the large engineering
projects and their various stakeholders. Meanwhile, as the “real-life social experiments”
[Miller and Lessard, 2001, p. 10], the study of today’s large engineering projects itself
provides insights into the workings of human organizations in a highly interwoven and
rapidly changing socio-technical system; and “seeing the big through the small” [Stolte,
Fine, and Cook, 2001, p. 387], these insights can further promote new developments
across engineering, management, and social sciences.
First of all, based on Social Exchange Theory (SET), or the “economic analysis of
noneconomic social situations” [Emerson, 1976, p. 336], the SVN approach unifies both
social and economic relationships into a common framework, under which all the
stakeholder relationships are formed by the use of subjective utility analysis (from the
Rational Choice Theory) and the comparison of alternatives (from the Behaviorist
- 270 -
Psychology). Further, restricted and generalized exchanges are taken as two basic
patterns for stakeholders to exchange both tangible and nontangible value, and
meanwhile, the missing link between the relationship types and the exchange patterns is
also identified. In the end, strategic implications, such as the stakeholder importance
(a.k.a., salience, power, etc.), are inferred as the confluence between value exchanges and
the structural properties of the network consisting of stakeholders and their exchange
relationships.
According to the above theoretically grounded assumptions, a four-step methodological
framework (viz., mapping, quantifying, searching, and analyzing) is developed for the
SVN analysis. Along this development, a rigorous network utility model is built to
quantify the value delivered to the focal organization (viz., large engineering projects)
through the channel of generalized exchanges. In addition, the benefits from as well as a
feasible way for the integration between stakeholders and strategic issues are also
explored. Moreover, in order to reduce the egocentric bias associated with the perspective
of a pre-selected focal organization, the above four-step framework is further developed
to interpret the implications of the SVN from the perspective of the whole network. The
computational challenges arising from this new development are also met by the
construction of a dedicated mathematic tool for the SVN analysis, namely, the DSM
(Dependency Structure Matrix) modeling platform.
Corresponding to the two-stage development of the methodological framework, two large
real-world engineering projects are chosen as cases to apply the SVN analysis from the
focal organization perspective and the whole network perspective, respectively. The first
one, Project Phoenix, is a retrospective case—based on this case study, the strength of the
SVN analysis in terms of capturing the impacts of indirect stakeholder relationships is
validated, through a comparison of important stakeholders between Mangers’ Mental
Model, the “Hub-and-Spoke” Model, and the SVN Model. The second one, China’s
Energy Conservation Campaign, is a prospective case—in this case study, five basic
principles are proposed for modeling the intraorganizational hierarchies of large and
important stakeholders, and then these principles are tested as an effective means to

- 271 -
manage the “structural complexity” [Moses, 2004a, p. 9] of the SVN in the modeling
process.
The SVN approach is now complete with the above theory, methodology, tool, and
meaningful findings from two different case studies. At the end of this dissertation, two
conceptual innovations, namely, Stakeholder-Oriented Architecting Process and Value
Exchange Rates & Matrix, are also presented to bridge the gap between the SVN analysis
and the architecting process for large engineering projects as well as engineering systems
in general.
7.2 Contributions and Implications
7.2.1 Theoretical, Methodological, and Empirical Contributions
The academic contributions of this dissertation can be synopsized from three aspects:
Theoretical Contributions
In this dissertation we have:
Enhanced the economic perspective of modern Strategic Management by
grounding the SVN approach in Social Exchange Theory (SET) and unifying
both social and economic relationships into a common framework for analysis;
Advanced the Network Theory of Stakeholder Influences by not only moving
beyond dyadic ties, but also considering the simultaneous interactions between
multiple types of stakeholder relationships;
Improved the descriptive accuracy of the Stakeholder Salience Theory by
interpreting stakeholder importance or power as a secondary and derivative
phenomena determined by both exchange relationships and network structures;
Integrated Stakeholder Theory with Strategic Issue Management through
transforming the SVN into multiple Issue Networks, which can provide greater
normative power for stakeholder balance with a simpler analysis.

- 272 -
Methodological Contributions
We also have:
Closed the gap for the Network Analysis in Social Sciences by constructing an
effective modeling tool and defining useful network measurements for a rigorous
analysis of the multi-type and indirect interorganizational relationships;
Developed the Whole Network analysis for the SVN to reduce the egocentric
bias associated with the pre-selected focal organization as well as to study the
networks without a clear central actor;
Provided a transparent, collaborative, and alive platform for different teams in a
large engineering project as well as for different stakeholders to share important
knowledge that is otherwise difficult to express or communicate.
Empirical Contributions
Finally, we have:
Conducted one of the very first empirical studies in business and management
for understanding the important role of generalized exchanges in value creation
and trade among stakeholders in a network;
Discovered the evidence for the similarity between Managers’ Mental Model
and the “Hub-and-Spoke” Model, as well as for the substantial impacts of
indirect relationships captured in the SVN model;
Demonstrated the feasibility of using hierarchical models to manage the
structural complexity of the SVN, and also the possibility of obtaining additional
insights from different levels of the network model.
7.2.2 Managerial Implications and Policy Recommendations
More specifically, the implications and recommendations derived from two case studies
in this dissertation are also recapitalized as below:

- 273 -
Managerial Implications for Large Engineering Projects Based on Project Phoenix
Impacts of Indirect Stakeholder Relationships:
o The typical Managers’ Mental Model is very similar to the “Hub-and-
Spoke” Model, and both of them are likely to miss key stakeholders, such
as the Public Media and the Local Government in Project Phoenix;
o The SVN Model identifies the important omitted stakeholders, such as the
Public Media and the Local Government in Project Phoenix, even with
only prior information, by considering the impacts of indirect stakeholder
relationships or generalized exchanges, which prevail over direct
stakeholder relationships or restricted exchanges under the condition that
social exchanges become the dominant phenomena in the stakeholder
network;
o The impacts of indirect stakeholder relationships or generalized exchanges
can be further decomposed into the “exchange” and “structural” parts,
based on the assumption that stakeholder power is the outcome of both
exchange relations and network positions. Correspondingly, different
strategies can be formulated to gain more influence on other stakeholders,
through an “exchange” (decrease or increase the value delivered through
relationships), “structural” (sever existing relationships or build new
relationships), or mixed way.
Importance of Issue Networks:
o Issue Networks arrive at the same conclusions as the SVN Model, with
much simpler analysis;
o Issue Networks provide greatest normative power since they identify those
stakeholders that place large values (positive and negative) on the two
opposing types of issues (taxes and jobs vs. pollutions) and thus can link
them internally, as well as those stakeholders that are “closest” to each
other to effect this “issue trade”. The central issue for Project Phoenix is
that it has negative balance on pollutions and positive balance on taxes as
well as jobs, but that in general these apply to different stakeholders;

- 274 -
o Under such a circumstance, generalized exchanges, which include more
than two parties in value exchange, can certainly shed light on formulating
“indirect” strategies to influence the stakeholders with positive balance
and those with negative balance at the same time.
Policy Implications for National Programs Based on China’s Energy Conservation
Campaign
Five Principles for Hierarchical Modeling:
o Principle A: In the SVN, hierarchy is not an interorganizational, but an
intraorganizational phenomenon;
o Principle B: In the SVN, hierarchical modeling is not a bottom-up, but a
top-down approach to decomposing a stakeholder into a set of subordinate
ones;
o Principle C: In the SVN, importance and necessity are two criteria to
identify the stakeholders to be decomposed on the next level of
hierarchical model;
o Principle D: In the SVN, Network Weighted Stakeholder Occurrence
(NWSO) is a more holistic measurement for stakeholder importance and
therefore should be applied in hierarchical modeling;
o Principle E: In the SVN, Network Weighted Value Flow Occurrence
(NWVFO) is a more holistic measurement for value flow importance and
can help NWSO build the hierarchical model on the next level.
Five Recommendations for Energy-Conservation Campaign:
o Placing the priority of the campaign on reducing energy consumption of
the industrial sector and improving the efficiencies of energy utilization;
o Managing the energy consumption on the supply side and coordinating the
development of economy with energy production on the national level;
o Integrating the distributed administrative authorities into one single
government organization, such as the Ministry of Energy, to assume
centralized responsibility for energy policies and regulations;

- 275 -
o Enhancing the power of energy and environmental policymakers, through
administrative (evaluating the performance of top executives in state-
owned enterprises), legislative (implementing energy law), economic
(adjusting energy prices), and other means;
o Balancing the different interests of national government and local
governments, such as designing a tax structure more favored by local
governments, or linking the overall performance of local government
officers with their achievements in the campaign.
7.3 Limitations and Future Work
7.3.1 Short List of Limitations
In this dissertation, along the comprehensive treatise on the multi-type and networked
relationships between large engineering projects and their stakeholders, a short list of
limitations still remain:
Normative Justification: The SVN approach is mainly developed for the
objective of descriptive accuracy and instrumental strength, and therefore lacks a
thorough consideration of normative justification;
Bounded Rationality: The SVN approach heavily relied on the rational choice
model borrowed by the Social Exchange Theory (SET) from neoclassical
economics, and therefore can be improved with the latest development in
behavioral and complexity economics;
Strategy Implementation: The SVN approach does not provide practical
guidelines to effectively implement the stakeholder strategies derived from
generalized exchanges, which often bring the problem of social dilemma such as
moral hazard and free-riding, and therefore these guidelines are much desired in
the real world to promote the trust between different stakeholders;

- 276 -
Homogeneous Utility: The SVN approach utilizes the Multi-Attribute Utility
Theory (MAUT) as the mathematical tool to quantify the value flows by the
subjective utilities of the recipient stakeholders, but for simplification, the same
utility function has been applied for all the stakeholders, and moreover, such a
utility function has not been calibrated with the data from psychological
experiments;
Meso-Level Networks: The SVN approach often deals with the models for
interorganizational networks on the “meso-level” of human society, and the
linkage between the SVN models and other networks on the individual, micro-,
or macro- levels has not been fully understood;
Information Bias: A beauty of the SVN approach comes from the convenience
that once the network model is built, each stakeholder can be taken as the focal
organization to conduct various analyses, but before that, a “default” focal
organization has always been chosen to help specifying the network boundaries
and/or satisfying the research sponsors, and therefore it is very difficult to avoid
the bias from the pre-selected focal organization when collecting information for
model construction at the beginning of the SVN analysis;
Static Characteristics: Last but not least, the SVN approach is inherently static
and more like a “snapshot” for the value exchanges among stakeholders at a
specific temporal stage, and therefore is unable to illustrate the longitudinal
evolution of the stakeholder network.
7.3.2 Future Work: Theoretical, Methodological, and Empirical Directions
Although the above is by no means a complete list, one should have not been intimidated
by the limitations—as wisely commented by Box and Draper [1987, p. 424], “Essentially,
all models are wrong, but some are useful.” and “Remember that all models are wrong;
the practical question is how wrong do they have to be to not be useful.” [Box and
Draper, 1987, p. 74]—articulating these limitations will actually help with the appropriate
application of the SVN approach. More importantly, except the inherent limitations of
information bias and static characteristics, other limitations in the above list also mark a

- 277 -
promising path for future work on theoretical construction, methodological development,
and empirical study:
Theoretical Construction
With Stakeholder Theory: Justify the normative validity of the SVN approach
by studying the “problem of the ethics of capitalism”, or “putting together
thinking about questions of ethics, responsibility, and sustainability with the
usual economic view of capitalism” [Freeman, Harrison, Wicks, et al., 2010, pp.
4-5 and p. 29];
With Social Exchange Theory: Improve the rational choice model borrowed
from neoclassical economics by introducing the latest development in behavioral
and complexity economics, such as bounded rationality [Simon, 1972, 1997],
intertemporal choice [Loewenstein and Prelec, 1992; Berns, Laibson, and
Loewenstein, 2007]; prospect theory [Kahneman and Tversky, 1979; Tversky
and Kahneman, 1992], evolutionary game theory [Weibull, 1997], and out-of-
equilibrium dynamics [Arthur, Durlauf, and Lane, 1997] among others;
With Institutional Theory: Enrich the substance of the SVN approach by
introducing institutions, which are the “humanly devised constraints that
structure political, economic and social interaction” [North, 1991, p. 97],
possibly as the “game rules” governing the value exchanges of stakeholders,
because “institutional theory attends to the deeper and more resilient aspects of
social structure” [Scott, 2005, p. 460];
With Innovation and Entrepreneurship: Identify the fundamental sources of
value creation for stakeholders by combining the SVN approach with the theory
of innovation systems—both Marx [1906] and Schumpeter [1934, 1942] saw
technology and technical change “as a central factor underlying organization and
political dynamics and as a critical determinant of group power and individual
outcomes” [Tushman and Nelson, 1990, p. 1].
Methodological Development

- 278 -
On Managerial Mindset: Search for “what to teach managers and students
about what it takes to be successful in the current business world” [Freeman,
Harrison, Wicks, et al., 2010, pp. 4-5 and p. 29] by synthesizing the lessons
learned from the SVN research, such as the importance of indirect stakeholder
relationships on the long-term success of large engineering systems;
On Social Dilemma: Understand how to implement generalized exchanges as
effective strategies in the business world and avoid the potential moral hazard
and free-riding problems by taking advantage of the network game theory
[Myerson, 1977; Jackson, 2008], the stag hunter games [Skyrms, 2004], among
other useful methods, regarding to different motivations behind generalized
exchanges which “span the gamut from pure altruistic (Sahlins, 1972) to norm-
based behavior (Ekeh, 1974) to behavior that is based on rational choice and
instrumental incentives (Olson, 1965)” [Levine and Shah, 2003, pp. 3-4];
On System Architectures: Bridge the gap between the SVN analysis and the
architecting process for large engineering projects by further developing the
Stakeholder-Oriented Architecting Process and Value Exchange Rates & Matrix
conceived in Appendix I.
Empirical Study
For Generalized Exchanges: Interpret the important role of generalized
exchanges, which provides “a partial answer to the question of why the whole of
stakeholder relationships can be greater than the sum of its parts” [Wicks and
Harrison, 2013, pp. 105-106], in value creation and trade among stakeholders by
conducting a significant amount of case studies, in addition to the Project
Phoenix and China’s Energy Conservation Campaign discussed in this
dissertation;
For Stakeholder Utility: Calibrate the utility functions of different stakeholders
and the “maximum distance” [Harary, Norman, and Cartwright, 1965; Jackson,
2008] to trace the received value with their bounded rationality by collecting and
analyzing empirical data from well-designed interviews and psychological
experiments;

- 279 -
For Other Networks: Test the generalizability of the SVN approach by
exploring the similarities as well as differences between the meso-level
(interorganizational) networks discussed in this dissertation and other individual,
micro- (intraorganizational), and macro-level (across industry sectors) networks.
Now the journey of this dissertation comes to an end, however, it is just the beginning of
a splendid march for better understanding and managing today’s large engineering
projects as well as advancing engineering systems into a new discipline.
Dream. Explore. Discover.

- 280 -
REFERENCES Abe, I. [2007]. Revenue Management in the Railway Industry in Japan and Portugal: A
Stakeholder Approach. Master’s Thesis, Engineering Systems Division, Massachusetts Institute of Technology. Cambridge, MA.
Adams, C. S. [2004]. An Interactive, Online Geographic Information System (GIS) for Stakeholder Participation in Environmental Site Selection. Master’s Thesis, Engineering Systems Division & Department of Civil and Environmental Engineering, Massachusetts Institute of Technology. Cambridge, MA.
Agle, B. R., R. K. Mitchell, and J. A. Sonnenfeld. [1999]. “Who Matters to CEOs? An Investigation of Stakeholder Attributes and Salience, Corporate Performance, and CEO Values.” Academy of Management Journal 42(5): 507-525.
Alexanderson, G. [2006]. “Euler and Königsberg’s Bridges: A Historical View.” Bulletin of the American Mathematical Society 43(4): 567-573.
Ansoff, H. I. [1980]. “Strategic Issue Management.” Strategic Management Journal 1: 131-148.
Arthur, B., S. Durlauf, and D. A. Lane. [1997]. “Introduction: Process and Emergence in the Economy.” The Economy as an Evolving Complex System II. Reading, MA: Addison-Wesley.
Arvind, A. S. [2009]. Stakeholder Value Network Analysis for the Mobile Services Ecosystem. Master’s Thesis, Engineering Systems Division & Sloan School of Management, Massachusetts Institute of Technology, Cambridge, MA.
Baron, D. P. [1995]. “Integrated Strategy: Market and Nonmarket Components.” California Management Review 37(2): 47-65.
Baron, D. P. [2001]. “Private Politics, Corporate Social Responsibility, and Integrated Strategy.” Journal of Economics & Management Strategy 10(1): 7-45.
Bearman, P. [1997]. “Generalized Exchange.” American Journal of Sociology 102(5): 1383-1415.
Berns, G. S., D. I. Laibson, and G. Loewenstein. [2007]. “Intertemporal Choice – Toward An Integrative Framework.” Trends in Cognitive Sciences 11(11): 482-488.
Bigelow, B., L. Fahey, and J. F. Mahon. [1991]. “Political Strategy and Issues Evolution: A Framework for Analysis and Action.” K. Paul. (Ed.). Contemporary Issues in Business Ethics and Politics. K. Paul. Lewiston, NY: Edwin Mellen: 1-26.

- 281 -
Bigelow, B., L. Fahey, and J. F. Mahon. [1993]. “A Typology of Issue Evolution.” Business and Society 32(1): 18-29.
Blau, P. M. [1964]. Exchange and Power in Social Life. New York: Wiley.
Blau, P. M. [1994]. Structural Contexts of Opportunities. Chicago: University of Chicago Press.
Boddewyn, J. J. [2003]. “Understanding and Advancing the Concept of ‘Nonmarket’.” Business and Society 42(3): 297-327.
Bollobás, B. [1998]. Modern Graph Theory. New York: Springer-Verlag.
Bolonkin, A. and R. B. Cathcart. [2009]. Macro-Projects. NOVA Publishing.
Bonacich, P. [1987]. “Power and Centrality: A Family of Measures.” American Journal of Sociology 92(5): 1170-1182.
Borgatti, S. P. and P. C. Foster. [2003]. “The Network Paradigm in Organizational Research: A Review and Typology.” Journal of Management 29(6): 991-1013.
Borgatti, S. P., A. Mehra, D. J. Brass, et al. [2009]. “Network Analysis in the Social Sciences.” Science 323: 892-895.
Box, G. E. and N. R. Draper. [1987]. Empirical Model-Building and Response Surfaces. New York: Wiley.
Brooks, J. M., J. S. Carroll, and J. W. Beard. [2009]. Dueling Stakeholders and Dual-Hatted Systems Engineers: Engineering Challenges, Capabilities and Skills in Government Infrastructure Technology Projects. Working Paper SSRN-id1481911, Sloan School of Management, Massachusetts Institute of Technology. Cambridge, MA.
Brown, B. B. [1968]. “Delphi Process: A Method Used for the Elicitation of Opinions of Experts.” Report P-3925. The RAND Corporation, Santa Monica, CA.
Browning, T. R. [1998]. Modeling and Analyzing Cost, Schedule, and Performance in Complex System Product Development. Doctoral Dissertation, Engineering Systems Division, Massachusetts Institute of Technology, Cambridge, MA.
Brusse-Gendre, T. [2002]. “Kano Model Analysis.” Lecture Notes for ENGG.251 Engineering Design and Communications. University of Calgary, Canada.
Bush, V. [1945]. Science: The Endless Frontier. Report to President Trumen, U.S. Office of Scientific Research and Development.

- 282 -
CAE (Chinese Academy of Engineering). [2009]. Research on the Energy Development Strategy of China in Mid- (2030) and Long-Term (2050). Beijing: CAE (internal report, in Chinese).
Calvert, S. [1995]. “Managing Stakeholders.” In The Commercial Project Manager, ed. J. R. Turner. London: McGraw-Hill.
Cameron, B. G. [2007]. Value Network Modeling: A Quantitative Method for Comparing Benefit across Exploration Architectures. Master’s Thesis, Department of Aeronautics and Astronautics & Engineering Systems Division, Massachusetts Institute of Technology, Cambridge, MA.
Cameron, B. G., E. F. Crawley, W. Feng, and M. Lin. [2011]. “Strategic Decisions in Complex Stakeholder Environments: A Theory of Generalized Exchange.” Engineering Management Journal 23(3): 37-45.
Cameron, B. G., E. F. Crawley, G. Loureiro, and E. S. Rebentisch. [2008]. “Value Flow Mapping: Using Networks to Inform Stakeholder Analysis.” Acta Astronautica 62(4-5): 324-333.
Carroll, A. B. [1999]. “Corporate Social Responsibility – Evolution of a Definitional Construct.” Business and Society 38(3): 268-295.
Cartwright, D. and F. Harary. [1956]. “Structural Balance: A Generalization of Heider’s Theory.” The Psychological Review 63(5): 277-293.
Cartwright, D. and T. C. Gleason. [1966]. “The number of paths and cycles in a digraph.” Psychometrika 31(2): 179-199.
Catanzaro, S. N. [2006]. Multi-Stakeholder Quantitative Analysis of Sustainability for Value Delivery Systems. Master’s Thesis, Engineering Systems Division & Sloan School of Management, Massachusetts Institute of Technology. Cambridge, MA.
Chai, Q. and X. Zhang. [2010]. “Technologies and Policies for the Transition to a Sustainable Energy System in China.” Energy 35(10): 3995-4002.
Chase, W. H. [1982]. “Issue Management Conference – A Special Report.” Corporate Public Issues and Their Management 7: 1-2.
Chase, W. H. [1984]. Issue Management: Origins of the Future. Stamford, CT: Issue Action Publishers.
Chen, I. J. and K. Popovich. [2003]. “Understanding Customer Relationship Management (CRM) – People, Process and Technology.” Business Process Management Journal 9(5): 672-688.
Clarkson, M. B. E. [1995]. “A Stakeholder Framework for Analyzing and Evaluating Corporate Social Performance.” Academy of Management Review 20(1): 92-117.

- 283 -
Cleland, D. I. [1998]. “Stakeholder Management.” In Project Management Handbook. San Francisco: Jossey-Bass.
Colander, D., R. Holt, and B. Rosser Jr. [2004]. “The Changing Face of Mainstream Economics.” Review of Political Economy 16(4): 485-499.
Coleman, J. S., and R. Smith. [1973]. The Mathematics of Collective Action. Chicago: Aldine.
Coleman, J. S. [1986]. “Social Action Systems.” Individual Interests and Collective Action: Studies of Rationality and Social Change. Nueva York: Cambridge University Press: 85-136.
Coleman, J. S. [1990]. Foundations of Social Theory. Cambridge: Harvard University Press.
Coleman, J. S. [1994]. “A Rational Choice Perspective on Economic Sociology.” N. Smelser and R. Swedberg (eds.), The Handbook of Economic Sociology. Princeton: Princeton University Press.
Collins, R. [1988]. Theoretical Sociology. San Diego: Harcourt Brace Jovanovich.
Cook, K. S. [1990]. “Linking Actors and Structures: An Exchange Network Perspective.” C. Calhoun, M. Meyer, and R. Scott (eds.), Structures of Power and Constraint. Cambridge: Cambridge University Press.
Cook, K. S. [2000]. “Charting Futures for Sociology: Structure and Action.” Contemporary Sociology 29: 685-692.
Cook, K. S., C. Cheshire, and A. Gerbasi. [2006]. “Power, Dependence, and Social Exchange.” in the Contemporary Social Psychological Theories by Burke, P. J. Stanford, CA: Stanford University Press: 194-216.
Cook, K. S. and R. M. Emerson. [1978]. “Power, Equity and Commitment in Exchange Networks.” American Sociological Review 43(5): 721-739.
Cook, K. S., R. M. Emerson, M. R. Gillmore, and T. Yamagishi. [1983]. “The Distribution of Power in Exchange Networks: Theory and Experimental Results.” American Journal of Sociology 89(2): 275-305.
Cook, K. S. and J. M. Whitmeyer. [1992]. “Two Approaches to Social Structure: Exchange Theory and Network Analysis.” Annual Review of Sociology 18: 109-127.
Crawley, E. F. [2008]. “Utility Network Theory.” Research Notes. Massachusetts Institute of Technology, Cambridge, MA.

- 284 -
Crawley, E. F. [2009]. “Identifying Value – Reducing Ambiguity in the System.” Lecture Notes for ESD.34 System Architecture. Massachusetts Institute of Technology, Cambridge, MA.
Cropanzano, R. and M. S. Mitchell. [2005]. “Social Exchange Theory: An Interdisciplinary Review.” Journal of Management 31(6): 874-900.
Czaika, E. G. [2010]. Starbucks Cups: Trash or Treasure? An Example of Facilitated Systems Thinking Assisting Stakeholders in Designing Their Own System to Recycle Take-away Cups. Master’s Thesis, Engineering Systems Division & Sloan School of Management, Massachusetts Institute of Technology. Cambridge, MA.
Dalkey, N. and O. Helmer. [1963]. “An Experimental Application of the Delphi Method to the Use of Experts.” Management Science 9(3): 458-467.
Danielson, G. H. [1968]. “On Finding the Simple Paths and Circuits in a Graph.” IEEE Transactions on Circuit Theory 15: 294-295.
Dare, R. E. [2003]. Stakeholder Collaboration in Air Force Acquisition: Adaptive Design Using System Representations. Doctoral Dissertation, Engineering Systems Division, Massachusetts Institute of Technology, Cambridge, MA.
de Weck, O. L., D. Roos, and C. L. Magee. [2011]. Engineering Systems: Meeting Human Needs in a Complex Technological World. Cambridge, MA: MIT Press.
Démurger, S. [2001]. “Infrastructure Development and Economic Growth: An Explanation for Regional Disparities in China.” Journal of Comparative Economics 29(1): 95-117.
Denzau, A. T. and D. C. North. [1994]. “Shared Mental Models: Ideologies and Institutions.” KYKLOS 47(1): 3-31.
Diestel, R. [2005]. Graph Theory. New York: Springer-Verlag.
DiMaggio, P. J. and W. W. Powell. [1983]. “The Iron Cage Revisited: Institutional Isomorphism and Collective Rationality in Organizational Fields.” American Sociological Review 48(2): 147-160.
Dodder, R. S., J. M. Sussman, and J. B. McConnell. [2004]. The Concept of the “CLIOS Process”: Integrating the Study of Physical and Policy Systems Using Mexico City as An Example. Engineering Systems Division, Massachusetts Institute of Technology, Cambridge, MA.
Donaldson, T. [1999]. “Making Stakeholder Theory Whole.” Academy of Management Review 24(2): 237-241.

- 285 -
Donaldson, T. and L. E. Preston. [1995]. “The Stakeholder Theory of the Corporation: Concepts, Evidence, and Implications.” Academy of Management Review 20(1): 65-91.
Donohoo, P., D. MacKenzie, J. McAulay, et al. [2008]. Growing towards a Sustainable Biofuel Future: A Comprehensive Policy Strategy for Navigating Tradeoffs and Stakeholder Interests in U.S. Agriculture. Working Paper ESD-WP-2008-12, Engineering Systems Division, Massachusetts Institute of Technology. Cambridge, MA.
Dori, D. [2002]. Object-Process Methodology – A Holistic Systems Paradigm. New York: Springer-Verlag.
Edwards, M. and D. Hulme. [1996]. “Too Close for Comfort? The Impact of Official Aid on Non-Governmental Organizations.” World Development 24(6): 961-973.
Edwards, M. and D. Hulme. [2002]. “NGO Performance and Accountability: Introduction and Overview.” in The Earthscan Reader on NGO Management by Edwards, M. and D. Hulme. UK: Earthscan Publications.
Edwards, W. [1954]. “The Theory of Decision Making.” Psychological Bulletin 51(4): 380-417.
Edwards, W. [1977]. “How to Use Multiattribute Utility Measurement for Social Decisionmaking.” IEEE Transactions on Systems, Man, and Cybernetics 7(5): 326-340.
Ekeh, P. P. [1974]. Social Exchange Theory: The Two Traditions. Cambridge, MA: Harvard University Press.
Emerson, R. M. [1972]. “Exchange Theory, Part I: A Psychological Basis for Social Exchange, and Exchange Theory, Part II: Exchange Relations and Networks.” J. Berger et al. (eds.), Sociological Theories in Progress. Boston: Houghton-Mifflin.
Emerson, R. M. [1976]. “Social Exchange Theory.” Annual Review in Sociology 2: 335-362.
Eppinger, S. D., D. E. Whitney, R. P. Smith, and G. A. Gebala. [1990]. “Organizing the Tasks in Complex Design Projects.” ASME Conference on Design Theory and Methodology. Chicago, IL: 39-46.
Eppinger, S. D., D. E. Whitney, R. P. Smith, and G. A. Gebala. [1994]. “A Model-Based Method for Organizing Tasks in Product Development.” Research in Engineering Design 6(1): 1-13.
ESD Symposium Committee. [2006]. ESD Terms and Definitions (Version 15). Engineering Systems Division, Massachusetts Institute of Technology. Cambridge, MA.

- 286 -
Euler, L. [1736]. “Solutio problematis ad geometriam situs pertinentis.” Commentarii Academiae Scientiarum Imperialis Petropolitanae 8: 128-140. Reprinted and translated in Biggs, N. L., E. K. Lloyd, and R. J. Wilson. [1976]. Graph Theory 1736 – 1936. Oxford, UK: Oxford University Press.
Evan, W. M. and R. E. Freeman. [1993]. “A Stakeholder Theory of the Modern Corporation: Kantian capitalism.” In T. L. Beauchamp and N. E. Bowie (eds.), Ethical Theory and Business. Englewood Cliffs, NJ: Prentice-Hall. 97–106.
Fararo, T. J. [2001]. Social Action Systems: Foundation and Synthesis in Sociological Theory. Westport, CT: Praeger Publishers.
Feng, W., E. F. Crawley, O. L. de Weck, R. Keller, and B. Robinson. [2010]. “Dependency Structure Matrix Modelling for Stakeholder Value Networks.” Proceedings of the 12th International Dependency and Structure Modelling Conference. July 22-23, 2010. Cambridge, UK: 3-16.
Feng, W., E. F. Crawley, O. L. de Weck, R. Keller, J. Lin, and B. Robinson. [2012]. “BP Stakeholder Value Network.” in the Design Structure Matrix Methods and Applications by Eppinger, S. D. and T. R. Browning. Cambridge, MA: MIT Press: 122-127.
Feng, W., E. F. Crawley, O. L. de Weck, D. R. Lessard, and B. G. Cameron. [2012]. “Understanding the Impacts of Indirect Stakeholder Relationships: Stakeholder Value Network Analysis and Its Application to Large Engineering Projects.” The Strategic Management Society (SMS) 32nd Annual International Conference. October 7-9, 2012. Prague, Czech Republic.
Firth, R. [1967]. Themes in Economic Anthropology. London: Tavistock.
Floyd, R. W. [1967]. “Nondeterministic Algorithms.” Journal of the Association for Computing Machinery 14(4): 636-644.
Flyvbjerg, B., N. Bruzelius, and W. Rothengatter. [2003]. Megaprojects and Risk: An Anatomy of Ambition. Cambridge, UK: Cambridge University Press.
Foa, U. G. [1971]. “Interpersonal and Economic Resources.” Science 171(3969): 345-351.
Foa, U. G. and E. B. Foa. [1974]. Societal Structures of The Mind. Springfield, IL: Charles C Thomas.
Foa, U. G. and E. B. Foa. [1980]. “Resource Theory: Interpersonal Behavior as Exchange.” K. J. Gergen, M. S. Greenberg, et al. (eds.), Social Exchange: Advances in Theory and Research. New York: Plenum: 77-94.
Forrester, J. W. [1964]. Industrial Dynamics. Cambridge, MA: MIT Press.

- 287 -
Frederick, S., G. Loewenstein, and T. O’Donoghue. [2002]. “Time Discounting and Time Preference: A Critical Review.” Journal of Economic Literature 40(2): 351-401.
Freeman, R. E. [1984]. Strategic Management: A Stakeholder Approach. Boston: Pitman.
Freeman, R. E. [1994]. “The Politics of Stakeholder Theory: Some Future Directions.” Business Ethics Quarterly 4(4): 409-421.
Freeman, R. E. [1999]. “Response: Divergent Stakeholder Theory.” Academy of Management Review 24(2): 233-236.
Freeman, R. E., J. S. Harrison, and A. C. Wicks. [2007]. Managing for Stakeholders: Survival, Reputation, and Success. New Haven: Yale University Press.
Freeman, R. E., J. S. Harrison, A. C. Wicks, et al. [2010]. Stakeholder Theory: The State of the Art. Cambridge, UK: Cambridge University Press.
Friedman, A. L. and S. Miles. [2002]. “Developing Stakeholder Theory.” Journal of Management Studies 39(1): 1-21.
Friedman, M. [1962]. Capitalism and Freedom. Chicago: University of Chicago Press and Phoenix Books.
Friedman, M. [1970]. “The Social Responsibility of Business Is to Increase Its Profits.” New York Times September 13: 33.
Frooman, J. [2010]. “The Issue Network: Reshaping the Stakeholder Model.” Canadian Journal of Administrative Sciences 27(2): 161-173.
Fu, F., W. Feng, Z. Li, E. F. Crawley, and W. Ni. [2011]. “A Network-based Modeling Framework for Stakeholder Analysis of China’s Energy Conservation Campaign.” Energy 36(8): 4996-5003.
Galbreath, J. [2002]. “Success in the Relationship Age: Building Quality Relationship Assets for Market Value Creation.” The TQM Magazine 14(1): 8-24.
Gonnet, G. H. [1984]. Handbook of Algorithms and Data Structures. Boston, MA: Addison-Wesley.
Granovetter, M. S. [1973]. “The Strength of Weak Ties.” American Journal of Sociology 78(6): 1360-1380.
Granovetter, M. [1992]. “Problems of Explanation in Economic Sociology.” N. Nohria and R. G. Eccles (eds.), Networks and Organizations: Structure, Form and Action. Boston: HBS Press: 25-26.
Green, P. and V. Srinivasan. [1978]. “Conjoint Analysis in Consumer Research: Issues and Outlook.” Journal of Consumer Research 5: 103-123.

- 288 -
Grimble, R., and K. Wellard. [1997]. “Stakeholder Methodologies in Natural Resource Management: A Review of Principles, Context, Experiences and Opportunities.” Agricultural Systems 55(2): 173-193.
Grossi, I. [2003]. Stakeholder Analysis in the Context of the Lean Enterprise. Master’s Thesis, Engineering Systems Division & Sloan School of Management, Massachusetts Institute of Technology. Cambridge, MA.
Gross, J. L. and J. Yellen (eds.). [2003]. Handbook of Graph Theory. Boca Raton, Florida: CRC Press.
Handy, C. B. [1993]. Understanding Organizations (4th edition). Harmondsworth, UK: Penguin.
Hanneman, R. and M. Riddle. [2005]. Introduction to Social Network Methods. Riverside, CA: University of California, Riverside.
Hanowsky, M. and J. M. Sussman. [2008]. Design of Ground Delay Programs Considering the Stakeholder Perspective. Working Paper ESD-WP-2008-18, Engineering Systems Division, Massachusetts Institute of Technology. Cambridge, MA.
Harary, F., R. Z. Norman, and D. Cartwright. [1965]. Structural Models: An Introduction to the Theory of Directed Graphs. New York: Wiley.
Harre, R. [1979]. Social Being. Oxford: Blackwell.
Harrison, J. S., D. A. Bosse, and R. A. Phillips. [2010]. “Managing for Stakeholders, Stakeholder Utility Functions, and Competitive Advantage.” Strategic Management Journal 31: 58-74.
Harrison, J. S. and C. H. St. John. [1996]. “Managing and Partnering with External Stakeholders.” Academy of Management Executive 10(2): 46-60.
Hashimoto, M. [2009]. Public-Private Partnerships in Space Projects: An Analysis of Stakeholder Dynamics. Master’s Thesis, Engineering Systems Division, Massachusetts Institute of Technology. Cambridge, MA.
He, J., J. Deng, and M. Su. [2010]. “CO2 Emission from China’s Energy Sector and Strategy for Its Control.” Energy 35(11): 4494-4498.
Heinz, J. P., E. O. Laumann, R. L. Nelson, and R. H. Salisbury. [1993]. The Hollow Core: Private Interests in National Policy Making. Cambridge, MA: Harvard University Press.
Hicks, J. and R. Allen. [1934]. “A Reconsideration of the Theory of Value (Part I).” Economica 1(1): 52-76.

- 289 -
Hillman, A. J. and G. D. Keim. [2001]. “Shareholder Value, Stakeholder Management, and Social Issues: What's the Bottom Line?” Strategic Management Journal 22: 125-139.
Hirschman, A. O. [1957]. “Economic Policy in Underdeveloped Countries.” Economic Development and Cultural Change 5(4): 362-370.
Hochbuam, D. [2008]. Graph Algorithms and Network Flows. IEOR 266 Notes, UC Berkeley.
Holland, J. H., K. J. Holyoak, R. E. Nisbett, and P. R. Thagard. [1986]. Induction: Processes of Inference, Learning, and Discovery. Cambridge, MA: MIT Press.
Homans, G. C. [1958]. “Social Behavior as Exchange.” American Journal of Sociology 63: 597-606.
Homans, G. C. [1961]. Social Behavior. New York: Harcourt, Brace & World.
Homans, G. C. [1990]. “Rational Choice Theory and Behavioral Psychology.” C. Calhoun, M. Meyer, and R. Scott (eds.), Structures of Power and Constraint. Cambridge: Cambridge University Press.
Hu, Jintao. [2007]. Report to the Seventeenth National Congress of the Communist Party of China (CPC). Beijing, China.
Hughes, T. P. [1998]. Rescuing Prometheus: Four Monumental Projects That Changed Our World (1st edition). New York: Pantheon Books.
IPCC (Intergovernmental Panel on Climate Change). [2007]. “Climate Change 2007: Synthesis Report.” The IPCC Fourth Assessment Report. Geneva: IPCC.
Jackson, M. O. [2008]. Social and Economic Networks. Princeton, NJ: Princeton University Press.
Jensen, M. C. [2001]. “Value Maximization, Stakeholder Theory, and the Corporate Objective Function.” European Financial Management 7(3): 297-317.
Jensen, M. C. and W. H. Meckling. [1976]. “Theory of the Firm: Managerial Behavior, Agency Costs and Ownership Structure.” Journal of Financial Economics 3(4): 305-360.
Jiang, B, Z. Sun, and M. Liu. [2010]. “China’s Energy Development Strategy under the Lowcarbon Economy.” Energy 35(11): 4257-4264.
Jiang, Zemin. [2008]. “Reflections on Energy Issues in China.” Journal of Shanghai Jiao Tong University 42(3): 345-359 (in Chinese).

- 290 -
Johnson, D. B. [1975]. “Finding All the Elementary Circuits of a Directed Graph.” SIAM J. Comput. 4(1): 77–84.
Jones, T. M. [1995]. “Instrumental Stakeholder Theory: A Synthesis of Ethics and Economics.” Academy of Management Review 20(2): 404-437.
Jones, T. M. and A. C. Wicks. [1999]. “Convergent Stakeholder Theory.” Academy of Management Review 24(2): 206-221.
Kahneman, D. and A. Tversky. [1979]. “Prospect Theory: An Analysis of Decision under Risk.” Econometrica 47(2): 263-292.
Kano, Noriaki, et al. [1984]. “Attractive Quality and Must-be Quality.” Quality 14(2): JSQC (Tokyo: Japanese Society for Quality Control).
Kapferer, B. [1969]. “Norms and the Manipulation of Relationships in a Work Context.” In Mitchell, J. C. (ed.), Social Networks in Urban Settings. Manchester, England: Manchester University Press: 181-244.
Keeney, R. L. and H. Raiffa. [1976]. Decisions with Multiple Objectives: Preferences and Value Tradeoffs. New York: Wiley.
Keller, R. [2007]. Predicting Change Propagation: Algorithms, Representations, Software Tools. Doctoral Dissertation, Wolfson College, Cambridge University Engineering Department, United Kingdom.
Knuth, D. E. [1973]. Sorting and Searching (Volume 3 of the Art of Computer Programming). Boston, MA: Addison-Wesley.
Köbberling, V. [2006]. “Strength of Preference and Cardinal Utility.” Economic Theory 27(2): 375-391.
Kochan, T. A. and S. Rubinstein. [1997]. Toward a Stakeholder Theory of the Firm: The Case of the Saturn Partnership. Working Paper SWP#: 3959-97-BPS, Sloan School of Management, Massachusetts Institute of Technology. Cambridge, MA.
Koo, B. [2005]. A Meta-Language for System Architecting. Doctoral Dissertation, Engineering Systems Division, Massachusetts Institute of Technology, Cambridge, MA.
Koopmans, T. C., P. A. Diamond, and R. E. Williamson. [1964]. “Stationary Utility and Time Perspective.” Econometrica 32(1-2): 82-100.
Laibson, D. [1997]. “Golden Eggs and Hyperbolic Discounting.” The Quarterly Journal of Economics 112(2): 443-477.
Laplume, A. O., K. Sonpar, and R. A. Litz. [2008]. “Stakeholder Theory: Reviewing a Theory That Moves Us.” Journal of Management 34(6): 1152-1189.

- 291 -
Lathrop, B. H. [2006]. Evaluating a Continuous Improvement Initiative Using Stakeholder Value Mapping. Master’s Thesis, Sloan School of Management & Department of Chemical Engineering, Massachusetts Institute of Technology. Cambridge, MA.
Laumann, E. O. [2006]. “A 45-year Retrospective on Doing Networks.” Connections 27(1): 65-90.
Laumann, E. O. and D. Knoke. [1987]. Organizational State: Social Choice in National Policy Domains. Madison, Wisconsin: University of Wisconsin Press.
Laumann, E. O., P. V. Marsden, and D. Prensky. [1983]. “The Boundary Specification Problem in Network Analysis.” R. S. Burt and M. J. Minor (eds.), Applied Network Analysis: A Methodological Introduction. Beverly Hills: Sage: 18-34.
Laumann, E. O. and F. U. Pappi. [1976]. Networks of Collective Action: A Perspective on Community Influence Systems. New York: Academic Press.
Lazega, E. and P. E. Pattison. [1999]. “Multiplexity, Generalized Exchange and Cooperation in Organizations: A Case Study.” Social Networks 21: 67-90.
Lévi-Strauss, C. [1949] 1969. The Elementary Structures of Kinship (J. H. Bell, J. R. von Sturmer, et al., Trans.) (Rev. ed.). Boston: Beacon Press.
Lévi-Strauss, C. [1963]. Structural Anthropology. New York: Basic.
Levine, S. S. and S. Shah. [2003]. “Towards a Theory of Large-Scale Generalized Exchange.” Danish Research Unit on Industrial Dynamics (DRUID) Summer Conference on Creating, Sharing and Transferring Knowledge: The Role of Geography. Copenhagen, Denmark.
Li, Z., L. Ma, K. Pan, et al. [2006]. “Harmonious Development of Industry and Energy in China”. Energy of China 28(10): 5-11 (in Chinese).
Lindemann, U., M. Maurer, et al. [2008]. “Deduction of Indirect Dependencies.” Chapter in Structural Complexity Management. Berlin Heidelberg: Springer.
Linstone, H. A. and M. Turoff. [1975]. The Delphi Method: Techniques and Applications. Reading, MA: Addison-Wesley.
Lindenberg, M. and C. Bryant. [2001]. Going Global: Transforming Relief and Development NGOs. Bloomfield: Kumarian Press.
Loewenstein, G. and D. Prelec. [1992]. “Anomalies in Intertemporal Choice: Evidence and An Interpretation.” The Quarterly Journal of Economics 107(2): 573-597.
Lorrain, F. P. and H. C. White. [1971]. “Structural Equivalence of Individuals in Social Networks.” Journal of Mathematical Sociology 1: 49-80.

- 292 -
Lucea, R. [2007]. Cross-Border Non-Market Environments; a multi-relational approach (in Essays on Global Non-Market Strategy). Doctoral Dissertation, Sloan School of Management, Massachusetts Institute of Technology, Cambridge, MA: 17-48.
Lucea, R. and J. Doh. [2012]. “International Strategy for the Nonmarket Context: Stakeholders, Issues, Networks, and Geography.” Business and Politics 14(3): 1-30.
Luhn, H. P. [1953]. “A New Method of Recording and Searching Information.” American Documentation 4: 14-16.
Ma, L., P. Liu, F. Fu, Z. Li, and W. Ni. [2011]. “Integrated Energy Strategy for the Sustainable Development in China.” Energy 36(2): 1143-1154.
Mahon, J. F., P. P. M. A. R. Heugens, and K. Lamertz. [2003]. “Social Networks and Non-Market Strategy.” Journal of Public Affairs 4(2): 170-189.
Malinowski, B. [1922]. “Kula, the Circulating Exchange of Valuables in the Archipelagoes of Eastern New Guinea.” Man 20.
Marshall, A. [1920]. Principles of Economics: An Introductory Volume (8th edition). London: Macmillan.
Marx, K. [1906]. Capital. Chicago: C. H. Kerr.
Mateti, P. and N. Deo. [1976]. “On Algorithms for Enumerating All Circuits of a Graph.” SIAM J. Comput. 5(1): 90–99.
Matty, D. [2010]. Stakeholder Salience Influence on Bureaucratic Program Enterprise Value Creation. Doctoral Dissertation, Engineering Systems Division, Massachusetts Institute of Technology. Cambridge, MA.
McAdam, D., H. S. Boudet, J. Davis, et al. [2010]. “’Site Fights’: Explaining Opposition to Pipeline Projects in the Developing World.” Sociological Forum 25(3): 401-427.
McKenna, N. [2006]. The Micro-foundations of Alignment among Sponsors and Contractors on Large Engineering Projects. Doctoral Dissertation, Engineering Systems Division, Massachusetts Institute of Technology. Cambridge, MA.
Miller, G. A. [1956]. “The Magic Number Seven, Plus or Minus Two: Some Limits on Our Capacity for Processing Information.” Psychological Review 63: 81-97.
Miller, R. and D. R. Lessard. [2001]. The Strategic Management of Large Engineering Projects: Shaping Institutions, Risks, and Governance. Cambridge, MA: MIT Press.

- 293 -
Mitchell, R. K., B. R. Agle, and D. J. Wood. [1997]. “Toward A Theory of Stakeholder Identification and Salience: Defining the Principle of Who and What Really Counts.” Academy of Management Review 22(4): 853-886.
Molm, L. [1990]. “Structure, Action, and Outcomes: The Dynamics of Power in Social Exchange.” American Sociological Review 55: 427-447.
Moses, J. [2004a]. “Foundational Issues in Engineering Systems: A Framing Paper.” Engineering Systems Monograph. Massachusetts Institute of Technology, Cambridge, MA.
Moses, J. [2004b]. “Three Design Methodologies, Their Associated Organizational Structures and Their Relationship to Various Fields.” Engineering Systems Symposium. Massachusetts Institute of Technology, Cambridge, MA.
Moscati, Ivan. [2012]. “How Cardinal Utility Entered Economic Analysis During the Ordinal Revolution.” Working Paper. Facolta di Economia, Universita Dell'Insubria.
Mostashari, A. [2005]. Stakeholder-Assisted Modeling and Policy Design Process for Engineering Systems. Doctoral Dissertation, Engineering Systems Division, Massachusetts Institute of Technology. Cambridge, MA.
Mostashari, A. and J. M. Sussman. [2004]. “Engaging Stakeholders in Engineering Systems Representation and Modeling.” Engineering Systems Symposium. Massachusetts Institute of Technology, Cambridge, MA.
Mushove, P and C. Vogel. [2005]. “Heads or Tails? Stakeholder Analysis as a Tool for Conservation Area Management.” Global Environmental Change 15(3): 184-198.
Myerson, R. B. [1977]. “Graphs and Cooperation in Games.” Mathematics of Operations Research 2(3): 225-229.
Nam, J. [2012]. The Strategic Importance of the “Stakeholder Approach” in the Service Industry. Master’s Thesis, Sloan School of Management, Massachusetts Institute of Technology. Cambridge, MA.
National People’s Congress. [2007]. Energy Conservation Law of the People’s Republic of China (2007 Revision). Beijing, China.
Ni, W., Z. Chen, and Z. Li. [2008]. “Energy Challenges for China and the Corresponding Strategies.” Energy of China 30(12): 5-9 (in Chinese).
North, D. C. [1990]. Institutions, Institutional Change, and Economic Performance. Cambridge, UK: Cambridge University Press.
North, D. C. [1991]. “Institutions.” The Journal of Economic Perspectives 5(1): 97-112.

- 294 -
Olson, M. [1965]. The Logic of Collective Action: Public Goods and the Theory of Group. Cambridge, MA: Harvard University Press.
Orme, B. [2005]. Getting Started with Conjoint Analysis. Madison, WI: Researcher Publishers LLC.
Parfitt, T. [2006]. “Kremlin attack dog vows to take on Shell in the battle of Sakhalin.” The Guardian (Guardian News and Media Limited). Retrieved 2013-02-01.
Parrot, K. W. [2007]. Lateral Stakeholder Alignment in the Global Water Partnership. Master’s Thesis, Engineering Systems Division, Massachusetts Institute of Technology. Cambridge, MA.
Paz, I. M. [1967]. “Pathfinding through a Communication Network.” Proc. IEE (London) 114: 76-77.
Phillips, R. A. [1997]. “Stakeholder Theory and A Principle of Fairness.” Business Ethics Quarterly 7(1): 51-66.
Pickett, S. E. [1997]. Deliberation: Integrating Stakeholder Values and Risk Assessments in Environmental Decision Making. Master’s Thesis, Sloan School of Management & Department of Nuclear Science and Engineering, Massachusetts Institute of Technology. Cambridge, MA.
Porter, M. E. [1985]. Competitive Advantage. New York: The Free Press.
Qian, Xuesen (Tsien, Hsue-Shen). [1988]. Essays on Systems Engineering. Shanghai: Shanghai Jiao Tong University Press. (in Chinese)
Robins, G. and P. Pattison. [2006]. Multiple Networks in Organizations. University of Melbourne, Australia.
Roloff, J. [2008]. “Learning from Multi-Stakeholder Networks: Issue-Focussed Stakeholder Management.” Journal of Business Ethics 82: 233-250.
Rorty, R. [1979]. Philosophy and the Mirror of Nature. Princeton, NJ: Princeton University Press.
Rowley, T. J. [1997]. “Moving beyond Dyadic Ties: A Network Theory of Stakeholder Influences.” Academy of Management Review 22(4): 887-910.
Saaty, T. L. [1999]. Decision Making for Leaders: The Analytic Hierarchy Process for Decisions in a Complex World. Pittsburgh, Pennsylvania: RWS Publications.
Saaty, T. L. [2001]. Fundamentals of Decision Making and Priority Theory. Pittsburgh, Pennsylvania: RWS Publications.

- 295 -
Sabidussi, G. [1964]. “Infinite Euler Graphs.” Canadian Journal of Mathematics 16: 821-838.
Sackman, H. [1974]. “Delphi Assessment: Expert Opinion, Forecasting, and Group Process.” Report R-1283-PR. The RAND Corporation, Santa Monica, CA.
Sahlins, M. [1965a]. Essays in Economic Anthropology. Seattle: University of Washington Press.
Sahlins, M. [1965b]. “Exchange Value and the Diplomacy of Primitive Trade.” In the Proceedings of American Anthropology Society. Seattle: University of Washington Press.
Samuelson, P. A. [1937]. “A Note on Measurement of Utility.” The Review of Economic Studies 4(2): 155-161.
Schenker, M. J. [1991]. Convergence of Neo-Classical and Stakeholder Models of the Firm? A Case Study of Buy Out Attempts at United States. Master’s Thesis, Sloan School of Management, Massachusetts Institute of Technology. Cambridge, MA.
Schumpeter, J. A. [1934]. The Theory of Economic Development. Cambridge, MA: Harvard University Press.
Schumpeter, J. A. [1942]. Capitalism, Socialism and Democracy. New York: Harper.
Scott, S. G. and V. R. Lane. [2000]. “A Stakeholder Approach to Organizational Identity.” Academy of Management Review 25(1): 43-62.
Scott, W. R. [1987]. “The Adolescence of Institutional Theory.” Administrative Science Quarterly 32(4): 493-511.
Scott, W. R. [2001]. Institutions and Organizations. London: Sage.
Scott, W. R. [2002]. Organizations: Rational, Nature, and Open Systems (5th Edition). Upper Saddle River, NJ: Prentice Hall.
Scott, W. R. [2005]. “Institutional Theory: Contributing to a Theoretical Research Program.” in the Great Minds in Management: The Process of Theory Development by Smith, K. G. and M. A. Hitt. Oxford, UK: Oxford University Press: 460-484.
Scott, W. R. and C. Calhoun. [2004]. “Peter Michael Blau: 1918~2002.” Biographical Memoirs vol. 85. Washington, D. C.: National Academies Press.
Seher, T. K. [2009]. Campaign-level Science Traceability for Earth Observation System Architecting. Master’s Thesis, Department of Aeronautics and Astronautics, Massachusetts Institute of Technology, Cambridge, MA.
- 296 -
Shah, S. and S. Levine. [2003]. “Towards a Theory of Large-Scale Generalized Exchange.” The Annual Meeting of the American Sociological Association. Atlanta, GA.
Shi, Y. [2012]. The Role of Infrastructure Capital in China’s Regional Economic Growth. Job Market Paper, Michigan State University.
Simon, H. A. [1962]. “The Architecture of Complexity.” Proceedings of the American Philosophical Society 106(6): 467-482.
Simon, H. A. [1972]. “Theories of Bounded Rationality.” Decision and Organization 1: 161-176.
Simon, H. A. [1997]. Models of Bounded Rationality (Vol. 3): Empirically Grounded Economic Reason. Cambridge, MA: MIT Press.
Skyrms, B. [2004]. The Stag Hunt and the Evolution of Social Structure. Cambridge, UK: Cambridge University Press.
Slinger, G. [1999]. “Spanning the Gap – The Theoretical Principles that Connect Stakeholder Policies to Business Performance.” Corporate Governance 7(2): 136-151.
Smith, K. G., T. R. Mitchell, and C. E. Summer. [1985]. “Top Level Management Priorities in Different Stages of the Organizational Life Cycle.” Academy of Management Journal 28(4): 799-820.
State Council. [2007]. Plan for Energy Conservation and Emission Reduction in the Eleventh Five-Year. No.15, Beijing, China.
State Council. [2012]. Plan for Energy Conservation and Emission Reduction in the Twelfth Five-Year. No.40, Beijing, China.
Sterman, J. D. [2000]. Business Dynamics. McGraw-Hill/Irwin.
Steward, D. V. [1981a]. System Analysis and Management: Structure, Strategy, and Design. Princeton, NJ: Petrocelli Books.
Steward, D. V. [1981b]. “The Design Structure System: A Method for Managing the Design of Complex Systems.” IEEE Transactions on Engineering Management 28(3): 71-74.
Stolte, J. F., G. A. Fine, and K. S. Cook. [2001]. “Sociological Miniaturism: Seeing the Big through the Small in Social Psychology.” Annual Review of Sociology 27: 387-413.
Strotz, R. H. [1953]. “Cardinal Utility.” American Economic Review 43(2): 384-397.
- 297 -
Sutherland, T. A. [2009]. Stakeholder Value Network Analysis for Space-Based Earth Observation. Master’s Thesis, Department of Aeronautics and Astronautics & Engineering Systems Division, Massachusetts Institute of Technology, Cambridge, MA.
Szwarcfiter, J. L. and P. E. Lauer. [1976]. “A Search Strategy for the Elementary Cycles of a Directed Graph.” BIT 16: 192-204.
Takahashi, N. [2000]. “The Emergence of Generalized Exchange.” American Journal of Sociology 105(4): 1105-1134.
Tarjan, R. [1972]. Enumeration of the Elementary Circuits of a Directed Graph. Manuscript TR72-145, Department of Computer Science, Cornell University. Ithaca, NY.
Thorelli, H. B. [1986]. “Networks: between Markets and Hierarchies.” Strategic Management Journal 7(1): 37-51.
Treviño L. K. and G. R. Weaver. [1999]. “Response: The Stakeholder Research Tradition: Converging Theorists – Not Convergent Theory.” Academy of Management Review 24(2): 222-227.
TSMPT (Tsinghua-BP Sustainable Mobility Project Team). [2008]. Sustainable Mobility in Rapid Urbanization: Theory and Practice in China. Beijing: China Railway Publishing House.
Tufte, E. R. [1983]. The Visual Display of Quantitative Information. Cheshire, CT: Graphics Press.
Tufte, E. R. [1990]. Envisioning Information. Cheshire, CT: Graphics Press.
Tufte, E. R. [1997]. Visual Explanations: Images and Quantities, Evidence and Narrative. Cheshire, CT: Graphics Press.
Turner, J. [1997]. The Institutional Order. New York: Longman.
Tushman, M. L. and R. R. Nelson. [1990]. “Introduction: Technology, Organizations, and Innovation.” Administrative Science Quarterly 35(1): 1-8.
Tversky, A. and D. Kahneman. [1992]. “Advances in Prospect Theory: Cumulative Representation of Uncertainty.” Journal of Risk and Uncertainty 5(4): 297-323.
Ulrich, K. T. and S. D. Eppinger. [2011]. Product Design and Development (5th Edition). Boston: McGraw-Hill/Irwin.
Van de Ven, A. H. [1976]. “On the Nature, Formation, and Maintenance of Relations Among Organizations.” Academy of Management Review 1(4): 24-36.

- 298 -
Veblen, O. [1912]. “An Application of Modular Equations in Analysis Situs.” Annals of Mathematics, Second Series 14(1): 86-94.
Venkataraman, S. [1997]. “The Distinctive Domain of Entrepreneurship Research: An Editor’s Perspective.” In J. Katz and R. Brokhous (eds.), Advances in Entrepreneurship, Firm Emergence, and Growth. Greenwich, CT: JAI Press.
Venkataraman, S. [2002]. “Stakeholder Value Equilibration and the Entrepreneurial Process.” In R. E. Freeman and S. Venkataraman (eds.), Ethics and Entrepreneurship. Charlottesville, VA: Philosophy Documentation Center.
Von Mises, L. [1944]. Bureaucracy. New Haven: Yale University Press.
Von Neumann, J. and O. Morgenstern. [1944]. Theory of Games and Economic Behavior. Princeton: Princeton University Press.
Walden, D., et al. [1993]. “Kano’s Methods for Understanding Customer-defined Quality.” Center for Quality of Management Journal 2(4): 1-36.
Walker, H. A., S. R. Thye, B. Simpson, et al. [2000]. “Network Exchange Theory: Recent Developments and New Directions.” Social Psychology Quarterly 63(4): 324-337.
Wang, Q. [2008]. China Energy Statistics in 2008. Beijing: The China Sustainable Energy Program.
Warfield, John N. [1973]. “Binary Matrices in System Modeling.” IEEE Transactions on Systems, Man, and Cybernetics 3(5): 441-449.
Wasserman, S. and K. Faust. [1994]. Social Network Analysis: Methods and Applications. New York, NY: Cambridge University Press.
Weibull, J. W. [1997]. Evolutionary Game Theory. Cambridge, MA: MIT Press.
Weinblatt, H. [1972]. “A New Search Algorithm for Finding the Simple Cycles of a Finite Directed Graph.” Journal of the Association for Computing Machinery 19(1): 43-56.
Westphal, J. D. and E. J. Zajac. [1997]. “Defections from the Inner Circle: Social Exchange, Reciprocity, and the Diffusion of Board Independence in U.S. Corporations.” Administrative Science Quarterly 42(1): 161-183.
Wheeler, D., B. Colbert, and R. E. Freeman. [2003]. “Focusing on Value: Reconciling Corporate Social Responsibility, Sustainability and a Stakeholder Approach in a Network World.” Journal of General Management 28(3): 1-28.
Wheeler, D. and M. Sillanpää. [1998]. “Including the Stakeholders: The Business Case.” Long Range Planning 31(2): 201-210.

- 299 -
White, H. C., S. A. Boorman, and R. L. Breiger. [1976]. “Social Structure from Multiple Networks. I. Blockmodels of Roles and Positions.” American Journal of Sociology 81(4): 730-780.
Wicks, A. C. and R. E. Freeman. [1998]. “Organization Studies and the New Pragmatism: Positivism, Anti-Positivism, and the Search for Ethics.” Organization Science 9(2): 123-140.
Wicks, A. C. and J. S. Harrison. [2013]. “Stakeholder Theory, Value, and Firm Performance.” Business Ethics Quarterly 23(1): 97-124.
Williamson, O. E. [1973]. “Markets and Hierarchies: Some Elementary Considerations.” The American Economic Review 63(2): 316-325.
Williamson, O. E. [1975]. Markets and Hierarchies: Analysis and Antitrust Implications. New York: Free Press.
Williamson, O. E. [1981]. “The Economics of Organizations: The Transaction Cost Approach.” American Journal of Sociology 87(3): 548-577.
Winch, G. M. [2004]. “Managing Project Stakeholders.” P. W. G. Morris and J. K. Pinto (eds.), The Wiley Guide to Managing Projects. Hoboken, NJ: John Wiley & Sons: 321-339.
Wood, D. J. [1991]. “Corporate Social Performance Revisited.” Academy of Management Review 16(4): 691-718.
World Bank. [1995]. China: Public Investment and Finance. World Bank Report No. 14540-CHA.
Wu, Q., C. Wu, and T. Lu. [2008]. “Study on the Stakeholders of Energy System in China.” Proceedings of International Conference on Management Science and Engineering. Beijing, China. September 10-12, 2008: 1524-1530.
Yamagishi, T. and K. S. Cook. [1990]. “Power Relations in Exchange Networks: A Comment on ‘Network Exchange Theory’.” American Sociological Review 55(2): 297-300.
Yamagishi, T. and K. S. Cook. [1993]. “Generalized Exchange and Social Dilemmas.” Social Psychology Quarterly 56(4): 235-248.
Yamagishi, T., M. R. Gillmore, and K. S. Cook. [1988]. “Network Connections and the Distribution of Power in Exchange Networks.” American Journal of Sociology 93(4): 833-851.
Yang, W., and H. Zhu. [2008]. “Analysis of Ecosystem of Energy Conservation Based on the View of Stakeholders.” Ecological Economy (9): 148-153 (in Chinese).

- 300 -
Yergin, D. [1991]. The Prize: the Epic Quest for Oil, Money, and Power. New York: Simon & Schuster.
Zafirovski, M. [2005]. “Social Exchange Theory under Scrutiny: A Positive Critique of Its Economic-Behaviorist Formulations.” Electronic Journal of Sociology: 1-40.
Zhou, N., M. A. McNeil, D. Fridley, et al. [2007]. Energy Use in China: Sectoral Trends and Future Outlook. Lawrence Berkeley National Laboratory Report (LBNL-61904). Berkeley, California, USA.

- 301 -
DISSERTATION PUBLICATIONS I. Referred Journal Articles
Cameron, B. G., E. F. Crawley, W. Feng, and M. Lin. [2011]. “Strategic Decisions in Complex Stakeholder Environments: A Theory of Generalized Exchange.” Engineering Management Journal 23(3): 37-45.
Fu, F., W. Feng, Z. Li, E. F. Crawley, and W. Ni. [2011]. “A Network-based Modeling Framework for Stakeholder Analysis of China’s Energy Conservation Campaign.” Energy 36(8): 4996-5003.
II. Conference Papers
Feng, W., E. F. Crawley, O. L. de Weck, R. Keller, and B. Robinson. [2010]. “Dependency Structure Matrix Modelling for Stakeholder Value Networks.” Proceedings of the 12th International Dependency and Structure Modelling Conference. July 22-23, 2010. Cambridge, UK: 3-16.
Feng, W., E. F. Crawley, O. L. de Weck, D. R. Lessard, and B. G. Cameron. [2012]. “Understanding the Impacts of Indirect Stakeholder Relationships: Stakeholder Value Network Analysis and Its Application to Large Engineering Projects.” The Strategic Management Society (SMS) 32nd Annual International Conference. October 6-9, 2012. Prague, Czech Republic. − Nominees, the SMS Best Conference Paper Prize (top 51 out of 1200) and the
SMS Best Conference Paper Prize for Practice Implications (top 31 out of 1200).
− Also published as working papers ESD-WP-2012-26 and SSRN-id2162037.
Feng, W., D. R. Lessard, E. F. Crawley, O. L. de Weck. [2013]. “Stakeholder Value Network and Strategic Issues for the Shaping of Large Engineering Projects.” Engineering Project Organizations Conference (EPOC) – International Community. July 9-11, 2013. Winter Park, CO.
Feng, W., E. F. Crawley, D. R. Lessard, B. G. Cameron, and O. L. de Weck. [2013]. “Moving beyond Single Relations: A Multi-Relational Network Theory of Stakeholder Power.” The Strategic Management Society (SMS) 33rd Annual International Conference. September 28 ~ October 1, 2013. Atlanta, GA.
III. Book Chapters
Feng, W., E. F. Crawley, O. L. de Weck, R. Keller, B. Robinson, and J. Lin. [2012]. “BP Stakeholder Value Network.” in Design Structure Matrix Methods and Applications by Eppinger, S. D. and T. R. Browning. Cambridge, MA: MIT Press: 122-127.

- 302 -
In Preparation
Feng, W., E. F. Crawley, D. R. Lessard, O. L. de Weck, and B. G. Cameron. [2013]. “Stakeholder Value Network: An Integrated Multi-Relational Approach for Stakeholder Salience and Strategic Issues.” Manuscript aiming for submission to Academy of Management Review.
Feng, W., E. F. Crawley, D. R. Lessard, O. L. de Weck, and B. G. Cameron. [2013]. “Understanding the Impacts of Indirect Stakeholder Relationships: Stakeholder Value Network Analysis and Its Application to Large Engineering Projects.” Manuscript aiming for submission to Strategic Management Journal.
Feng, W., E. F. Crawley, D. R. Lessard, O. L. de Weck, and B. G. Cameron. [2013]. “A Multi-Relational Network Approach Based on Generalized Exchanges: Theory, Methodology, Tool, and Evidence.” Manuscript aiming for submission to Social Networks.
Feng, W., E. F. Crawley, F. Fu, Z. Li, and W. Ni. [2013]. “Stakeholder Value Network Analysis for China’s Energy Conservation Campaign (Part II): Hierarchical Modeling and New Findings.” Manuscript aiming for submission to Energy.

- 303 -
APPENDIX I: FROM SVN TO SYSTEMS ARCHITECTING
“Changes in the world’s political, economic and
technological realms in the past century have placed great
stresses on approaches to management and system design.
The changes that have had the greatest impact are the
increase in size and complexity of the human organizations
and technical systems needed in the world today, and the
rate of change in the external environment with which these
organizations and systems must cope.”
— Joel Moses (from [Hughes, 1998, p. 1])
A.1 Introduction
From Chapter 2 to Chapter 6, the theory, methodology, and tool for the SVN analysis are
developed step by step, with the application to two cases of large engineering projects.
On the basis of these chapters and against an even broader backdrop, this Appendix
briefly explores the possible ways to bridge the SVN analysis to Systems Architecting,
which is defined as “the process by which standards, rules, system structures and
interfaces are created in order to achieve the requirements of a system” [ESD Symposium
Committee, 2006, p. 6], so that the synergy between stakeholder management and system
design can be achieved to ensure the long-term success of large engineering projects in a
complex and dynamic socio-technical environment.
Specifically, based on the unique features of the SVN analysis, which models the multi-
type and networked stakeholder relationships as value exchanges, two promising methods
are conceived in this Appendix, namely, the Stakeholder-Oriented Architecting
Process and the Value Exchange Rates and Matrix.

- 304 -
A.2 Stakeholder-Oriented Architecting Process
Figure A-1-1 illustrates the conceptual framework of the Stakeholder-Oriented
Architecting Process, which consists of two major parts, that is, the Stakeholder
Networks on the left and the Large Engineering Projects on the right.
Borrowing the symbols from the Object-Process Methodology (OPM) [Dori, 2002], the
architecting process for Large Engineering Projects can be further divided into four
columns, from left to right: Intent, Function (Process and Operand), Form (Object), and
the Projects, which represent the standard steps for engineers to design the physical
architectures of Large Engineering Projects. Specifically, the first step is usually
transforming the intent to a few solution-neutral designs, and then defining the specific
function of the selected design, and finally choosing the specific forms and integrating
them into a complete artifact. Note that from the perspective of Engineering Systems,
complexity and uncertainty are two basic characteristics associated with the architectures
of Large Engineering Projects, and today’s engineers should not only care about the
immediate value of the architectures, such as cost and schedule, but also take their life-
cycle value into consideration. Using the terminology of Engineering Systems, life-cycle
value is reflected through many “ilities”, such as flexibility, commonality, reliability,
maintainability, durability, scalability, safety, recyclability, and so on, with sustainability
as the “holistic, if not overarching goal” [Moses, 2004a, p. 12].
The Stakeholder Networks can also be divided into four columns, from right to left:
Need, Value, Individual Evaluation, and Group Decision, which represent the normal
process for each stakeholder to make decisions related to the Large Engineering Projects.
Specifically, stakeholder needs often provide engineers the intent of design, and once the
physical architectures come into being, each stakeholder will usually have different
perception for the (immediate and life-cycle) value of the Large Engineering Projects.
Finally, the collective feedback from the Stakeholder Networks to the Large Engineering
Projects generally takes the form of group decisions, after multi-round negotiations

- 305 -
influenced by the value perception and decision power of each stakeholder. Note that
from the perspective of SVN, stakeholders’ power is the confluence of both exchange
relationships and network structures, as demonstrated by the Project Phoenix case in
Chapter 4. Moreover, corresponding to the organizational hierarchies of each stakeholder,
which are discussed through the China case in Chapter 6, stakeholders’ specific needs,
value perceptions, individual evaluations, and group decisions can also be classified into
different levels, as emphasized by Keeney and Raiffa [1976, p. 44].
On the basis of the above reasoning, three meta-flows, namely, Architecture Design,
Architecture Selection, and Architecture Iteration, finally connect Stakeholder Networks
and Large Engineering Projects into the Stakeholder-Oriented Architecting Process. Note
that the whole process should not be interpreted as a static, linear, and one-time
phenomenon, but instead a dynamic, interactive, and iterative one.
In addition to its explanatory power, Figure A-1-1 also delivers two important messages
as both challenges and opportunities for engineers, managers, and policymakers around
the Large Engineering Projects:
Mapping between the Hierarchies of Objective, Organization, and
Architecture: (1) First and foremost, as “one of the central structural schemes
that the architect of complexity uses” [Simon, 1962, p. 468], hierarchy is a
common characteristics of objectives, stakeholders, and physical architectures.
More specifically, engineers are knowledgeable about the architectural hierarchy
shown on the right of Figure A-1-1; managers or decision analysts apply the
hierarchy of multiple objectives to construct multi-attribute utility functions and
inform the value trade-offs, as shown on the left of Figure A-1-1; and Chapter 6
in this dissertation, joined by organization scholars and social scientists,
demonstrates the necessity to understand the organizational hierarchy of large
and important stakeholders. However, a complete mapping between these types
of hierarchies is still missing in many studies and practices, and arguably, this
often causes the complexity across different domains cannot be fully understood

- 306 -
and effectively coped in a holistic way. (2) In the real world, stakeholders often
express their needs abstractly on the highest level but root their value perceptions
into the form attributes on the lowest level, as shown in Figure A-1-1. Actually,
such a disparity often brings the difficulty (for both managers and engineers) to
keep a logical consistency between the priority of stakeholder needs and the
importance of form attributes. Therefore, it is important to explore the hierarchies
of stakeholder objective and system architecture, and then link them at the same
level. (3) In addition, as shown by the China case in Chapter 6, “the significant
problems we face cannot be solved at the same level of thinking we were at when
we created them”—if it is hard to analyze the stakeholder needs, values,
positions, and decisions on one specific level, researchers and practitioners may
want to shift their analysis into other levels to gain additional insights, by method
of decision tools such as the AHP (Analytic Hierarchy Process).
Developing A Common Language, Framework, and Methodology: Along the
three meta-flows, that is, Architecture Design, Architecture Selection, and
Architecture Iteration, Figure A-1-1 also attaches a non-exhaustive list of the
(currently) available theories and methods to each process. For example, during
the process of Architecture Design, system modeling is the traditional and
primary approach for engineers to specify the space of architecture alternatives
and compute the attributes of those alternatives—available methods include the
OPN (Object-Process Network), DSM (Design Structure Matrix), DOE (Design
of Experiments), and so on. However, the theories and methods for different
processes are often developed for their own purpose and therefore come up in a
fragmented way in Figure A-1-1. It would be difficult but well worthwhile to
build the interfaces between those theories and methods, so that engineers,
managers, and policymakers can share a common language, framework, and
methodology to tackle with these tough problems together—the SVN analysis
developed in this dissertation contributes to such an effort.

- 307 -
Figure A-1-1: Stakeholder-Oriented Architecting Process
Solution Neutral Transforming
Specific System Operating
Specific System Form
Attribute of Operating
Attribute of Form
Generic Concept Form
Attribute of Transforming
Beneficial Attribute
Operand
Stakeholder Networks
Operator
Supporting Systems
Engineering Systems
Intent Need Form (Object) Function (Process + Operand)
Need: Level 1
Concept
Concrete
Value: Level 1
Value
Need: Level 3
Need: Level 2 Value: Level 2
Value: Level 3
Value Need
Position: Level 1
Position: Level 2
Position: Level 3
Power
Decision: Level 1
Decision: Level 2
Decision: Level 3
Relationship
Individual Evaluation Group Decision
Top
Down
Interview and Delphi /Requirements Analysis /
Kano Model / QFD
MAUT / MCDM
Stakeholder Theory / Strategic Issue Management /
Network Game Theory / Negotiation Analysis
AHP
Decision Learning / System Dynamics /
Agent-based Modeling / Scenario Analysis
OPN / DSM / DOE
Uncertainty
Complexity
Immediate Value
Life-cycle Value (ilities)
Decomposed to
Specializes to
Has Attribute of
Architecture Design
Architecture Selection
Architecture Iteration
Existing Theories and Methods (Non-Exhaustive)
Sensitivity Analysis / Monte Carlo/
Stochastic Process / Real Options
Sustainability
Cost / Schedule
Abstract

- 308 -
A.3 Value Exchange Rates and Matrix
The other method, this Appendix shall propose now, is the Value Exchange Rates and
Matrix, based on further extension of the common framework in the SVN analysis for
both economic and social exchanges.
A.3.1 Theoretical Basis
As discussed in Chapter 2, for economic exchanges, Rational Choice Theory, which can
be simply put as the principle of maximizing benefits and minimizing costs, is the
dominant theoretical paradigm in microeconomics to explain exchange behavior of
individuals or organizations.
On the basis of Social Exchange Theory (SET), the SVN analysis in this dissertation
reduces both social and economic relationships to exchanges, through combining
Rational Choice Theory (subjective cost-benefit analysis to be specific) and Behaviorist
Psychology (comparison of alternatives to be specific). Under such a framework,
“concepts and principles borrowed from microeconomics” [Cook, 2000, p. 687] can be
applied to conduct “the economic analysis of noneconomic social situations” [Emerson,
1976, p. 336].
Exchange rates are clearly a widely used concept in microeconomics. In this section, this
concept will be borrowed to include the exchanges mediated by natural and technological
factors, in addition to the social and economic exchanges mediated by nonmarket and
market environments, as discussed throughout previous chapters. Arguably, these natural
and technological factors, such as the ratios from Oil to CO2 in the energy industry, are
also critical for the overall performance of Large Engineering Projects.
A.3.2 Example and Definitions

- 309 -
For a better understanding, this section uses the Large Oil Projects (LOP hereafter) as an
example to explain the definitions of the Value Exchange Rates and Matrix, as well as to
elaborate their implications.
Figure A-1-2 illustrates a simplified exchange model for the LOP. Similar to the
Stakeholder-Oriented Architecting Process discussed before, such an exchange model is
distinguished from other existing models by the inclusion of exchanges between
stakeholder network, physical architecture, and natural environment. Note that the
stakeholder network shown in Figure A-1-2 is a subset of the SVN in previous chapters,
because only those “architecturally significant” value flows are included.
Figure A-1-2: Simplified Exchange Model for the LOP
Based on the example in Figure A-1-2, the definitions of Value Exchange Rates are
summarized in Table A-1-1, and Figure A-1-3 maps these definitions back to the
simplified exchange model for the LOP.
CO2 Rejection
Oil Oil
CAPEX/OPEX Payment
Carbon Credits
Oil
Payment
Carbon Market
Oil Market
Govt
LOP Reservoir Asset
Atmosphere
Perm
its Taxes
Stakeholder Network (Architecture Related)
Oil E&P Architecture
CO2 Emission
CO
2 Em
issi
on
Carbon Credits
Carbon C
redits
Oil/Gas Flow GHG Flow (Carbon Equivalent)
Monetary Flow Political Flow
Stakeholder (Organization) Asset (Stock)
Legend

- 310 -
Further, Figure A-1-4 visualizes the structure between different exchange rates as a Value
Exchange Matrix.
Table A-1-1: Definitions of Value Exchange Rates for the LOP
Exchange Rate No. From To Definition Mediator / Driver
1 Oil CO2 Archi / Tech
2 Oil Money Oil Market
3 Oil Permit Institutions
4 CO2 Oil Reservoir
5 CO2 Money Carbon Market
6 CO2 Permit Institutions
7 Money Oil Archi / Tech
8 Money CO2 Carbon Market
9 Money Permit Institutions
10 Permit Oil Institutions
11 Permit CO2 Institutions
12 Permit Money Institutions
CO2EMISSION _ ASSET + CO2REJECTION _ ASSETOil_RESERVOIR
Payment _OILMARKETOil _ LOP
Payment _ LOPCarbonCredits_CARBONMARKET
Tax _OILPayment _OILMARKET
Tax _CARBONPayment _OILMARKET
Oil_RESERVOIRCO2REJECTION _ ASSET
Oil _ASSETCAPEX _ LOP +OPEX _ LOP
CarbonCredits_CARBONMARKETPayment _ LOP
= 1ExchangeRate_5
Tax _CAPEXPayment _OILMARKET
Payment _OILMARKETTax _CAPEX
= 1ExchangeRate_9
Payment _OILMARKETTax _CARBON
= 1ExchangeRate_6
Payment _OILMARKETTax _OIL
= 1ExchangeRate_ 3

- 311 -
Figure A-1-3: Mapping between Value Exchange Rates and the Exchange Model
Figure A-1-4: Value Exchange Matrix for the LOP
CO2 Rejection
Oil Oil
CAPEX/OPEX Payment
Carbon Credits
Oil
Payment
Carbon Market
Oil Market
Govt
LOP Reservoir Asset
Atmosphere
Perm
its Taxes
CO2 Emission
CO
2 Em
issi
on
Carbon Credits
Carbon C
redits
1
2
4 5 7
3+6+9
Oil (bbl)
CO2 (tonne)
Money (US $) Permit
Oil (bbl)
1 CO2 Production Rate
51* Oil Tax Rate
CO2 (tonne)
Gas Oil Ratio (GOR) 1 15** Carbon Tax
Rate
Money (US $)
CAPEX and OPEX 1/15 1 CAPEX Tax
Rate
Permit 1/Oil Tax Rate 1/Carbon Tax Rate
1/CAPEX Tax Rate 1
Note: Exchanges in Blue Blocks are mediated by (Oil and Carbon) Market; while Exchanges in Red, Green, and Grey Blocks are mediated by Institutions, Architecture/Technology, and Reservoir respectively (all are Nonmarket); Crude Oil Price (*, 03/19/2009) from: http://www.bloomberg.com/markets/commodities/energyprices.html; Carbon Price (**, 03/19/2009) from: http://www.ecx.eu/ and http://www.x-rates.com/calculator.html.

- 312 -
A.3.3 Observations and Applications
By defining two kinds of nodes (viz., stakeholder and asset) and four types of flows (viz.,
oil and gas, GHG, monetary, and political), the simplified exchange model bridges the
gap between stakeholder network and physical architecture for the Large Engineering
Projects. With this method, it becomes possible to better understand how the technical
decisions will impact the stakeholder relationships, as well as how to apply such an
understanding to inform better decisions on architecture design and selection.
For the Value Exchange Rates and Matrix, more specific applications may include:
Aligning Stakeholders’ Interest: With the “generalized” Value Exchange Rates
defined between Oil, CO2, Money, and Permit, the traditional results from system
architecting model can be propagated into the stakeholder network and then the
costs/benefits (debits/credits) for each stakeholder are possible to be calculated.
Based on a trade-off analysis for these costs/benefits, good architectures, which
align the stakeholders’ interest, can be better identified.
Adding Time Dependence: The concept of Value Exchange Rates can easily
integrate the temporal dimension (time dependence) into analysis: How will the
costs/benefits (debits/credits) and stakeholders’ interest change with time? How
can stakeholders’ temporal preference (discount rate) be described (exponential
or hyperbolic)?
Analyzing Network Performance: With the costs/benefits (debits/credits)
profile of each stakeholder, the distribution of resources/pollutions throughout
the stakeholder network can be analyzed, and further, the network performance
(robustness, stability, etc.) in terms of specific criteria (efficiency, equity, etc.)
can also be evaluated.
Capturing Major Drivers: The Value Exchange Matrix (see Figure A-1-4)
identifies the major drivers (mediators) for both physical architecture and
stakeholder network, and also visualizes the structure of these drivers. It would

- 313 -
be interesting to study the properties of these drivers as well as to test the
dependence of stakeholders’ interest and network performance on them.
A.4 Summary
Based on the complete framework of the SVN analysis, this Appendix conceives two
innovative methods, namely, Stakeholder-Oriented Architecting Process and Value
Exchange Rates & Matrix, to bridge the gap between the SVN analysis and Systems
Architecting, so that the synergy between stakeholder management and system design
can be achieved to ensure the long-term success of large engineering projects in a
complex and dynamic socio-technical environment.
Currently these two methods are still in the stage of conceptual development, and
therefore more research along with empirical observations and case studies for these
methods are much desired.

- 314 -
APPENDIX II: SUPPLEMENTAL MATERIALS Questionnaire A-3-1: Stakeholder Questionnaire for the Multinational Energy Project
INSTRUCTIONS: The intent of this survey is to develop insight into the needs of stakeholders and how they are fulfilled. We have identified a number of stakeholders that interact with each other. We have identified a number of needs that each particular stakeholder may have. This survey seeks to characterize the nature of the needs of each stakeholder, as well as their preferred source of fulfillment. The following pages of the survey contain a series of questions regarding the needs of each stakeholder, divided into sections by stakeholder. In answering the questions, it is important that you try to think of yourself as a representative from that particular stakeholder group. For each identified need, there are two questions. The 4th column labeled “Intensity of Need” asks you to characterize both the “satisfaction” of fulfillment, as well as the “regret” you feel when the need goes unfulfilled. Use the first scale below to characterize each in as: A, B, C, D, or E. In the 5th column labeled “Importance of Source” you are asked to evaluate how much benefit or utility you derive from having a particular source fulfill that need. Use the second scale below to characterize each in as: 1, 2, 3, 4, or 5. In some instances there is more than one source capable of fulfilling a need, and you will be asked to provide feedback on each source individually. Please check the box that corresponds to your response to each question in the questionnaire. Although your feelings on a particular need or source may be described by more than one answer, please select the one that BEST describes how you feel. You may wish to print out the Question box below to refer to while you complete the survey. Thank you for taking the time to complete the survey! Intensity of Need: How would you characterize the presence/absence of fulfillment of this need? A. I would be satisfied by its presence, but I would not regret its absence B. I would be satisfied by its presence, and I would somewhat regret its absence C. I would be satisfied by its presence, and I would regret its absence D. Its presence is necessary, and I would regret its absence E. Its presence is absolutely essential, and I would regret its absence Importance of Source: If this need were to be fulfilled, how important would this source be in fulfilling the need? 1. Not important – I do not need this source to fulfill this need 2. Somewhat important – It is acceptable that this source fulfills this need 3. Important – It is preferable that this source fulfills this need 4. Very important – It is strongly desirable that this source fulfills this need 5. Extremely important – It is indispensible that this source fulfills this need

- 315 -
A B C D E 1 2 3 4 5
Project Approval
Host-Country Government
Regulatory Approval
Local Community
Technology
Enterprise
Workforce
Local Community
Logistic Support
Host-Country Corporation
Product Subsystems
Suppliers
Investment
Enterprise
Future Project Approval
Host-Country Government
Technology Requirements
Project
High-grade Goods
Project
Low-grade Goods
Project
Investment
Investors
Sales Revenue
Consumers
Technology Transfer
Project
Revenue Sharing
Project
Economic Support
Host-Country Government
Political Influence
Host-Country Corporation
Project Lobbying
Local Community
Taxes
Project
Federal Support
Host-Country Government
Policy Support
NGO
Environmental Compliance
Project
Employment
Project
ROI
Enterprise
Product
Enterprise
Contracts
Project
Environmental Impact Plan
Project
COMMENTS
Investors
Consumers
NGO
INTENSITY OF NEED IMPORTANCE OF SOURCE
ProjectEnterprise
Host-C
ountry C
orporation
TO VALUE FLOW FROM
Host-C
ountry G
overnment
Local Com
munity
Suppliers

- 316 -
Table A-3-1: Value Flow Scores for the RuSakOil Case
A B C D E 1 2 3 4 5
Project Approval X
Host-Country Government X
Regulatory Approval X
Local Community X
Technology X
Enterprise X
Workforce X
Local Community X
Logistic Support X
Host-Country Corporation X
Product Subsystems X
Suppliers X
Investment X
Enterprise X
Future Project Approval X
Host-Country Government X
Technology Requirements X
Project X
High-grade Goods X
Project X
Low-grade Goods X
Project X
Investment X
Investors X
Sales Revenue X
Consumers X
Technology Transfer X
Project X
Revenue Sharing X
Project X
Economic Support X
Host-Country Government X
Political Influence X
Host-Country Corporation X
Project Lobbying X
Local Community X
Taxes X
Project X
Federal Support X
Host-Country Government X
Policy Support X
NGO X
Environmental Compliance X
Project X
Employment X
Project X
ROI X
Enterprise X
Product X
Enterprise X
Contracts X
Project X
Environmental Impact Plan X
Project X
COMBINED SCORETO VALUE FLOW FROMINTENSITY OF NEED IMPORTANCE OF SOURCE
Project
0.96
0.96
0.18
0.11
0.11
0.18
0.76
Enterprise
0.32
0.18
0.54
0.31
0.10
0.32
Investors 0.54
Host-C
ountry C
orporation
0.44
0.54
0.56
Host-C
ountry G
overnment
0.10
0.10
0.32
Local Com
munity
0.96
0.18
0.44
0.54
Consumers 0.18
Suppliers 0.18
NGO 0.18
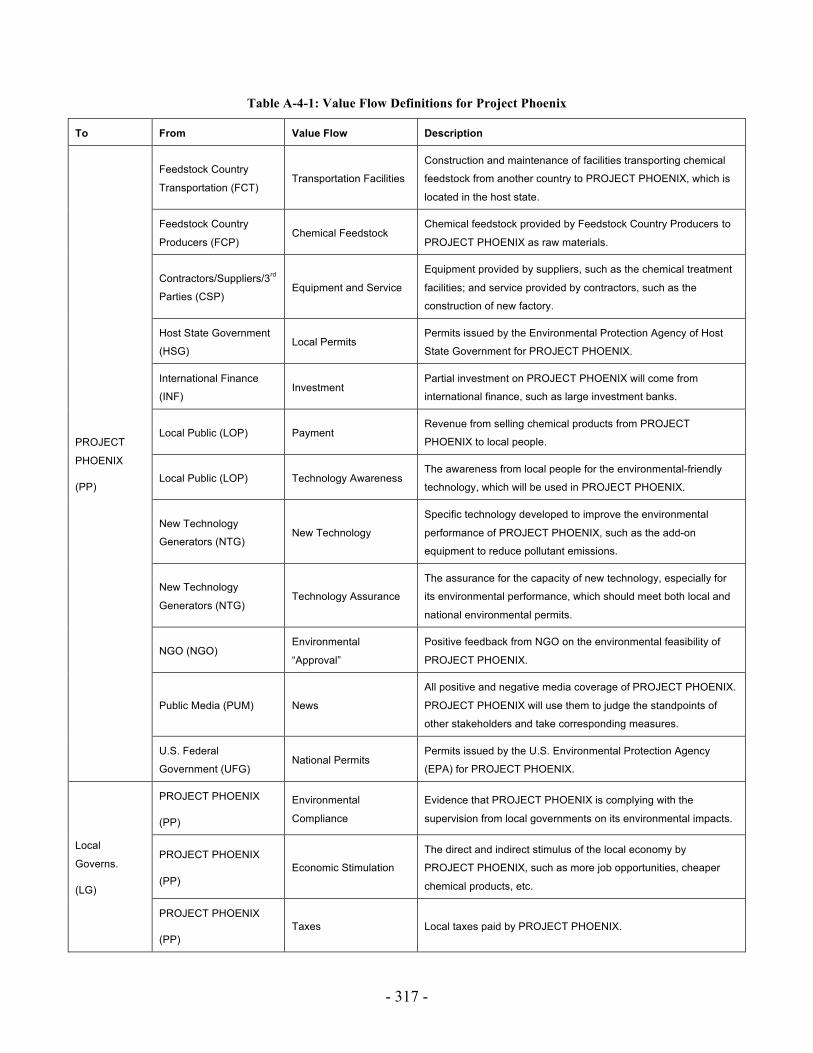
- 317 -
Table A-4-1: Value Flow Definitions for Project Phoenix
To From Value Flow Description
PROJECT
PHOENIX
(PP)
Feedstock Country
Transportation (FCT) Transportation Facilities
Construction and maintenance of facilities transporting chemical
feedstock from another country to PROJECT PHOENIX, which is
located in the host state.
Feedstock Country
Producers (FCP) Chemical Feedstock
Chemical feedstock provided by Feedstock Country Producers to
PROJECT PHOENIX as raw materials.
Contractors/Suppliers/3rd
Parties (CSP) Equipment and Service
Equipment provided by suppliers, such as the chemical treatment
facilities; and service provided by contractors, such as the
construction of new factory.
Host State Government
(HSG) Local Permits
Permits issued by the Environmental Protection Agency of Host
State Government for PROJECT PHOENIX.
International Finance
(INF) Investment
Partial investment on PROJECT PHOENIX will come from
international finance, such as large investment banks.
Local Public (LOP) Payment Revenue from selling chemical products from PROJECT
PHOENIX to local people.
Local Public (LOP) Technology Awareness The awareness from local people for the environmental-friendly
technology, which will be used in PROJECT PHOENIX.
New Technology
Generators (NTG) New Technology
Specific technology developed to improve the environmental
performance of PROJECT PHOENIX, such as the add-on
equipment to reduce pollutant emissions.
New Technology
Generators (NTG) Technology Assurance
The assurance for the capacity of new technology, especially for
its environmental performance, which should meet both local and
national environmental permits.
NGO (NGO) Environmental
“Approval”
Positive feedback from NGO on the environmental feasibility of
PROJECT PHOENIX.
Public Media (PUM) News
All positive and negative media coverage of PROJECT PHOENIX.
PROJECT PHOENIX will use them to judge the standpoints of
other stakeholders and take corresponding measures.
U.S. Federal
Government (UFG) National Permits
Permits issued by the U.S. Environmental Protection Agency
(EPA) for PROJECT PHOENIX.
Local
Governs.
(LG)
PROJECT PHOENIX
(PP)
Environmental
Compliance
Evidence that PROJECT PHOENIX is complying with the
supervision from local governments on its environmental impacts.
PROJECT PHOENIX
(PP) Economic Stimulation
The direct and indirect stimulus of the local economy by
PROJECT PHOENIX, such as more job opportunities, cheaper
chemical products, etc.
PROJECT PHOENIX
(PP) Taxes Local taxes paid by PROJECT PHOENIX.

- 318 -
Adjacent State
Representatives (ASR) Political Support
Favorable feelings and support from Adjacent State
Representatives to the local governments, such as favorable
policy for economic development.
Host State Government
(HSG) Political Support
Favorable feelings and support from Host State Government to
the local governments, such as favorable policy for economic
development.
Local Public (LOP) Support Approval by the people for their local governments, such as votes
for the election of local government officers.
Public Media (PUM) News
All positive and negative media coverage of PROJECT PHOENIX.
Local governments will use them to adjust their opinions on the
project.
Host State
Government
(HSG)
PROJECT PHOENIX
(PP) Taxes State taxes paid by PROJECT PHOENIX.
Local Governments
(LOG) Political Influence
The decisions of Host State Government on PROJECT PHOENIX
may be influenced by local governments, through lobby or other
ways.
Local Governments
(LOG) Regulatory Compliance
Evidence that local governments are complying with all the
regulations issued by Host State Government, such as the
emission permits for PROJECT PHOENIX.
Local Public (LOP) Support Approval by the people for Host State Government, such as votes
for the election of State Congress and Executives.
Public Media (PUM) News
All positive and negative media coverage of PROJECT PHOENIX.
Host State Government will use them to adjust its opinions on the
project.
U.S. Federal
Government (UFG) Boundary Conditions
The conditions stated by U.S. Federal Government, regarding the
land boundary between host state and its adjacent state. Those
conditions will significantly change the right / responsibility of each
state on PROJECT PHOENIX.
U.S. Federal
Government (UFG) Political Influence
The U.S. Federal Government influences Host State Government
with regard to laws and policy, for example to adopt stricter
permits on environmental emissions.
Adjacent State
Reps.
(ASR)
Local Governments
(LOG) Political Influence
The decisions of Adjacent State Representatives may be
influenced by local governments, through lobby or other ways.
Local Governments
(LOG) Regulatory Compliance
Evidence that local governments are complying with all the
regulations issued by Host State Government, such as the
emission permits for PROJECT PHOENIX.
Local Public (LOP) Support
Approval by the people for Adjacent State Representatives, such
as votes for the election of the Congressmen and Senators for the
adjacent state.
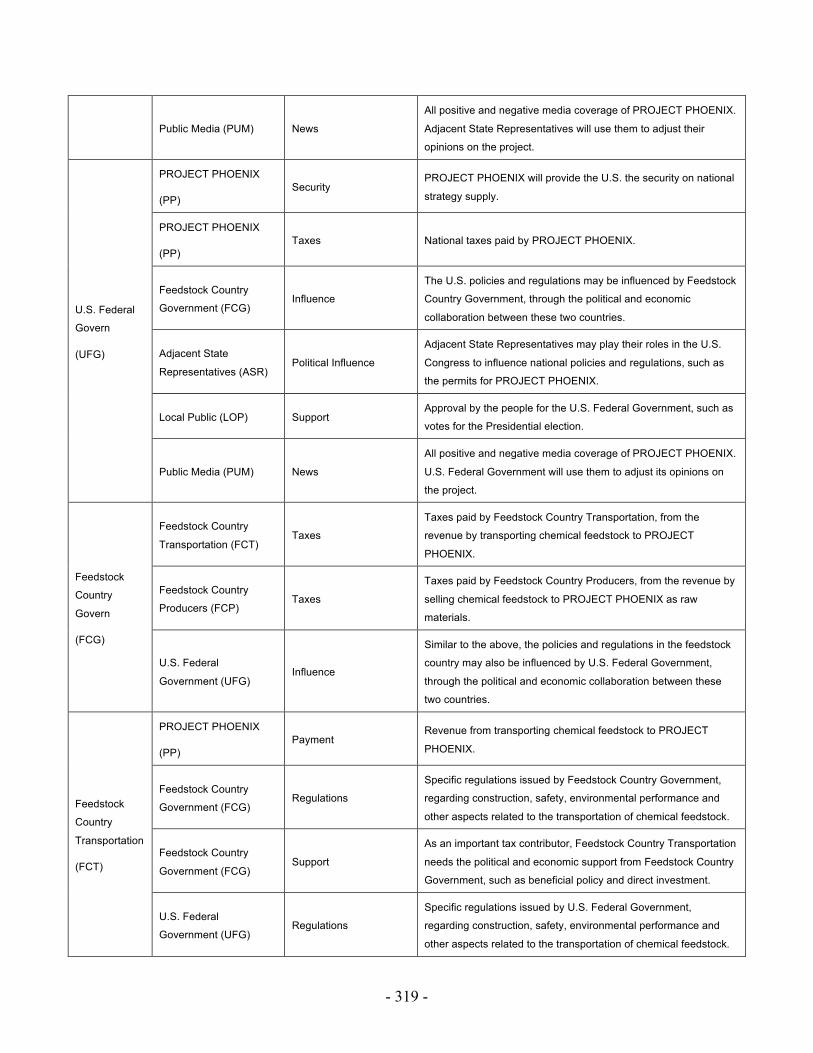
- 319 -
Public Media (PUM) News
All positive and negative media coverage of PROJECT PHOENIX.
Adjacent State Representatives will use them to adjust their
opinions on the project.
U.S. Federal
Govern
(UFG)
PROJECT PHOENIX
(PP) Security
PROJECT PHOENIX will provide the U.S. the security on national
strategy supply.
PROJECT PHOENIX
(PP) Taxes National taxes paid by PROJECT PHOENIX.
Feedstock Country
Government (FCG) Influence
The U.S. policies and regulations may be influenced by Feedstock
Country Government, through the political and economic
collaboration between these two countries.
Adjacent State
Representatives (ASR) Political Influence
Adjacent State Representatives may play their roles in the U.S.
Congress to influence national policies and regulations, such as
the permits for PROJECT PHOENIX.
Local Public (LOP) Support Approval by the people for the U.S. Federal Government, such as
votes for the Presidential election.
Public Media (PUM) News
All positive and negative media coverage of PROJECT PHOENIX.
U.S. Federal Government will use them to adjust its opinions on
the project.
Feedstock
Country
Govern
(FCG)
Feedstock Country
Transportation (FCT) Taxes
Taxes paid by Feedstock Country Transportation, from the
revenue by transporting chemical feedstock to PROJECT
PHOENIX.
Feedstock Country
Producers (FCP) Taxes
Taxes paid by Feedstock Country Producers, from the revenue by
selling chemical feedstock to PROJECT PHOENIX as raw
materials.
U.S. Federal
Government (UFG) Influence
Similar to the above, the policies and regulations in the feedstock
country may also be influenced by U.S. Federal Government,
through the political and economic collaboration between these
two countries.
Feedstock
Country
Transportation
(FCT)
PROJECT PHOENIX
(PP) Payment
Revenue from transporting chemical feedstock to PROJECT
PHOENIX.
Feedstock Country
Government (FCG) Regulations
Specific regulations issued by Feedstock Country Government,
regarding construction, safety, environmental performance and
other aspects related to the transportation of chemical feedstock.
Feedstock Country
Government (FCG) Support
As an important tax contributor, Feedstock Country Transportation
needs the political and economic support from Feedstock Country
Government, such as beneficial policy and direct investment.
U.S. Federal
Government (UFG) Regulations
Specific regulations issued by U.S. Federal Government,
regarding construction, safety, environmental performance and
other aspects related to the transportation of chemical feedstock.
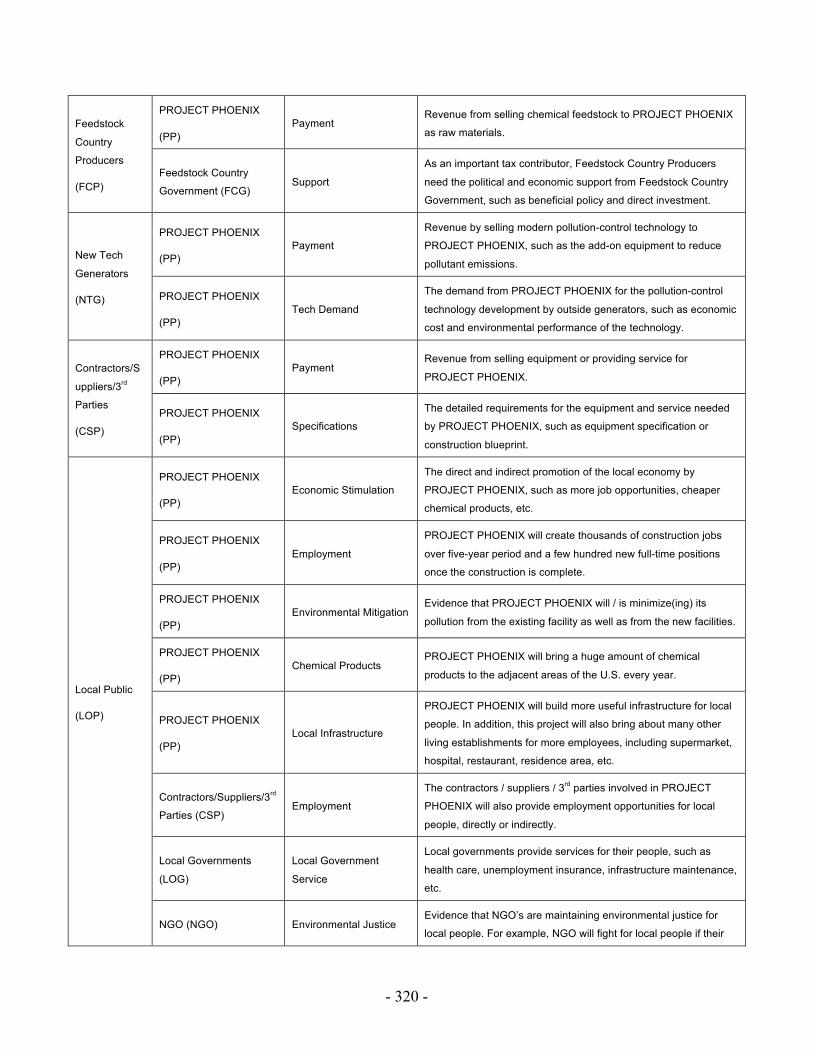
- 320 -
Feedstock
Country
Producers
(FCP)
PROJECT PHOENIX
(PP) Payment
Revenue from selling chemical feedstock to PROJECT PHOENIX
as raw materials.
Feedstock Country
Government (FCG) Support
As an important tax contributor, Feedstock Country Producers
need the political and economic support from Feedstock Country
Government, such as beneficial policy and direct investment.
New Tech
Generators
(NTG)
PROJECT PHOENIX
(PP) Payment
Revenue by selling modern pollution-control technology to
PROJECT PHOENIX, such as the add-on equipment to reduce
pollutant emissions.
PROJECT PHOENIX
(PP) Tech Demand
The demand from PROJECT PHOENIX for the pollution-control
technology development by outside generators, such as economic
cost and environmental performance of the technology.
Contractors/S
uppliers/3rd
Parties
(CSP)
PROJECT PHOENIX
(PP) Payment
Revenue from selling equipment or providing service for
PROJECT PHOENIX.
PROJECT PHOENIX
(PP) Specifications
The detailed requirements for the equipment and service needed
by PROJECT PHOENIX, such as equipment specification or
construction blueprint.
Local Public
(LOP)
PROJECT PHOENIX
(PP) Economic Stimulation
The direct and indirect promotion of the local economy by
PROJECT PHOENIX, such as more job opportunities, cheaper
chemical products, etc.
PROJECT PHOENIX
(PP) Employment
PROJECT PHOENIX will create thousands of construction jobs
over five-year period and a few hundred new full-time positions
once the construction is complete.
PROJECT PHOENIX
(PP) Environmental Mitigation
Evidence that PROJECT PHOENIX will / is minimize(ing) its
pollution from the existing facility as well as from the new facilities.
PROJECT PHOENIX
(PP) Chemical Products
PROJECT PHOENIX will bring a huge amount of chemical
products to the adjacent areas of the U.S. every year.
PROJECT PHOENIX
(PP) Local Infrastructure
PROJECT PHOENIX will build more useful infrastructure for local
people. In addition, this project will also bring about many other
living establishments for more employees, including supermarket,
hospital, restaurant, residence area, etc.
Contractors/Suppliers/3rd
Parties (CSP) Employment
The contractors / suppliers / 3rd parties involved in PROJECT
PHOENIX will also provide employment opportunities for local
people, directly or indirectly.
Local Governments
(LOG)
Local Government
Service
Local governments provide services for their people, such as
health care, unemployment insurance, infrastructure maintenance,
etc.
NGO (NGO) Environmental Justice Evidence that NGO’s are maintaining environmental justice for
local people. For example, NGO will fight for local people if their

- 321 -
life quality and the natural environment are threaten or harmed.
Public Media (PUM) News All positive and negative media coverage of PROJECT PHOENIX.
Local public will use them to adjust their opinions on the project.
Public Media
(PUM)
PROJECT PHOENIX
(PP) Opinions
The positive view from PROJECT PHOENIX, or PROJECT
PHOENIX’s argument against the negative feedback from other
stakeholders.
PROJECT PHOENIX
(PP)
Tech Assurance
Information
This is a subset of PROJECT PHOENIX’s opinions, mainly
referring to the technical information, which can prove the
environmental capability of the project.
Adjacent State
Representatives (ASR) Opinions
The specific view or feedback, which can be positive, negative or
neutral, from Adjacent State Representatives on PROJECT
PHOENIX.
Host State Government
(HSG) Opinions
The specific view or feedback, which can be positive, negative or
neutral, from Host State Government on PROJECT PHOENIX.
International Finance
(INF) Opinions
The specific view or feedback, which can be positive, negative or
neutral, from the international finance on PROJECT PHOENIX.
Local Governments
(LOG) Opinions
The specific view or feedback, which can be positive, negative or
neutral, from the local governments on PROJECT PHOENIX.
Local Public (LOP) Opinions The specific view or feedback, which can be positive, negative or
neutral, from the local people on PROJECT PHOENIX.
NGO (NGO) Opinions The specific view or feedback, which can be positive, negative or
neutral, from NGO on PROJECT PHOENIX.
U.S. Federal
Government (UFG) Opinions
The specific view or feedback, which can be positive, negative or
neutral, from the U.S. Federal Government on PROJECT
PHOENIX.
NGO
(NGO)
PROJECT PHOENIX
(PP) Information
NGO needs the environmental impact information from PROJECT
PHOENIX to make assessment on the project, such as the indices
for pollutant emissions.
Host State Government
(HSG)
Friendly Environmental
Policy
Friendly environmental policy from Host State Government will
help NGO protect the natural environment and life quality for local
people. For example, setting the emission quota for PROJECT
PHOENIX.
Local Public (LOP) Environmental
Satisfaction
NGO needs the degree of satisfaction by the local community to
make assessment on PROJECT PHOENIX. These data can be
obtained through public survey.
Public Media (PUM) News All positive and negative media coverage of PROJECT PHOENIX.
NGO will use them to adjust its opinions on the project.
U.S. Federal
Government (UFG)
Friendly Environmental
Policy
Friendly environmental policy from the U.S. Federal Government
will help NGO protect the natural environment and life quality for

- 322 -
local people. For example, setting the emission quota for
PROJECT PHOENIX.
International
Finance
(INF)
PROJECT PHOENIX
(PP) Profits
The monetary return for the investment from international finance
on PROJECT PHOENIX.
Public Media (PUM) News
All positive and negative media coverage of PROJECT PHOENIX.
International finance will use them to adjust its opinions on the
project.

- 323 -
Table A-4-2: Stakeholder Questionnaire for Project Phoenix
A B C D E 1 2 3 4 5Transportation Facilities Feedstock Country TransportationRaw Materials Feedstock Country ProducersEquipment and Service Contractors/Suppliers/3rd PartiesLocal Permits Host State GovernmentInvestment International FinancePayment Local PublicTech Awareness Local PublicNew Tech New Tech GeneratorsTech Assurance New Tech GeneratorsEnvironmental "Approval" NGONews Public MediaNational Permits U.S. Federal GovernmentEnvironmental Compliance Project PhoenixEconomic Stimulation Project PhoenixTaxes Project PhoenixPolitical Support Adjacent State RepresentativesPolitical Support Host State GovernmentSupport Local PublicNews Public MediaTaxes Project PhoenixPolitical Influence Local GovernmentsRegulatory Compliance Local GovernmentsSupport Local PublicNews Public MediaBoundary Conditions U.S. Federal GovernmentPolitical Influence U.S. Federal GovernmentPolitical Influence Local GovernmentsRegulatory Compliance Local GovernmentsSupport Local PublicNews Public MediaStrategy Supply Security Project PhoenixTaxes Project PhoenixInfluence Canadian GovernmentPolitical Influence Adjacent State RepresentativesSupport Local PublicNews Public MediaTaxes Feedstock Country TransportationTaxes Feedstock Country ProducersInfluence U.S. Federal GovernmentPayment Project PhoenixRegulations Canadian GovernmentSupport Canadian GovernmentRegulations U.S. Federal GovernmentPayment Project PhoenixSupport Canadian GovernmentPayment Project PhoenixTech Demand Project PhoenixPayment Project PhoenixSpecifications Project PhoenixEconomic Stimulation Project PhoenixEmployment Project PhoenixEnvironmental Mitigation Project PhoenixChemical Products Project PhoenixLocal Infrastructure Project PhoenixEmployment Contractors/Suppliers/3rd PartiesLocal Government Service Local GovernmentsEnvironmental Justice NGONews Public MediaOpinions Project PhoenixTech Assurance Info Project PhoenixOpinions Adjacent State RepresentativesOpinions Host State GovernmentOpinions International FinanceOpinions Local GovernmentsOpinions Local PublicOpinions NGOOpinions U.S. Federal GovernmentInformation Project PhoenixFriendly Environmental Policy Host State GovernmentEnvironmental Satisfaction Local PublicNews Public MediaFriendly Environmental Policy U.S. Federal GovernmentProfits Project PhoenixNews Public Media
URGENCY OF NEED (Check all that apply)
Project Phoenix (PP)
Local Governments (LOG)
Host State Government (HSG)
Adjacent State Representatives (ASR)
IMPORTANCE OF SOURCE (Check only one)TO STAKEHOLDER VALUE FLOW FROM STAKEHOLDER
Local Public (LOP)
Public Media (PUM)
NGO (NGO)
International Finance (INF)
U.S. Federal Government (UFG)
Feedstock Country Government (FCG)
Feedstock Country Transportation (FCT)
Feedstock Country Producers (FCP)
New Tech Generators (NTG)
Contractors/Suppliers/3rd Parties (CSP)

- 324 -
Table A-4-3: Internal Assets Definitions for Project Phoenix
Stakeholder Characterization Internal Assets for Value Flows
Category Representatives Name Description
Governments LOG, HSG, ASR,
UFG, FCG
Domestic Political Capital
Connecting the value flows that are generally related
with favorable public image for the government,
such as “Support from Local Public to Local
Governments”.
Project Support
Connecting the value flows that are specifically
related to the project, such as “Environmental
Compliance from PROJECT PHOENIX to Local
Governments”.
Treasury
Connecting the monetary value flows, such as
“Taxes from PROJECT PHOENIX to Host State
Government”.
Commercial
Sectors
PP, FCP, FCT,
NTG, CSP, INF
Human Resource
Connecting the value flows for workforce and
employment, such as “Employment from PROJECT
PHOENIX to Local Public”.
CAPEX
Connecting the value flows related with fixed capital
cost, such as “Facilities from Feedstock Country
Transportation to PROJECT PHOENIX”.
OPEX
Connecting the value flows related with variable
operation cost, such as “Chemical Feedstock from
Feedstock Country Producers to PROJECT
PHOENIX”.
Revenue
Connecting the value flows related with revenue
from sales, such as “Payment from Local Public to
PROJECT PHOENIX”.
Legal Eligibility
Connecting the value flows related with legal /
regulatory / policy requirements for the companies,
such as “National Permits from the U.S. Federal
Government to PROJECT PHOENIX”.
Corporate Strategy
Connecting the value flows related with high-level or
long-term benefits of the companies, such as
“Security from PROJECT PHOENIX to the U.S.
Federal Government”.

- 325 -
Local Public LOP
Financial Wellbeing
Connecting the monetary value flows in people’s life,
such as “Economic Stimulation from PROJECT
PHOENIX to Local Public”.
Quality of Life
Connecting the value flows related with natural
environment and other aspects important for
people’s life quality, such as “Environmental
Mitigation from PROJECT PHOENIX to Local
Public”.
Political Influence
Connecting the value flows for the generally
relationships between local people and
governments, such as “Local Government Service
from Local Governments to Local Public”.
Project Support
Connecting the value flows that are specifically
related to the project, such as “Chemical Products
from PROJECT PHOENIX to Local Public”.
NGO NGO
Political Influence
Connecting the value flows related with the public
role of NGO, such as “Environmental ‘Approval’ from
NGO to PROJECT PHOENIX”.
Supporting Materials
Connecting the value flows supporting NGO to play
its public role, such as “Environmental Satisfaction
from Local Public to NGO”.
Public Media PUM Informative Content
Connecting the value flows related with all positive
and negative coverage of media on the project, such
as “Tech Assurance Info from PROJECT PHOENIX
to Public Media”.

- 326 -
Figure A-4-1: Internal Assets Model for PP
Figure A-4-2: Internal Assets Model for HSG
PP
Investment from INF
Sales to CSP
Local Permits from HSG
Profits to INF
Sales to FCP
Sales to FCT
Specifications to CSP
Taxes to HSG
Payment from LOP
Tech Awareness from LOP
Equipment and Service from CSP
Chemical Feedstock from FCP
Transportation Facilities from FCT
Environ Compliance to LOG
Economic Stimulation to LOG
Environ Approval from NGO
New Tech from NTG
Tech Assurance from NTG
News from PUM
National Permits from UFG
Taxes to LOG
Economic Stimulation to LOP
Employment to LOP
Environ Mitigation to LOP
Chemical Products to LOP
Local Infrastructure to LOP
Information to NGO
Sales to NTG
Tech Demand to NTG Opinions to PUM
Tech Assurance Info to PUM
Security to UFG Taxes to UFG
Human Resource
CAPEX
OPEX
Revenue
Legal Eligibility
Corporate Strategy
News from PUM Friendly Environ Policy to NGO
Boundary Conditions from UFG
Political Support to LOG
Local Permits to PP
Opinions to PUM
Political Influence from UFG
Support from LOP
Regulatory Compliance from LOG
Political Influence from LOG
HSG
Domestic Political Capital
Project Support
Treasury
Taxes from PP

- 327 -
Figure A-4-3: Internal Assets Model for ASR
Figure A-4-4: Internal Assets Model for UFG
News from PUM
Opinions to PUM
Political Support to LOG
Political Influence to UFG
Support from LOP
Regulatory Compliance from LOG
ASR
Domestic Political Capital
Project Support
Treasury
Political Influence from LOG
Political Influence from ASR
Regulations to FCT
Support from LOP
Influence to FCG
National Permits to PP
Boundary Conditions to HSG
News from PUM
Influence from FCG
Taxes from PP
Security from PP
Political Influence to HSG
Friendly Environ Policy to NGO
Opinions to PUM
UFG
Domestic Political Capital
Project Support
Treasury

- 328 -
Figure A-4-5: Internal Assets Model for FCG
Figure A-4-6: Internal Assets Model for FCT
Influence from UFG
Support to FCT
Regulations to FCT
Support to FCP Taxes from FCP
Taxes from FCT
Influence to UFG
FCG
Domestic Political Capital
Project Support
Treasury
Support from FCG Taxes to FCG
Pipelines to PP Regulations from FCG
Sales from PP
Regulations from UFG
FCT
Human Resource
CAPEX
OPEX
Revenue
Legal Eligibility
Corporate Strategy

- 329 -
Figure A-4-7: Internal Assets Model for FCP
Figure A-4-8: Internal Assets Model for NTG
Taxes to FCG
Chemical Feedstock to PP
Support from FCG
Sales from PP
FCP
Tech Assurance to PP
New Tech to PP
Tech Demand from PP
Sales from PP
NTG
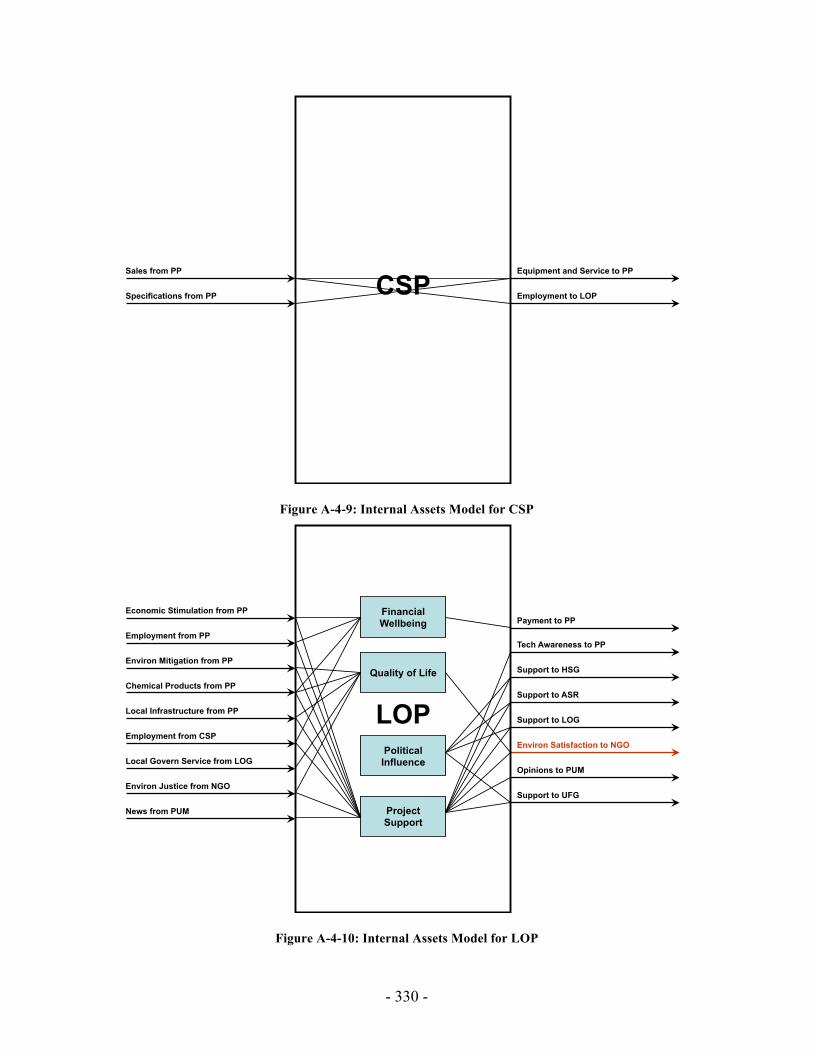
- 330 -
Figure A-4-9: Internal Assets Model for CSP
Figure A-4-10: Internal Assets Model for LOP
Employment to LOP
Equipment and Service to PP
Specifications from PP
Sales from PP
CSP
Chemical Products from PP
Support to HSG
Local Infrastructure from PP
Tech Awareness to PP
Payment to PP
Support to ASR
Employment from CSP
Local Govern Service from LOG
Environ Mitigation from PP
Employment from PP
Economic Stimulation from PP
Environ Justice from NGO
News from PUM
Support to LOG
Environ Satisfaction to NGO
Opinions to PUM
Support to UFG
LOP
Financial Wellbeing
Quality of Life
Political Influence
Project Support

- 331 -
Figure A-4-11: Internal Assets Model for PUM
Figure A-4-12: Internal Assets Model for NGO
Opinions from ASR
News to HSG
Opinions from INF
News to INF
News to PP
News to ASR
Opinions from LOG
Opinions from LOP
Opinions from HSG
Tech Assurance Info from PP
Opinions from PP
Opinions from NGO
Opinions from UFG
News to LOG
News to LOP
News to NGO
News to UFG
PUM
Informative Content
News from PUM Opinions to PUM
Friendly Environ Policy from UFG
Environ Justice to LOP
Environ Approval to PP
Environ Satisfaction from LOP
Friendly Environ Policy from HSG
Information from PP
NGO
Political Influence
Supporting Materials

- 332 -
Figure A-4-13: Internal Assets Model for INF
Figure A-4-14: Issue Network 2 of “General Economic Performance”
Opinions to PUM
Investment to PP
News from PUM
Profits from PP
INF
Local Public
Owner
Local Governments Host State Government
Owner Corporation
Owner Distribution
Project Phoenix
Intl. Finance(Owner
Shareholders and Bond Holders)
Product Consumers
Oversight Committee
Political Influence and Regulatory Compliance
U.S. Federal Government
Congress (House)
Public MediaOpinions
News
Political Influence
Profits
OpinionsNews
Payment
Chemical Products
Support
Sup
port
Support
Local Government Service
Taxes
Taxes
New
s
Opi
nion
s
New
s
Opi
nion
s
New
s
Opi
nion
s
Opi
nion
s
New
s
Local Government B
Local Government A
Opi
nion
s
New
s
Investment
Political Support
Taxes

- 333 -
Figure A-4-15: Stakeholder Balance in Issue Network 2
Figure A-4-16: Net Transaction Value in Issue Network 2
Figure A-4-17: Impact of Indirect Transactions for PP in Issue Network 2
-4 -2 0 2 4 6 8 10
INF
HSG
LOG
LOP
PUM
UFG
Network: Direct and Indirect Transaction Value in Issue Network 2
PP to Stakeholders Stakeholders to PP
-0.4 -0.3 -0.2 -0.1 0 0.1 0.2 0.3 0.4 0.5 0.6 0.7
INF
HSG
LOG
LOP
PUM
UFG
Hub-and-Spoke: Direct Transaction Value in Issue Network 2
PP to Stakeholders Stakeholders to PP
0
2
4
6
8
INF HSG LOG LOP PUM UFG
Net
Tra
nsac
tion
Valu
e
Stakeholder
Net Transaction Value in Issue Network 2
Hub-and-Spoke
Network
0
1
2
3
4
5
6
7
8
9
INF HSG LOG LOP PUM UFG
Tran
sact
ion
Valu
e
Impact of Indirect Transactions for PP in Issue Network 2
PP's Inputs (Network)
PP's Outputs (Hub-and-Spoke)
PP's Outputs (Network)

- 334 -
Figure A-4-18: Issue Network 3 of “Local Environmental Protection”
Figure A-4-19: Stakeholder Balance in Issue Network 3
Local Public
Owner
Local Governments Host State Government
Project Phoenix
New Tech Generators
EPAAdjacent State Representatives
Oversight Committee
NGO
Political Influence and Regulatory Compliance
Concerned Neighbors
U.S. Federal Government
EPA Congress (House)
Public MediaOpinions
News
Pol
itica
l Inf
luen
ce
Political Influence
National Permits
Local Permits
Environmental “Approval”
Information
Opinions
News
Environmental Satisfaction
New
Tec
h
Tech
Ass
uran
ce
Tech
Dem
and
Pay
men
t
Env
iron
men
tal M
itiga
tion
Support
Sup
port
Sup
port
Political Support
Support
Local Government Service
Tech Assurance Information
Tech
Aw
aren
ess
Env
iron
men
tal C
ompl
ianc
e
New
s
Opi
nion
s
New
s
Opi
nion
s
New
s
Opi
nion
s
New
s
Opi
nion
s
Opi
nion
s
New
s
Local Government B
Local Government A
Opi
nion
s
New
s
Environmental Justice
Boundary Conditions
Frie
ndly
Env
iron
Pol
icy
Friendly Environ Policy
-10 -5 0 5 10 15 20
HSG
ASR
LOG
LOP
NGO
NTG
PUM
UFG
Network: Direct and Indirect Transaction Value in Issue Network 3
PP to Stakeholders Stakeholders to PP
-0.6 -0.4 -0.2 0 0.2 0.4 0.6 0.8
HSG
ASR
LOG
LOP
NGO
NTG
PUM
UFG
Hub-and-Spoke: Direct Transaction Value in Issue Network 3
PP to Stakeholders Stakeholders to PP

- 335 -
Figure A-4-20: Net Transaction Value in Issue Network 3
Figure A-4-21: Impacts of Indirect Transactions for PP in Issue Network 3
-4
-2
0
2
4
6
8
10
12
14
HSG ASR LOG LOP NGO NTG PUM UFG
Net
Tra
nsac
tion
Valu
e
Stakeholder
Net Transaction Value in Issue Network 3
Hub-and-Spoke
Network
0
2
4
6
8
10
12
14
16
18
HSG ASR LOG LOP NGO NTG PUM UFG
Tran
sact
ion
Valu
e
Impact of Indirect Transactions for PP in Issue Network 3
PP's Inputs (Network)
PP's Outputs (Hub-and-Spoke)
PP's Outputs (Network)

- 336 -
Figure A-4-22: Issue Network 4 of “National Security”
Figure A-4-23: Stakeholder Balance in Issue Network 4
Figure A-4-24: Net Transaction Value in Issue Network 4
Local Public
Owner
Owner Distribution
Project Phoenix
Product Consumers
Feedstock Country
Producers
U.S. Federal Government
Public MediaOpinions
News
Raw
Mat
eria
lsP
aym
ent
Payment
Chemical Products
Support
Stategy Supply Security
Taxes
New
s
Opi
nion
s
Opi
nion
s
Feedstock Country
Transportation
Feedstock Country
Government
Reg
ulat
ions
Reg
ulat
ions
Tran
spor
tatio
n Fa
cilit
ies
Pay
men
tTa
xes
Taxe
s
Sup
port
Sup
port
InfluenceInfluence
New
s
-1.5 -1 -0.5 0 0.5 1 1.5 2
FCG
FCP
FCT
LOP
PUM
UFG
Network: Direct and Indirect Transaction Value in Issue Network 4
PP to Stakeholders Stakeholders to PP
-0.4 -0.2 0 0.2 0.4 0.6 0.8
FCG
FCP
FCT
LOP
PUM
UFG
Hub-and-Spoke: Direct Transaction Value in Issue Network 4
PP to Stakeholders Stakeholders to PP
-0.4
-0.2
0
0.2
0.4
0.6
0.8
1
1.2
1.4
1.6
FCG FCP FCT LOP PUM UFG
Net
Tra
nsac
tion
Valu
e
Stakeholder
Net Transaction Value in Issue Network 4
Hub-and-Spoke
Network

- 337 -
Figure A-4-25: Impact of Indirect Transactions for PP in Issue Network 4
Figure A-4-26: Relationship Balance between PP and PUM across Four Issues
0
0.2
0.4
0.6
0.8
1
1.2
1.4
1.6
1.8
FCG FCP FCT LOP PUM UFG
Tran
sact
ion
Valu
e
Impact of Indirect Transactions for PP in Issue Network 4
PP's Inputs (Network)
PP's Outputs (Hub-and-Spoke)
PP's Outputs (Network)
0
2
4
6
8
10
Issue 1: Local Economic Stimulus
Issue 2: General Economic
Performance
Issue 3: Local Environmental
Protection
Issue 4: National Strategy Supply
Security
Net Transaction Value between PP and PUM
Hub-and-Spoke
Network

- 338 -
Figure A-4-27: Relationship Balance between PP and LOG across Three Issues
Figure A-4-28: Relationship Balance between PP and UFG across Three Issues
-2
0
2
4
6
8
Issue 1: Local Economic Stimulus
Issue 2: General Economic
Performance
Issue 3: Local Environmental
Protection
Net Transaction Value between PP and LOG
Hub-and-Spoke
Network
-1
0
1
2
3
4
Issue 2: General Economic Performance
Issue 3: Local Environmental Protection
Issue 4: National Strategy Supply Security
Net Transaction Value between PP and UFG
Hub-and-Spoke
Network

- 339 -
Appendix 5.1 Software Architecture of the DSM Modeling Platform
(This software is in the process of patent application. Please not use or spread without permission.)
[Matrix Data Read-In]
Input Files: “input_vertex.dat”, “input_edge.dat” (including edge scores), and
“input_constraint.dat” (optional)
Processing Features:
o Five Classes of Objects: Matrix, Elements, Path, Vertex, and Edge
o Three Self-defined Operations: Matrix Multiplication, Element
Multiplication, and Element Addition
o Two Logic Requirements: Simple Path (and Cycle) Check and Internal
Asset Constraints (optional)
[Focal Organization Analysis]
Input Parameters: Utility function (optional), Start vertex, End vertex, and
Multiplication steps
Focal Organization Analysis
Matrix Data Read-In
Whole Network Analysis
Basic Package 1.0

- 340 -
Output Results:
o “FocalInfoCycle.java”: To identify the Critical Cycles for the focal
organization
o “FocalInfoVertex.java”: To calculate the Weighted Stakeholder
Occurrence (WSO)
o “FocalInfoDIRatio.java”: To calculate the Ratio between WSO_Hub-and-
Spoke and WSO_Network
o “FocalInfoEdge.java”: To calculate the Weighted Value Flow Occurrence
(WVFO)
o “FocalInfoInputOutput.java”: To calculate the Conversion Matrix between
the outputs and inputs of the focal organization
[Whole Network Analysis]
Input Parameters: Multiplication steps
Output Results:
o “NetworkInfoCycle.java”: To identify the Critical Cycles within the whole
network
o “NetworkInfoVertex.java”: To calculate the Network Weighted
Stakeholder Occurrence (NWSO)
o “NetworkInfoEdge.java”: To calculate the Network Weighted Value Flow
Occurrence (NWVFO)
o “NetworkInfoStakeholder.java”: To calculate the Relationship Balance
Matrix between all the stakeholders
[Additional Features]

- 341 -
<Flexible Utility Function>
Focal Organization Analysis:
Two basic operation modes are defined to derive different forms for the utility
function of value cycles
o [v1 * v2]: suitable for “abc”, “abc2”, “(abc)2”, etc.
o [v1 + v2]: suitable for “a + b + c”, “a + b + c2”, “(a + b + c)2”, etc.
Based on Ed’s theory, “abc2” is a good approximation of the optimal solution to
maximize the focal organization’s utility
Compared to “abc”, “abc2” intuitively reflects more interest from the focal
organization on its own needs
Whole Network Analysis:
“abc” is set as the default utility function of value cycles, because all the
stakeholders along each value cycle are equally treated from the perspective of the
whole network
<Automation of Analysis>
The latest DSM software directly calculates all the network measurements (i.e.,
WSO, DI Ratio, WVFO, WOO, WIO; NWSO, NWVFO)
Computational time and bottleneck (i.e., the maximum multiplication steps, if the
matrix is too large for computer’s RAM to handle) are also displayed

- 342 -
Appendix 5.2 Algorithm Memo for the DSM Modeling Platform
(As an Example, Only for the Focal Organization Analysis)
Classes
The main body of the program contains five classes of objects:
Matrix
Element
Path
Edge
Vertex
The class of Matrix is used to describe the overall information of the graphic connection.
The dimension of the Matrix is DIM * DIM, where DIM is the number of total vertices in
the graphic. Hence, after k steps of multiplication, Matrix[i, j] is able to maintain all the
paths from vertex i to vertex j with path length k.
The class of Element is used to keep the graphic information for each pair of Vertices.
Hence, after k steps of multiplication, Matrix[i, j] is actually an instance of Element
which contains all paths from vertex i to vertex j with path length equal to k.
The class of Path stands for each path in the graph. It records all the Edge references that
construct the path. Note that only Edge references rather than real copy of the Edges are
kept in the run time. Hence, we can dramatically reduce the program memory usage and
improve the performance.
The classes of Edge and Vertex stand for edge and vertex in the graph respectively. To
efficiently process the graph, both edges and vertices are mapped to internal integer ids
for internal expression.
Multiplication

- 343 -
1). Matrix Multiplication
In this section, we describe how Matrix multiplication M3 = M1 * M2 is designed.
As we know, normal Matrix multiplication can be expressed as follows:
M 3 i, j[ ] = M1 i,r[ ]r=1
DIM
∑ *M 2 r, j[ ]
Here, M[i, j] stands for the Element in row i and column j of M. However, to record all
the path information in the matrix and to expend the path length via matrix multiplication,
we should redefine the Element multiplication and addition expressed in the above
formula.
2). Element Multiplication
Recall that each Element M[i, j] in the matrix is either a collection of paths or no path at
all (expressed as 0). If an Element is 0, which means it cannot contribute to expand paths
from any other Element, the multiplication result should also be a zero Element.
Otherwise, for M1[i, r] * M2[r, j], where neither of them is zero, the multiplication
resulted Element should be a collection of new paths from vertex i to vertex j where each
path from M1[i, r] connected with each path from M1[r, j]. Path connection strategies
will be discussed in the next section.
3). Element Addition
Element Addition E1 + E2 is relatively simple. It summarizes all paths from E1 and E2
together to form a new Element.
- 344 -
The algorithm for Matrix Multiplication, Element Multiplication and Addition is attached
in the Appendix 5.3.
Path Connection
In this section, we describe how Paths P1 and P2 are connected together.
When the last edge from P1 is connectable to the first edge from P2, we record all edge
references from P1 and P2 in sequence in the resulting new path. Notice here we record
edge reference rather than the real edge copy to reduce the memory usage and increase
the efficiency.
However, before we really perform the path connection, we need to do two extra
condition checks: one is the redundant loop check, which will rule out a path having a
vertex been accessed more than twice; the other is the edge constraint check, which is to
check whether the value exchange is doable in the real word.
1). Redundant Loop Check
Before connecting Path P1 and Path P2 together, we should make sure that the resulted
new path does not have redundant loops. In other words, we need to make sure that the
path neither has an edge accessed more than once nor an internal vertex (other than the
start and end vertex) accessed twice. This requirement is equivalent to the condition that
no vertex in the path has input/output degrees greater than 2.
To perform such loop check, we maintain a bitmap style loop check array LCA for each
path to record the corresponding input and output degrees of each vertex in that path. If
the path has an edge starting from or ending with node i, we will increase i's degree by
one. If any vertex’s degree in the path is greater than 2, this path is defined to have
redundant loops and ruled out.
- 345 -
An important advantage of our loop check method is that it avoids a pass of accesses to
the entire new path so as to recalculate the new LCA, because the new LCA can be
deducted by directly adding P1’s LCA and P2’s LCA together when P1 and P2 are
connected together. More specifically,
LCA i[ ] = LCAP1 i[ ] + LCAP 2 i[ ] , where
i ∈ 0,DIM[ )stands for Vertex i in the path. If
LCA i[ ] > 2 , the current considering path would be
dropped directly without further calculation. In this way, we can efficiently check
redundant loop without any unnecessary calculation.
2). Edge Constraint Check
Another important issue during path connection is edge constraint check. Edge constraint
check is to check whether the value exchange makes sense in the real world. Each time
two paths P1 and P2 are to be connected, the last edge from P1 is checked against the
first edge from P2 to make sure that they are connectable. To fulfill this, we maintain in
the program a hash map to record all the connectable information. If the paths (edges) are
not connectable, the new path is dropped.

- 346 -
Appendix 5.3 Example Java Code for the DSM Modeling Platform
(As an Example, Only for the Focal Organization Analysis)
// * * * * * * * * * * * * * * * * * * * * * * * * * * * * * * * * * * * * * * * * * * *
MMaattrriixx IInnppuutt
// * * * * * * * * * * * * * * * * * * * * * * * * * * * * * * * * * * * * * * * * * * *
/* Matrix.java
* Initial Matrix Constructor
* Input:
* String fnode: Node Input File
* String fedge: Edge Input File
* String fcons: Constraint Input File
*/
Matrix(String fnode, String fedge, String fcons) {
// Read in the node information
ttrryy {
BufferedReader bufRead = nneeww BufferedReader(nneeww FileReader(fnode));
String line; iinntt count = 0;
// Read the first line
line = bufRead.readLine(); count++;
// Read through the file
wwhhiillee(line != nnuullll) {
Vertex n = nneeww Vertex(line); // construct a new node
nodemapi2n.put(nneeww Integer(n.intval), n);
nodemaps2n.put(n.name, n);
line = bufRead.readLine(); count++;
}
bufRead.close();
DIM = count-1; System.out.println("Totally " + DIM + " nodes constructed.");
}ccaattcchh(IOException e) { e.printStackTrace(); }

- 347 -
// Read in the Edge information
matrix = nneeww Element[DIM*DIM]; ttrryy{
BufferedReader bufRead = nneeww BufferedReader(nneeww FileReader(fedge));
String line; iinntt count = 0;
// Read the first edge
line = bufRead.readLine(); count++;
// Read through the file
wwhhiillee(line != nnuullll) {
Edge e = parseEdge(line);
iiff (getElement(e.start, e.end) == nnuullll) {
setElement(e.start, e.end, nneeww Element(e));
}
eellssee getElement(e.start, e.end).addPath(e);
edgemaps2e.put(e.name, e); edgemapi2e.put(e.id, e);
line = bufRead.readLine(); count++;
}
bufRead.close();
}ccaattcchh(IOException e) { e.printStackTrace(); }
// Read in the constraints
ttrryy{
iiff (fcons == nnuullll) rreettuurrnn;
BufferedReader bufRead = nneeww BufferedReader(nneeww FileReader(fcons));
String line; iinntt count = 0;
// Read the first edge
line = bufRead.readLine(); count++;
// Read through the file
wwhhiillee(line != nnuullll) {
parseConstraint(line);
line = bufRead.readLine(); count++;
}
bufRead.close();
}ccaattcchh(FileNotFoundException e) {

- 348 -
System.out.println("no constraint file :-)");
connection = nnuullll; // no constraints }ccaattcchh(IOException e) { e.printStackTrace(); }
}
// * * * * * * * * * * * * * * * * * * * * * * * * * * * * * * * * * * * * * * * * * * *
MMaaiinn AAllggoorriitthhmm
// * * * * * * * * * * * * * * * * * * * * * * * * * * * * * * * * * * * * * * * * * * *
/* Matrix.java
* Matrix Multiplication
* Input:
* Matrix M1: the left multiplier
* Matrix M2: the right multiplier
* Output:
* Matrix: the result matrix
*/
ppuubblliicc ssttaattiicc Matrix multi(Matrix M1, Matrix M2) {
Matrix M = nneeww Matrix();
ffoorr(iinntt k=0; k<DIM; k++) { // M1-row
ffoorr(iinntt c=0; c<DIM; c++) { // M2-column
Element sum = nneeww Element();
ffoorr (iinntt r=0; r<DIM; r++) { // M2-row, M1-column Element e = Element.multi(M1.getElement(k, r), M2.getElement(r, c));
iiff(e != nnuullll)
sum.plus(e);
}
iiff (sum.pathNumber() == 0) sum = nnuullll;
M.setElement(k, c, sum);
}
}
rreettuurrnn M;
}

- 349 -
/* Element.java
* Element Multiplication
* Input:
* Element e1: the left multiplier
* Element e2: the right multiplier
* Output:
* Element: the result element
*/
ppuubblliicc ssttaattiicc Element multi(Element e1, Element e2) {
iiff(e1 == nnuullll || e2 == nnuullll) { rreettuurrnn nnuullll; }
Element element = nneeww Element();
ffoorr(iinntt i=0; i<e1.pathNumber(); i++) {
ffoorr(iinntt j=0; j<e2.pathNumber(); j++) {
Path p = Path.connect(e1.getPath(i), e2.getPath(j));
iiff(p != nnuullll) element.paths.addElement(p);
}
}
iiff (element.pathNumber() == 0) rreettuurrnn nnuullll;
rreettuurrnn element;
}
/* Element.java
* Element Plus
* Input:
* Element e: the element to be added
*/
ppuubblliicc vvooiidd plus(Element e) {
ffoorr(iinntt i=0; i<e.pathNumber(); i++)
paths.addElement(e.paths.get(i));
}
/* Path.java
* Path Connection + Redundant Loop Check
* Input:
* Path p1: the first path to be connected

- 350 -
* Path p2: the second path to be connected
* Output:
* Path: the result connected path
*/
ppuubblliicc ssttaattiicc Path connect(Path p1, Path p2) {
// whether p1.last matchable with p2.first
iiff(!p1.connectable(p2)) rreettuurrnn nnuullll;
sshhoorrtt[] lc = nneeww sshhoorrtt[Matrix.DIM]; ffoorr(iinntt i=0; i<Matrix.DIM; i++) {
lc[i] = (sshhoorrtt)(p1.loopcheck[i] + p2.loopcheck[i]);
// check whether having multiple loops
iiff(lc[i] > DEGREE) rreettuurrnn nnuullll;
}
// no multiple loop, connect the path together
Path p = nneeww Path(p1, p2, lc);
rreettuurrnn p;
}
/* Path.java
* Constraint Check, whether the first edge of Path p satisfies the constraint with the
last edge of the current path
* Input:
* Path p: the path to be connected
*/
pprriivvaattee bboooolleeaann connectable(Path p) {
iiff (Matrix.connection == nnuullll) rreettuurrnn ttrruuee;
Edge last = path.lastElement();
Vector<Edge> connect = Matrix.connection.get(last); iiff (connect == nnuullll) rreettuurrnn ttrruuee;
Edge first = p.path.firstElement();
iiff (connect.contains(first)) rreettuurrnn ttrruuee;
rreettuurrnn ffaallssee;
}

- 351 -
Figure A-6-1: Stakeholder Map for Level Three Model (76 Stakeholders)
Chinese Companies
International Governments
Chinese Local Governments Chinese People
Chinese Financial Institutions
Chinese Media
Chinese National Government
State OrgansCommunist Party of China
National People’s Congress
State Council
National Energy Administration
Dept of Resource Conservation and Environ Protection
Dept of IndustryAcademy of
Macroeconomic Research
National Development and Reform Commission
National Bureau of Statistics
State-Owned Assets Superv &
Admin Commission
State Admin of Taxation
Ministry of Industry and Info Tech
National Leading Group to Address Climate Change and Energy Conservation & Pollutant
Discharge Reduction
Ministry of Supervision
People’s Bank of China
Ministry of Environmental
Protection
Ministry of Science and Technology
Xinhua News Agency
Chinese Academy of
Sciences
Chinese Academy of Engineering
Development Research Center
Ministry of Finance
General Admin of Quality Superv
Inspec and Quarantine
China Banking Regulatory
Commission
China Securities Regulatory
Commission
State Electricity Regulatory
Commission
Environ Protect and Resource Conservation
Committee
Ministries and Commissions
Organizations
Institutions
National Congress of CPC
Politburo
Central Organization
Dept
Central Commission of
Discipline Inspection
Political Consultative Conference
Local Development and Reform Commission
Local Officials
Prime Minister(WEN Jiabao)
General Secretary / President(HU Jintao)
General Admin of Press and Publication
Consumers Chinese Universities
National Media
BP
Other International
Energy Companies
International Financial
Institutions
Financing NGOs
Influencing NGOs
International Media
EU Governments
US Government
UK Government
Contractors / Suppliers
Technology and Consulting Companies
Certification and Inspection Companies
Energy Producing Companies
Chinese Industry Associations
Stock Brokerages
State-Owned Banks Private Banks
Concerned Citizens
Local Media Unofficial Media
Energy Using Companies
Local CompaniesLarge State-
Owned Companies
Medium and Small State-
Owned Companies
Private Companies
Ministry of Education
Ministry of Human
Resources and Social Security
Dept of Energy Conservation and Integrated
Utilization

- 352 -
Figure A-6-2: Stakeholder Map for Level Three Model (Political Flows Part 1)
Chinese Companies
International Governments
Chinese Local Governments Chinese People
Chinese Financial Institutions
Chinese Media
Chinese National Government
State OrgansCommunist Party of China
National People’s Congress
State CouncilNational Development and Reform Commission
State-Owned Assets Superv &
Admin Commission
National Leading Group to Address Climate Change and Energy Conservation & Pollutant
Discharge Reduction
Xinhua News Agency
General Admin of Quality Superv
Inspec and Quarantine
China Banking Regulatory
Commission
China Securities Regulatory
Commission
State Electricity Regulatory
Commission
Ministries and Commissions
Organizations
Institutions
National Congress of CPC
Politburo
Central Organization
Dept
Central Commission of
Discipline Inspection
Political Consultative Conference
Prime Minister(WEN Jiabao)
General Secretary / President(HU Jintao)
General Admin of Press and Publication
Chinese Universities
BP
Other International
Energy Companies
Influencing NGOs
International Media
Energy Producing Companies
Chinese Industry Associations
Stock Brokerages
State-Owned Banks Private Banks
Concerned Citizens
Support
Con
sulta
ncy
Fulfillment
Voting Voting
Fulfillment
Nom
inat
ion Fulfillm
ent
Energy Using CompaniesLarge State-
Owned Companies
Medium and Small State-
Owned Companies
Dire
ctio
n Support
Support
Fulfillment
Direction
Supp
ortVoting
Fulfi
llmen
t
Nom
ination
Voting
DisciplineInspection
OfficialsNomination
Laws and R
egulations / Com
pliance
Laws and R
egulations / Com
pliance
Laws and R
egulations / Com
pliance
Laws and Regulations / Compliance
Laws and R
egulations / Com
pliance
Laws and R
egulations / Com
pliance
News Direction
Assets Superv and Executives A
ppraisal / Com
pliance
Assets Superv and Executives Appraisal / Compliance
Assets Superv and Executives Appraisal / Compliance
Environ Permits/ Compliance
Environ Permits / C
ompliance
Quality Superv and Standardization / Compliance
Fulfillment
Direction
Support
Fulfi
llmen
t
Support
Support
Support
Rep
utat
ion
Supp
ort
Gov Service
Support
Gov Service
Support
SupportSu
ppor
t
Supp
ort
Supp
ort
Support
Support
Supp
ort Su
ppor
t
Support on Curriculum and Construction
Supp
ort
Supp
ort
Supp
ort
Supp
ort
Regulations / C
ompliance
Support to:
International GovtsChinese National GovtChinese Local GovtsChinese CompaniesChinese Universities
Chinese Industry Assn’s
Supp
ort
Supp
ort
Support
Support
Support
Support
People’s Bank of China
Ministry of Environmental
Protection
Ministry of Education
Support
Support Consumers
Support
Support
Support
Support
Support
Supp
ort
Support
Support
Support
Support
Legislation and Inspection
Legislation and Inspection

- 353 -
Figure A-6-3: Stakeholder Map for Level Three Model (Political Flows Part 2)
Chinese Companies
International Governments
Chinese Local Governments Chinese People
Chinese Financial Institutions
Chinese National Government
State OrgansCommunist Party of China
National People’s Congress
State Council
National Energy Administration
Dept of Resource Conservation and Environ Protection
Academy of Macroeconomic
Research
National Development and Reform Commission
State-Owned Assets Superv &
Admin Commission
State Admin of Taxation
Dept of Energy Conservation and Integrated
Utilization
Ministry of Industry and Info Tech
National Leading Group to Address Climate Change and Energy Conservation & Pollutant
Discharge Reduction
Ministry of Environmental
Protection
Ministry of Science and Technology
Chinese Academy of
Sciences
Chinese Academy of Engineering
Development Research Center
Ministry of Finance
State Electricity Regulatory
Commission
Environ Protect and Resource Conservation
Committee
Ministries and Commissions
Organizations
Institutions
Politburo
Local Development and Reform Commission
Prime Minister(WEN Jiabao)
Chinese Universities
BP
Other International
Energy Companies
Influencing NGOs
Technology and Consulting Companies
Certification and Inspection Companies
Energy Producing Companies
Energy Using Companies
Local CompaniesLarge State-
Owned Companies
Medium and Small State-
Owned Companies
Private Companies
SuggestedEnergy-Saving goals
ApprovedEnergy-Saving goals
SuggestedEnergy-Saving goals
ApprovedEnergy-Saving goals
Energy-Saving goals /G
oal Fulfillment
Energy-Saving goals /G
oal Fulfillment
Permission / C
ompliance
Energy-Saving goals /G
oal Fulfillment
Energy-Saving goals /G
oal Fulfillment
Suggested Energy Prices
Approved Energy Prices
Energy-Saving goals /G
oal Fulfillment
Energy-Saving goals /G
oal Fulfillment
Energy-Saving goals /G
oal Fulfillment
Energy-Saving goals /G
oal Fulfillment
Sugg
este
d En
ergy
Pric
es (E
lect
ricity
)
Energy-SavingPolicy Suggestions
Ener
gy-S
avin
g Po
licy
Sugg
estio
ns
Legislation for Environ Protection and Energy-Saving /Energy and Environ Laws Implementation
Legislation for Environ Protection and Energy-Saving /Energy and Environ Laws Implementation
Legislation for Environ Protection and Energy-Saving /Energy and Environ Laws Implementation
Energy-SavingPolicy Research Collaboration
Energy-Saving Project Permits (Reform) / Compliance
Energy-Saving Project Permits (New) / Compliance
Energy-Saving Project Permits (Reform) / Compliance
Assurance for Environ Protection and Energy-Saving
Assurance for Environ Protection and Energy-Saving
Assurance for Environ Protection and Energy-Saving
Assurance for Environ Protection and Energy-Saving
Creation of Energy-Saving Co’s
Energy Security
Environmental Protection
Economic D
evelopment
Energy SecurityEnvironmental ProtectionEconomic Development
Access to Energy-Saving Projects (N
ew)
Access to Energy-Saving Projects (N
ew)
Access to Energy-Saving Projects (R
eform)
Access to Energy-Saving Projects (R
eform)
Access to Energy-Saving Projects (R
eform)
Access to Energy-Saving Projects (R
eform)
Acc
ess
to E
nerg
y-Sa
ving
Pro
ject
s (L
ocal
)
Acc
ess
to E
nerg
y-Sa
ving
Pro
ject
s (L
ocal
)
Energy-SavingPolicy Suggestions
Energy-SavingPolicy Suggestions
Energy-Saving Policy Suggestions
Energy-Saving Policy Suggestions
Energy-SavingPolicy Suggestions
Suggested Taxation Policies
Suggested Taxation Policies
Favorable Policies
Favorable Taxation Policies
Favorable Financial Policies
Favorable Financial Policies
Favorable Policies
Favorable Policies
Favorable Policies
Favorable Policies

- 354 -
Figure A-6-4: Stakeholder Map for Level Three Model (Information Flows)
Chinese Companies
International Governments
Chinese Local Governments Chinese People
Chinese Financial Institutions
Chinese Media
Chinese National Government
State OrgansCommunist Party of China
State Council
National Energy Administration
Dept of Resource Conservation and Environ Protection
National Development and Reform Commission
National Bureau of Statistics
State-Owned Assets Superv &
Admin Commission
State Admin of Taxation
National Leading Group to Address Climate Change and Energy Conservation & Pollutant
Discharge Reduction
Ministry of Supervision
People’s Bank of China
Ministry of Finance
Ministries and Commissions
Organizations
Institutions
Central Organization
Dept
Central Commission of
Discipline Inspection
Local Officials
Prime Minister(WEN Jiabao)
Chinese Universities
BP
Other International
Energy Companies
International Financial
Institutions
Financing NGOs
Influencing NGOs
International Media
Certification and Inspection Companies
Energy Producing Companies
Chinese Industry Associations
State-Owned Banks Private Banks
Concerned Citizens
Energy Using Companies
Large State-Owned
Companies
Medium and Small State-
Owned Companies
Energy-Saving Report for A
uditing
Statistical Data
Stat
istic
al D
ata
Stat
istic
al D
ata
Stat
istic
al D
ata
Stat
istic
al D
ata
Stat
istic
al D
ata
Stat
istic
al D
ata
Stat
istic
s an
d Su
gges
tions
Assets Report for Auditing
Assets Report for Auditing
Interest Rate
Interest Rate
Exchange Rate
Assets Report for AuditingPu
blic
Aw
aren
ess
on E
nerg
y-Sa
ving
Offi
cial
Eva
luat
ion
Offi
cial
Eva
luat
ion
Offi
cial
Eva
luat
ion
Official Evaluation
Official EvaluationO
fficial Evaluation
Tax Rate
Tax Rate
Tax Rate
Tax Rate
Tax Rate
Financial Report for Auditing
Financial Report for Auditing
Progress Evaluation
Financial Wellbeing and Progress Evaluation
Financial Wellbeing and Progress Evaluation
Financial Wellbeing
Progress Evaluation
Financial wellbeing
Dept of Energy Conservation and Integrated
Utilization
Ministry of Industry and Info Tech
Progress Evaluation
Progress Evaluation
Prog
ress
Eva
luat
ion
Financial Report for Auditing
General Admin of Quality Superv
Inspec and Quarantine
Measurement Report for Auditing
Opi
nion
s
News
News
News
News
News
New
s
News
New
s
News
News
News
News
News
NewsNews
Research Data
Research Data
Research Data
Ministry of Science and Technology
Ministry of Education
Progress Evaluation
Progress Evaluation
Progress EvaluationProgress Evaluation
Energy-Saving Propaganda
News
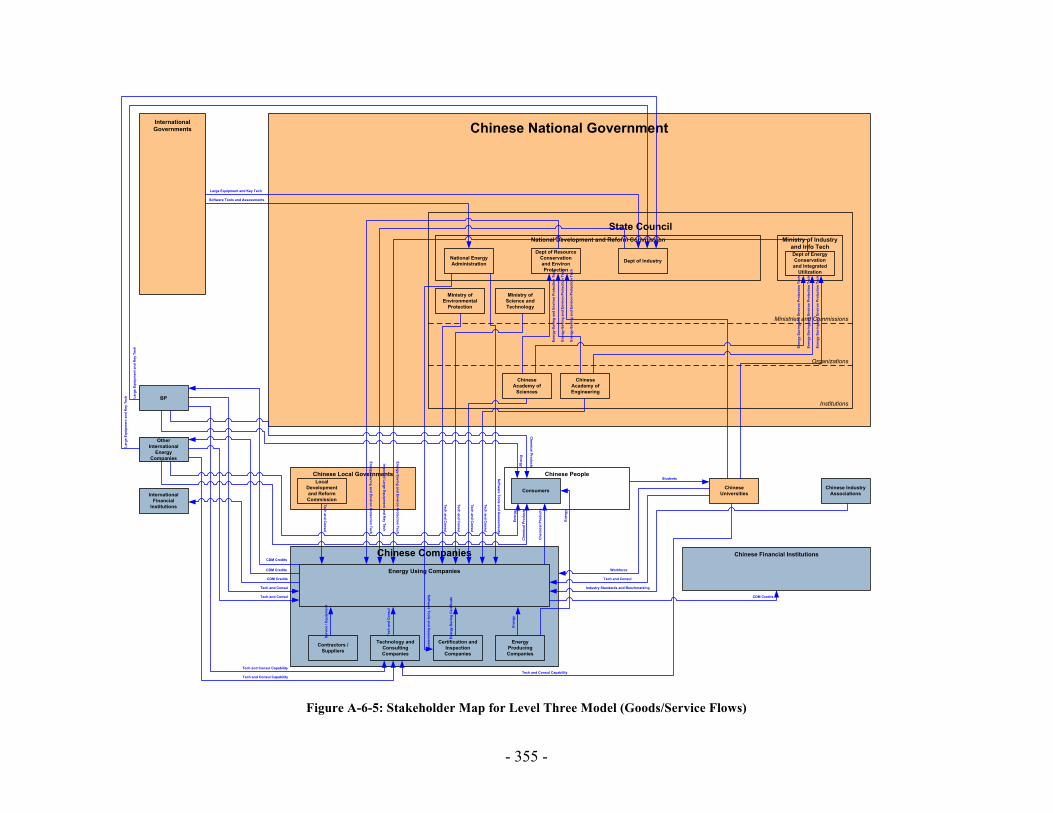
- 355 -
Figure A-6-5: Stakeholder Map for Level Three Model (Goods/Service Flows)
Chinese Companies
International Governments
Chinese Local Governments Chinese People
Chinese Financial Institutions
Chinese National Government
State Council
National Energy Administration
Dept of Resource Conservation and Environ Protection
Dept of Industry
National Development and Reform Commission
Dept of Energy Conservation and Integrated
Utilization
Ministry of Industry and Info Tech
Ministry of Environmental
Protection
Ministry of Science and Technology
Chinese Academy of
Sciences
Chinese Academy of Engineering
Ministries and Commissions
Organizations
Institutions
Consumers Chinese Universities
BP
Other International
Energy Companies
International Financial
Institutions
Contractors / Suppliers
Technology and Consulting Companies
Certification and Inspection Companies
Energy Producing Companies
Chinese Industry Associations
Energy Using Companies
Ener
gy
Ener
gy-S
avin
g C
ertif
icat
e
Tech
and
Con
sul
Serv
ice
/ Equ
ipm
ent
Ener
gy
Che
mic
al P
rodu
cts
Students
Workforce
Tech and Consul
Tech and Consul
Tech and Consul
CDM Credits
CDM Credits
CDM Credits
Software Tools and Assessments
Software Tools and A
ssessments
Software Tools and A
ssessments
Tech and Consul
Tech and Consul
Industry Standards and Benchmarking
Tech and Consul Capability
Tech and Consul Capability
CDM CreditsTech and C
onsul
Tech and Consul
Local Development and Reform Commission
Tech and Consul
Energy-Saving and Environ Protection Tech
Imported Large Equipm
ent and Key Tech
Energy-Saving and Environ Protection Tech
Large Equipment and Key Tech
Larg
e Eq
uipm
ent a
nd K
ey T
ech
Larg
e Eq
uipm
ent a
nd K
ey T
ech
Ener
gy-S
avin
g an
d En
viro
n Pr
otec
tion
Tech
Ener
gy-S
avin
g an
d En
viro
n Pr
otec
tion
Tech
Ener
gy-S
avin
g an
d En
viro
n Pr
otec
tion
Tech
Ener
gy-S
avin
g an
d En
viro
n Pr
otec
tion
Tech
Ener
gy-S
avin
g an
d En
viro
n Pr
otec
tion
Tech
Ener
gy-S
avin
g an
d En
viro
n Pr
otec
tion
Tech
Chem
ical Products
Energy
Ener
gy
Che
mic
al P
rodu
cts
Tech and Consul Capability

- 356 -
Figure A-6-6: Stakeholder Map for Level Three Model (Financial Flows)
Chinese Companies
International Governments
Chinese Local Governments Chinese People
Chinese Financial Institutions
Chinese National Government
State Council
National Energy Administration
Dept of Resource Conservation and Environ Protection
National Development and Reform Commission
State Admin of Taxation
Dept of Energy Conservation and Integrated
Utilization
Ministry of Industry and Info Tech
Ministry of Environmental
Protection
Ministry of Science and Technology
Ministry of Finance
General Admin of Quality Superv
Inspec and Quarantine
Ministries and Commissions
Organizations
Institutions
Consumers Chinese Universities
BP
Other International
Energy Companies
International Financial
Institutions
Financing NGOs
Contractors / Suppliers
Technology and Consulting Companies
Certification and Inspection Companies
Energy Producing Companies
Chinese Industry Associations
Energy Using Companies
Ministry of Education
Ministry of Human
Resources and Social Security
Payment
Payment
Payment
Investment and D
emo Fund
Investment and D
emo Fund
Investment and Loan
Demo Fund
Payment
ROI
Funding
Funding
Wages
Taxes
DuesFunding
Payment
Payment
Budget
PaymentPayment
Payment
ROI and Payment
ROI and Payment
Paym
ent
Paym
ent
Budget
Investment and Loan
ROI
Tuition
Taxe
s
Taxes
Taxe
s
Taxes
Demo Fund
Non
-Com
plia
nce
Fee
Social Insurance Funding
Funding
Dem
o Fund
Dem
o Fund
Dem
o Fund
Dem
o Fund
Dem
o Fund
Dem
o Fund
Dem
o Fund
Dem
o Fund
Dem
o Fund
Dem
o Fund
Dem
o Fund
Dem
o Fund
TaxesTaxes
Non
-Com
plia
nce
Fee
Non
-Com
plia
nce
Fee
Allow
ance and Rew
ard for Energy-Saving