strategic plan for non-motorized traffic monitoring … plan for non-motorized traffic monitoring in...
TRANSCRIPT
Strategic Plan for Non-Motorized Traffic Monitoring in Colorado
Prepared for
Colorado Department of Transportation Project Manager: Mr. Steven Abeyta
Prepared by
Shawn Turner, P.E. Tongbin (Teresa) Qu, Ph.D., P.E.
Phil Lasley
Texas Transportation Institute The Texas A&M University System
College Station, TX 77843-3135
FINAL VERSION
June 29, 2012


1
INTRODUCTION The Colorado Department of Transportation (CDOT) is one of a few state DOTs that has begun to collect non-motorized traffic count data within the past few years. The practice of collecting non-motorized traffic count data is considered by many to be in the early stages of implementation; therefore, there is little guidance at the national or state level in regards to best practices. The Federal Highway Administration (FHWA) will be including guidance on monitoring non-motorized traffic in the 2012 update of the Traffic Monitoring Guide, but that guidance will be based on limited experience to date. Given their position as a leader and early innovator in non-motorized traffic data collection, CDOT has contracted with the Texas Transportation Institute (TTI) to develop a strategic plan for CDOT’s future activities in non-motorized traffic monitoring. PROCESS OVERVIEW This research project, titled “Non-Motorized Data: Site Selection Study and Strategic Plan Development,” consisted of three tasks:
1. Evaluate Non-Motorized Data Collection Methods 2. Evaluate Non-Motorized Traffic Count Data 3. Develop Strategic Plan for Non-Motorized Traffic Monitoring
The elements that were considered in Task 1 were:
Non-motorized monitoring site selection;
Maintaining, updating and publishing short-duration count data;
Non-motorized traffic count factor groups; and,
Sample coverage adequacy. The elements that were considered in Task 2 were:
Develop data charts and summaries of non-motorized traffic patterns and trends.
Assess the quality and consistency of data collected thus far. This Strategic Plan represents the outcome of Task 3 and synthesizes the information developed in Tasks 1 and 2 into a coherent plan of action for CDOT. A separate research project (being conducted by University of Colorado-Denver, or UC-Denver) will provide more detailed recommendations for several elements of this Strategic Plan. In particular, the UC-Denver will provide recommendations on the permanent site factor grouping and the factor adjustment process. TTI researchers have coordinated with UC-Denver researchers on these respective projects and preliminary recommendations; however, Colorado DOT will still have to synthesize the final recommendations of these two projects as the different elements are implemented.
2
STRATEGIC PLAN ELEMENTS Overview This introductory section provides an overview of the major recommendations in this Strategic Plan, and subsequent sections provide the necessary supporting detail.
Establish business process for non-motorized traffic data: The business process for non-motorized data should be similar in scope/detail to the motorized traffic data process.1 This Strategic Plan contains TTI recommendations for several key elements of this process:
1. Import/loading of local agency non-motorized data 2. Assignment of count type (i.e., special study versus monitoring site) 3. Quality assurance / quality control processes 4. Establish and assignment non-motorized factor groups 5. Annualization and factoring process (to include occlusion factor) 6. Compelling reports/applications
Maintain and extend local agency partnerships: Colorado DOT has already established an exemplary institutional process and local agency partnerships through the Traffic Data Committee. These partnerships should be maintained and extended such that local agencies are actively and routinely submitting their non-motorized traffic data to CDOT’s traffic data warehouse (as is currently done with motorized traffic data).
Establish non-motorized factor groups: Colorado DOT should implement factor groups that can be used to annualize short-duration counts. TTI’s analysis indicated that, initially, 3 factor groups should be used: 1) commuter and work/school-based trips; 2) recreation/utilitarian trips; and, 3) mixed trip purposes (both commuter and recreation/utilitarian). TTI’s recommendations should be compared and/or combined with the forthcoming University of Colorado-Denver’s results in late 2012 and synthesized for implementation.
Short-duration site selection: Colorado DOT’s existing practice for identifying short-duration sites is consistent with other state and local agency best practices. However, Colorado DOT should differentiate between “special study” (e.g., before-after) counts and established short-duration monitoring sites. “Special study” sites are those at which facility-specific improvements have recently or will soon be made, and are not necessarily representative of overall citywide or regional trends. Conversely, established monitoring sites are locations that are believed to be representative of overall trends.
Enhance the quality assurance/quality checking (QA/QC) process: Colorado DOT should improve the QA/QC process for non-motorized data by: 1) using select automated QC rules available through TRADAS; 2) performing periodic validation counts to develop an occlusion adjustment factor for side-mounted infrared sensors; and 3) using targeted visual review.
It will be CDOT’s responsibility to identify a prioritized implementation path for viable recommendations, along with the necessary supporting detail required for implementation.
1 See “Traffic Analysis Business Process and Integrated Software Recommendations” prepared for Colorado DOT by
Cambridge Systematics, June 30, 2008.

3
Establish Business Process for Non-Motorized Traffic Data Summary Paragraph: The business process for non-motorized data should be similar in scope and detail to the motorized traffic data process.2 This Strategic Plan contains TTI’s high-level recommendations for several key elements of this process:
1. Import/loading of local agency non-motorized data 2. Assignment of count type (i.e., special study versus monitoring site) 3. Quality assurance / quality control processes 4. Establish and assign non-motorized factor groups 5. Annualization and factoring process (to include occlusion factor) 6. Compelling reports/applications
This non-motorized traffic data business process will accomplish 2 objectives:
1. Formalize several informal, undocumented elements of the existing program (such as the short-duration site selection).
2. Develop new process elements based on TTI and UC-Denver overall recommendations (such as the factor groups, factoring process, and quality assurance).
Some of the details for this non-motorized business process are defined in subsequent sections of this Strategic Plan. Other details will need to be defined by the Colorado DOT and their partners and stakeholders as they implement the findings of this and other related projects. Maintain and Extend Local Agency Partnerships Summary Paragraph: Colorado DOT has already established an exemplary institutional process and local agency partnerships through the Traffic Data Committee. These partnerships should be maintained and extended such that local agencies are actively and routinely submitting their non-motorized traffic data to CDOT’s traffic data warehouse (as is currently done with motorized traffic data). Discussion of Recommendations Through the Colorado Traffic Data Committee, Colorado DOT has already established a process for compiling motorized traffic data in a centralized, accessible data warehouse. The topic of non-motorized traffic is routinely discussed in these Committee meetings, and several local agencies are accessing the non-motorized traffic data already collected by Colorado DOT. The next logical step is to accept and encourage local agency submission of non-motorized traffic data into Colorado DOT’s traffic data warehouse. As with the motorized data, this single central repository provides a focal point for all non-motorized traffic data within Colorado. It also helps to ensure that any short-duration counts collected by local agencies are factored appropriately and consistently among all local agencies. The details of non-motorized traffic data submittal to Colorado DOT should follow the same basic process and formats that local agencies use when submitting motorized traffic data. However, Colorado
2 See “Traffic Analysis Business Process and Integrated Software Recommendations” prepared for Colorado DOT by
Cambridge Systematics, June 30, 2008.

4
DOT also should consider the FHWA non-motorized data attributes that will be included in the forthcoming update of the Traffic Monitoring Guide (TMG). The TMG update will specify mandatory and optional data attributes for non-motorized data submittal to FHWA, and ideally, Colorado DOT will import local agency non-motorized data in the CDOT data warehouse and be capable of submitting both CDOT and local agency non-motorized data to FHWA. Establish Non-Motorized Factor Groups Summary: Colorado DOT should implement factor groups that can be used to annualize short-duration counts. TTI’s analysis indicated that, initially, 3 factor groups may be appropriate: 1) commuter and work/school-based trips; 2) recreation/utilitarian trips; and, 3) mixed trip purposes (both commuter and recreation/utilitarian). TTI’s recommendations should be compared/combined with the forthcoming University of Colorado-Denver’s results in late 2012 and synthesized for implementation. Analysis and Findings Within Task 2, TTI analyzed the non-motorized traffic data that was available at all permanent monitoring locations and a sample of the short-duration monitoring locations. For each location, the analysis included:
1. A preliminary quality assessment; 2. Identification/verification of valid date ranges; 3. Analyzing and identifying typical time-of-day patterns; 4. Analyzing and identifying typical day-of-week patterns; and, 5. Analyzing and identifying typical month-of-year and seasonal patterns (permanent locations
only). Based on the data from several permanent locations, TTI identified two distinct seasonal groups:
1. Spring/Summer: April through September 2. Fall/Winter: October through March
These two seasonal groups are consistent with the 2 seasonal groups reported by the National Bicycle and Pedestrian Documentation Project3 for factoring short-duration counts. For each of the permanent locations, three charts were developed to summarize the non-motorized traffic patterns and trends:
1. Average time-of-day patterns by season and weekday/weekend; 2. Average day-of-week patterns by season and all months combined; and, 3. Average month-of-year patterns by weekday/weekend and all days combined.
These patterns are important because permanent locations with similar traffic patterns will be grouped together to form factor groups, which will form the basis of adjustment factors for short-duration counts.
3 See http://bikepeddocumentation.org/ for more information.
5
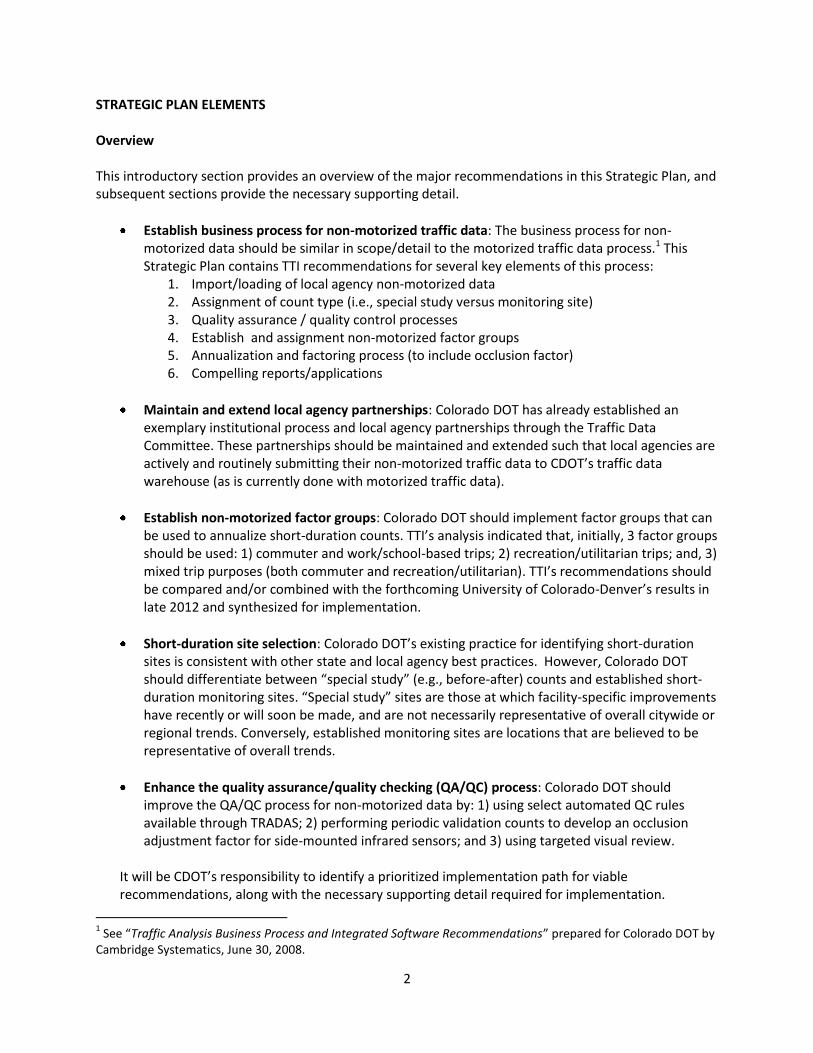
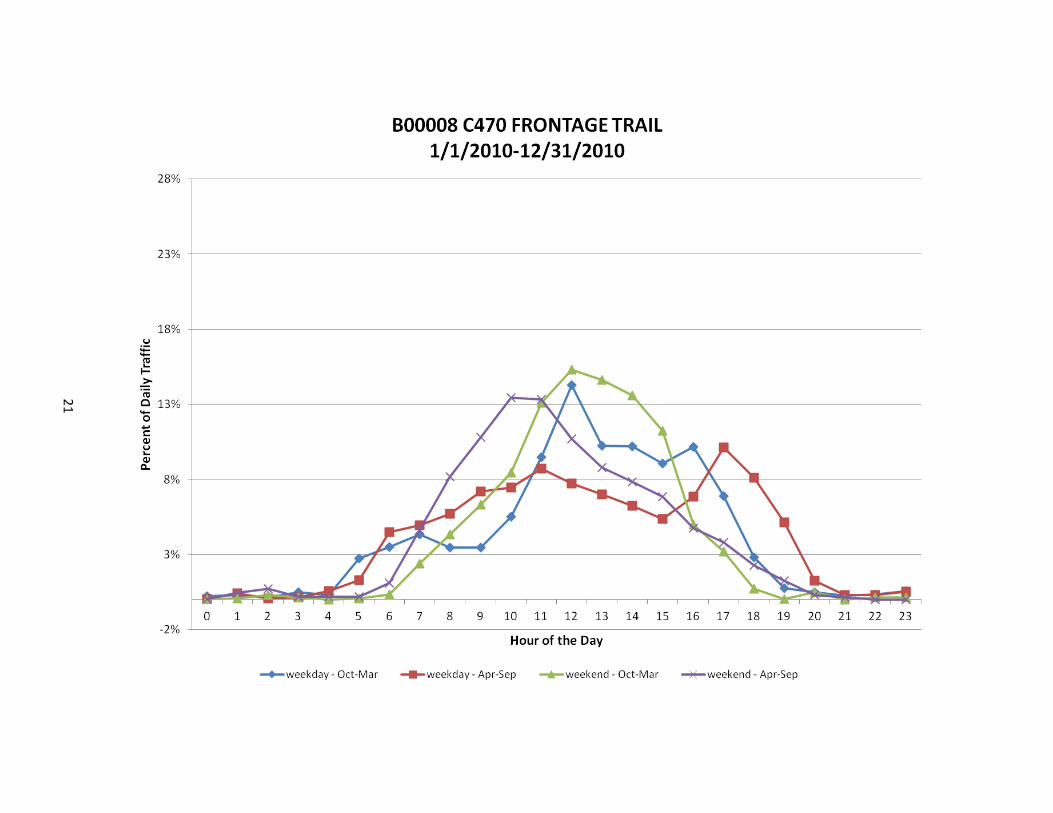
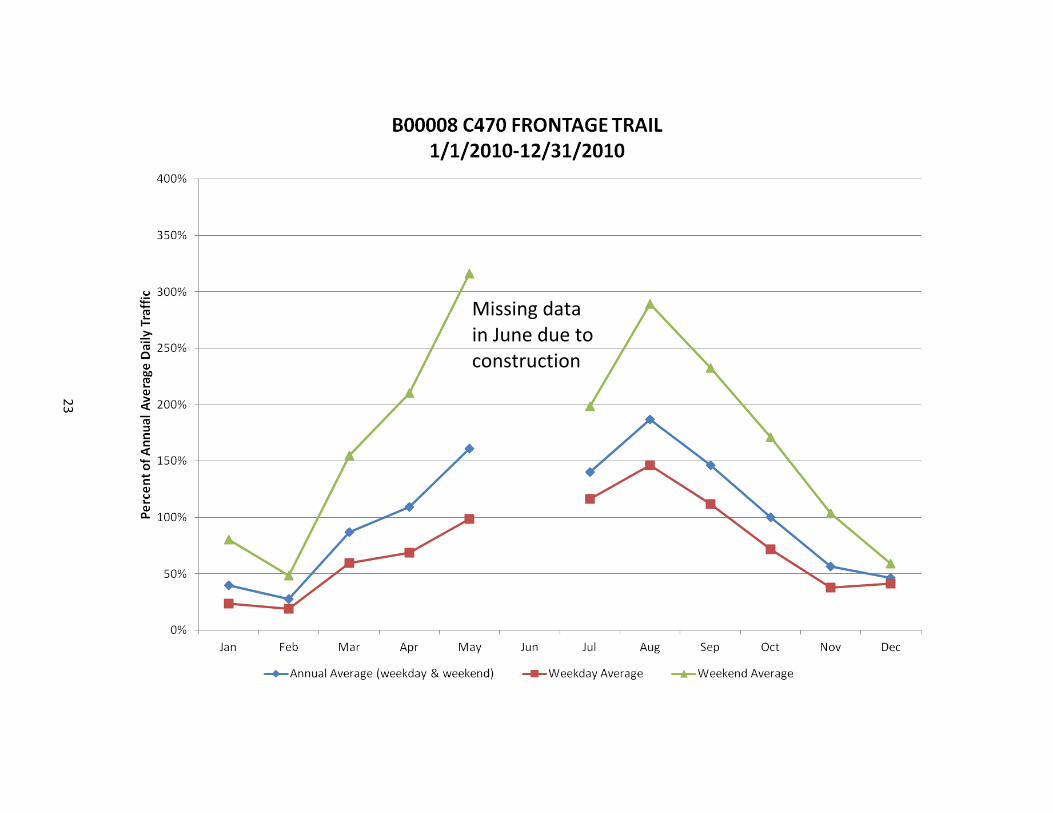
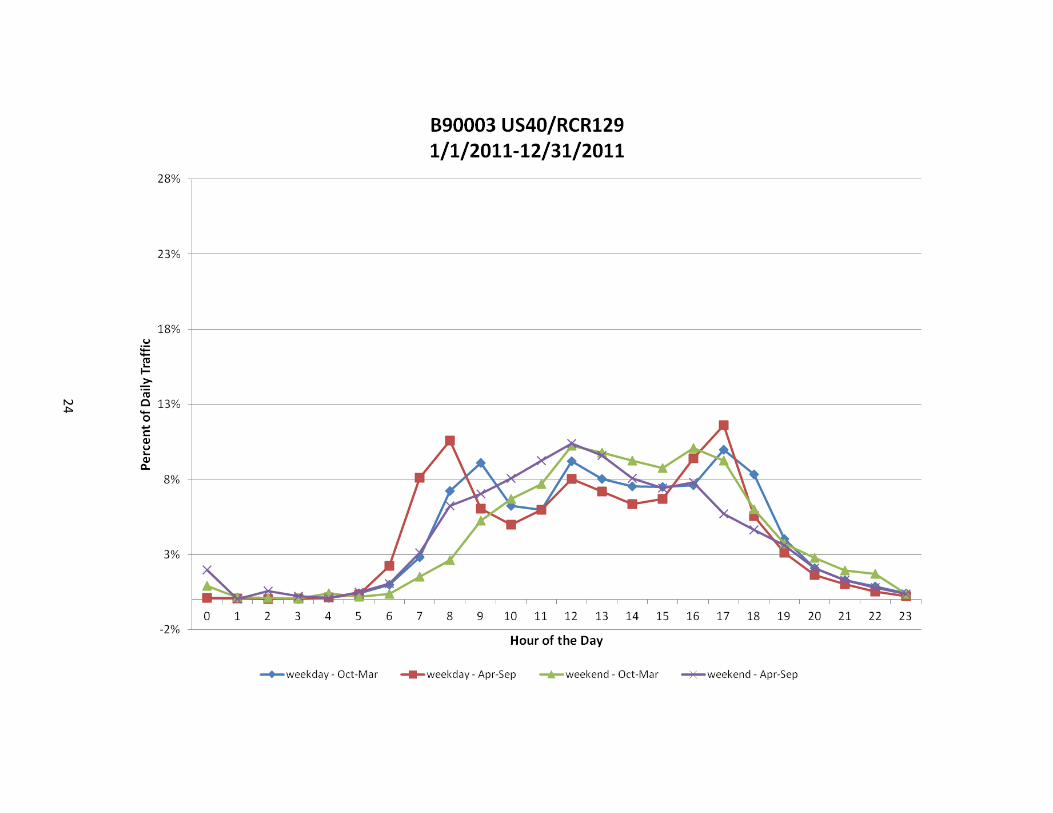
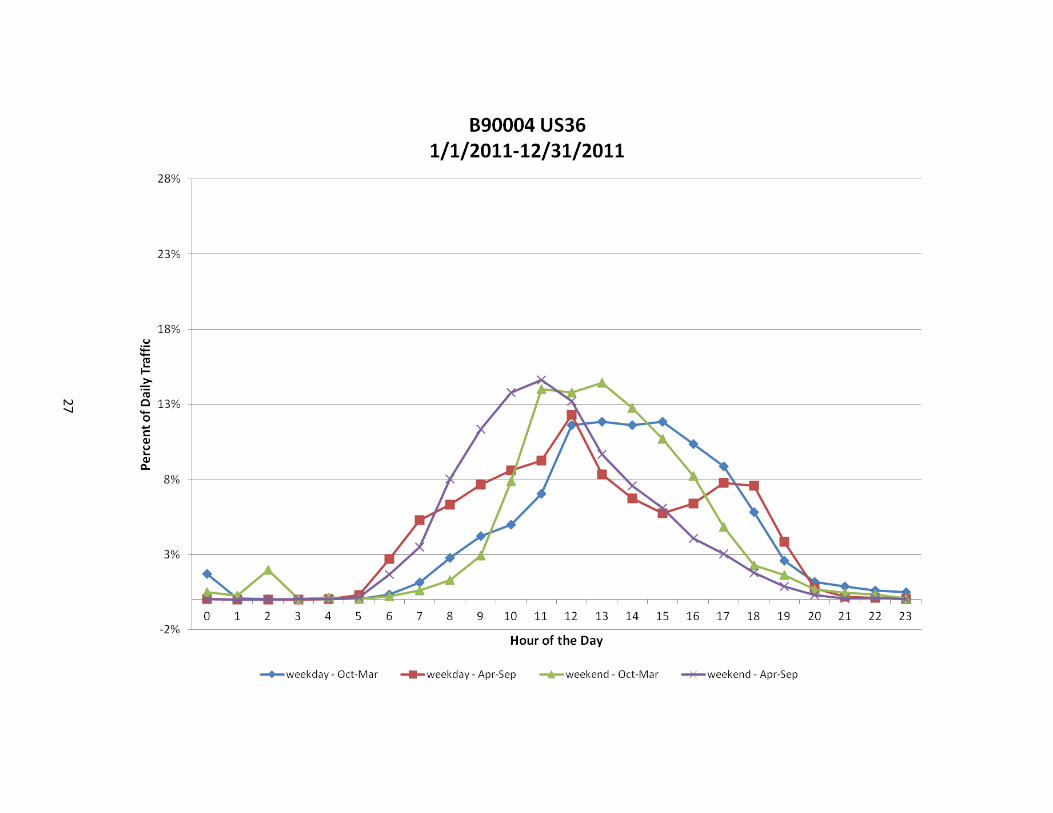
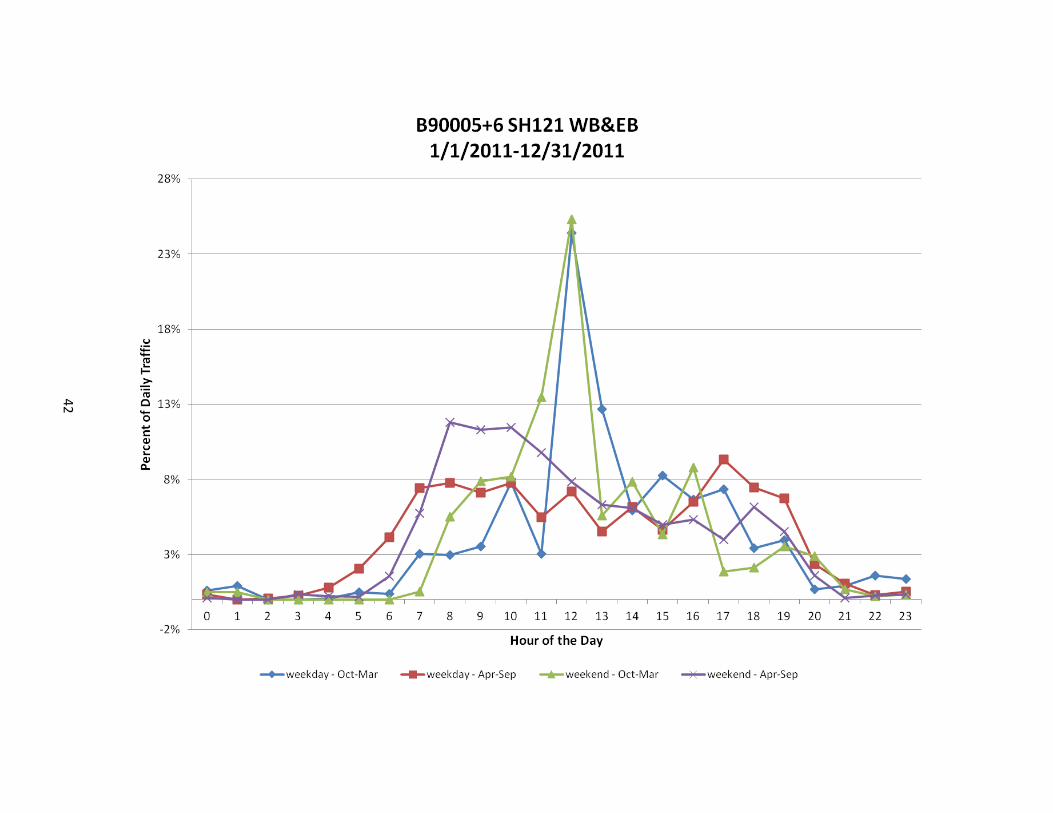
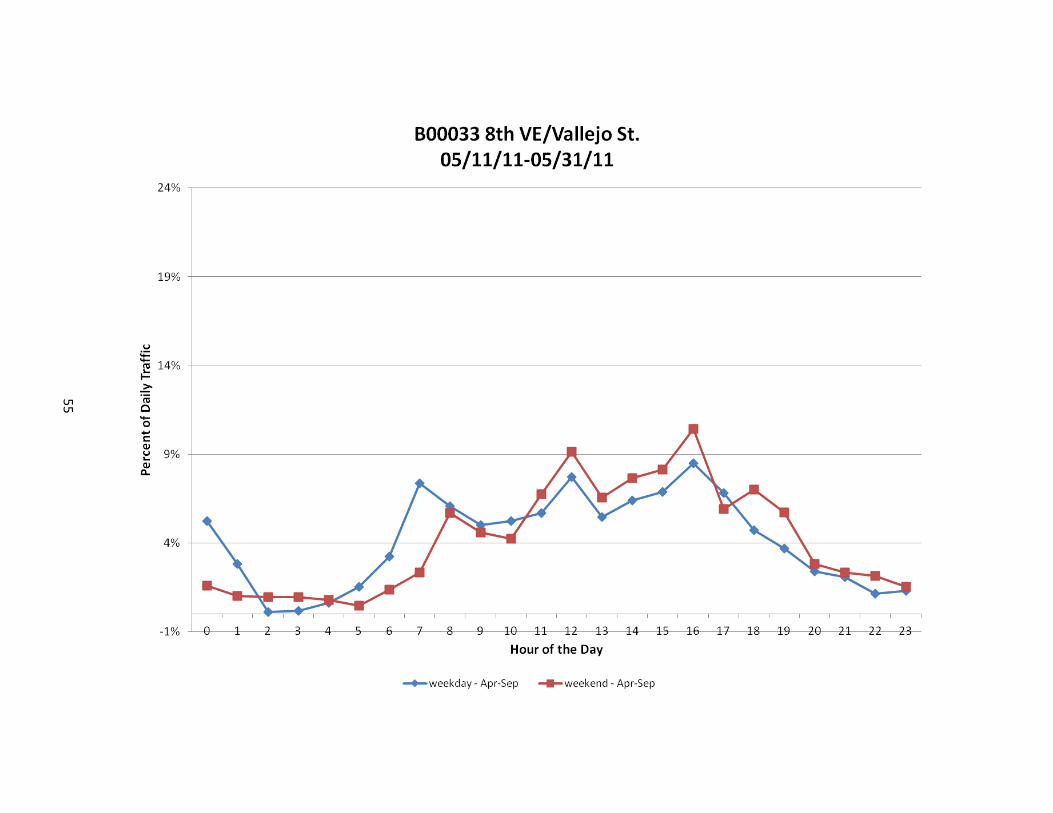
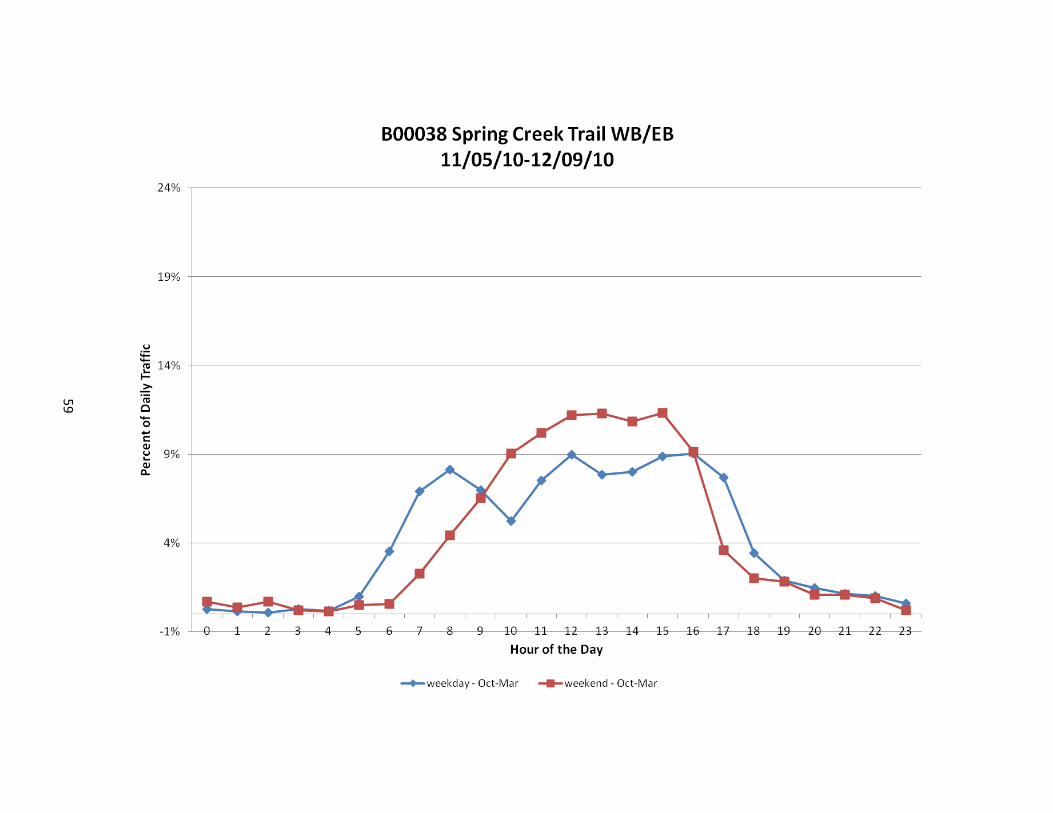
Exhibits 1 through 3 provide an example of these three charts for a single location: C470 at Ken Caryl. As background, this C470 monitoring location is a shared use path in the southwest Denver metro area that has a high percentage of recreational travel. Appendix A contains similar charts for all permanent and short-duration monitoring locations.
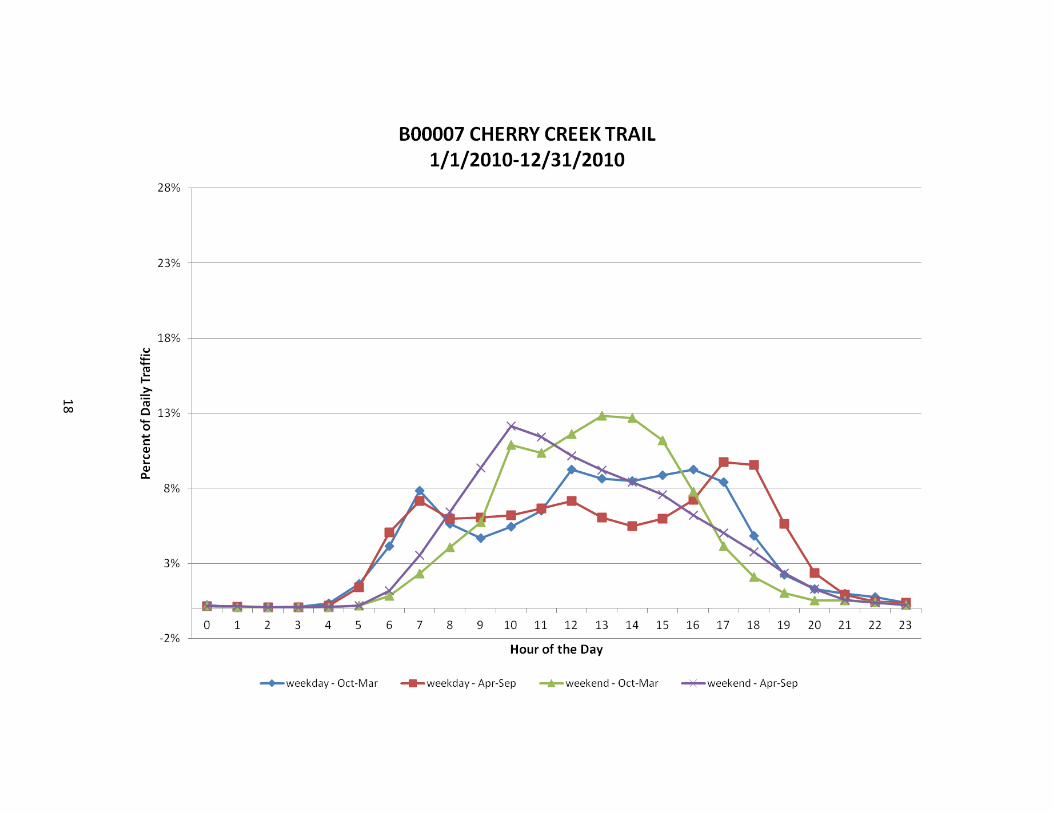
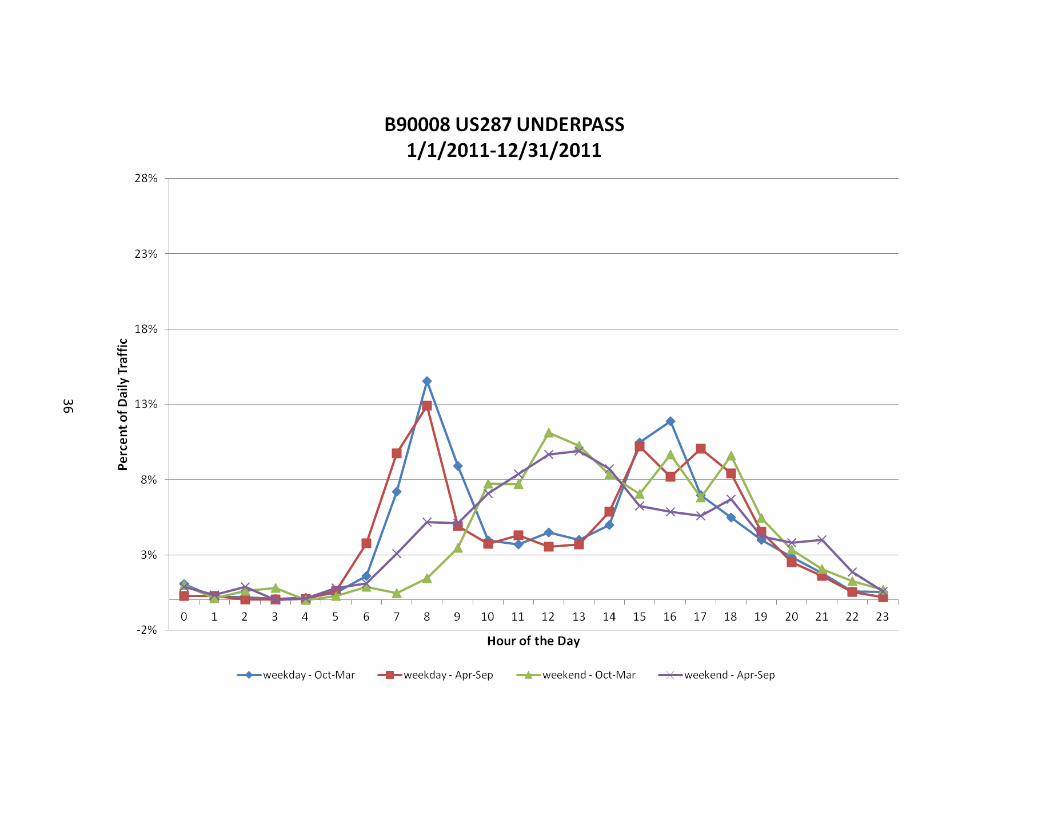
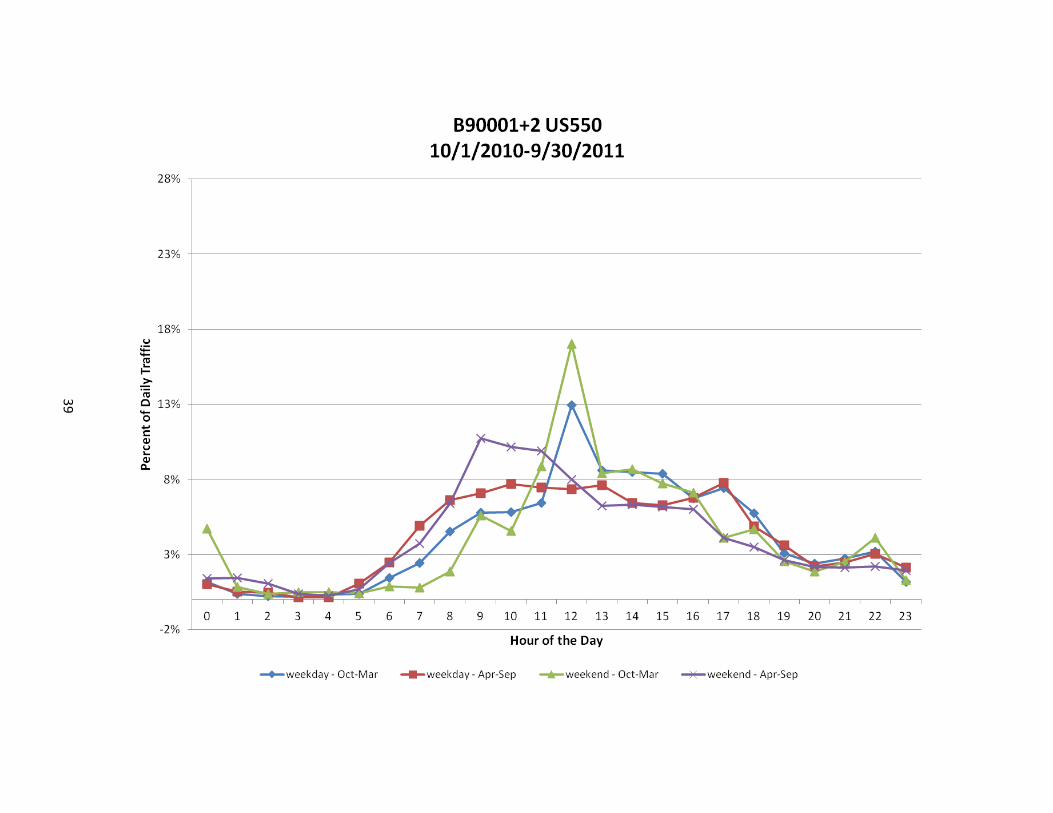
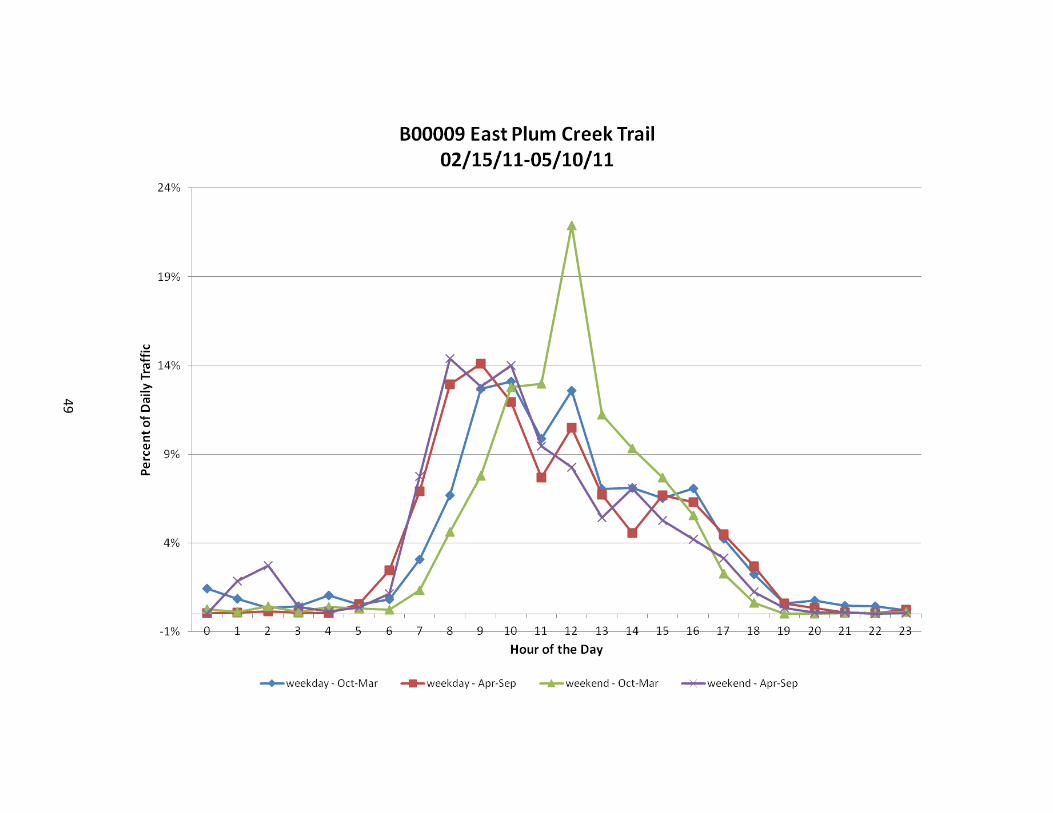
Exhibit 1. Example: Non-Motorized Traffic Patterns and Interpretations: Average Time-of-Day
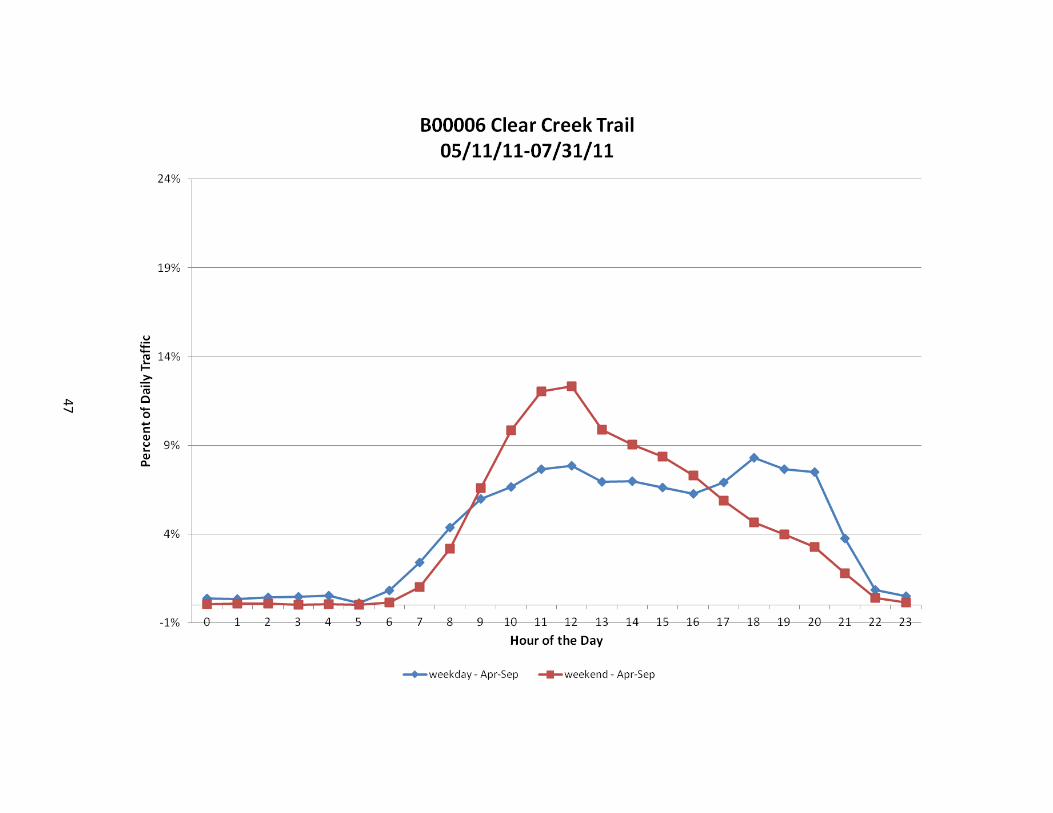
Average Time-of-Day Patterns
This location shows a high percentage of recreational trips.
This is demonstrated by a single peak near mid-day, and sometimes an evening peak.
The peak for recreational trips tends to shift later in the day during winter months.
-2%
3%
8%
13%
18%
23%
28%
0 1 2 3 4 5 6 7 8 9 10 11 12 13 14 15 16 17 18 19 20 21 22 23
Per
cen
t o
f Dai
ly T
raff
ic
Hour of the Day
B00008 C470 FRONTAGE TRAIL1/1/2010-12/31/2010
weekday - Oct-Mar weekday - Apr-Sep weekend - Oct-Mar weekend - Apr-Sep
6
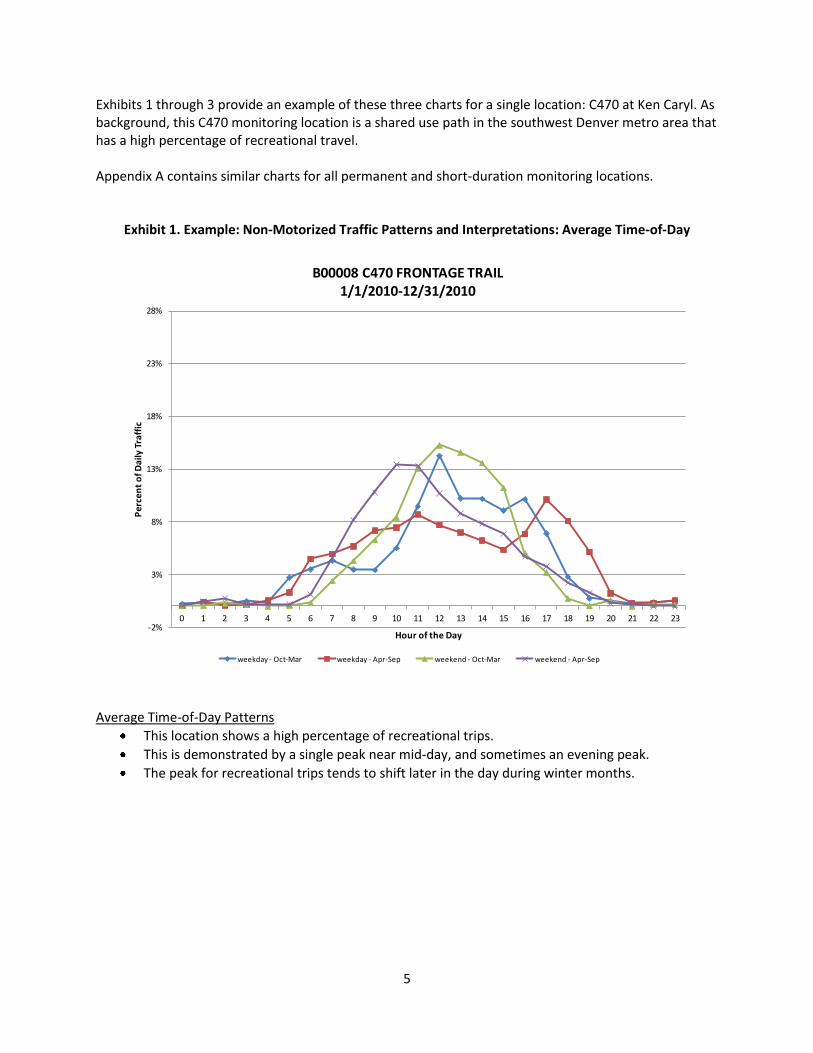
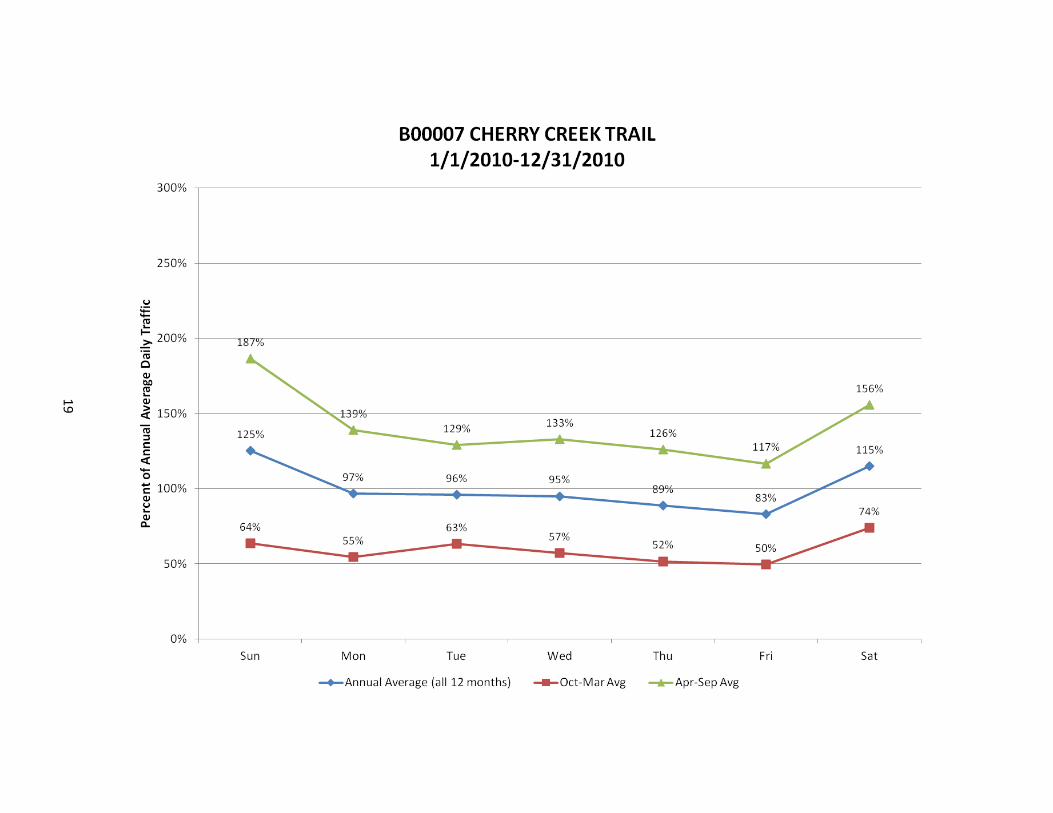
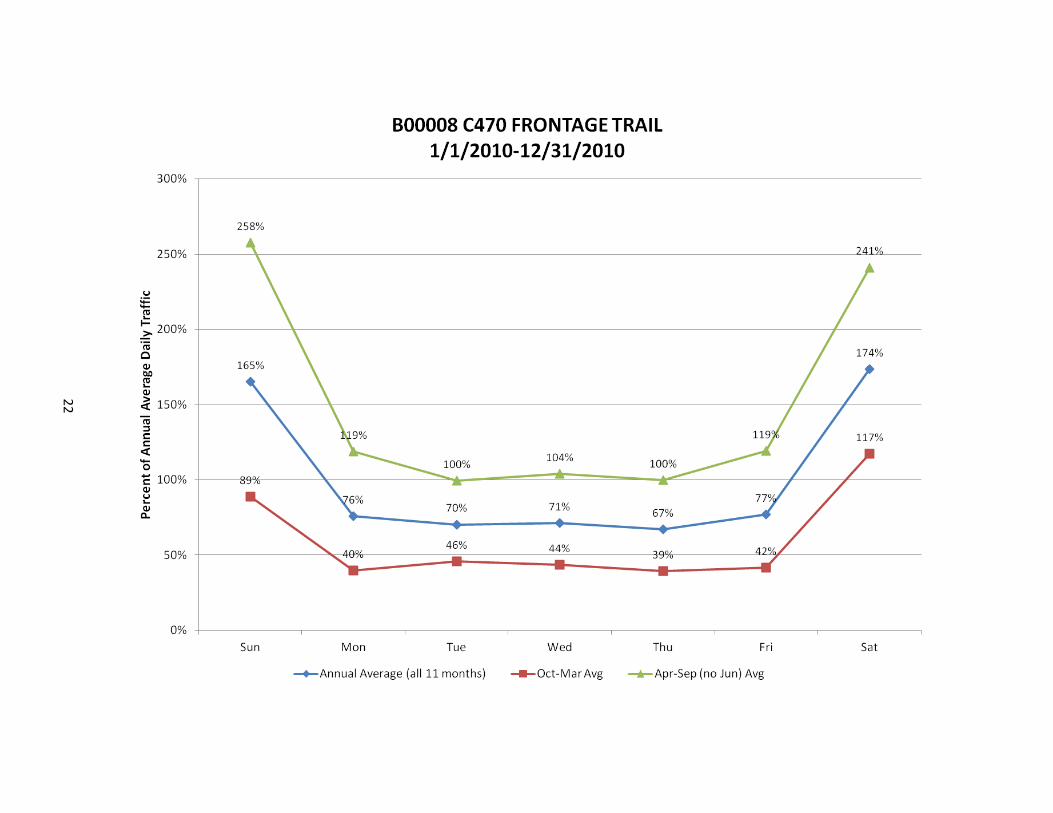
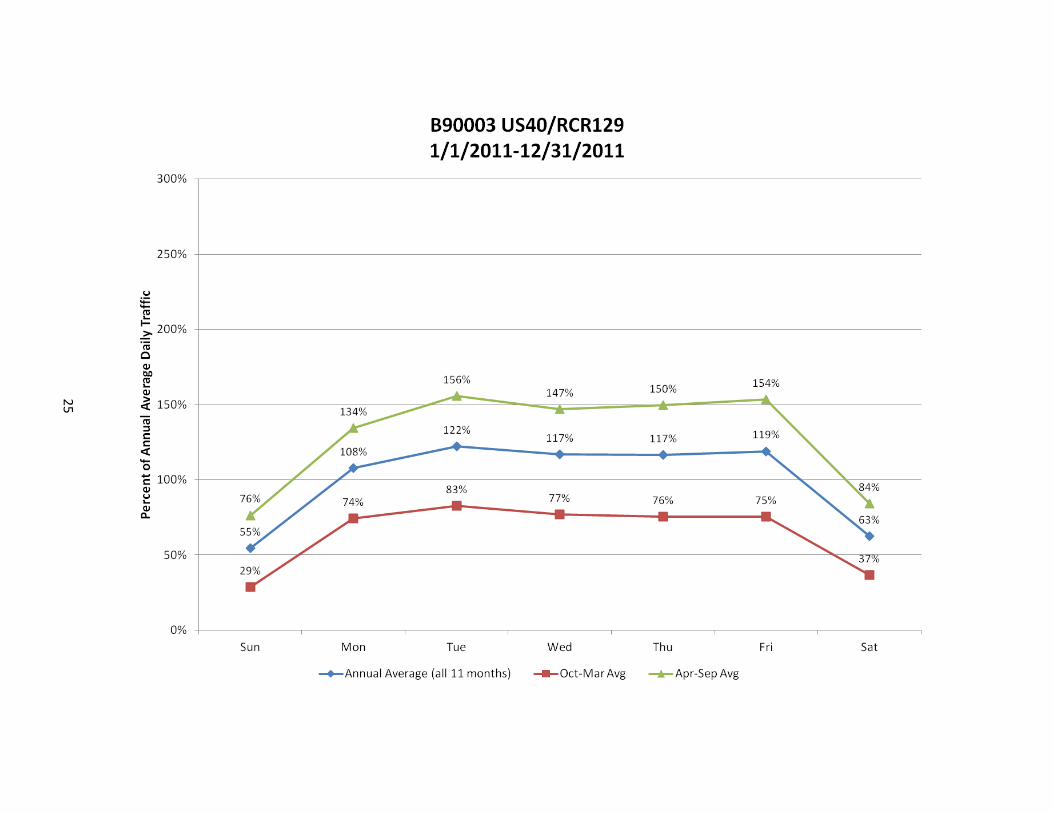
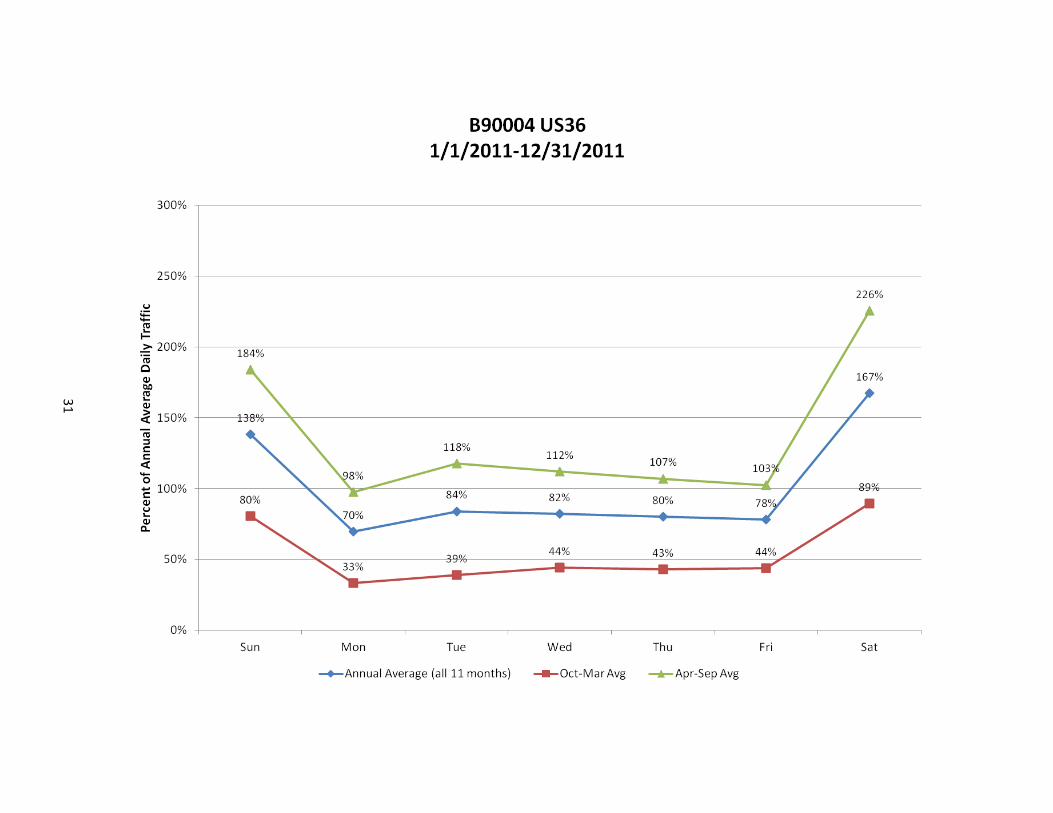
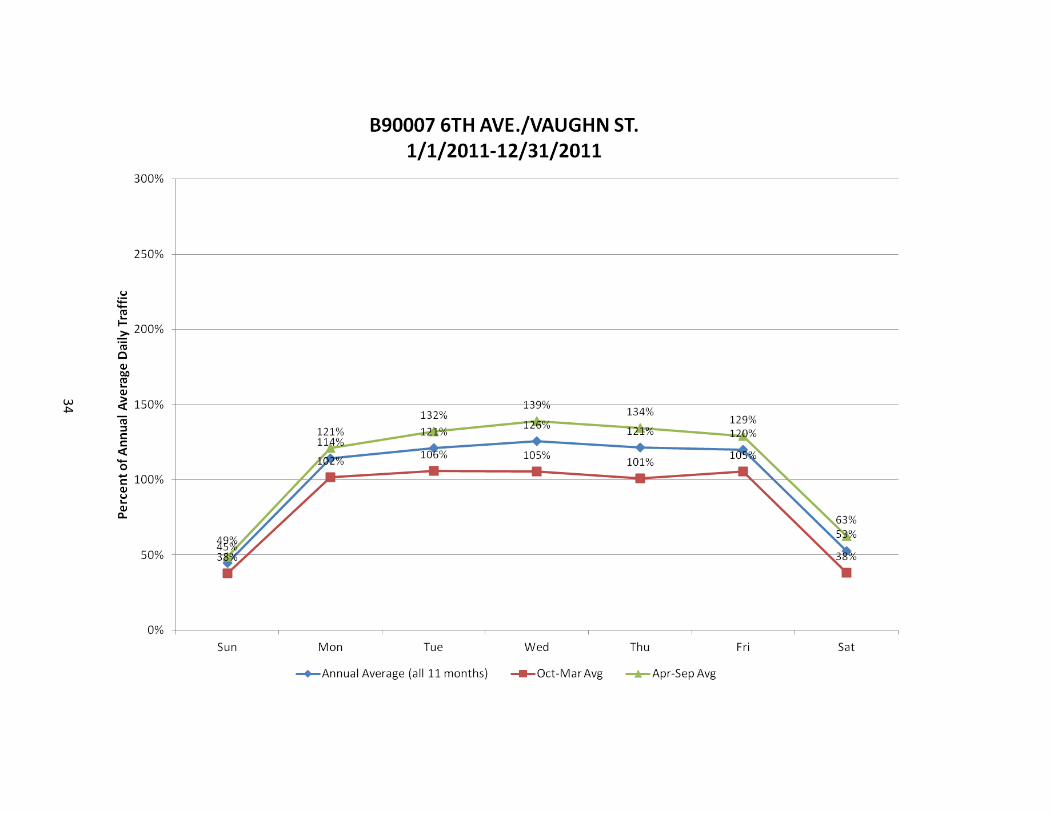
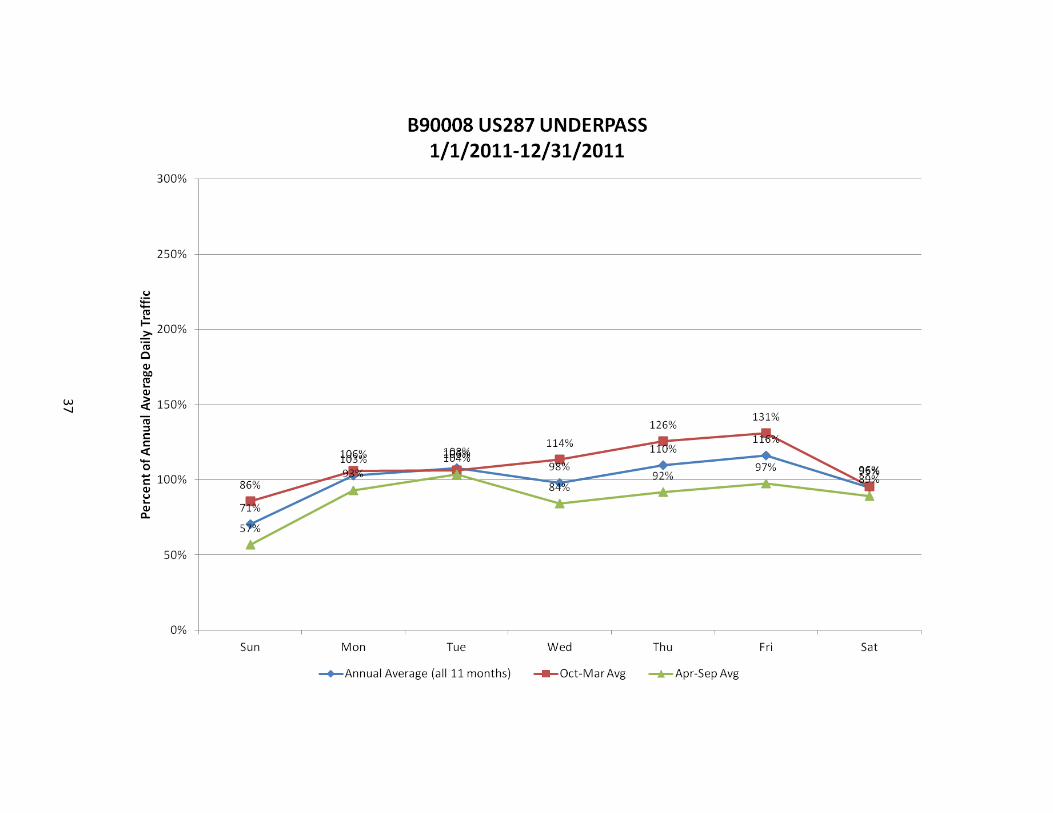
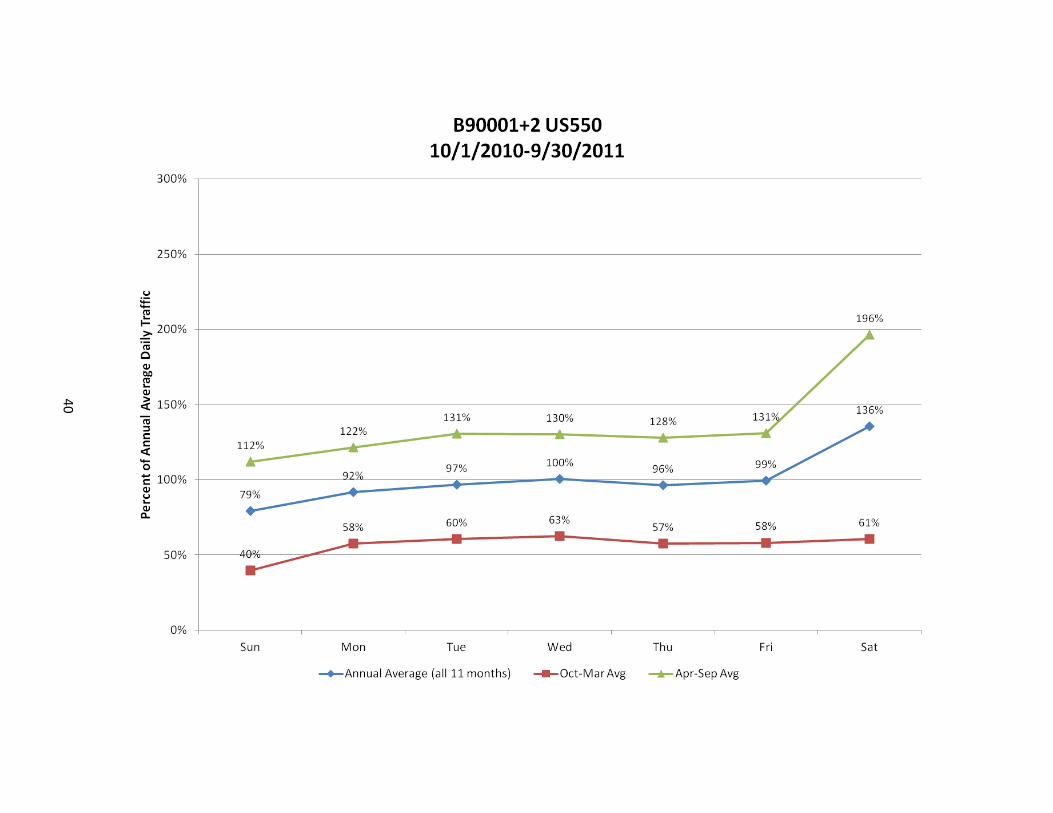
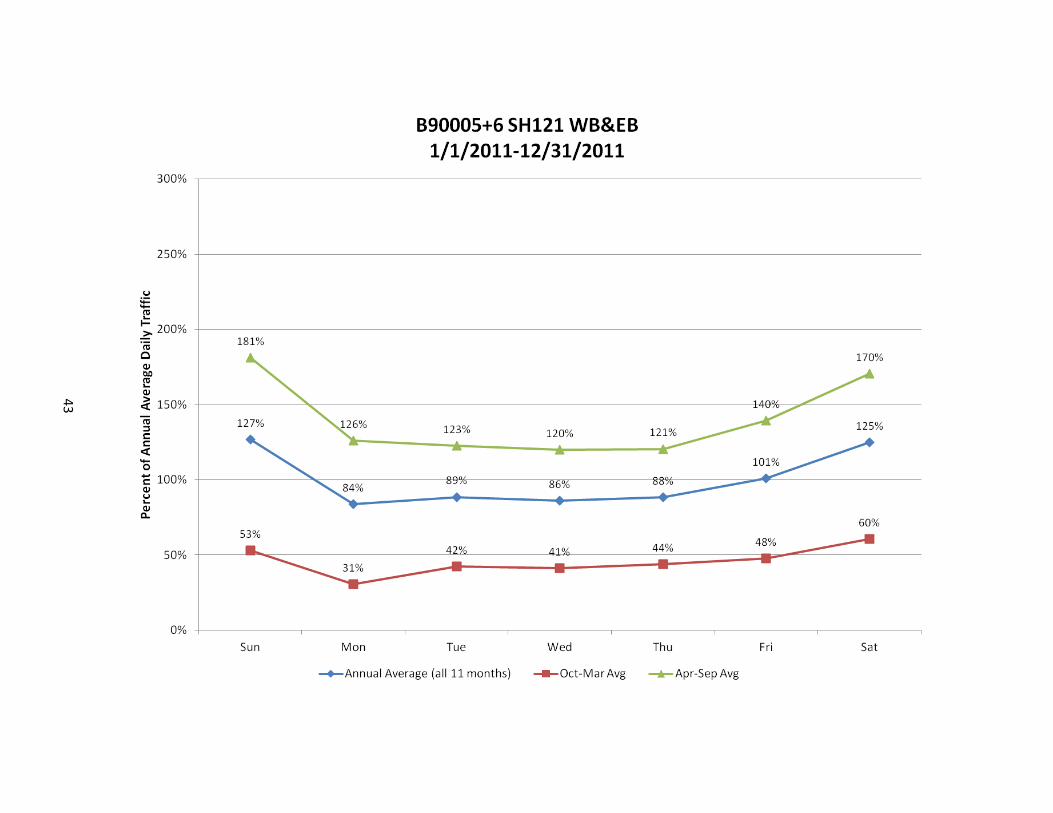
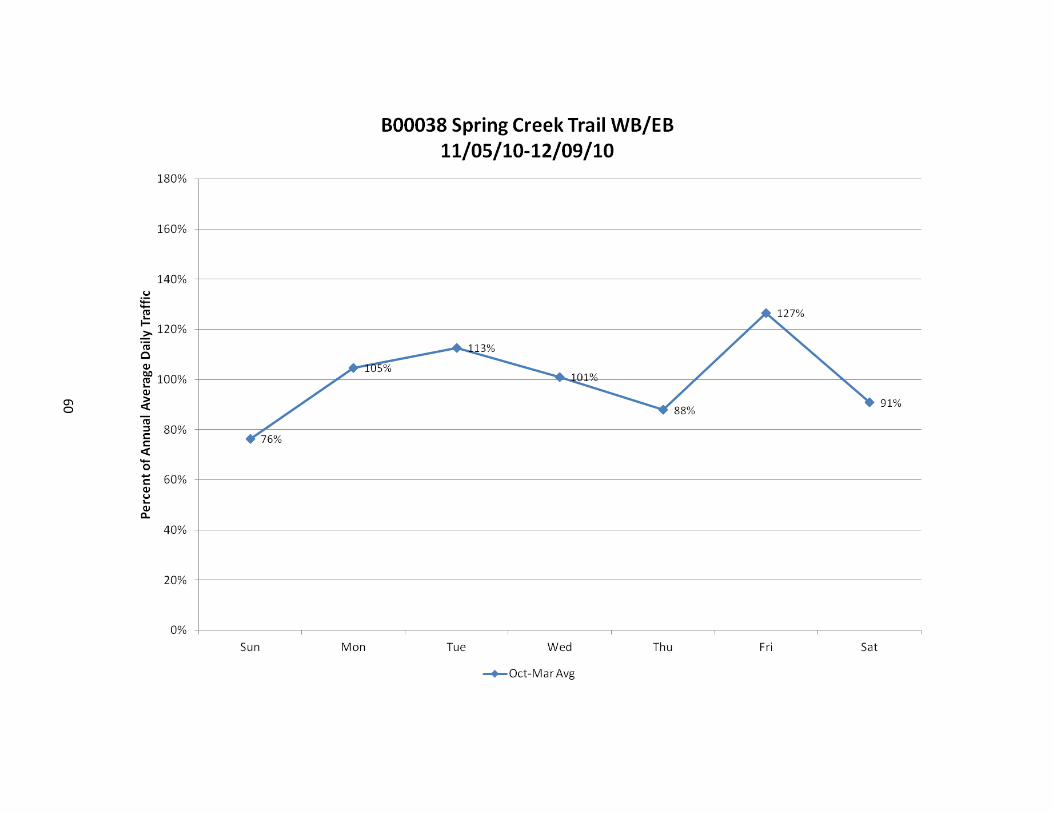
Exhibit 2. Example: Non-Motorized Traffic Patterns and Interpretations: Average Day-of-Week
Average Day-of-Week Patterns
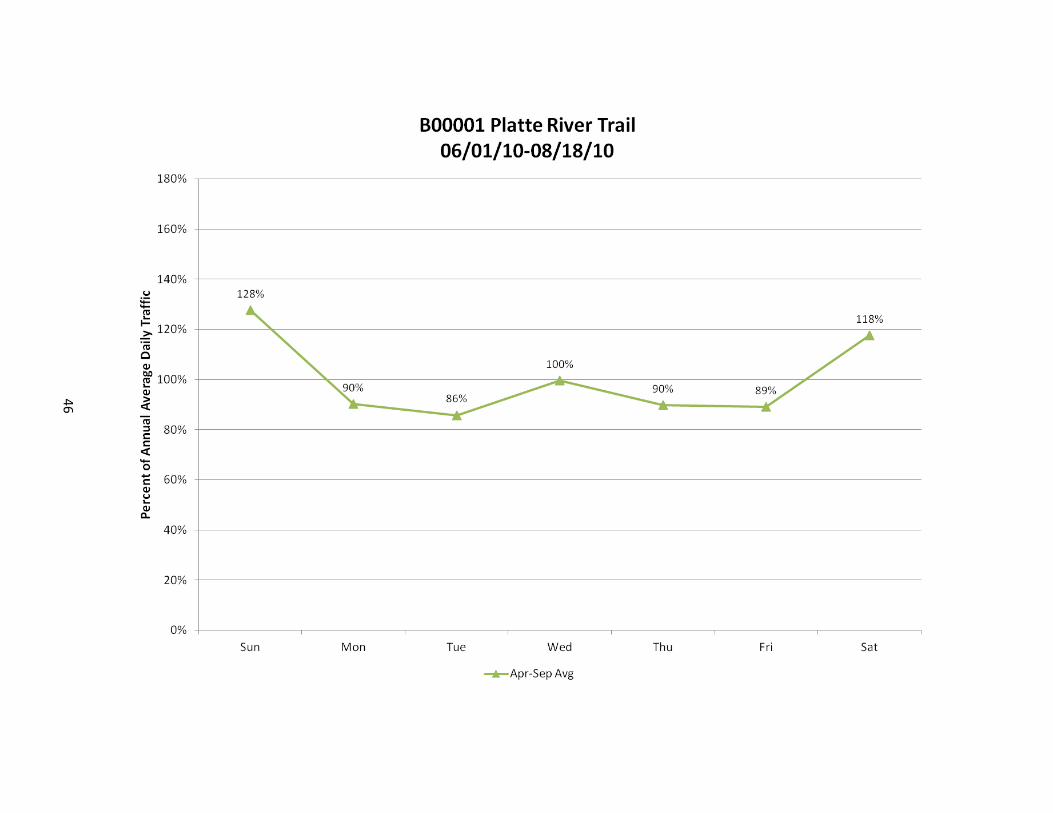
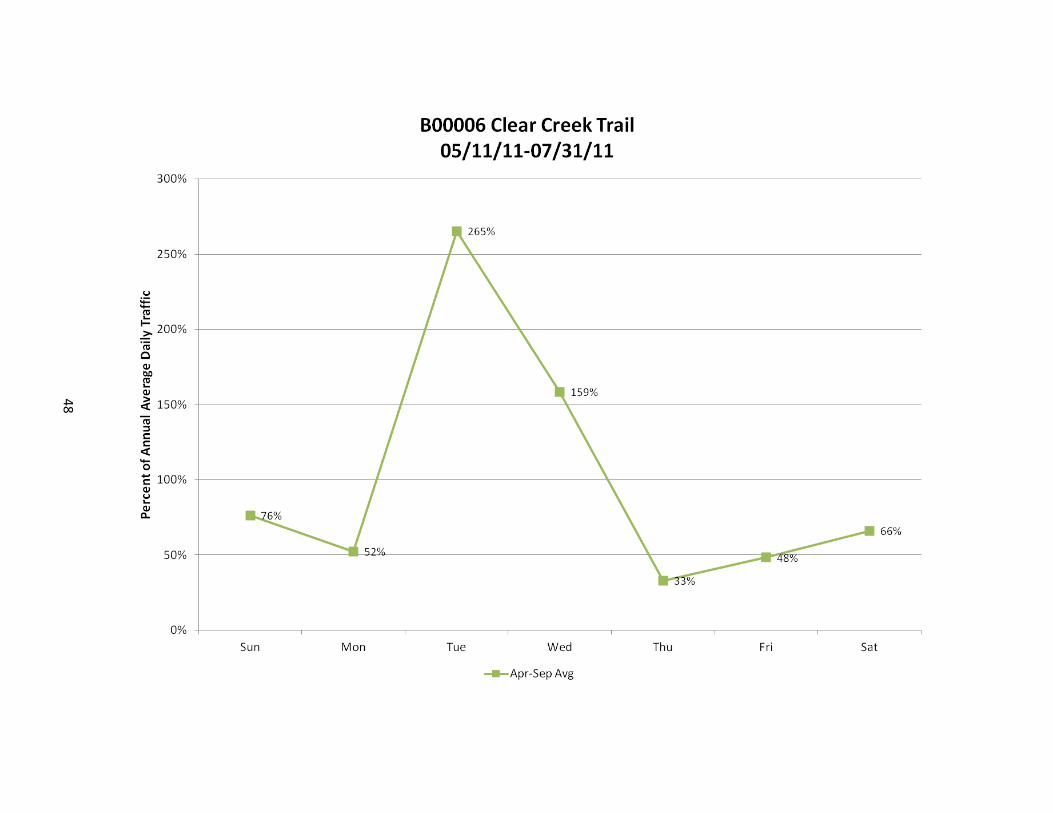
At locations with a high percentage of recreational trips, the day-of-week chart looks like a bowl, with Sunday and Saturday forming the sides of the bowl.
The weekdays form the bottom of the bowl, and results because fewer recreational trips occur during the weekdays.
At locations with many commuting trips and few recreational trips, the day-of-week chart looks like an upside-down bowl.
165%
76%70% 71%
67%
77%
174%
89%
40%46% 44%
39% 42%
117%
258%
119%
100%104%
100%
119%
241%
0%
50%
100%
150%
200%
250%
300%
Sun Mon Tue Wed Thu Fri Sat
Per
cen
t o
f An
nu
al A
vera
ge D
aily
Tra
ffic
B00008 C470 FRONTAGE TRAIL1/1/2010-12/31/2010
Annual Average (all 11 months) Oct-Mar Avg Apr-Sep (no Jun) Avg
7
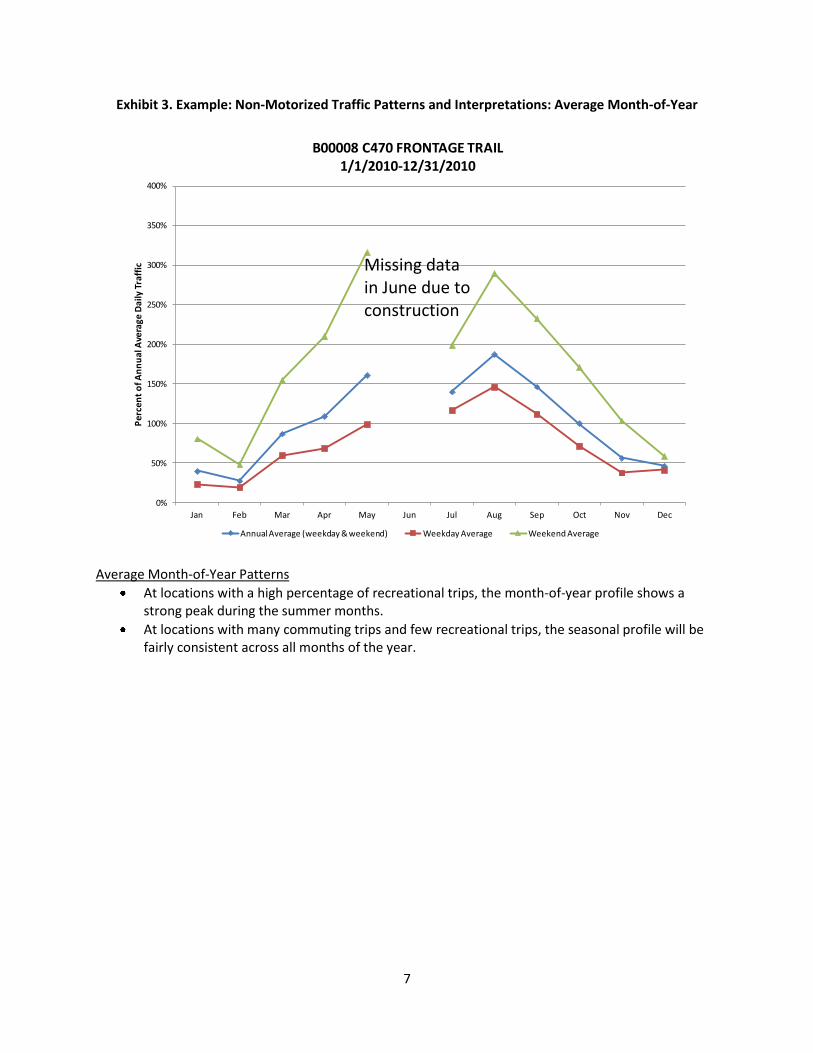
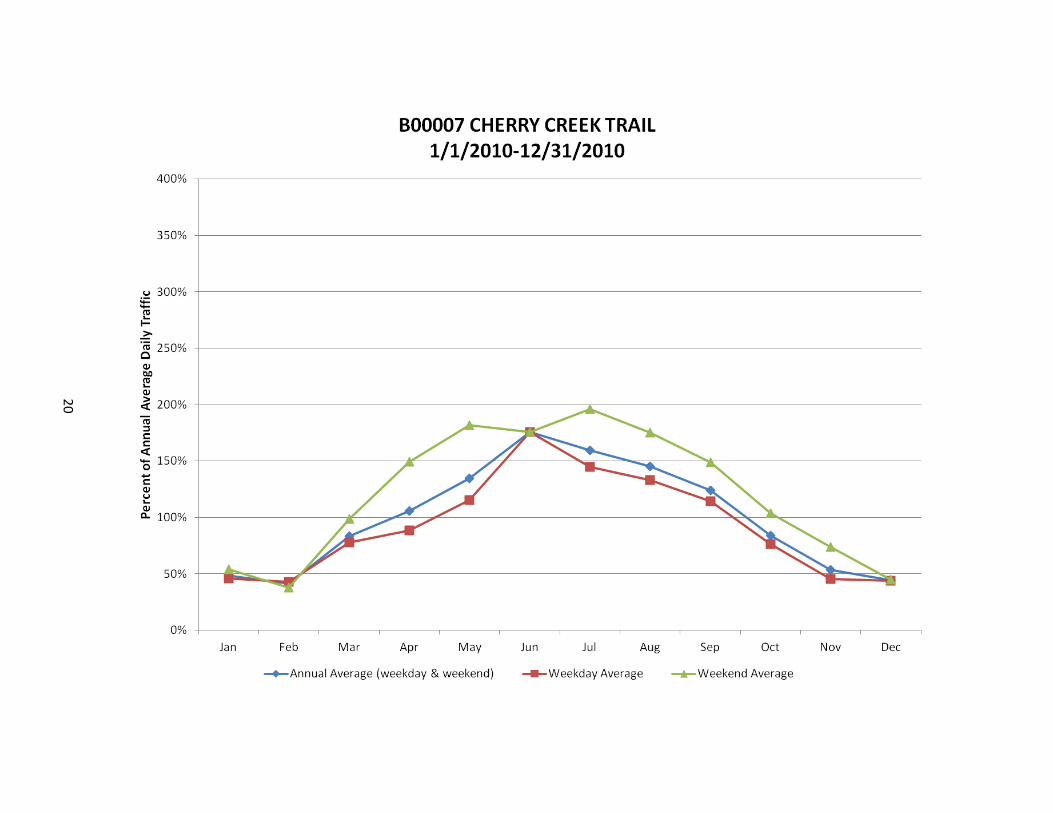
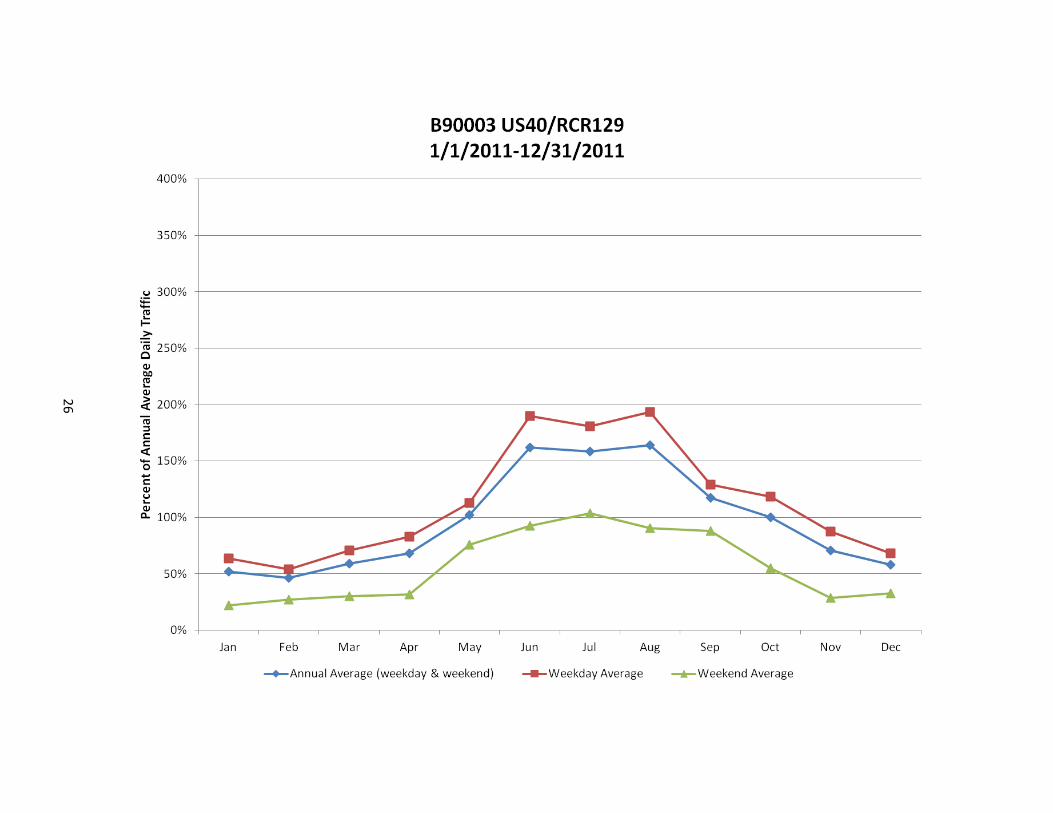
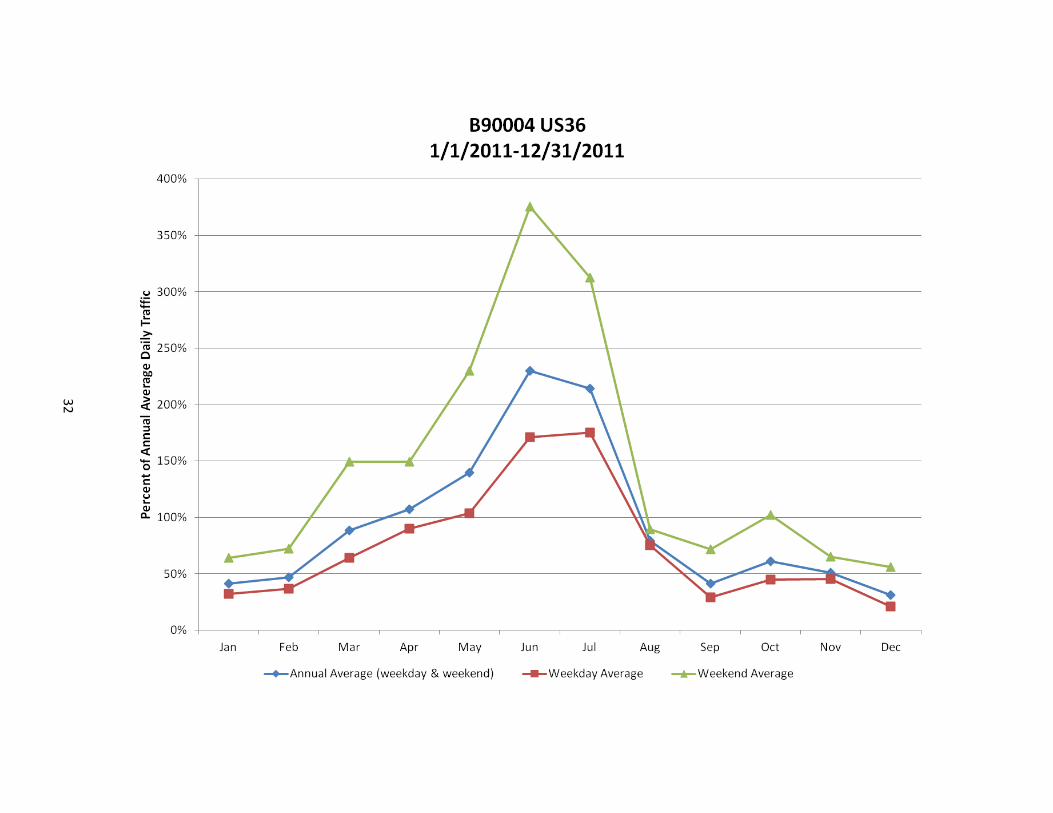
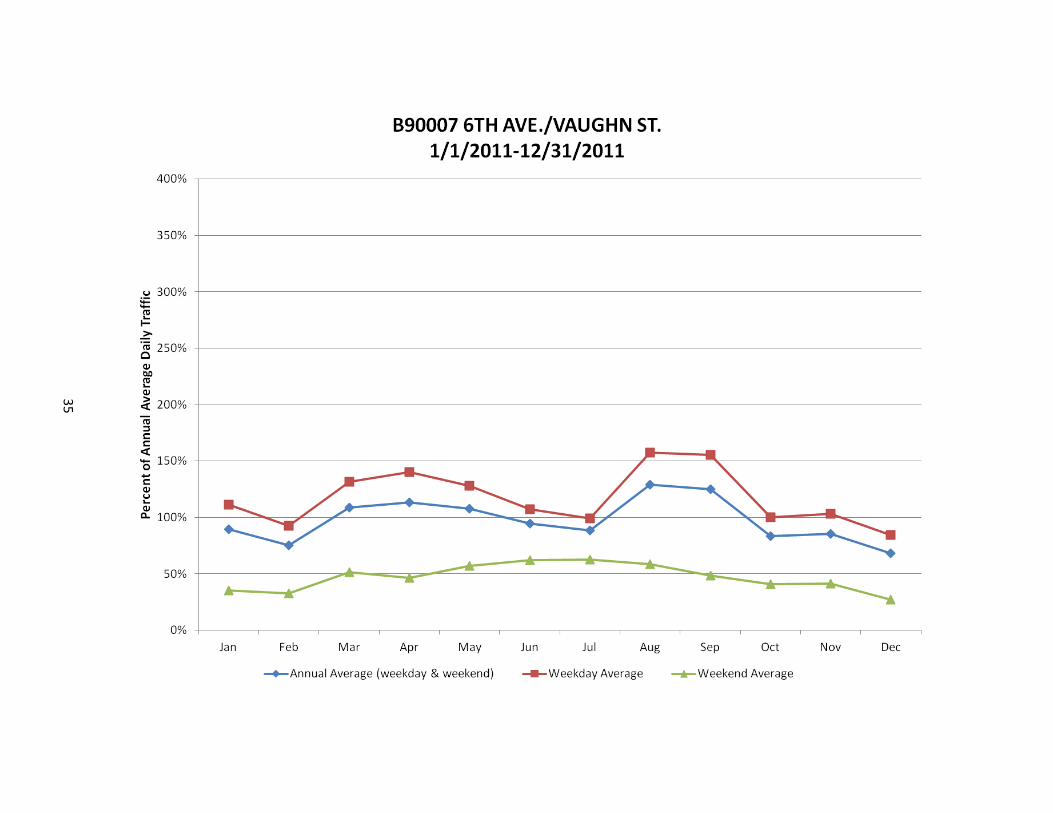
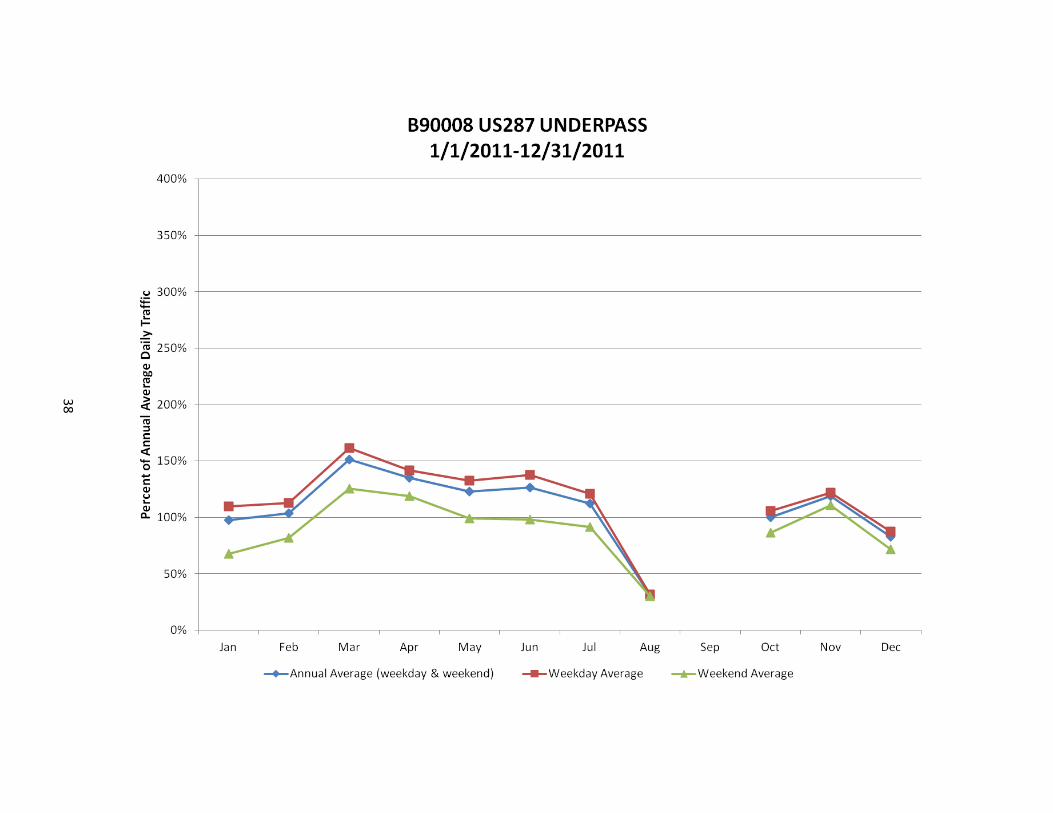
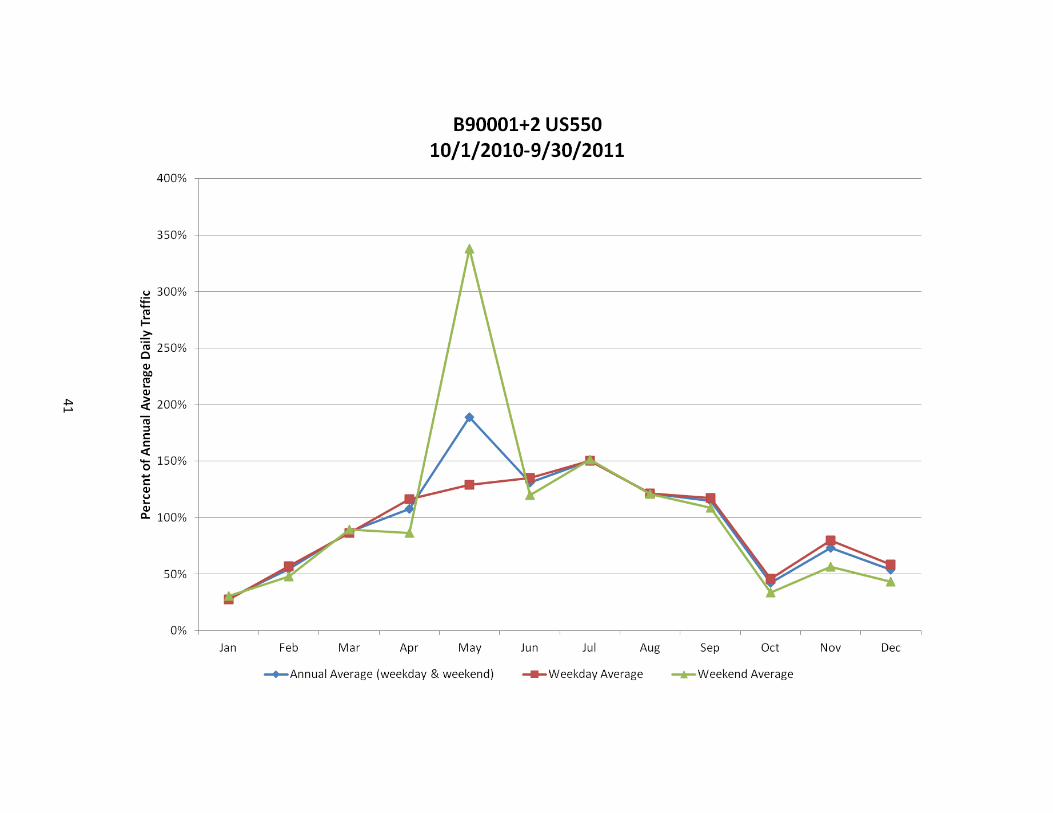
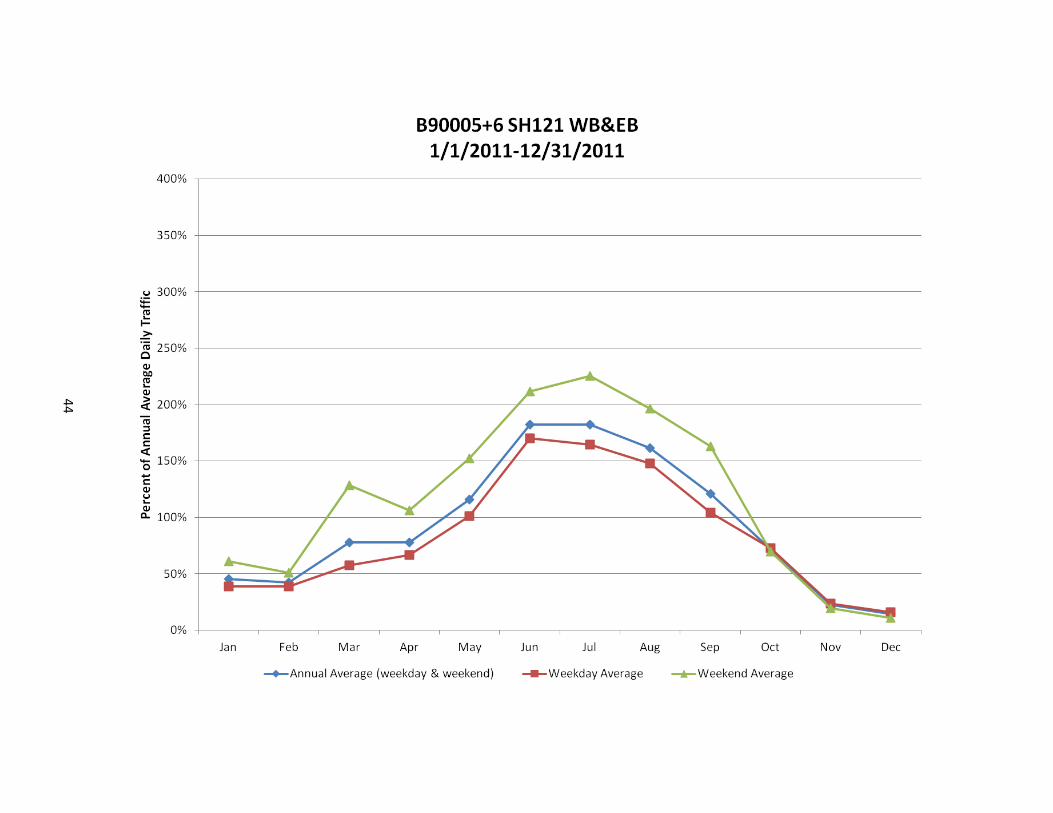
Exhibit 3. Example: Non-Motorized Traffic Patterns and Interpretations: Average Month-of-Year
Average Month-of-Year Patterns
At locations with a high percentage of recreational trips, the month-of-year profile shows a strong peak during the summer months.
At locations with many commuting trips and few recreational trips, the seasonal profile will be fairly consistent across all months of the year.
0%
50%
100%
150%
200%
250%
300%
350%
400%
Jan Feb Mar Apr May Jun Jul Aug Sep Oct Nov Dec
Per
cen
t o
f An
nu
al A
vera
ge D
aily
Tra
ffic
B00008 C470 FRONTAGE TRAIL1/1/2010-12/31/2010
Annual Average (weekday & weekend) Weekday Average Weekend Average
Missing data in June due to construction

8
Recommendations Based on the prevailing traffic patterns seen in Appendix A, three factor groups are recommended for non-motorized traffic data:
1. Commuter and work/school-based trips a. Typically have the highest peaks in the morning and evening. b. Weekday traffic is higher than weekend traffic (upside-down bowl shape). c. Traffic is relatively consistent across all seasons of the year.
2. Recreation/utilitarian
a. Typically peaks only once daily at mid-day, or be evenly distributed throughout the day. b. Weekend traffic is higher than weekday traffic (right-side-up bowl shape). c. Traffic peaks strongly during the months of comfortable outdoor weather.
3. Mixed trip purposes (both commuter and recreation/utilitarian) – has varying levels of these
two different trip purposes, or may include other miscellaneous trip purposes. a. Some peaking during morning and evening rush hour, but also mid-day or after-work
peak. b. Weekday and weekend traffic is comparable (very shallow bowl shape, either right-side-
up or upside-down). c. Traffic peaks gently during the months of comfortable outdoor weather.
With the 8 existing CDOT permanent count locations, this translates to about 2-3 permanent locations per factor group. If/when additional permanent locations are installed, the third category (mixed trip purposes) could be further subdivided into 2-3 more categories, such as:
1. Mixed trips with majority recreation 2. Mixed trips with majority commuter 3. Mixed trips, equal balance recreation and commuter
Based on the traffic profiles for each permanent counter location in Appendix A, the following permanent locations should be assigned to these respective factor groups: Commuter and work/school-based trips
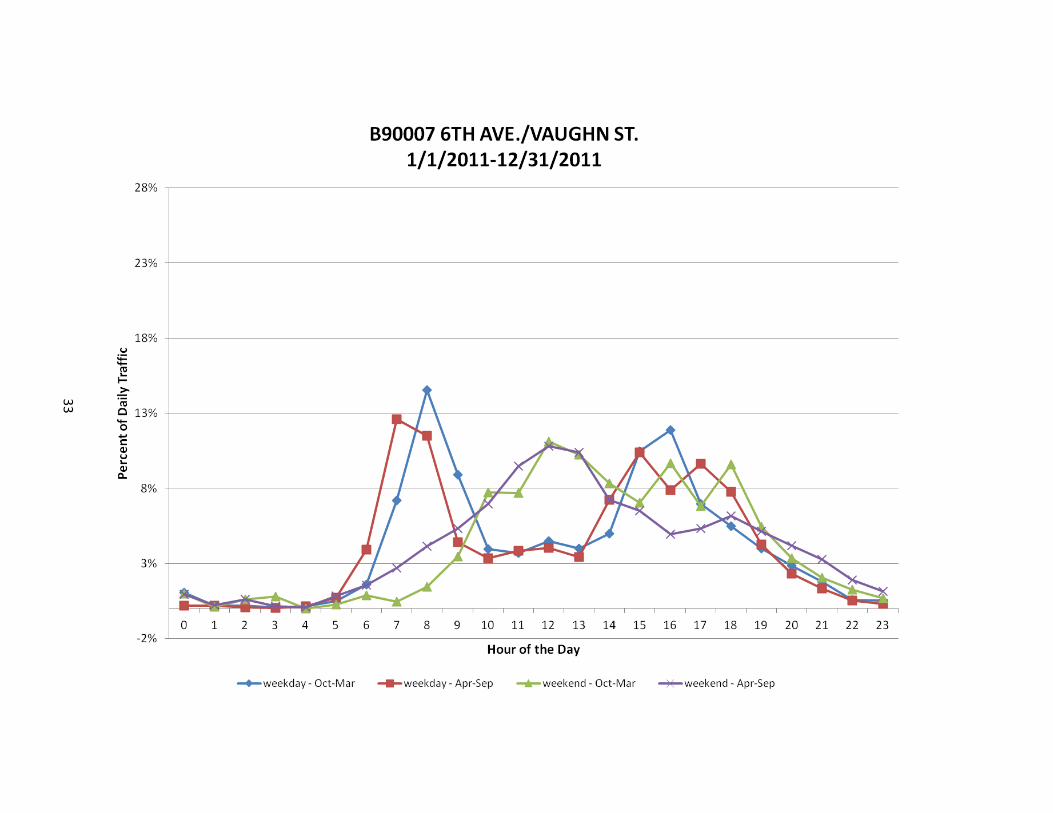
1. B90003, US 40 / RCR 129 (Steamboat Springs) 2. B90007, 6th Avenue/Vaughn Street (Aurora)
Recreation/utilitarian
1. B00008, C470 Frontage Trail (Ken Caryl) 2. B90004, US 36 (Boulder) 3. B90012, US 550 (Durango)
Mixed trip purposes (both commuter and recreation/utilitarian)
1. B00007, Cherry Creek Trail (Denver) 2. B90008, US 287 Underpass (Broomfield) 3. B90056, SH 121 (Arvada)

9
Short-Duration Site Selection Summary Paragraph: Colorado DOT’s existing practice for identifying short-duration sites is consistent with other state and local agency best practices (see section titled “Best Practices for Site Selection”). However, Colorado DOT should differentiate between “special study” (e.g., before-after) counts and established short-duration monitoring sites. “Special study” sites are those at which facility-specific improvements have recently or will soon be made, and are not necessarily representative of overall citywide or regional trends. Conversely, established monitoring sites are locations that are believed to be representative of overall trends. Current Practice of Site Selection with Colorado DOT In terms of current practice, Colorado DOT works with local agencies to identify both permanent and short-duration monitoring sites. The site selection process is informal and undocumented and uses qualitative criteria and local knowledge of bicycling and walking patterns and travel. The highest priority sites are typically designated as permanent monitoring sites, and other sites are considered for short-duration monitoring. There appear to be 2 overall criteria for selecting these non-motorized sites:
1. The locations already experience high non-motorized use (relative to other locations within the city or region); or,
2. The locations are near upcoming facility improvements and relatively high use is expected once these improvements are completed.
In the first case, the non-motorized counts are collected to document high or growing use, with facility improvements already in place. These sites are most similar to traditional traffic monitoring sites. With an adequate sampling plan, these counts could be expanded to represent city or regional use and trends. In the second case, the non-motorized counts are collected to capture the before-and-after effects of upcoming or recently-completed facility improvements. In traffic monitoring terms, this before-and-after case is typically referred to as a “special study” or “special count.” In both of these cases, the counts are valuable, but it is important to recognize that the end-use applications are subtly different. The trends at “special study” sites are relevant for other specific locations at which facility improvements are planned. However, these “special study” sites should not be extrapolated to a city or regional level as part of an overall trend monitoring process. Because of the differences in these two types of counts, it is important that Colorado DOT properly identify those short-duration counts that are considered to be special study counts collected to specifically document changes due to facility construction and/or improvements. As with the site selection, the designation of special study counts will be qualitative at first, but consistency will develop with more experience. Best Practices for Site Selection The following represents best practices for site selection for non-motorized traffic monitoring. These practices have been derived from a draft currently being reviewed for FHWA’s Traffic Monitoring Guide.

10
Similar to motorized traffic monitoring, the majority of non-motorized locations will be monitored using short-duration counts. However, in some non-motorized monitoring programs, the distinction between short-duration counts and “special needs” counts is not clearly defined. That is, short-duration counts are performed on specific facilities based on certain needs for that facility (e.g., before-after), but it is not known whether that specific facility is representative of other facilities and can therefore be expanded to a sub-area or regional estimate of overall non-motorized travel. Unfortunately, clear guidance does not yet exist on this “statistical representation” issue and one will have to use their best judgment in determining which “special needs” counts also can be used to represent sub-area or regional travel estimates and trends. For motorized traffic, state DOTs have a short-duration data program that provides traffic data for all roads on their state highway system. The same goal for non-motorized traffic data may not be feasible, especially since most non-motorized travel occurs off of the state highway system, on lower-volume and lower-speed city streets, shared use paths, and pedestrian facilities. The prevailing practice for collecting short-duration non-motorized traffic data has been to focus on targeted locations where activity levels and professional interest are the highest. Although this non-random site selection may not yield a statistically-representative regional estimate, it provides a more efficient use of limited data collection resources (e.g., random samples are likely to result in many locations with little to no non-motorized use). The following National Bicycle and Pedestrian Documentation (NBPD) Project criteria4 are recommended for short-duration counts:
Pedestrian and bicycle activity areas or corridors (downtowns, near schools, parks, etc.);
Representative locations in urban, suburban, and rural locations;
Key corridors that can be used to gauge the impacts of future improvements;
Locations where counts have been conducted historically;
Locations where there are ongoing counts being conducted by other agencies through a variety of means, including videotaping;
Gaps, “pinch points,” and locations that are operationally difficult for bicyclists and pedestrians (potential improvement areas);
Locations where bicyclist and pedestrian collision numbers are high; and
Select locations that meet as many of the criteria as possible. The number of short-duration count locations will depend on the available budget and the planned uses of the count data. To date, there has been no definitive analysis of, or guidance for, determining the required number of short-duration count locations. For most regions getting started with counting non-motorized travel, the short count program is best developed by working with other key stakeholders interested in collecting and using these data. By discussing needs and budgets, this group can identify and prioritize the “special needs” short count locations which the available data collection budget can afford to collect. (These same discussions should also identify those key regional facilities that should be used for early deployment of permanent counters that will then be used to expand the short count data into estimates of annual and peak use.) These special needs counts will then provide the data needed to guide the development of a more statistically valid sample of short count locations. These more
4 See “Data Collection Instructions” at http://bikepeddocumentation.org/downloads/.

11
statistically rigorous sample designs will become possible in the future as more data are collected and as research is performed in the coming years. Once general monitoring locations have been identified, the most suitable counter positioning must be determined. The NBPD Project recommended the following for counter positioning:
For multi-use paths and parks, locations near the major access points are best.
For on-street bikeways, locations where there are few if any alternative parallel routes are best.
For traditional downtown areas, a location near a transit stop or in the center of downtown is best.
For shopping malls, a location near the main entrance and transit stop is best. Count at one access point.
For employment areas, either on the main access roadway or near off-street multi-use paths is best. Count at one access point, typically a sidewalk and street.
For residential areas, locations near higher density developments or near parks and schools are the best. Count at one access point, typically a sidewalk and street.
In many cases, these recommended counter positioning locations will result in the highest non-motorized traffic volumes. Given limited data collection resources and specific data uses, this focus on high-use locations may be appropriate. However, one should recognize that these high-use locations may represent a biased estimate of use levels and trends for an entire city or state. Enhance the Quality Assurance/Quality Control (QA/QC) Process Summary Paragraph: Colorado DOT should improve the QA/QC process for non-motorized data by: 1) using select automated QC rules available through TRADAS; 2) performing periodic validation counts to develop an occlusion adjustment factor for sidefire infrared sensors; and 3) continuing to use targeted visual review. Discussion of Recommendations Data quality is important for any application, as it affects the credibility and usability of the data for basic agency decisions. Quality assessment of non-motorized traffic data is more difficult than motorized traffic data because:
1. Non-motorized traffic data is typically a smaller magnitude and therefore has greater percentage changes over time;
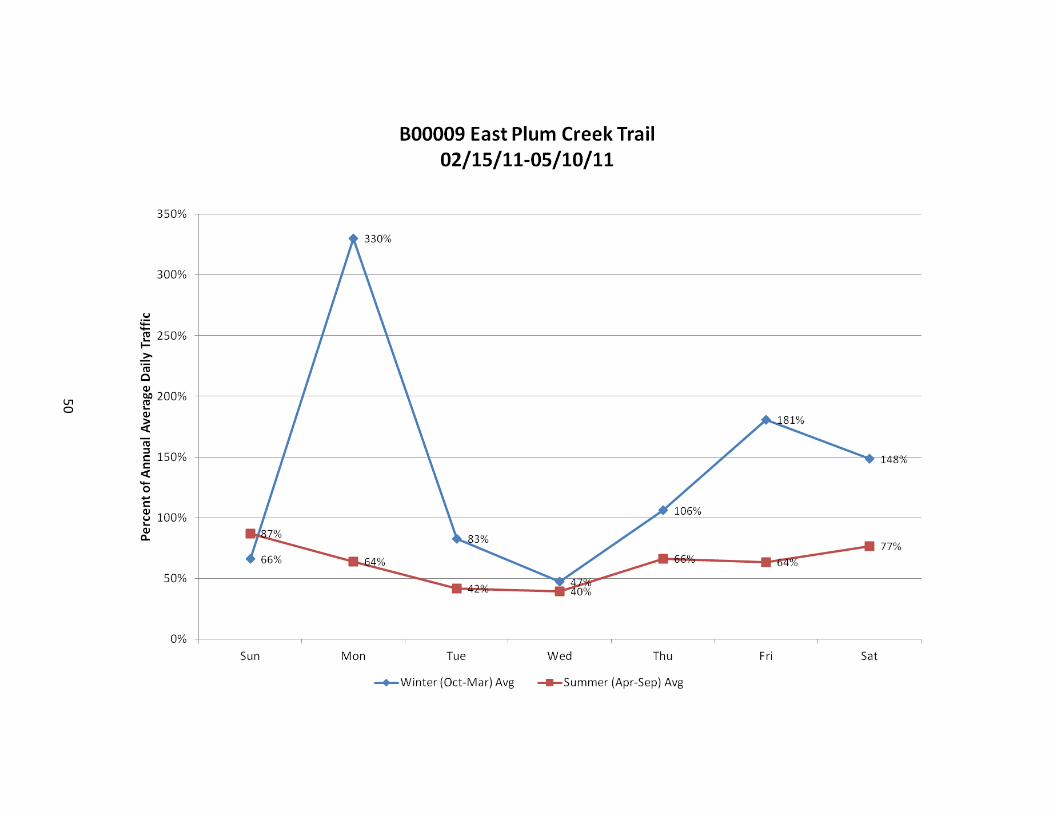
2. Non-motorized traffic typically is more variable in several time dimensions. The quality assurance process for the Colorado DOT non-motorized data is currently manual and is focused on identifying data that are obviously erroneous. TTI reviewed the non-motorized data in Task 2 of this project and identified several examples of data values that are suspect (see Exhibits 4 and 5) and should be flagged as such in Colorado DOT’s Traffic Data Warehouse. In these two examples, the non-motorized counts (i.e. greater than 10,000 or more) are very unlikely or impossible, especially since all other days’ counts are much lower. Therefore, there is a high probability that these data values are errors.

12
Exhibit 4. Suspect Data that are Most Likely Data Errors, Example 1
Exhibit 5. Suspect Data that are Most Likely Data Errors, Example 2
0
2000
4000
6000
8000
10000
12000
14000
16000
18000
20000
2/1
5/2
01
1
2/1
7/2
01
1
2/1
9/2
01
1
2/2
1/2
01
1
2/2
3/2
01
1
2/2
5/2
01
1
2/2
7/2
01
1
3/1
/20
11
3/3
/20
11
3/5
/20
11
3/7
/20
11
3/9
/20
11
3/1
1/2
01
1
3/1
3/2
01
1
3/1
5/2
01
1
3/1
7/2
01
1
3/1
9/2
01
1
3/2
1/2
01
1
3/2
3/2
01
1
3/2
5/2
01
1
3/2
7/2
01
1
3/2
9/2
01
1
3/3
1/2
01
1
4/2
/20
11
4/4
/20
11
4/6
/20
11
4/8
/20
11
4/1
0/2
01
1
4/1
2/2
01
1
4/1
4/2
01
1
4/1
6/2
01
1
4/1
8/2
01
1
4/2
0/2
01
1
4/2
2/2
01
1
4/2
4/2
01
1
4/2
6/2
01
1
4/2
8/2
01
1
4/3
0/2
01
1
5/2
/20
11
5/4
/20
11
5/6
/20
11
5/8
/20
11
5/1
0/2
01
1
B00009 East Plum Creek Trail02/15/11-05/10/11
Sum of TOTAL
Sum of IN
Sum of OUT
0
5000
10000
15000
20000
25000
30000
35000
5/1
1/2
01
1
5/1
3/2
01
1
5/1
5/2
01
1
5/1
7/2
01
1
5/1
9/2
01
1
5/2
1/2
01
1
5/2
3/2
01
1
5/2
5/2
01
1
5/2
7/2
01
1
5/2
9/2
01
1
5/3
1/2
01
1
6/2
/20
11
6/4
/20
11
6/6
/20
11
6/8
/20
11
6/1
0/2
01
1
6/1
2/2
01
1
6/1
4/2
01
1
6/1
6/2
01
1
6/1
8/2
01
1
6/2
0/2
01
1
6/2
2/2
01
1
6/2
4/2
01
1
6/2
6/2
01
1
6/2
8/2
01
1
6/3
0/2
01
1
7/2
/20
11
7/4
/20
11
7/6
/20
11
7/8
/20
11
7/1
0/2
01
1
7/1
2/2
01
1
7/1
4/2
01
1
7/1
6/2
01
1
7/1
8/2
01
1
7/2
0/2
01
1
7/2
2/2
01
1
7/2
4/2
01
1
7/2
6/2
01
1
7/2
8/2
01
1
7/3
0/2
01
1
Co
un
ts
B00006 Clear Creek Trail05/11/11-07/31/11
Sum of TOTAL
Sum of IN
Sum of OUT
High daily counts are most likely errors
High daily counts are most likely errors
13
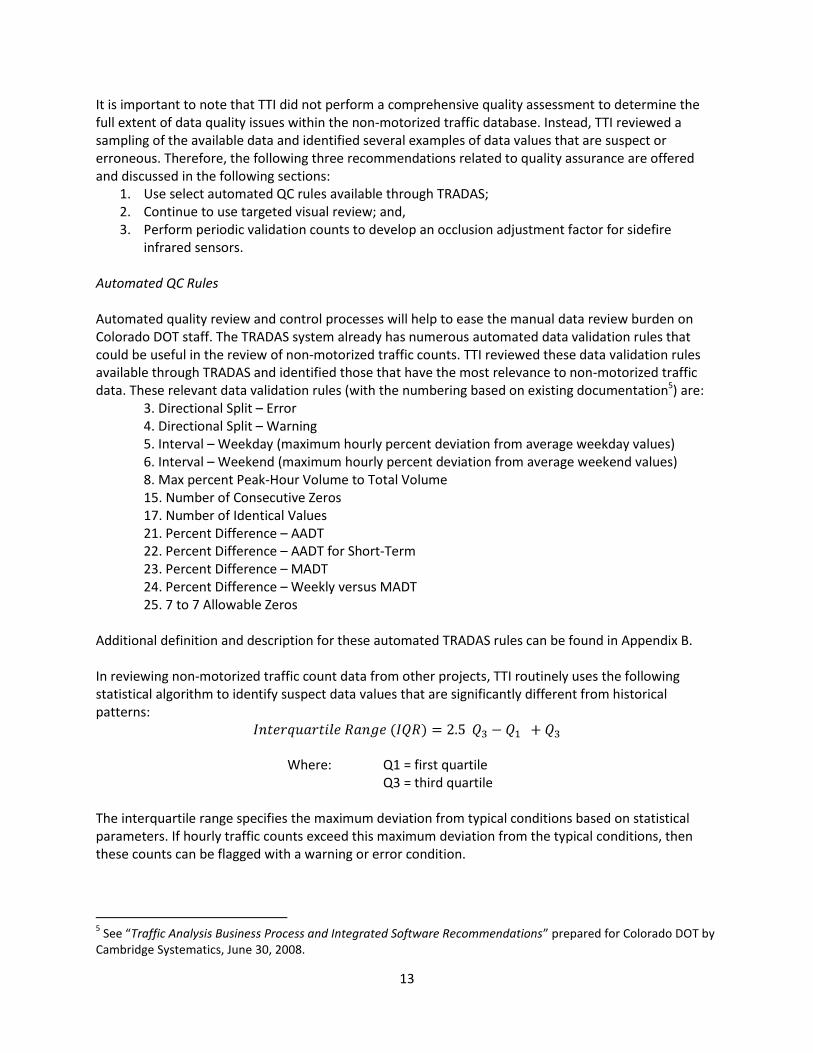
It is important to note that TTI did not perform a comprehensive quality assessment to determine the full extent of data quality issues within the non-motorized traffic database. Instead, TTI reviewed a sampling of the available data and identified several examples of data values that are suspect or erroneous. Therefore, the following three recommendations related to quality assurance are offered and discussed in the following sections:
1. Use select automated QC rules available through TRADAS; 2. Continue to use targeted visual review; and, 3. Perform periodic validation counts to develop an occlusion adjustment factor for sidefire
infrared sensors. Automated QC Rules Automated quality review and control processes will help to ease the manual data review burden on Colorado DOT staff. The TRADAS system already has numerous automated data validation rules that could be useful in the review of non-motorized traffic counts. TTI reviewed these data validation rules available through TRADAS and identified those that have the most relevance to non-motorized traffic data. These relevant data validation rules (with the numbering based on existing documentation5) are:
3. Directional Split – Error 4. Directional Split – Warning 5. Interval – Weekday (maximum hourly percent deviation from average weekday values) 6. Interval – Weekend (maximum hourly percent deviation from average weekend values) 8. Max percent Peak-Hour Volume to Total Volume 15. Number of Consecutive Zeros 17. Number of Identical Values 21. Percent Difference – AADT 22. Percent Difference – AADT for Short-Term 23. Percent Difference – MADT 24. Percent Difference – Weekly versus MADT 25. 7 to 7 Allowable Zeros
Additional definition and description for these automated TRADAS rules can be found in Appendix B. In reviewing non-motorized traffic count data from other projects, TTI routinely uses the following statistical algorithm to identify suspect data values that are significantly different from historical patterns:
Where: Q1 = first quartile Q3 = third quartile
The interquartile range specifies the maximum deviation from typical conditions based on statistical parameters. If hourly traffic counts exceed this maximum deviation from the typical conditions, then these counts can be flagged with a warning or error condition.
5 See “Traffic Analysis Business Process and Integrated Software Recommendations” prepared for Colorado DOT by
Cambridge Systematics, June 30, 2008.

14
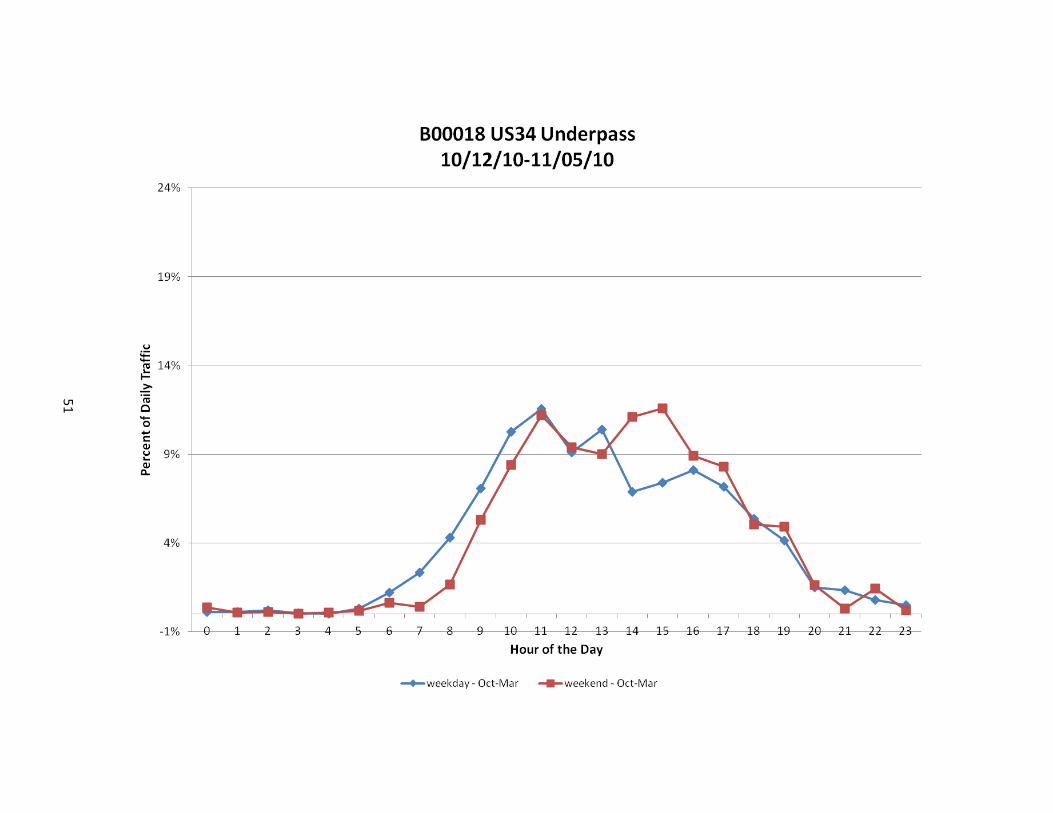
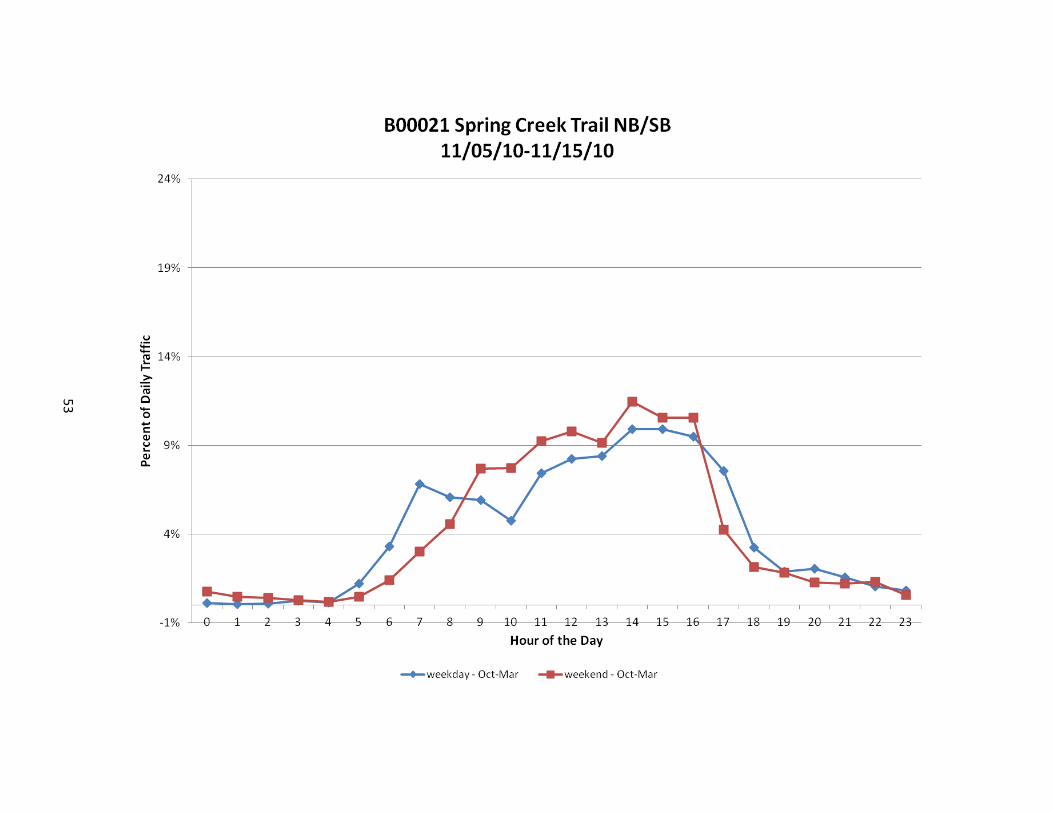
It should be noted that this interquartile range is the same principle as the #5 and #6 TRADAS Interval rules for weekday and weekend conditions. However, the interquartile range provides a statistical basis from which to select the interval cutoff values in TRADAS. Therefore, in implementing the TRADAS data validation rules, Colorado DOT should use the interquartile range method to as a starting point for selecting interval cutoff values. Use of Targeted Manual Visual Review Using automated quality checking processes will help to catch obvious data errors; however, targeted visual review by trained staff can be extremely valuable in identifying suspect data that may pass through the automated processes undetected. The intent should not be to review all collected data, but to visually review random samples of the incoming non-motorized data to ensure that the automated quality control processes are functioning properly. Consider an analogy with a factory – not all widgets rolling off an assembly line can be tested for quality standards. Automated processes are in place, and then quality control managers will randomly pull a small sample of widgets for more in-depth testing or visual inspection. There are several chart graphics that can be used to visually review the non-motorized traffic count data. It is important to review the data at a detailed enough level such that erroneous data values can be identified before they become averaged and “washed out” in summary statistics. At the same time, the review of extremely detailed data limits the number of locations that can be visually reviewed. In TTI’s analysis of non-motorized data, we have identified several chart graphics that have proven useful in visually reviewing the quality of non-motorized traffic counts. These charts are shown as Exhibits 6 and 7.

15
Exhibit 6. Example 1, Chart Graphic Used to Visually Review Non-Motorized Traffic Counts
Exhibit 7. Example 2, Chart Graphic Used to Visually Review Non-Motorized Traffic Counts

16
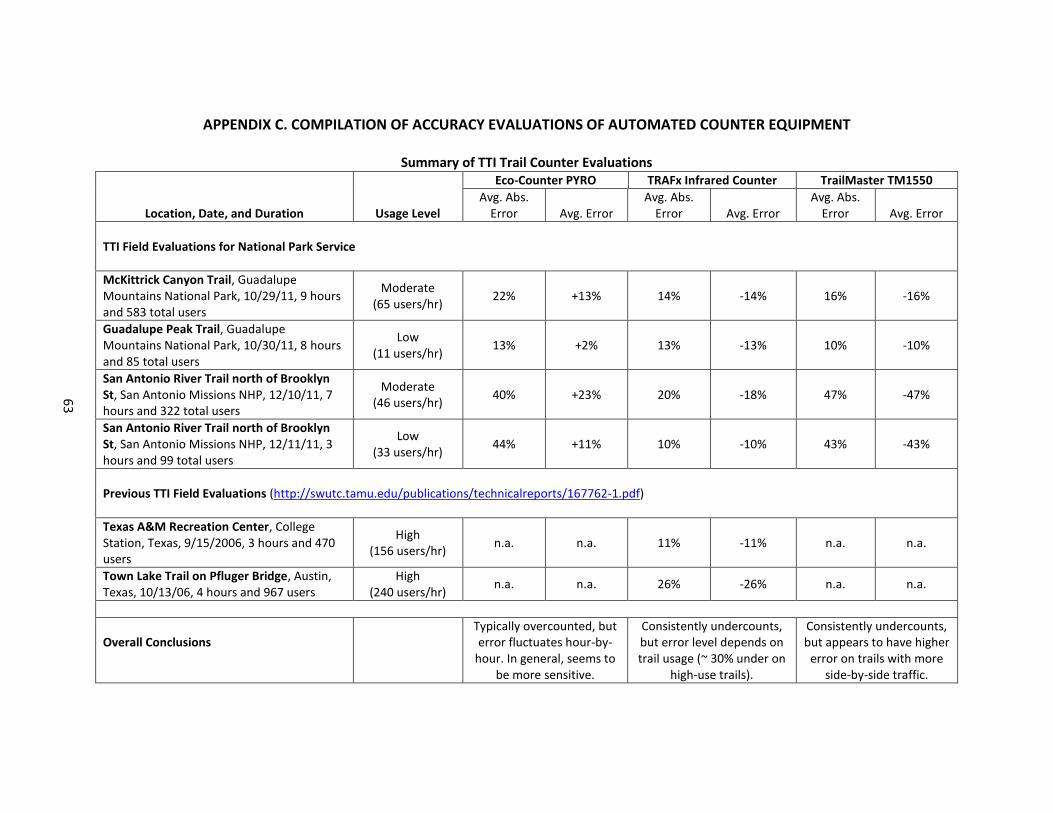
Adjustment Factors for Occlusion and Undercounting Past research has indicated that some types of automated counting equipment have difficultly accurately counting non-motorized users that are traveling side-by-side (see Appendix C for compilation of accuracy evaluation results). In particular, side-mounted infrared sensors are prone to occlusions by people walking or bicycling side-by-side. With moderate non-motorized traffic levels, the undercounting can ranges from about 10 to 20 percent. On heavily used travel ways, the undercounting of some passive infrared trail counters can approach 40 percent. Currently, however, the CDOT data system does not account for the systematic undercounting that is prevalent with infrared trail counters. Several non-motorized data collection efforts have applied an adjustment factor to counts that are collected with automated infrared trail counters, based on locally documented undercounting levels:
Delaware Valley Regional Planning Commission (i.e., the Philadelphia MPO) performed a manual validation procedure for their infrared counters at five sites, with ten hours at each site.6 Their occlusion adjustment factor was determined to be about 6 percent, which is now applied to all automated pedestrian counts.
In a Caltrans research project, Alta Planning + Design and University of California, Berkeley collected extensive non-motorized counts in San Diego County to develop a travel demand estimation tool.7 They conducted manual validation of their automated passive infrared counter and found undercounting that ranged from 6 to 31 percent. The counts were then adjusted based on this known undercounting bias.
In a project for the San Francisco County Transportation Authority, the University of California, Berkeley and Fehr and Peers collected non-motorized intersection approach volumes to determine safety exposure.8 Based on previous validation studies, the project team applied a “sliding-scale” adjustment factor that was based upon a regression analysis.
Switzerland Mobility (Schwiez Mobil, http://www.schweizmobil.ch) conducts regular bike counts using automated radar equipment and routinely applies adjustment factors that can occur with miscounting of vehicle, pedestrians, and trail and street users.
Therefore, TTI recommends that Colorado DOT conduct field validation to document whether undercounting is an issue with Colorado DOT automated non-motorized counters, and if so, the magnitude of the undercounting issues. The field validation is a simple process whereby human observers manually count non-motorized traffic as a benchmark, which is then compared to the counts from the automated equipment. Fifteen-minute or hourly intervals are commonly used for comparisons, and a 1-2 hour duration is typically sufficient to get an estimate of consistent undercounting. The manual benchmarking counts are typically taken during light and heavy traffic times, such that an average adjustment factor is applied for continuous counts.
6 Email from Scott Brady ([email protected]), June 29, 2012.
7 Jones, M.G. et. al. Seamless Travel: Measuring Bicycle and Pedestrian Activity in San Diego County and its
Relationship to Land Use, Transportation, Safety, and Facility Type. Caltrans Task Order 6117, UC Berkeley Safe Transportation Research & Education Center, 2010. 8 Schneider, R. et al. Development and Application of the San Francisco Pedestrian Intersection Volume Model.
Paper to be published in forthcoming Transportation Research Record.
17
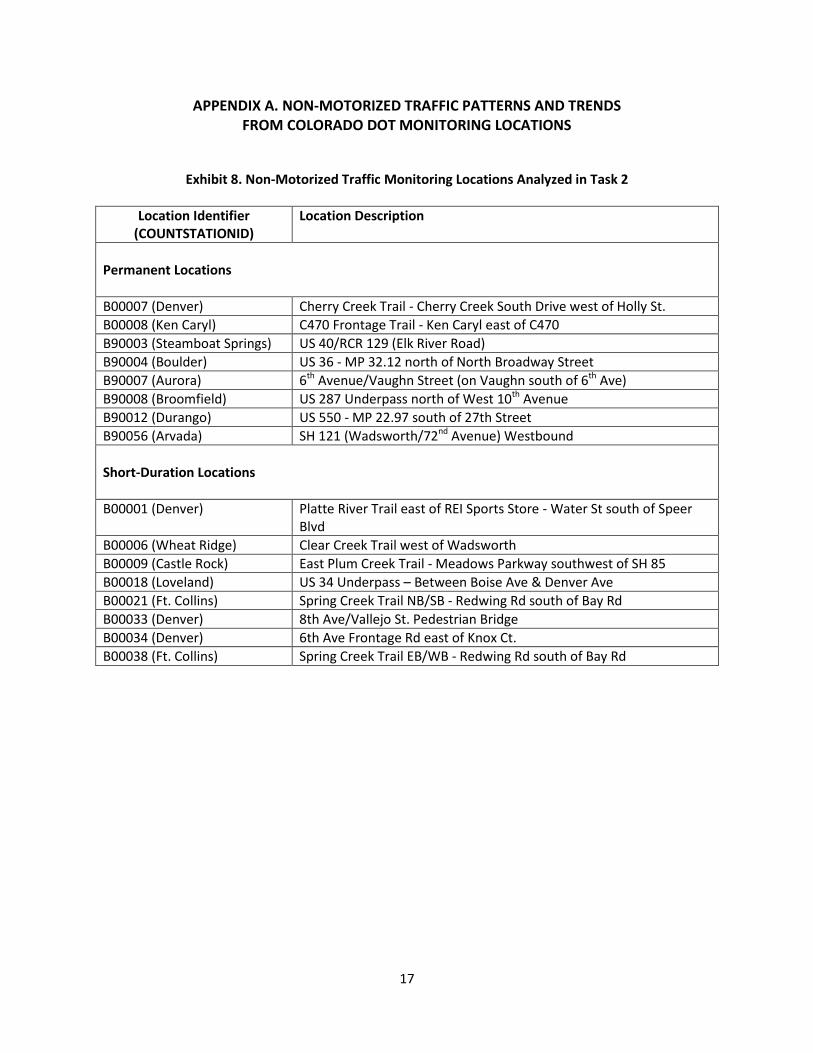
APPENDIX A. NON-MOTORIZED TRAFFIC PATTERNS AND TRENDS FROM COLORADO DOT MONITORING LOCATIONS
Exhibit 8. Non-Motorized Traffic Monitoring Locations Analyzed in Task 2
Location Identifier (COUNTSTATIONID)
Location Description
Permanent Locations
B00007 (Denver) Cherry Creek Trail - Cherry Creek South Drive west of Holly St.
B00008 (Ken Caryl) C470 Frontage Trail - Ken Caryl east of C470
B90003 (Steamboat Springs) US 40/RCR 129 (Elk River Road)
B90004 (Boulder) US 36 - MP 32.12 north of North Broadway Street
B90007 (Aurora) 6th Avenue/Vaughn Street (on Vaughn south of 6th Ave)
B90008 (Broomfield) US 287 Underpass north of West 10th Avenue
B90012 (Durango) US 550 - MP 22.97 south of 27th Street
B90056 (Arvada) SH 121 (Wadsworth/72nd Avenue) Westbound
Short-Duration Locations
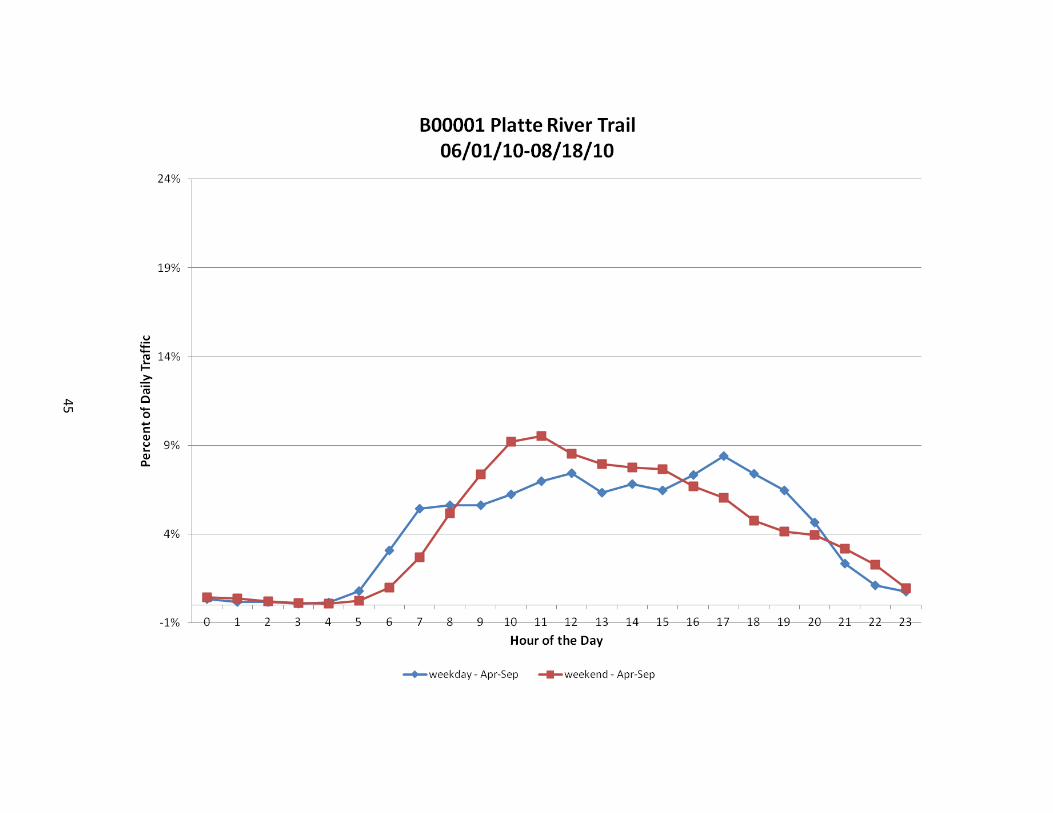
B00001 (Denver) Platte River Trail east of REI Sports Store - Water St south of Speer Blvd
B00006 (Wheat Ridge) Clear Creek Trail west of Wadsworth
B00009 (Castle Rock) East Plum Creek Trail - Meadows Parkway southwest of SH 85
B00018 (Loveland) US 34 Underpass – Between Boise Ave & Denver Ave
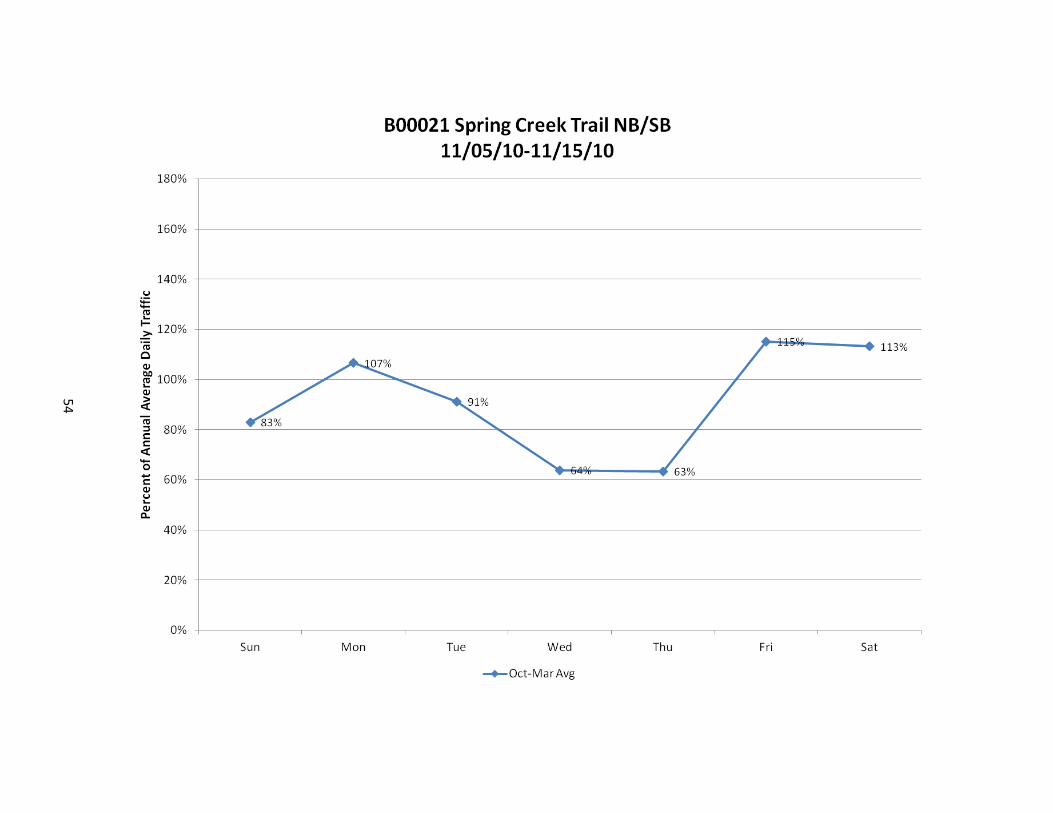
B00021 (Ft. Collins) Spring Creek Trail NB/SB - Redwing Rd south of Bay Rd
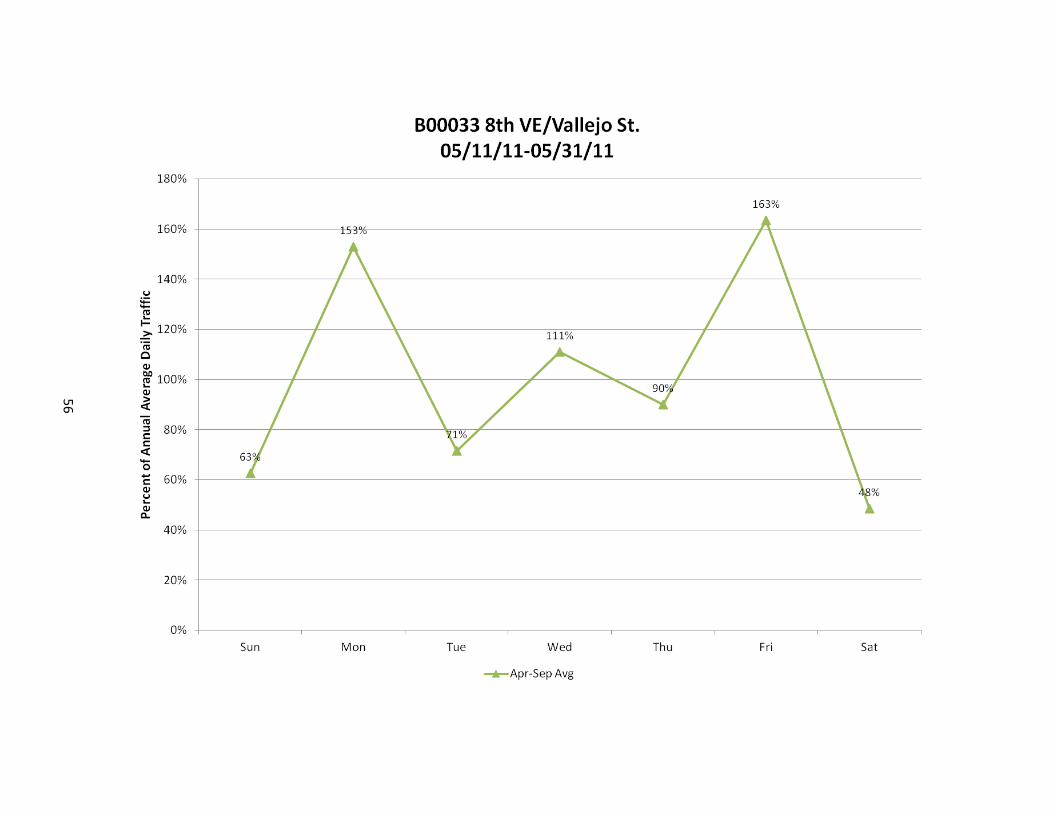
B00033 (Denver) 8th Ave/Vallejo St. Pedestrian Bridge
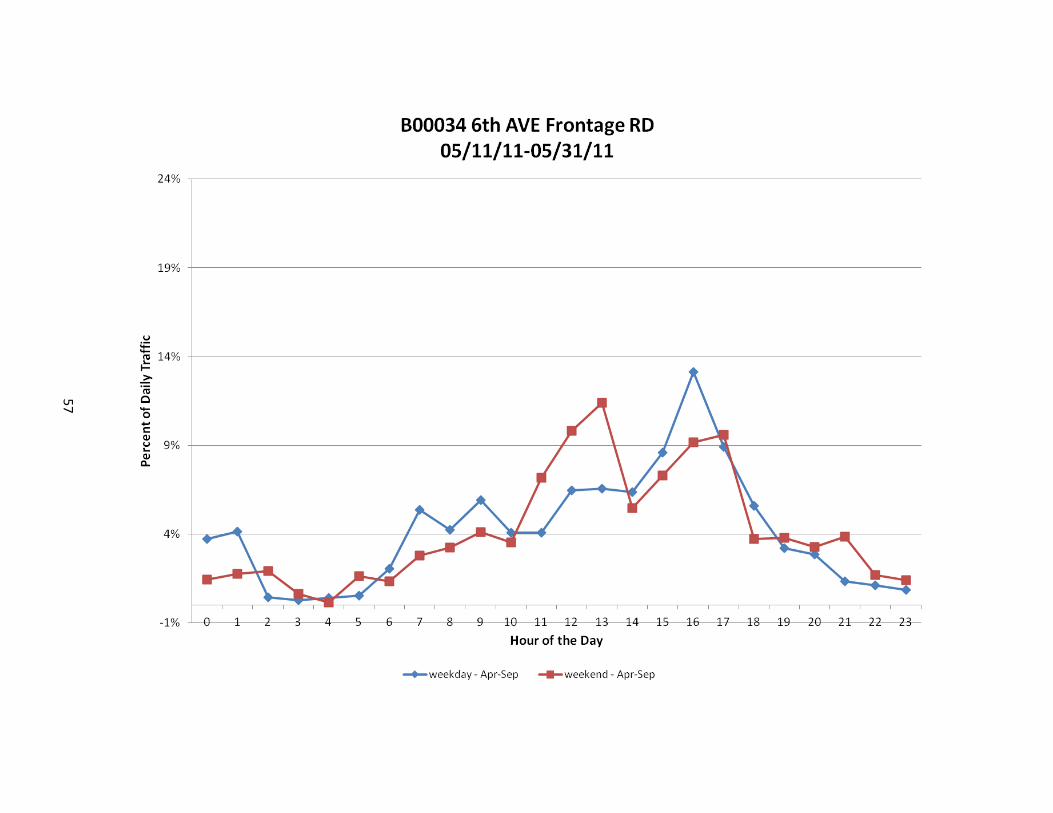
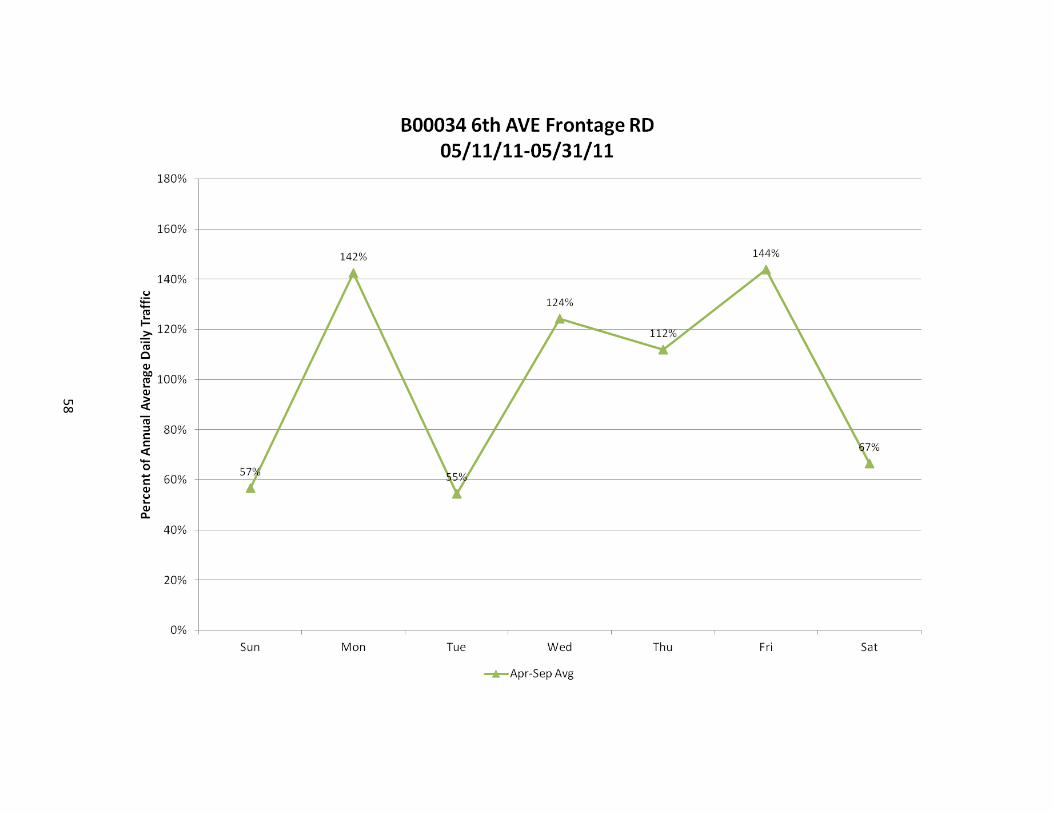
B00034 (Denver) 6th Ave Frontage Rd east of Knox Ct.
B00038 (Ft. Collins) Spring Creek Trail EB/WB - Redwing Rd south of Bay Rd
18
19
20
21
22
23
Missing data in June due to construction
24
25
26
27

28

29

30
31
32
33
34
35
36
37
38
39
40
41
42
43
44
45
46
47
48
49
50
51

52
53
54
55
56
57
58
59
60
61
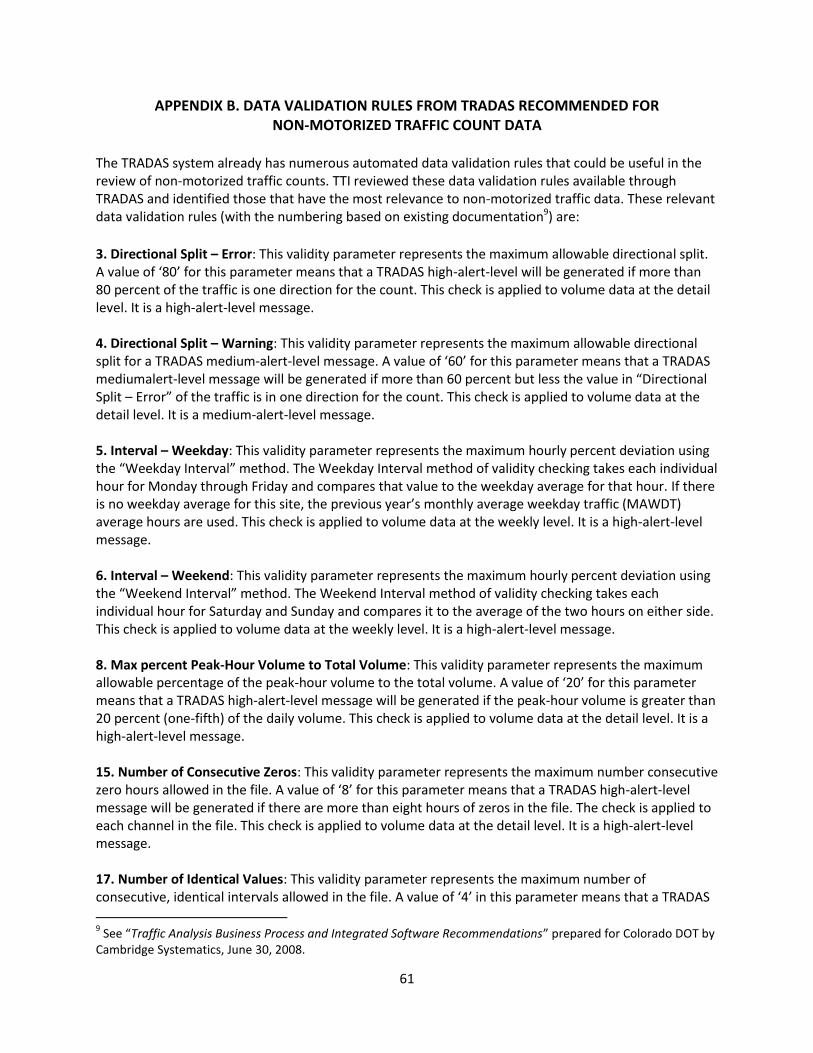
APPENDIX B. DATA VALIDATION RULES FROM TRADAS RECOMMENDED FOR NON-MOTORIZED TRAFFIC COUNT DATA
The TRADAS system already has numerous automated data validation rules that could be useful in the review of non-motorized traffic counts. TTI reviewed these data validation rules available through TRADAS and identified those that have the most relevance to non-motorized traffic data. These relevant data validation rules (with the numbering based on existing documentation9) are:
3. Directional Split – Error: This validity parameter represents the maximum allowable directional split. A value of ‘80’ for this parameter means that a TRADAS high-alert-level will be generated if more than 80 percent of the traffic is one direction for the count. This check is applied to volume data at the detail level. It is a high-alert-level message. 4. Directional Split – Warning: This validity parameter represents the maximum allowable directional split for a TRADAS medium-alert-level message. A value of ‘60’ for this parameter means that a TRADAS mediumalert-level message will be generated if more than 60 percent but less the value in “Directional Split – Error” of the traffic is in one direction for the count. This check is applied to volume data at the detail level. It is a medium-alert-level message. 5. Interval – Weekday: This validity parameter represents the maximum hourly percent deviation using the “Weekday Interval” method. The Weekday Interval method of validity checking takes each individual hour for Monday through Friday and compares that value to the weekday average for that hour. If there is no weekday average for this site, the previous year’s monthly average weekday traffic (MAWDT) average hours are used. This check is applied to volume data at the weekly level. It is a high-alert-level message. 6. Interval – Weekend: This validity parameter represents the maximum hourly percent deviation using the “Weekend Interval” method. The Weekend Interval method of validity checking takes each individual hour for Saturday and Sunday and compares it to the average of the two hours on either side. This check is applied to volume data at the weekly level. It is a high-alert-level message. 8. Max percent Peak-Hour Volume to Total Volume: This validity parameter represents the maximum allowable percentage of the peak-hour volume to the total volume. A value of ‘20’ for this parameter means that a TRADAS high-alert-level message will be generated if the peak-hour volume is greater than 20 percent (one-fifth) of the daily volume. This check is applied to volume data at the detail level. It is a high-alert-level message. 15. Number of Consecutive Zeros: This validity parameter represents the maximum number consecutive zero hours allowed in the file. A value of ‘8’ for this parameter means that a TRADAS high-alert-level message will be generated if there are more than eight hours of zeros in the file. The check is applied to each channel in the file. This check is applied to volume data at the detail level. It is a high-alert-level message. 17. Number of Identical Values: This validity parameter represents the maximum number of consecutive, identical intervals allowed in the file. A value of ‘4’ in this parameter means that a TRADAS
9 See “Traffic Analysis Business Process and Integrated Software Recommendations” prepared for Colorado DOT by
Cambridge Systematics, June 30, 2008.
62
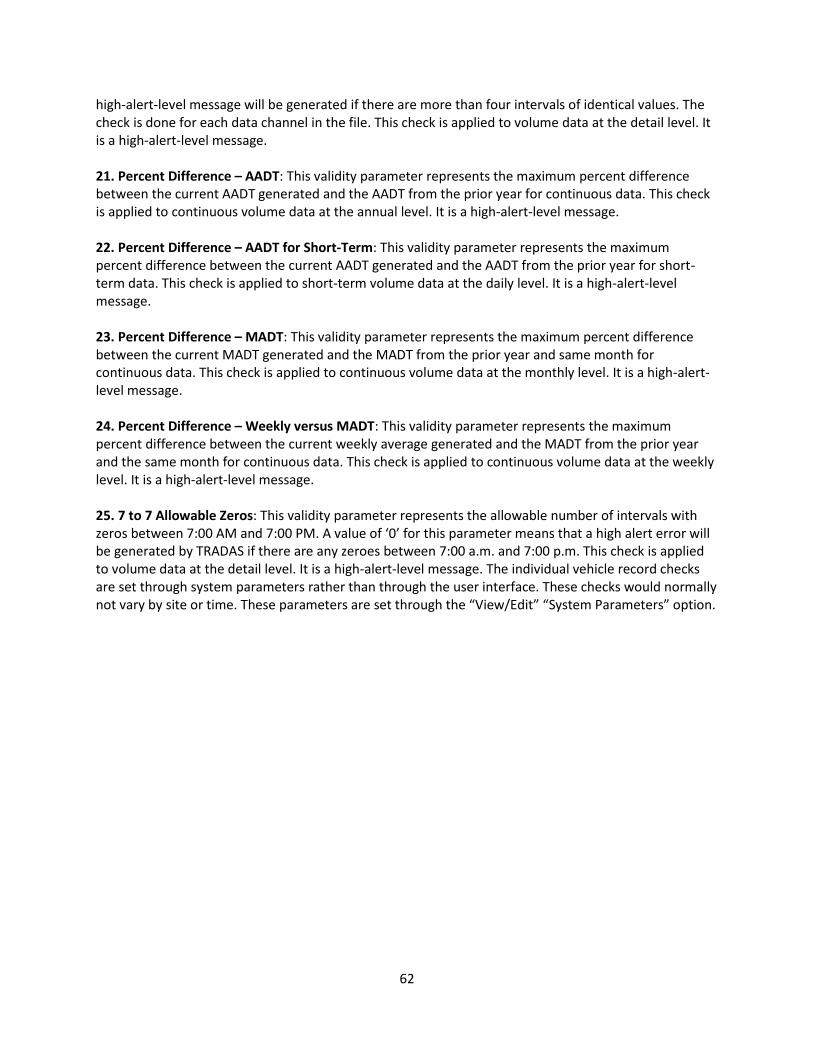
high-alert-level message will be generated if there are more than four intervals of identical values. The check is done for each data channel in the file. This check is applied to volume data at the detail level. It is a high-alert-level message. 21. Percent Difference – AADT: This validity parameter represents the maximum percent difference between the current AADT generated and the AADT from the prior year for continuous data. This check is applied to continuous volume data at the annual level. It is a high-alert-level message. 22. Percent Difference – AADT for Short-Term: This validity parameter represents the maximum percent difference between the current AADT generated and the AADT from the prior year for short-term data. This check is applied to short-term volume data at the daily level. It is a high-alert-level message. 23. Percent Difference – MADT: This validity parameter represents the maximum percent difference between the current MADT generated and the MADT from the prior year and same month for continuous data. This check is applied to continuous volume data at the monthly level. It is a high-alert-level message. 24. Percent Difference – Weekly versus MADT: This validity parameter represents the maximum percent difference between the current weekly average generated and the MADT from the prior year and the same month for continuous data. This check is applied to continuous volume data at the weekly level. It is a high-alert-level message. 25. 7 to 7 Allowable Zeros: This validity parameter represents the allowable number of intervals with zeros between 7:00 AM and 7:00 PM. A value of ‘0’ for this parameter means that a high alert error will be generated by TRADAS if there are any zeroes between 7:00 a.m. and 7:00 p.m. This check is applied to volume data at the detail level. It is a high-alert-level message. The individual vehicle record checks are set through system parameters rather than through the user interface. These checks would normally not vary by site or time. These parameters are set through the “View/Edit” “System Parameters” option.
63
APPENDIX C. COMPILATION OF ACCURACY EVALUATIONS OF AUTOMATED COUNTER EQUIPMENT
Summary of TTI Trail Counter Evaluations
Location, Date, and Duration Usage Level
Eco-Counter PYRO TRAFx Infrared Counter TrailMaster TM1550
Avg. Abs. Error Avg. Error
Avg. Abs. Error Avg. Error
Avg. Abs. Error Avg. Error
TTI Field Evaluations for National Park Service
McKittrick Canyon Trail, Guadalupe Mountains National Park, 10/29/11, 9 hours and 583 total users
Moderate (65 users/hr)
22% +13% 14% -14% 16% -16%
Guadalupe Peak Trail, Guadalupe Mountains National Park, 10/30/11, 8 hours and 85 total users
Low (11 users/hr)
13% +2% 13% -13% 10% -10%
San Antonio River Trail north of Brooklyn St, San Antonio Missions NHP, 12/10/11, 7 hours and 322 total users
Moderate (46 users/hr)
40% +23% 20% -18% 47% -47%
San Antonio River Trail north of Brooklyn St, San Antonio Missions NHP, 12/11/11, 3 hours and 99 total users
Low (33 users/hr)
44% +11% 10% -10% 43% -43%
Previous TTI Field Evaluations (http://swutc.tamu.edu/publications/technicalreports/167762-1.pdf)
Texas A&M Recreation Center, College Station, Texas, 9/15/2006, 3 hours and 470 users
High (156 users/hr)
n.a. n.a. 11% -11% n.a. n.a.
Town Lake Trail on Pfluger Bridge, Austin, Texas, 10/13/06, 4 hours and 967 users
High (240 users/hr)
n.a. n.a. 26% -26% n.a. n.a.
Overall Conclusions
Typically overcounted, but error fluctuates hour-by-
hour. In general, seems to be more sensitive.
Consistently undercounts, but error level depends on trail usage (~ 30% under on
high-use trails).
Consistently undercounts, but appears to have higher
error on trails with more side-by-side traffic.
64
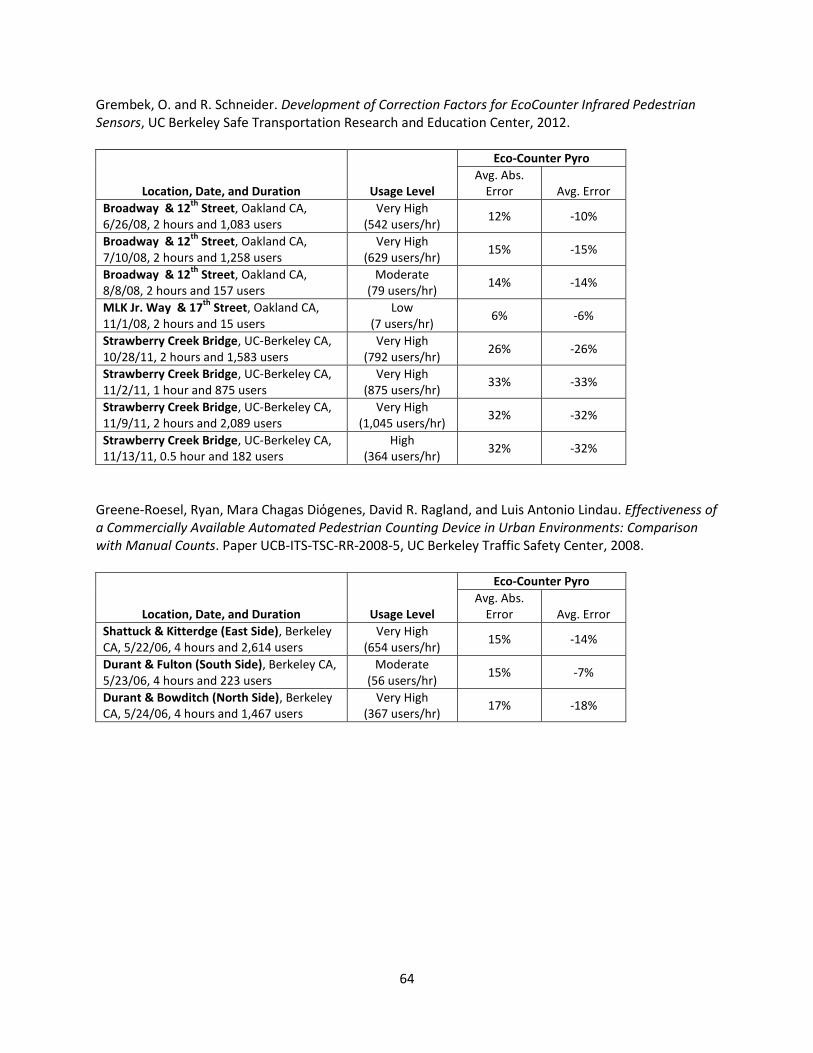
Grembek, O. and R. Schneider. Development of Correction Factors for EcoCounter Infrared Pedestrian Sensors, UC Berkeley Safe Transportation Research and Education Center, 2012.
Location, Date, and Duration Usage Level
Eco-Counter Pyro
Avg. Abs. Error Avg. Error
Broadway & 12th
Street, Oakland CA, 6/26/08, 2 hours and 1,083 users
Very High (542 users/hr)
12% -10%
Broadway & 12th
Street, Oakland CA, 7/10/08, 2 hours and 1,258 users
Very High (629 users/hr)
15% -15%
Broadway & 12th
Street, Oakland CA, 8/8/08, 2 hours and 157 users
Moderate (79 users/hr)
14% -14%
MLK Jr. Way & 17th
Street, Oakland CA, 11/1/08, 2 hours and 15 users
Low (7 users/hr)
6% -6%
Strawberry Creek Bridge, UC-Berkeley CA, 10/28/11, 2 hours and 1,583 users
Very High (792 users/hr)
26% -26%
Strawberry Creek Bridge, UC-Berkeley CA, 11/2/11, 1 hour and 875 users
Very High (875 users/hr)
33% -33%
Strawberry Creek Bridge, UC-Berkeley CA, 11/9/11, 2 hours and 2,089 users
Very High (1,045 users/hr)
32% -32%
Strawberry Creek Bridge, UC-Berkeley CA, 11/13/11, 0.5 hour and 182 users
High (364 users/hr)
32% -32%
Greene-Roesel, Ryan, Mara Chagas Diόgenes, David R. Ragland, and Luis Antonio Lindau. Effectiveness of a Commercially Available Automated Pedestrian Counting Device in Urban Environments: Comparison with Manual Counts. Paper UCB-ITS-TSC-RR-2008-5, UC Berkeley Traffic Safety Center, 2008.
Location, Date, and Duration Usage Level
Eco-Counter Pyro
Avg. Abs. Error Avg. Error
Shattuck & Kitterdge (East Side), Berkeley CA, 5/22/06, 4 hours and 2,614 users
Very High (654 users/hr)
15% -14%
Durant & Fulton (South Side), Berkeley CA, 5/23/06, 4 hours and 223 users
Moderate (56 users/hr)
15% -7%
Durant & Bowditch (North Side), Berkeley CA, 5/24/06, 4 hours and 1,467 users
Very High (367 users/hr)
17% -18%
65
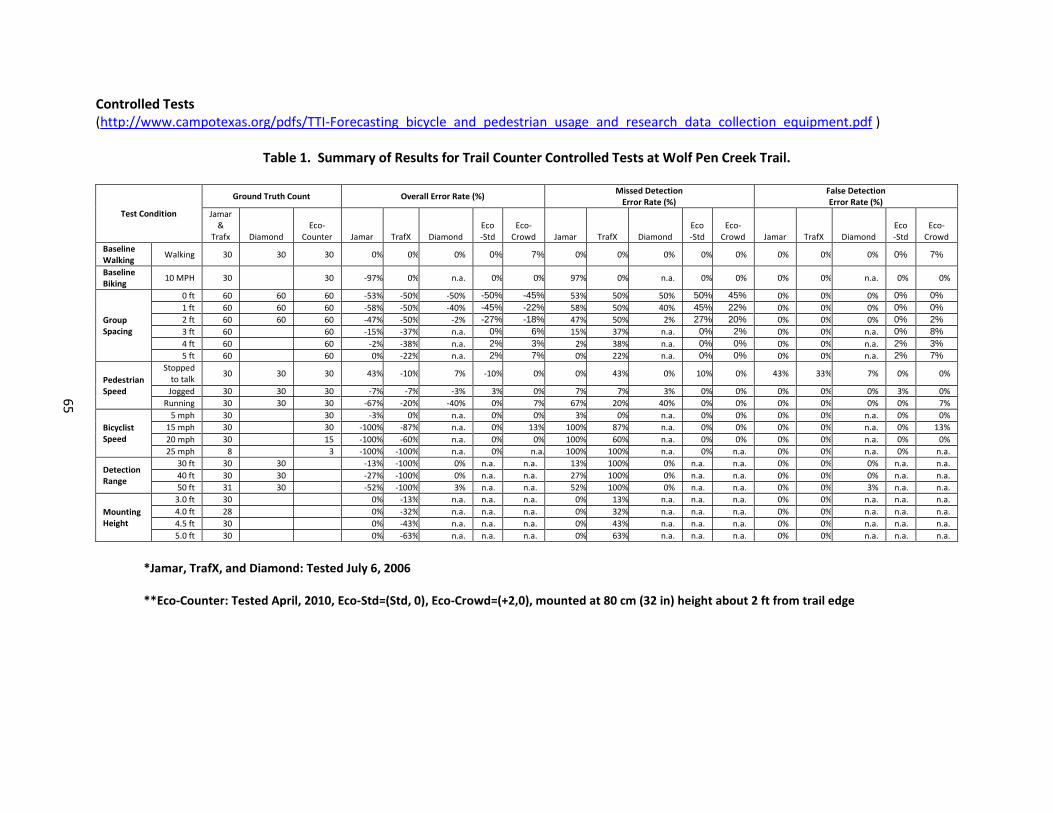
Controlled Tests (http://www.campotexas.org/pdfs/TTI-Forecasting_bicycle_and_pedestrian_usage_and_research_data_collection_equipment.pdf )
Table 1. Summary of Results for Trail Counter Controlled Tests at Wolf Pen Creek Trail.
Test Condition
Ground Truth Count Overall Error Rate (%) Missed Detection
Error Rate (%) False Detection Error Rate (%)
Jamar &
Trafx Diamond Eco-
Counter Jamar TrafX Diamond Eco-Std
Eco-Crowd Jamar TrafX Diamond
Eco-Std
Eco-Crowd Jamar TrafX Diamond
Eco-Std
Eco-Crowd
Baseline Walking
Walking 30 30 30 0% 0% 0% 0% 7% 0% 0% 0% 0% 0% 0% 0% 0% 0% 7%
Baseline Biking
10 MPH 30 30 -97% 0% n.a. 0% 0% 97% 0% n.a. 0% 0% 0% 0% n.a. 0% 0%
Group Spacing
0 ft 60 60 60 -53% -50% -50% -50% -45% 53% 50% 50% 50% 45% 0% 0% 0% 0% 0%
1 ft 60 60 60 -58% -50% -40% -45% -22% 58% 50% 40% 45% 22% 0% 0% 0% 0% 0%
2 ft 60 60 60 -47% -50% -2% -27% -18% 47% 50% 2% 27% 20% 0% 0% 0% 0% 2%
3 ft 60 60 -15% -37% n.a. 0% 6% 15% 37% n.a. 0% 2% 0% 0% n.a. 0% 8%
4 ft 60 60 -2% -38% n.a. 2% 3% 2% 38% n.a. 0% 0% 0% 0% n.a. 2% 3%
5 ft 60 60 0% -22% n.a. 2% 7% 0% 22% n.a. 0% 0% 0% 0% n.a. 2% 7%
Pedestrian Speed
Stopped to talk
30 30 30 43% -10% 7% -10% 0% 0% 43% 0% 10% 0% 43% 33% 7% 0% 0%
Jogged 30 30 30 -7% -7% -3% 3% 0% 7% 7% 3% 0% 0% 0% 0% 0% 3% 0%
Running 30 30 30 -67% -20% -40% 0% 7% 67% 20% 40% 0% 0% 0% 0% 0% 0% 7%
Bicyclist Speed
5 mph 30 30 -3% 0% n.a. 0% 0% 3% 0% n.a. 0% 0% 0% 0% n.a. 0% 0%
15 mph 30 30 -100% -87% n.a. 0% 13% 100% 87% n.a. 0% 0% 0% 0% n.a. 0% 13%
20 mph 30 15 -100% -60% n.a. 0% 0% 100% 60% n.a. 0% 0% 0% 0% n.a. 0% 0%
25 mph 8 3 -100% -100% n.a. 0% n.a. 100% 100% n.a. 0% n.a. 0% 0% n.a. 0% n.a.
Detection Range
30 ft 30 30 -13% -100% 0% n.a. n.a. 13% 100% 0% n.a. n.a. 0% 0% 0% n.a. n.a.
40 ft 30 30 -27% -100% 0% n.a. n.a. 27% 100% 0% n.a. n.a. 0% 0% 0% n.a. n.a.
50 ft 31 30 -52% -100% 3% n.a. n.a. 52% 100% 0% n.a. n.a. 0% 0% 3% n.a. n.a.
Mounting Height
3.0 ft 30 0% -13% n.a. n.a. n.a. 0% 13% n.a. n.a. n.a. 0% 0% n.a. n.a. n.a.
4.0 ft 28 0% -32% n.a. n.a. n.a. 0% 32% n.a. n.a. n.a. 0% 0% n.a. n.a. n.a.
4.5 ft 30 0% -43% n.a. n.a. n.a. 0% 43% n.a. n.a. n.a. 0% 0% n.a. n.a. n.a.
5.0 ft 30 0% -63% n.a. n.a. n.a. 0% 63% n.a. n.a. n.a. 0% 0% n.a. n.a. n.a.
*Jamar, TrafX, and Diamond: Tested July 6, 2006 **Eco-Counter: Tested April, 2010, Eco-Std=(Std, 0), Eco-Crowd=(+2,0), mounted at 80 cm (32 in) height about 2 ft from trail edge
66
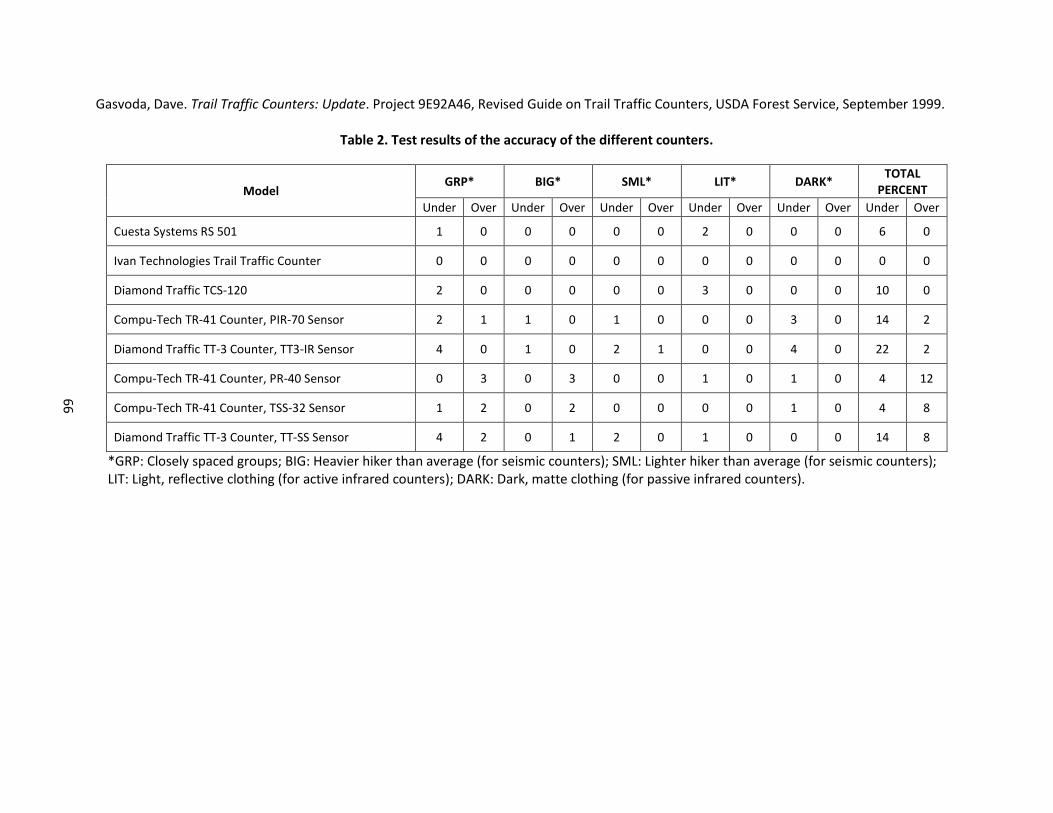
Gasvoda, Dave. Trail Traffic Counters: Update. Project 9E92A46, Revised Guide on Trail Traffic Counters, USDA Forest Service, September 1999.
Table 2. Test results of the accuracy of the different counters.
Model GRP* BIG* SML* LIT* DARK*
TOTAL PERCENT
Under Over Under Over Under Over Under Over Under Over Under Over
Cuesta Systems RS 501 1 0 0 0 0 0 2 0 0 0 6 0
Ivan Technologies Trail Traffic Counter 0 0 0 0 0 0 0 0 0 0 0 0
Diamond Traffic TCS-120 2 0 0 0 0 0 3 0 0 0 10 0
Compu-Tech TR-41 Counter, PIR-70 Sensor 2 1 1 0 1 0 0 0 3 0 14 2
Diamond Traffic TT-3 Counter, TT3-IR Sensor 4 0 1 0 2 1 0 0 4 0 22 2
Compu-Tech TR-41 Counter, PR-40 Sensor 0 3 0 3 0 0 1 0 1 0 4 12
Compu-Tech TR-41 Counter, TSS-32 Sensor 1 2 0 2 0 0 0 0 1 0 4 8
Diamond Traffic TT-3 Counter, TT-SS Sensor 4 2 0 1 2 0 1 0 0 0 14 8
*GRP: Closely spaced groups; BIG: Heavier hiker than average (for seismic counters); SML: Lighter hiker than average (for seismic counters); LIT: Light, reflective clothing (for active infrared counters); DARK: Dark, matte clothing (for passive infrared counters).