strategies applying the darvas method - marco den...
TRANSCRIPT

In This Issue: Marco’s Power Performers (see page 9)
Strategies
Applying the Darvas Method
Last issue I reviewed Nicolas Darvas amazing little book, How I Made $2,000,000 in the Stock Market. This issue I look at his methodology in more detail with an eye to seeing if his feat can be easily replicated. The short answer is no. If it could, there would now be thousands of millionaires who made their money using the Darvas method. Many people have studied his methods. Many have achieved some success in the stock market. But few if any managed to turn $25,000 into $2,000,000 in the short eighteen months Darvas did it in. We’ll get into the reasons for this later. But the Darvas method contains some valuable truths that can be applied to improve our own stock market performance. The most important of these is the concept of the Darvas box.
The Darvas Box What is a Darvas box? In his investigations of stock price movements, Darvas discovered that stocks don’t move in a straight line. They fluctuate up and down. But a stock in an up trend has a peculiar pattern, a rhythm that can be observed and used to time one’s stock purchases and place one’s stop loss orders. What Darvas observed was that up trending stocks typically advance for a while, then stall and consolidate, then advance again. This stalling and consolidation process he called forming a box. For example, a stock might have the following price pattern 22, 25, 24, 26, 27, 30, 29, 29, 27, 28, 29, 29, 30, 28, 29. The stock advanced from 22 to 30 and then started stalling and consolidating, falling back to 27. The pattern above would, in Darvas view, have formed a box or frame with a high of 30 and a low of 27. The stock oscillates between those figures. The upper edge of the box is formed when the stock retreats from its high and stays below it for three consecutive days. So the move from 25 to 24 did not signal the top of a box as the stock moved up again after that. But when it hit 30, it stayed below that level. After the top of a box is formed, the bottom is formed when the stock advances from a low for three consecutive days without breaking out of the box to the upside. In our example, it is 27. This Darvas would call a 27/30 box which is a pretty tight frame. The depth of the box may vary each time one is formed.
(continued on page 2)

2 The Break Out Report
The Break Out Report
is published twice a month by Break Out Publishing. The report and its writers are not registered investment advisors and the contents of the Break Out Report are not to be construed as investment advice. It is for information only. The material in these pages is derived from sources believed to be reliable but accuracy and completeness are not guaranteed. Readers are advised that past performance of companies featured in these pages is no guarantee of future performance. The Break Out Report and its writers accept no liability for losses incurred as a result of acting on this information.
Copyright © 2006 Break Out Publishing. Stock charts copyright © Investools and used by permission.
Editors: Marco den Ouden & Ken Ballard Email us: [email protected] Website: http://breakoutreport.com [email protected]
Articles this issue by Marco den Ouden unless otherwise indicated. Subscription: US $14.95 a month
Applying the Darvas Method (from page 1)
Once a box is firmly established, Darvas says a break out above the upper line of the box is a buy signal. A drop below the bottom of the box is a sign that the stock’s trend has changed and a sell signal. Darvas was also very keen on volume. Increasing volume on a rising stock indicated buyer interest. Once he discovered a stock that was rising with increasing volume, he would wait for a box to develop. Then he would issue an on stop buy order to buy the stock when it broke out of the box. An on stop buy order is the opposite of a stop loss order. It is an instruction to your broker to buy the stock only after it has climbed to a certain level. It seems almost counter-intuitive to the way most investors think. Many, if not most, would think “buy low” and tell their brokers, when the stock drops to this level, buy me some. The on stop buy order says I’m not interested until the stock has proven itself by climbing to a certain level. It is the tool in trade of the contrarian investor who, instead of following the rule of buy low, sell high, follows the rule of buy high, sell higher. I used to think this was a crazy idea until I read William O’Neil’s How to Make Money in Stocks. In fact, there are many similarities between O’Neil’s CANSLIM method and Darvas’s approach. In our example, Darvas would issue a buy order at 31. Immediately he would also issue a stop loss order at the top of the box or 30 in our example. He reasoned that if the stock was behaving correctly, it should advance once it broke out of the box. If it retreated, he had made a mistake and wanted to be out of the stock quickly with a minimal loss. He recognized that this might result in being stopped out quite a few times, but the advances would take care of that. It was the famous financier and advisor to presidents, Bernard Baruch, who once said “Even being right 3 or 4 times out of 10 should yield a person a fortune if he has the sense to cut his losses quickly on the ventures where he has been wrong.” A point reiterated by Darvas. The best way to see the Darvas box method is graphically. Consider Research in Motion. This stock had been on a solid up trend from early 2003 through the end of 2004, rising from $8.50 to $110. The stock then drifted in a wide sideways pattern to mid-2006, fluctuating between $70 and $105. Now Darvas only bought stocks that were hitting all time highs. Research in Motion hit an all time high of $130 (split adjusted) on February 28, 2000, so Darvas may not have been interested in RIM until it broke through that high. But for the sake of our example, we’ll look at the boxes since June. We rated Research in Motion a buy again on July 10th using our method of a bounce off the 30 day moving average after a change in direction of the moving average to the upside. So we’ll look at the boxes since then.
(continued on page 3)

The Break Out Report 3
Applying the Darvas Method (from page 2)
As you can see, there have been five Darvas boxes formed since we issued our buy rating on July 10th. Darvas probed his stocks by buying in increments. If he had bought when we rated Research in Motion a buy, he likely would have sold when it hit 75, bought back in when it broke above 80, bought some more when it broke above 94 and bought a lot more when it spiked up on Sept. 29th. And if he was not yet fully invested at the time, he would have bought more when the stock broke above 130 and even more above 134. Each break out from a box to the upside is a buy signal. The chart above graphically shows how boxes pyramid upwards in an up trending stock. Sometimes, as in the last two boxes, they overlap. Darvas used stop losses, the initial one very tight but subsequent ones a bit looser. When a new box formed, Darvas would raise the stop to the bottom of the new box. In the case of Research in Motion, he would have raised the stops progressively to 86, 94, 122 and 128. which would be the current stop. The trailing stop using our current system is a bit looser at $122.50. As I noted at the beginning of this article, Darvas’s results cannot be easily duplicated. The reason is because of a Darvas idiosyncrasy he shared with Jesse Livermore. He was a plunger. He followed very few stocks and invested in even fewer. And when he did, he went whole hog and used margin, a dangerous prescription. For example, after some initial successes had built up his capital position, he bought 500 shares of E.L. Bruce (makers of Bruce Hardwood Flooring which is still around today) at 50 ¾ . He bought another 500 shares at 51 1/8, another 500 at 51 ¾ another 500 at 52 ¾ and a final 500 shares at 53 5/8. He bought $130,687.55 worth of this one stock. It was his only holding and 50% of that was on
(continued on page 4)

4 The Break Out Report
Applying the Darvas Method (from page 3)
margin. Plunger indeed! Then Darvas got very lucky indeed. Unknown to the general public, Bruce was the subject of takeover negotiations. Short sellers, not knowing this, pooh-poohed the rise in price and start selling short. As the price continued to rise, the shorts were in a frenzy trying to sell and close their positions. Things got so crazy that trading in the stock was halted. The shorts scrambled to buy the stock over-the-counter privately. Darvas broker told him he could sell out for $100 a share. Then he did something most people would probably not have the guts to do. He told his broker no and hung on. The offers went up and eventually Darvas sold out all his Bruce at an average price of $171. He made a profit of $295,305.45. Now that is a combination of skillful stock picking, high risk (by ignoring the usual advice of diversifying), guts and just plain good luck. So replicating Darvas would take a combination of guts and foolishness most people just do not have. That said, his box method is intriguing and fairly easy to follow. I will be adopting some of his methods in managing my Model Portfolio as noted with our stock picks this issue. I will look for stocks just breaking out of their Darvas boxes, preferably on good volume. I will also continue to buy in increments as I have been doing recently. Although I like the idea of using the boxes to determine stop loss points, my method of using a percentage from the recent high is easier to manage and works as well. The only change will be that I will use a tight initial stop, increasing it as the profits mount. Using a very tight initial stop should help us hold on to our profits better and certainly prevent us from losing money because of bad selection or bad timing. I may substitute a Darvas stop for stocks actually in our Model Portfolio. We’ll have to watch and see how this works out over time!
Darvas’s Trades
Here is the progression of Darvas’s trades to $2 million. Remember, he used margin and so invested more than he actually had in cash. First trade noted below was in November 1957.
• bought 200 Lorillard at 28 ¾, 200 at 35, 200 at 36 ½ and 400 at 38 5/8. Invested $35,827.50 • bought 500 Diner’s Club at 24 ½ , 500 at 26 1/8. Invested $25,520.80 • sold Diner’s Club for $35,848.85 • sold Lorillard for $56,880.45 • bought E.L. Bruce in 5 increments between 50 ¾ and 53 5/8 for $130,687.55 • sold E.L. Bruce for $425,993 • lost small amounts on Molybdenum and Haveg Industries. Lost about $6500 trying Lorillard
again after which he had a total profit of $318,686.45 • bought 300 Universal Controls at 35 ¼ , 1200 at 36 ½ , 1500 at 40. Total $115,313.49 • bought 200 Thiokol at 47 ¼ , 1300 at 49 ½. Total invested: $74,943.98 • a rights offer came from Thiokol which enabled him to convert to a highly leveraged position of
6000 shares for a cost of $350,820 • combined holdings of Thiokol and Universal Controls climbs to over half million • got over-confident, ignored his rules and lost $96,588.66 trading 14 different stocks (he calls it
his mad period). Still held Thiokol and Universal Controls through this period. • traded a variety of stocks for a profit of $25,000 (he lists 11 stocks) • sold Universal Controls for $524,669.97 • bought 2000 Texas Instruments at 94 3/8, 1500 at 97 7/8, 200 at 101 7/8. Total $541,996.95 • sold Thiokol for $1,212,851.52 • after probing four stocks, bought $574,842.25 of Zenith, $567,820.60 of Fairchild Camera • 3 positions - Zenith, Fairchild and Texas Instruments – valued over $2,250,000 in July 1959

The Break Out Report 5
Pharmaceutical Pick
Paladin Labs (LGI–TSX) (website: www.paladin-labs.com)
Paladin Labs was a featured stock in the 2003 edition of my book, The 50 Best Science & Technology Stocks for Canadians. Unfortunately it went from profit to loss in 2002 and the stock dropped like a rock before the book was even published. Luckily for readers, it rebounded nicely from a low of around $3. In the book I wrote: “Paladin Labs is a small but fast-growing pharmaceutical company focused on niche markets that may be underserved by the giant drug companies. Founded in 1996 as a spinoff of Pharmascience Inc., the company became profitable in its third year. The company’s focus is commercialization of specialty products, not research. It acquires or in-licenses late-stage specialty pharmaceuticals from other small to medium sized pharmaceutical and biotechnology companies with little or no sales and marketing expertise in Canada. And it acquires products from large multinational pharmaceutical companies that don’t want to expend the resources necessary to market to small niche areas or to Canada. The company’s expertise is twofold: shepherding acquired products through the Canadian regulatory process, including conducting any additional clinical trials that may be required, and focused marketing to high-prescribing specialty physicians. The company is selective in choosing products that complement existing lines and specialty areas. These include urology, endocrinology, women’s health, dermatology, palliative care and hospital emergency room products.” Licensors for the company’s product line include Novartis, Pfizer, Eli Lilly, Merck Frosst, and Aventis. It also markets some generic products licensed from Pharmascience which is one of Canada’s largest generic drug manufacturers. On its website, the company reports compounded annual growth of revenues of 111% since inception in 1996. Now for an odd coincidence. Thursday I developed an ear infection and my doctor prescribed some ear drops for me. I got the prescription, put a drop in my ear and proceeded to scan stocks for a likely prospect. I liked Paladin’s chart so opted for it. While researching the company online, I went through its product list and well, I’ll be darned but the ear drops were marketed by Paladin. I checked the box, and yes, indeed they were. I don’t know if that’s an omen, but it is interesting!
Quarterly Earnings per Share
To Sept. 30th 2005 2006 % Change EPS (continuing operations) $0.05 $0.13 +160.00% Revenues (000s) $9,135 $12,702 +39.05%%
Annual Earnings per Share
To Dec. 31st 2003 2004 % Change 2005 % Change EPS -$0.28 $0.22 turnaround 0.22 +00.00% Revenues (000s) $25,692 $29,150 +13.46% $35,267 +20.98%
(continued on page 6)

6 The Break Out Report
Paladin Labs (from page 5)
Chart Analysis: The stock plunged in the tech wreck, dropping from around $12 to below $5. It climbed again to around $11 in January 2002 before dropping to $3.55 by the end of that year. Since then it has climbed magnificently and Thursday hit an all-time high of $12.25. Volume is strong. Its box is 10.25/12.00 and since we’re now priced inside the box, we’ll set a stop at the lower end of the box or $10.25. If it closes above $12.25, we’ll move the stop up to our purchase price of $11.52.
Stats as of 11/17/06 Phase 2 Analysis ▪ Hi/Lo Ratio: 2.31 ▪ RS: 93.28 ▪ Shares: 14,940,537 ▪ P/E: 30.32 ▪ Price: $11.52
▪ Price Pattern: A ▪ Volatility: A ▪ Estimates: A+ ▪ Snapshot: B- ▪ News: A+
Phase 2: We give PLB an A for price pattern and an A for volatility as the up trend is solid and corrections have been short-lived. Estimates are up with a consensus rating of 2.0 or buy. We give it an A. The snapshot is mixed with growing revenues but earnings flat year over year. Return on equity is poor at 5.03. The bright spot is the most recent quarter. We give it a B-. News is solid with two new products added to its line and increased revenue guidance for 2007. We rate it an A+.
All charts courtesy of Investools. Visit their website at http://me.investortoolbox.com for more information on their courses and online tools.
The Break Out Report 7
Technology Pick
Logibec Groupe Informatique Ltee. (LGI–TSX) (website: www.logibec.com)
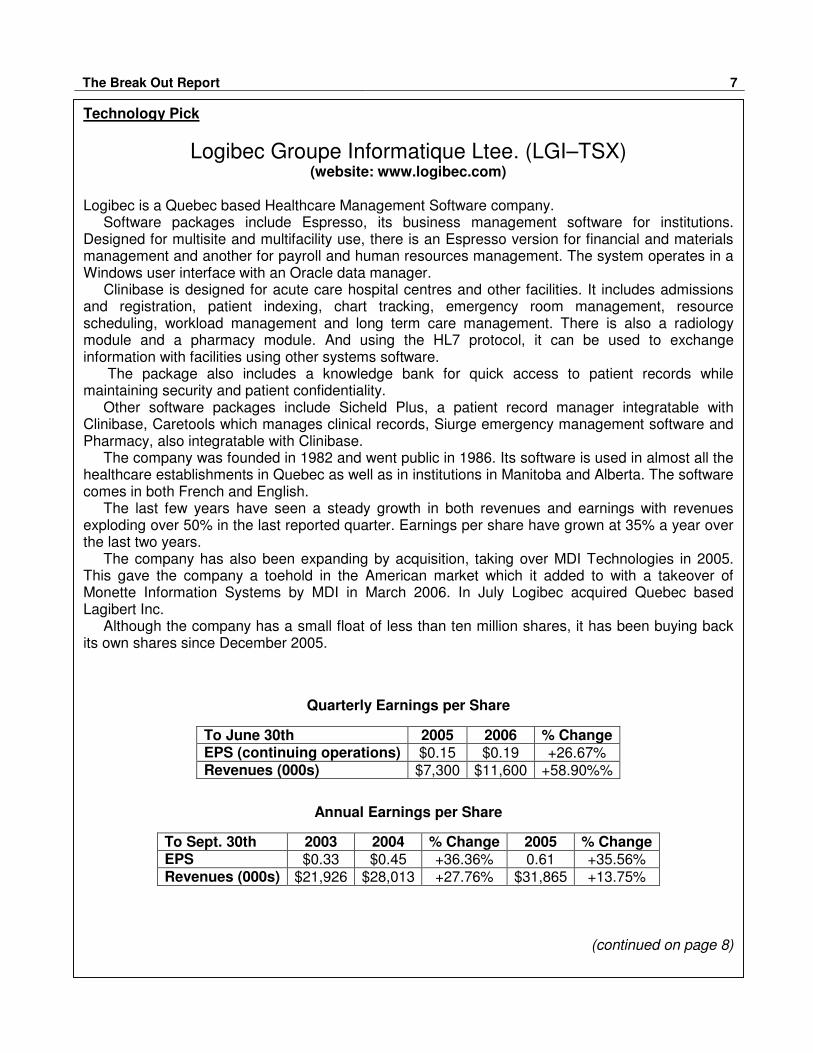
Logibec is a Quebec based Healthcare Management Software company. Software packages include Espresso, its business management software for institutions. Designed for multisite and multifacility use, there is an Espresso version for financial and materials management and another for payroll and human resources management. The system operates in a Windows user interface with an Oracle data manager. Clinibase is designed for acute care hospital centres and other facilities. It includes admissions and registration, patient indexing, chart tracking, emergency room management, resource scheduling, workload management and long term care management. There is also a radiology module and a pharmacy module. And using the HL7 protocol, it can be used to exchange information with facilities using other systems software. The package also includes a knowledge bank for quick access to patient records while maintaining security and patient confidentiality. Other software packages include Sicheld Plus, a patient record manager integratable with Clinibase, Caretools which manages clinical records, Siurge emergency management software and Pharmacy, also integratable with Clinibase. The company was founded in 1982 and went public in 1986. Its software is used in almost all the healthcare establishments in Quebec as well as in institutions in Manitoba and Alberta. The software comes in both French and English. The last few years have seen a steady growth in both revenues and earnings with revenues exploding over 50% in the last reported quarter. Earnings per share have grown at 35% a year over the last two years. The company has also been expanding by acquisition, taking over MDI Technologies in 2005. This gave the company a toehold in the American market which it added to with a takeover of Monette Information Systems by MDI in March 2006. In July Logibec acquired Quebec based Lagibert Inc. Although the company has a small float of less than ten million shares, it has been buying back its own shares since December 2005.
Quarterly Earnings per Share
To June 30th 2005 2006 % Change EPS (continuing operations) $0.15 $0.19 +26.67% Revenues (000s) $7,300 $11,600 +58.90%%
Annual Earnings per Share
To Sept. 30th 2003 2004 % Change 2005 % Change EPS $0.33 $0.45 +36.36% 0.61 +35.56% Revenues (000s) $21,926 $28,013 +27.76% $31,865 +13.75%
(continued on page 8)

8 The Break Out Report
Logibec Groupe Informatique (from page 7)
8 Chart Analysis: As recently as January of 2003, Logibec traded at $2 a share. Now it is up to $16. The last year saw it rise in a rather erratic pattern from $11.50 to $15.00 before correcting. It has been in a very narrow trading range around $16 since August. This week it broke out of its box and could go higher from here. As there is not strong volume pushing the stock, we’ll follow the Darvas logic of tight stops, and place one at $15.50.
Stats as of 11/17/06 Phase 2 Analysis ▪ Hi/Lo Ratio: 1.44 ▪ RS: 83.40 ▪ Shares: 8,931,724 ▪ P/E: 23.00 ▪ Price: $16.10
▪ Price Pattern: A ▪ Volatility: B ▪ Estimates: A+ ▪ Snapshot: A ▪ News: A+
Phase 2: We give LGI an A for price pattern and a B for volatility as the up trend is solid but there has been the odd correction in the last year. Estimates are way up with a consensus rating of 1.5 or strong buy. We give it an A+. The snapshot is solid with growing revenues and earnings and return on equity is good at 17.06. We give it an A. News is solid as well with record revenues and earnings, a normal course issuer bid and several acquisitions to expand into the US market. We rate it an A+.
All charts courtesy of Investools. Visit their website at http://me.investortoolbox.com for more information on their courses and online tools.

The Break Out Report 9
Mutual Funds
Marco’s Power Performers (for October 2006)
Definitions
Power Performers – Mutual Funds returning better than 20% in each of the one year, three year and five year time periods. Super Power Performers – funds returning better than 25% in the three relevant time periods. Performers – funds returning better than 15% in each of the time periods.
The TSX rose 583.32 points or 4.96% in October closing at 12,344.59. Not surprisingly, the number of Power Performers rose for October as well. . The number of Super Power Performers soared to 34 from 13. The number of Power Performers jumped to 35 from 19. And the number of Performers exploded to 131 from 51. Total: 200 compared to 83 for September. This even surpasses the whopping 173 we had in April. Much of the rebound was in the resource sector which makes up the bulk of the Super Power Performers this issue. Seventeen of the 34 Super Power Performers were in the resource or precious metals sector. Also strong were small caps and emerging markets. The mix for the Power Performers and Performers was similar. A good month for mutual funds!
Super Power Performers (34) 1 yr % 3 yr % 5 yr %
Front Street Special Opportunities Canadian 26.47 30.05 39.16
TDK Resource Fund Inc. 53.60 41.70 39.05
Mackenzie Universal Cdn. Resource (US$) 35.48 35.18 38.46
Front Street Small Cap Canadian 32.42 33.37 37.19
Sceptre Equity Growth - O 49.33 31.16 35.07
CI Signature Cdn Res Corp Class (US$) 45.03 40.10 33.98
Northern Rivers Innovation Fund LP 64.09 27.70 33.94
Sceptre Equity Growth - A 47.57 29.64 33.64
AGF Global Resources Class (US$) 46.39 40.41 33.38
TD Latin American Growth (US$) 43.08 47.25 32.33
Dynamic FocusPlus Resource 49.86 36.75 32.29
Excel India 37.09 32.46 32.14
Fidelity Latin America-B (US$) 43.56 46.84 32.09
Fidelity Latin America-A (US$) 43.14 46.62 31.97
Sprott Canadian Equity 39.29 28.16 30.86
Norrep Fund 25.78 26.15 30.05
Epic Limited Partnership 32.18 25.34 29.84
Mackenzie Universal Canadian Resource 28.94 28.10 29.22
Altamira Resource 34.19 29.03 28.77
AGF Canadian Resources 37.10 31.97 28.58
London Life Canadian Resource (MF) 27.73 26.95 28.21
Sentry Precious Metals Growth 98.09 25.97 28.06
GWL Canadian Resources (A) DSC 35.81 30.74 27.65
DMP Resource Class 48.11 29.45 27.51
GWL Canadian Resources (A) NL 35.52 30.46 27.38
AGF Emerging Markets Value (US$) 42.95 34.85 27.33
Fidelity Emerging Markets-B (US$) 40.51 30.99 26.87
Fidelity Emerging Markets-A (US$) 40.23 30.81 26.77
CI Signature Canadian Resource 39.56 34.06 26.72
BMO Resource 41.31 32.18 26.44
Clarica SF CI Signature Cdn Res - DSC 38.30 32.55 25.84
Clarica SF CI Signature Canadian Resource 38.31 32.56 25.81
Mavrix Strategic Small Cap 65.24 43.19 25.41
Trimark Canadian Resources 33.16 25.80 25.38 (continued on page 11)
Marco is now a regular guest on Gold Radio at HoweStreet.com.
The Tuesday segment with host Tom Jeffries is called Off the Cuff.
Follow the links from our website or go directly to HoweStreet.com!
Also check out Marco’s new website:
• Towards a Tax Free Canada (http://taxfreecanada.org)

10 The Break Out Report
Marco’s Power Performers (from page 10)
Below are our Power Performers.
Power Performers (35)
Fund Name 1 yr 3 yr 5 yr Fund Name 1 yr 3 yr 5 yr
AGF Precious Metal 82.08 21.16 41.51 Fidelity Latin America-A 36.14 38.99 23.15
Mackenzie Cundill Recovery 'C' (US$) 35.82 22.71 30.53 Montrusco Bolton Enterprise 22.38 22.23 23.14
Norrep II Class-A 20.66 23.59 29.43 Mackenzie Universal World Res. Class 24.27 26.37 22.63
Bissett Microcap-F 25.65 24.40 27.32 AGF European Equity Class (US$) 44.07 27.12 22.51
QVGD Cdn. Enterprise Small Cap 20.49 n/a 25.83 AGF Global Real Estate Equity (US$) 39.30 26.66 22.13
Bissett Microcap-A 24.00 22.75 25.75 CIBC Latin American 29.58 30.52 22.13
Sentry Canadian Resource Class 24.65 29.96 25.35 CI Sig. Select Cdn Corp. Class (US$) 28.92 25.73 21.65
CI Signature Cdn. Res. Corp Class 37.91 32.79 24.99 AGF Global Financial Services (US$) 34.59 24.92 21.56
AGF Global Resources Class 39.04 33.00 24.46 SEI Emerging Market Equity-O 26.32 22.30 21.24
Templeton Emerging Mkts CC (US$) 28.03 25.63 24.30 Scotia Latin American Growth 30.78 34.41 21.17
Templeton Emerging Markets (US$) 28.07 25.69 24.27 Sceptre Income Trusts 23.89 23.31 20.84
Montrusco Bolton Cdn. Small Cap 'B' 22.36 22.61 24.25 Trans IMS Canadian Small Cap 20.19 26.55 20.80
Mawer New Canada 21.26 21.96 24.18 Renaissance Canadian Small-Cap 30.80 24.09 20.73
RBC Global Resources 47.56 33.13 23.99 Concordia Special Growth 25.59 20.30 20.69
TD Resource 27.51 24.42 23.75 GGOF Monthly High Income Classic 22.94 22.33 20.54
TD Latin American Growth 35.98 39.52 23.46 CI Harbour Corporate Class (US$) 23.95 24.50 20.48
Trimark Europlus (US$) 37.00 25.92 23.40 ABC Fundamental Value 25.94 21.25 20.03
Fidelity Latin America-B 36.46 39.19 23.26 Power Performers © Marco den Ouden
Below and on the next page are our Performers.
Performers (131)
Fund Name 1 yr 3 yr 5 yr Fund Name 1 yr 3 yr 5 yr
RBC Global Precious Metals 68.40 16.20 43.91 Sprott Hedge L.P. 21.59 19.56 20.65
Mackenzie Univ. Precious Metals(US$) 69.79 18.08 38.69 Montrusco Bolton TSX 100 Moment. 18.72 28.53 20.44
CIBC Precious Metals 70.48 16.86 32.82 AIC Cdn Focused Corp. Class (US$) 19.32 24.99 20.35
CI Global Energy Corp Class (US$) 16.59 45.62 30.50 Empire Small Cap Equity - Class A 24.08 18.86 20.05
Northwest Specialty Equity 19.03 20.62 28.90 National Bank Natural Resources 27.21 25.48 19.96
TD Precious Metals 61.00 15.24 28.13 R Canadian Smaller Companies 17.35 17.30 19.91
Ethical Special Equity 20.39 19.10 24.66 GGOF Monthly High Income Mutual 22.10 21.74 19.88
Acuity All Cap 30 Canadian Equity 29.86 18.77 24.51 CI Emerging Markets Corp Cl (US$) 39.53 25.85 19.78
Clarington Canadian Small Cap 20.10 18.96 24.08 GGOF Emerging Markets Mutual 25.31 23.67 19.76
iShares CDN Energy Sector Index 15.05 35.02 24.05 TD Emerging Markets-A 31.88 23.72 19.76
Maritime Life Cdn Growth II-R 18.06 15.53 22.83 SEI Cdn Small Company Equity-O 25.16 19.44 19.72
Maritime Life Cdn Growth-R 17.81 15.27 22.63 TD Emerging Markets 31.94 23.58 19.72
AGF China Focus Class (US$) 46.66 19.33 22.47 Saxon Small Cap 22.63 16.10 19.65
Mackenzie Cundill Recovery 'C' 29.26 16.28 21.82 Elliott & Page Growth Opportunities 17.31 16.96 19.56
CI Can-Am Small Cap Corporate Class 16.06 20.33 21.67 Dynamic Canadian Value Class 39.65 28.79 19.52
Dynamic Power Small Cap 17.58 19.48 21.52 Dynamic FocusPlus Small Business 34.47 26.01 19.48
CIBC Canadian Resource 19.87 27.52 21.43 Trimark Global Endeavour (US$) 27.44 20.53 19.48
Assumption/MB Canadian Small Cap 19.46 19.69 21.29 AGF Canada Class (US$) 26.17 23.53 19.46
Acuity Pooled Canadian Equity 24.11 18.78 21.15 CI Emerging Markets (US$) 39.01 25.84 19.36
Dynamic FocusPlus Div. Income Trust 19.82 20.53 21.15 Vertex Fund - A 17.50 22.78 19.32
Palos Income Trust Fund LP 21.08 19.02 20.88 Acuity Pooled High Income 15.70 18.14 19.22
(continued on page 12)

The Break Out Report 11
Marco’s Power Performers (from page 11)
Performers (continued)
Montrusco Bolton Canadian Equity Plus 20.36 19.18 19.20 Fidelity Focus Financial Ser-B(US$) 31.96 23.30 16.75
United-Canadian Equity Small Cap Pl 20.64 17.15 19.12 Hillsdale US Performance Eq A (US$) 17.92 20.49 16.69
APEX Canadian Value (Dynamic) 42.28 29.69 19.09 Fidelity Focus Financial Svcs–A (US$) 31.69 23.14 16.66
Renaissance Canadian Income Trust 22.41 21.00 18.97 AIM International Growth Class (US$) 31.79 22.97 16.60
IA Group Dividends 24.57 22.35 18.92 Assumption Canadian Equity Plus 17.81 16.66 16.58
Acuity Pooled Conservative Asset Alloc. 16.70 18.07 18.85 National Bank Emerging Markets 28.73 21.67 16.57
CIBC Emerging Markets Index 27.14 22.06 18.83 Mackenzie Univ European Opp. (US$) 25.73 23.29 16.46
Dynamic Power Canadian Growth 22.06 22.21 18.83 Sentry Select REIT 25.24 20.81 16.46
AGF Emerging Markets 35.85 27.72 18.80 SEI Canadian Equity-O 20.70 19.21 16.40
Assumption/MB TSX 100 Momentum 16.96 26.63 18.71 IA Ecflx Dividends 21.92 19.75 16.39
Altamira Global Discovery 27.82 22.44 18.48 IAP Dividends 21.92 19.75 16.39
Bissett Income-F 22.49 19.19 18.42 Trimark International Co. (US$) 28.37 18.70 16.30
Highstreet Canadian Equity 20.86 21.42 18.40 Renaissance Developing Cap Markets 25.06 19.75 16.25
Trimark Global Balanced (US$) 22.17 15.04 18.36 Sun Life Sunfund (Fund A) 23.98 20.76 16.21
Fidelity Emerging Markets-B 33.57 24.16 18.33 United-Real Estate Investment Pool 29.70 23.19 16.19
Fidelity Emerging Markets-A 33.26 24.00 18.23 Genus Canadian Equity 19.80 21.18 16.18
Genus Biosphere Plus Cdn Equity 23.54 22.44 18.23 Guardian Vector Canadian Equity 22.51 19.77 16.15
KEYSTONE Saxon Smaller Companies 16.72 15.87 18.00 Talvest Millennium Next Generation 26.70 20.79 16.12
Dynamic FocusPlus Real Estate 29.29 22.18 17.99 CI Signature High Income 16.35 17.48 16.01
Acuity Canadian Equity 20.50 15.64 17.93 Thornmark Dividend & Income 24.50 22.33 16.00
CI Synergy Focus Global Equity (US$) 21.96 19.37 17.72 Templeton Emerging Markets CC 21.73 19.13 15.98
Sceptre Canadian Equity Pooled 26.85 22.47 17.66 Templeton Emerging Markets 21.66 19.15 15.95
Dynamic Power Canadian Growth Class 19.78 20.75 17.62 RBC O'Shaughnessy Cdn Equity 16.80 16.86 15.81
Standard Life Cdn Small Cap-A 15.32 20.01 17.56 Dynamic Canadian Dividend Fund 17.88 19.12 15.67
Fidelity Far East-B (US$) 37.09 22.27 17.44 TD Dividend Growth 20.70 19.02 15.66
Mackenzie Univ Wld Real Est Class 36.14 21.56 17.44 BMO Emerging Markets 22.18 18.67 15.56
StandardLife Ideal Canadian Small Cap 15.22 19.90 17.43 CI Synergy Canadian Corporate Class 22.37 18.28 15.56
Leith Wheeler Canadian Equity B 18.61 19.13 17.35 Montrusco Bolton Canadian Equity 'B' 19.82 19.45 15.55
Trans IMS Can-Emerge 24.81 20.39 17.34 IA Group Fidelity True North 24.16 21.77 15.50
CIBC Canadian Real Estate 29.72 22.11 17.33 CI Synergy Focus Canadian Equity 29.63 22.91 15.47
Dynamic Value Fund of Canada 36.08 26.37 17.33 AGF Canadian Small Cap 42.63 20.65 15.40
Fidelity Far East-A (US$) 36.69 22.02 17.30 TD Canadian Equity 26.96 23.86 15.37
StandardLife Ideal-NL Cdn Small Cap 15.04 19.71 17.30 Genus Dividend Equity 20.69 19.70 15.34
Bona Vista Canadian Equity 26.40 21.85 17.27 CIBC Emerging Economies 22.42 18.10 15.27
Dynamic Global Value Fund (US$) 29.73 23.76 17.24 AIC Advantage II Corp Class (US$) 34.01 18.72 15.26
HSBC Small Cap Growth-I 17.92 19.69 17.22 Sceptre Canadian Equity - O 34.22 23.58 15.26
Bissett Income-A 21.22 17.95 17.19 TD Canadian Equity-A 26.22 23.38 15.13
Acuity Social Values Canadian Equity 23.12 17.29 17.10 Trimark Europlus 30.38 19.34 15.13
Middlefield Enhanced Yield 21.58 19.67 17.04 IA Group Canadian Equity Value 20.22 18.70 15.07
Investors Euro Mid-Cap Equity-C 37.50 21.15 17.03 iShares CDN MidCap Index 18.62 20.09 15.03
iShares CDN Financial Sector Index 19.81 18.41 17.02 Talvest Small-Cap Canadian Equity 28.68 15.60 15.03
BMO Special Equity 28.83 21.25 16.96 CI Signature High Income GIF Cl B 15.42 16.53 15.02
Thornmark Enhanced Equity 27.40 24.86 16.90 Altafund Investment Corp. 20.84 23.18 15.00
AGF International Stock Class (US$) 38.18 24.40 16.84 Clarica SF Growth 17.87 16.67 15.00
Talvest Millennium High Income 19.83 17.65 16.81 Power Performers © Marco den Ouden

12 The Break Out Report
Our Model Portfolio Initial Position: $50,000 (Jan. 11, 2002)
Current Position: $161,974.94 (Up 223.95%) Up 3.27% YTD
Our portfolio got blindsided by the Feds this month, losing $4000 in income trusts. This week we were stopped out of Inmet Mining and we’re selling TSX Group Monday as it has failed to perform. That leaves $70,500 to reinvest in five stocks - $14,000 each. We are buying our two featured stocks as well as Gildan, Stantec and Potash Corp., all at or close to Darvas break out points. We are setting tight stops on our initial purchases and again, will add to our positions each week if the stock performs as expected. After trades, we are left with a cash position of $50,544.50. We also raised the stops on COM DEV and WFI using the Darvas approach as they have not been behaving well.
COM DEV International (CDV) # of Shares: 2469 Bought: 18/09/06,
02/10/06, 16/10/06 Price Then: $6.07 Price Now: $6.19 Gain: 1.98% Stop: $5.90
Notes: COM DEV is a leading manufacturer of components for satellite communications.
Fortis Inc. (FTS) # of Shares: 795 Bought: Oct. 24/05 Price Then: $22.88 Price Now: $28.17 Gain: 23.13% Stop: $22.71
Notes: Newfoundland based electric company Fortis Inc. has expanded into other regions of Canada including British Columbia.
Gildan Activewear (GIL) # of Shares: 64 Bought: Nov. 20/06 Price Then: $62.04 Price Now: $62.04 Gain: 0.00% Stop: $60.00
Notes: Gildan is a leading manufacturer of T-shirts and other sportswear which are often rebranded by third parties.
Logibec Groupe (LGI) # of Shares: 78 Bought: Nov. 20/06 Price Then: $16.10 Price Now: $16.10 Gain: 0.00% Stop: $15.50
Notes: Quebec based Logibec Groupe Informatique manufactures specialized software for hospitals and other healthcare facilities.
Paladin Labs (PLB) # of Shares: 347 Bought: Nov. 20/06 Price Then: $11.52 Price Now: $11.52 Gain: 0.00% Stop: $10.25
Notes: Paladin Labs in-licenses specialized drugs from other manufacturers for sale in Canada.
Potash Corporation (POT) # of Shares: 25 Bought: Nov. 20/06 Price Then: $157.41 Price Now: $157.41 Gain: 0.00% Stop: $145.00
Notes: Potash Corporation of Saskatchewan is one of the world’s leading suppliers of fertilizers for agriculture.
Research in Motion (RIM) # of Shares: 145 Bought: 18/09/06,
25/09/06, 02/10/06 Price Then: $102.65 Price Now: $153.07 Gain: 49.13% Stop: $122.50
Notes: Research in Motion is famous for its Blackberry Pager.
Stantec (STN) # of Shares: 163 Bought: Nov. 20/06 Price Then: $24.45 Price Now: $24.45 Gain: 0.00% Stop: $23.60
Notes: Stantec is one of Canada’s leading engineering firms with offices and business worldwide.
Stella Jones (SJ) # of Shares: 575 Bought: Oct. 16/30/
Nov. 5/06 Price Then: $26.05 Price Now: $29.45 Gain: 13.05% Stop: $25.03
Notes: Stella Jones is one of those low tech companies a Warren Buffett or Peter Lynch would like. They make telephone poles.
WFI Industries (WFI) # of Shares: 583 Bought: Oct. 16/30/
Nov. 5/06 Price Then: $25.70 Price Now: $25.18 Gain: -2.02% Stop: $24.18
Notes: WFI Industries manufactures and sells heat exchangers for use as both heating in summer and air conditioning in winter.